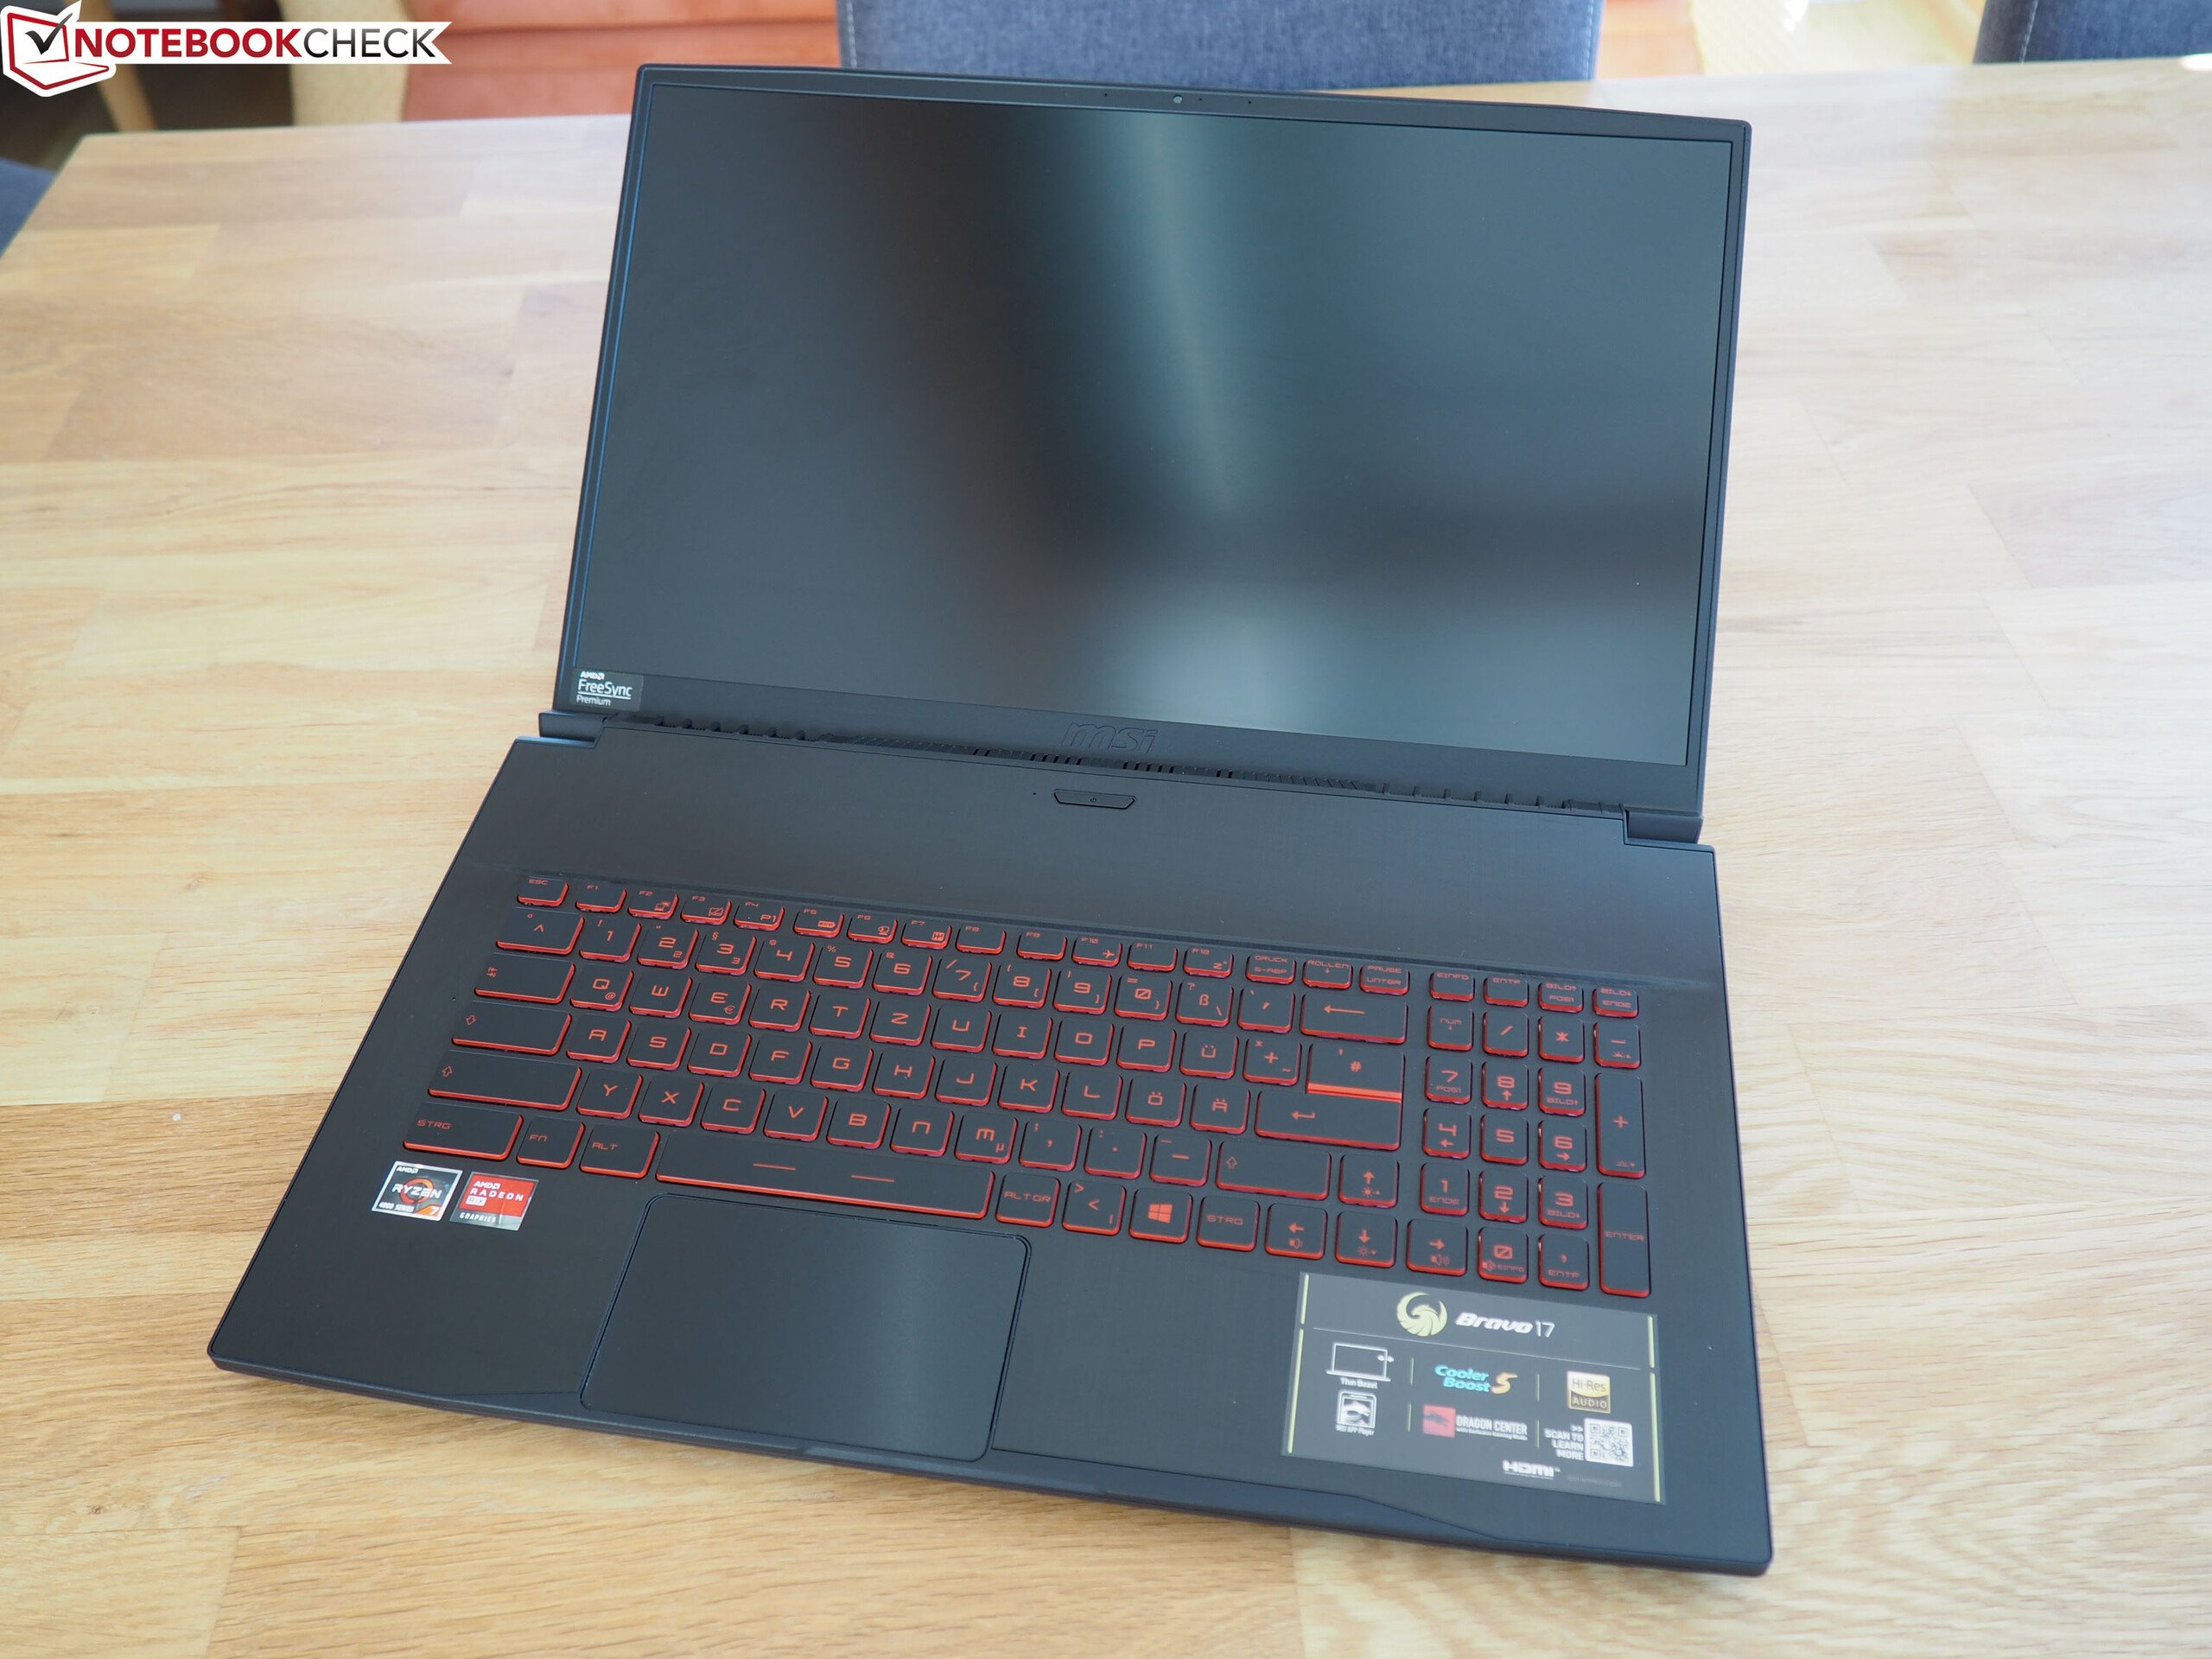
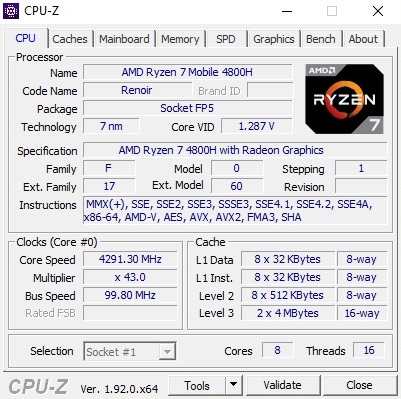
Breve Análise do Portátil MSI Bravo 17: Máquina de jogos exclusivamente AMD
Avaliação | Data | Modelo | Peso | Altura | Size | Resolução | Preço |
|---|---|---|---|---|---|---|---|
| 80.9 % v7 (old) | 07/2020 | MSI Bravo 17 A4DDR R7 4800H, Radeon RX 5500M | 2.2 kg | 23 mm | 17.30" | 1920x1080 | |
| 78.8 % v7 (old) | 02/2020 | MSI Alpha 15 A3DDK-034 R7 3750H, Radeon RX 5500M | 2.3 kg | 27.5 mm | 15.60" | 1920x1080 | |
| 78 % v7 (old) | 07/2019 | MSI GF75 Thin 9SC i7-9750H, GeForce GTX 1650 Mobile | 2.3 kg | 23.1 mm | 17.30" | 1920x1080 | |
| 77.8 % v7 (old) | Asus TUF FX705DT-AU068T R5 3550H, GeForce GTX 1650 Mobile | 2.7 kg | 26.6 mm | 17.30" | 1920x1080 | ||
| 82.9 % v7 (old) | 05/2020 | Asus TUF A17 FA706IU-AS76 R7 4800H, GeForce GTX 1660 Ti Mobile | 2.6 kg | 26 mm | 17.30" | 1920x1080 | |
| 82.3 % v7 (old) | Lenovo Legion Y540-17IRH i5-9300H, GeForce GTX 1660 Ti Mobile | 2.8 kg | 26.3 mm | 17.30" | 1920x1080 |
| Networking | |
| iperf3 transmit AX12 | |
| MSI Bravo 17 A4DDR | |
| Lenovo Legion Y540-17IRH | |
| MSI GF75 Thin 9SC | |
| MSI Alpha 15 A3DDK-034 | |
| Asus TUF A17 FA706IU-AS76 | |
| Asus TUF FX705DT-AU068T | |
| iperf3 receive AX12 | |
| MSI Bravo 17 A4DDR | |
| Lenovo Legion Y540-17IRH | |
| MSI Alpha 15 A3DDK-034 | |
| MSI GF75 Thin 9SC | |
| Asus TUF A17 FA706IU-AS76 | |
| Asus TUF FX705DT-AU068T | |


| |||||||||||||||||||||||||
iluminação: 88 %
iluminação com acumulador: 264 cd/m²
Contraste: 1148:1 (Preto: 0.23 cd/m²)
ΔE ColorChecker Calman: 3.85 | ∀{0.5-29.43 Ø4.71}
calibrated: 3.4
ΔE Greyscale Calman: 1.95 | ∀{0.09-98 Ø4.96}
60% sRGB (Argyll 1.6.3 3D)
42% AdobeRGB 1998 (Argyll 1.6.3 3D)
41.88% AdobeRGB 1998 (Argyll 3D)
60.1% sRGB (Argyll 3D)
40.54% Display P3 (Argyll 3D)
Gamma: 2.52
CCT: 6371 K
| MSI Bravo 17 A4DDR AU Optronics B173HAN04.7 (AUO479D), IPS, 1920x1080 | MSI Alpha 15 A3DDK-034 AU Optronics B156HAN08.0 (AUO80ED), IPS, 1920x1080 | MSI GF75 Thin 9SC AU Optronics B173HAN04.2, IPS, 1920x1080 | Asus TUF FX705DT-AU068T AU Optronics B173HAN04.2, IPS, 1920x1080 | Asus TUF A17 FA706IU-AS76 BOE NV173FHM-NX1, IPS, 1920x1080 | Lenovo Legion Y540-17IRH AU Optronics B173HAN04.4 (AUO449D), IPS, 1920x1080 | |
|---|---|---|---|---|---|---|
| Display | 58% | 52% | 51% | -0% | 68% | |
| Display P3 Coverage (%) | 40.54 | 66.4 64% | 62.5 54% | 62.3 54% | 40.55 0% | 69 70% |
| sRGB Coverage (%) | 60.1 | 91 51% | 90 50% | 89.1 48% | 59.7 -1% | 98.3 64% |
| AdobeRGB 1998 Coverage (%) | 41.88 | 66.6 59% | 64 53% | 63.7 52% | 41.89 0% | 70.7 69% |
| Response Times | 74% | 6% | -2% | 40% | 56% | |
| Response Time Grey 50% / Grey 80% * (ms) | 40 ? | 7 ? 82% | 34 ? 15% | 41 ? -2% | 22.4 ? 44% | 18 ? 55% |
| Response Time Black / White * (ms) | 29.6 ? | 10.4 ? 65% | 30.4 ? -3% | 30 ? -1% | 19.2 ? 35% | 12.8 ? 57% |
| PWM Frequency (Hz) | ||||||
| Screen | -2% | 9% | 7% | -18% | 13% | |
| Brightness middle (cd/m²) | 264 | 310 17% | 344.7 31% | 316 20% | 264.8 0% | 286 8% |
| Brightness (cd/m²) | 244 | 310 27% | 332 36% | 294 20% | 253 4% | 282 16% |
| Brightness Distribution (%) | 88 | 86 -2% | 91 3% | 84 -5% | 90 2% | 87 -1% |
| Black Level * (cd/m²) | 0.23 | 0.29 -26% | 0.3 -30% | 0.32 -39% | 0.31 -35% | 0.19 17% |
| Contrast (:1) | 1148 | 1069 -7% | 1149 0% | 988 -14% | 854 -26% | 1505 31% |
| Colorchecker dE 2000 * | 3.85 | 4.78 -24% | 3.08 20% | 3.39 12% | 4.73 -23% | 3.57 7% |
| Colorchecker dE 2000 max. * | 9.13 | 8.1 11% | 6.32 31% | 5.56 39% | 18.89 -107% | 7.5 18% |
| Colorchecker dE 2000 calibrated * | 3.4 | 2.36 31% | 2.94 14% | 2.14 37% | 4.64 -36% | 1.31 61% |
| Greyscale dE 2000 * | 1.95 | 4.78 -145% | 3.8 -95% | 3.17 -63% | 1.4 28% | 4.51 -131% |
| Gamma | 2.52 87% | 2.43 91% | 2.17 101% | 2.39 92% | 2.16 102% | 2.36 93% |
| CCT | 6371 102% | 7739 84% | 7284 89% | 7098 92% | 6641 98% | 7411 88% |
| Color Space (Percent of AdobeRGB 1998) (%) | 42 | 59 40% | 58 38% | 51 21% | 38.4 -9% | 64 52% |
| Color Space (Percent of sRGB) (%) | 60 | 91 52% | 89.6 49% | 89 48% | 59.3 -1% | 98 63% |
| Média Total (Programa/Configurações) | 43% /
18% | 22% /
17% | 19% /
14% | 7% /
-8% | 46% /
29% |
* ... menor é melhor
Exibir tempos de resposta
| ↔ Tempo de resposta preto para branco | ||
|---|---|---|
| 29.6 ms ... ascensão ↗ e queda ↘ combinadas | ↗ 16.4 ms ascensão | 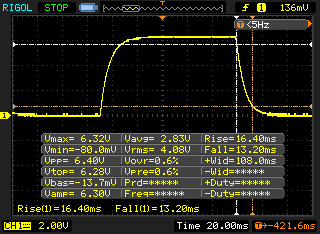 |
| ↘ 13.2 ms queda | ||
| A tela mostra taxas de resposta relativamente lentas em nossos testes e pode ser muito lenta para os jogadores. Em comparação, todos os dispositivos testados variam de 0.1 (mínimo) a 240 (máximo) ms. » 79 % de todos os dispositivos são melhores. Isso significa que o tempo de resposta medido é pior que a média de todos os dispositivos testados (19.8 ms). | ||
| ↔ Tempo de resposta 50% cinza a 80% cinza | ||
| 40 ms ... ascensão ↗ e queda ↘ combinadas | ↗ 19.2 ms ascensão | 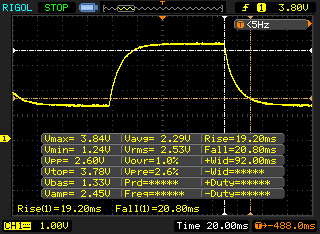 |
| ↘ 20.8 ms queda | ||
| A tela mostra taxas de resposta lentas em nossos testes e será insatisfatória para os jogadores. Em comparação, todos os dispositivos testados variam de 0.165 (mínimo) a 636 (máximo) ms. » 61 % de todos os dispositivos são melhores. Isso significa que o tempo de resposta medido é pior que a média de todos os dispositivos testados (30.9 ms). | ||
Cintilação da tela / PWM (modulação por largura de pulso)
| Tela tremeluzindo / PWM não detectado | 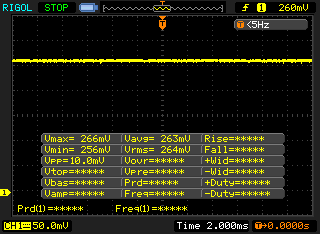 | ||
[pwm_comparison] Em comparação: 52 % de todos os dispositivos testados não usam PWM para escurecer a tela. Se PWM foi detectado, uma média de 7741 (mínimo: 5 - máximo: 343500) Hz foi medida. | |||
| Cinebench R15 | |
| CPU Single 64Bit | |
| MSI GF75 Thin 9SC | |
| Asus TUF A17 FA706IU-AS76 | |
| MSI Bravo 17 A4DDR | |
| Lenovo Legion Y540-17IRH | |
| Asus TUF FX705DT-AU068T | |
| MSI Alpha 15 A3DDK-034 | |
| CPU Multi 64Bit | |
| MSI Bravo 17 A4DDR | |
| Asus TUF A17 FA706IU-AS76 | |
| MSI GF75 Thin 9SC | |
| Lenovo Legion Y540-17IRH | |
| Asus TUF FX705DT-AU068T | |
| MSI Alpha 15 A3DDK-034 | |
| Blender - v2.79 BMW27 CPU | |
| Asus TUF A17 FA706IU-AS76 | |
| MSI Bravo 17 A4DDR | |
| 7-Zip 18.03 | |
| 7z b 4 -mmt1 | |
| Asus TUF A17 FA706IU-AS76 | |
| MSI Bravo 17 A4DDR | |
| 7z b 4 | |
| MSI Bravo 17 A4DDR | |
| Asus TUF A17 FA706IU-AS76 | |
| Cinebench R20 | |
| CPU (Single Core) | |
| MSI Bravo 17 A4DDR | |
| Asus TUF A17 FA706IU-AS76 | |
| Lenovo Legion Y540-17IRH | |
| Asus TUF FX705DT-AU068T | |
| MSI Alpha 15 A3DDK-034 | |
| CPU (Multi Core) | |
| MSI Bravo 17 A4DDR | |
| Asus TUF A17 FA706IU-AS76 | |
| Lenovo Legion Y540-17IRH | |
| Asus TUF FX705DT-AU068T | |
| MSI Alpha 15 A3DDK-034 | |
| Geekbench 5.5 | |
| Single-Core | |
| MSI Bravo 17 A4DDR | |
| Asus TUF A17 FA706IU-AS76 | |
| MSI Alpha 15 A3DDK-034 | |
| Multi-Core | |
| MSI Bravo 17 A4DDR | |
| Asus TUF A17 FA706IU-AS76 | |
| MSI Alpha 15 A3DDK-034 | |
| HWBOT x265 Benchmark v2.2 - 4k Preset | |
| MSI Bravo 17 A4DDR | |
| Asus TUF A17 FA706IU-AS76 | |
| LibreOffice - 20 Documents To PDF | |
| MSI Bravo 17 A4DDR | |
| Asus TUF A17 FA706IU-AS76 | |
| R Benchmark 2.5 - Overall mean | |
| Asus TUF A17 FA706IU-AS76 | |
| MSI Bravo 17 A4DDR | |
* ... menor é melhor
| PCMark 10 - Score | |
| MSI Bravo 17 A4DDR | |
| Asus TUF A17 FA706IU-AS76 | |
| Lenovo Legion Y540-17IRH | |
| MSI GF75 Thin 9SC | |
| MSI Alpha 15 A3DDK-034 | |
| Asus TUF FX705DT-AU068T | |
| DPC Latencies / LatencyMon - interrupt to process latency (max), Web, Youtube, Prime95 | |
| Asus TUF A17 FA706IU-AS76 | |
| MSI Bravo 17 A4DDR | |
* ... menor é melhor
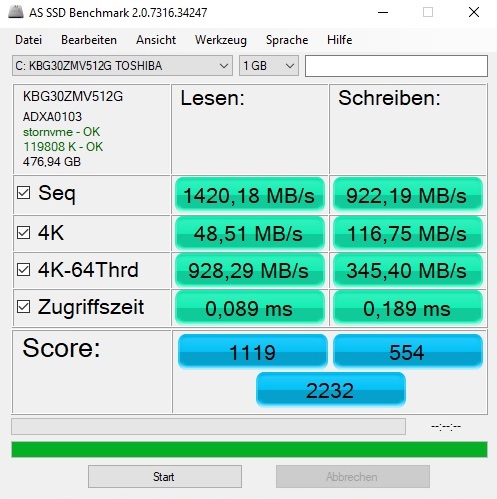
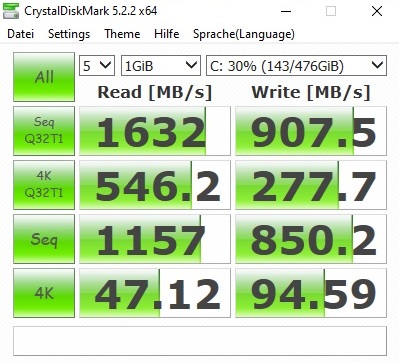
| MSI Bravo 17 A4DDR Toshiba KBG30ZMV512G | MSI Alpha 15 A3DDK-034 Kingston RBUSNS8154P3512GJ | MSI GF75 Thin 9SC Crucial P1 SSD CT1000P1SSD8 | Asus TUF FX705DT-AU068T WDC PC SN520 SDAPNUW-256G | Asus TUF A17 FA706IU-AS76 Intel SSD 660p 1TB SSDPEKNW010T8 | Lenovo Legion Y540-17IRH WDC PC SN520 SDAPNUW-512G | |
|---|---|---|---|---|---|---|
| CrystalDiskMark 5.2 / 6 | -1% | 43% | 15% | 56% | 8% | |
| Write 4K (MB/s) | 94.6 | 105.4 11% | 133 41% | 145 53% | 189.7 101% | 105.1 11% |
| Read 4K (MB/s) | 47.12 | 33.24 -29% | 55.6 18% | 45.28 -4% | 62.3 32% | 34.41 -27% |
| Write Seq (MB/s) | 850 | 1029 21% | 1623 91% | 1301 53% | 1681 98% | 1298 53% |
| Read Seq (MB/s) | 1157 | 1098 -5% | 1386 20% | 1362 18% | 1608 39% | 1099 -5% |
| Write 4K Q32T1 (MB/s) | 277.7 | 322.1 16% | 501 80% | 249.1 -10% | 468.6 69% | 335.7 21% |
| Read 4K Q32T1 (MB/s) | 546 | 352 -36% | 584 7% | 342.1 -37% | 541 -1% | 231.4 -58% |
| Write Seq Q32T1 (MB/s) | 908 | 1036 14% | 1696 87% | 1301 43% | 1770 95% | 1454 60% |
| Read Seq Q32T1 (MB/s) | 1632 | 1606 -2% | 1572 -4% | 1732 6% | 1898 16% | 1740 7% |

Continuous load read: DiskSpd Read Loop, Queue Depth 8
| 3DMark | |
| 1920x1080 Fire Strike Graphics | |
| Asus TUF A17 FA706IU-AS76 | |
| Lenovo Legion Y540-17IRH | |
| MSI Bravo 17 A4DDR | |
| MSI Alpha 15 A3DDK-034 | |
| MSI GF75 Thin 9SC | |
| Asus TUF FX705DT-AU068T | |
| 2560x1440 Time Spy Graphics | |
| Asus TUF A17 FA706IU-AS76 | |
| Lenovo Legion Y540-17IRH | |
| MSI Bravo 17 A4DDR | |
| MSI Alpha 15 A3DDK-034 | |
| Asus TUF FX705DT-AU068T | |
| MSI GF75 Thin 9SC | |
| 3DMark 11 - 1280x720 Performance GPU | |
| Asus TUF A17 FA706IU-AS76 | |
| Lenovo Legion Y540-17IRH | |
| MSI Bravo 17 A4DDR | |
| MSI Alpha 15 A3DDK-034 | |
| Asus TUF FX705DT-AU068T | |
| MSI GF75 Thin 9SC | |
| 3DMark 11 Performance | 16271 pontos | |
| 3DMark Cloud Gate Standard Score | 39492 pontos | |
| 3DMark Fire Strike Score | 11461 pontos | |
| 3DMark Time Spy Score | 4712 pontos | |
Ajuda | ||
| The Witcher 3 | |
| 1920x1080 High Graphics & Postprocessing (Nvidia HairWorks Off) | |
| Lenovo Legion Y540-17IRH | |
| Asus TUF A17 FA706IU-AS76 | |
| MSI Alpha 15 A3DDK-034 | |
| MSI Bravo 17 A4DDR | |
| MSI GF75 Thin 9SC | |
| Asus TUF FX705DT-AU068T | |
| 1920x1080 Ultra Graphics & Postprocessing (HBAO+) | |
| Asus TUF A17 FA706IU-AS76 | |
| Lenovo Legion Y540-17IRH | |
| MSI Bravo 17 A4DDR | |
| MSI Alpha 15 A3DDK-034 | |
| MSI GF75 Thin 9SC | |
| Asus TUF FX705DT-AU068T | |
| baixo | média | alto | ultra | |
|---|---|---|---|---|
| GTA V (2015) | 168 | 104 | 53.1 | |
| The Witcher 3 (2015) | 72 | 45.4 | ||
| Dota 2 Reborn (2015) | 120 | 113 | 106 | 103 |
| X-Plane 11.11 (2018) | 49.4 | 37.9 | 34.1 | |
| Shadow of the Tomb Raider (2018) | 65 | 54 | ||
| Battlefield V (2018) | 93 | 88.2 | ||
| Borderlands 3 (2019) | 47.9 | 35.9 | ||
| Escape from Tarkov (2020) | 81.5 | 64.5 | ||
| Hunt Showdown (2020) | 56.5 | |||
| Doom Eternal (2020) | 0 | 0 | ||
| Gears Tactics (2020) | 78.5 | 55.1 |
Barulho
| Ocioso |
| 33 / 34 / 35 dB |
| Carga |
| 39 / 52 dB |
 | ||
30 dB silencioso 40 dB(A) audível 50 dB(A) ruidosamente alto |
||
min: | ||
| MSI Bravo 17 A4DDR R7 4800H, Radeon RX 5500M | MSI Alpha 15 A3DDK-034 R7 3750H, Radeon RX 5500M | MSI GF75 Thin 9SC i7-9750H, GeForce GTX 1650 Mobile | Asus TUF FX705DT-AU068T R5 3550H, GeForce GTX 1650 Mobile | Asus TUF A17 FA706IU-AS76 R7 4800H, GeForce GTX 1660 Ti Mobile | Lenovo Legion Y540-17IRH i5-9300H, GeForce GTX 1660 Ti Mobile | |
|---|---|---|---|---|---|---|
| Noise | -13% | 6% | 6% | 3% | 0% | |
| desligado / ambiente * (dB) | 30 | 29 3% | 28.2 6% | 30.8 -3% | 28.7 4% | 30 -0% |
| Idle Minimum * (dB) | 33 | 36 -9% | 33.6 -2% | 30.8 7% | 28.7 13% | 30 9% |
| Idle Average * (dB) | 34 | 37 -9% | 33.6 1% | 30.8 9% | 30.5 10% | 32 6% |
| Idle Maximum * (dB) | 35 | 46 -31% | 33.8 3% | 32.2 8% | 32.5 7% | 34 3% |
| Load Average * (dB) | 39 | 50 -28% | 37.2 5% | 38.6 1% | 42.5 -9% | 44 -13% |
| Witcher 3 ultra * (dB) | 48 | 51 -6% | 40.6 15% | 50.1 -4% | 50 -4% | |
| Load Maximum * (dB) | 52 | 57 -10% | 44.4 15% | 44.8 14% | 53.4 -3% | 52 -0% |
* ... menor é melhor
(-) A temperatura máxima no lado superior é 48 °C / 118 F, em comparação com a média de 40.4 °C / 105 F , variando de 21.2 a 68.8 °C para a classe Gaming.
(-) A parte inferior aquece até um máximo de 50 °C / 122 F, em comparação com a média de 43.2 °C / 110 F
(+) Em uso inativo, a temperatura média para o lado superior é 24 °C / 75 F, em comparação com a média do dispositivo de 33.9 °C / ### class_avg_f### F.
(-) Jogando The Witcher 3, a temperatura média para o lado superior é 40.3 °C / 105 F, em comparação com a média do dispositivo de 33.9 °C / ## #class_avg_f### F.
(+) Os apoios para as mãos e o touchpad estão atingindo a temperatura máxima da pele (33 °C / 91.4 F) e, portanto, não estão quentes.
(-) A temperatura média da área do apoio para as mãos de dispositivos semelhantes foi 28.8 °C / 83.8 F (-4.2 °C / -7.6 F).
| MSI Bravo 17 A4DDR R7 4800H, Radeon RX 5500M | MSI Alpha 15 A3DDK-034 R7 3750H, Radeon RX 5500M | MSI GF75 Thin 9SC i7-9750H, GeForce GTX 1650 Mobile | Asus TUF FX705DT-AU068T R5 3550H, GeForce GTX 1650 Mobile | Asus TUF A17 FA706IU-AS76 R7 4800H, GeForce GTX 1660 Ti Mobile | Lenovo Legion Y540-17IRH i5-9300H, GeForce GTX 1660 Ti Mobile | |
|---|---|---|---|---|---|---|
| Heat | -1% | -15% | -1% | -11% | -26% | |
| Maximum Upper Side * (°C) | 48 | 44 8% | 47.8 -0% | 41.6 13% | 47.6 1% | 48 -0% |
| Maximum Bottom * (°C) | 50 | 49 2% | 57 -14% | 38 24% | 50.8 -2% | 56 -12% |
| Idle Upper Side * (°C) | 25 | 26 -4% | 30.2 -21% | 31.7 -27% | 33 -32% | 36 -44% |
| Idle Bottom * (°C) | 26 | 28 -8% | 32 -23% | 29.5 -13% | 29 -12% | 38 -46% |
* ... menor é melhor
MSI Bravo 17 A4DDR análise de áudio
(+) | os alto-falantes podem tocar relativamente alto (###valor### dB)
Graves 100 - 315Hz
(-) | quase nenhum baixo - em média 18.2% menor que a mediana
(±) | a linearidade dos graves é média (11.7% delta para a frequência anterior)
Médios 400 - 2.000 Hz
(+) | médios equilibrados - apenas 3.3% longe da mediana
(+) | médios são lineares (3.7% delta para frequência anterior)
Altos 2 - 16 kHz
(+) | agudos equilibrados - apenas 2.7% longe da mediana
(+) | os máximos são lineares (4.7% delta da frequência anterior)
Geral 100 - 16.000 Hz
(+) | o som geral é linear (14.8% diferença em relação à mediana)
Comparado com a mesma classe
» 29% de todos os dispositivos testados nesta classe foram melhores, 7% semelhantes, 63% piores
» O melhor teve um delta de 6%, a média foi 18%, o pior foi 132%
Comparado com todos os dispositivos testados
» 20% de todos os dispositivos testados foram melhores, 4% semelhantes, 76% piores
» O melhor teve um delta de 4%, a média foi 23%, o pior foi 134%
MSI Alpha 15 A3DDK-034 análise de áudio
(+) | os alto-falantes podem tocar relativamente alto (###valor### dB)
Graves 100 - 315Hz
(-) | quase nenhum baixo - em média 31.4% menor que a mediana
(+) | o baixo é linear (5.8% delta para a frequência anterior)
Médios 400 - 2.000 Hz
(±) | médios reduzidos - em média 7.4% menor que a mediana
(±) | a linearidade dos médios é média (9.9% delta para frequência anterior)
Altos 2 - 16 kHz
(+) | agudos equilibrados - apenas 2.1% longe da mediana
(+) | os máximos são lineares (3.7% delta da frequência anterior)
Geral 100 - 16.000 Hz
(±) | a linearidade do som geral é média (19.5% diferença em relação à mediana)
Comparado com a mesma classe
» 68% de todos os dispositivos testados nesta classe foram melhores, 7% semelhantes, 26% piores
» O melhor teve um delta de 6%, a média foi 18%, o pior foi 132%
Comparado com todos os dispositivos testados
» 49% de todos os dispositivos testados foram melhores, 7% semelhantes, 44% piores
» O melhor teve um delta de 4%, a média foi 23%, o pior foi 134%
| desligado | |
| Ocioso | |
| Carga |
|
Key:
min: | |
| MSI Bravo 17 A4DDR R7 4800H, Radeon RX 5500M | MSI Alpha 15 A3DDK-034 R7 3750H, Radeon RX 5500M | MSI GF75 Thin 9SC i7-9750H, GeForce GTX 1650 Mobile | Asus TUF FX705DT-AU068T R5 3550H, GeForce GTX 1650 Mobile | Asus TUF A17 FA706IU-AS76 R7 4800H, GeForce GTX 1660 Ti Mobile | Lenovo Legion Y540-17IRH i5-9300H, GeForce GTX 1660 Ti Mobile | |
|---|---|---|---|---|---|---|
| Power Consumption | -44% | -13% | 29% | -9% | -63% | |
| Idle Minimum * (Watt) | 9 | 14 -56% | 6.1 32% | 3.9 57% | 7.4 18% | 19 -111% |
| Idle Average * (Watt) | 10 | 18 -80% | 11.2 -12% | 9.6 4% | 10.5 -5% | 22 -120% |
| Idle Maximum * (Watt) | 13 | 32 -146% | 24.5 -88% | 12.2 6% | 17 -31% | 30 -131% |
| Load Average * (Watt) | 69 | 64 7% | 94.7 -37% | 59 14% | 103.7 -50% | 79 -14% |
| Witcher 3 ultra * (Watt) | 128 | 123 4% | 105.8 17% | 128.1 -0% | 134 -5% | |
| Load Maximum * (Watt) | 214 | 193 10% | 192.2 10% | 80 63% | 183.2 14% | 201 6% |
* ... menor é melhor
| MSI Bravo 17 A4DDR R7 4800H, Radeon RX 5500M, 51 Wh | MSI Alpha 15 A3DDK-034 R7 3750H, Radeon RX 5500M, 51 Wh | MSI GF75 Thin 9SC i7-9750H, GeForce GTX 1650 Mobile, 51 Wh | Asus TUF FX705DT-AU068T R5 3550H, GeForce GTX 1650 Mobile, 64 Wh | Asus TUF A17 FA706IU-AS76 R7 4800H, GeForce GTX 1660 Ti Mobile, 90 Wh | Lenovo Legion Y540-17IRH i5-9300H, GeForce GTX 1660 Ti Mobile, 57 Wh | |
|---|---|---|---|---|---|---|
| Duração da bateria | -28% | -10% | 63% | 78% | -25% | |
| Reader / Idle (h) | 7.7 | 5.8 -25% | 13.6 77% | 9.1 18% | 5.2 -32% | |
| WiFi v1.3 (h) | 5.2 | 4.1 -21% | 4.7 -10% | 7.8 50% | 8.5 63% | 3.7 -29% |
| Load (h) | 1.3 | 0.8 -38% | 2.1 62% | 3.3 154% | 1.1 -15% | |
| H.264 (h) | 3.9 | 8.1 | 3.4 |
Pro
Contra
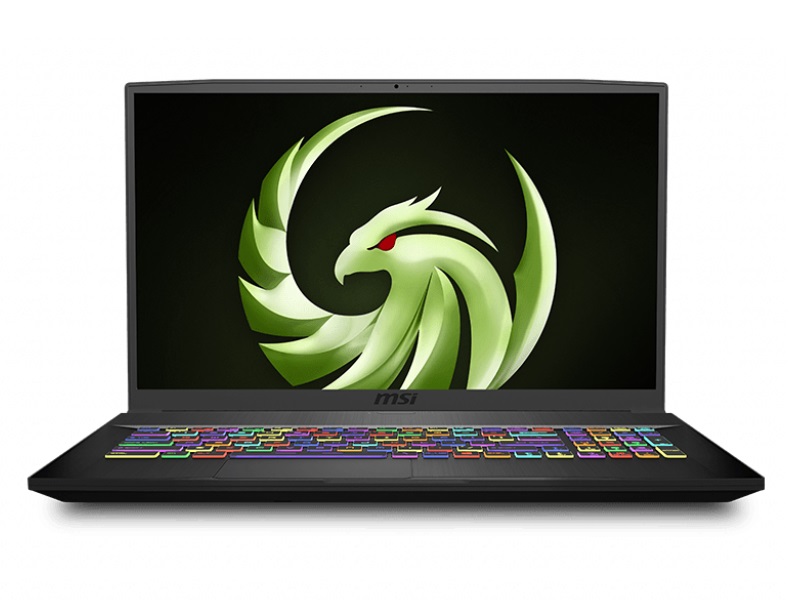
A AMD está de volta – e um uma surpresa: Não necessariamente do lado da GPU, mas definitivamente do lado da CPU.
A Ryzen 7 4800H impressiona com um desempenho muito alto que coloca a concorrência Intel comparável em preço (por exemplo o Core i7-9750H) em seu lugar. Essa quantidade de potência da CPU era anteriormente reservada para portáteis de jogos acima de 1.500 Euros (~$1.696).
Com exceção da baixa conectividade, da tela de baixo brilho e do alto nível de ruído sob carga, o restante do Bravo 17 também causa uma boa impressão. Os fãs da AMD, que precisam/querem ter cuidado com o orçamento, podem acionar a compra com confiança.
MSI Bravo 17 A4DDR
- 07/02/2020 v7 (old)
Florian Glaser
Price comparison