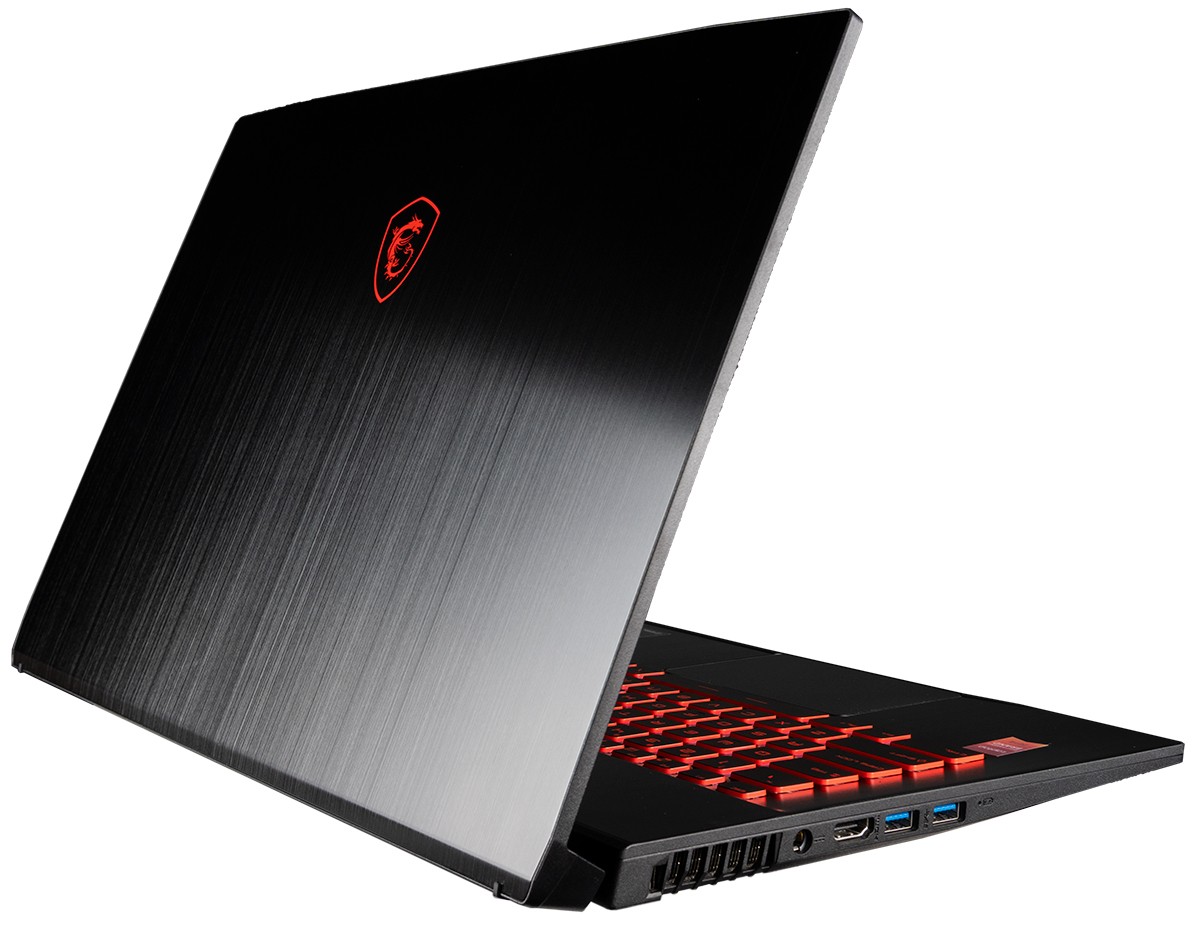
Fino está de moda: Breve Análise do Portátil MSI GF75 Thin 9SC
| Networking | |
| iperf3 transmit AX12 | |
| MSI GP75 Leopard 9SD | |
| MSI GF75 Thin 9SC | |
| MSI GF72VR 7RF | |
| Asus TUF FX705DT-AU068T | |
| iperf3 receive AX12 | |
| MSI GP75 Leopard 9SD | |
| MSI GF72VR 7RF | |
| MSI GF75 Thin 9SC | |
| Asus TUF FX705DT-AU068T | |
| |||||||||||||||||||||||||
iluminação: 91 %
iluminação com acumulador: 344.7 cd/m²
Contraste: 1149:1 (Preto: 0.3 cd/m²)
ΔE ColorChecker Calman: 3.08 | ∀{0.5-29.43 Ø4.71}
calibrated: 2.94
ΔE Greyscale Calman: 3.8 | ∀{0.09-98 Ø4.96}
89.6% sRGB (Argyll 1.6.3 3D)
58% AdobeRGB 1998 (Argyll 1.6.3 3D)
64% AdobeRGB 1998 (Argyll 3D)
90% sRGB (Argyll 3D)
62.5% Display P3 (Argyll 3D)
Gamma: 2.17
CCT: 7284 K
| MSI GF75 Thin 9SC AU Optronics B173HAN04.2, IPS, 17.3", 1920x1080 | MSI GF72VR 7RF Chi Mei CMN1747, TN LED, 17.3", 1920x1080 | Asus TUF FX705DT-AU068T AU Optronics B173HAN04.2, IPS, 17.3", 1920x1080 | MSI GP75 Leopard 9SD Chi Mei N173HCE-G33 (CMN175C), IPS, 17.3", 1920x1080 | Lenovo Legion Y740-17ICH AU Optronics B173HAN03.2, IPS, 17.3", 1920x1080 | HP Omen 17t-3AW55AV_1 AU Optronics AUO309D, IPS, 17.3", 1920x1080 | |
|---|---|---|---|---|---|---|
| Display | 30% | -0% | 3% | 1% | 3% | |
| Display P3 Coverage (%) | 62.5 | 90.8 45% | 62.3 0% | 63.4 1% | 64 2% | 65.4 5% |
| sRGB Coverage (%) | 90 | 99.8 11% | 89.1 -1% | 94.9 5% | 90.4 0% | 90 0% |
| AdobeRGB 1998 Coverage (%) | 64 | 85.6 34% | 63.7 0% | 65.1 2% | 64.8 1% | 65.8 3% |
| Response Times | 44% | -10% | 74% | 56% | 58% | |
| Response Time Grey 50% / Grey 80% * (ms) | 34 ? | 24.4 ? 28% | 41 ? -21% | 8 ? 76% | 15.6 ? 54% | 17.6 ? 48% |
| Response Time Black / White * (ms) | 30.4 ? | 12.6 ? 59% | 30 ? 1% | 8.8 ? 71% | 12.8 ? 58% | 10 ? 67% |
| PWM Frequency (Hz) | 25000 ? | 25510 ? | ||||
| Screen | -37% | -1% | 10% | -24% | -5% | |
| Brightness middle (cd/m²) | 344.7 | 329.2 -4% | 316 -8% | 420 22% | 299.1 -13% | 343.6 0% |
| Brightness (cd/m²) | 332 | 318 -4% | 294 -11% | 393 18% | 273 -18% | 320 -4% |
| Brightness Distribution (%) | 91 | 92 1% | 84 -8% | 91 0% | 81 -11% | 87 -4% |
| Black Level * (cd/m²) | 0.3 | 0.4 -33% | 0.32 -7% | 0.32 -7% | 0.27 10% | 0.34 -13% |
| Contrast (:1) | 1149 | 823 -28% | 988 -14% | 1313 14% | 1108 -4% | 1011 -12% |
| Colorchecker dE 2000 * | 3.08 | 6.4 -108% | 3.39 -10% | 3.04 1% | 5.07 -65% | 3.74 -21% |
| Colorchecker dE 2000 max. * | 6.32 | 11.7 -85% | 5.56 12% | 7.22 -14% | 10.55 -67% | 5.33 16% |
| Colorchecker dE 2000 calibrated * | 2.94 | 2.14 27% | 0.89 70% | 3.31 -13% | 3.49 -19% | |
| Greyscale dE 2000 * | 3.8 | 9.2 -142% | 3.17 17% | 3.91 -3% | 6.8 -79% | 3.7 3% |
| Gamma | 2.17 101% | 2.18 101% | 2.39 92% | 2.26 97% | 2.46 89% | 2.36 93% |
| CCT | 7284 89% | 10484 62% | 7098 92% | 7138 91% | 7805 83% | 6388 102% |
| Color Space (Percent of AdobeRGB 1998) (%) | 58 | 76 31% | 51 -12% | 60 3% | 58.5 1% | 58 0% |
| Color Space (Percent of sRGB) (%) | 89.6 | 92 3% | 89 -1% | 95 6% | 89.9 0% | 90 0% |
| Média Total (Programa/Configurações) | 12% /
-13% | -4% /
-2% | 29% /
17% | 11% /
-9% | 19% /
4% |
* ... menor é melhor
Exibir tempos de resposta
| ↔ Tempo de resposta preto para branco | ||
|---|---|---|
| 30.4 ms ... ascensão ↗ e queda ↘ combinadas | ↗ 18 ms ascensão | 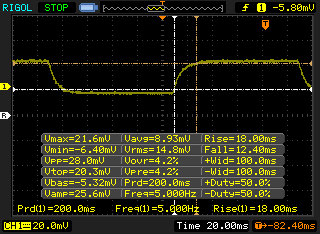 |
| ↘ 12.4 ms queda | ||
| A tela mostra taxas de resposta lentas em nossos testes e será insatisfatória para os jogadores. Em comparação, todos os dispositivos testados variam de 0.1 (mínimo) a 240 (máximo) ms. » 82 % de todos os dispositivos são melhores. Isso significa que o tempo de resposta medido é pior que a média de todos os dispositivos testados (19.8 ms). | ||
| ↔ Tempo de resposta 50% cinza a 80% cinza | ||
| 34 ms ... ascensão ↗ e queda ↘ combinadas | ↗ 17.6 ms ascensão | 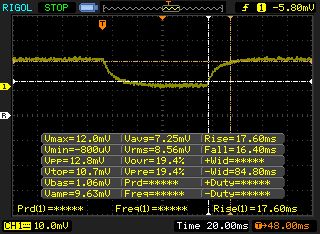 |
| ↘ 16.4 ms queda | ||
| A tela mostra taxas de resposta lentas em nossos testes e será insatisfatória para os jogadores. Em comparação, todos os dispositivos testados variam de 0.165 (mínimo) a 636 (máximo) ms. » 47 % de todos os dispositivos são melhores. Isso significa que o tempo de resposta medido é pior que a média de todos os dispositivos testados (30.9 ms). | ||
Cintilação da tela / PWM (modulação por largura de pulso)
| Tela tremeluzindo / PWM não detectado | 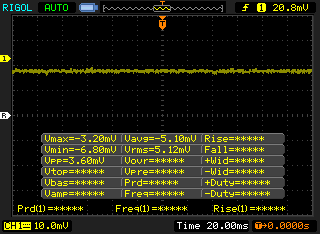 | ||
[pwm_comparison] Em comparação: 52 % de todos os dispositivos testados não usam PWM para escurecer a tela. Se PWM foi detectado, uma média de 7741 (mínimo: 5 - máximo: 343500) Hz foi medida. | |||
| PCMark 10 | |
| Score | |
| Lenovo Legion Y740-17ICH | |
| MSI GP75 Leopard 9SD | |
| MSI GF75 Thin 9SC | |
| MSI GF72VR 7RF | |
| MSI GF75 8RD-001 | |
| Asus TUF FX705DT-AU068T | |
| Essentials | |
| Lenovo Legion Y740-17ICH | |
| MSI GP75 Leopard 9SD | |
| MSI GF75 Thin 9SC | |
| Asus TUF FX705DT-AU068T | |
| MSI GF75 8RD-001 | |
| MSI GF72VR 7RF | |
| Productivity | |
| MSI GF75 Thin 9SC | |
| Lenovo Legion Y740-17ICH | |
| MSI GP75 Leopard 9SD | |
| MSI GF72VR 7RF | |
| MSI GF75 8RD-001 | |
| Asus TUF FX705DT-AU068T | |
| Digital Content Creation | |
| Lenovo Legion Y740-17ICH | |
| MSI GP75 Leopard 9SD | |
| MSI GF75 Thin 9SC | |
| MSI GF72VR 7RF | |
| MSI GF75 8RD-001 | |
| Asus TUF FX705DT-AU068T | |
| PCMark 8 | |
| Home Score Accelerated v2 | |
| Lenovo Legion Y740-17ICH | |
| Asus TUF FX705DT-AU068T | |
| MSI GF75 Thin 9SC | |
| MSI GF72VR 7RF | |
| MSI GF75 8RD-001 | |
| MSI GP75 Leopard 9SD | |
| Work Score Accelerated v2 | |
| Lenovo Legion Y740-17ICH | |
| MSI GP75 Leopard 9SD | |
| MSI GF75 Thin 9SC | |
| MSI GF75 8RD-001 | |
| MSI GF72VR 7RF | |
| Asus TUF FX705DT-AU068T | |
| PCMark 8 Home Score Accelerated v2 | 4116 pontos | |
| PCMark 8 Work Score Accelerated v2 | 5417 pontos | |
| PCMark 10 Score | 5249 pontos | |
Ajuda | ||
| MSI GF75 Thin 9SC Crucial P1 SSD CT1000P1SSD8 | MSI GF72VR 7RF Samsung PM961 MZVLW256HEHP | Asus TUF FX705DT-AU068T WDC PC SN520 SDAPNUW-256G | MSI GP75 Leopard 9SD Kingston RBUSNS8154P3256GJ1 | Lenovo Legion Y740-17ICH Samsung SSD PM981 MZVLB256HAHQ | |
|---|---|---|---|---|---|
| AS SSD | 19% | -28% | -65% | 9% | |
| Seq Read (MB/s) | 1079 | 2337 117% | 1546 43% | 748 -31% | 1153 7% |
| Seq Write (MB/s) | 1566 | 897 -43% | 1182 -25% | 219 -86% | 1328 -15% |
| 4K Read (MB/s) | 48.68 | 48.49 0% | 36.54 -25% | 25.7 -47% | 35.05 -28% |
| 4K Write (MB/s) | 106.7 | 126.1 18% | 109.2 2% | 82.4 -23% | 96 -10% |
| 4K-64 Read (MB/s) | 656 | 1122 71% | 612 -7% | 259.3 -60% | 727 11% |
| 4K-64 Write (MB/s) | 751 | 359.7 -52% | 436.6 -42% | 190.2 -75% | 1212 61% |
| Access Time Read * (ms) | 0.044 | 0.053 -20% | 0.113 -157% | 0.159 -261% | 0.063 -43% |
| Access Time Write * (ms) | 0.131 | 0.03 77% | 0.034 74% | 0.058 56% | 0.04 69% |
| Score Read (Points) | 812 | 1405 73% | 803 -1% | 360 -56% | 878 8% |
| Score Write (Points) | 1014 | 575 -43% | 664 -35% | 294 -71% | 1441 42% |
| Score Total (Points) | 2281 | 2635 16% | 1869 -18% | 821 -64% | 2784 22% |
| Copy ISO MB/s (MB/s) | 1414 | 698 -51% | 1487 5% | ||
| Copy Program MB/s (MB/s) | 531 | 114.1 -79% | 608 15% | ||
| Copy Game MB/s (MB/s) | 1483 | 379.6 -74% | 1162 -22% |
* ... menor é melhor

| 3DMark 11 Performance | 12993 pontos | |
| 3DMark Cloud Gate Standard Score | 30331 pontos | |
| 3DMark Fire Strike Score | 8367 pontos | |
| 3DMark Fire Strike Extreme Score | 4064 pontos | |
| 3DMark Time Spy Score | 3731 pontos | |
Ajuda | ||
| Shadow of the Tomb Raider - 1920x1080 Highest Preset AA:T | |
| MSI GE75 9SG | |
| Asus G752VS | |
| Asus ROG Zephyrus G15 GA502DU | |
| MSI GF75 Thin 9SC | |
| Média NVIDIA GeForce GTX 1650 Mobile (34 - 47, n=15) | |
| Asus Zephyrus S GX531GM | |
| Asus TUF FX505DT-EB73 | |
| Asus G752VY | |
| Asus TUF FX705GE-EW096T | |
| baixo | média | alto | ultra | |
|---|---|---|---|---|
| BioShock Infinite (2013) | 319.5 | 251 | 221.6 | 90.4 |
| The Witcher 3 (2015) | 209.1 | 126 | 67.6 | 37.7 |
| Shadow of the Tomb Raider (2018) | 128 | 59 | 51 | 45 |
| MSI GF75 Thin 9SC GeForce GTX 1650 Mobile, i7-9750H, Crucial P1 SSD CT1000P1SSD8 | MSI GF72VR 7RF GeForce GTX 1060 Mobile, i7-7700HQ, Samsung PM961 MZVLW256HEHP | MSI GP75 Leopard 9SD GeForce GTX 1660 Ti Mobile, i7-9750H, Kingston RBUSNS8154P3256GJ1 | Lenovo Legion Y740-17ICH GeForce RTX 2080 Max-Q, i7-8750H, Samsung SSD PM981 MZVLB256HAHQ | HP Omen 17t-3AW55AV_1 GeForce GTX 1070 Mobile, i7-8750H, Samsung SSD PM981 MZVLB512HAJQ | Asus TUF FX505DT-EB73 GeForce GTX 1650 Mobile, R7 3750H, Intel SSD 660p SSDPEKNW512G8 | |
|---|---|---|---|---|---|---|
| Noise | -2% | -13% | 3% | -2% | 0% | |
| desligado / ambiente * (dB) | 28.2 | 28.1 -0% | 29 -3% | 28.3 -0% | 27.8 1% | 28.2 -0% |
| Idle Minimum * (dB) | 33.6 | 31.4 7% | 29 14% | 31.5 6% | 31.1 7% | 28.2 16% |
| Idle Average * (dB) | 33.6 | 31.4 7% | 34 -1% | 31.6 6% | 31.1 7% | 28.2 16% |
| Idle Maximum * (dB) | 33.8 | 32.6 4% | 37 -9% | 31.6 7% | 35 -4% | 31.4 7% |
| Load Average * (dB) | 37.2 | 39.4 -6% | 53 -42% | 32.3 13% | 42 -13% | 39.8 -7% |
| Witcher 3 ultra * (dB) | 40.6 | 45.3 -12% | 51 -26% | 43 -6% | 44.5 -10% | 47 -16% |
| Load Maximum * (dB) | 44.4 | 52 -17% | 55 -24% | 45.5 -2% | 46.5 -5% | 50.2 -13% |
* ... menor é melhor
Barulho
| Ocioso |
| 33.6 / 33.6 / 33.8 dB |
| Carga |
| 37.2 / 44.4 dB |
 | ||
30 dB silencioso 40 dB(A) audível 50 dB(A) ruidosamente alto |
||
min: | ||
(-) A temperatura máxima no lado superior é 47.8 °C / 118 F, em comparação com a média de 40.4 °C / 105 F , variando de 21.2 a 68.8 °C para a classe Gaming.
(-) A parte inferior aquece até um máximo de 57 °C / 135 F, em comparação com a média de 43.2 °C / 110 F
(+) Em uso inativo, a temperatura média para o lado superior é 27.7 °C / 82 F, em comparação com a média do dispositivo de 33.9 °C / ### class_avg_f### F.
(±) Jogando The Witcher 3, a temperatura média para o lado superior é 35.9 °C / 97 F, em comparação com a média do dispositivo de 33.9 °C / ## #class_avg_f### F.
(+) Os apoios para as mãos e o touchpad são mais frios que a temperatura da pele, com um máximo de 31.2 °C / 88.2 F e, portanto, são frios ao toque.
(-) A temperatura média da área do apoio para as mãos de dispositivos semelhantes foi 28.8 °C / 83.8 F (-2.4 °C / -4.4 F).
MSI GF75 Thin 9SC análise de áudio
(+) | os alto-falantes podem tocar relativamente alto (###valor### dB)
Analysis not possible as minimum curve is missing or too high
Apple MacBook 12 (Early 2016) 1.1 GHz análise de áudio
(+) | os alto-falantes podem tocar relativamente alto (###valor### dB)
Graves 100 - 315Hz
(±) | graves reduzidos - em média 11.3% menor que a mediana
(±) | a linearidade dos graves é média (14.2% delta para a frequência anterior)
Médios 400 - 2.000 Hz
(+) | médios equilibrados - apenas 2.4% longe da mediana
(+) | médios são lineares (5.5% delta para frequência anterior)
Altos 2 - 16 kHz
(+) | agudos equilibrados - apenas 2% longe da mediana
(+) | os máximos são lineares (4.5% delta da frequência anterior)
Geral 100 - 16.000 Hz
(+) | o som geral é linear (10.2% diferença em relação à mediana)
Comparado com a mesma classe
» 7% de todos os dispositivos testados nesta classe foram melhores, 2% semelhantes, 90% piores
» O melhor teve um delta de 5%, a média foi 18%, o pior foi 53%
Comparado com todos os dispositivos testados
» 5% de todos os dispositivos testados foram melhores, 1% semelhantes, 94% piores
» O melhor teve um delta de 4%, a média foi 23%, o pior foi 134%
| desligado | |
| Ocioso | |
| Carga |
|
Key:
min: | |
| MSI GF75 Thin 9SC i7-9750H, GeForce GTX 1650 Mobile, Crucial P1 SSD CT1000P1SSD8, IPS, 1920x1080, 17.3" | MSI GF72VR 7RF i7-7700HQ, GeForce GTX 1060 Mobile, Samsung PM961 MZVLW256HEHP, TN LED, 1920x1080, 17.3" | MSI GP75 Leopard 9SD i7-9750H, GeForce GTX 1660 Ti Mobile, Kingston RBUSNS8154P3256GJ1, IPS, 1920x1080, 17.3" | HP Omen 17t-3AW55AV_1 i7-8750H, GeForce GTX 1070 Mobile, Samsung SSD PM981 MZVLB512HAJQ, IPS, 1920x1080, 17.3" | Asus TUF FX505DT-EB73 R7 3750H, GeForce GTX 1650 Mobile, Intel SSD 660p SSDPEKNW512G8, IPS, 1920x1080, 15.6" | MSI GF75 8RD-001 i7-8750H, GeForce GTX 1050 Ti Max-Q, Kingston RBUSNS8154P3256GJ1, IPS, 1920x1080, 17.3" | |
|---|---|---|---|---|---|---|
| Power Consumption | -39% | -24% | -67% | 20% | 15% | |
| Idle Minimum * (Watt) | 6.1 | 15.7 -157% | 10 -64% | 17.8 -192% | 7 -15% | 6.5 -7% |
| Idle Average * (Watt) | 11.2 | 21.4 -91% | 15 -34% | 24.7 -121% | 9.9 12% | 11.9 -6% |
| Idle Maximum * (Watt) | 24.5 | 21.9 11% | 22 10% | 29.6 -21% | 12 51% | 13.1 47% |
| Load Average * (Watt) | 94.7 | 83.9 11% | 92 3% | 110 -16% | 68.4 28% | 86 9% |
| Witcher 3 ultra * (Watt) | 105.8 | 130.2 -23% | 153 -45% | 167.8 -59% | 94.9 10% | |
| Load Maximum * (Watt) | 192.2 | 159.6 17% | 216 -12% | 178.6 7% | 130.9 32% | 131 32% |
* ... menor é melhor
| MSI GF75 Thin 9SC i7-9750H, GeForce GTX 1650 Mobile, 51 Wh | MSI GF72VR 7RF i7-7700HQ, GeForce GTX 1060 Mobile, 43 Wh | Asus TUF FX705DT-AU068T R5 3550H, GeForce GTX 1650 Mobile, 64 Wh | MSI GP75 Leopard 9SD i7-9750H, GeForce GTX 1660 Ti Mobile, 51 Wh | Lenovo Legion Y740-17ICH i7-8750H, GeForce RTX 2080 Max-Q, 76 Wh | HP Omen 17t-3AW55AV_1 i7-8750H, GeForce GTX 1070 Mobile, 86 Wh | |
|---|---|---|---|---|---|---|
| Duração da bateria | -49% | 66% | -32% | -32% | -11% | |
| WiFi v1.3 (h) | 4.7 | 2.4 -49% | 7.8 66% | 3.2 -32% | 3.2 -32% | 4.2 -11% |
| Reader / Idle (h) | 3.4 | 13.6 | 4.8 | 4.5 | ||
| Load (h) | 0.7 | 2.1 | 0.6 | 1.6 |
Pro
Contra


É difícil recomendar um portátil para jogos com o Core i7-9750H quando os benefícios de desempenho em relação ao Core i7-8750H são quase insignificantes. É uma pena que a MSI não ofereça o GF75 com o Core i7-8750H e GTX 1650, porque o desempenho dos jogos teria sido essencialmente o mesmo, mas para um preço mais baixo.
Falando de preços, o preço recomendado de $1200 USD é um pouco alto para um portátil de jogos econômico. O MSI GL73 8SD, por exemplo, vem equipado com uma CPU Core i7-8750H e gráficos GTX 1660 Ti mais rápidos por menos de 1.100 dólares. O alto preço do GF75 se deve aos marcos estreitos, peso leve e design compacto, em vez de desempenho bruto. Se você pretende viajar com frequência e pode usar uma tela relativamente leve de 17,3 polegadas com qualidades de jogo respeitáveis, então o MSI GF75 é o adequado. Caso contrário, os usuários interessados no maior desempenho por dólar podem querer procurar outros portáteis, com a GTX 1660 Ti superior, pode ser encontrado por aproximadamente o mesmo preço, como o HP Pavilion Gaming 17 ou o Alienware m17 básico.
O MSI GF75 é um dos mais leves portáteis de jogos de 17,3 polegadas disponíveis especialmente nesta faixa de preço. Você terá que comprometer algo de desempenho e recursos ao longo do caminho para torna-lo mais um híbrido viajante-jogador do que um portátil de jogos puro.
MSI GF75 Thin 9SC
- 10/26/2019 v7 (old)
Allen Ngo
Price comparison
