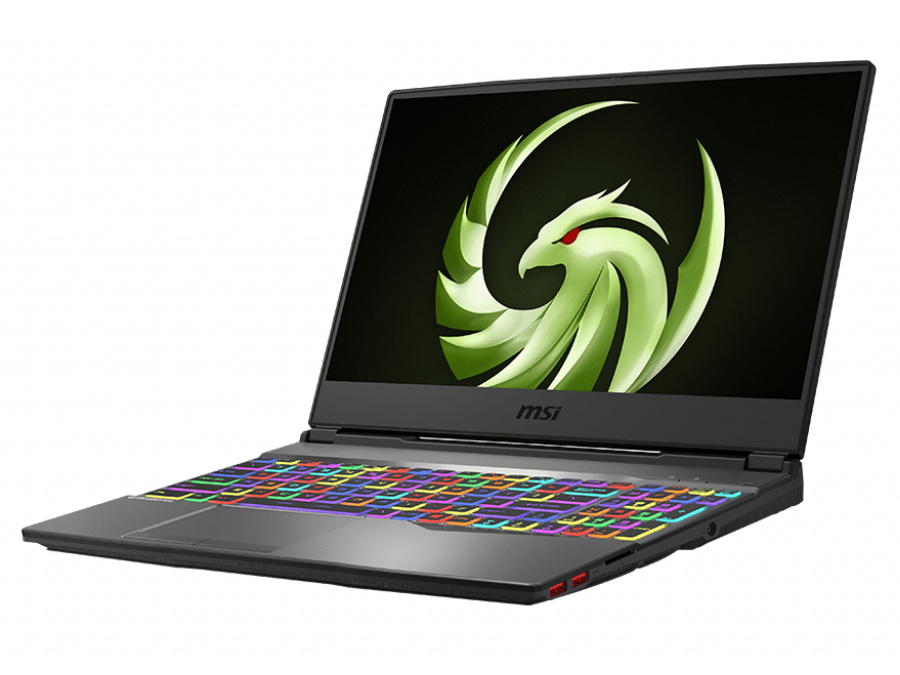
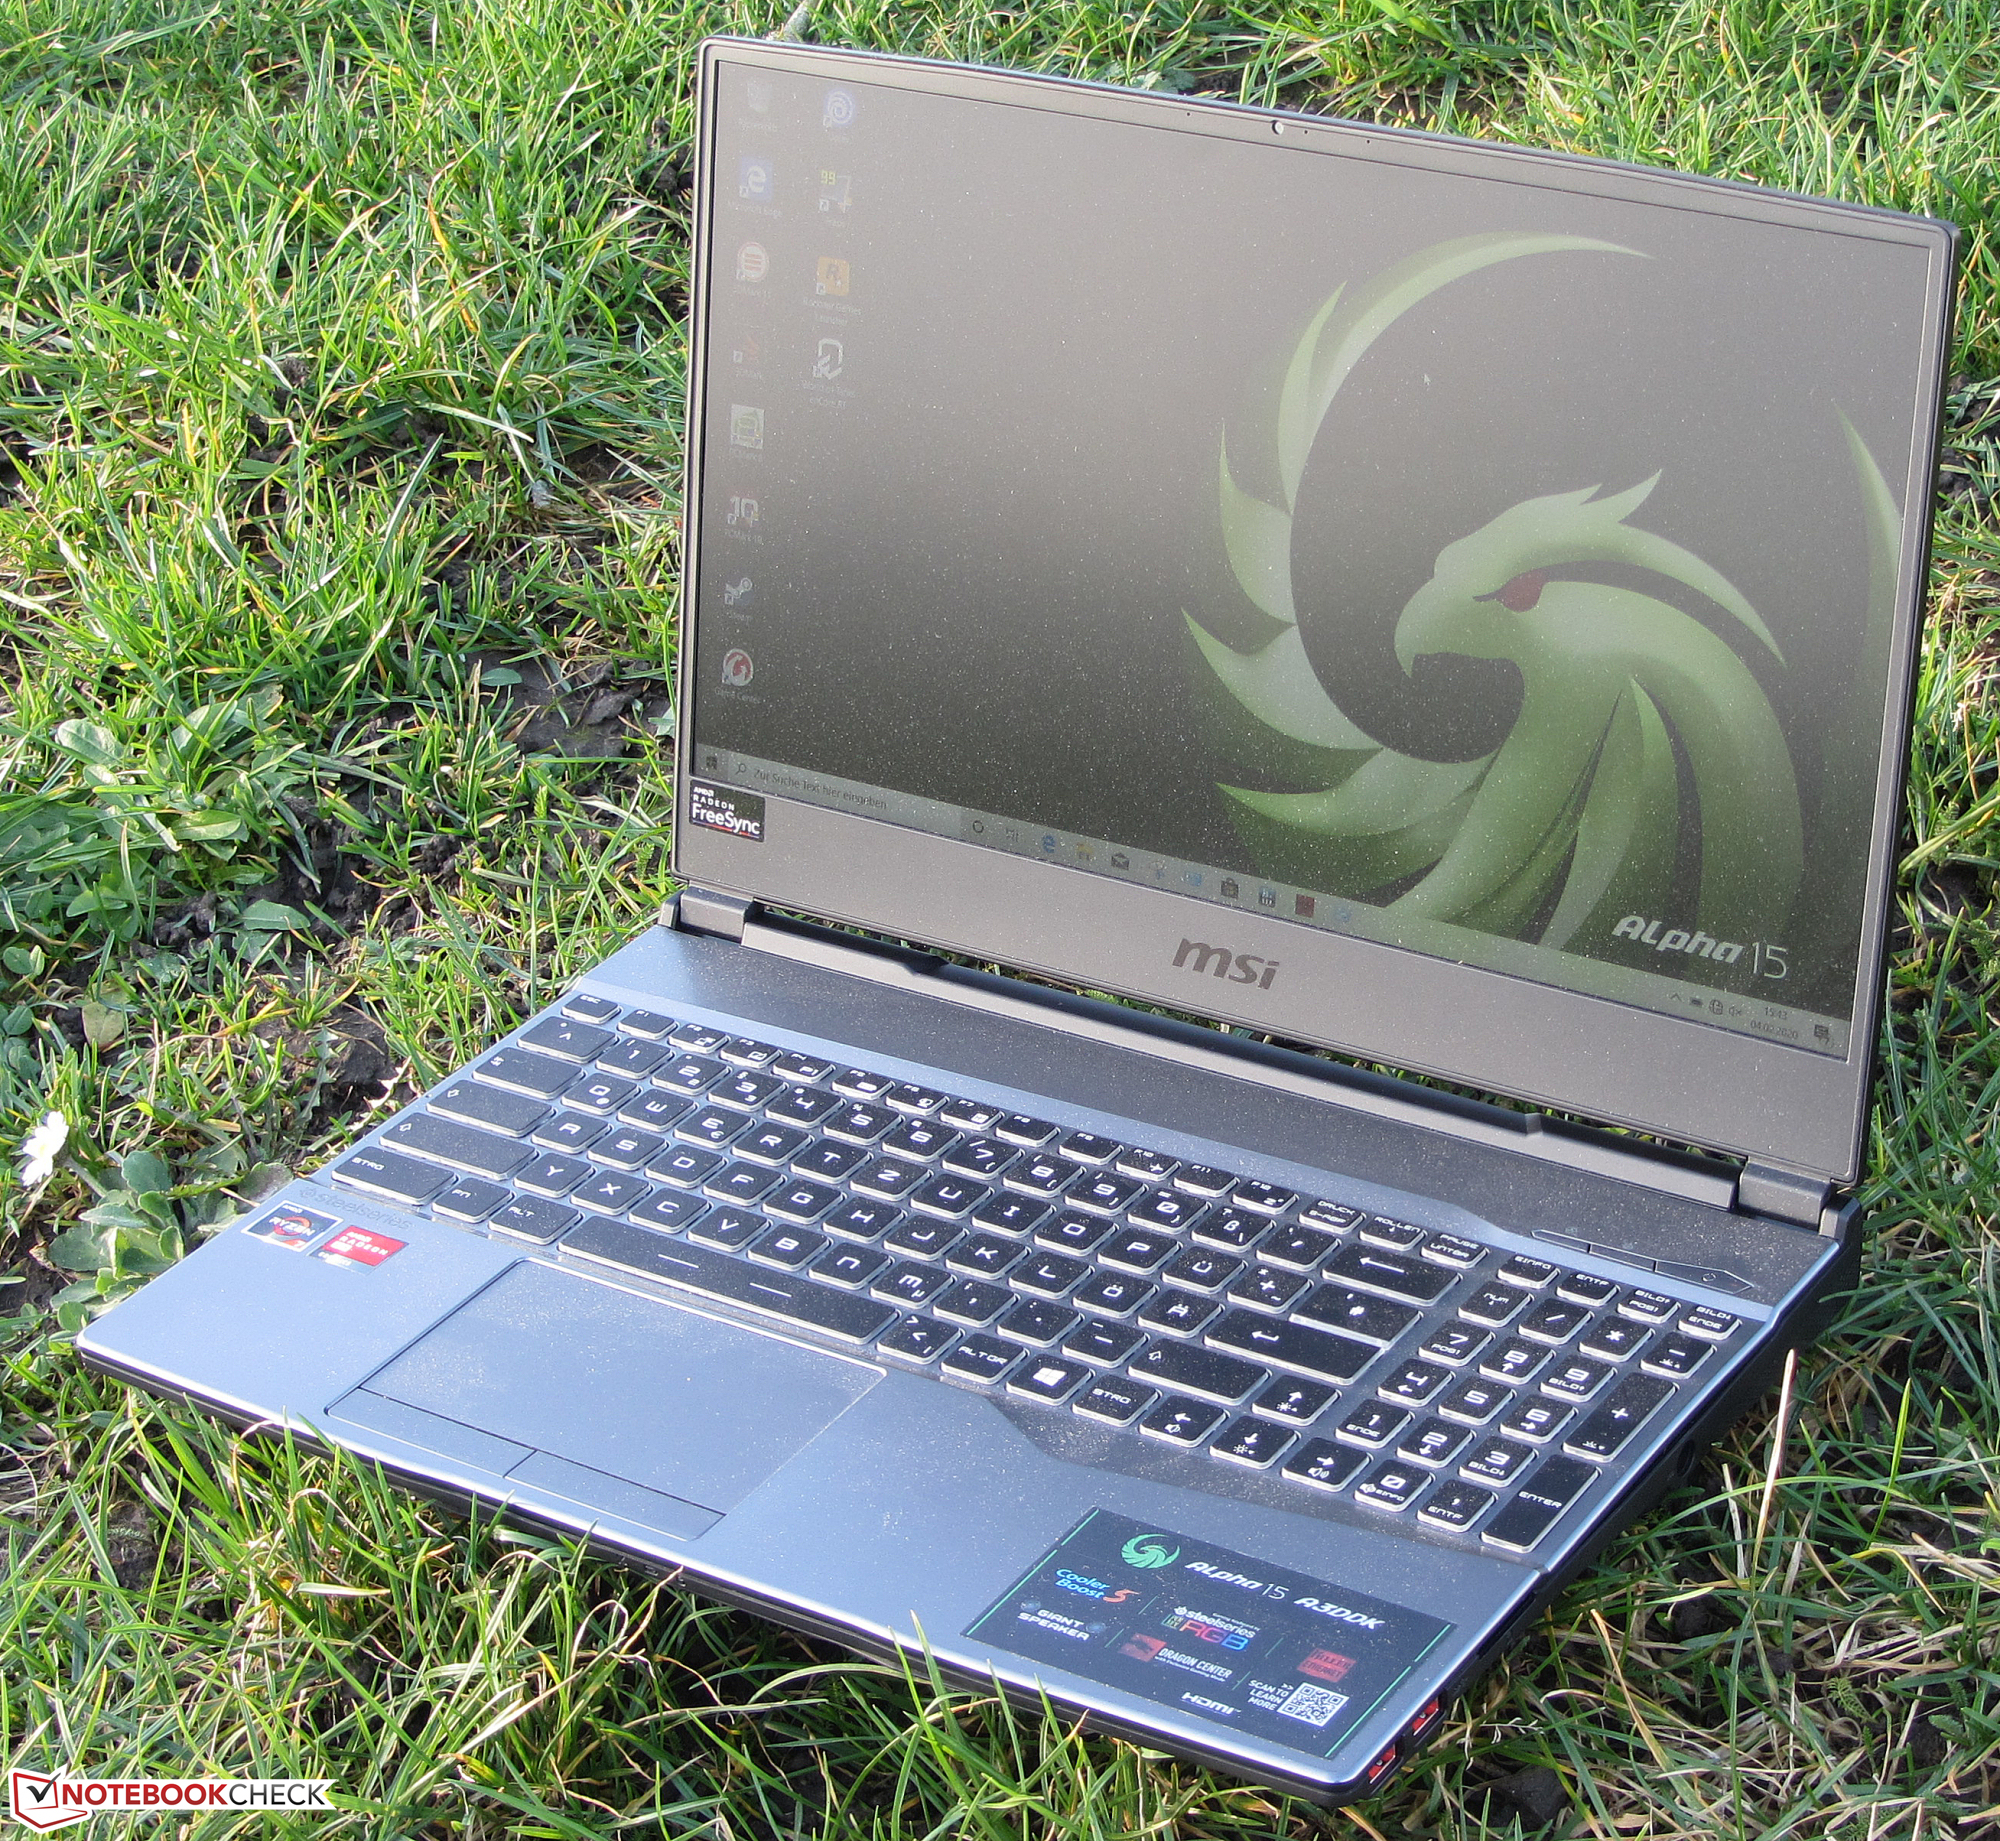
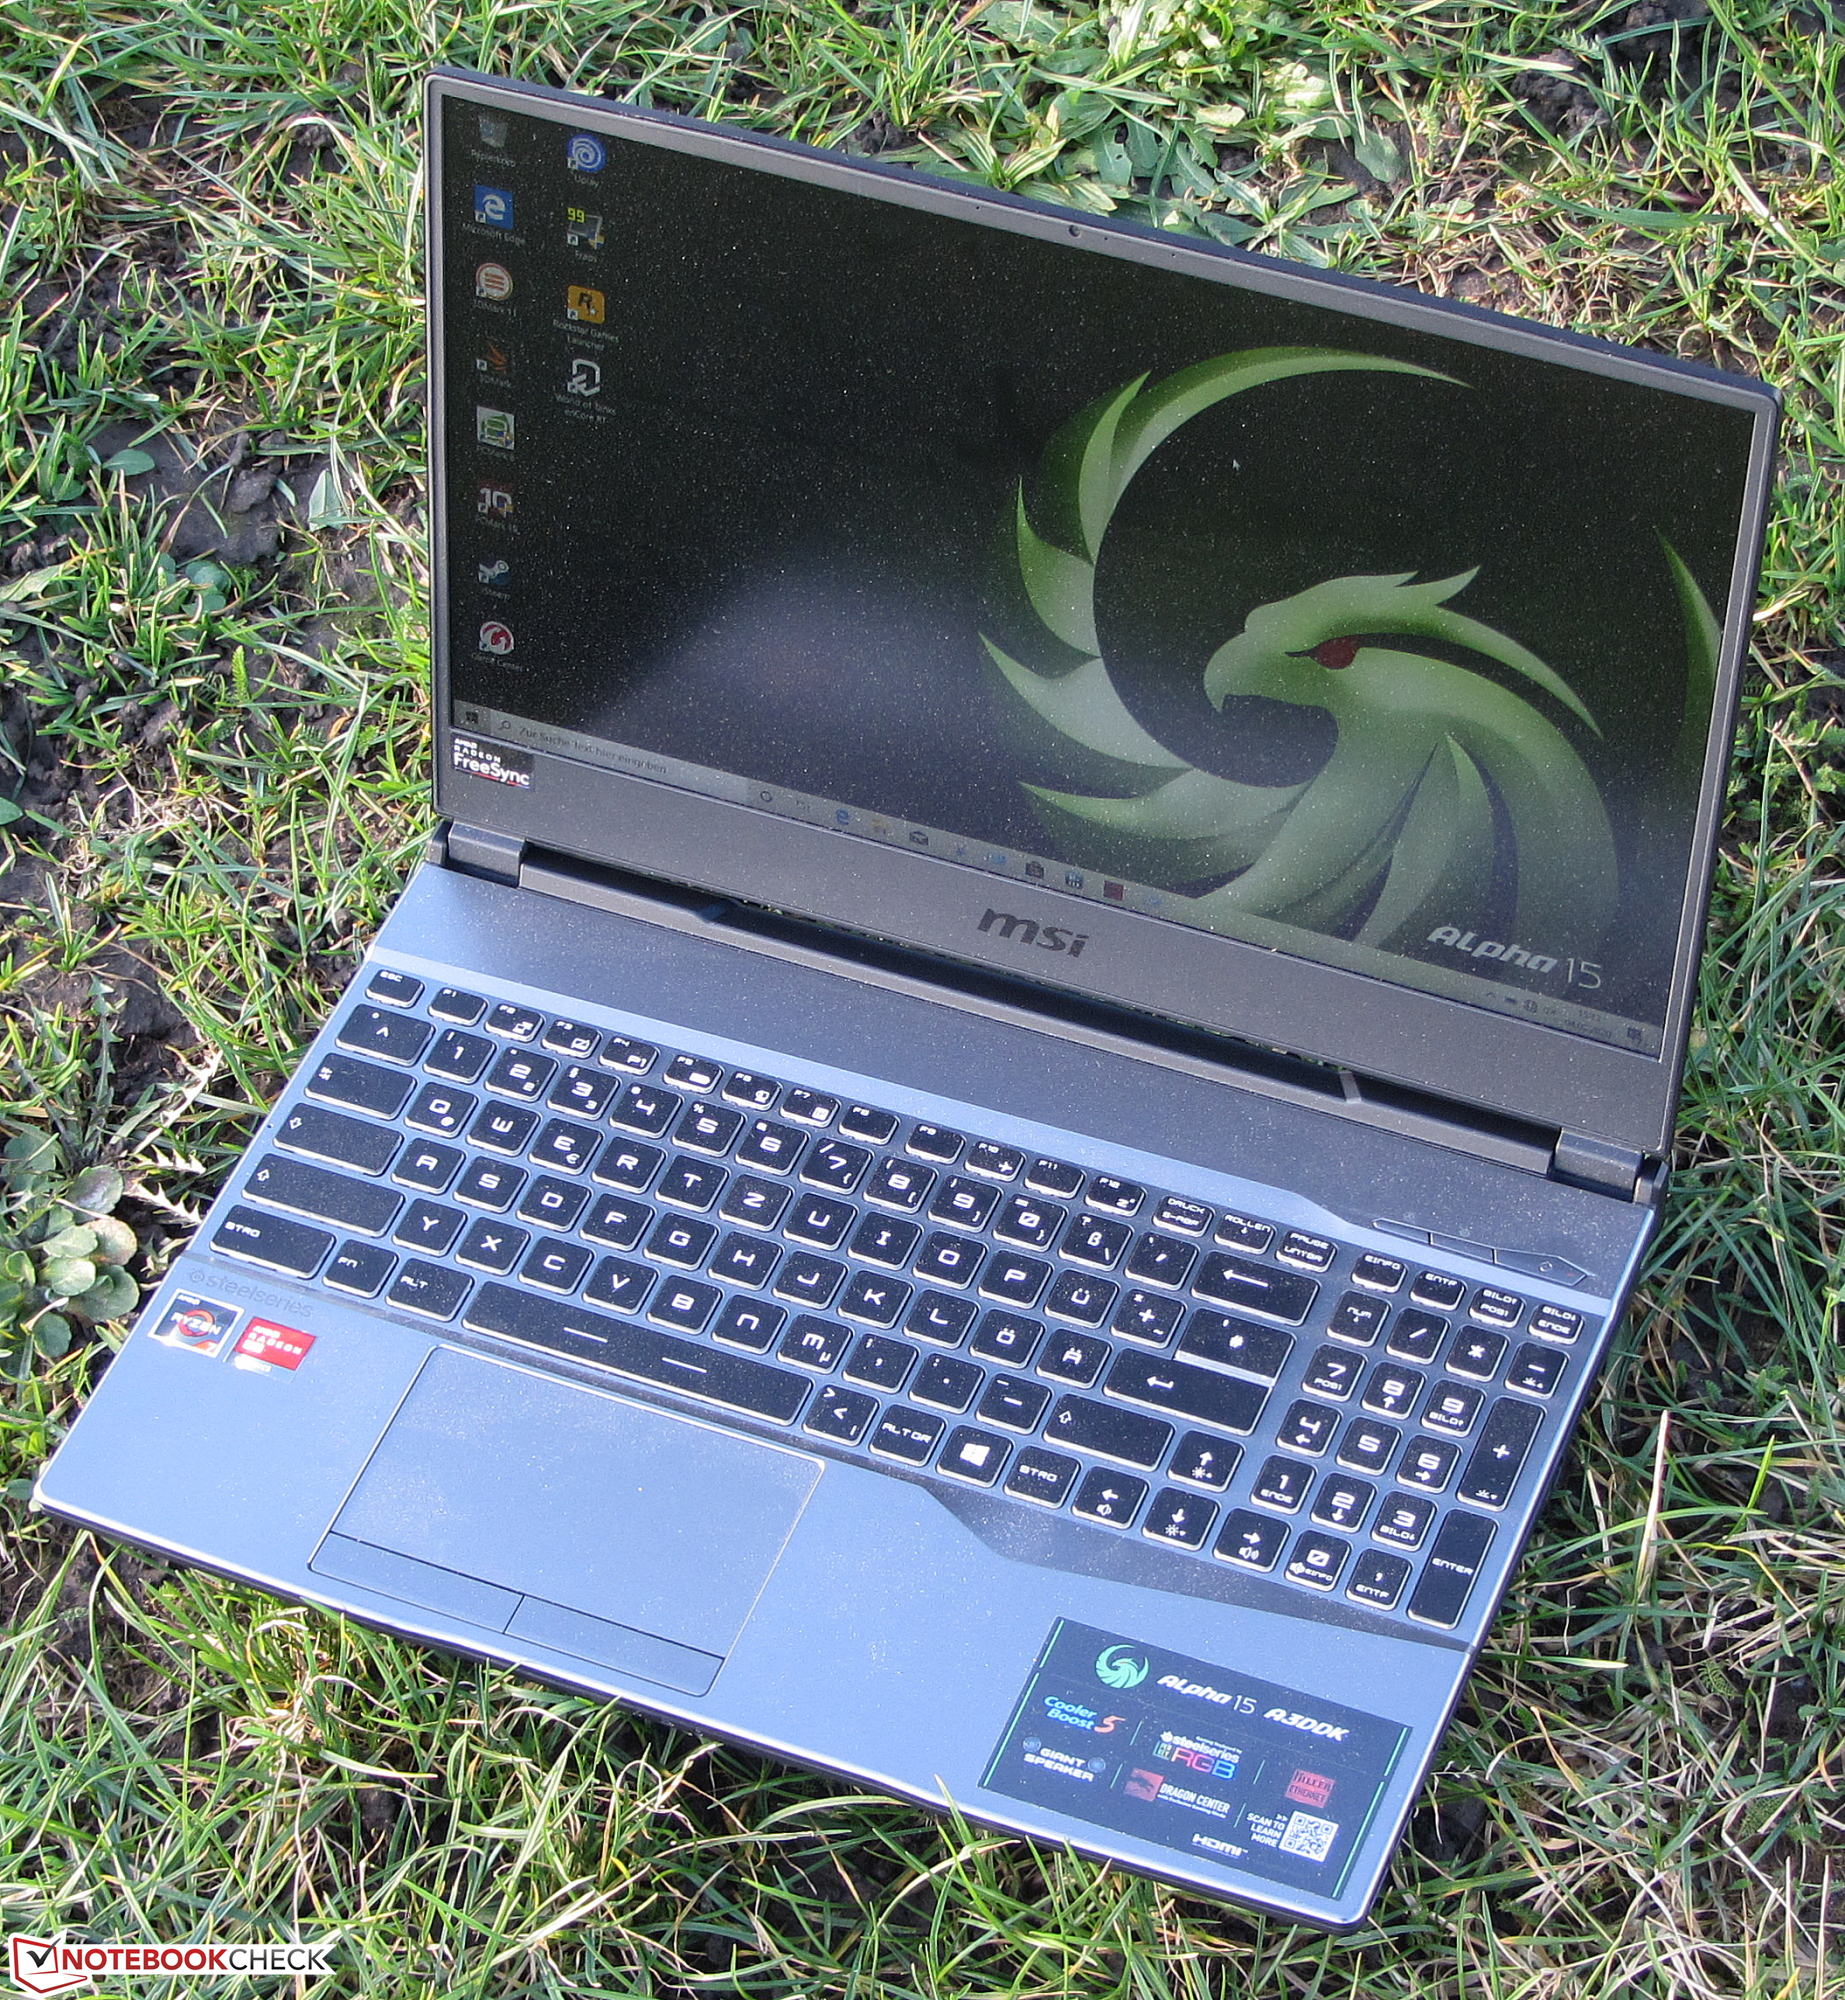
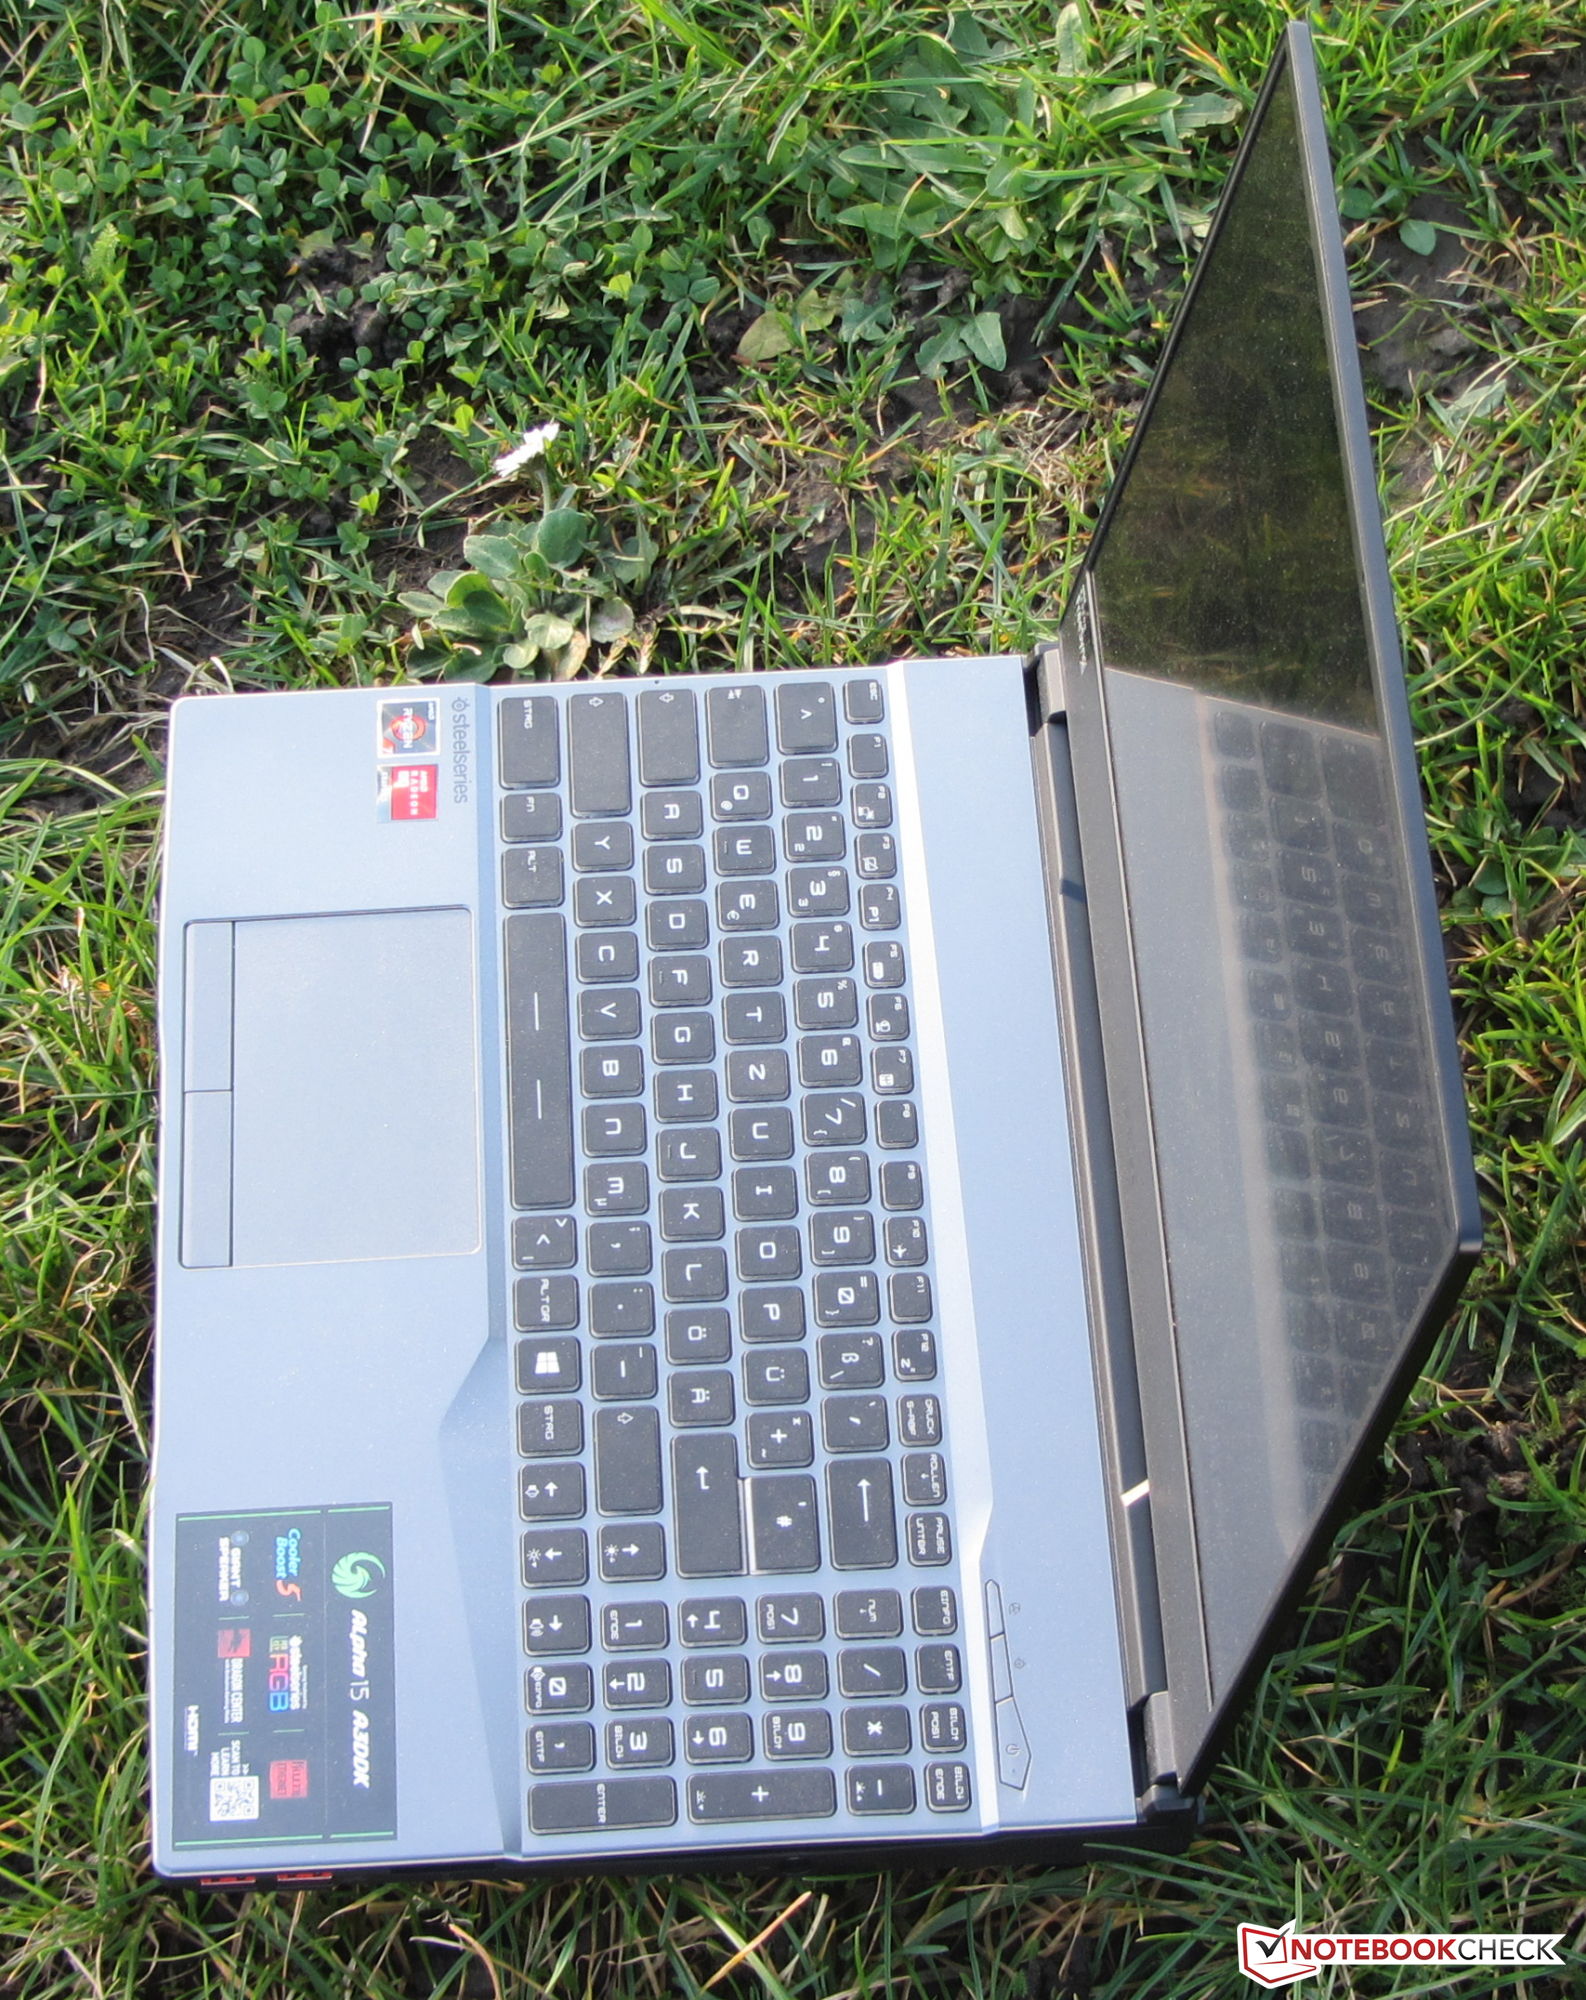
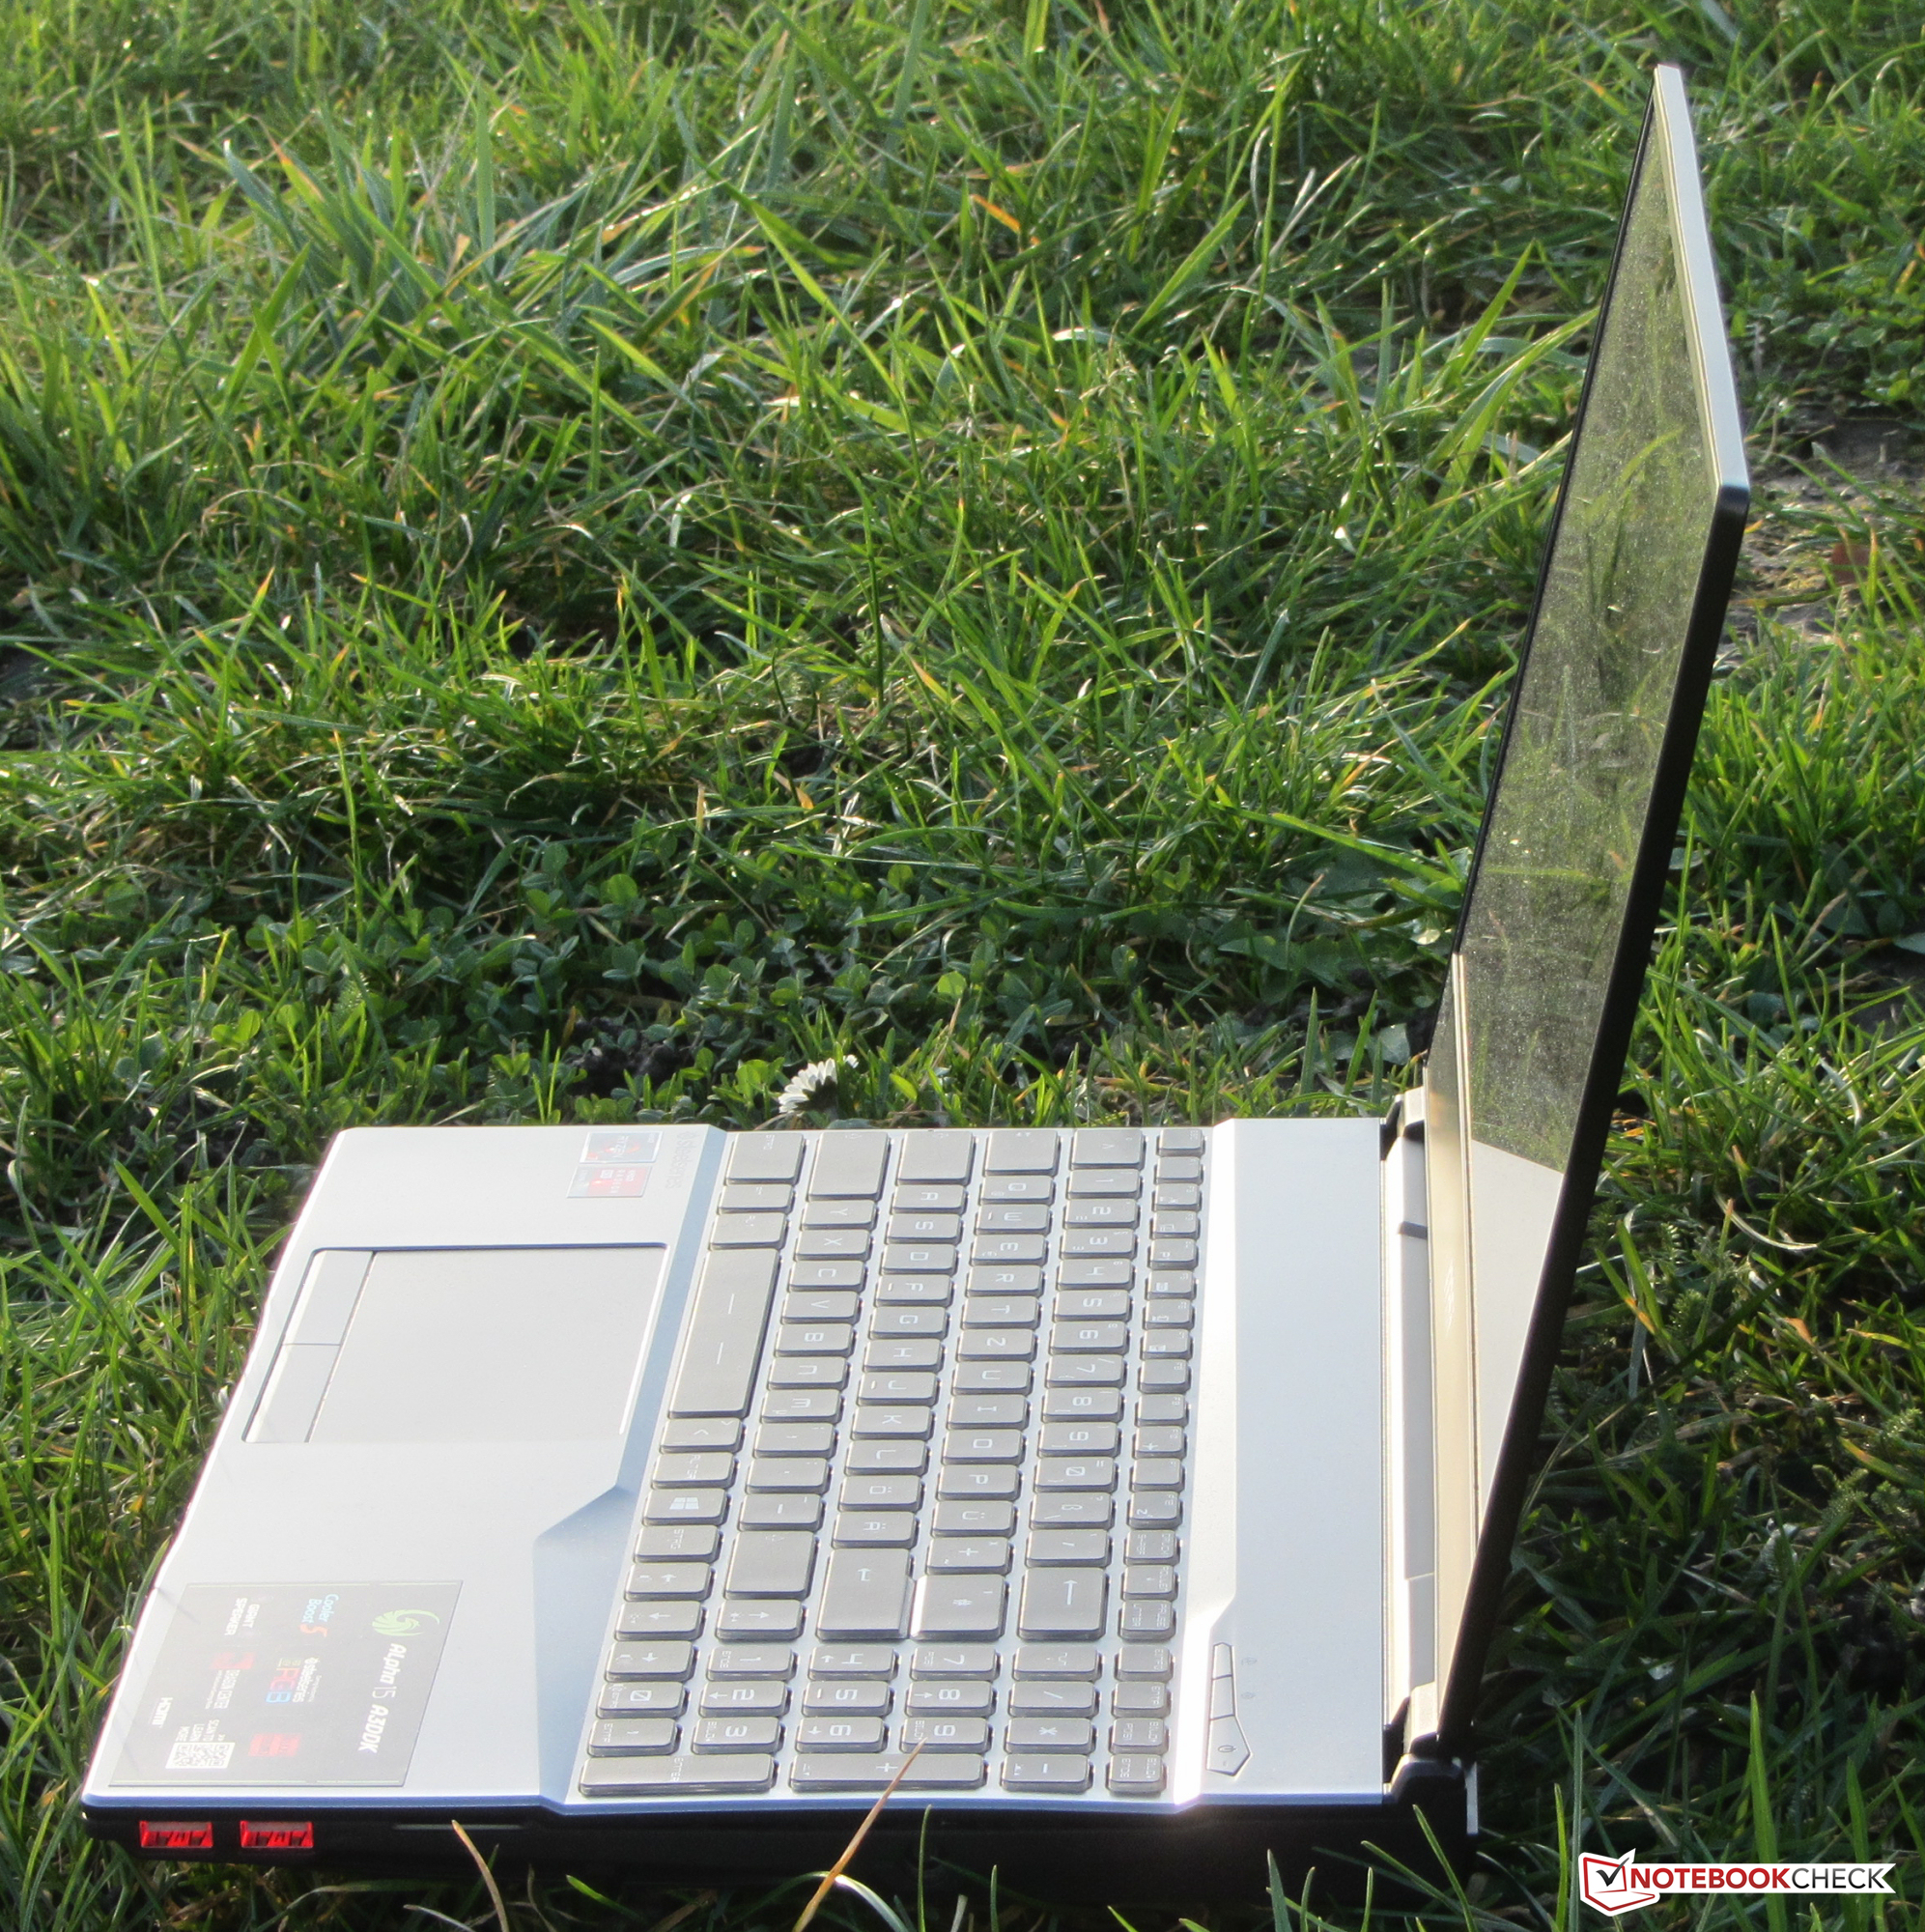
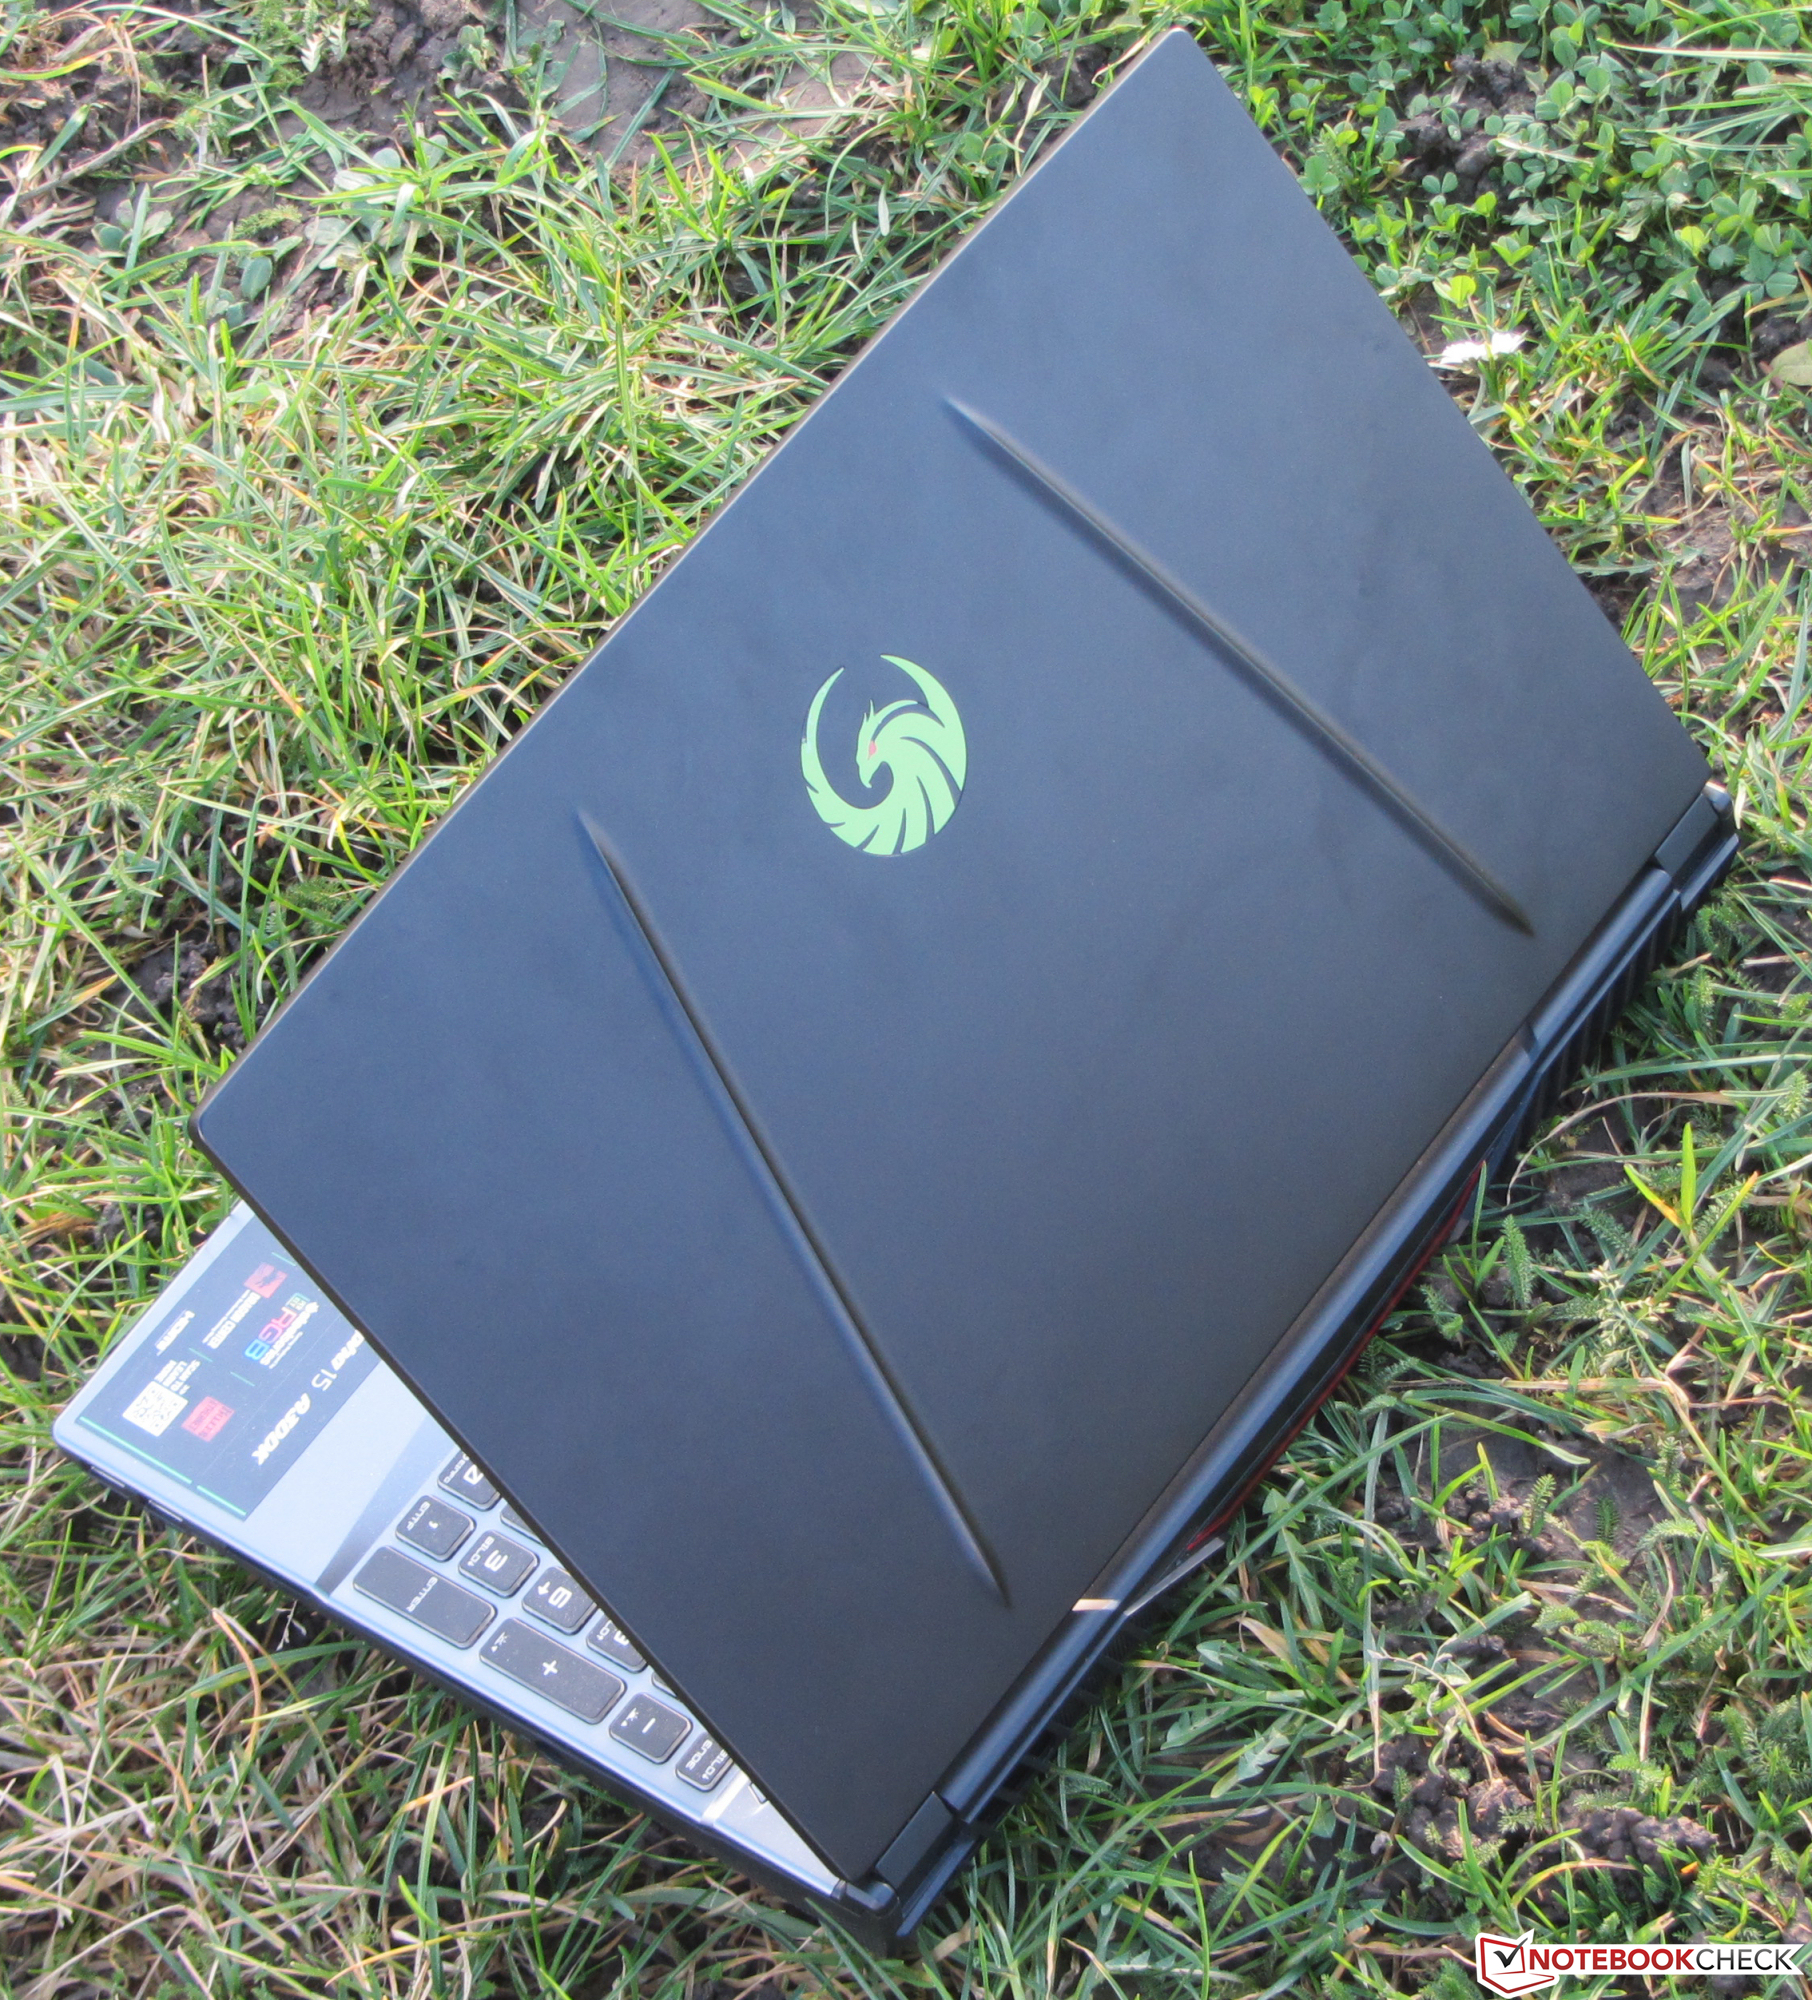
Breve Análise do Portátil MSI Alpha 15 A3DDK: Um portátil para jogos de gama média e faminto por energia
Avaliação | Data | Modelo | Peso | Altura | Size | Resolução | Preço |
|---|---|---|---|---|---|---|---|
| 78.8 % v7 (old) | 02/2020 | MSI Alpha 15 A3DDK-034 R7 3750H, Radeon RX 5500M | 2.3 kg | 27.5 mm | 15.60" | 1920x1080 | |
| 82.1 % v7 (old) | 11/2019 | Acer Predator Helios 300 PH315-52-79TY i7-9750H, GeForce GTX 1660 Ti Mobile | 2.3 kg | 23.2 mm | 15.60" | 1920x1080 | |
| 79.7 % v7 (old) | 11/2019 | HP Pavilion Gaming 15-ec0017ng R7 3750H, GeForce GTX 1660 Ti Max-Q | 2.3 kg | 23.5 mm | 15.60" | 1920x1080 | |
| 79.6 % v7 (old) | 10/2019 | Dell G5 15 5590-PCNJJ i5-9300H, GeForce GTX 1650 Mobile | 2.7 kg | 23.7 mm | 15.60" | 1920x1080 | |
| 82.3 % v7 (old) | 08/2019 | Lenovo Legion Y540-15IRH-81SX00B2GE i7-9750H, GeForce GTX 1660 Ti Mobile | 2.2 kg | 26 mm | 15.60" | 1920x1080 |
| SD Card Reader | |
| average JPG Copy Test (av. of 3 runs) | |
| Média da turma Gaming (20.9 - 210, n=54, últimos 2 anos) | |
| HP Pavilion Gaming 15-ec0017ng (Toshiba Exceria Pro SDXC 64 GB UHS-II) | |
| MSI Alpha 15 A3DDK-034 (Toshiba Exceria Pro SDXC 64 GB UHS-II) | |
| Dell G5 15 5590-PCNJJ (Toshiba Exceria Pro SDXC 64 GB UHS-II) | |
| maximum AS SSD Seq Read Test (1GB) | |
| Média da turma Gaming (25.5 - 261, n=51, últimos 2 anos) | |
| HP Pavilion Gaming 15-ec0017ng (Toshiba Exceria Pro SDXC 64 GB UHS-II) | |
| MSI Alpha 15 A3DDK-034 (Toshiba Exceria Pro SDXC 64 GB UHS-II) | |
| Dell G5 15 5590-PCNJJ (Toshiba Exceria Pro SDXC 64 GB UHS-II) | |
| |||||||||||||||||||||||||
iluminação: 86 %
iluminação com acumulador: 310 cd/m²
Contraste: 1069:1 (Preto: 0.29 cd/m²)
ΔE ColorChecker Calman: 4.78 | ∀{0.5-29.43 Ø4.72}
calibrated: 2.36
ΔE Greyscale Calman: 4.78 | ∀{0.09-98 Ø4.97}
91% sRGB (Argyll 1.6.3 3D)
59% AdobeRGB 1998 (Argyll 1.6.3 3D)
66.6% AdobeRGB 1998 (Argyll 3D)
91% sRGB (Argyll 3D)
66.4% Display P3 (Argyll 3D)
Gamma: 2.43
CCT: 7739 K
| MSI Alpha 15 A3DDK-034 AU Optronics B156HAN08.0 (AUO80ED), IPS, 1920x1080 | Acer Predator Helios 300 PH315-52-79TY AUO, B156HAN08.2, IPS, 1920x1080 | HP Pavilion Gaming 15-ec0017ng AU Optronics B156HAK02.0, IPS, 1920x1080 | Dell G5 15 5590-PCNJJ AU Optronics B156HAN (AUO23ED), IPS, 1920x1080 | Lenovo Legion Y540-15IRH-81SX00B2GE BOE 084D, IPS, 1920x1080 | |
|---|---|---|---|---|---|
| Display | -1% | -4% | 27% | -2% | |
| Display P3 Coverage (%) | 66.4 | 64.1 -3% | 62.8 -5% | 83.1 25% | 63.6 -4% |
| sRGB Coverage (%) | 91 | 93 2% | 89.2 -2% | 99.9 10% | 91.7 1% |
| AdobeRGB 1998 Coverage (%) | 66.6 | 65.7 -1% | 63.8 -4% | 96.8 45% | 65.2 -2% |
| Response Times | -51% | -325% | -387% | -21% | |
| Response Time Grey 50% / Grey 80% * (ms) | 7 ? | 15 ? -114% | 40 ? -471% | 48 ? -586% | 8.8 ? -26% |
| Response Time Black / White * (ms) | 10.4 ? | 9 ? 13% | 29 ? -179% | 30 ? -188% | 12 ? -15% |
| PWM Frequency (Hz) | |||||
| Screen | 7% | 1% | -21% | 5% | |
| Brightness middle (cd/m²) | 310 | 325 5% | 302 -3% | 234 -25% | 299 -4% |
| Brightness (cd/m²) | 310 | 310 0% | 291 -6% | 216 -30% | 290 -6% |
| Brightness Distribution (%) | 86 | 82 -5% | 84 -2% | 87 1% | 89 3% |
| Black Level * (cd/m²) | 0.29 | 0.255 12% | 0.25 14% | 0.22 24% | 0.29 -0% |
| Contrast (:1) | 1069 | 1275 19% | 1208 13% | 1064 0% | 1031 -4% |
| Colorchecker dE 2000 * | 4.78 | 4.28 10% | 4.84 -1% | 6.52 -36% | 3.7 23% |
| Colorchecker dE 2000 max. * | 8.1 | 8.42 -4% | 8.18 -1% | 10.58 -31% | 7 14% |
| Colorchecker dE 2000 calibrated * | 2.36 | 1.45 39% | 2.63 -11% | 3.56 -51% | 2 15% |
| Greyscale dE 2000 * | 4.78 | 5.01 -5% | 4.31 10% | 5.33 -12% | 4.1 14% |
| Gamma | 2.43 91% | 2.6 85% | 2.56 86% | 2.86 77% | 2.19 100% |
| CCT | 7739 84% | 7678 85% | 7318 89% | 5983 109% | 7166 91% |
| Color Space (Percent of AdobeRGB 1998) (%) | 59 | 60 2% | 58 -2% | 36 -39% | 59.3 1% |
| Color Space (Percent of sRGB) (%) | 91 | 93 2% | 89 -2% | 57 -37% | 91.5 1% |
| Média Total (Programa/Configurações) | -15% /
-2% | -109% /
-41% | -127% /
-58% | -6% /
1% |
* ... menor é melhor
Exibir tempos de resposta
| ↔ Tempo de resposta preto para branco | ||
|---|---|---|
| 10.4 ms ... ascensão ↗ e queda ↘ combinadas | ↗ 5.2 ms ascensão | 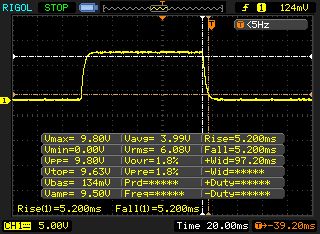 |
| ↘ 5.2 ms queda | ||
| A tela mostra boas taxas de resposta em nossos testes, mas pode ser muito lenta para jogadores competitivos. Em comparação, todos os dispositivos testados variam de 0.1 (mínimo) a 240 (máximo) ms. » 28 % de todos os dispositivos são melhores. Isso significa que o tempo de resposta medido é melhor que a média de todos os dispositivos testados (19.8 ms). | ||
| ↔ Tempo de resposta 50% cinza a 80% cinza | ||
| 7 ms ... ascensão ↗ e queda ↘ combinadas | ↗ 3.4 ms ascensão | 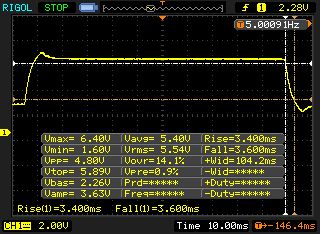 |
| ↘ 3.6 ms queda | ||
| A tela mostra taxas de resposta muito rápidas em nossos testes e deve ser muito adequada para jogos em ritmo acelerado. Em comparação, todos os dispositivos testados variam de 0.165 (mínimo) a 636 (máximo) ms. » 20 % de todos os dispositivos são melhores. Isso significa que o tempo de resposta medido é melhor que a média de todos os dispositivos testados (31 ms). | ||
Cintilação da tela / PWM (modulação por largura de pulso)
| Tela tremeluzindo / PWM não detectado | 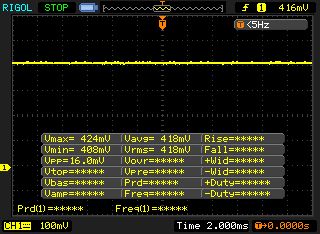 | ||
[pwm_comparison] Em comparação: 52 % de todos os dispositivos testados não usam PWM para escurecer a tela. Se PWM foi detectado, uma média de 7772 (mínimo: 5 - máximo: 343500) Hz foi medida. | |||

| Cinebench R15 | |
| CPU Single 64Bit | |
| Média da turma Gaming (188.8 - 343, n=110, últimos 2 anos) | |
| Acer Predator Helios 300 PH315-52-79TY | |
| Lenovo Legion Y540-15IRH-81SX00B2GE | |
| Dell G5 15 5590-PCNJJ | |
| MSI Alpha 15 A3DDK-034 | |
| HP Pavilion Gaming 15-ec0017ng | |
| MSI Alpha 15 A3DDK-034 (Silent) | |
| CPU Multi 64Bit | |
| Média da turma Gaming (1578 - 6271, n=109, últimos 2 anos) | |
| Acer Predator Helios 300 PH315-52-79TY | |
| Lenovo Legion Y540-15IRH-81SX00B2GE | |
| Dell G5 15 5590-PCNJJ | |
| HP Pavilion Gaming 15-ec0017ng | |
| MSI Alpha 15 A3DDK-034 | |
| MSI Alpha 15 A3DDK-034 (Silent) | |
| Cinebench R10 | |
| Rendering Single 32Bit | |
| Média da turma Gaming (7457 - 11779, n=8, últimos 2 anos) | |
| HP Pavilion Gaming 15-ec0017ng | |
| MSI Alpha 15 A3DDK-034 | |
| Rendering Multiple CPUs 32Bit | |
| Média da turma Gaming (42932 - 81339, n=8, últimos 2 anos) | |
| HP Pavilion Gaming 15-ec0017ng | |
| MSI Alpha 15 A3DDK-034 | |
| Geekbench 3 | |
| 32 Bit Multi-Core Score | |
| HP Pavilion Gaming 15-ec0017ng | |
| MSI Alpha 15 A3DDK-034 | |
| 32 Bit Single-Core Score | |
| HP Pavilion Gaming 15-ec0017ng | |
| MSI Alpha 15 A3DDK-034 | |
| Geekbench 5.0 | |
| 5.0 Multi-Core | |
| Média da turma Gaming (15251 - 23588, n=3, últimos 2 anos) | |
| HP Pavilion Gaming 15-ec0017ng | |
| MSI Alpha 15 A3DDK-034 | |
| MSI Alpha 15 A3DDK-034 (Silent) | |
| 5.0 Single-Core | |
| Média da turma Gaming (1937 - 2270, n=3, últimos 2 anos) | |
| HP Pavilion Gaming 15-ec0017ng | |
| MSI Alpha 15 A3DDK-034 | |
| MSI Alpha 15 A3DDK-034 (Silent) | |
| Geekbench 5.5 | |
| Multi-Core | |
| Média da turma Gaming (6460 - 27010, n=109, últimos 2 anos) | |
| MSI Alpha 15 A3DDK-034 | |
| Single-Core | |
| Média da turma Gaming (986 - 2474, n=109, últimos 2 anos) | |
| MSI Alpha 15 A3DDK-034 | |
| Mozilla Kraken 1.1 - Total | |
| Lenovo Legion Y540-15IRH-81SX00B2GE | |
| MSI Alpha 15 A3DDK-034 (Edge 44) | |
| HP Pavilion Gaming 15-ec0017ng (Edge 44) | |
| Acer Predator Helios 300 PH315-52-79TY (Edge: 44.18362.387.0) | |
| Média da turma Gaming (391 - 590, n=106, últimos 2 anos) | |
| Octane V2 - Total Score | |
| Média da turma Gaming (89353 - 139447, n=28, últimos 2 anos) | |
| Lenovo Legion Y540-15IRH-81SX00B2GE | |
| Acer Predator Helios 300 PH315-52-79TY (Edge: 44.18362.387.0) | |
| HP Pavilion Gaming 15-ec0017ng (Edge 44) | |
| MSI Alpha 15 A3DDK-034 (Edge 44) | |
| JetStream 1.1 - 1.1 Total | |
| Média da turma Gaming (549 - 647, n=3, últimos 2 anos) | |
| Acer Predator Helios 300 PH315-52-79TY (Edge: 44.18362.387.0) | |
| HP Pavilion Gaming 15-ec0017ng (Edge 44) | |
| Lenovo Legion Y540-15IRH-81SX00B2GE | |
| MSI Alpha 15 A3DDK-034 (Edge 44) | |
| MSI Alpha 15 A3DDK-034 (Edge 44; Silent) | |
* ... menor é melhor
| PCMark 8 Home Score Accelerated v2 | 4121 pontos | |
| PCMark 8 Creative Score Accelerated v2 | 4614 pontos | |
| PCMark 8 Work Score Accelerated v2 | 5045 pontos | |
| PCMark 10 Score | 4605 pontos | |
Ajuda | ||

| MSI Alpha 15 A3DDK-034 Kingston RBUSNS8154P3512GJ | Acer Predator Helios 300 PH315-52-79TY WDC PC SN720 SDAPNTW-512G | HP Pavilion Gaming 15-ec0017ng WDC PC SN720 SDAPNTW-256G | Dell G5 15 5590-PCNJJ KBG30ZMS128G | Lenovo Legion Y540-15IRH-81SX00B2GE WDC PC SN720 SDAPNTW-512G | |
|---|---|---|---|---|---|
| CrystalDiskMark 5.2 / 6 | 67% | 39% | -48% | 60% | |
| Write 4K (MB/s) | 105.4 | 108.7 3% | 148 40% | 65.3 -38% | 158.8 51% |
| Read 4K (MB/s) | 33.24 | 44.91 35% | 43.73 32% | 29.71 -11% | 29.11 -12% |
| Write Seq (MB/s) | 1029 | 2424 136% | 1617 57% | 128.8 -87% | 1584 54% |
| Read Seq (MB/s) | 1098 | 1617 47% | 1753 60% | 859 -22% | 1694 54% |
| Write 4K Q32T1 (MB/s) | 322.1 | 356.9 11% | 246.3 -24% | 95.8 -70% | 536 66% |
| Read 4K Q32T1 (MB/s) | 352 | 557 58% | 368 5% | 197.6 -44% | 363.9 3% |
| Write Seq Q32T1 (MB/s) | 1036 | 2542 145% | 1618 56% | 132.5 -87% | 2536 145% |
| Read Seq Q32T1 (MB/s) | 1606 | 3218 100% | 3027 88% | 1208 -25% | 3458 115% |
| 3DMark 06 Standard Score | 24966 pontos | |
| 3DMark 11 Performance | 12765 pontos | |
| 3DMark Ice Storm Standard Score | 55844 pontos | |
| 3DMark Cloud Gate Standard Score | 21898 pontos | |
| 3DMark Fire Strike Score | 10319 pontos | |
| 3DMark Time Spy Score | 4105 pontos | |
Ajuda | ||
| 3DMark 11 - 1280x720 Performance GPU | |
| Média da turma Gaming (21841 - 80022, n=107, últimos 2 anos) | |
| Lenovo Legion Y540-15IRH-81SX00B2GE | |
| Acer Predator Helios 300 PH315-52-79TY | |
| HP Pavilion Gaming 15-ec0017ng | |
| MSI Alpha 15 A3DDK-034 | |
| MSI Alpha 15 A3DDK-034 (Silent) | |
| Dell G5 15 5590-PCNJJ | |
| The Witcher 3 - 1920x1080 Ultra Graphics & Postprocessing (HBAO+) | |
| Média da turma Gaming (95 - 240, n=8, últimos 2 anos) | |
| Acer Predator Helios 300 PH315-52-79TY | |
| Lenovo Legion Y540-15IRH-81SX00B2GE | |
| HP Pavilion Gaming 15-ec0017ng | |
| MSI Alpha 15 A3DDK-034 | |
| MSI Alpha 15 A3DDK-034 (Silent) | |
| Dell G5 15 5590-PCNJJ | |
| BioShock Infinite - 1920x1080 Ultra Preset, DX11 (DDOF) | |
| Lenovo Legion Y540-15IRH-81SX00B2GE | |
| Acer Predator Helios 300 PH315-52-79TY | |
| HP Pavilion Gaming 15-ec0017ng | |
| MSI Alpha 15 A3DDK-034 | |
| MSI Alpha 15 A3DDK-034 (Silent) | |
| Dell G5 15 5590-PCNJJ | |
| For Honor - 1920x1080 Extreme Preset AA:T AF:16x | |
| MSI Alpha 15 A3DDK-034 | |
| F1 2019 - 1920x1080 Ultra High Preset AA:T AF:16x | |
| HP Pavilion Gaming 15-ec0017ng | |
| MSI Alpha 15 A3DDK-034 | |
| Dell G5 15 5590-PCNJJ | |
| baixo | média | alto | ultra | |
|---|---|---|---|---|
| BioShock Infinite (2013) | 197.3 | 173.5 | 155 | 94.2 |
| The Witcher 3 (2015) | 173.6 | 129 | 73.3 | 44.7 |
| For Honor (2017) | 184.3 | 102 | 97 | 78.5 |
| Ghost Recon Wildlands (2017) | 73.1 | 52.9 | 50.3 | 27.1 |
| Final Fantasy XV Benchmark (2018) | 90.9 | 57.7 | 30.8 | |
| World of Tanks enCore (2018) | 241.9 | 176.3 | 89.7 | |
| F1 2019 (2019) | 114 | 97 | 82 | 68 |
| Control (2019) | 128.9 | 50.1 | 36.9 | |
| Borderlands 3 (2019) | 75.2 | 62.3 | 45 | 34.2 |
| Star Wars Jedi Fallen Order (2019) | 57.3 | 52.8 | 50.1 |
Barulho
| Ocioso |
| 36 / 37 / 46 dB |
| Carga |
| 50 / 57 dB |
 | ||
30 dB silencioso 40 dB(A) audível 50 dB(A) ruidosamente alto |
||
min: | ||
| MSI Alpha 15 A3DDK-034 R7 3750H, Radeon RX 5500M | Acer Predator Helios 300 PH315-52-79TY i7-9750H, GeForce GTX 1660 Ti Mobile | HP Pavilion Gaming 15-ec0017ng R7 3750H, GeForce GTX 1660 Ti Max-Q | Dell G5 15 5590-PCNJJ i5-9300H, GeForce GTX 1650 Mobile | Lenovo Legion Y540-15IRH-81SX00B2GE i7-9750H, GeForce GTX 1660 Ti Mobile | |
|---|---|---|---|---|---|
| Noise | 15% | 15% | 9% | 20% | |
| desligado / ambiente * (dB) | 29 | 30.2 -4% | 30.2 -4% | 30 -3% | 29.3 -1% |
| Idle Minimum * (dB) | 36 | 31 14% | 31.5 12% | 31 14% | 29.3 19% |
| Idle Average * (dB) | 37 | 31 16% | 31.5 15% | 32 14% | 29.3 21% |
| Idle Maximum * (dB) | 46 | 31 33% | 31.5 32% | 35 24% | 29.3 36% |
| Load Average * (dB) | 50 | 41.5 17% | 41.4 17% | 49 2% | 35.7 29% |
| Witcher 3 ultra * (dB) | 51 | 46.7 8% | 43.7 14% | 47 8% | 44.2 13% |
| Load Maximum * (dB) | 57 | 46.9 18% | 45.5 20% | 53 7% | 45.6 20% |
* ... menor é melhor
(±) A temperatura máxima no lado superior é 44 °C / 111 F, em comparação com a média de 40.4 °C / 105 F , variando de 21.2 a 68.8 °C para a classe Gaming.
(-) A parte inferior aquece até um máximo de 49 °C / 120 F, em comparação com a média de 43.2 °C / 110 F
(+) Em uso inativo, a temperatura média para o lado superior é 25.6 °C / 78 F, em comparação com a média do dispositivo de 33.9 °C / ### class_avg_f### F.
(±) Jogando The Witcher 3, a temperatura média para o lado superior é 37.3 °C / 99 F, em comparação com a média do dispositivo de 33.9 °C / ## #class_avg_f### F.
(±) Os apoios para as mãos e o touchpad podem ficar muito quentes ao toque, com um máximo de 37 °C / 98.6 F.
(-) A temperatura média da área do apoio para as mãos de dispositivos semelhantes foi 28.8 °C / 83.8 F (-8.2 °C / -14.8 F).
| MSI Alpha 15 A3DDK-034 R7 3750H, Radeon RX 5500M | Acer Predator Helios 300 PH315-52-79TY i7-9750H, GeForce GTX 1660 Ti Mobile | HP Pavilion Gaming 15-ec0017ng R7 3750H, GeForce GTX 1660 Ti Max-Q | Dell G5 15 5590-PCNJJ i5-9300H, GeForce GTX 1650 Mobile | Lenovo Legion Y540-15IRH-81SX00B2GE i7-9750H, GeForce GTX 1660 Ti Mobile | |
|---|---|---|---|---|---|
| Heat | 1% | 6% | -3% | -20% | |
| Maximum Upper Side * (°C) | 44 | 52 -18% | 44.8 -2% | 49 -11% | 42.7 3% |
| Maximum Bottom * (°C) | 49 | 46.3 6% | 40.8 17% | 55 -12% | 52.7 -8% |
| Idle Upper Side * (°C) | 26 | 24.8 5% | 25.4 2% | 25 4% | 33.1 -27% |
| Idle Bottom * (°C) | 28 | 25.4 9% | 26.6 5% | 26 7% | 41 -46% |
* ... menor é melhor
MSI Alpha 15 A3DDK-034 análise de áudio
(+) | os alto-falantes podem tocar relativamente alto (###valor### dB)
Graves 100 - 315Hz
(-) | quase nenhum baixo - em média 31.4% menor que a mediana
(+) | o baixo é linear (5.8% delta para a frequência anterior)
Médios 400 - 2.000 Hz
(±) | médios reduzidos - em média 7.4% menor que a mediana
(±) | a linearidade dos médios é média (9.9% delta para frequência anterior)
Altos 2 - 16 kHz
(+) | agudos equilibrados - apenas 2.1% longe da mediana
(+) | os máximos são lineares (3.7% delta da frequência anterior)
Geral 100 - 16.000 Hz
(±) | a linearidade do som geral é média (19.5% diferença em relação à mediana)
Comparado com a mesma classe
» 68% de todos os dispositivos testados nesta classe foram melhores, 7% semelhantes, 26% piores
» O melhor teve um delta de 6%, a média foi 18%, o pior foi 132%
Comparado com todos os dispositivos testados
» 48% de todos os dispositivos testados foram melhores, 7% semelhantes, 44% piores
» O melhor teve um delta de 4%, a média foi 24%, o pior foi 134%
HP Pavilion Gaming 15-ec0017ng análise de áudio
(-) | alto-falantes não muito altos (###valor### dB)
Graves 100 - 315Hz
(-) | quase nenhum baixo - em média 22.5% menor que a mediana
(±) | a linearidade dos graves é média (10.5% delta para a frequência anterior)
Médios 400 - 2.000 Hz
(+) | médios equilibrados - apenas 1.7% longe da mediana
(±) | a linearidade dos médios é média (8.4% delta para frequência anterior)
Altos 2 - 16 kHz
(+) | agudos equilibrados - apenas 4.4% longe da mediana
(±) | a linearidade dos máximos é média (8.1% delta para frequência anterior)
Geral 100 - 16.000 Hz
(±) | a linearidade do som geral é média (23.8% diferença em relação à mediana)
Comparado com a mesma classe
» 86% de todos os dispositivos testados nesta classe foram melhores, 5% semelhantes, 10% piores
» O melhor teve um delta de 6%, a média foi 18%, o pior foi 132%
Comparado com todos os dispositivos testados
» 71% de todos os dispositivos testados foram melhores, 6% semelhantes, 22% piores
» O melhor teve um delta de 4%, a média foi 24%, o pior foi 134%
| desligado | |
| Ocioso | |
| Carga |
|
Key:
min: | |
| MSI Alpha 15 A3DDK-034 R7 3750H, Radeon RX 5500M | Acer Predator Helios 300 PH315-52-79TY i7-9750H, GeForce GTX 1660 Ti Mobile | HP Pavilion Gaming 15-ec0017ng R7 3750H, GeForce GTX 1660 Ti Max-Q | Dell G5 15 5590-PCNJJ i5-9300H, GeForce GTX 1650 Mobile | Lenovo Legion Y540-15IRH-81SX00B2GE i7-9750H, GeForce GTX 1660 Ti Mobile | |
|---|---|---|---|---|---|
| Power Consumption | -12% | 38% | 34% | -2% | |
| Idle Minimum * (Watt) | 14 | 17.2 -23% | 3.4 76% | 4 71% | 14.5 -4% |
| Idle Average * (Watt) | 18 | 22.6 -26% | 7.6 58% | 7 61% | 18.5 -3% |
| Idle Maximum * (Watt) | 32 | 25.5 20% | 10.2 68% | 12 62% | 20 37% |
| Load Average * (Watt) | 64 | 88 -38% | 73 -14% | 95 -48% | 81.6 -27% |
| Witcher 3 ultra * (Watt) | 123 | 107 13% | 86 30% | 132 -7% | |
| Load Maximum * (Watt) | 193 | 177 8% | 140.5 27% | 135 30% | 208.1 -8% |
* ... menor é melhor
| MSI Alpha 15 A3DDK-034 R7 3750H, Radeon RX 5500M, 51 Wh | Acer Predator Helios 300 PH315-52-79TY i7-9750H, GeForce GTX 1660 Ti Mobile, 58.75 Wh | HP Pavilion Gaming 15-ec0017ng R7 3750H, GeForce GTX 1660 Ti Max-Q, 52.5 Wh | Dell G5 15 5590-PCNJJ i5-9300H, GeForce GTX 1650 Mobile, 60 Wh | Lenovo Legion Y540-15IRH-81SX00B2GE i7-9750H, GeForce GTX 1660 Ti Mobile, 57 Wh | |
|---|---|---|---|---|---|
| Duração da bateria | 2% | 103% | 140% | -3% | |
| Reader / Idle (h) | 5.8 | 5 -14% | 13.7 136% | 14.5 150% | 4 -31% |
| H.264 (h) | 3.9 | 3.4 -13% | 8.5 118% | ||
| WiFi v1.3 (h) | 4.1 | 3.5 -15% | 8 95% | 8 95% | 2.4 -41% |
| Load (h) | 0.8 | 1.2 50% | 1.3 63% | 2.2 175% | 1.3 63% |
Pro
Contra
Verdict - A competent and compact midrange gaming laptop let down by loud fans and short battery life
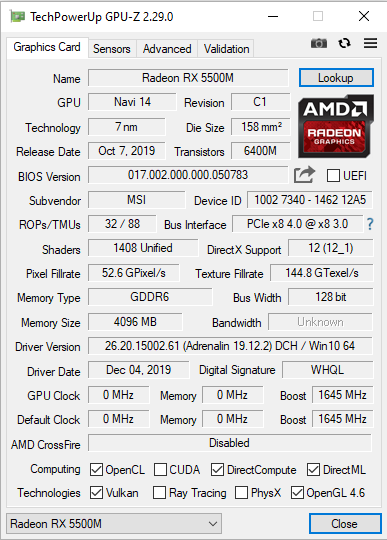
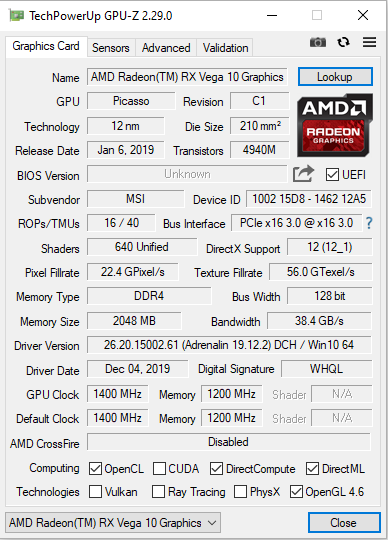
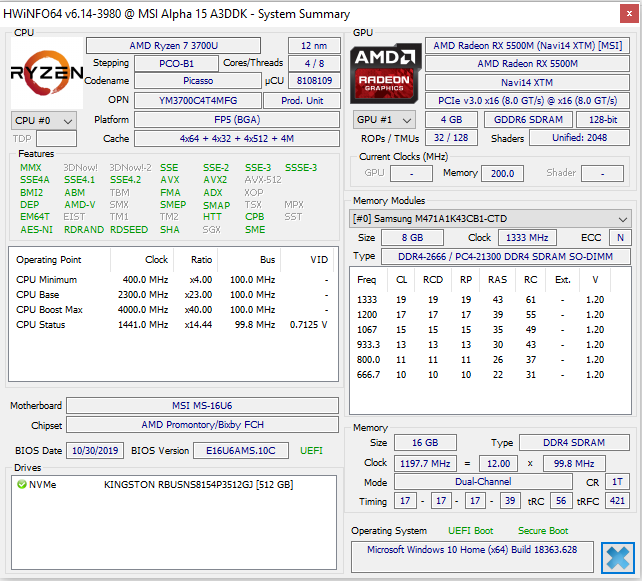
A MSI, com o Alpha 15, criou um portátil de jogos de gama média decente de 15,6 polegadas. Sua APU Ryzen 7 3750H e GPU Radeon RX 5500M permitem que o Alpha 15 rode todos os jogos atuais sem problemas. Como regra, o Alpha 15 é um portátil para jogos de 1080p que pode rodar títulos com gráficos médios a altos. Em alguns casos, o Alpha 15 pode jogar além desses níveis, mas apenas em títulos pouco exigentes. No geral, o RX 5500M fica entre a GeForce GTX 1650 e a GeForce GTX 1660 Ti Max-Q.
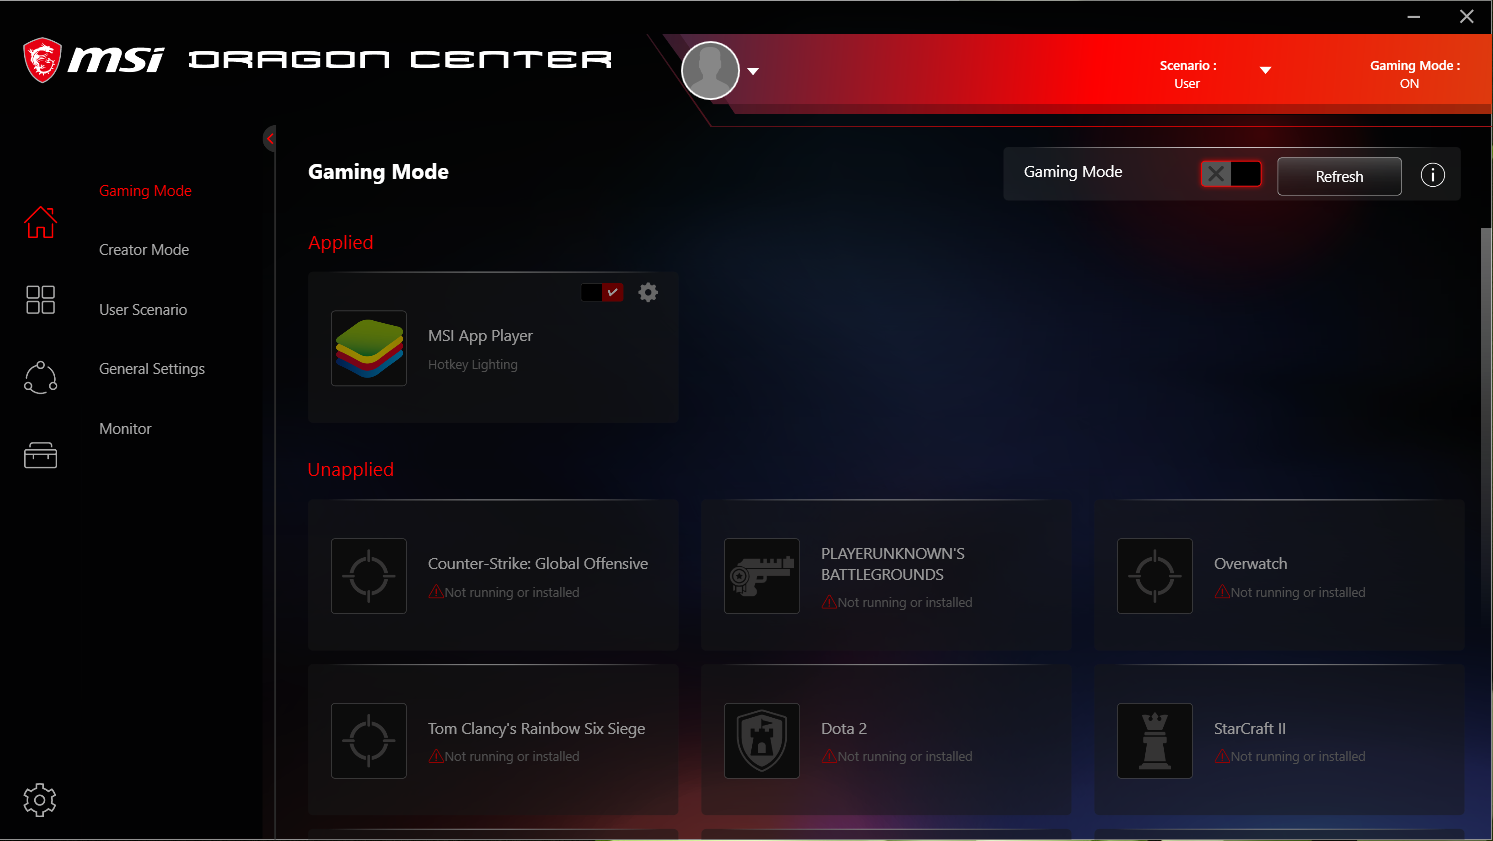
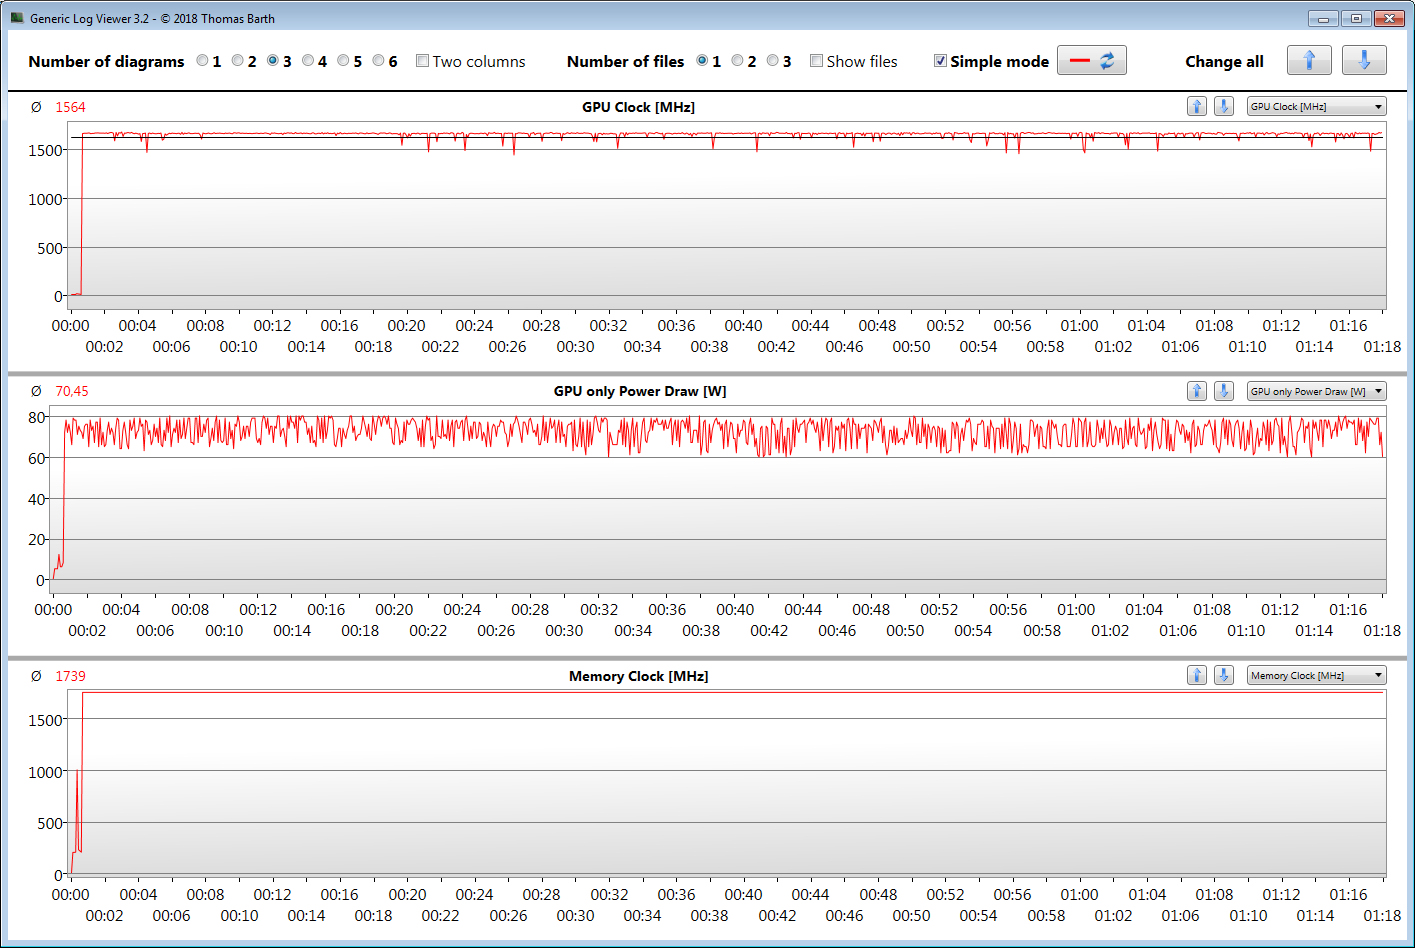
O Alpha 15 também possui um consumo de energia comparativamente alto, tanto sob carga quanto no modo ocioso. Como resultado, as durações de sua bateria de 51 Wh não são particularmente boas. A MSI deve examinar novamente o gerenciamento de energia, em nossa opinião. O portátil também funciona de forma barulhenta, principalmente com o perfil de desempenho que usamos durante nossos testes. Se você não precisar necessariamente do desempenho máximo, poderá usar o modo Silencioso no MSI Dragon Center. Pelo menos isso seria preferível para o uso diário.
Essencialmente, o MSI Alpha 15 A3DDK é um portátil de jogos de gama média bem-sucedido. No entanto, sofre de fraquezas que a MSI ainda está para erradicar, se isso for possível.
A MSI equipou o dispositivo com um SSD NVMe rápido, que oferece 512 GB de armazenamento. Se isso não for suficiente, você poderá adicionar uma unidade SATA de 2,5 polegadas. A MSI pré-instala o Alpha 15 com um slot SATA e estrutura de montagem também.
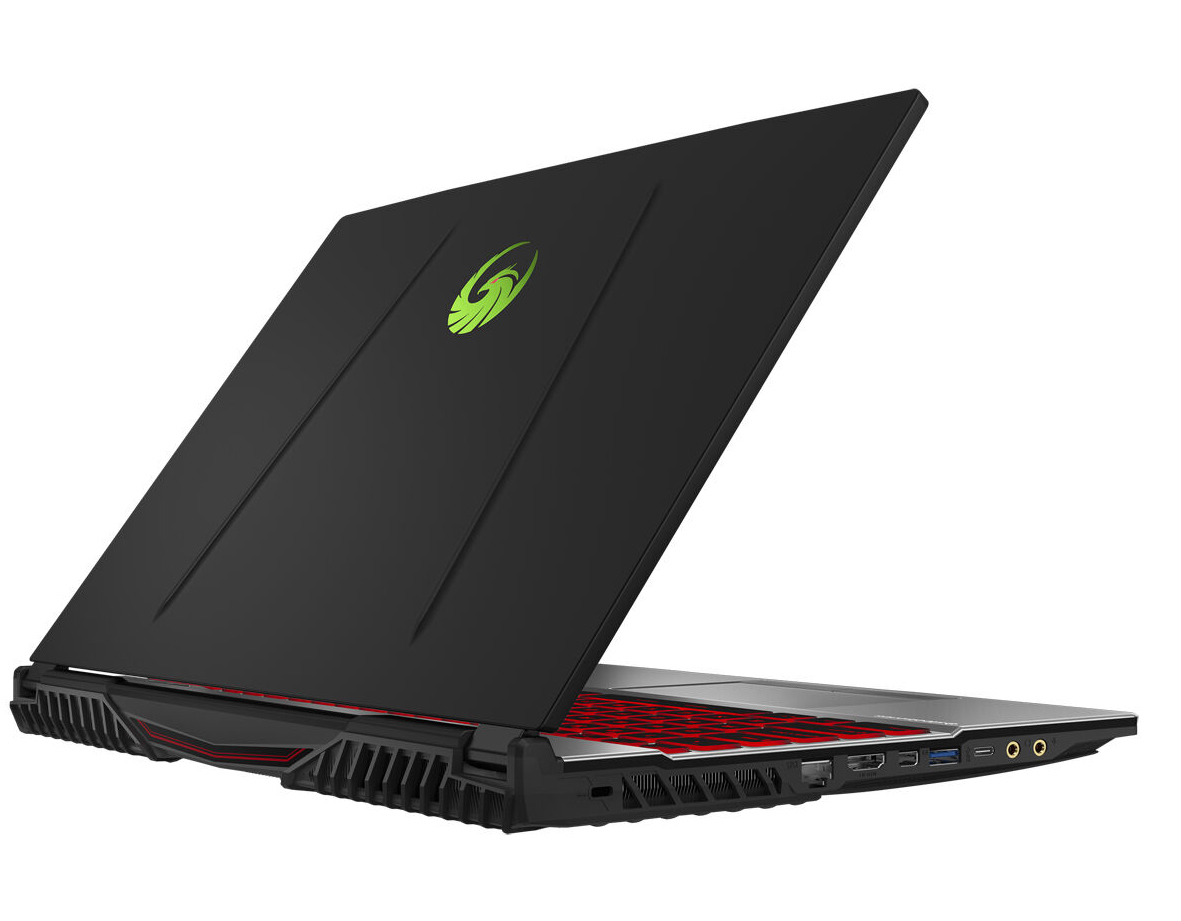
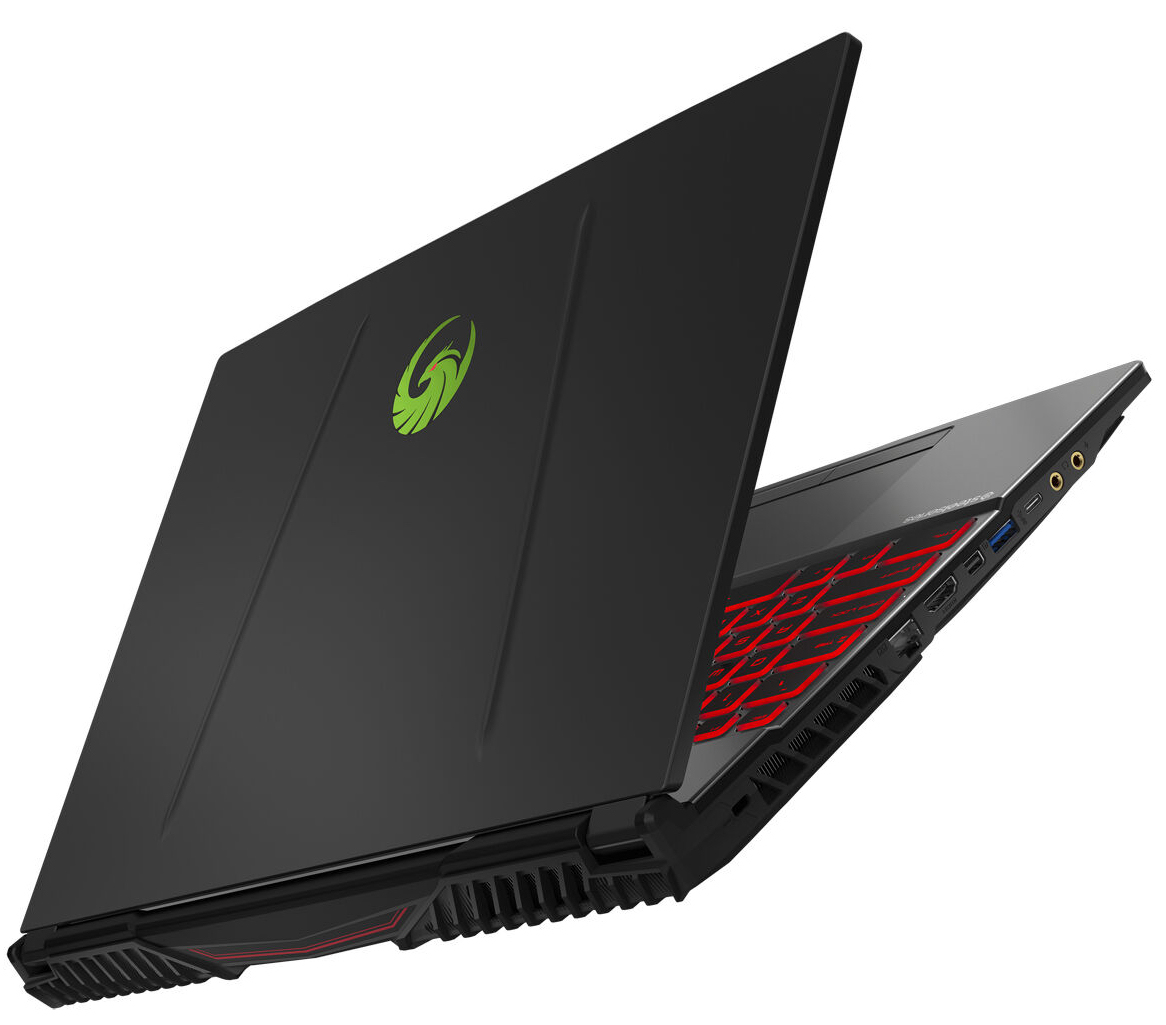
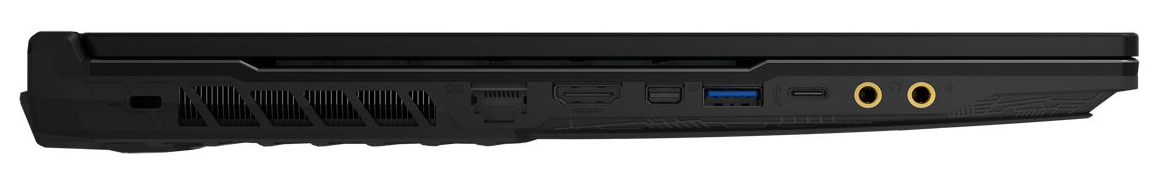
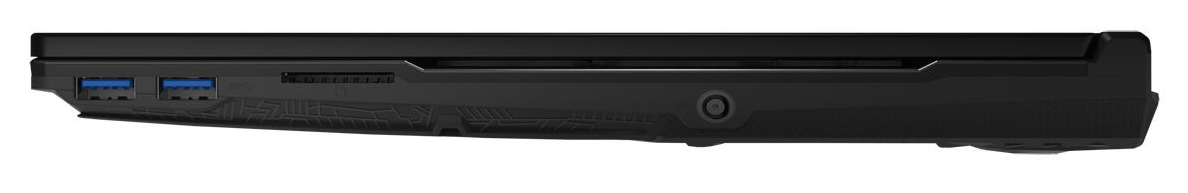
O dispositivo também possui um painel IPS adequadamente brilhante, com acabamento mate e resolução nativa de 1080p. O painel também possui uma boa taxa de contraste, além de ângulos de visão estáveis, precisão de cores decente e tempos de resposta curtos. Ele também suporta a tecnologia AMD FreeSync. Além disso, o Alpha 15 possui um número adequado de portas, mas não há Thunderbolt 3. O teclado retro iluminado também é bom o suficiente para o uso diário.
O Alpha 15 não terá facilidade em se afirmar. Alguns concorrentes têm uma relação custo/benefício significativamente melhor, por exemplo. O HP Pavilion Gaming 15-ec0017ng custa € 1.150 (~$ 1.259), uns bons € 150 (~$ 164) menos que nossa unidade de análise. O Pavilion Gaming 15 também oferece uma GPU mais potente que a Alpha 15, junto com ventiladores mais silenciosos, temperaturas mais baixas da superfície, consumo de energia reduzido e duração da bateria significativamente melhor.
MSI Alpha 15 A3DDK-034
- 02/07/2020 v7 (old)
Sascha Mölck
Price comparison
