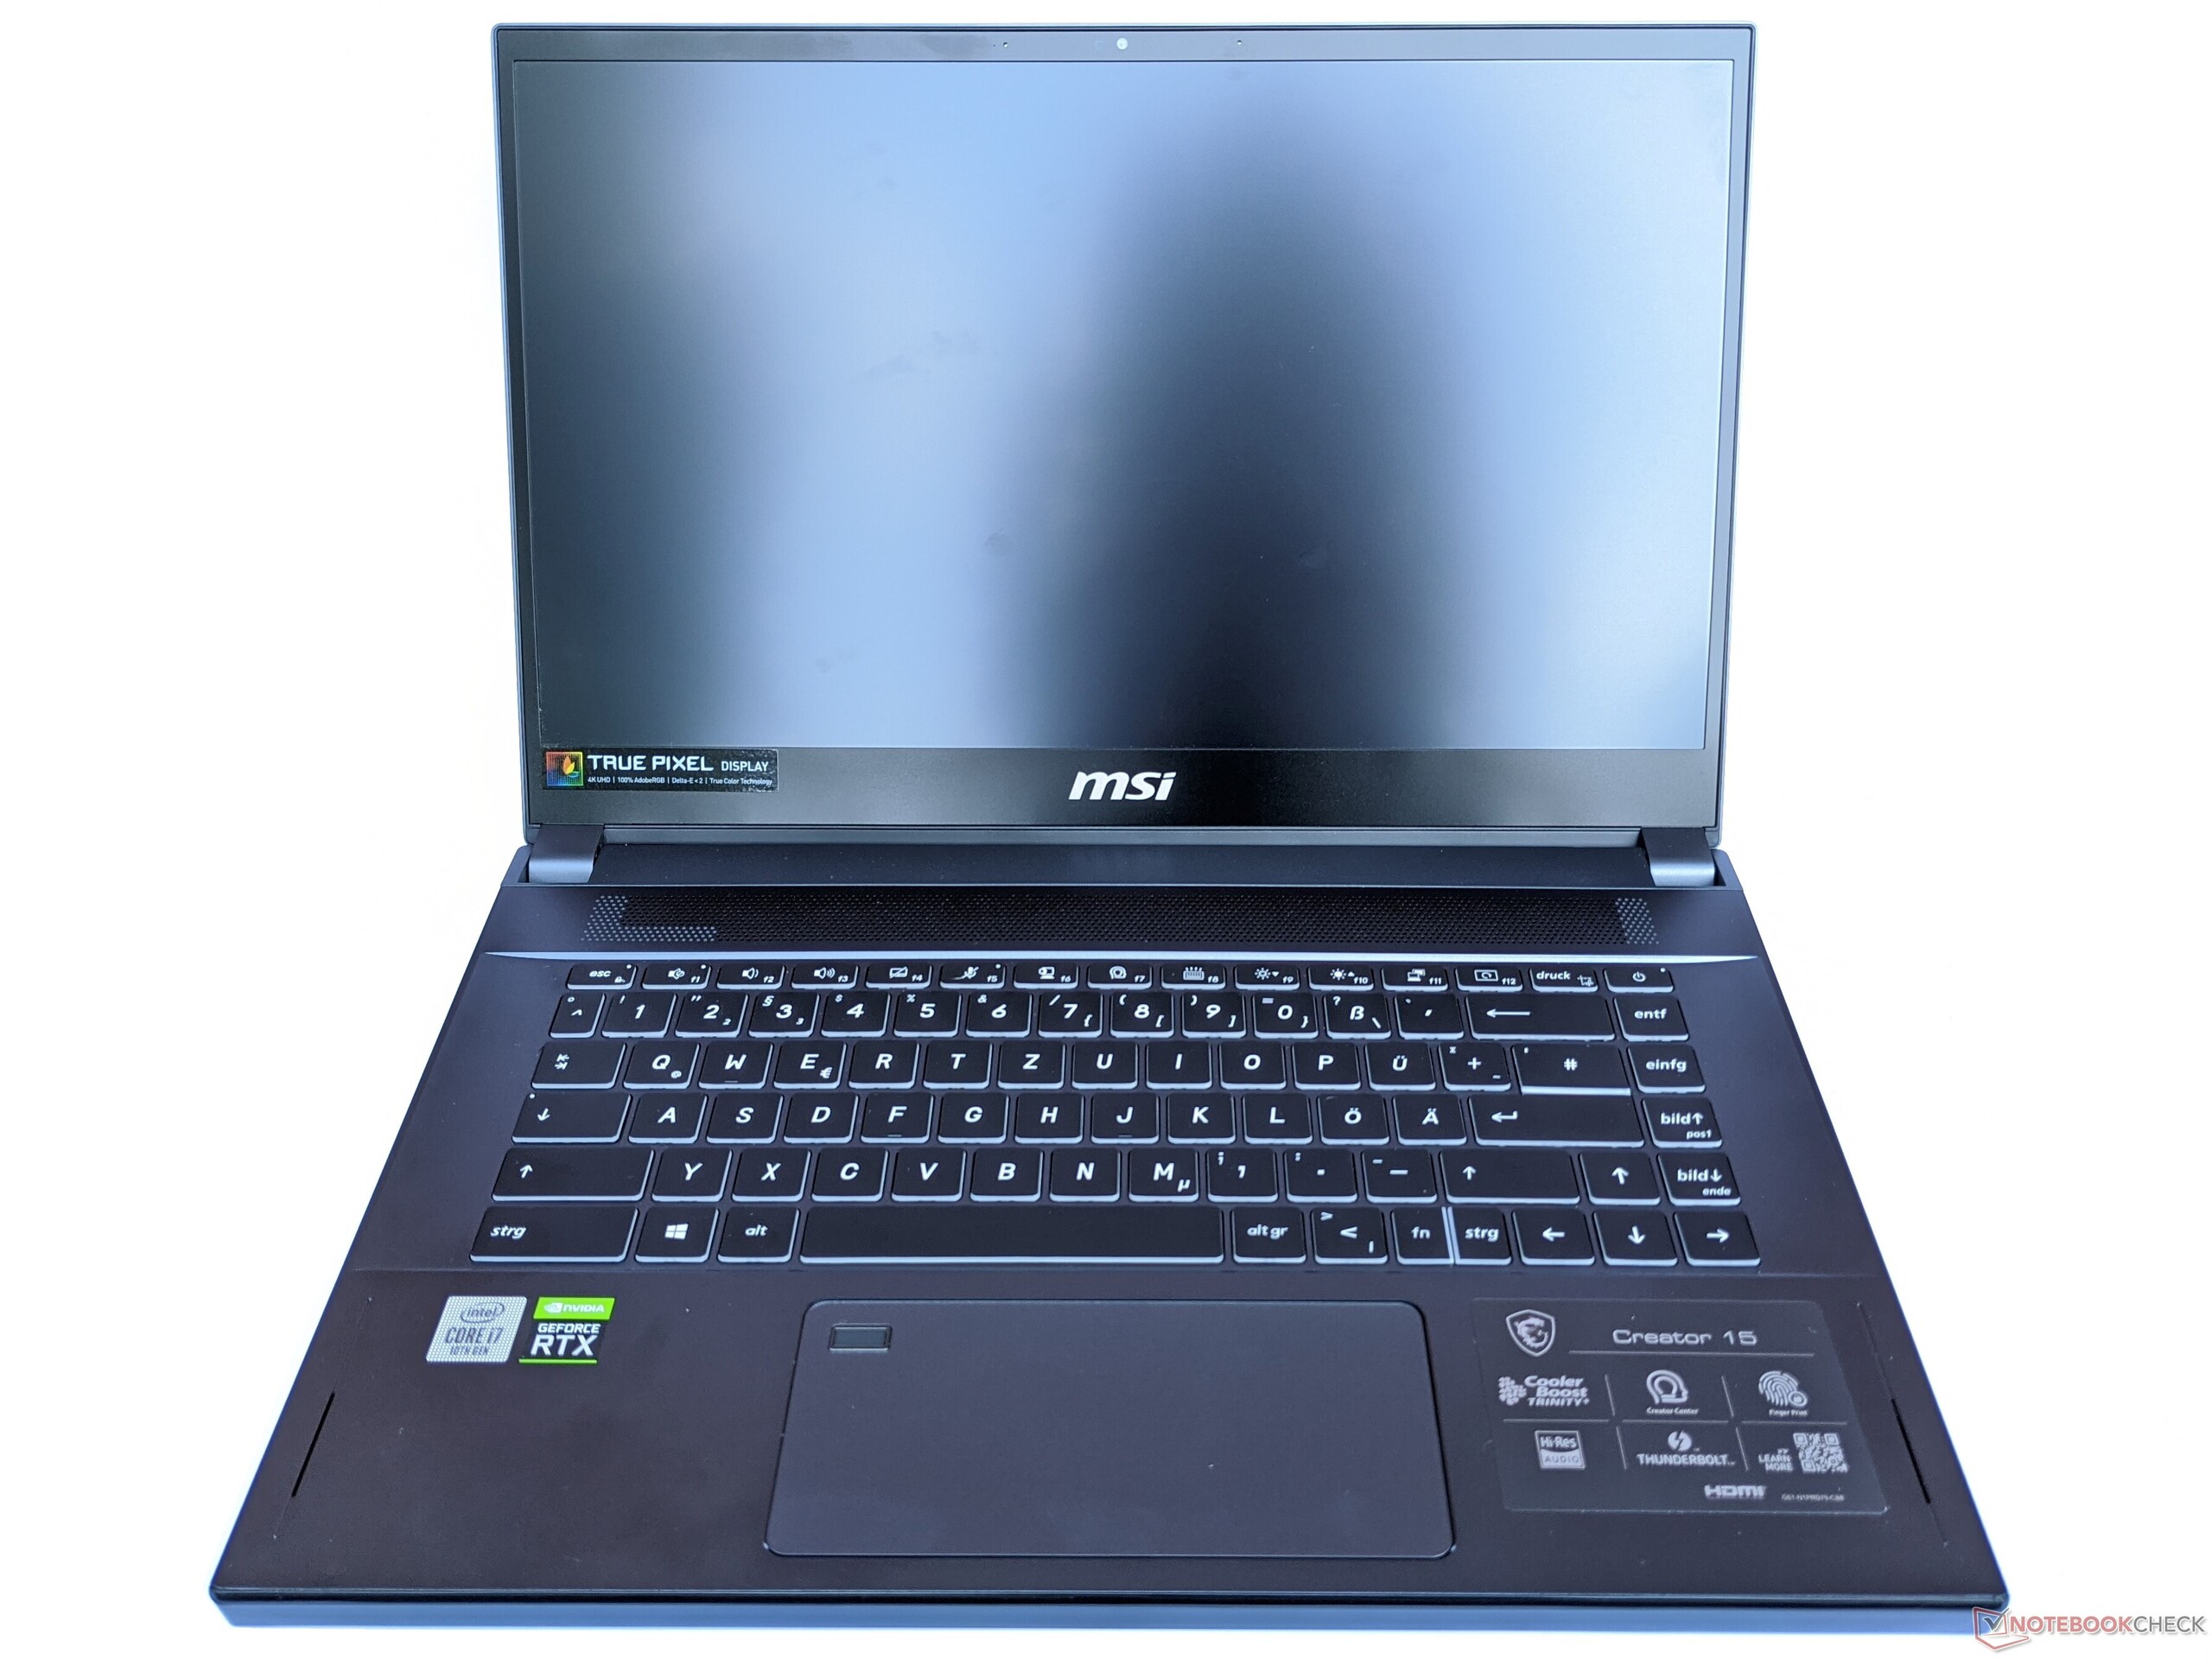
Breve Análise do Portátil MSI Creator 15: Uma tela 4K brilhante para criadores de conteúdo
Avaliação | Data | Modelo | Peso | Altura | Size | Resolução | Preço |
|---|---|---|---|---|---|---|---|
| 84.7 % v7 (old) | 10/2020 | MSI Creator 15 i7-10875H, GeForce RTX 2070 Max-Q | 1.9 kg | 22 mm | 15.60" | 3840x2160 | |
| 85 % v7 (old) | 06/2019 | MSI P65 Creator 9SF-657 i9-9880H, GeForce RTX 2070 Max-Q | 1.9 kg | 18 mm | 15.60" | 3840x2160 | |
| 85.8 % v7 (old) | 05/2020 | Gigabyte Aero 15 OLED XB-8DE51B0SP i7-10875H, GeForce RTX 2070 Super Max-Q | 2.2 kg | 20 mm | 15.60" | 3840x2160 | |
| 86.9 % v7 (old) | 08/2020 | Razer Blade 15 RTX 2070 Super Max-Q i7-10875H, GeForce RTX 2070 Super Max-Q | 2.1 kg | 17.8 mm | 15.60" | 1920x1080 | |
| 82.9 % v7 (old) | 10/2020 | Asus Zephyrus S15 GX502L i7-10875H, GeForce RTX 2070 Super Mobile | 2.1 kg | 19 mm | 15.60" | 1920x1080 |
| SD Card Reader | |
| average JPG Copy Test (av. of 3 runs) | |
| MSI Creator 15 (Toshiba Exceria Pro SDXC 64 GB UHS-II) | |
| Gigabyte Aero 15 OLED XB-8DE51B0SP (Toshiba Exceria Pro SDXC 64 GB UHS-II) | |
| Razer Blade 15 RTX 2070 Super Max-Q (Toshiba Exceria Pro SDXC 64 GB UHS-II) | |
| Média da turma Multimedia (23 - 531, n=41, últimos 2 anos) | |
| maximum AS SSD Seq Read Test (1GB) | |
| Gigabyte Aero 15 OLED XB-8DE51B0SP (Toshiba Exceria Pro SDXC 64 GB UHS-II) | |
| MSI Creator 15 (Toshiba Exceria Pro SDXC 64 GB UHS-II) | |
| Razer Blade 15 RTX 2070 Super Max-Q (Toshiba Exceria Pro SDXC 64 GB UHS-II) | |
| Média da turma Multimedia (37.3 - 1455, n=40, últimos 2 anos) | |

")
")
| |||||||||||||||||||||||||
iluminação: 85 %
iluminação com acumulador: 463 cd/m²
Contraste: 1326:1 (Preto: 0.35 cd/m²)
ΔE ColorChecker Calman: 2.39 | ∀{0.5-29.43 Ø4.72}
ΔE Greyscale Calman: 3.97 | ∀{0.09-98 Ø4.97}
100% sRGB (Argyll 1.6.3 3D)
75% AdobeRGB 1998 (Argyll 1.6.3 3D)
84.9% AdobeRGB 1998 (Argyll 3D)
99.7% sRGB (Argyll 3D)
85.4% Display P3 (Argyll 3D)
Gamma: 2.23
CCT: 6817 K
| MSI Creator 15 Sharp SHP14A1, IPS, 3840x2160, 15.6" | MSI P65 Creator 9SF-657 AU Optronics AUO41EB, IPS, 3840x2160, 15.6" | Gigabyte Aero 15 OLED XB-8DE51B0SP Samsung SDCA029, OLED, 3840x2160, 15.6" | Razer Blade 15 RTX 2070 Super Max-Q AU Optronics B156HAN12.0, IPS, 1920x1080, 15.6" | Asus Zephyrus S15 GX502L B156HAN12.0 (AUOBC8C), IPS, 1920x1080, 15.6" | |
|---|---|---|---|---|---|
| Display | 5% | 11% | -12% | -11% | |
| Display P3 Coverage (%) | 85.4 | 84.4 -1% | 99.9 17% | 69.4 -19% | 69.7 -18% |
| sRGB Coverage (%) | 99.7 | 100 0% | 100 0% | 98.8 -1% | 99.7 0% |
| AdobeRGB 1998 Coverage (%) | 84.9 | 98.5 16% | 98.2 16% | 70.5 -17% | 71.1 -16% |
| Response Times | 24% | 96% | 89% | 78% | |
| Response Time Grey 50% / Grey 80% * (ms) | 62 ? | 51 ? 18% | 2.2 ? 96% | 3.2 ? 95% | 14 ? 77% |
| Response Time Black / White * (ms) | 44 ? | 31 ? 30% | 1.8 ? 96% | 8 ? 82% | 9.6 ? 78% |
| PWM Frequency (Hz) | 25000 ? | 60 ? | |||
| Screen | -20% | 13% | -12% | -4% | |
| Brightness middle (cd/m²) | 464 | 445 -4% | 385 -17% | 345.4 -26% | 283 -39% |
| Brightness (cd/m²) | 446 | 462 4% | 390 -13% | 342 -23% | 289 -35% |
| Brightness Distribution (%) | 85 | 83 -2% | 93 9% | 90 6% | 90 6% |
| Black Level * (cd/m²) | 0.35 | 0.5 -43% | 0.34 3% | 0.24 31% | |
| Contrast (:1) | 1326 | 890 -33% | 1016 -23% | 1179 -11% | |
| Colorchecker dE 2000 * | 2.39 | 4.75 -99% | 2.46 -3% | 3.18 -33% | 2.26 5% |
| Colorchecker dE 2000 max. * | 6 | 7.79 -30% | 4.01 33% | 6.57 -10% | 5.64 6% |
| Greyscale dE 2000 * | 3.97 | 4.49 -13% | 1.39 65% | 3.8 4% | 3.4 14% |
| Gamma | 2.23 99% | 2.49 88% | 2.31 95% | 2.15 102% | 2.228 99% |
| CCT | 6817 95% | 7374 88% | 6395 102% | 7109 91% | 7249 90% |
| Color Space (Percent of AdobeRGB 1998) (%) | 75 | 87 16% | 98 31% | 64.3 -14% | 71 -5% |
| Color Space (Percent of sRGB) (%) | 100 | 100 0% | 100 0% | 99 -1% | 93 -7% |
| Colorchecker dE 2000 calibrated * | 2.6 | 1.77 | 1.11 | ||
| Média Total (Programa/Configurações) | 3% /
-9% | 40% /
25% | 22% /
2% | 21% /
6% |
* ... menor é melhor
Exibir tempos de resposta
| ↔ Tempo de resposta preto para branco | ||
|---|---|---|
| 44 ms ... ascensão ↗ e queda ↘ combinadas | ↗ 26 ms ascensão | 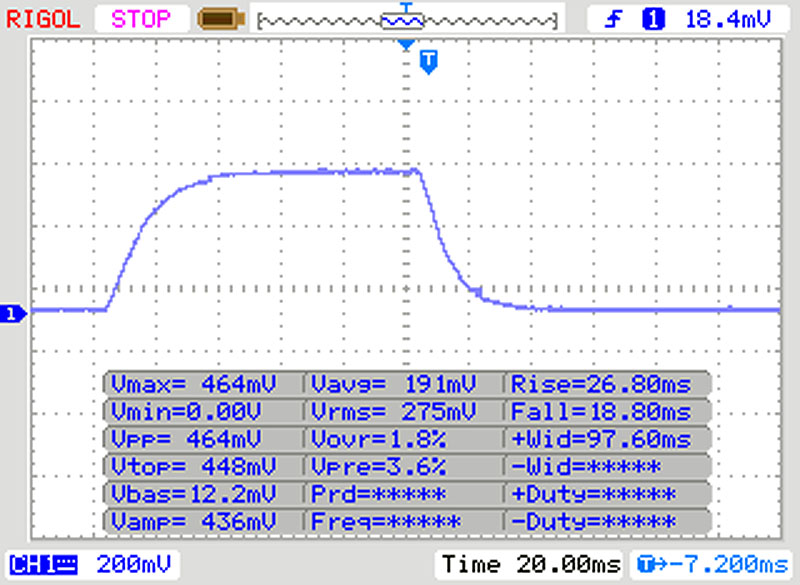 |
| ↘ 18 ms queda | ||
| A tela mostra taxas de resposta lentas em nossos testes e será insatisfatória para os jogadores. Em comparação, todos os dispositivos testados variam de 0.1 (mínimo) a 240 (máximo) ms. » 98 % de todos os dispositivos são melhores. Isso significa que o tempo de resposta medido é pior que a média de todos os dispositivos testados (19.8 ms). | ||
| ↔ Tempo de resposta 50% cinza a 80% cinza | ||
| 62 ms ... ascensão ↗ e queda ↘ combinadas | ↗ 32 ms ascensão | 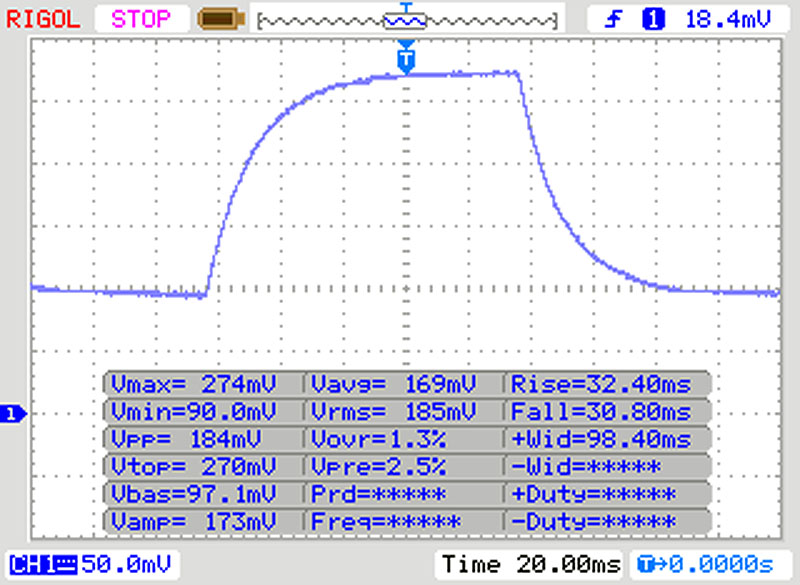 |
| ↘ 30 ms queda | ||
| A tela mostra taxas de resposta lentas em nossos testes e será insatisfatória para os jogadores. Em comparação, todos os dispositivos testados variam de 0.165 (mínimo) a 636 (máximo) ms. » 97 % de todos os dispositivos são melhores. Isso significa que o tempo de resposta medido é pior que a média de todos os dispositivos testados (31 ms). | ||
Cintilação da tela / PWM (modulação por largura de pulso)
| Tela tremeluzindo/PWM detectado | 25000 Hz | ≤ 20 % configuração de brilho | 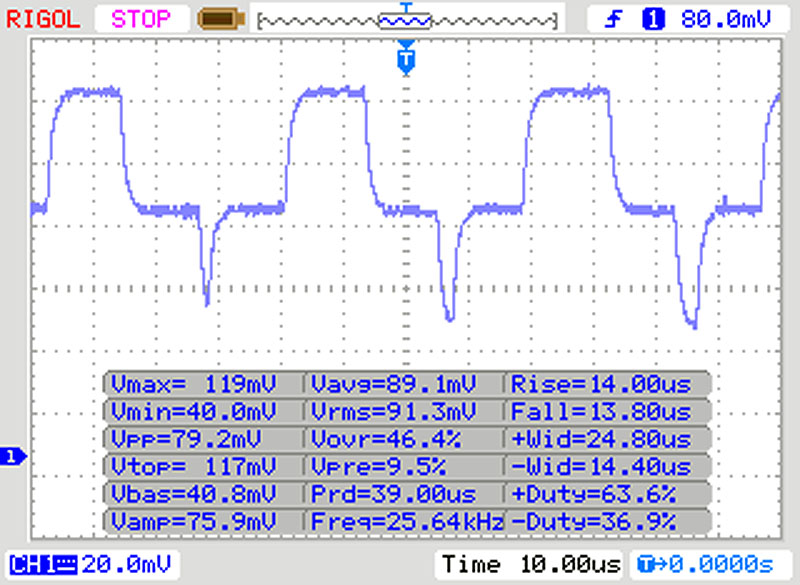 |
A luz de fundo da tela pisca em 25000 Hz (pior caso, por exemplo, utilizando PWM) Cintilação detectada em uma configuração de brilho de 20 % e abaixo. Não deve haver cintilação ou PWM acima desta configuração de brilho. A frequência de 25000 Hz é bastante alta, então a maioria dos usuários sensíveis ao PWM não deve notar nenhuma oscilação. [pwm_comparison] Em comparação: 52 % de todos os dispositivos testados não usam PWM para escurecer a tela. Se PWM foi detectado, uma média de 7750 (mínimo: 5 - máximo: 343500) Hz foi medida. | |||
Cinebench R15: CPU Single 64Bit | CPU Multi 64Bit
Blender: v2.79 BMW27 CPU
7-Zip 18.03: 7z b 4 -mmt1 | 7z b 4
Geekbench 5.5: Single-Core | Multi-Core
HWBOT x265 Benchmark v2.2: 4k Preset
LibreOffice : 20 Documents To PDF
R Benchmark 2.5: Overall mean
| Cinebench R20 / CPU (Single Core) | |
| Média da turma Multimedia (425 - 853, n=61, últimos 2 anos) | |
| Gigabyte Aero 15 OLED XB-8DE51B0SP | |
| Razer Blade 15 RTX 2070 Super Max-Q | |
| Média Intel Core i7-10875H (430 - 524, n=32) | |
| MSI Creator 15 | |
| MSI Creator 15 | |
| Asus Zephyrus S15 GX502L | |
| Cinebench R20 / CPU (Multi Core) | |
| Média da turma Multimedia (1887 - 12912, n=61, últimos 2 anos) | |
| MSI Creator 15 | |
| MSI Creator 15 | |
| Asus Zephyrus S15 GX502L | |
| Gigabyte Aero 15 OLED XB-8DE51B0SP | |
| Média Intel Core i7-10875H (1986 - 4176, n=32) | |
| Razer Blade 15 RTX 2070 Super Max-Q | |
| Cinebench R15 / CPU Single 64Bit | |
| Média da turma Multimedia (184.8 - 326, n=63, últimos 2 anos) | |
| Gigabyte Aero 15 OLED XB-8DE51B0SP | |
| Média Intel Core i7-10875H (190 - 220, n=37) | |
| Razer Blade 15 RTX 2070 Super Max-Q | |
| MSI Creator 15 | |
| MSI P65 Creator 9SF-657 | |
| Asus Zephyrus S15 GX502L | |
| Cinebench R15 / CPU Multi 64Bit | |
| Média da turma Multimedia (856 - 5224, n=65, últimos 2 anos) | |
| Gigabyte Aero 15 OLED XB-8DE51B0SP | |
| MSI Creator 15 | |
| Asus Zephyrus S15 GX502L | |
| Média Intel Core i7-10875H (1003 - 1833, n=38) | |
| MSI P65 Creator 9SF-657 | |
| Razer Blade 15 RTX 2070 Super Max-Q | |
| Blender / v2.79 BMW27 CPU | |
| MSI Creator 15 | |
| MSI Creator 15 | |
| Razer Blade 15 RTX 2070 Super Max-Q | |
| Média Intel Core i7-10875H (259 - 535, n=30) | |
| Gigabyte Aero 15 OLED XB-8DE51B0SP | |
| Asus Zephyrus S15 GX502L | |
| Média da turma Multimedia (100 - 557, n=62, últimos 2 anos) | |
| 7-Zip 18.03 / 7z b 4 -mmt1 | |
| Média da turma Multimedia (3666 - 7545, n=60, últimos 2 anos) | |
| Gigabyte Aero 15 OLED XB-8DE51B0SP | |
| Média Intel Core i7-10875H (5071 - 5780, n=31) | |
| Razer Blade 15 RTX 2070 Super Max-Q | |
| MSI Creator 15 | |
| MSI Creator 15 | |
| Asus Zephyrus S15 GX502L | |
| 7-Zip 18.03 / 7z b 4 | |
| Média da turma Multimedia (26062 - 130368, n=59, últimos 2 anos) | |
| Asus Zephyrus S15 GX502L | |
| MSI Creator 15 | |
| MSI Creator 15 | |
| Gigabyte Aero 15 OLED XB-8DE51B0SP | |
| Média Intel Core i7-10875H (29844 - 49562, n=31) | |
| Razer Blade 15 RTX 2070 Super Max-Q | |
| Geekbench 5.5 / Single-Core | |
| Média da turma Multimedia (805 - 2974, n=60, últimos 2 anos) | |
| Gigabyte Aero 15 OLED XB-8DE51B0SP | |
| Média Intel Core i7-10875H (1233 - 1371, n=29) | |
| Razer Blade 15 RTX 2070 Super Max-Q | |
| MSI Creator 15 | |
| Asus Zephyrus S15 GX502L | |
| Geekbench 5.5 / Multi-Core | |
| Média da turma Multimedia (4652 - 20422, n=60, últimos 2 anos) | |
| Gigabyte Aero 15 OLED XB-8DE51B0SP | |
| MSI Creator 15 | |
| Média Intel Core i7-10875H (5715 - 8620, n=29) | |
| Asus Zephyrus S15 GX502L | |
| Razer Blade 15 RTX 2070 Super Max-Q | |
| HWBOT x265 Benchmark v2.2 / 4k Preset | |
| Média da turma Multimedia (5.26 - 36.1, n=60, últimos 2 anos) | |
| Asus Zephyrus S15 GX502L | |
| Gigabyte Aero 15 OLED XB-8DE51B0SP | |
| Média Intel Core i7-10875H (7.27 - 14.1, n=27) | |
| Razer Blade 15 RTX 2070 Super Max-Q | |
| LibreOffice / 20 Documents To PDF | |
| Gigabyte Aero 15 OLED XB-8DE51B0SP | |
| MSI Creator 15 | |
| MSI Creator 15 | |
| Média Intel Core i7-10875H (30.2 - 84.3, n=30) | |
| Média da turma Multimedia (23.9 - 146.7, n=61, últimos 2 anos) | |
| Asus Zephyrus S15 GX502L | |
| Razer Blade 15 RTX 2070 Super Max-Q | |
| R Benchmark 2.5 / Overall mean | |
| MSI Creator 15 | |
| MSI Creator 15 | |
| Asus Zephyrus S15 GX502L | |
| Razer Blade 15 RTX 2070 Super Max-Q | |
| Média Intel Core i7-10875H (0.546 - 0.662, n=29) | |
| Gigabyte Aero 15 OLED XB-8DE51B0SP | |
| Média da turma Multimedia (0.3604 - 0.947, n=60, últimos 2 anos) | |
* ... menor é melhor
| PCMark 10 Score | 6514 pontos | |
Ajuda | ||
| DPC Latencies / LatencyMon - interrupt to process latency (max), Web, Youtube, Prime95 | |
| Asus Zephyrus S15 GX502L | |
| Gigabyte Aero 15 OLED XB-8DE51B0SP | |
| Razer Blade 15 RTX 2070 Super Max-Q | |
| MSI Creator 15 | |
* ... menor é melhor
| MSI Creator 15 2x WDC PC SN730 SDBPNTY-1T00 (RAID 0) | MSI P65 Creator 9SF-657 2x Samsung SSD PM981 MZVLB512HAJQ (RAID 0) | Gigabyte Aero 15 OLED XB-8DE51B0SP Intel Optane Memory H10 with Solid State Storage 32GB + 512GB HBRPEKNX0202A(L/H) | Razer Blade 15 RTX 2070 Super Max-Q Samsung SSD PM981a MZVLB512HBJQ | Asus Zephyrus S15 GX502L WDC PC SN730 SDBPNTY-1T00 | Média 2x WDC PC SN730 SDBPNTY-1T00 (RAID 0) | |
|---|---|---|---|---|---|---|
| CrystalDiskMark 5.2 / 6 | 10% | 4% | 2% | -8% | 10% | |
| Write 4K (MB/s) | 134.4 | 105.6 -21% | 127.4 -5% | 139.8 4% | 127.4 -5% | 136.7 ? 2% |
| Read 4K (MB/s) | 45.7 | 46.32 1% | 147.5 223% | 48.62 6% | 46.38 1% | 47.2 ? 3% |
| Write Seq (MB/s) | 2480 | 2910 17% | 485.9 -80% | 2260 -9% | 2034 -18% | 2841 ? 15% |
| Read Seq (MB/s) | 2583 | 2820 9% | 1352 -48% | 2135 -17% | 2172 -16% | 2626 ? 2% |
| Write 4K Q32T1 (MB/s) | 351.8 | 545 55% | 476.5 35% | 499.3 42% | 413.7 18% | 404 ? 15% |
| Read 4K Q32T1 (MB/s) | 526 | 632 20% | 531 1% | 552 5% | 354 -33% | 513 ? -2% |
| Write Seq Q32T1 (MB/s) | 3227 | 3349 4% | 1061 -67% | 2960 -8% | 3063 -5% | 3640 ? 13% |
| Read Seq Q32T1 (MB/s) | 3491 | 3333 -5% | 2552 -27% | 3269 -6% | 3396 -3% | 4598 ? 32% |
| AS SSD | 2% | -35% | -13% | 12% | -5% | |
| Seq Read (MB/s) | 3015 | 2860 -5% | 1200 -60% | 1957 -35% | 2714 -10% | 3466 ? 15% |
| Seq Write (MB/s) | 2742 | 2604 -5% | 836 -70% | 2092 -24% | 928 -66% | 2556 ? -7% |
| 4K Read (MB/s) | 43.22 | 45.15 4% | 65.8 52% | 50.2 16% | 42.83 -1% | 42.7 ? -1% |
| 4K Write (MB/s) | 122.9 | 100.2 -18% | 103.8 -16% | 96.5 -21% | 120.5 -2% | 126.2 ? 3% |
| 4K-64 Read (MB/s) | 1420 | 1428 1% | 789 -44% | 1594 12% | 978 -31% | 1402 ? -1% |
| 4K-64 Write (MB/s) | 1113 | 1401 26% | 929 -17% | 2005 80% | 2797 151% | 1307 ? 17% |
| Access Time Read * (ms) | 0.056 | 0.049 12% | 0.103 -84% | 0.057 -2% | 0.057 -2% | 0.04533 ? 19% |
| Access Time Write * (ms) | 0.032 | 0.037 -16% | 0.045 -41% | 0.112 -250% | 0.032 -0% | 0.06933 ? -117% |
| Score Read (Points) | 1765 | 1759 0% | 975 -45% | 1840 4% | 1292 -27% | 1791 ? 1% |
| Score Write (Points) | 1510 | 1762 17% | 1117 -26% | 2310 53% | 3011 99% | 1689 ? 12% |
| Score Total (Points) | 4166 | 4411 6% | 2594 -38% | 5103 22% | 4881 17% | 4351 ? 4% |
| Copy ISO MB/s (MB/s) | 1793 | 2307 ? | ||||
| Copy Program MB/s (MB/s) | 573 | 875 ? | ||||
| Copy Game MB/s (MB/s) | 1418 | 1795 ? | ||||
| Média Total (Programa/Configurações) | 6% /
5% | -16% /
-19% | -6% /
-7% | 2% /
4% | 3% /
1% |
* ... menor é melhor

Dauerleistung Lesen: DiskSpd Read Loop, Queue Depth 8
| 3DMark 11 Performance | 20251 pontos | |
| 3DMark Cloud Gate Standard Score | 45260 pontos | |
| 3DMark Fire Strike Score | 15264 pontos | |
Ajuda | ||
| The Witcher 3 - 1920x1080 Ultra Graphics & Postprocessing (HBAO+) | |
| MSI P65 Creator 9SF-657 | |
| Gigabyte Aero 15 OLED XB-8DE51B0SP | |
| Asus Zephyrus S15 GX502L | |
| Razer Blade 15 RTX 2070 Super Max-Q | |
| Média NVIDIA GeForce RTX 2070 Max-Q (56 - 83.8, n=31) | |
| MSI Creator 15 | |
| Média da turma Multimedia (11 - 121, n=11, últimos 2 anos) | |
| Final Fantasy XV Benchmark | |
| 3840x2160 High Quality | |
| Média da turma Multimedia (42 - 83.4, n=4, últimos 2 anos) | |
| MSI Creator 15 | |
| Média NVIDIA GeForce RTX 2070 Max-Q (23.3 - 27, n=2) | |
| 1920x1080 High Quality | |
| Razer Blade 15 RTX 2070 Super Max-Q | |
| Asus Zephyrus S15 GX502L | |
| MSI Creator 15 | |
| Média NVIDIA GeForce RTX 2070 Max-Q (55.1 - 62.9, n=3) | |
| Média da turma Multimedia (7.61 - 144.4, n=62, últimos 2 anos) | |
| Far Cry 5 | |
| 3840x2160 Ultra Preset AA:T | |
| Média da turma Multimedia (54 - 59, n=2, últimos 2 anos) | |
| Média NVIDIA GeForce RTX 2070 Max-Q (30 - 37, n=3) | |
| MSI Creator 15 | |
| 2560x1440 Ultra Preset AA:T | |
| Média da turma Multimedia (45 - 106, n=4, últimos 2 anos) | |
| MSI Creator 15 | |
| Média NVIDIA GeForce RTX 2070 Max-Q (60 - 68, n=3) | |
| 1920x1080 Ultra Preset AA:T | |
| Asus Zephyrus S15 GX502L | |
| Média NVIDIA GeForce RTX 2070 Max-Q (67 - 101, n=7) | |
| Média da turma Multimedia (17 - 145, n=20, últimos 2 anos) | |
| baixo | média | alto | ultra | QHD | 4K | |
|---|---|---|---|---|---|---|
| The Witcher 3 (2015) | 56 | |||||
| Dota 2 Reborn (2015) | 153 | 136 | 132 | 123 | 94.8 | |
| Final Fantasy XV Benchmark (2018) | 61 | 27 | ||||
| Far Cry 5 (2018) | 66 | 33 | ||||
| Doom Eternal (2020) | 54.8 |
Barulho
| Ocioso |
| 30.4 / 30.4 / 30.7 dB |
| Carga |
| 45.5 / 49.1 dB |
 | ||
30 dB silencioso 40 dB(A) audível 50 dB(A) ruidosamente alto |
||
min: | ||
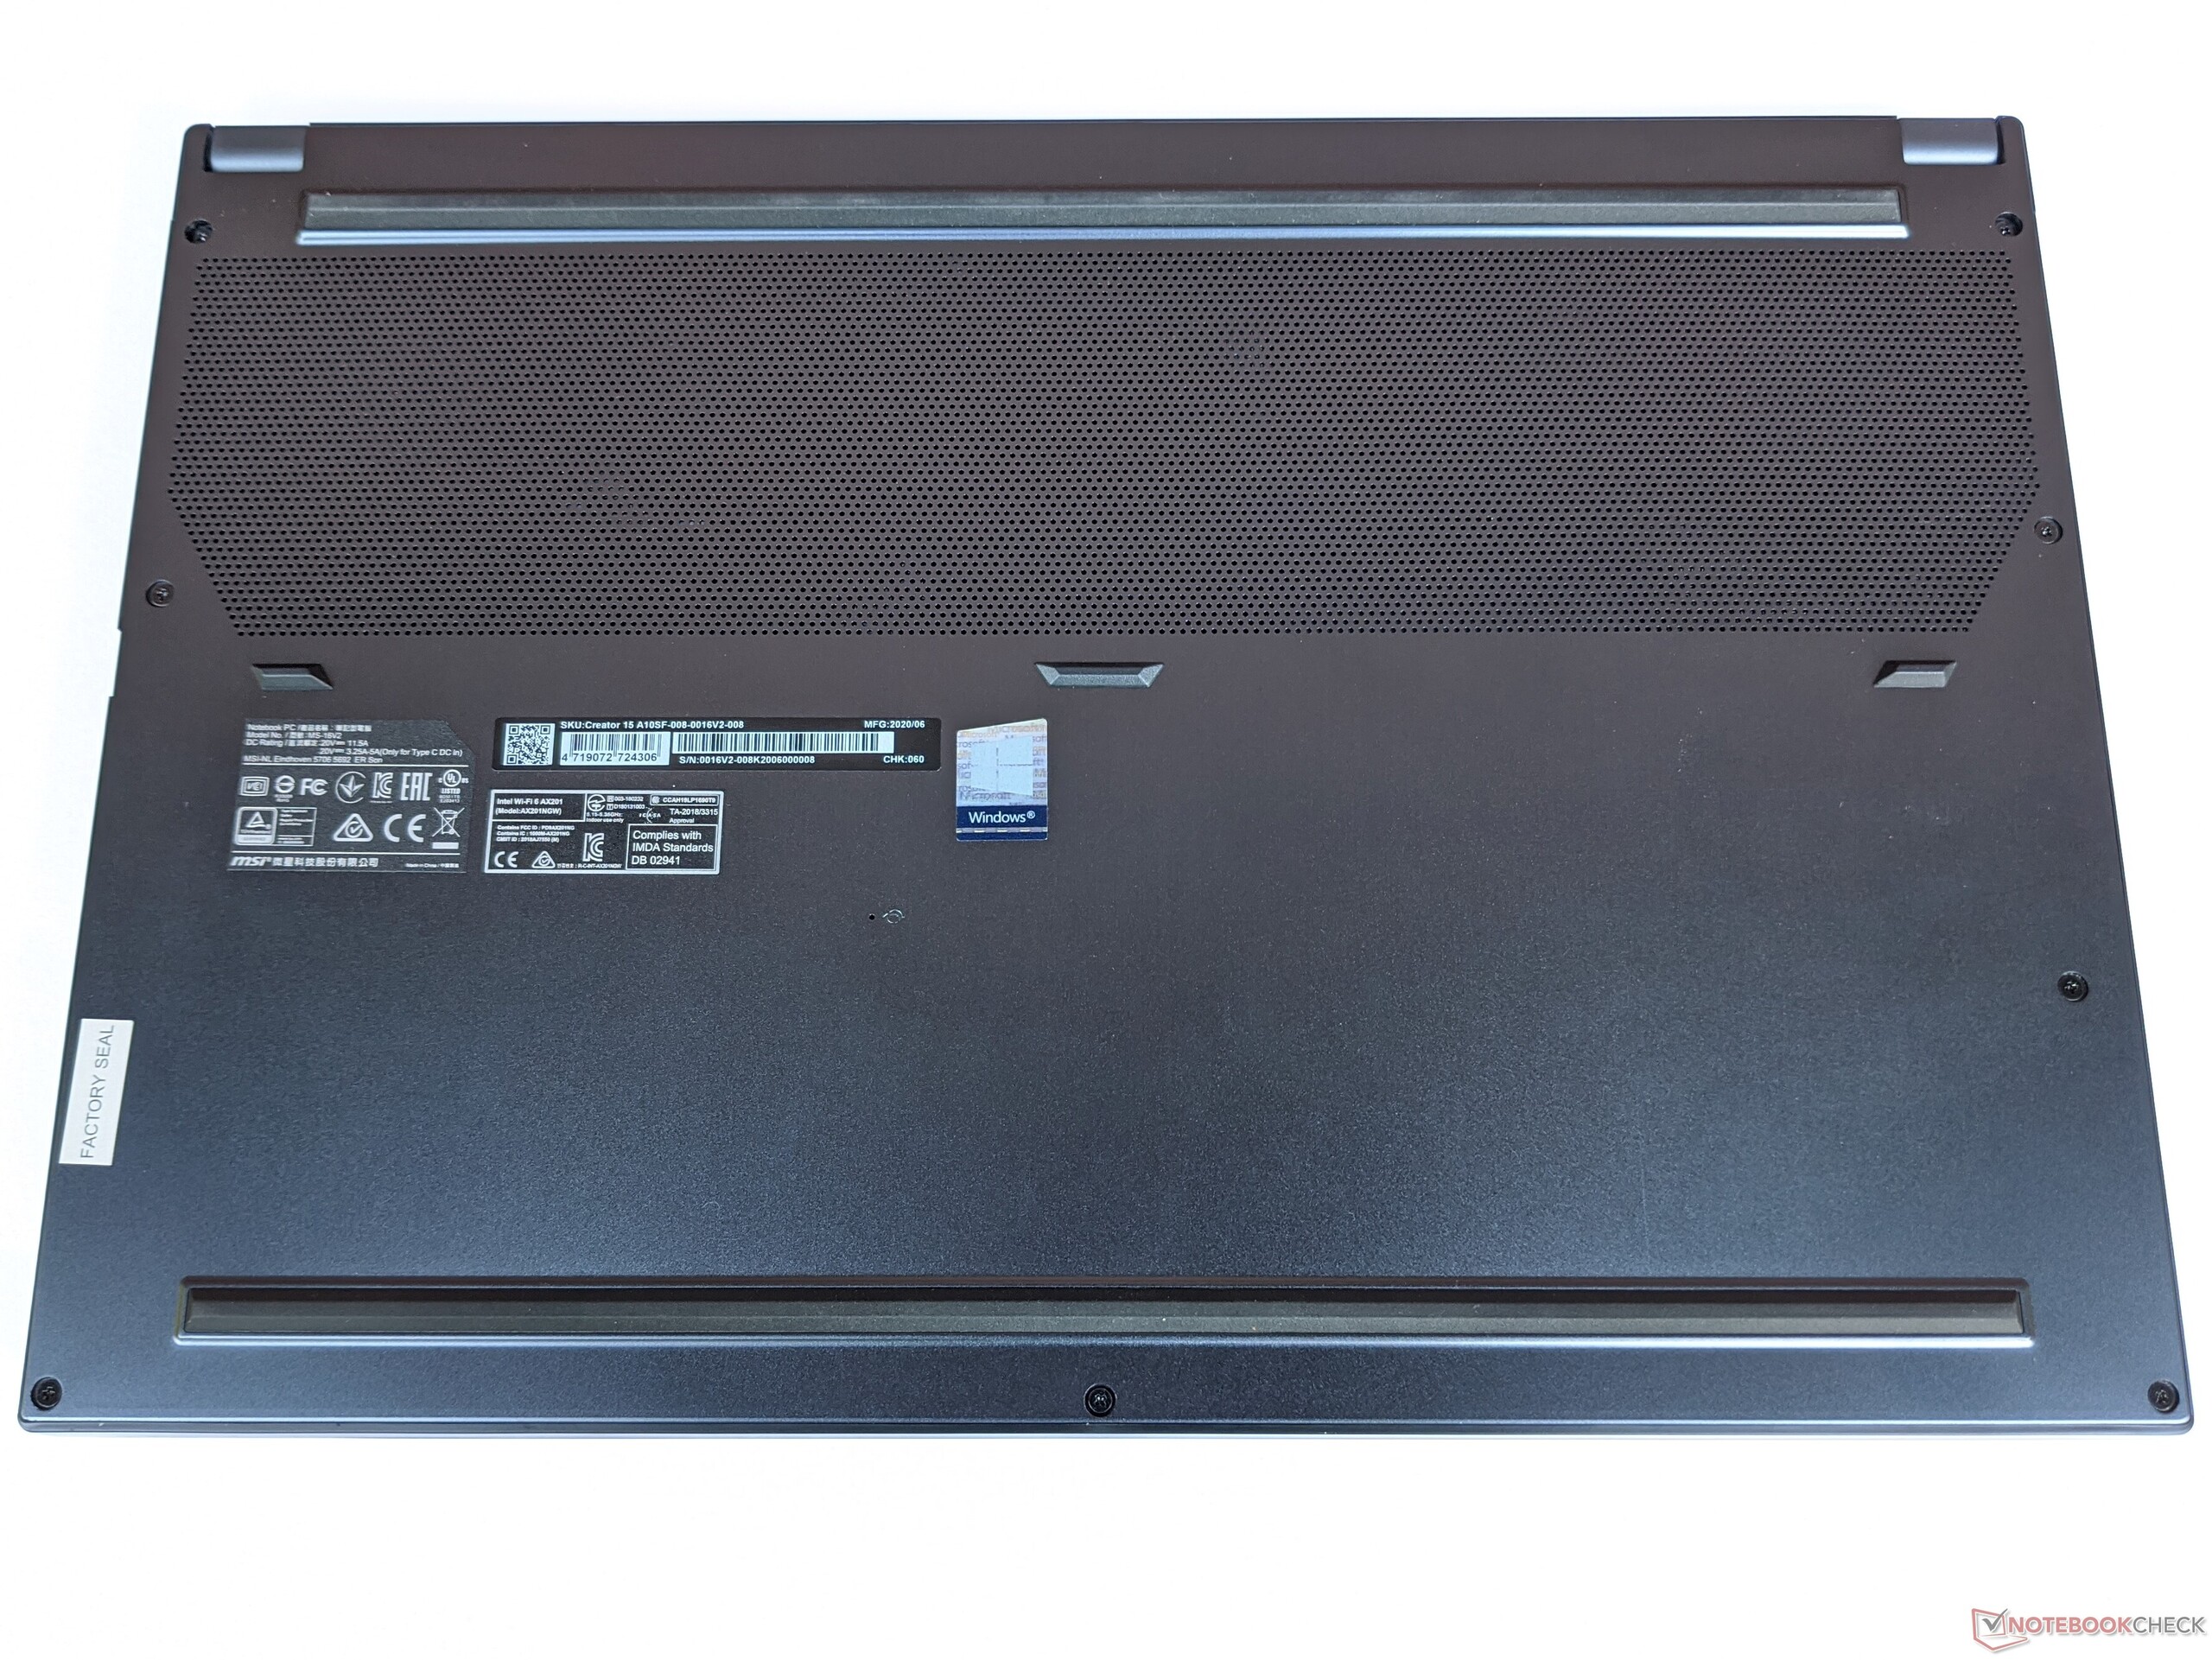
(-) A temperatura máxima no lado superior é 49 °C / 120 F, em comparação com a média de 36.8 °C / 98 F , variando de 21 a 71 °C para a classe Multimedia.
(-) A parte inferior aquece até um máximo de 46.9 °C / 116 F, em comparação com a média de 39.1 °C / 102 F
(+) Em uso inativo, a temperatura média para o lado superior é 31 °C / 88 F, em comparação com a média do dispositivo de 31.3 °C / ### class_avg_f### F.
(±) Jogando The Witcher 3, a temperatura média para o lado superior é 33.7 °C / 93 F, em comparação com a média do dispositivo de 31.3 °C / ## #class_avg_f### F.
(+) Os apoios para as mãos e o touchpad são mais frios que a temperatura da pele, com um máximo de 30.3 °C / 86.5 F e, portanto, são frios ao toque.
(±) A temperatura média da área do apoio para as mãos de dispositivos semelhantes foi 28.7 °C / 83.7 F (-1.6 °C / -2.8 F).
MSI Creator 15 análise de áudio
(±) | o volume do alto-falante é médio, mas bom (###valor### dB)
Graves 100 - 315Hz
(-) | quase nenhum baixo - em média 29.7% menor que a mediana
(±) | a linearidade dos graves é média (11.1% delta para a frequência anterior)
Médios 400 - 2.000 Hz
(±) | médios mais altos - em média 8.9% maior que a mediana
(±) | a linearidade dos médios é média (8.2% delta para frequência anterior)
Altos 2 - 16 kHz
(+) | agudos equilibrados - apenas 2.4% longe da mediana
(±) | a linearidade dos máximos é média (7.7% delta para frequência anterior)
Geral 100 - 16.000 Hz
(±) | a linearidade do som geral é média (24% diferença em relação à mediana)
Comparado com a mesma classe
» 85% de todos os dispositivos testados nesta classe foram melhores, 6% semelhantes, 10% piores
» O melhor teve um delta de 5%, a média foi 17%, o pior foi 45%
Comparado com todos os dispositivos testados
» 72% de todos os dispositivos testados foram melhores, 6% semelhantes, 22% piores
» O melhor teve um delta de 4%, a média foi 23%, o pior foi 134%
Apple MacBook 12 (Early 2016) 1.1 GHz análise de áudio
(+) | os alto-falantes podem tocar relativamente alto (###valor### dB)
Graves 100 - 315Hz
(±) | graves reduzidos - em média 11.3% menor que a mediana
(±) | a linearidade dos graves é média (14.2% delta para a frequência anterior)
Médios 400 - 2.000 Hz
(+) | médios equilibrados - apenas 2.4% longe da mediana
(+) | médios são lineares (5.5% delta para frequência anterior)
Altos 2 - 16 kHz
(+) | agudos equilibrados - apenas 2% longe da mediana
(+) | os máximos são lineares (4.5% delta da frequência anterior)
Geral 100 - 16.000 Hz
(+) | o som geral é linear (10.2% diferença em relação à mediana)
Comparado com a mesma classe
» 7% de todos os dispositivos testados nesta classe foram melhores, 2% semelhantes, 91% piores
» O melhor teve um delta de 5%, a média foi 18%, o pior foi 53%
Comparado com todos os dispositivos testados
» 5% de todos os dispositivos testados foram melhores, 1% semelhantes, 94% piores
» O melhor teve um delta de 4%, a média foi 23%, o pior foi 134%
| desligado | |
| Ocioso | |
| Carga |
|
Key:
min: | |
| MSI Creator 15 i7-10875H, GeForce RTX 2070 Max-Q, 2x WDC PC SN730 SDBPNTY-1T00 (RAID 0), IPS, 3840x2160, 15.6" | MSI P65 Creator 9SF-657 i9-9880H, GeForce RTX 2070 Max-Q, 2x Samsung SSD PM981 MZVLB512HAJQ (RAID 0), IPS, 3840x2160, 15.6" | Gigabyte Aero 15 OLED XB-8DE51B0SP i7-10875H, GeForce RTX 2070 Super Max-Q, Intel Optane Memory H10 with Solid State Storage 32GB + 512GB HBRPEKNX0202A(L/H), OLED, 3840x2160, 15.6" | Razer Blade 15 RTX 2070 Super Max-Q i7-10875H, GeForce RTX 2070 Super Max-Q, Samsung SSD PM981a MZVLB512HBJQ, IPS, 1920x1080, 15.6" | Asus Zephyrus S15 GX502L i7-10875H, GeForce RTX 2070 Super Mobile, WDC PC SN730 SDBPNTY-1T00, IPS, 1920x1080, 15.6" | Média NVIDIA GeForce RTX 2070 Max-Q | Média da turma Multimedia | |
|---|---|---|---|---|---|---|---|
| Power Consumption | 22% | -8% | -4% | 9% | 9% | 54% | |
| Idle Minimum * (Watt) | 18.7 | 9.4 50% | 18 4% | 14.3 24% | 7 63% | 15.4 ? 18% | 5.67 ? 70% |
| Idle Average * (Watt) | 24.9 | 17.4 30% | 21 16% | 22.3 10% | 13 48% | 20 ? 20% | 10.1 ? 59% |
| Idle Maximum * (Watt) | 27 | 19.6 27% | 38 -41% | 36.9 -37% | 25 7% | 26.7 ? 1% | 12.3 ? 54% |
| Load Average * (Watt) | 109 | 103 6% | 113 -4% | 118.4 -9% | 148 -36% | 105.2 ? 3% | 65.6 ? 40% |
| Witcher 3 ultra * (Watt) | 147 | 149 -1% | 153.7 -5% | 175 -19% | |||
| Load Maximum * (Watt) | 209 | 216 -3% | 256 -22% | 220.8 -6% | 232 -11% | 201 ? 4% | 113.2 ? 46% |
* ... menor é melhor
| MSI Creator 15 i7-10875H, GeForce RTX 2070 Max-Q, 99.99 Wh | MSI P65 Creator 9SF-657 i9-9880H, GeForce RTX 2070 Max-Q, 82 Wh | Gigabyte Aero 15 OLED XB-8DE51B0SP i7-10875H, GeForce RTX 2070 Super Max-Q, 94.2 Wh | Razer Blade 15 RTX 2070 Super Max-Q i7-10875H, GeForce RTX 2070 Super Max-Q, 80 Wh | Asus Zephyrus S15 GX502L i7-10875H, GeForce RTX 2070 Super Mobile, 76 Wh | Média da turma Multimedia | |
|---|---|---|---|---|---|---|
| Duração da bateria | 41% | 66% | 62% | 16% | 217% | |
| Reader / Idle (h) | 4.6 | 9.6 109% | 8.6 87% | 8.7 89% | 25.2 ? 448% | |
| WiFi v1.3 (h) | 3.9 | 6 54% | 6.1 56% | 6.3 62% | 3 -23% | 12.1 ? 210% |
| Load (h) | 1.8 | 1.1 -39% | 2.8 56% | 1.5 -17% | 1.654 ? -8% |
Pro
Contra
Veredicto - Manutenção do modelo
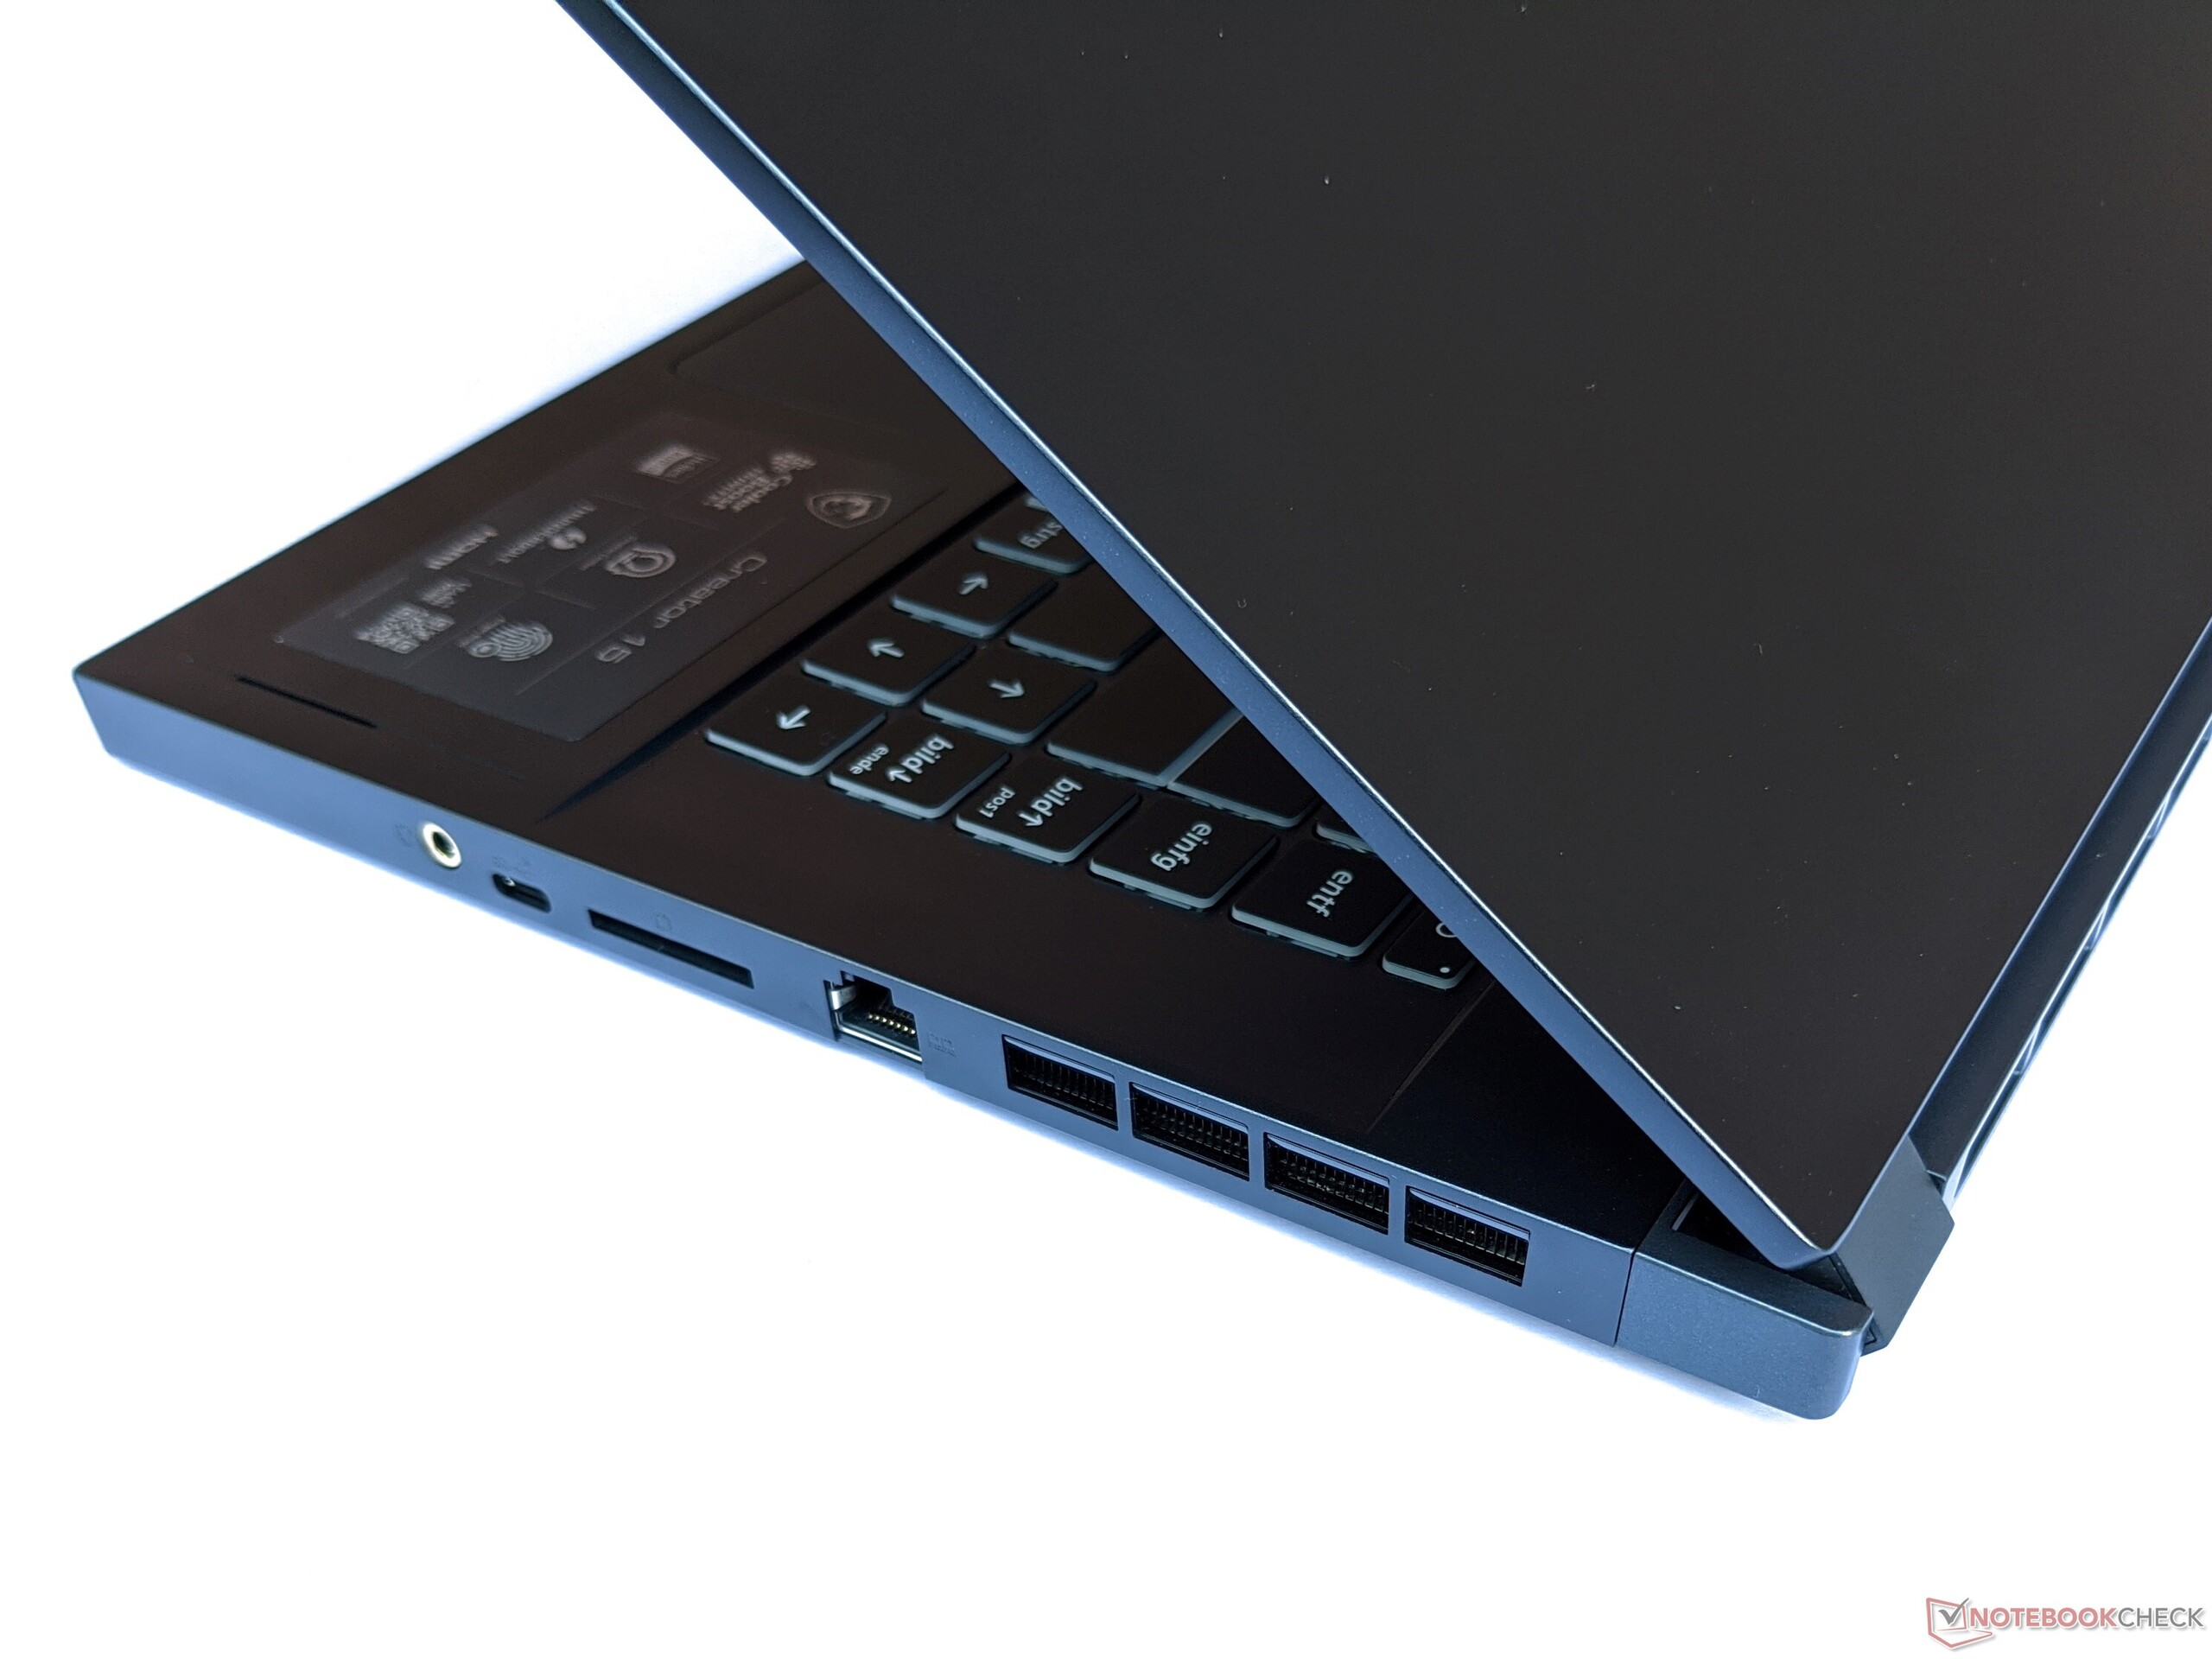
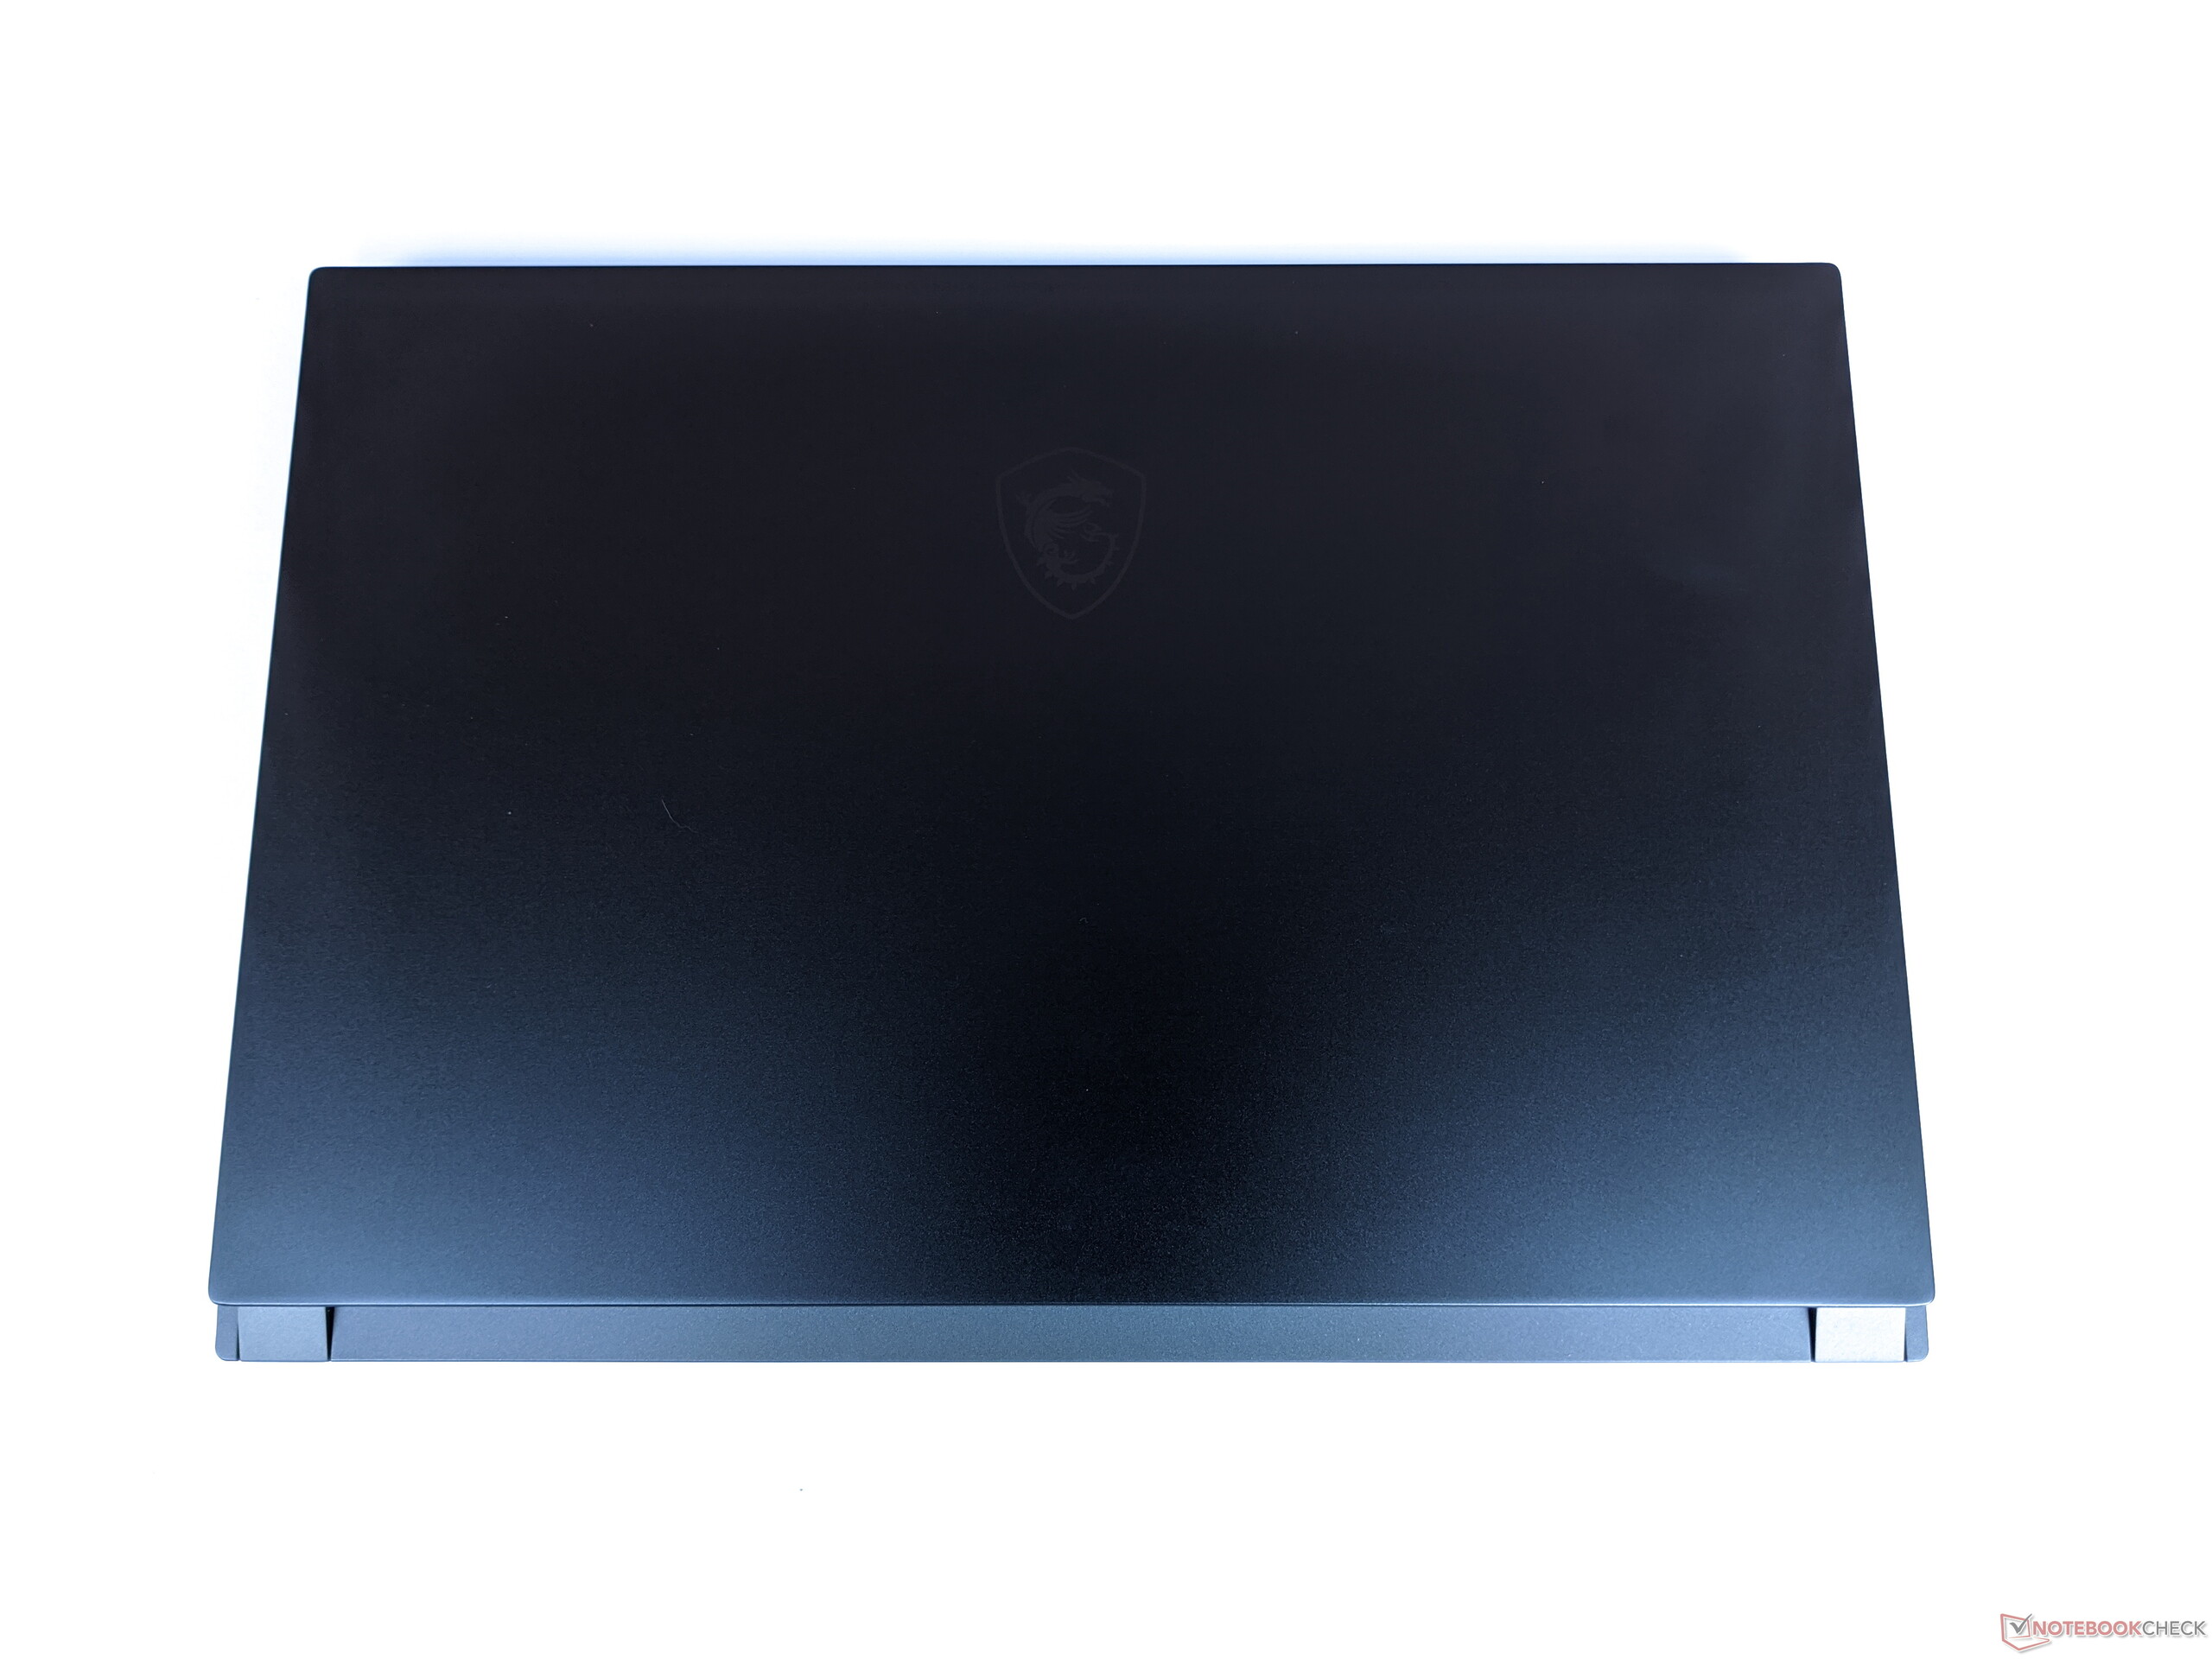
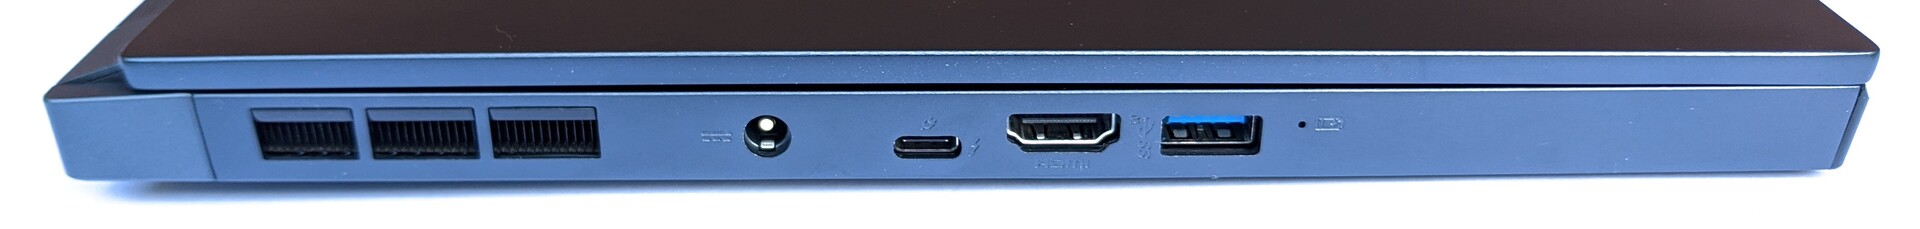
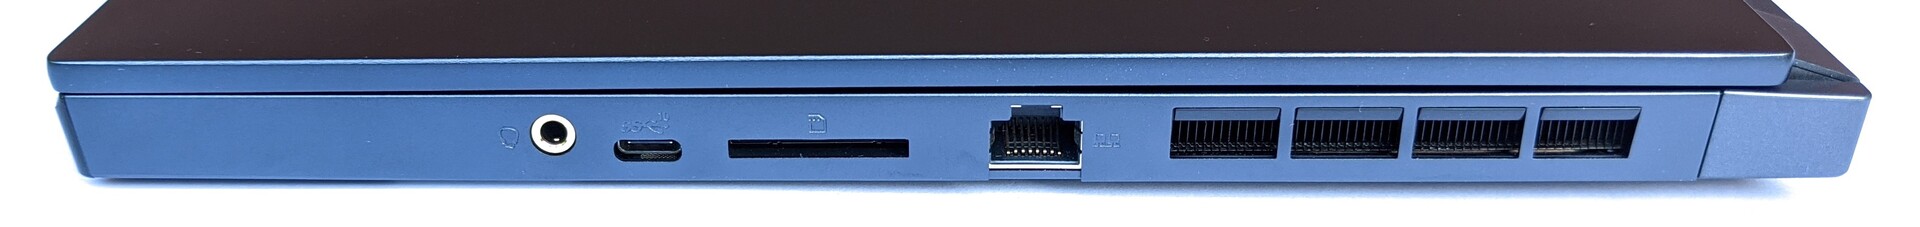
O design compacto e a tela de alta resolução são os dois destaques do MSI Creator 15. Combinado com os dispositivos de entrada, isso o torna um dispositivo muito favorável à produtividade que também pode ser carregado com você. A seleção de portas contém todas as portas básicas e pode ser expandida sem limites graças ao seu conector Thunderbolt 3. Os vários modos de desempenho e espaços de cores mutáveis também permitem outras aplicações.
O MSI Creator 15 oferece um painel UHD muito bom, mas desempenho apenas médio.
O hardware é bom e garante um bom desempenho do sistema. Comparado com a concorrência, mas também com o MSI P65 Creator 9SF do próprio fabricante, por exemplo, o resultados dos testes estão na gama média alta. A duração da bateria poderia ser melhor, o que provavelmente é causado pelo painel UHD, que possui um alto consumo de energia. Os usuários que procuram uma tela excelente em um portátil compacto de 15 polegadas ainda podem achar que o MSI Creator 15 é a escolha certa para eles.
MSI Creator 15
- 10/18/2020 v7 (old)
Mike Wobker
Price comparison
