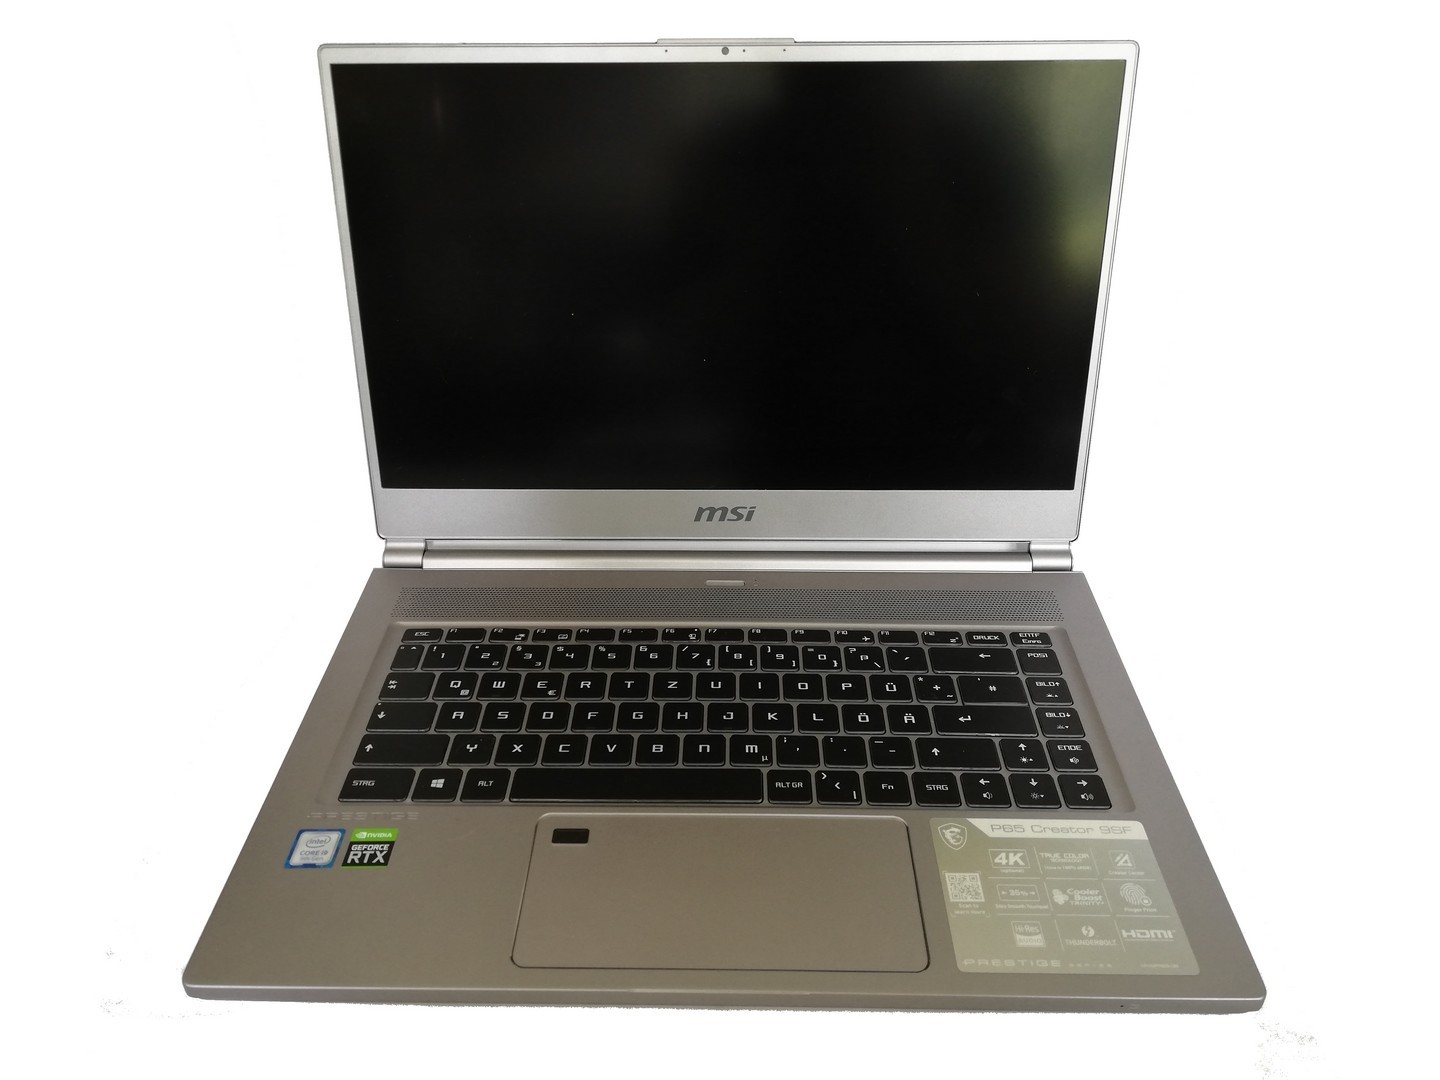
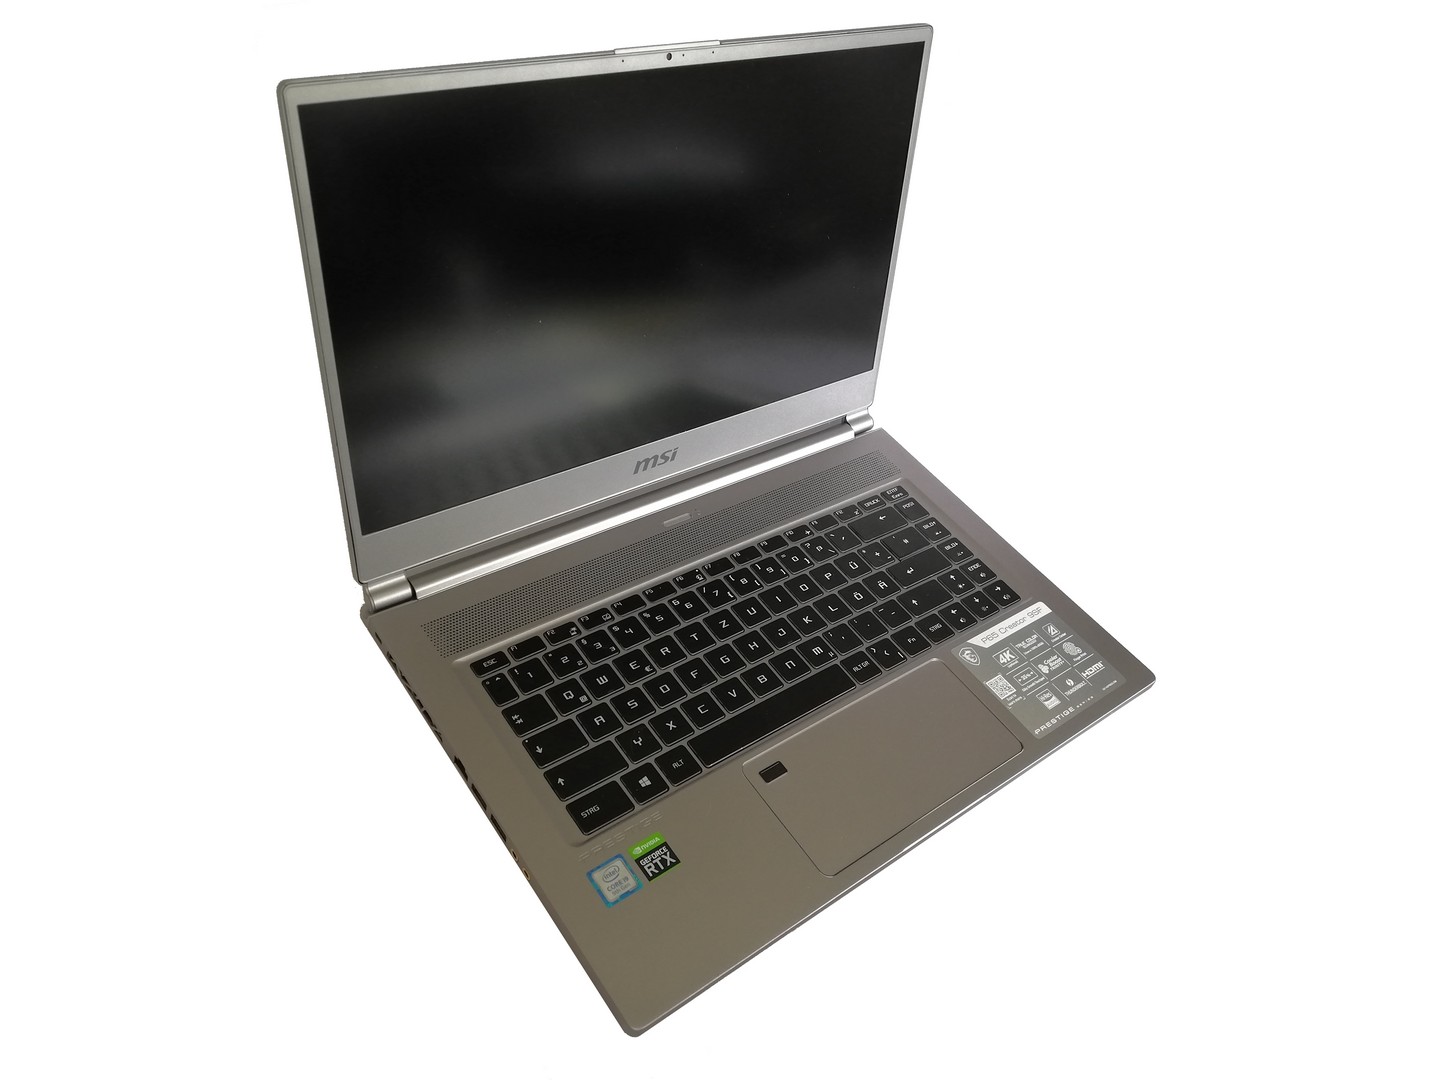
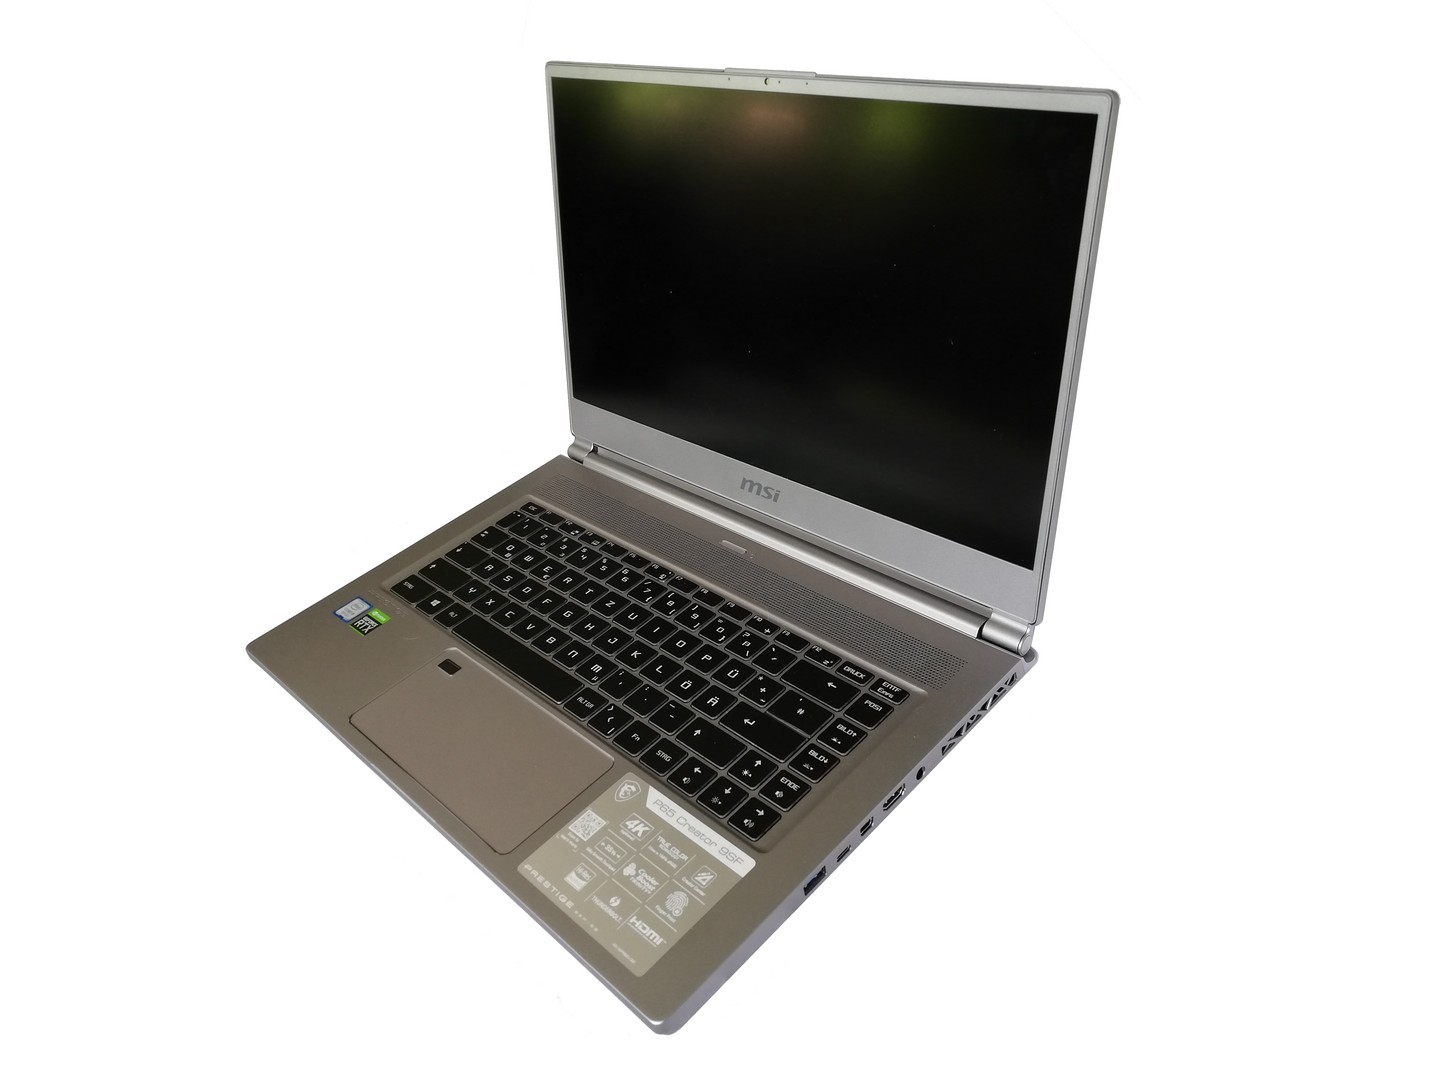
Breve Análise do Portátil MSI P65 Creator 9SF (i9-9880H, RTX2070 Max-Q)
| |||||||||||||||||||||||||
iluminação: 83 %
iluminação com acumulador: 476 cd/m²
Contraste: 890:1 (Preto: 0.5 cd/m²)
ΔE ColorChecker Calman: 4.75 | ∀{0.5-29.43 Ø4.73}
ΔE Greyscale Calman: 4.49 | ∀{0.09-98 Ø4.97}
100% sRGB (Argyll 1.6.3 3D)
87% AdobeRGB 1998 (Argyll 1.6.3 3D)
98.5% AdobeRGB 1998 (Argyll 3D)
100% sRGB (Argyll 3D)
84.4% Display P3 (Argyll 3D)
Gamma: 2.49
CCT: 7374 K
| MSI P65 Creator 9SF-657 AU Optronics AUO41EB, , 3840x2160, 15.6" | Razer Blade 15 RTX 2070 Max-Q LG Philips LGD05C0, , 1920x1080, 15.6" | Asus Zephyrus S GX502GW AU Optronics B156HAN08.2 (AUO82ED), , 1920x1080, 15.6" | Schenker XMG Ultra 15 Turing AU Optronics B156HAN07.0 (AUO70ED), , 1920x1080, 15.6" | Gigabyte Aero 15-X9 LGD05C0, , 1920x1080, 15.6" | |
|---|---|---|---|---|---|
| Display | -20% | -22% | -20% | -22% | |
| Display P3 Coverage (%) | 84.4 | 65.3 -23% | 64.9 -23% | 66.1 -22% | 63.5 -25% |
| sRGB Coverage (%) | 100 | 94.9 -5% | 91 -9% | 92.6 -7% | 93.1 -7% |
| AdobeRGB 1998 Coverage (%) | 98.5 | 66.3 -33% | 65.9 -33% | 67.1 -32% | 64.5 -35% |
| Response Times | 65% | 79% | 62% | 62% | |
| Response Time Grey 50% / Grey 80% * (ms) | 51 ? | 16.8 ? 67% | 7.2 ? 86% | 17.6 ? 65% | 16.4 ? 68% |
| Response Time Black / White * (ms) | 31 ? | 11.6 ? 63% | 8.8 ? 72% | 12.8 ? 59% | 13.6 ? 56% |
| PWM Frequency (Hz) | |||||
| Screen | 4% | 5% | 2% | 12% | |
| Brightness middle (cd/m²) | 445 | 314.7 -29% | 286 -36% | 263 -41% | 250 -44% |
| Brightness (cd/m²) | 462 | 312 -32% | 275 -40% | 264 -43% | 235 -49% |
| Brightness Distribution (%) | 83 | 90 8% | 90 8% | 89 7% | 85 2% |
| Black Level * (cd/m²) | 0.5 | 0.38 24% | 0.37 26% | 0.17 66% | 0.29 42% |
| Contrast (:1) | 890 | 828 -7% | 773 -13% | 1547 74% | 862 -3% |
| Colorchecker dE 2000 * | 4.75 | 2.56 46% | 2.19 54% | 4.45 6% | 1.46 69% |
| Colorchecker dE 2000 max. * | 7.79 | 4.89 37% | 4.4 44% | 8.33 -7% | 2.47 68% |
| Greyscale dE 2000 * | 4.49 | 3.4 24% | 2.2 51% | 4.77 -6% | 1.27 72% |
| Gamma | 2.49 88% | 2.3 96% | 2.41 91% | 2.52 87% | 2.4 92% |
| CCT | 7374 88% | 6435 101% | 6405 101% | 7767 84% | 6749 96% |
| Color Space (Percent of AdobeRGB 1998) (%) | 87 | 60.7 -30% | 59 -32% | 60 -31% | 60 -31% |
| Color Space (Percent of sRGB) (%) | 100 | 94.6 -5% | 91 -9% | 93 -7% | 93 -7% |
| Colorchecker dE 2000 calibrated * | 1.71 | 2.27 | 1.93 | ||
| Média Total (Programa/Configurações) | 16% /
7% | 21% /
10% | 15% /
5% | 17% /
12% |
* ... menor é melhor
Exibir tempos de resposta
| ↔ Tempo de resposta preto para branco | ||
|---|---|---|
| 31 ms ... ascensão ↗ e queda ↘ combinadas | ↗ 18 ms ascensão | 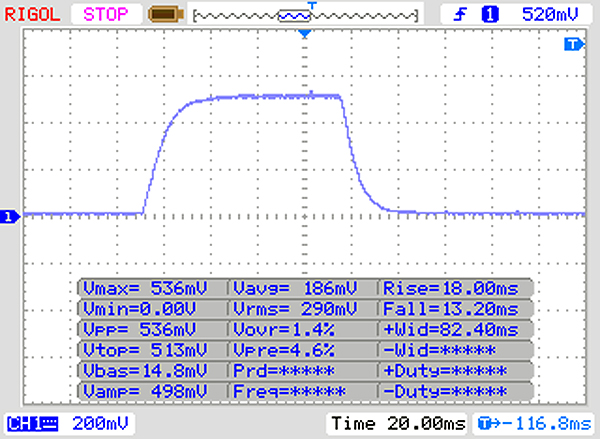 |
| ↘ 13 ms queda | ||
| A tela mostra taxas de resposta lentas em nossos testes e será insatisfatória para os jogadores. Em comparação, todos os dispositivos testados variam de 0.1 (mínimo) a 240 (máximo) ms. » 84 % de todos os dispositivos são melhores. Isso significa que o tempo de resposta medido é pior que a média de todos os dispositivos testados (19.9 ms). | ||
| ↔ Tempo de resposta 50% cinza a 80% cinza | ||
| 51 ms ... ascensão ↗ e queda ↘ combinadas | ↗ 24 ms ascensão | 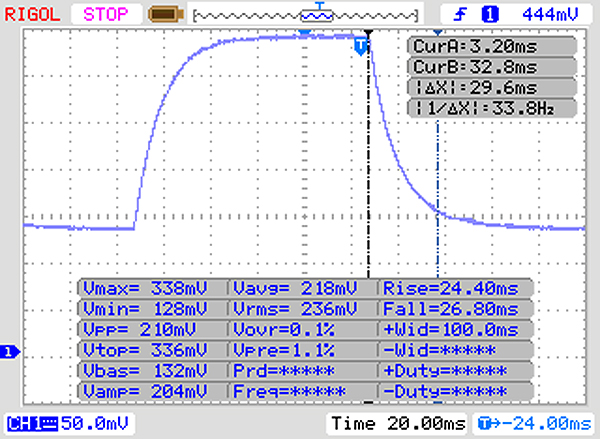 |
| ↘ 27 ms queda | ||
| A tela mostra taxas de resposta lentas em nossos testes e será insatisfatória para os jogadores. Em comparação, todos os dispositivos testados variam de 0.165 (mínimo) a 636 (máximo) ms. » 87 % de todos os dispositivos são melhores. Isso significa que o tempo de resposta medido é pior que a média de todos os dispositivos testados (31.1 ms). | ||
Cintilação da tela / PWM (modulação por largura de pulso)
| Tela tremeluzindo / PWM não detectado |  | ||
[pwm_comparison] Em comparação: 52 % de todos os dispositivos testados não usam PWM para escurecer a tela. Se PWM foi detectado, uma média de 7791 (mínimo: 5 - máximo: 343500) Hz foi medida. | |||
| PCMark 8 Home Score Accelerated v2 | 3505 pontos | |
| PCMark 8 Work Score Accelerated v2 | 4482 pontos | |
| PCMark 10 Score | 5211 pontos | |
Ajuda | ||
| MSI P65 Creator 9SF-657 2x Samsung SSD PM981 MZVLB512HAJQ (RAID 0) | Razer Blade 15 RTX 2070 Max-Q Samsung SSD PM981 MZVLB512HAJQ | Asus Zephyrus S GX502GW 2x Intel SSD 660p SSDPEKNW512G8 (RAID 0) | Schenker XMG Ultra 15 Turing Samsung SSD 970 EVO Plus 1TB | Gigabyte Aero 15-X9 Intel SSD 760p SSDPEKKW010T8 | Média 2x Samsung SSD PM981 MZVLB512HAJQ (RAID 0) | |
|---|---|---|---|---|---|---|
| CrystalDiskMark 5.2 / 6 | -32% | -24% | -17% | -31% | -7% | |
| Write 4K (MB/s) | 105.6 | 93.9 -11% | 97 -8% | 129.9 23% | 97.1 -8% | 98.6 ? -7% |
| Read 4K (MB/s) | 46.32 | 40.56 -12% | 49.58 7% | 47.15 2% | 53.7 16% | 42.5 ? -8% |
| Write Seq (MB/s) | 2910 | 1468 -50% | 1838 -37% | 1840 -37% | 1526 -48% | 2804 ? -4% |
| Read Seq (MB/s) | 2820 | 1540 -45% | 2421 -14% | 1775 -37% | 2020 -28% | 2806 ? 0% |
| Write 4K Q32T1 (MB/s) | 545 | 293.5 -46% | 326.9 -40% | 294.5 -46% | 285.6 -48% | 446 ? -18% |
| Read 4K Q32T1 (MB/s) | 632 | 346 -45% | 372.9 -41% | 373.6 -41% | 321.8 -49% | 512 ? -19% |
| Write Seq Q32T1 (MB/s) | 3349 | 1941 -42% | 1894 -43% | 3295 -2% | 1533 -54% | 3252 ? -3% |
| Read Seq Q32T1 (MB/s) | 3333 | 3266 -2% | 2828 -15% | 3535 6% | 2351 -29% | 3324 ? 0% |
| AS SSD | -4% | -24% | 19% | -34% | -5% | |
| Seq Read (MB/s) | 2860 | 1840 -36% | 2506 -12% | 2739 -4% | 2113 -26% | 2811 ? -2% |
| Seq Write (MB/s) | 2604 | 1822 -30% | 1712 -34% | 2650 2% | 1471 -44% | 2627 ? 1% |
| 4K Read (MB/s) | 45.15 | 52.3 16% | 48.32 7% | 27.86 -38% | 55 22% | 42.4 ? -6% |
| 4K Write (MB/s) | 100.2 | 110.7 10% | 103.6 3% | 134.7 34% | 107.1 7% | 97.5 ? -3% |
| 4K-64 Read (MB/s) | 1428 | 1126 -21% | 624 -56% | 1651 16% | 914 -36% | 1382 ? -3% |
| 4K-64 Write (MB/s) | 1401 | 1717 23% | 1253 -11% | 2190 56% | 703 -50% | 1245 ? -11% |
| Access Time Read * (ms) | 0.049 | 0.047 4% | 0.08 -63% | 0.031 37% | 0.114 -133% | 0.05367 ? -10% |
| Access Time Write * (ms) | 0.037 | 0.033 11% | 0.04 -8% | 0.028 24% | 0.034 8% | 0.038 ? -3% |
| Score Read (Points) | 1759 | 1362 -23% | 923 -48% | 1953 11% | 1180 -33% | 1706 ? -3% |
| Score Write (Points) | 1762 | 2010 14% | 1528 -13% | 2590 47% | 957 -46% | 1605 ? -9% |
| Score Total (Points) | 4411 | 4079 -8% | 2896 -34% | 5529 25% | 2722 -38% | 4176 ? -5% |
| Copy ISO MB/s (MB/s) | 1975 | 2031 | 1864 | |||
| Copy Program MB/s (MB/s) | 526 | 452.1 | 362.6 | |||
| Copy Game MB/s (MB/s) | 1200 | 1043 | 936 | |||
| Média Total (Programa/Configurações) | -18% /
-15% | -24% /
-24% | 1% /
4% | -33% /
-32% | -6% /
-6% |
* ... menor é melhor

| 3DMark 11 Performance | 19440 pontos | |
| 3DMark Cloud Gate Standard Score | 36379 pontos | |
| 3DMark Fire Strike Score | 14946 pontos | |
Ajuda | ||
| Thief | |
| 1920x1080 Very High Preset AA:FXAA & High SS AF:8x | |
| Média NVIDIA GeForce RTX 2070 Max-Q (99 - 103, n=2) | |
| MSI P65 Creator 9SF-657 | |
| 1366x768 High Preset AA:FXAA & Low SS AF:4x | |
| MSI P65 Creator 9SF-657 | |
| Média NVIDIA GeForce RTX 2070 Max-Q (n=1) | |
| 1366x768 Normal Preset AA:FX | |
| MSI P65 Creator 9SF-657 | |
| Média NVIDIA GeForce RTX 2070 Max-Q (n=1) | |
| 1024x768 Very Low Preset | |
| MSI P65 Creator 9SF-657 | |
| Média NVIDIA GeForce RTX 2070 Max-Q (n=1) | |
| Dota 2 Reborn | |
| 1920x1080 ultra (3/3) best looking | |
| Média NVIDIA GeForce RTX 2070 Max-Q (105.8 - 126, n=13) | |
| MSI P65 Creator 9SF-657 | |
| Média da turma Multimedia (29 - 179.9, n=68, últimos 2 anos) | |
| 1920x1080 high (2/3) | |
| Média NVIDIA GeForce RTX 2070 Max-Q (111.4 - 135, n=13) | |
| MSI P65 Creator 9SF-657 | |
| Média da turma Multimedia (31.1 - 196.9, n=68, últimos 2 anos) | |
| 1366x768 med (1/3) | |
| Média NVIDIA GeForce RTX 2070 Max-Q (117.4 - 141, n=13) | |
| MSI P65 Creator 9SF-657 | |
| Média da turma Multimedia (49.1 - 208, n=68, últimos 2 anos) | |
| 1280x720 min (0/3) fastest | |
| Média NVIDIA GeForce RTX 2070 Max-Q (126.5 - 164, n=13) | |
| MSI P65 Creator 9SF-657 | |
| Média da turma Multimedia (77.2 - 233, n=68, últimos 2 anos) | |
| baixo | média | alto | ultra | 4K | |
|---|---|---|---|---|---|
| BioShock Infinite (2013) | 369.7 | 291.8 | 277.2 | 148.8 | |
| Thief (2014) | 134.8 | 131.6 | 128.7 | 99 | |
| The Witcher 3 (2015) | 295.7 | 205.8 | 116.5 | 80.8 | 42.3 |
| Dota 2 Reborn (2015) | 142.2 | 131.4 | 122.9 | 117.4 |
Barulho
| Ocioso |
| 32.8 / 32.8 / 33.6 dB |
| Carga |
| 40.9 / 42.7 dB |
 | ||
30 dB silencioso 40 dB(A) audível 50 dB(A) ruidosamente alto |
||
min: | ||
(-) A temperatura máxima no lado superior é 49.7 °C / 121 F, em comparação com a média de 36.8 °C / 98 F , variando de 21 a 71 °C para a classe Multimedia.
(-) A parte inferior aquece até um máximo de 60.4 °C / 141 F, em comparação com a média de 39.1 °C / 102 F
(+) Em uso inativo, a temperatura média para o lado superior é 26.8 °C / 80 F, em comparação com a média do dispositivo de 31.3 °C / ### class_avg_f### F.
(+) Os apoios para as mãos e o touchpad estão atingindo a temperatura máxima da pele (34.9 °C / 94.8 F) e, portanto, não estão quentes.
(-) A temperatura média da área do apoio para as mãos de dispositivos semelhantes foi 28.7 °C / 83.7 F (-6.2 °C / -11.1 F).
MSI P65 Creator 9SF-657 análise de áudio
(±) | o volume do alto-falante é médio, mas bom (###valor### dB)
Graves 100 - 315Hz
(-) | quase nenhum baixo - em média 23.6% menor que a mediana
(±) | a linearidade dos graves é média (9.9% delta para a frequência anterior)
Médios 400 - 2.000 Hz
(±) | médios mais altos - em média 8.4% maior que a mediana
(±) | a linearidade dos médios é média (7.8% delta para frequência anterior)
Altos 2 - 16 kHz
(±) | máximos mais altos - em média 6% maior que a mediana
(±) | a linearidade dos máximos é média (9.3% delta para frequência anterior)
Geral 100 - 16.000 Hz
(±) | a linearidade do som geral é média (28.3% diferença em relação à mediana)
Comparado com a mesma classe
» 94% de todos os dispositivos testados nesta classe foram melhores, 2% semelhantes, 5% piores
» O melhor teve um delta de 5%, a média foi 17%, o pior foi 45%
Comparado com todos os dispositivos testados
» 85% de todos os dispositivos testados foram melhores, 3% semelhantes, 12% piores
» O melhor teve um delta de 4%, a média foi 24%, o pior foi 134%
Apple MacBook 12 (Early 2016) 1.1 GHz análise de áudio
(+) | os alto-falantes podem tocar relativamente alto (###valor### dB)
Graves 100 - 315Hz
(±) | graves reduzidos - em média 11.3% menor que a mediana
(±) | a linearidade dos graves é média (14.2% delta para a frequência anterior)
Médios 400 - 2.000 Hz
(+) | médios equilibrados - apenas 2.4% longe da mediana
(+) | médios são lineares (5.5% delta para frequência anterior)
Altos 2 - 16 kHz
(+) | agudos equilibrados - apenas 2% longe da mediana
(+) | os máximos são lineares (4.5% delta da frequência anterior)
Geral 100 - 16.000 Hz
(+) | o som geral é linear (10.2% diferença em relação à mediana)
Comparado com a mesma classe
» 7% de todos os dispositivos testados nesta classe foram melhores, 2% semelhantes, 91% piores
» O melhor teve um delta de 5%, a média foi 18%, o pior foi 53%
Comparado com todos os dispositivos testados
» 5% de todos os dispositivos testados foram melhores, 1% semelhantes, 94% piores
» O melhor teve um delta de 4%, a média foi 24%, o pior foi 134%
| desligado | |
| Ocioso | |
| Carga |
|
Key:
min: | |
| MSI P65 Creator 9SF-657 i9-9880H, GeForce RTX 2070 Max-Q, 2x Samsung SSD PM981 MZVLB512HAJQ (RAID 0), IPS, 3840x2160, 15.6" | Razer Blade 15 RTX 2070 Max-Q i7-8750H, GeForce RTX 2070 Max-Q, Samsung SSD PM981 MZVLB512HAJQ, IPS, 1920x1080, 15.6" | Asus Zephyrus S GX502GW i7-9750H, GeForce RTX 2070 Mobile, 2x Intel SSD 660p SSDPEKNW512G8 (RAID 0), IPS, 1920x1080, 15.6" | Schenker XMG Ultra 15 Turing i7-9700K, GeForce RTX 2070 Mobile, Samsung SSD 970 EVO Plus 1TB, IPS, 1920x1080, 15.6" | Gigabyte Aero 15-X9 i7-8750H, GeForce RTX 2070 Max-Q, Intel SSD 760p SSDPEKKW010T8, IPS, 1920x1080, 15.6" | Média NVIDIA GeForce RTX 2070 Max-Q | Média da turma Multimedia | |
|---|---|---|---|---|---|---|---|
| Power Consumption | 10% | -61% | -118% | -10% | -22% | 41% | |
| Idle Minimum * (Watt) | 9.4 | 10.4 -11% | 24 -155% | 35 -272% | 16 -70% | 15.4 ? -64% | 5.71 ? 39% |
| Idle Average * (Watt) | 17.4 | 14.6 16% | 27 -55% | 39 -124% | 18 -3% | 20 ? -15% | 10.1 ? 42% |
| Idle Maximum * (Watt) | 19.6 | 16.3 17% | 33 -68% | 47 -140% | 23 -17% | 26.7 ? -36% | 12.4 ? 37% |
| Load Average * (Watt) | 103 | 88.5 14% | 129 -25% | 117 -14% | 88 15% | 105.2 ? -2% | 65 ? 37% |
| Load Maximum * (Watt) | 216 | 182.4 16% | 216 -0% | 299 -38% | 167 23% | 201 ? 7% | 112.2 ? 48% |
| Witcher 3 ultra * (Watt) | 155.4 | 176 | 196 | 120 |
* ... menor é melhor
| MSI P65 Creator 9SF-657 i9-9880H, GeForce RTX 2070 Max-Q, 82 Wh | Razer Blade 15 RTX 2070 Max-Q i7-8750H, GeForce RTX 2070 Max-Q, 80 Wh | Asus Zephyrus S GX502GW i7-9750H, GeForce RTX 2070 Mobile, 76 Wh | Schenker XMG Ultra 15 Turing i7-9700K, GeForce RTX 2070 Mobile, 82 Wh | Gigabyte Aero 15-X9 i7-8750H, GeForce RTX 2070 Max-Q, 94.24 Wh | Média da turma Multimedia | |
|---|---|---|---|---|---|---|
| Duração da bateria | 21% | -29% | -32% | 56% | 105% | |
| Reader / Idle (h) | 9.6 | 11.4 19% | 5.9 -39% | 3.2 -67% | 9.2 -4% | 25.2 ? 163% |
| WiFi v1.3 (h) | 6 | 6.5 8% | 3.7 -38% | 2.6 -57% | 6.4 7% | 12 ? 100% |
| Load (h) | 1.1 | 1.5 36% | 1 -9% | 1.4 27% | 2.9 164% | 1.675 ? 52% |
| H.264 (h) | 2.6 | 6.1 | 16.4 ? |
Pro
Contra
Veredicto - portátil multimídia compacto com muita potência
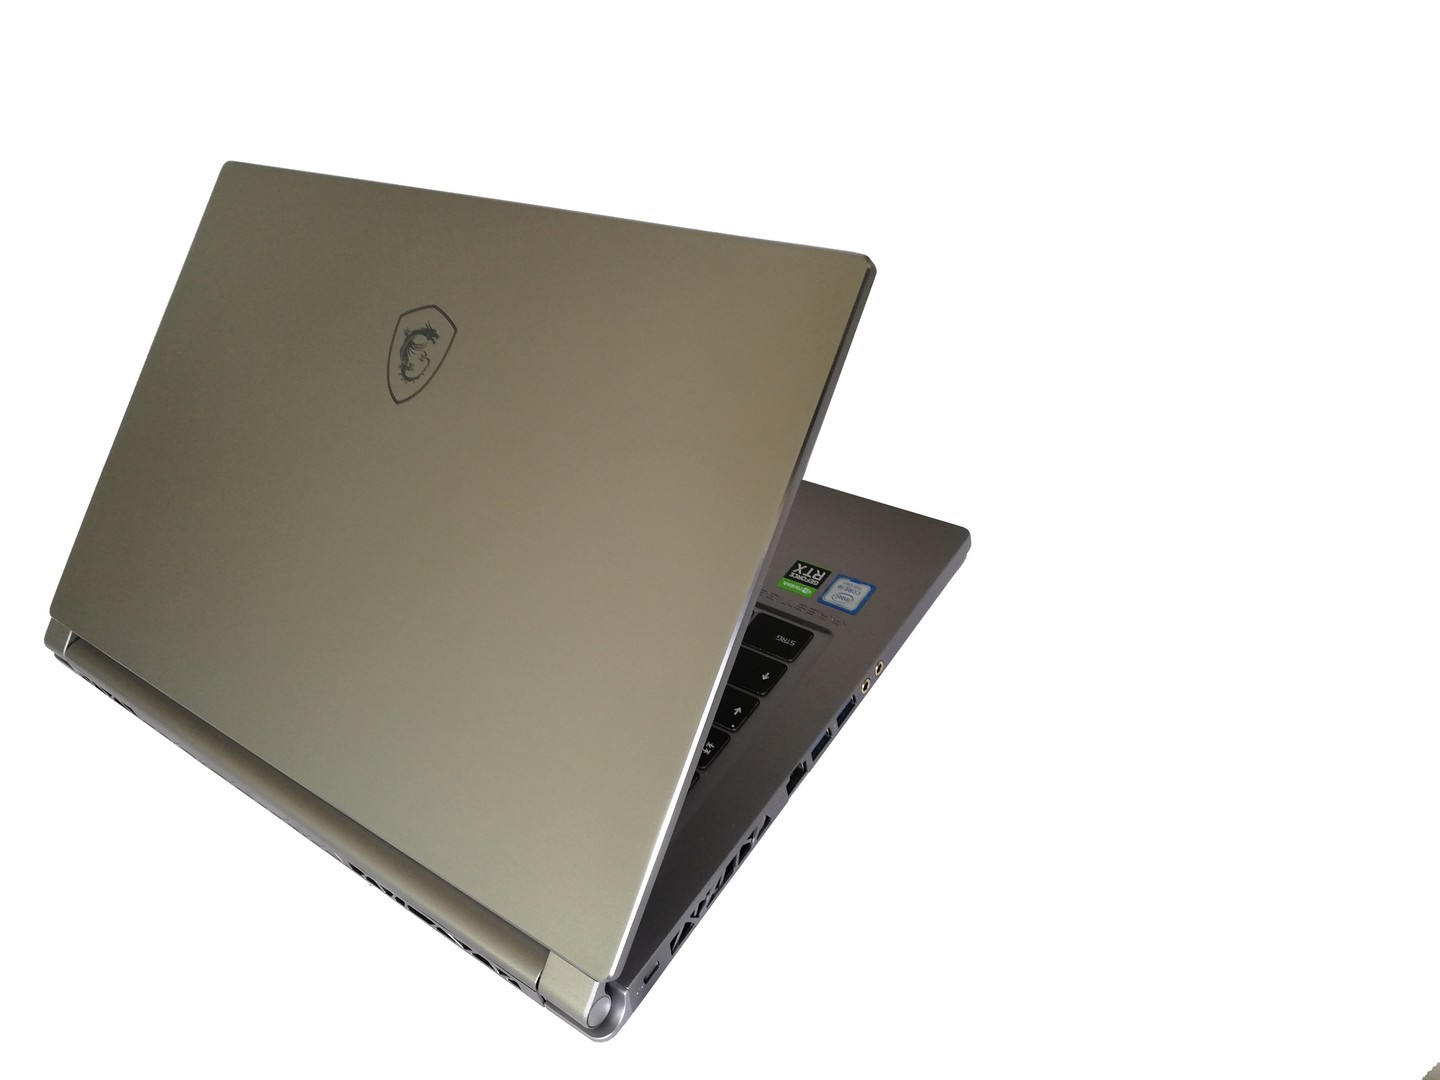
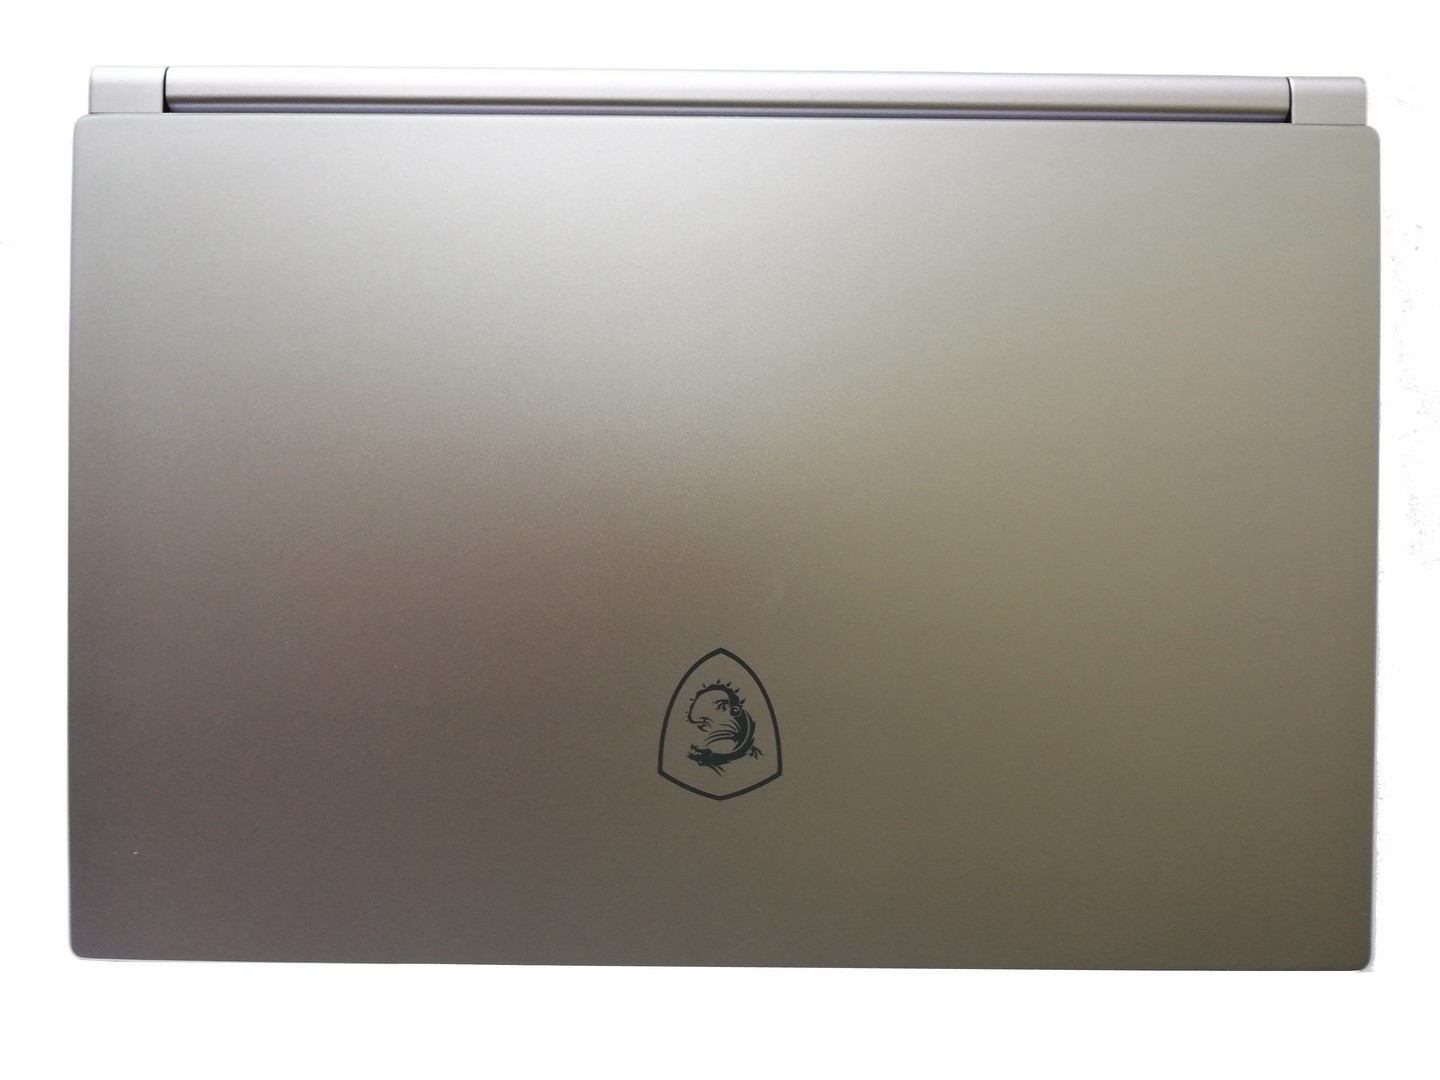
Nossa análise mostrou que o MSI P65 Creator 9SF é uma usina compacta com uma tela viva. Sua carcaça se adapta perfeitamente a ambientes de negócios e o acabamento é bom. A porta Thunderbolt 3 garante que os usuários continuem bem equipados para qualquer necessidade futura de portas.
O MSI P65 Creator 9SF é impressionante com seu design atraente e ótimo desempenho. O fabricante poderia ter escolhido a versão da Nvidia GeForce RTX 2070 Max-Q com um TDP mais alto, no entanto.
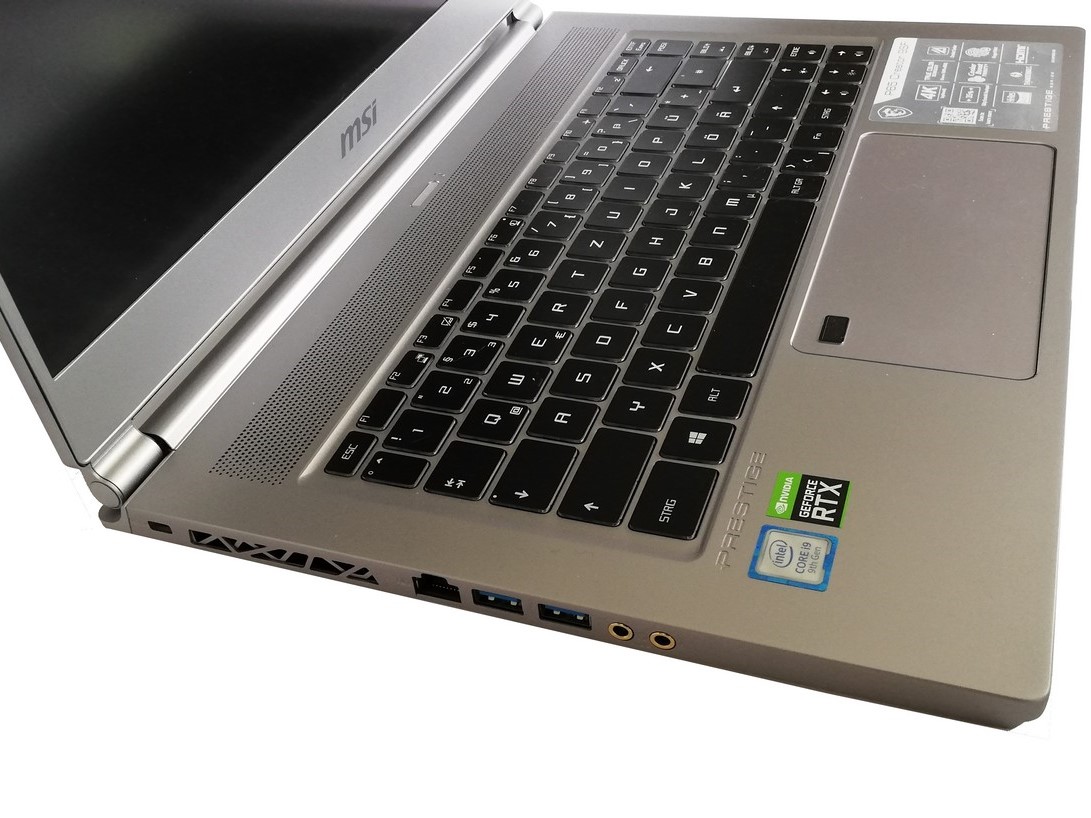
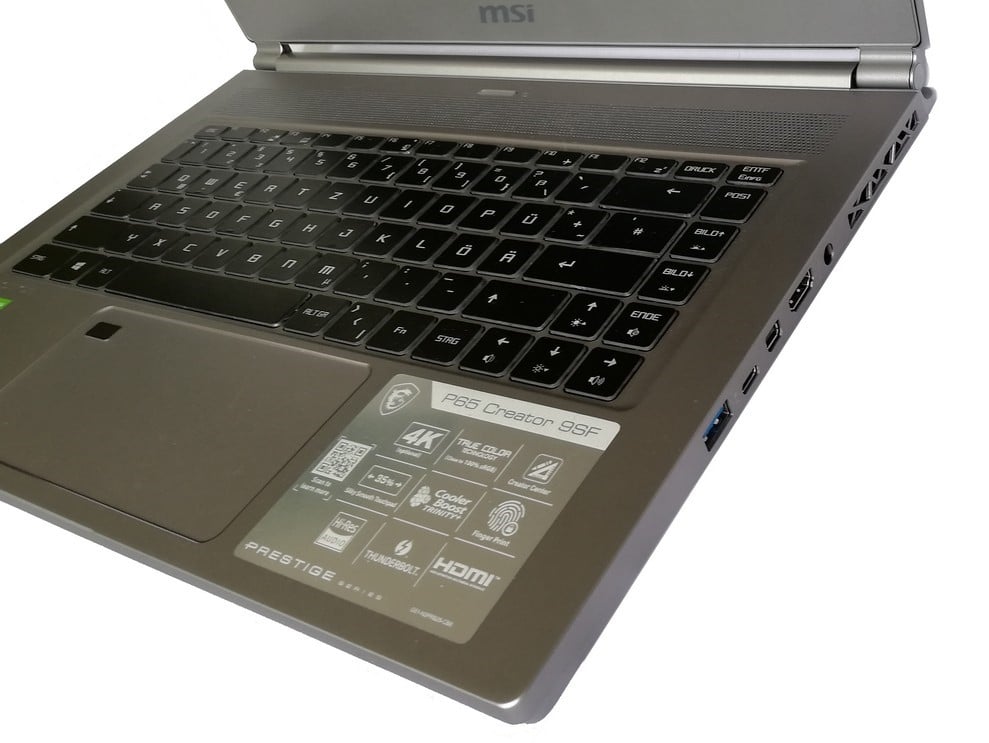
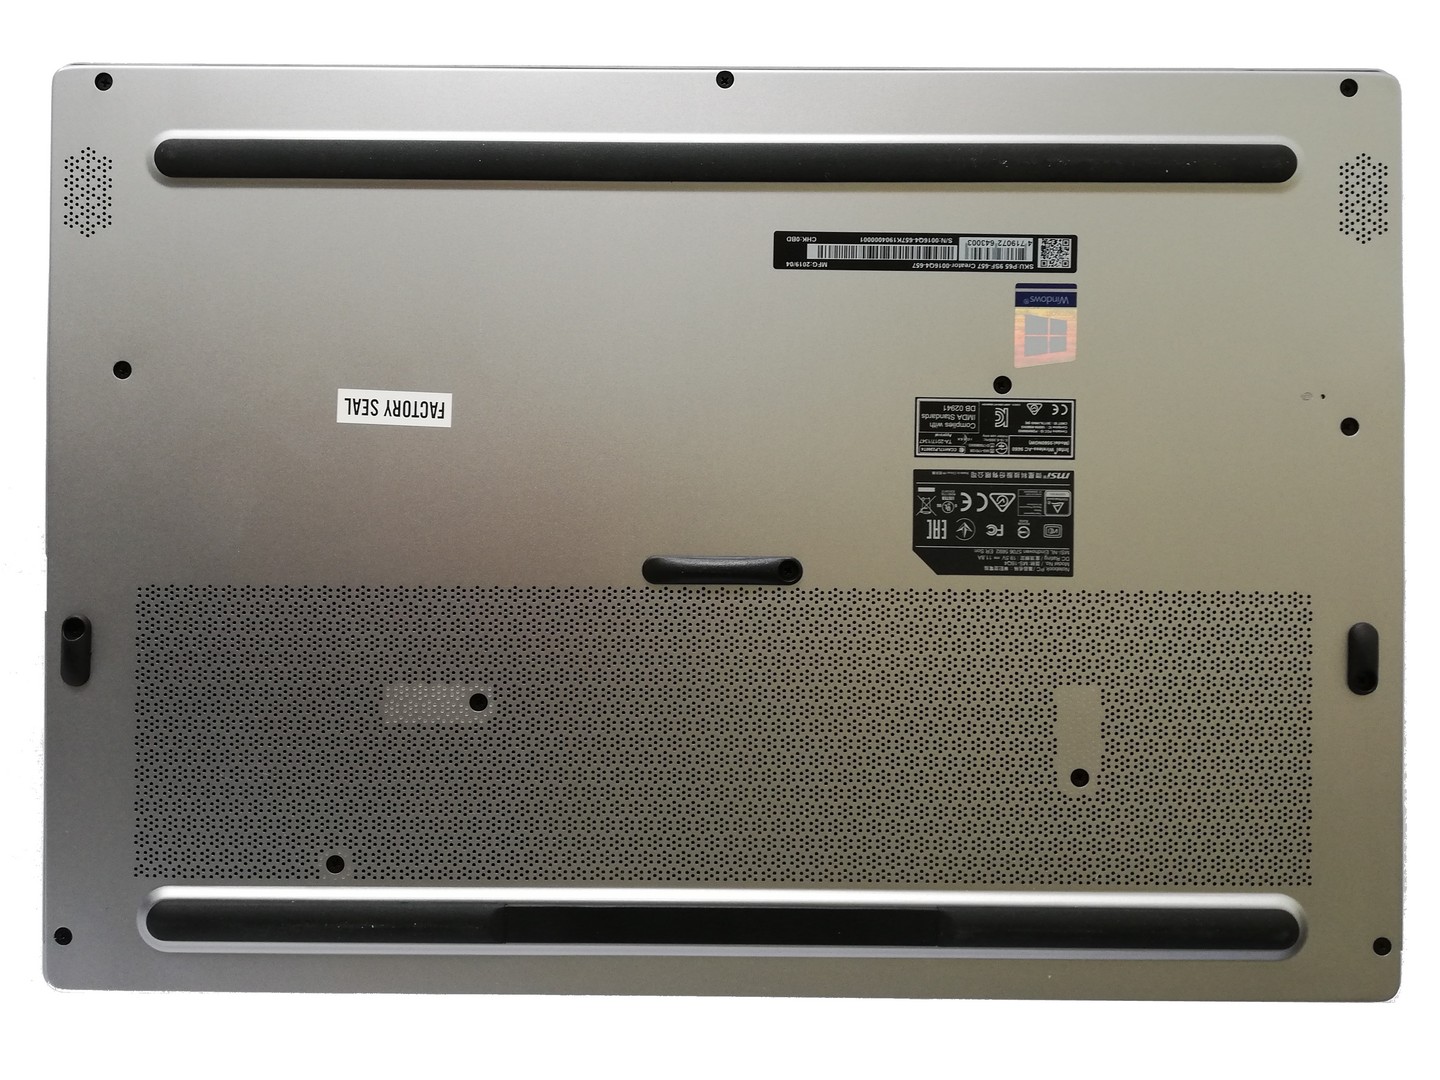
O desempenho do sistema é bom e pode acompanhar facilmente a maioria dos concorrentes. Outros fabricantes, no entanto, conseguem tirar um pouco mais da GPU - embora, é claro, o P65 Creator esteja equipado com a versão TDP mais baixa do RTX 2070 Max-Q. Como no modelo anterior, as opções de manutenção são basicamente inexistentes. Nossa unidade de teste também continua a apresentar um leitor de digitais integrado no touchpad. Este último é significativamente mais amplo do que antes e, portanto, oferece mais espaço para navegação por gestos.
MSI P65 Creator 9SF-657
- 10/25/2019 v7 (old)
Mike Wobker
Price comparison
