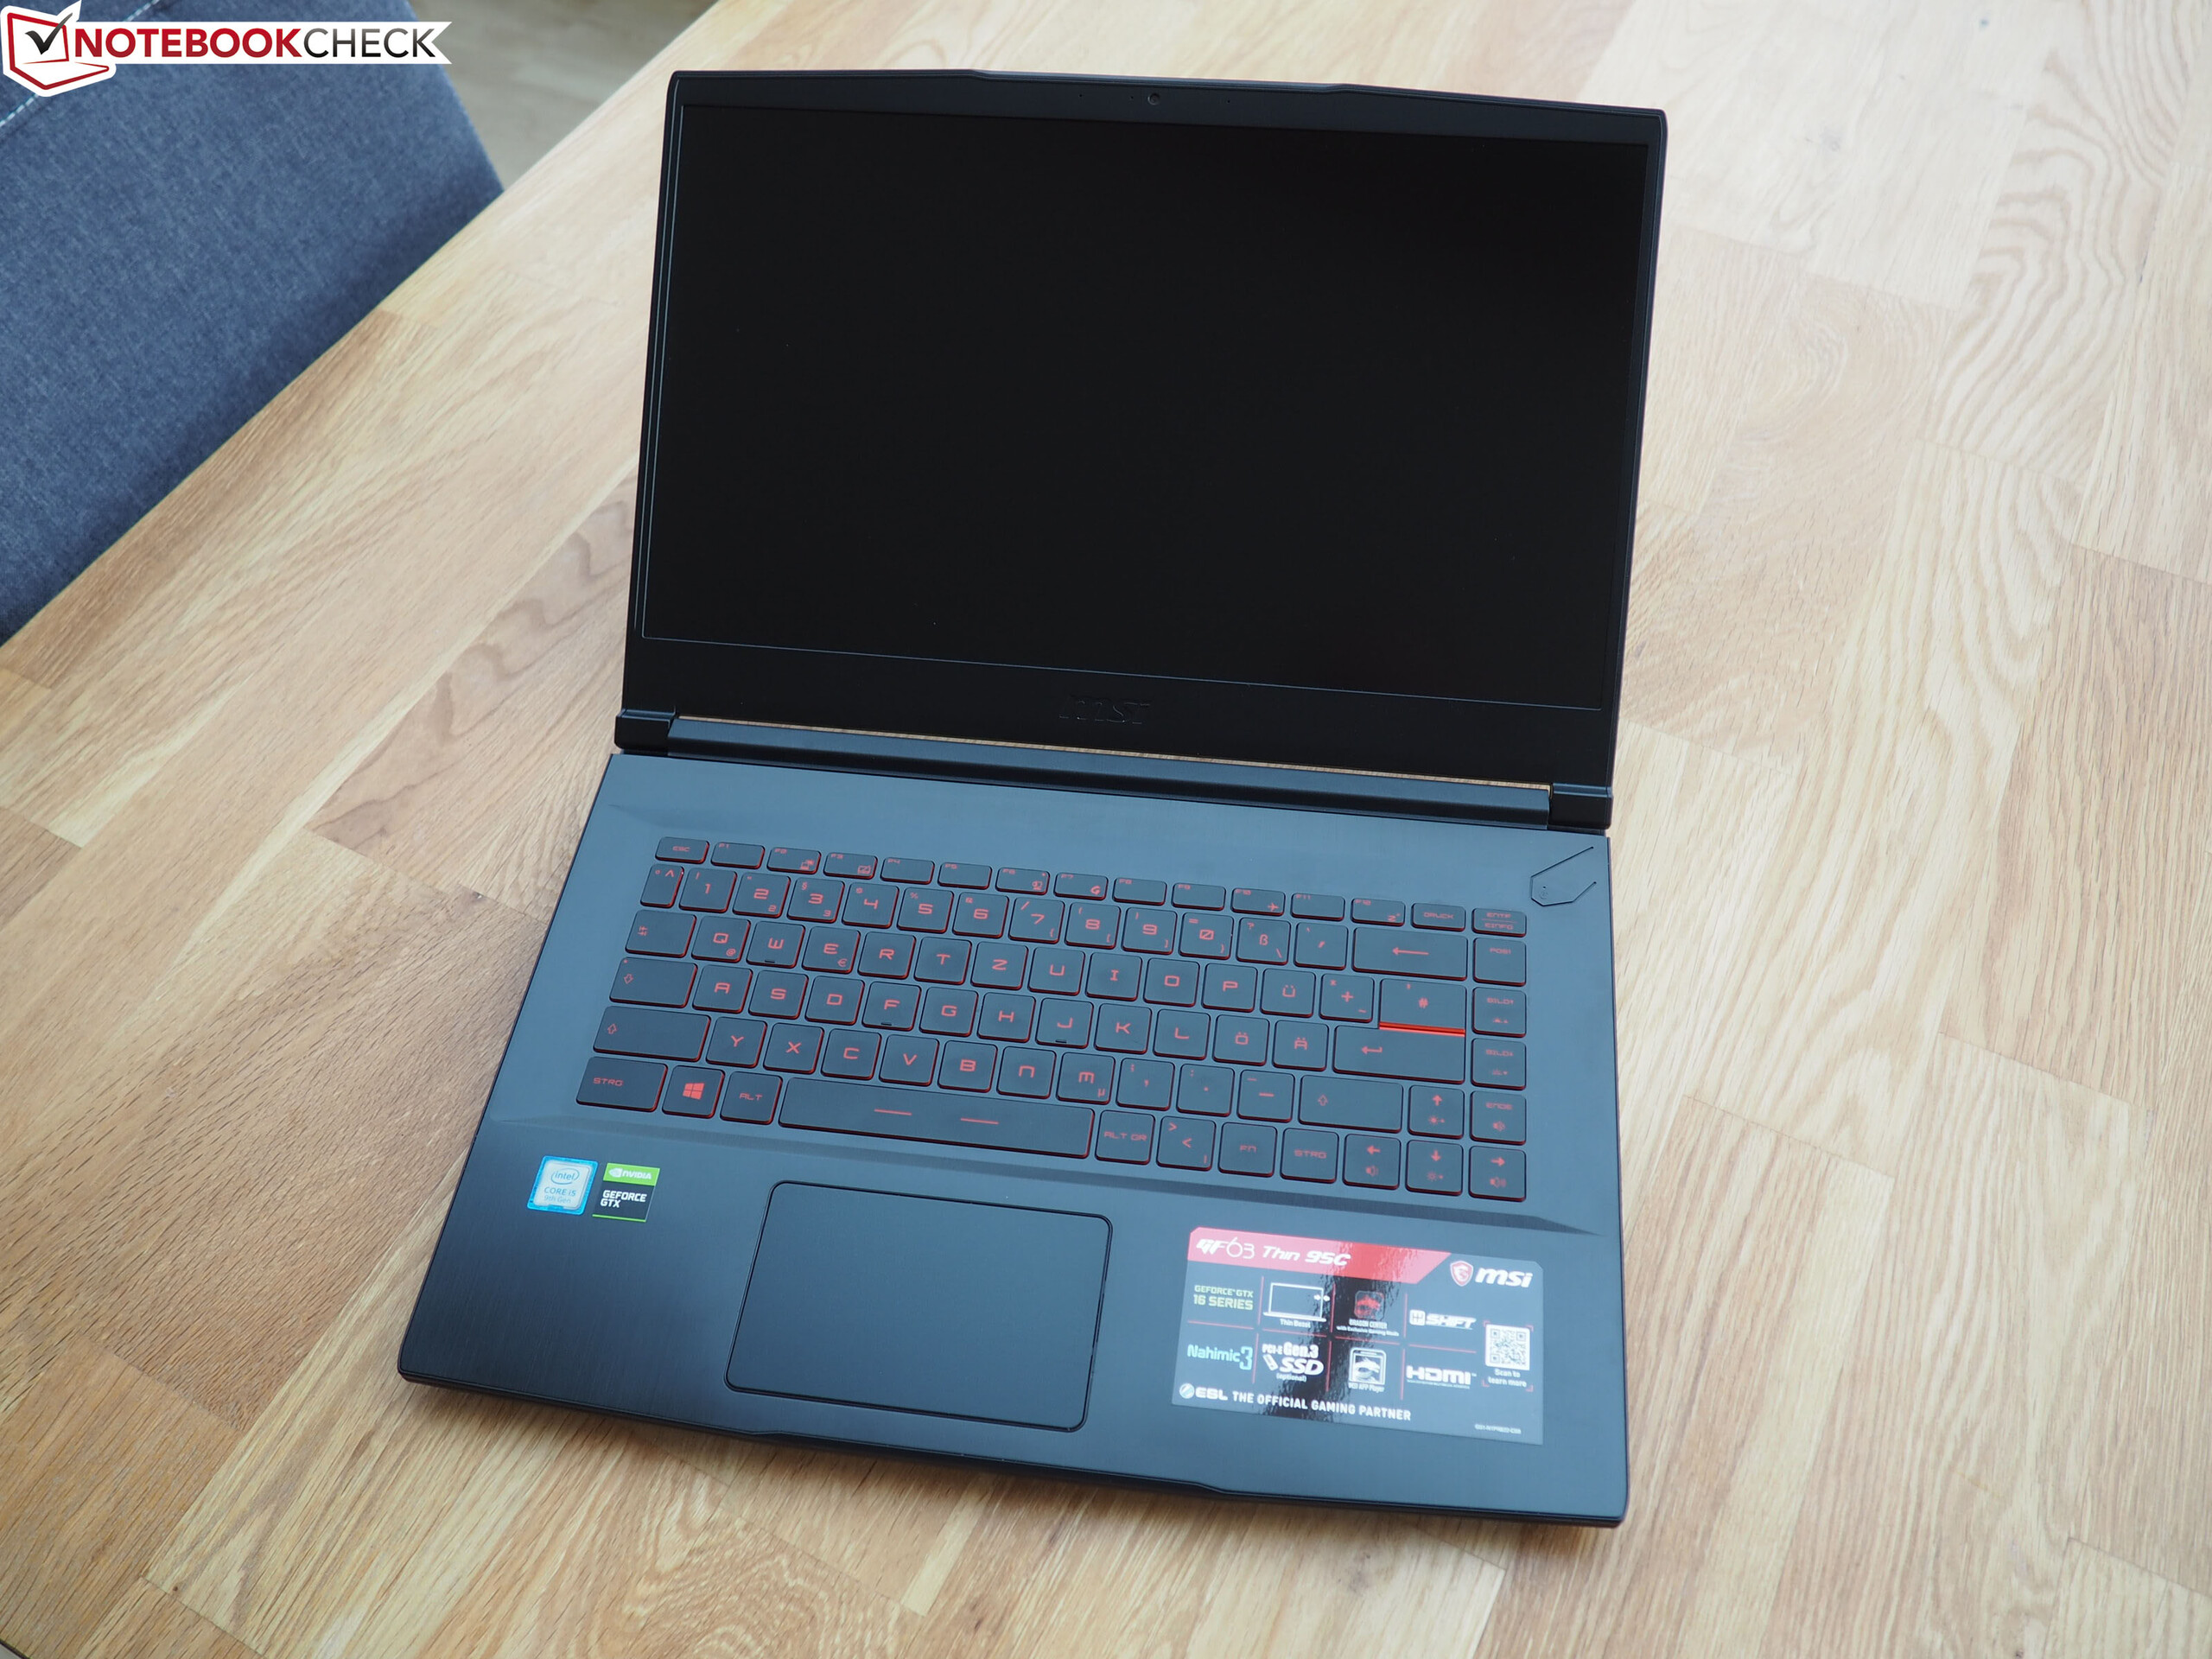
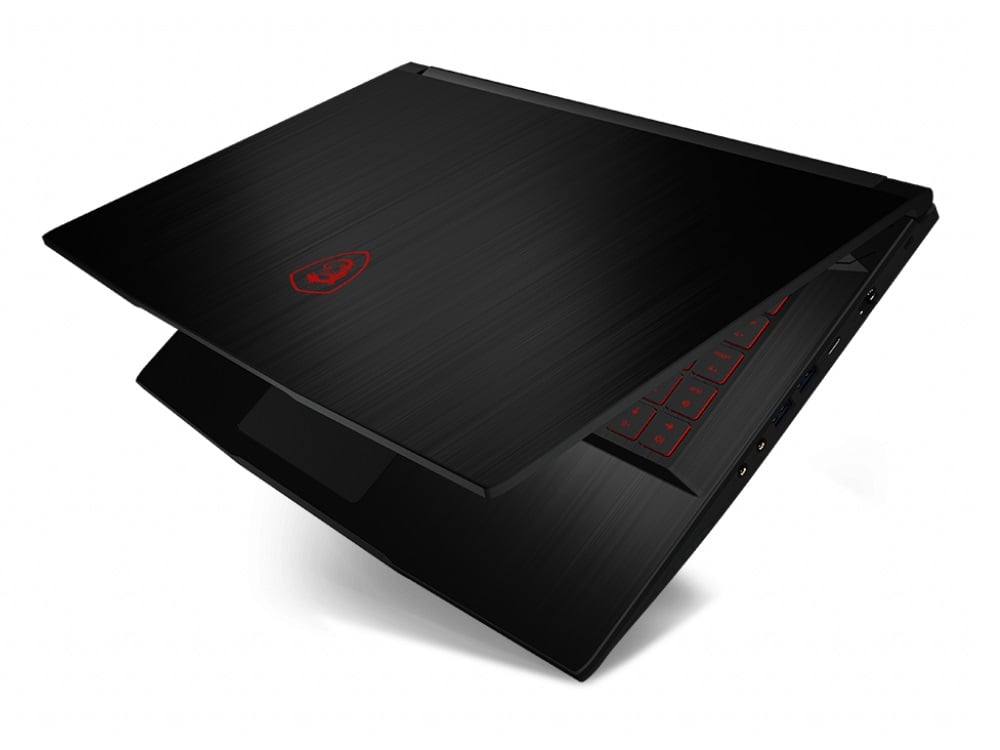
Breve Análise do Portátil MSI GF63 Thin 9SC: Gamer leve por pouco menos de $1000
Avaliação | Data | Modelo | Peso | Altura | Size | Resolução | Preço |
|---|---|---|---|---|---|---|---|
| 77.6 % v7 (old) | 01/2020 | MSI GF63 Thin 9SC i5-9300H, GeForce GTX 1650 Max-Q | 1.8 kg | 22 mm | 15.60" | 1920x1080 | |
| 79.6 % v7 (old) | 10/2019 | Dell G5 15 5590-PCNJJ i5-9300H, GeForce GTX 1650 Mobile | 2.7 kg | 23.7 mm | 15.60" | 1920x1080 | |
| 82.5 % v6 (old) | 05/2019 | Acer Aspire Nitro 5 AN515-54-53Z2 i5-9300H, GeForce GTX 1650 Mobile | 2.2 kg | 27 mm | 15.60" | 1920x1080 | |
| 81.5 % v7 (old) | 07/2019 | HP Omen 15-dc1020ng i5-9300H, GeForce GTX 1650 Mobile | 2.3 kg | 25 mm | 15.60" | 1920x1080 | |
| 77 % v7 (old) | 12/2019 | Lenovo IdeaPad L340-15IRH 81LK00BMGE i5-9300H, GeForce GTX 1650 Mobile | 2.1 kg | 23.9 mm | 15.60" | 1920x1080 |
| Networking | |
| iperf3 transmit AX12 | |
| MSI GF63 Thin 9SC | |
| iperf3 receive AX12 | |
| MSI GF63 Thin 9SC | |
| |||||||||||||||||||||||||
iluminação: 92 %
iluminação com acumulador: 260 cd/m²
Contraste: 1130:1 (Preto: 0.23 cd/m²)
ΔE ColorChecker Calman: 4.1 | ∀{0.5-29.43 Ø4.73}
calibrated: 3.56
ΔE Greyscale Calman: 2.83 | ∀{0.09-98 Ø4.97}
56% sRGB (Argyll 1.6.3 3D)
36% AdobeRGB 1998 (Argyll 1.6.3 3D)
39.01% AdobeRGB 1998 (Argyll 3D)
56.5% sRGB (Argyll 3D)
37.76% Display P3 (Argyll 3D)
Gamma: 2.53
CCT: 6158 K
| MSI GF63 Thin 9SC AU Optronics B156HAN02.1 (AUO21ED), IPS, 1920x1080 | Dell G5 15 5590-PCNJJ AU Optronics B156HAN (AUO23ED), IPS, 1920x1080 | Acer Aspire Nitro 5 AN515-54-53Z2 LG LP156WFC-SPD1 (LGD0563), IPS, 1920x1080 | HP Omen 15-dc1020ng LGD05CE, IPS, 1920x1080 | Lenovo IdeaPad L340-15IRH 81LK00BMGE CMN 156HCA-EAB, IPS, 1920x1080 | |
|---|---|---|---|---|---|
| Display | 115% | 1% | 2% | 13% | |
| Display P3 Coverage (%) | 37.76 | 83.1 120% | 37.97 1% | 38.37 2% | 42.81 13% |
| sRGB Coverage (%) | 56.5 | 99.9 77% | 57 1% | 57.6 2% | 63.8 13% |
| AdobeRGB 1998 Coverage (%) | 39.01 | 96.8 148% | 39.23 1% | 39.69 2% | 44.31 14% |
| Response Times | -1% | 11% | 9% | 1% | |
| Response Time Grey 50% / Grey 80% * (ms) | 44.8 ? | 48 ? -7% | 42 ? 6% | 40 ? 11% | 45.6 ? -2% |
| Response Time Black / White * (ms) | 31.6 ? | 30 ? 5% | 26.8 ? 15% | 29.6 ? 6% | 30.8 ? 3% |
| PWM Frequency (Hz) | 25910 ? | ||||
| Screen | -19% | -2% | -21% | -16% | |
| Brightness middle (cd/m²) | 260 | 234 -10% | 238 -8% | 251 -3% | 275 6% |
| Brightness (cd/m²) | 249 | 216 -13% | 226 -9% | 232 -7% | 253 2% |
| Brightness Distribution (%) | 92 | 87 -5% | 83 -10% | 76 -17% | 83 -10% |
| Black Level * (cd/m²) | 0.23 | 0.22 4% | 0.27 -17% | 0.17 26% | 0.18 22% |
| Contrast (:1) | 1130 | 1064 -6% | 881 -22% | 1476 31% | 1528 35% |
| Colorchecker dE 2000 * | 4.1 | 6.52 -59% | 4.11 -0% | 6.2 -51% | 5.4 -32% |
| Colorchecker dE 2000 max. * | 7.93 | 10.58 -33% | 6.89 13% | 18.6 -135% | 21.3 -169% |
| Colorchecker dE 2000 calibrated * | 3.56 | 3.56 -0% | 3.76 -6% | 4.8 -35% | 4.4 -24% |
| Greyscale dE 2000 * | 2.83 | 5.33 -88% | 1.78 37% | 4.2 -48% | 3.7 -31% |
| Gamma | 2.53 87% | 2.86 77% | 2.41 91% | 2.32 95% | 2.12 104% |
| CCT | 6158 106% | 5983 109% | 6311 103% | 7454 87% | 6376 102% |
| Color Space (Percent of AdobeRGB 1998) (%) | 36 | 36 0% | 36 0% | 36.5 1% | 40.8 13% |
| Color Space (Percent of sRGB) (%) | 56 | 57 2% | 57 2% | 57.4 2% | 63.6 14% |
| Média Total (Programa/Configurações) | 32% /
8% | 3% /
0% | -3% /
-13% | -1% /
-8% |
* ... menor é melhor
Exibir tempos de resposta
| ↔ Tempo de resposta preto para branco | ||
|---|---|---|
| 31.6 ms ... ascensão ↗ e queda ↘ combinadas | ↗ 17.2 ms ascensão | 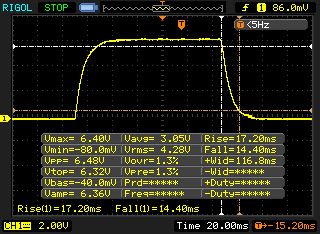 |
| ↘ 14.4 ms queda | ||
| A tela mostra taxas de resposta lentas em nossos testes e será insatisfatória para os jogadores. Em comparação, todos os dispositivos testados variam de 0.1 (mínimo) a 240 (máximo) ms. » 85 % de todos os dispositivos são melhores. Isso significa que o tempo de resposta medido é pior que a média de todos os dispositivos testados (19.9 ms). | ||
| ↔ Tempo de resposta 50% cinza a 80% cinza | ||
| 44.8 ms ... ascensão ↗ e queda ↘ combinadas | ↗ 22 ms ascensão | 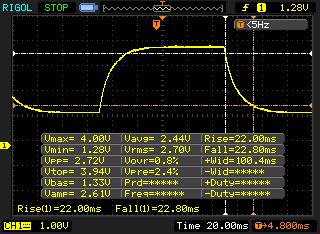 |
| ↘ 22.8 ms queda | ||
| A tela mostra taxas de resposta lentas em nossos testes e será insatisfatória para os jogadores. Em comparação, todos os dispositivos testados variam de 0.165 (mínimo) a 636 (máximo) ms. » 76 % de todos os dispositivos são melhores. Isso significa que o tempo de resposta medido é pior que a média de todos os dispositivos testados (31.1 ms). | ||
Cintilação da tela / PWM (modulação por largura de pulso)
| Tela tremeluzindo / PWM não detectado | 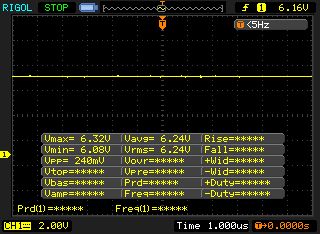 | ||
[pwm_comparison] Em comparação: 52 % de todos os dispositivos testados não usam PWM para escurecer a tela. Se PWM foi detectado, uma média de 7798 (mínimo: 5 - máximo: 343500) Hz foi medida. | |||
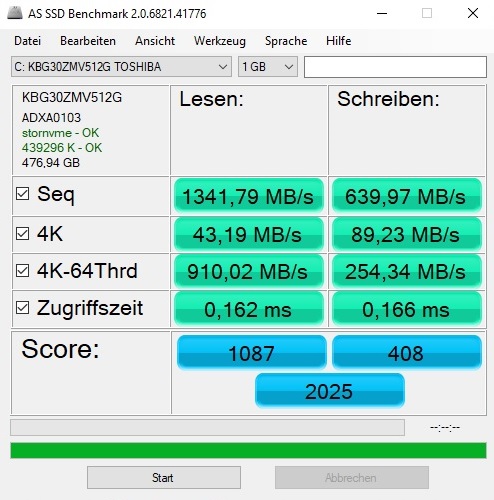
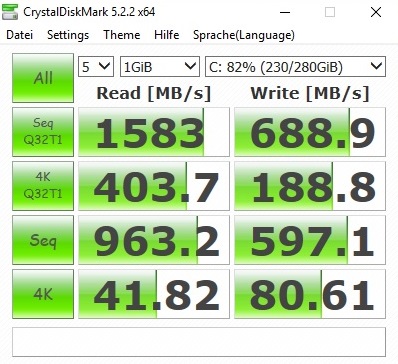
| MSI GF63 Thin 9SC Toshiba KBG30ZMV512G | Dell G5 15 5590-PCNJJ KBG30ZMS128G | Acer Aspire Nitro 5 AN515-54-53Z2 WDC PC SN520 SDAPNUW-512G | HP Omen 15-dc1020ng WDC PC SN720 SDAQNTW-512G | Lenovo IdeaPad L340-15IRH 81LK00BMGE WDC PC SN520 SDAPMUW-512 | |
|---|---|---|---|---|---|
| CrystalDiskMark 5.2 / 6 | -43% | 48% | 105% | 34% | |
| Write 4K (MB/s) | 80.6 | 65.3 -19% | 109.1 35% | 112.1 39% | 103.6 29% |
| Read 4K (MB/s) | 41.82 | 29.71 -29% | 42.05 1% | 42.01 0% | 39.91 -5% |
| Write Seq (MB/s) | 597 | 128.8 -78% | 1457 144% | 1964 229% | 1160 94% |
| Read Seq (MB/s) | 963 | 859 -11% | 1421 48% | 2065 114% | 990 3% |
| Write 4K Q32T1 (MB/s) | 188.8 | 95.8 -49% | 287.8 52% | 318.2 69% | 283.4 50% |
| Read 4K Q32T1 (MB/s) | 403.7 | 197.6 -51% | 317.9 -21% | 406.7 1% | 344.5 -15% |
| Write Seq Q32T1 (MB/s) | 689 | 132.5 -81% | 1455 111% | 2534 268% | 1455 111% |
| Read Seq Q32T1 (MB/s) | 1583 | 1208 -24% | 1739 10% | 3438 117% | 1690 7% |

| 3DMark 11 Performance | 10378 pontos | |
| 3DMark Cloud Gate Standard Score | 17713 pontos | |
| 3DMark Fire Strike Score | 7177 pontos | |
| 3DMark Time Spy Score | 3136 pontos | |
Ajuda | ||
| The Witcher 3 | |
| 1920x1080 High Graphics & Postprocessing (Nvidia HairWorks Off) | |
| Média da turma Gaming (181 - 341, n=3, últimos 2 anos) | |
| HP Omen 15-dc1020ng | |
| Acer Aspire Nitro 5 AN515-54-53Z2 | |
| Dell G5 15 5590-PCNJJ | |
| MSI GF63 Thin 9SC | |
| 1920x1080 Ultra Graphics & Postprocessing (HBAO+) | |
| Média da turma Gaming (95 - 240, n=8, últimos 2 anos) | |
| HP Omen 15-dc1020ng | |
| Acer Aspire Nitro 5 AN515-54-53Z2 | |
| Lenovo IdeaPad L340-15IRH 81LK00BMGE | |
| Dell G5 15 5590-PCNJJ | |
| MSI GF63 Thin 9SC | |
| baixo | média | alto | ultra | |
|---|---|---|---|---|
| The Witcher 3 (2015) | 146 | 99 | 53.2 | 30.4 |
| Apex Legends (2019) | 144 | 71.1 | 58.4 | 57 |
| Far Cry New Dawn (2019) | 72 | 52 | 49 | 46 |
| Metro Exodus (2019) | 73.3 | 36.9 | 27.5 | 22.6 |
| Dirt Rally 2.0 (2019) | 154 | 81.6 | 68.8 | 38.7 |
| The Division 2 (2019) | 82 | 56 | 45 | 32 |
| Anno 1800 (2019) | 60.4 | 52.2 | 34.7 | 18 |
| Rage 2 (2019) | 103 | 46.5 | 39.7 | 38.9 |
| F1 2019 (2019) | 127 | 83 | 69 | 46 |
| Control (2019) | 120 | 39.9 | 29.1 | |
| Borderlands 3 (2019) | 86 | 53.6 | 34.9 | 26 |
| FIFA 20 (2019) | 150 | 118 | 115 | 114 |
| Ghost Recon Breakpoint (2019) | 63 | 41 | 39 | 26 |
| GRID 2019 (2019) | 92.4 | 65.9 | 53.4 | 36.7 |
| Call of Duty Modern Warfare 2019 (2019) | 94.1 | 59 | 49.8 | 40.6 |
| Need for Speed Heat (2019) | 67.6 | 52.2 | 46.8 | 37.2 |
| Star Wars Jedi Fallen Order (2019) | 57.2 | 49.7 | 44.4 | |
| Red Dead Redemption 2 (2019) | 56.3 | 43.5 | 29.3 | 18.6 |
Barulho
| Ocioso |
| 35 / 36 / 37 dB |
| Carga |
| 44 / 43 dB |
 | ||
30 dB silencioso 40 dB(A) audível 50 dB(A) ruidosamente alto |
||
min: | ||
| MSI GF63 Thin 9SC i5-9300H, GeForce GTX 1650 Max-Q | Dell G5 15 5590-PCNJJ i5-9300H, GeForce GTX 1650 Mobile | Acer Aspire Nitro 5 AN515-54-53Z2 i5-9300H, GeForce GTX 1650 Mobile | HP Omen 15-dc1020ng i5-9300H, GeForce GTX 1650 Mobile | Lenovo IdeaPad L340-15IRH 81LK00BMGE i5-9300H, GeForce GTX 1650 Mobile | Média da turma Gaming | |
|---|---|---|---|---|---|---|
| Noise | -3% | 1% | 14% | 16% | 11% | |
| desligado / ambiente * (dB) | 30 | 30 -0% | 30 -0% | 28.8 4% | 28.4 5% | 24.1 ? 20% |
| Idle Minimum * (dB) | 35 | 31 11% | 30 14% | 28.8 18% | 28.4 19% | 25.8 ? 26% |
| Idle Average * (dB) | 36 | 32 11% | 31 14% | 29.5 18% | 28.4 21% | 27.4 ? 24% |
| Idle Maximum * (dB) | 37 | 35 5% | 33 11% | 31.1 16% | 28.4 23% | 30 ? 19% |
| Load Average * (dB) | 44 | 49 -11% | 46 -5% | 35.2 20% | 30.1 32% | 43 ? 2% |
| Witcher 3 ultra * (dB) | 41 | 47 -15% | 46 -12% | 35.2 14% | 40.2 2% | |
| Load Maximum * (dB) | 43 | 53 -23% | 49 -14% | 41 5% | 40.2 7% | 54 ? -26% |
* ... menor é melhor
(-) A temperatura máxima no lado superior é 47 °C / 117 F, em comparação com a média de 40.4 °C / 105 F , variando de 21.2 a 68.8 °C para a classe Gaming.
(-) A parte inferior aquece até um máximo de 47 °C / 117 F, em comparação com a média de 43.2 °C / 110 F
(+) Em uso inativo, a temperatura média para o lado superior é 23.8 °C / 75 F, em comparação com a média do dispositivo de 33.9 °C / ### class_avg_f### F.
(-) Jogando The Witcher 3, a temperatura média para o lado superior é 38.8 °C / 102 F, em comparação com a média do dispositivo de 33.9 °C / ## #class_avg_f### F.
(+) Os apoios para as mãos e o touchpad estão atingindo a temperatura máxima da pele (32 °C / 89.6 F) e, portanto, não estão quentes.
(-) A temperatura média da área do apoio para as mãos de dispositivos semelhantes foi 28.8 °C / 83.8 F (-3.2 °C / -5.8 F).
| MSI GF63 Thin 9SC i5-9300H, GeForce GTX 1650 Max-Q | Dell G5 15 5590-PCNJJ i5-9300H, GeForce GTX 1650 Mobile | Acer Aspire Nitro 5 AN515-54-53Z2 i5-9300H, GeForce GTX 1650 Mobile | HP Omen 15-dc1020ng i5-9300H, GeForce GTX 1650 Mobile | Lenovo IdeaPad L340-15IRH 81LK00BMGE i5-9300H, GeForce GTX 1650 Mobile | Média da turma Gaming | |
|---|---|---|---|---|---|---|
| Heat | -4% | 2% | 6% | -8% | -13% | |
| Maximum Upper Side * (°C) | 47 | 49 -4% | 47 -0% | 40.3 14% | 44.8 5% | 45.2 ? 4% |
| Maximum Bottom * (°C) | 47 | 55 -17% | 50 -6% | 48.5 -3% | 58.1 -24% | 48 ? -2% |
| Idle Upper Side * (°C) | 26 | 25 4% | 24 8% | 23.9 8% | 27.9 -7% | 31.1 ? -20% |
| Idle Bottom * (°C) | 26 | 26 -0% | 25 4% | 24.6 5% | 27.9 -7% | 34.2 ? -32% |
* ... menor é melhor
MSI GF63 Thin 9SC análise de áudio
(+) | os alto-falantes podem tocar relativamente alto (###valor### dB)
Graves 100 - 315Hz
(-) | quase nenhum baixo - em média 19.5% menor que a mediana
(±) | a linearidade dos graves é média (10.9% delta para a frequência anterior)
Médios 400 - 2.000 Hz
(±) | médios mais altos - em média 7.7% maior que a mediana
(±) | a linearidade dos médios é média (9.9% delta para frequência anterior)
Altos 2 - 16 kHz
(+) | agudos equilibrados - apenas 1.8% longe da mediana
(+) | os máximos são lineares (6.3% delta da frequência anterior)
Geral 100 - 16.000 Hz
(±) | a linearidade do som geral é média (18.9% diferença em relação à mediana)
Comparado com a mesma classe
» 63% de todos os dispositivos testados nesta classe foram melhores, 8% semelhantes, 29% piores
» O melhor teve um delta de 6%, a média foi 18%, o pior foi 132%
Comparado com todos os dispositivos testados
» 44% de todos os dispositivos testados foram melhores, 8% semelhantes, 48% piores
» O melhor teve um delta de 4%, a média foi 24%, o pior foi 134%
Dell G5 15 5590-PCNJJ análise de áudio
(+) | os alto-falantes podem tocar relativamente alto (###valor### dB)
Graves 100 - 315Hz
(-) | quase nenhum baixo - em média 19.7% menor que a mediana
(±) | a linearidade dos graves é média (11.9% delta para a frequência anterior)
Médios 400 - 2.000 Hz
(±) | médios mais altos - em média 5.7% maior que a mediana
(+) | médios são lineares (4.9% delta para frequência anterior)
Altos 2 - 16 kHz
(±) | máximos reduzidos - em média 6.5% menor que a mediana
(±) | a linearidade dos máximos é média (9.6% delta para frequência anterior)
Geral 100 - 16.000 Hz
(±) | a linearidade do som geral é média (17.4% diferença em relação à mediana)
Comparado com a mesma classe
» 48% de todos os dispositivos testados nesta classe foram melhores, 12% semelhantes, 40% piores
» O melhor teve um delta de 6%, a média foi 18%, o pior foi 132%
Comparado com todos os dispositivos testados
» 33% de todos os dispositivos testados foram melhores, 8% semelhantes, 59% piores
» O melhor teve um delta de 4%, a média foi 24%, o pior foi 134%
| desligado | |
| Ocioso | |
| Carga |
|
Key:
min: | |
| MSI GF63 Thin 9SC i5-9300H, GeForce GTX 1650 Max-Q | Dell G5 15 5590-PCNJJ i5-9300H, GeForce GTX 1650 Mobile | Acer Aspire Nitro 5 AN515-54-53Z2 i5-9300H, GeForce GTX 1650 Mobile | HP Omen 15-dc1020ng i5-9300H, GeForce GTX 1650 Mobile | Lenovo IdeaPad L340-15IRH 81LK00BMGE i5-9300H, GeForce GTX 1650 Mobile | Média da turma Gaming | |
|---|---|---|---|---|---|---|
| Power Consumption | 9% | 8% | 9% | 20% | -76% | |
| Idle Minimum * (Watt) | 7 | 4 43% | 5 29% | 4.04 42% | 3.8 46% | 13.2 ? -89% |
| Idle Average * (Watt) | 9 | 7 22% | 7 22% | 7.2 20% | 6.6 27% | 18.9 ? -110% |
| Idle Maximum * (Watt) | 13 | 12 8% | 11 15% | 11.4 12% | 8.9 32% | 24.3 ? -87% |
| Load Average * (Watt) | 79 | 95 -20% | 89 -13% | 80.8 -2% | 78.4 1% | 108 ? -37% |
| Witcher 3 ultra * (Watt) | 73 | 86 -18% | 90 -23% | 93.6 -28% | 82 -12% | |
| Load Maximum * (Watt) | 164 | 135 18% | 132 20% | 144.5 12% | 124 24% | 254 ? -55% |
* ... menor é melhor
| MSI GF63 Thin 9SC i5-9300H, GeForce GTX 1650 Max-Q, 51 Wh | Dell G5 15 5590-PCNJJ i5-9300H, GeForce GTX 1650 Mobile, 60 Wh | Acer Aspire Nitro 5 AN515-54-53Z2 i5-9300H, GeForce GTX 1650 Mobile, 57 Wh | HP Omen 15-dc1020ng i5-9300H, GeForce GTX 1650 Mobile, 52.5 Wh | Lenovo IdeaPad L340-15IRH 81LK00BMGE i5-9300H, GeForce GTX 1650 Mobile, 45 Wh | Média da turma Gaming | |
|---|---|---|---|---|---|---|
| Duração da bateria | 79% | 71% | 44% | 5% | 28% | |
| Reader / Idle (h) | 8.5 | 14.5 71% | 17.4 105% | 15.9 87% | 7.8 -8% | 8.71 ? 2% |
| WiFi v1.3 (h) | 4.4 | 8 82% | 8.1 84% | 6.4 45% | 6.1 39% | 7.02 ? 60% |
| Load (h) | 1.2 | 2.2 83% | 1.5 25% | 1.2 0% | 1 -17% | 1.47 ? 23% |
| H.264 (h) | 8 | 8.26 ? | ||||
| Witcher 3 ultra (h) | 1 |
Pro
Contra
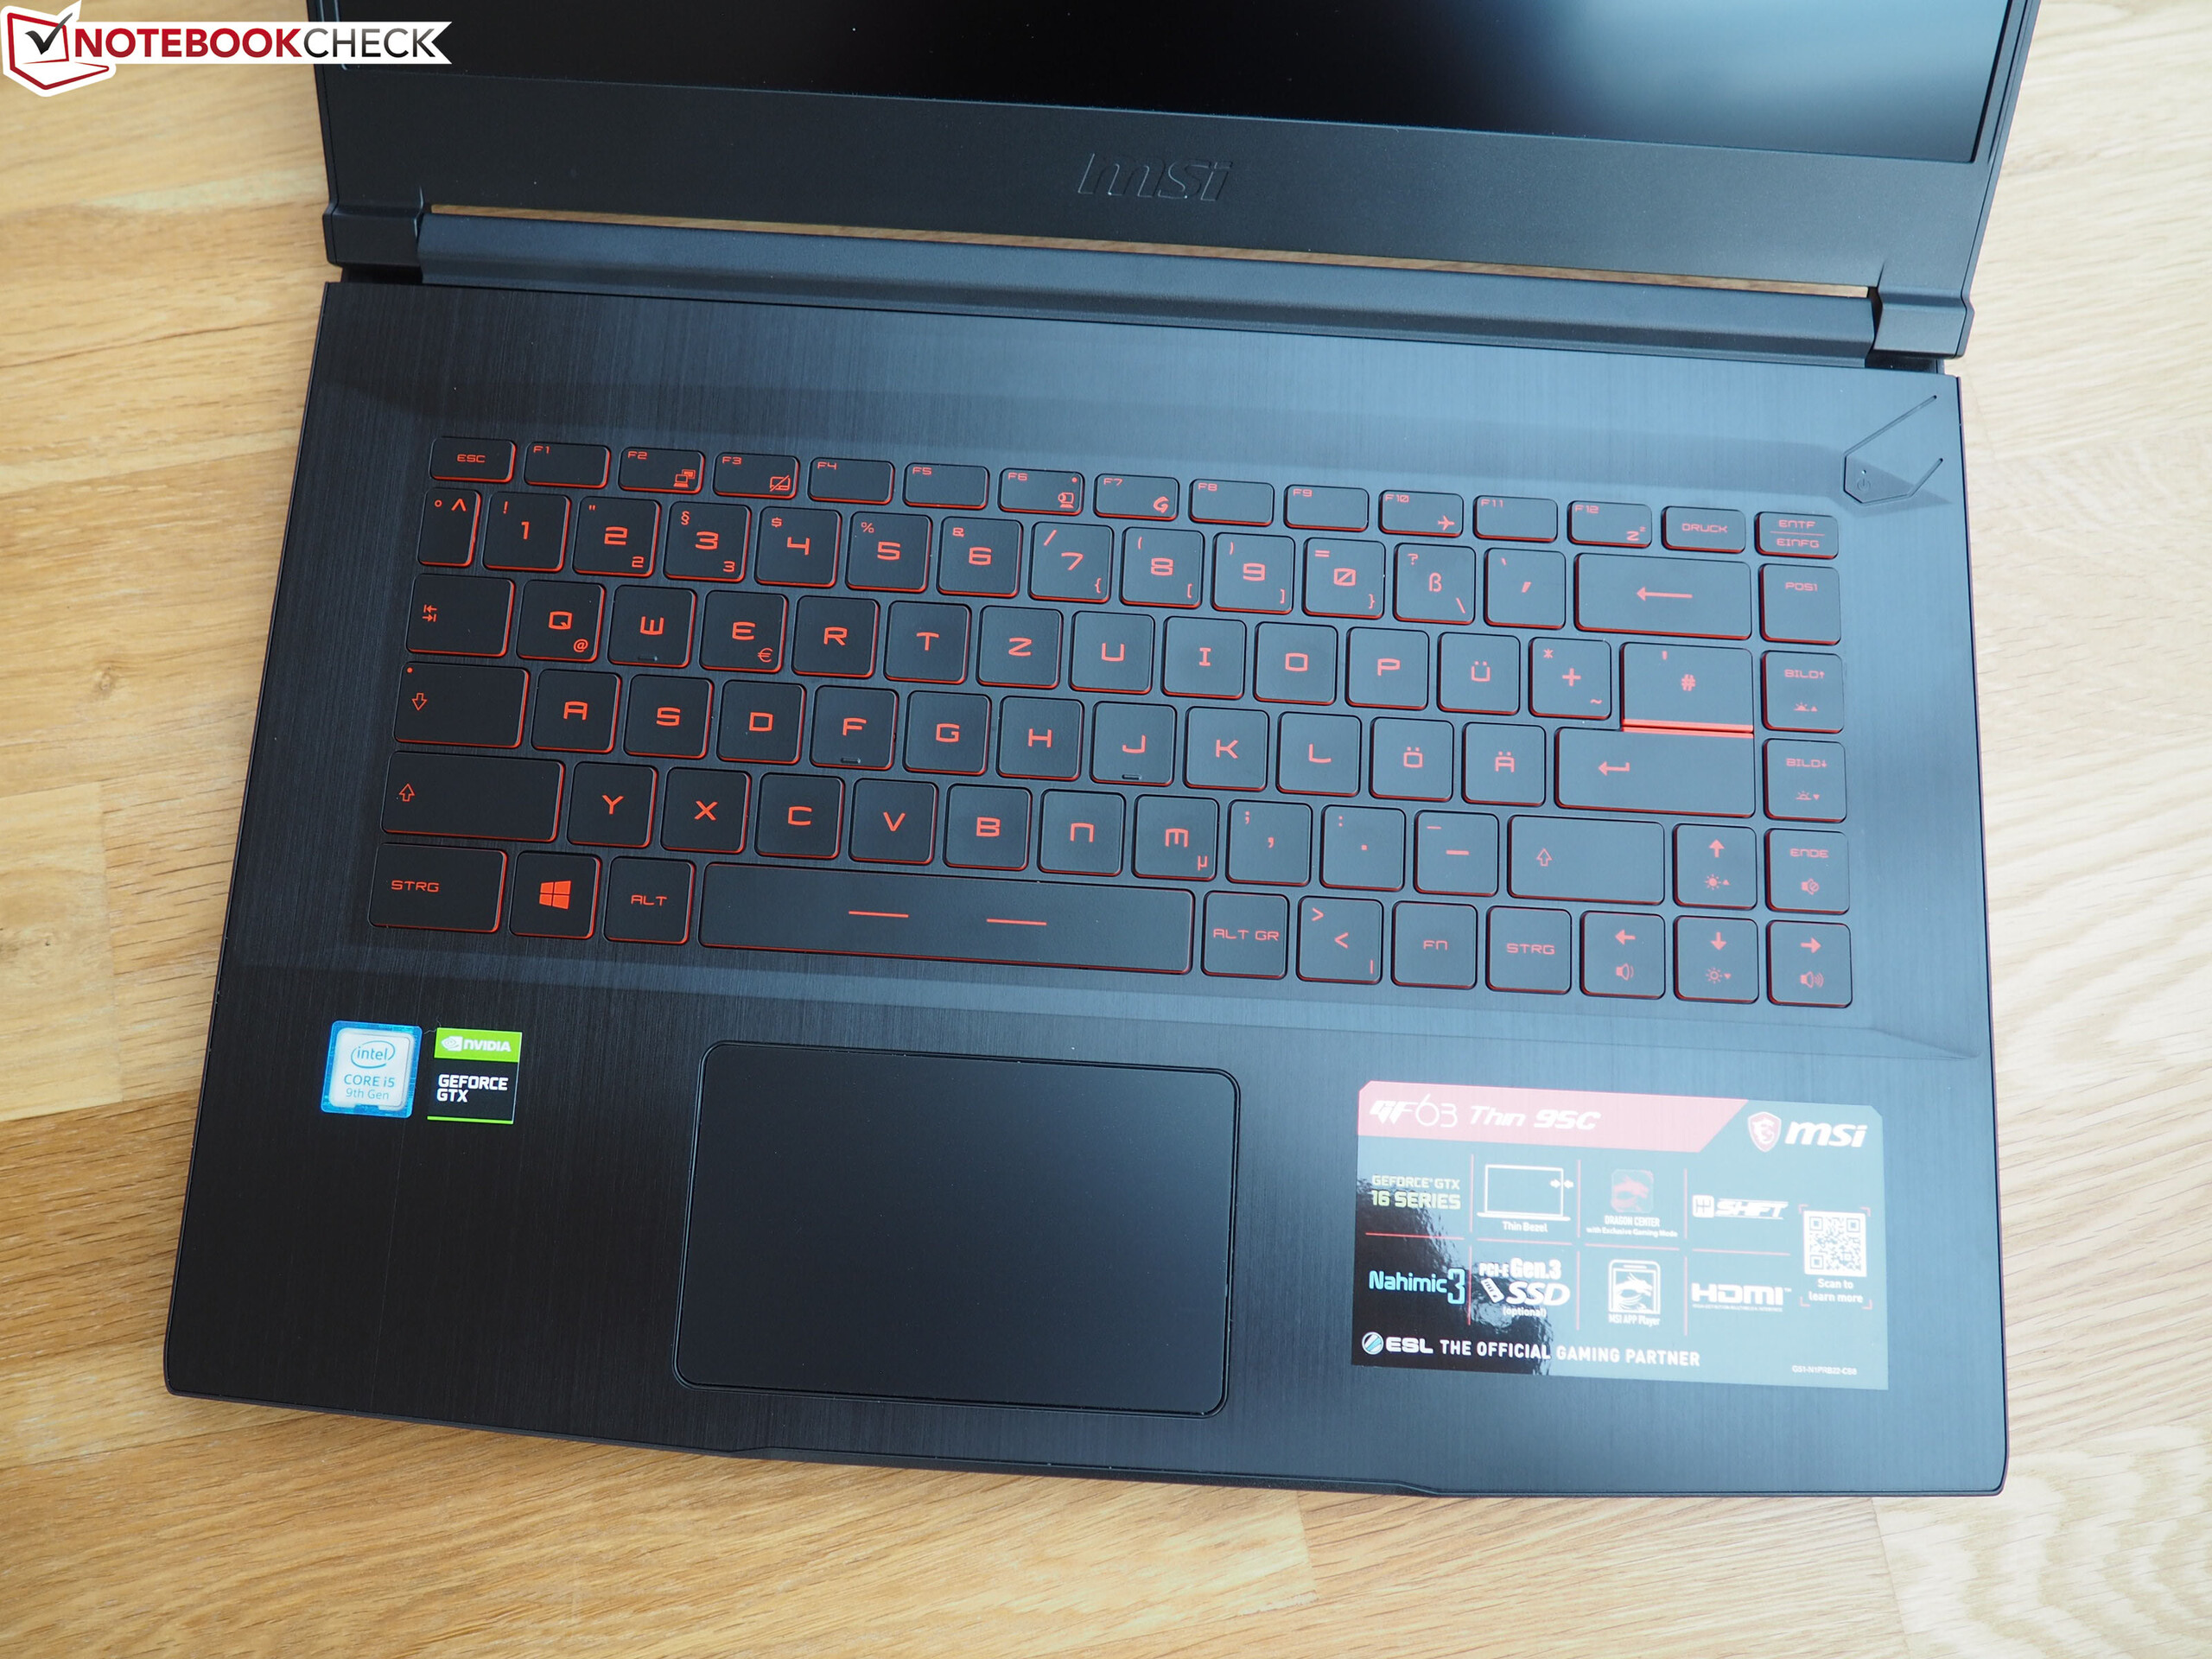
Se deixar de lado a escassa seleção de portas (sem leitor de cartões, sem DisplayPort, sem Thunderbolt 3 ou USB 3.1 Gen2), o controle do ventilador que poderia ser melhorado (modo inativo!) e a tela relativamente escura e lenta, o MSI GF63 Thin 9SC não apresenta maiores fraquezas.
O gamer de 15 polegadas é compacto, tem pouco peso e oferece uma boa relação de preço-desempenho, o que deve agradar os gamers que procuram um portátil para jogos portável e acessível. Os dispositivos de entrada, duração da bateria, qualidade da carcaça e desempenho, são todos adequados para este preço de compra.
Mas este é um campo muito competitivo e existem alternativas similares ou até melhores disponíveis, de outros fabricantes (como Dell, Acer, HP e Lenovo).
MSI GF63 Thin 9SC
- 05/14/2020 v7 (old)
Florian Glaser
Price comparison