Breve Análise do Portátil MSI GF63 8RC (i5-8300H, GTX 1050)
| Networking | |
| iperf3 transmit AX12 | |
| Asus Strix GL504GM | |
| MSI GS65 Stealth Thin 8RE-051US | |
| Dell G5 15 5587 | |
| MSI GF62VR 7RF-877 | |
| MSI GF63 8RC | |
| iperf3 receive AX12 | |
| MSI GS65 Stealth Thin 8RE-051US | |
| MSI GF62VR 7RF-877 | |
| Asus Strix GL504GM | |
| Dell G5 15 5587 | |
| MSI GF63 8RC | |
| |||||||||||||||||||||||||
iluminação: 89 %
iluminação com acumulador: 266.6 cd/m²
Contraste: 919:1 (Preto: 0.29 cd/m²)
ΔE ColorChecker Calman: 5.93 | ∀{0.5-29.43 Ø4.71}
calibrated: 3.6
ΔE Greyscale Calman: 6.8 | ∀{0.09-98 Ø4.96}
59.3% sRGB (Argyll 1.6.3 3D)
37.6% AdobeRGB 1998 (Argyll 1.6.3 3D)
40.73% AdobeRGB 1998 (Argyll 3D)
59.3% sRGB (Argyll 3D)
39.43% Display P3 (Argyll 3D)
Gamma: 2.43
CCT: 7192 K
| MSI GF63 8RC AU Optronics B156HAN02.1, IPS, 15.6", 1920x1080 | MSI GS65 Stealth Thin 8RE-051US AUO80ED, IPS, 15.6", 1920x1080 | Asus Strix GL504GM AU Optronics B156HAN08.2 (AUO82ED), IPS, 15.6", 1920x1080 | Acer Aspire 7 A715-71G-53TU BOE NV156FHM-N42 , a-Si TFT-LCD, IPS, 15.6", 1920x1080 | MSI GF62VR 7RF-877 Chi Mei N156HGA-EAL, TN LED, 15.6", 1920x1080 | Dell G5 15 5587 LGD053F, 156WF6, IPS, 15.6", 1920x1080 | |
|---|---|---|---|---|---|---|
| Display | 62% | 62% | 2% | 97% | -3% | |
| Display P3 Coverage (%) | 39.43 | 65.8 67% | 65.3 66% | 40.53 3% | 85.6 117% | 38.13 -3% |
| sRGB Coverage (%) | 59.3 | 92.1 55% | 92.8 56% | 59.9 1% | 99.9 68% | 56.8 -4% |
| AdobeRGB 1998 Coverage (%) | 40.73 | 67 64% | 66.7 64% | 41.87 3% | 83.9 106% | 39.47 -3% |
| Response Times | 48% | 70% | -40% | -20% | 7% | |
| Response Time Grey 50% / Grey 80% * (ms) | 33.2 ? | 20 ? 40% | 7.8 ? 77% | 49 ? -48% | 49.6 ? -49% | 33 ? 1% |
| Response Time Black / White * (ms) | 27.2 ? | 12 ? 56% | 10.4 ? 62% | 36 ? -32% | 24.4 ? 10% | 24 ? 12% |
| PWM Frequency (Hz) | 20000 ? | 25510 ? | ||||
| Screen | 24% | 29% | 11% | -19% | -7% | |
| Brightness middle (cd/m²) | 266.6 | 250.9 -6% | 350 31% | 267 0% | 223.9 -16% | 229 -14% |
| Brightness (cd/m²) | 257 | 257 0% | 338 32% | 250 -3% | 208 -19% | 224 -13% |
| Brightness Distribution (%) | 89 | 83 -7% | 90 1% | 82 -8% | 88 -1% | 87 -2% |
| Black Level * (cd/m²) | 0.29 | 0.32 -10% | 0.33 -14% | 0.31 -7% | 0.56 -93% | 0.28 3% |
| Contrast (:1) | 919 | 784 -15% | 1061 15% | 861 -6% | 400 -56% | 818 -11% |
| Colorchecker dE 2000 * | 5.93 | 2.77 53% | 4.3 27% | 4.65 22% | 9.7 -64% | 6.1 -3% |
| Colorchecker dE 2000 max. * | 16.28 | 5.89 64% | 7.78 52% | 8.2 50% | 19.7 -21% | 12.2 25% |
| Colorchecker dE 2000 calibrated * | 3.6 | 2.5 31% | 2.83 21% | 6.12 -70% | ||
| Greyscale dE 2000 * | 6.8 | 4 41% | 4.4 35% | 2.65 61% | 12.9 -90% | 5.68 16% |
| Gamma | 2.43 91% | 2.27 97% | 2.26 97% | 2.44 90% | 2.18 101% | 2.4 92% |
| CCT | 7192 90% | 6901 94% | 7517 86% | 6820 95% | 15225 43% | 6989 93% |
| Color Space (Percent of AdobeRGB 1998) (%) | 37.6 | 60 60% | 60 60% | 38 1% | 75 99% | 36 -4% |
| Color Space (Percent of sRGB) (%) | 59.3 | 92 55% | 92.5 56% | 59 -1% | 100 69% | 57 -4% |
| Média Total (Programa/Configurações) | 45% /
34% | 54% /
40% | -9% /
2% | 19% /
4% | -1% /
-5% |
* ... menor é melhor
Exibir tempos de resposta
| ↔ Tempo de resposta preto para branco | ||
|---|---|---|
| 27.2 ms ... ascensão ↗ e queda ↘ combinadas | ↗ 15.6 ms ascensão | 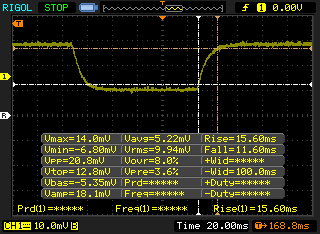 |
| ↘ 11.6 ms queda | ||
| A tela mostra taxas de resposta relativamente lentas em nossos testes e pode ser muito lenta para os jogadores. Em comparação, todos os dispositivos testados variam de 0.1 (mínimo) a 240 (máximo) ms. » 69 % de todos os dispositivos são melhores. Isso significa que o tempo de resposta medido é pior que a média de todos os dispositivos testados (19.8 ms). | ||
| ↔ Tempo de resposta 50% cinza a 80% cinza | ||
| 33.2 ms ... ascensão ↗ e queda ↘ combinadas | ↗ 15.2 ms ascensão | 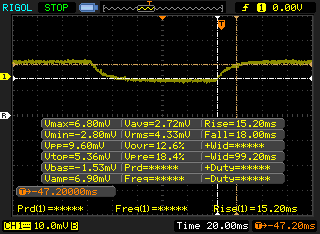 |
| ↘ 18 ms queda | ||
| A tela mostra taxas de resposta lentas em nossos testes e será insatisfatória para os jogadores. Em comparação, todos os dispositivos testados variam de 0.165 (mínimo) a 636 (máximo) ms. » 46 % de todos os dispositivos são melhores. Isso significa que o tempo de resposta medido é semelhante à média de todos os dispositivos testados (31 ms). | ||
Cintilação da tela / PWM (modulação por largura de pulso)
| Tela tremeluzindo / PWM não detectado | 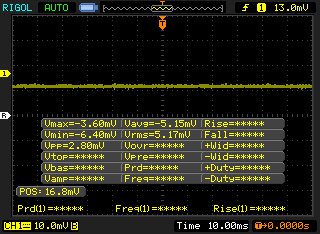 | ||
[pwm_comparison] Em comparação: 52 % de todos os dispositivos testados não usam PWM para escurecer a tela. Se PWM foi detectado, uma média de 7757 (mínimo: 5 - máximo: 343500) Hz foi medida. | |||
| PCMark 8 Home Score Accelerated v2 | 3704 pontos | |
| PCMark 8 Work Score Accelerated v2 | 4609 pontos | |
| PCMark 10 Score | 3711 pontos | |
Ajuda | ||
| MSI GF63 8RC Seagate BarraCuda Pro Compute 1TB ST1000LM049 | Panasonic Toughbook CF-54G2999VM Seagate BarraCuda Compute 1TB ST1000LM048 | Lenovo IdeaPad 330-15ARR-81D2005JGE Seagate Mobile HDD 1TB ST1000LM035 | Dell G3 15 3579 Seagate Mobile HDD 1TB ST1000LX015-1U7172 | Dell Latitude 15 3590-K8JP Toshiba MQ01ACF050 | |
|---|---|---|---|---|---|
| CrystalDiskMark 5.2 / 6 | -14% | -39% | -40% | -13% | |
| Write 4K (MB/s) | 1.244 | 1.145 -8% | 0.217 -83% | 0.202 -84% | 1.216 -2% |
| Read 4K (MB/s) | 0.544 | 0.453 -17% | 0.367 -33% | 0.461 -15% | 0.451 -17% |
| Write Seq (MB/s) | 97.1 | 52.2 -46% | 98.8 2% | 53.5 -45% | 117.6 21% |
| Read Seq (MB/s) | 162.1 | 122.7 -24% | 131.1 -19% | 107.2 -34% | 120 -26% |
| Write 4K Q32T1 (MB/s) | 1.674 | 2.428 45% | 0.222 -87% | 0.882 -47% | 1.212 -28% |
| Read 4K Q32T1 (MB/s) | 0.998 | 1.063 7% | 0.781 -22% | 1.057 6% | 0.844 -15% |
| Write Seq Q32T1 (MB/s) | 134.8 | 73.7 -45% | 97 -28% | 63.7 -53% | 115.1 -15% |
| Read Seq Q32T1 (MB/s) | 154.8 | 120.4 -22% | 93.3 -40% | 77.1 -50% | 121.6 -21% |

| 3DMark | |
| 1280x720 Cloud Gate Standard Graphics | |
| MSI GT63 Titan 8RG-046 | |
| MSI Gaming Z GeForce GTX 1070 OC Bios Desktop PC | |
| MSI GS65 Stealth Thin 8RE-051US | |
| MSI GP62 7REX-1045US | |
| MSI GE72-6QF8H11 | |
| MSI GV72 7RD-1048XPL | |
| MSI GF63 8RC | |
| Média NVIDIA GeForce GTX 1050 Mobile (14979 - 40201, n=40) | |
| MSI GL62-6QFi781H11 | |
| MSI Prestige PS42 8RB-059 | |
| 1920x1080 Fire Strike Graphics | |
| MSI GT63 Titan 8RG-046 | |
| MSI Gaming Z GeForce GTX 1070 OC Bios Desktop PC | |
| MSI GS65 Stealth Thin 8RE-051US | |
| MSI GP62 7REX-1045US | |
| MSI GE72-6QF8H11 | |
| Dell XPS 15 9570 i7 UHD | |
| MSI GV72 7RD-1048XPL | |
| MSI GF63 8RC | |
| Média NVIDIA GeForce GTX 1050 Mobile (4935 - 6651, n=43) | |
| MSI GL62-6QFi781H11 | |
| MSI Prestige PS42 8RB-059 | |
| 3DMark 11 | |
| 1280x720 Performance GPU | |
| MSI GT63 Titan 8RG-046 | |
| MSI Gaming Z GeForce GTX 1070 OC Bios Desktop PC | |
| MSI GS65 Stealth Thin 8RE-051US | |
| MSI GE72-6QF8H11 | |
| MSI GP62 7REX-1045US | |
| Dell XPS 15 9570 i7 UHD | |
| MSI GV72 7RD-1048XPL | |
| Média NVIDIA GeForce GTX 1050 Mobile (6744 - 8903, n=42) | |
| MSI GF63 8RC | |
| MSI GL62-6QFi781H11 | |
| MSI Prestige PS42 8RB-059 | |
| 1280x720 Performance Combined | |
| MSI Gaming Z GeForce GTX 1070 OC Bios Desktop PC | |
| MSI GS65 Stealth Thin 8RE-051US | |
| MSI GT63 Titan 8RG-046 | |
| Dell XPS 15 9570 i7 UHD | |
| MSI GF63 8RC | |
| MSI GP62 7REX-1045US | |
| Média NVIDIA GeForce GTX 1050 Mobile (4446 - 7607, n=42) | |
| MSI GV72 7RD-1048XPL | |
| MSI GE72-6QF8H11 | |
| MSI GL62-6QFi781H11 | |
| MSI Prestige PS42 8RB-059 | |
| 3DMark 11 Performance | 7529 pontos | |
| 3DMark Cloud Gate Standard Score | 19994 pontos | |
| 3DMark Fire Strike Score | 5511 pontos | |
Ajuda | ||
| baixo | média | alto | ultra | |
|---|---|---|---|---|
| BioShock Infinite (2013) | 234.1 | 180.8 | 159.8 | 64.5 |
| The Witcher 3 (2015) | 123.5 | 72.5 | 40.1 | 20.6 |
| Rise of the Tomb Raider (2016) | 124.7 | 72.8 | 38.6 | 33.7 |
Barulho
| Ocioso |
| 33.8 / 34 / 34.2 dB |
| Carga |
| 37.3 / 46 dB |
 | ||
30 dB silencioso 40 dB(A) audível 50 dB(A) ruidosamente alto |
||
min: | ||
| MSI GF63 8RC GeForce GTX 1050 Mobile, i5-8300H, Seagate BarraCuda Pro Compute 1TB ST1000LM049 | MSI GS65 Stealth Thin 8RE-051US GeForce GTX 1060 Mobile, i7-8750H, Samsung SSD PM981 MZVLB256HAHQ | Asus Strix GL504GM GeForce GTX 1060 Mobile, i7-8750H, Toshiba NVMe THNSN5256GPU7 | Acer Aspire 7 A715-71G-53TU GeForce GTX 1050 Mobile, i5-7300HQ, Kingston RBUSNS8180DS3128GH | MSI GF62VR 7RF-877 GeForce GTX 1060 Mobile, i7-7700HQ, Intel SSD 600p SSDPEKKW256G7 | Dell G5 15 5587 GeForce GTX 1060 Max-Q, i5-8300H, SK hynix SC311 M.2 | |
|---|---|---|---|---|---|---|
| Noise | 3% | 0% | 6% | -5% | 3% | |
| desligado / ambiente * (dB) | 28 | 28.4 -1% | 28.5 -2% | 30.4 -9% | 28.1 -0% | 30.3 -8% |
| Idle Minimum * (dB) | 33.8 | 28.4 16% | 30 11% | 30.4 10% | 33.5 1% | 31.1 8% |
| Idle Average * (dB) | 34 | 28.4 16% | 30 12% | 30.8 9% | 33.5 1% | 31.1 9% |
| Idle Maximum * (dB) | 34.2 | 29.6 13% | 30 12% | 30.8 10% | 33.5 2% | 34.2 -0% |
| Load Average * (dB) | 37.3 | 43.5 -17% | 41.8 -12% | 33.6 10% | 41.3 -11% | 34.9 6% |
| Witcher 3 ultra * (dB) | 43.4 | 45.7 -5% | 47.6 -10% | 48.5 -12% | 42.7 2% | |
| Load Maximum * (dB) | 46 | 45.7 1% | 50 -9% | 43.4 6% | 53.5 -16% | 44 4% |
* ... menor é melhor
(-) A temperatura máxima no lado superior é 50.8 °C / 123 F, em comparação com a média de 40.4 °C / 105 F , variando de 21.2 a 68.8 °C para a classe Gaming.
(-) A parte inferior aquece até um máximo de 52 °C / 126 F, em comparação com a média de 43.2 °C / 110 F
(+) Em uso inativo, a temperatura média para o lado superior é 29.3 °C / 85 F, em comparação com a média do dispositivo de 33.9 °C / ### class_avg_f### F.
(-) Jogando The Witcher 3, a temperatura média para o lado superior é 39.9 °C / 104 F, em comparação com a média do dispositivo de 33.9 °C / ## #class_avg_f### F.
(+) Os apoios para as mãos e o touchpad estão atingindo a temperatura máxima da pele (33.6 °C / 92.5 F) e, portanto, não estão quentes.
(-) A temperatura média da área do apoio para as mãos de dispositivos semelhantes foi 28.8 °C / 83.8 F (-4.8 °C / -8.7 F).
MSI GF63 8RC análise de áudio
(-) | alto-falantes não muito altos (###valor### dB)
Graves 100 - 315Hz
(-) | quase nenhum baixo - em média 18.9% menor que a mediana
(±) | a linearidade dos graves é média (13.8% delta para a frequência anterior)
Médios 400 - 2.000 Hz
(+) | médios equilibrados - apenas 1.6% longe da mediana
(+) | médios são lineares (6.7% delta para frequência anterior)
Altos 2 - 16 kHz
(+) | agudos equilibrados - apenas 1.2% longe da mediana
(+) | os máximos são lineares (4.6% delta da frequência anterior)
Geral 100 - 16.000 Hz
(±) | a linearidade do som geral é média (18.5% diferença em relação à mediana)
Comparado com a mesma classe
» 60% de todos os dispositivos testados nesta classe foram melhores, 8% semelhantes, 32% piores
» O melhor teve um delta de 6%, a média foi 18%, o pior foi 132%
Comparado com todos os dispositivos testados
» 42% de todos os dispositivos testados foram melhores, 8% semelhantes, 51% piores
» O melhor teve um delta de 4%, a média foi 23%, o pior foi 134%
Apple MacBook 12 (Early 2016) 1.1 GHz análise de áudio
(+) | os alto-falantes podem tocar relativamente alto (###valor### dB)
Graves 100 - 315Hz
(±) | graves reduzidos - em média 11.3% menor que a mediana
(±) | a linearidade dos graves é média (14.2% delta para a frequência anterior)
Médios 400 - 2.000 Hz
(+) | médios equilibrados - apenas 2.4% longe da mediana
(+) | médios são lineares (5.5% delta para frequência anterior)
Altos 2 - 16 kHz
(+) | agudos equilibrados - apenas 2% longe da mediana
(+) | os máximos são lineares (4.5% delta da frequência anterior)
Geral 100 - 16.000 Hz
(+) | o som geral é linear (10.2% diferença em relação à mediana)
Comparado com a mesma classe
» 7% de todos os dispositivos testados nesta classe foram melhores, 2% semelhantes, 90% piores
» O melhor teve um delta de 5%, a média foi 18%, o pior foi 53%
Comparado com todos os dispositivos testados
» 5% de todos os dispositivos testados foram melhores, 1% semelhantes, 94% piores
» O melhor teve um delta de 4%, a média foi 23%, o pior foi 134%
| desligado | |
| Ocioso | |
| Carga |
|
Key:
min: | |
| MSI GF63 8RC i5-8300H, GeForce GTX 1050 Mobile, Seagate BarraCuda Pro Compute 1TB ST1000LM049, IPS, 1920x1080, 15.6" | MSI GF62VR 7RF-877 i7-7700HQ, GeForce GTX 1060 Mobile, Intel SSD 600p SSDPEKKW256G7, TN LED, 1920x1080, 15.6" | MSI GL63 8RC-069US i5-8300H, GeForce GTX 1050 Mobile, Toshiba HG6 THNSNJ256G8NY, IPS, 1920x1080, 15.6" | Asus Strix GL504GM i7-8750H, GeForce GTX 1060 Mobile, Toshiba NVMe THNSN5256GPU7, IPS, 1920x1080, 15.6" | Dell G5 15 5587 i5-8300H, GeForce GTX 1060 Max-Q, SK hynix SC311 M.2, IPS, 1920x1080, 15.6" | |
|---|---|---|---|---|---|
| Power Consumption | -71% | -7% | -60% | -1% | |
| Idle Minimum * (Watt) | 5.4 | 16.2 -200% | 7.1 -31% | 10 -85% | 4.9 9% |
| Idle Average * (Watt) | 10.4 | 18.2 -75% | 9.8 6% | 16.9 -62% | 8.5 18% |
| Idle Maximum * (Watt) | 10.5 | 18.9 -80% | 10.4 1% | 21.1 -101% | 9.1 13% |
| Load Average * (Watt) | 84.7 | 82.7 2% | 88.8 -5% | 112.4 -33% | 90.7 -7% |
| Witcher 3 ultra * (Watt) | 92.7 | 125.7 -36% | 93.3 -1% | 135.5 -46% | 110 -19% |
| Load Maximum * (Watt) | 119.9 | 162.3 -35% | 132.5 -11% | 157.3 -31% | 144 -20% |
* ... menor é melhor
| MSI GF63 8RC i5-8300H, GeForce GTX 1050 Mobile, 51 Wh | MSI GS65 Stealth Thin 8RE-051US i7-8750H, GeForce GTX 1060 Mobile, 82 Wh | Asus Strix GL504GM i7-8750H, GeForce GTX 1060 Mobile, 66 Wh | Acer Aspire 7 A715-71G-53TU i5-7300HQ, GeForce GTX 1050 Mobile, 48 Wh | MSI GF62VR 7RF-877 i7-7700HQ, GeForce GTX 1060 Mobile, 41 Wh | Dell G5 15 5587 i5-8300H, GeForce GTX 1060 Max-Q, 56 Wh | |
|---|---|---|---|---|---|---|
| Duração da bateria | 23% | 7% | 28% | -53% | 62% | |
| Reader / Idle (h) | 9.5 | 9.9 4% | 2.8 -71% | 11.8 24% | ||
| WiFi v1.3 (h) | 5.5 | 6.2 13% | 5.9 7% | 5.6 2% | 1.9 -65% | 6.5 18% |
| Load (h) | 0.9 | 1.2 33% | 1.6 78% | 0.7 -22% | 2.2 144% |
Pro
Contra
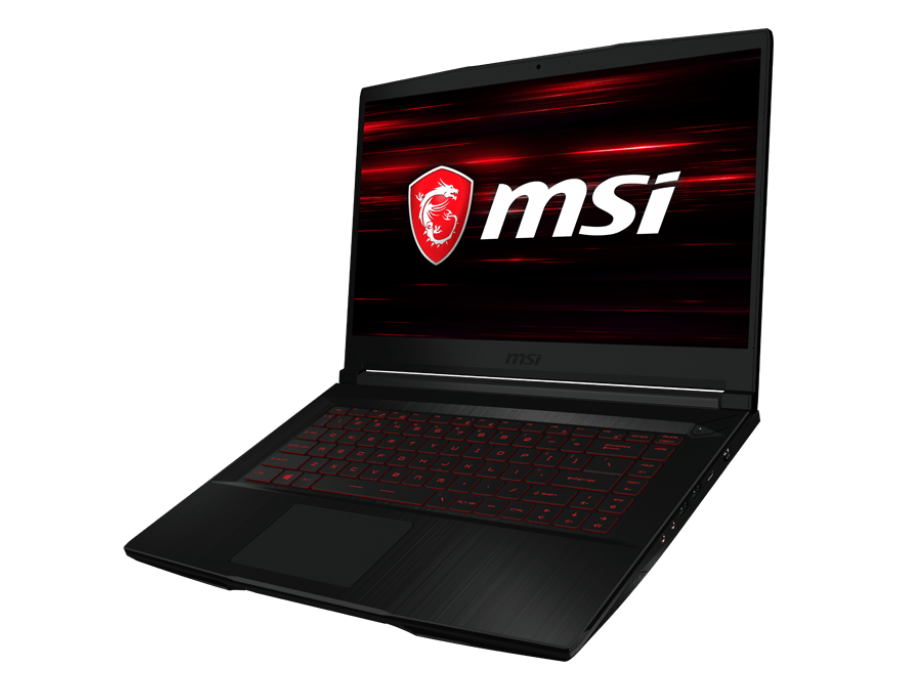
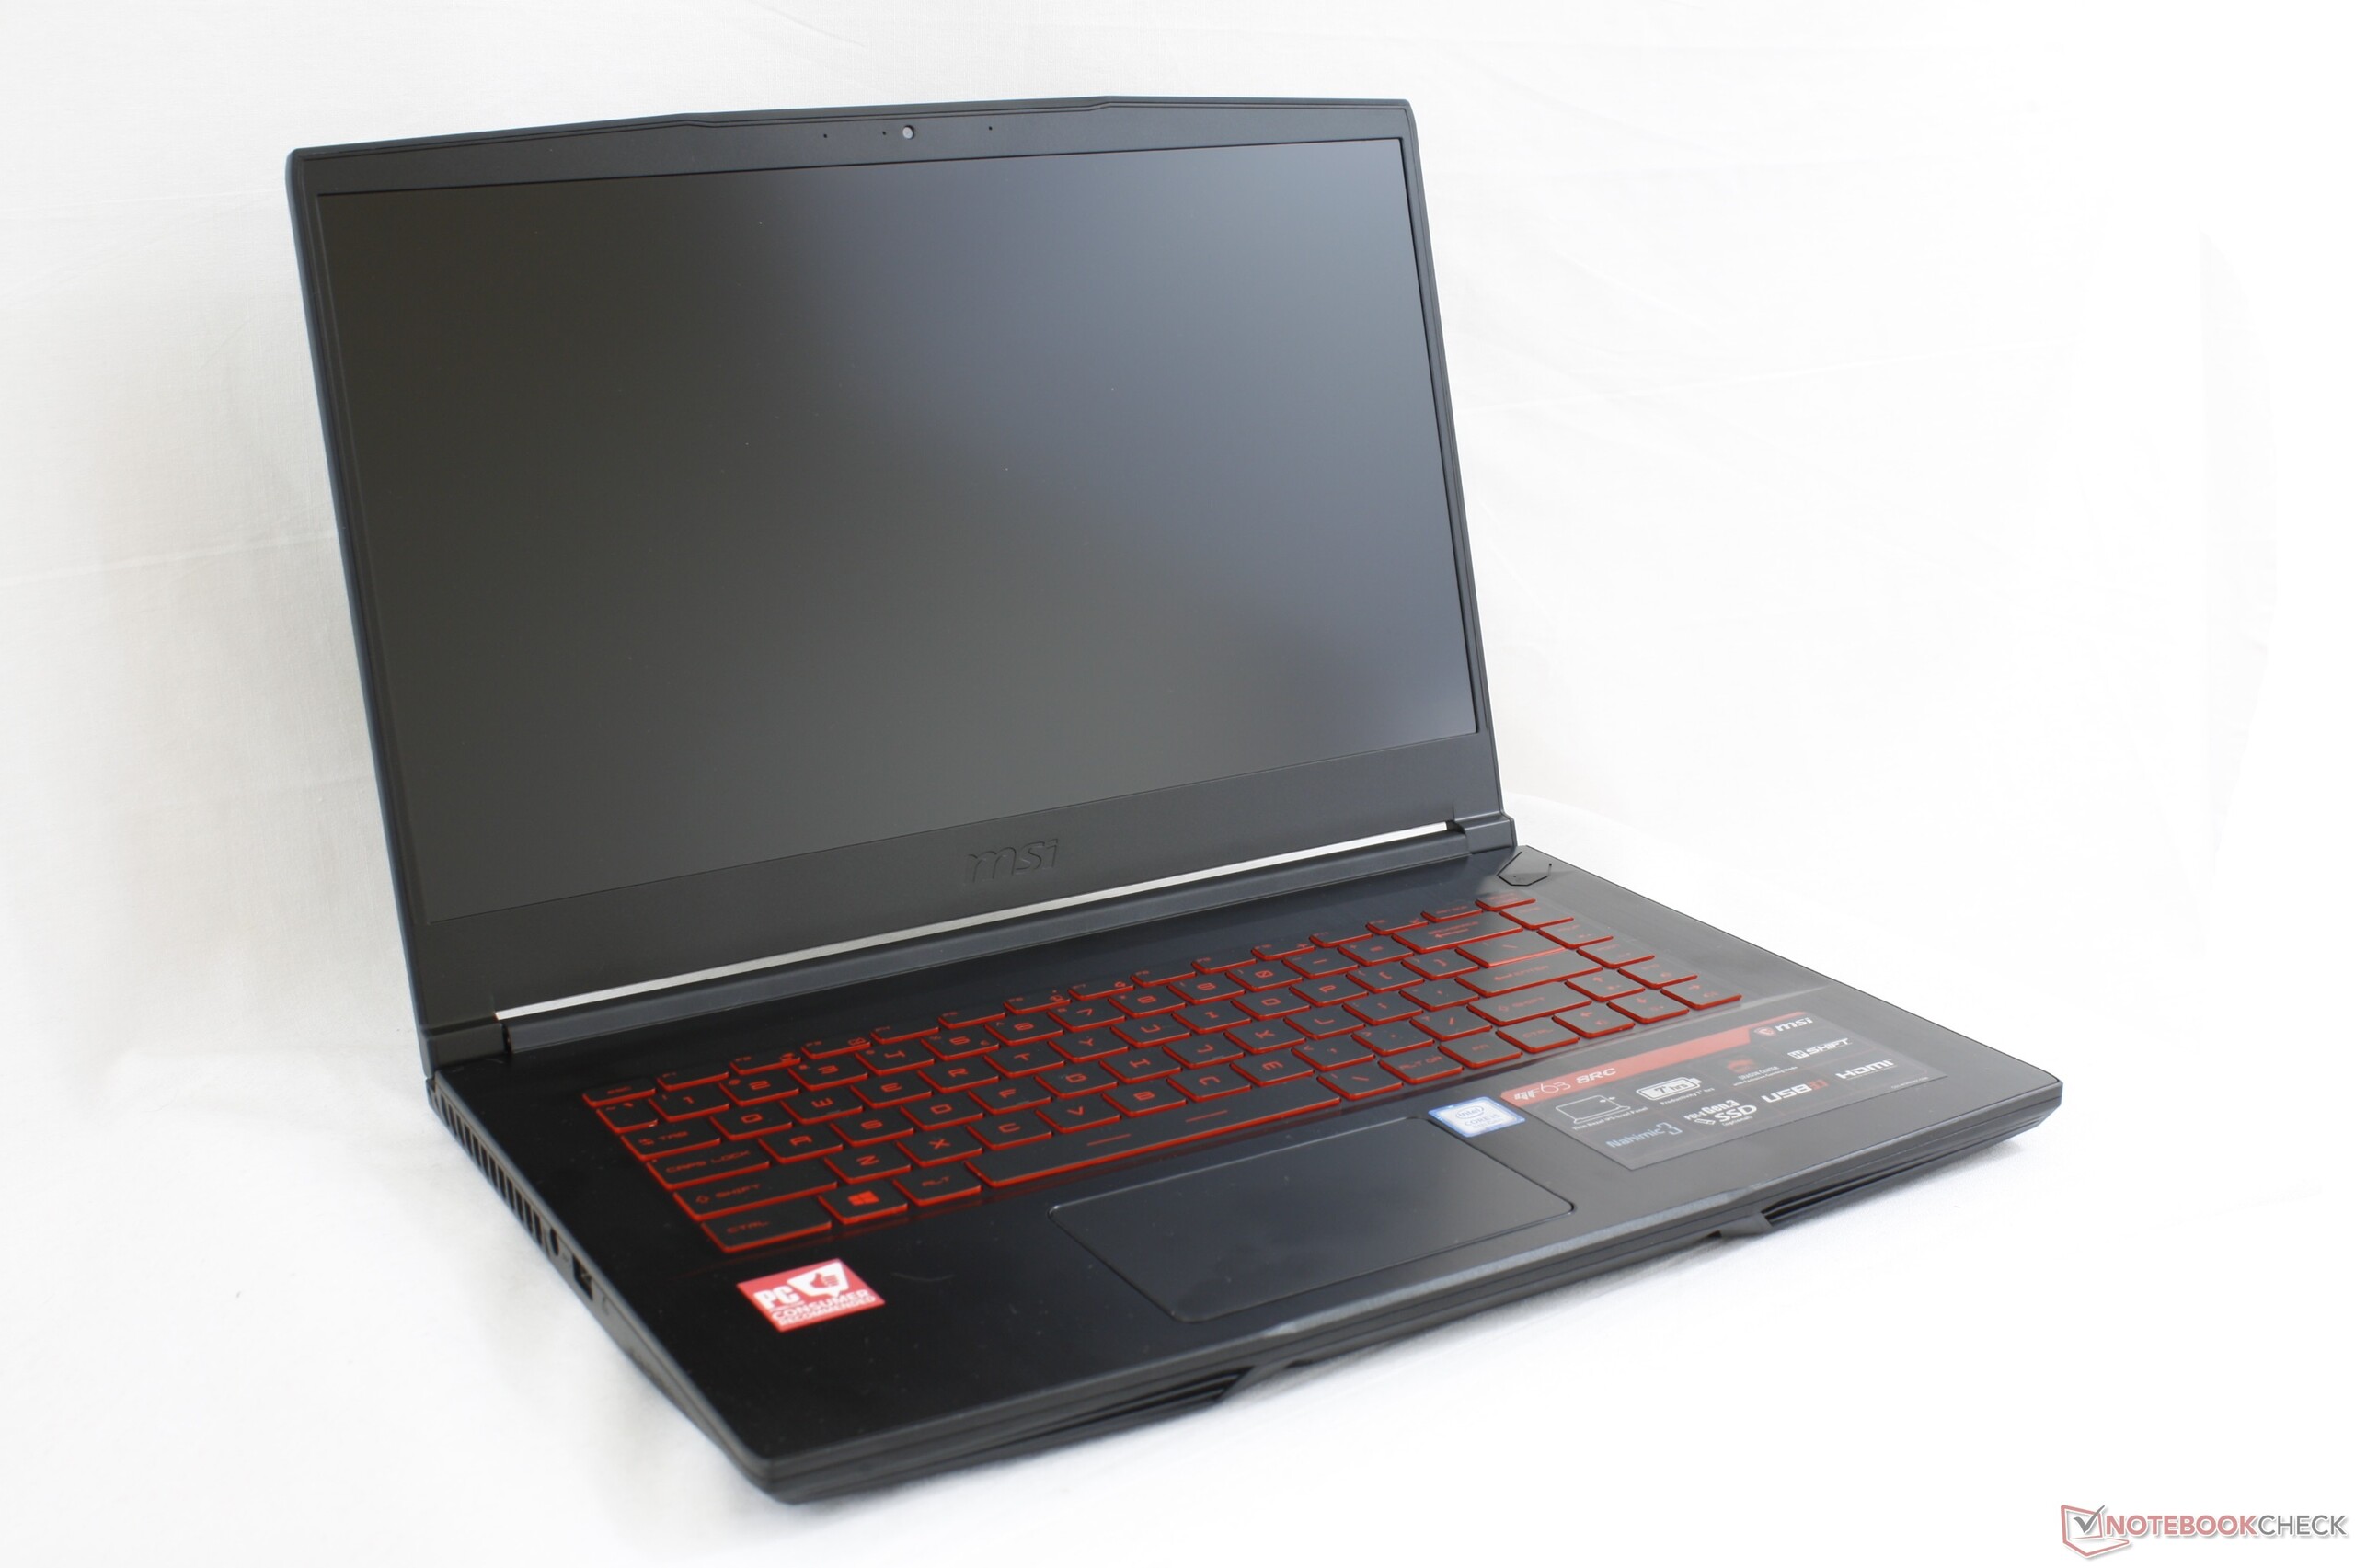
O MSI GF63 reduz o preço de entrada para portáteis de jogos com borda estreita para apenas $750 e é significativamente mais leve e menor que os concorrentes em sua faixa de preço. Se você quer um portátil para jogos convencionais que também seja portátil o suficiente para trabalhos escolares, por menos de 1.000 USD, então o GF63 é uma excelente opção. Sua combinação de desempenho de jogos, acessibilidade e mobilidade era inédita há apenas um ano, quando os marcos estreitos eram limitados a modelos caros como o XPS 15 9560 ou Gigabyte Aero 15X.
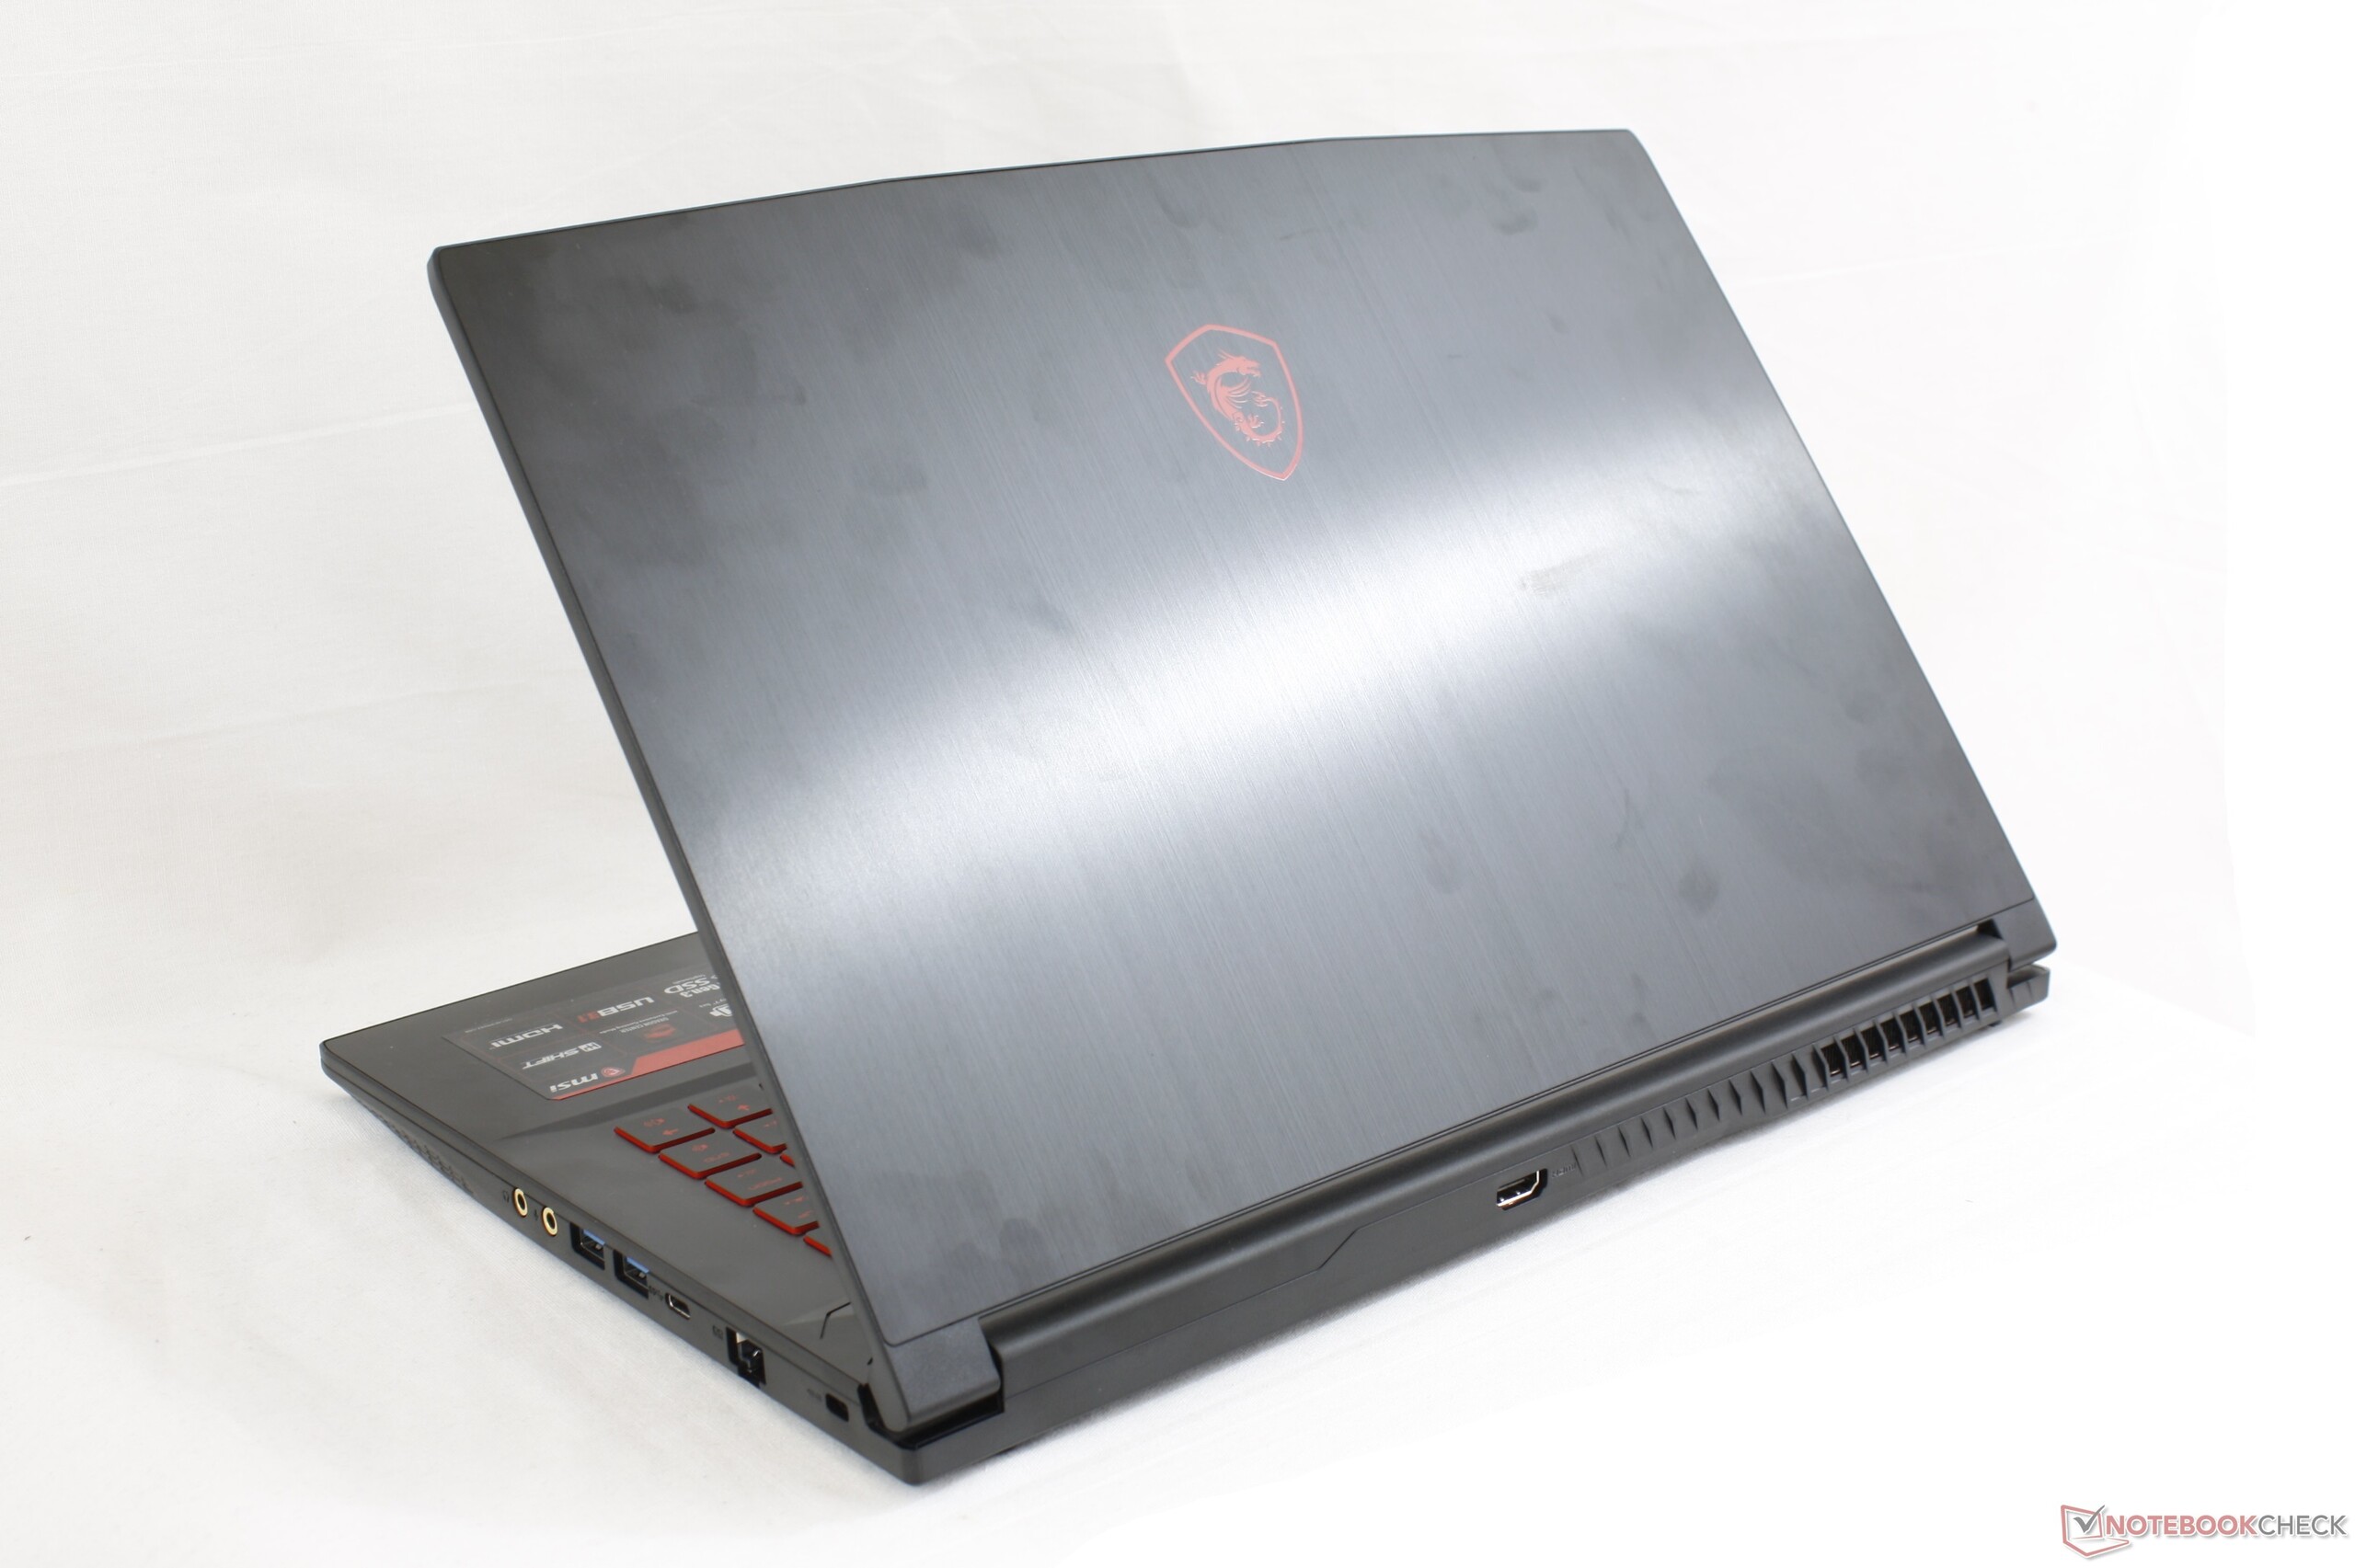
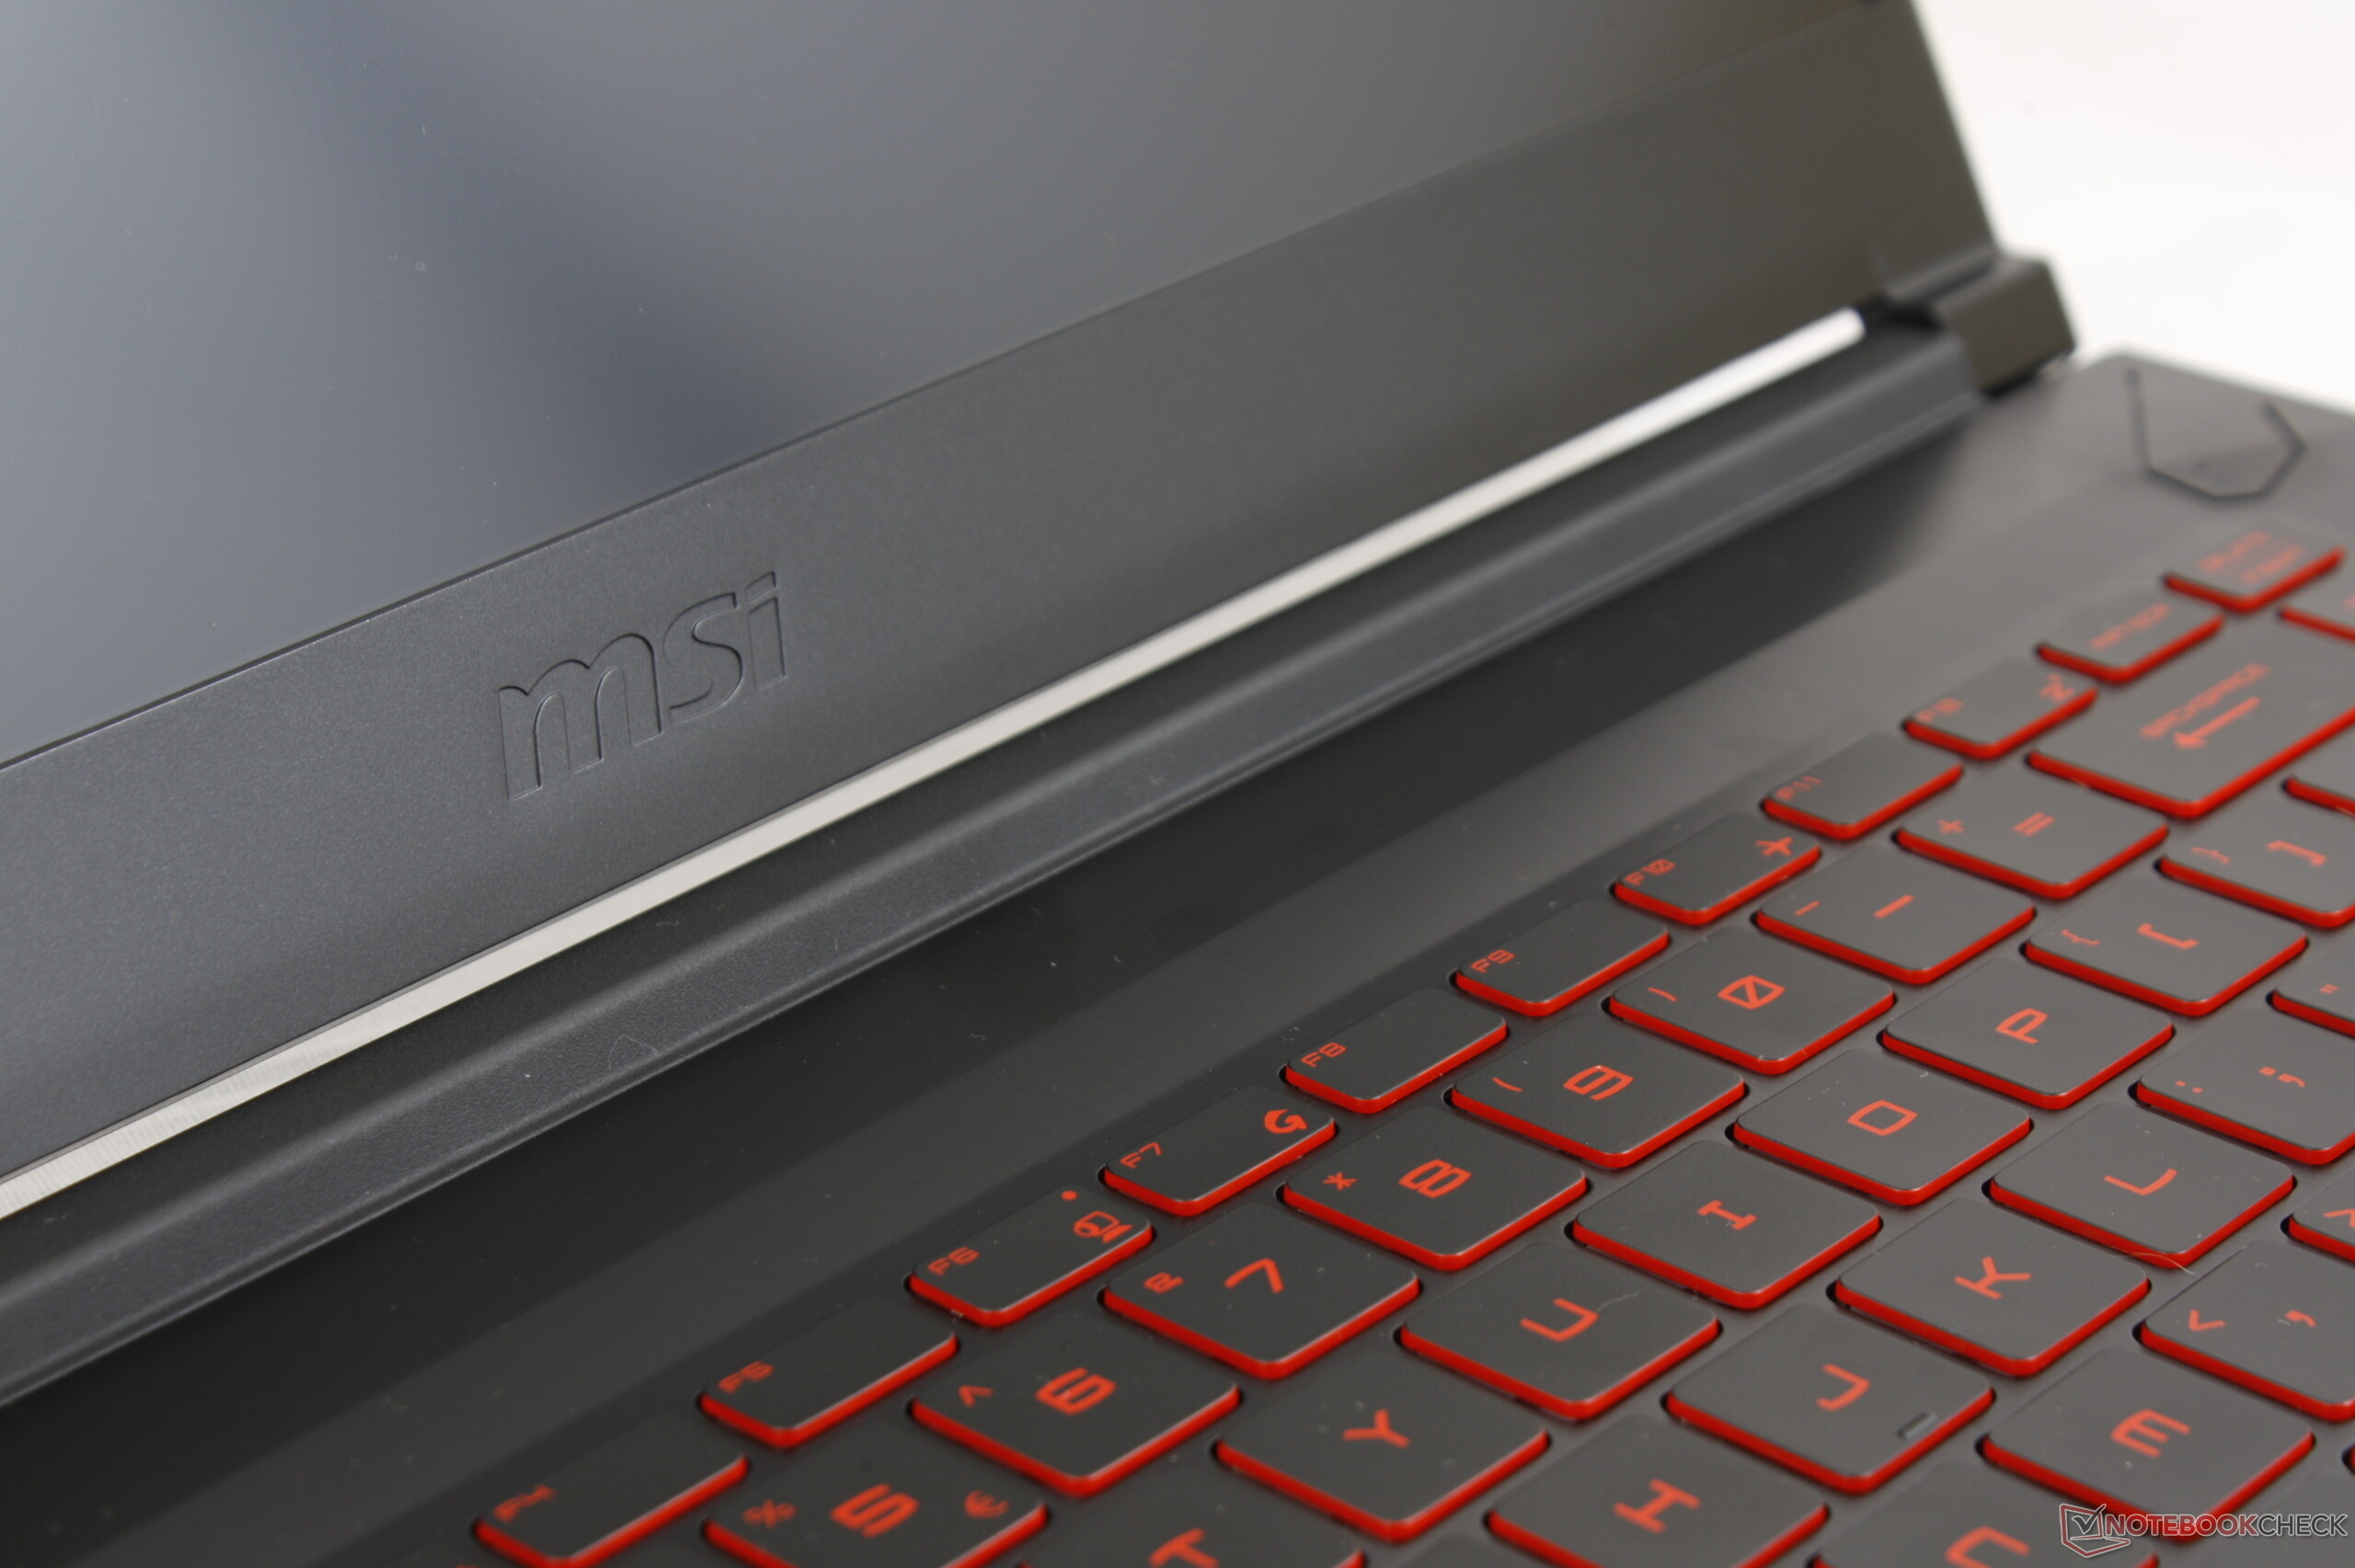
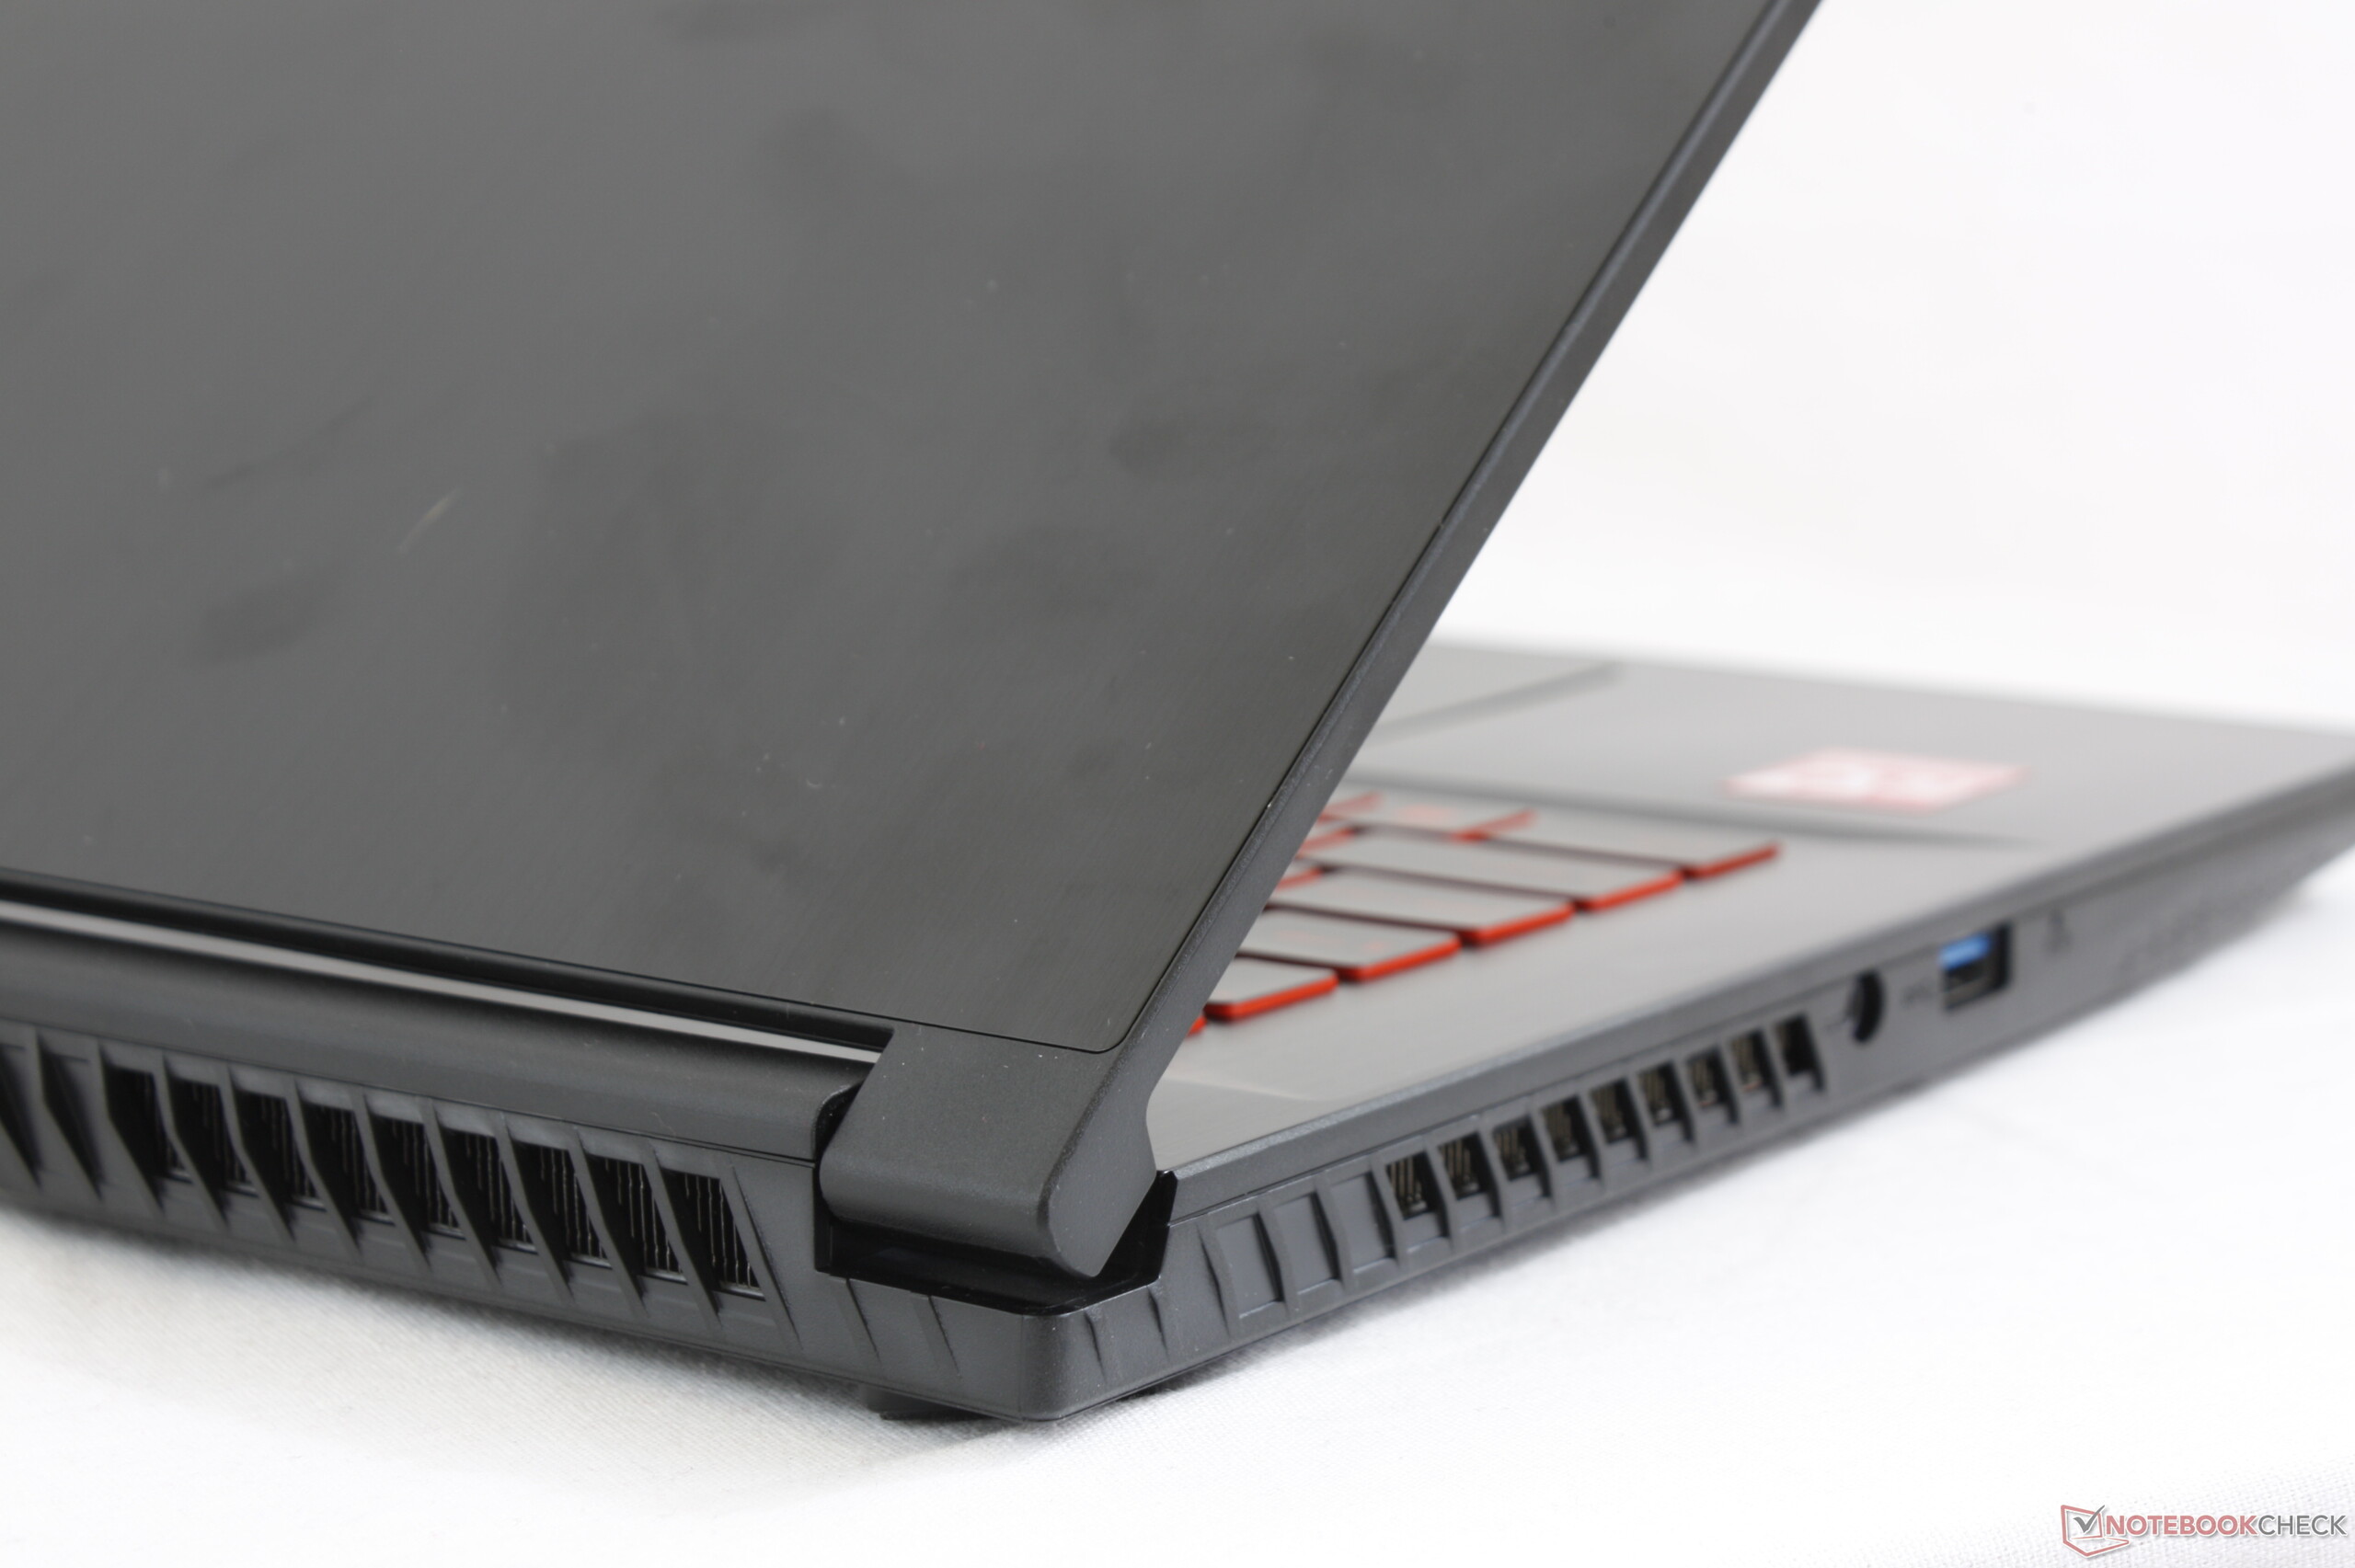
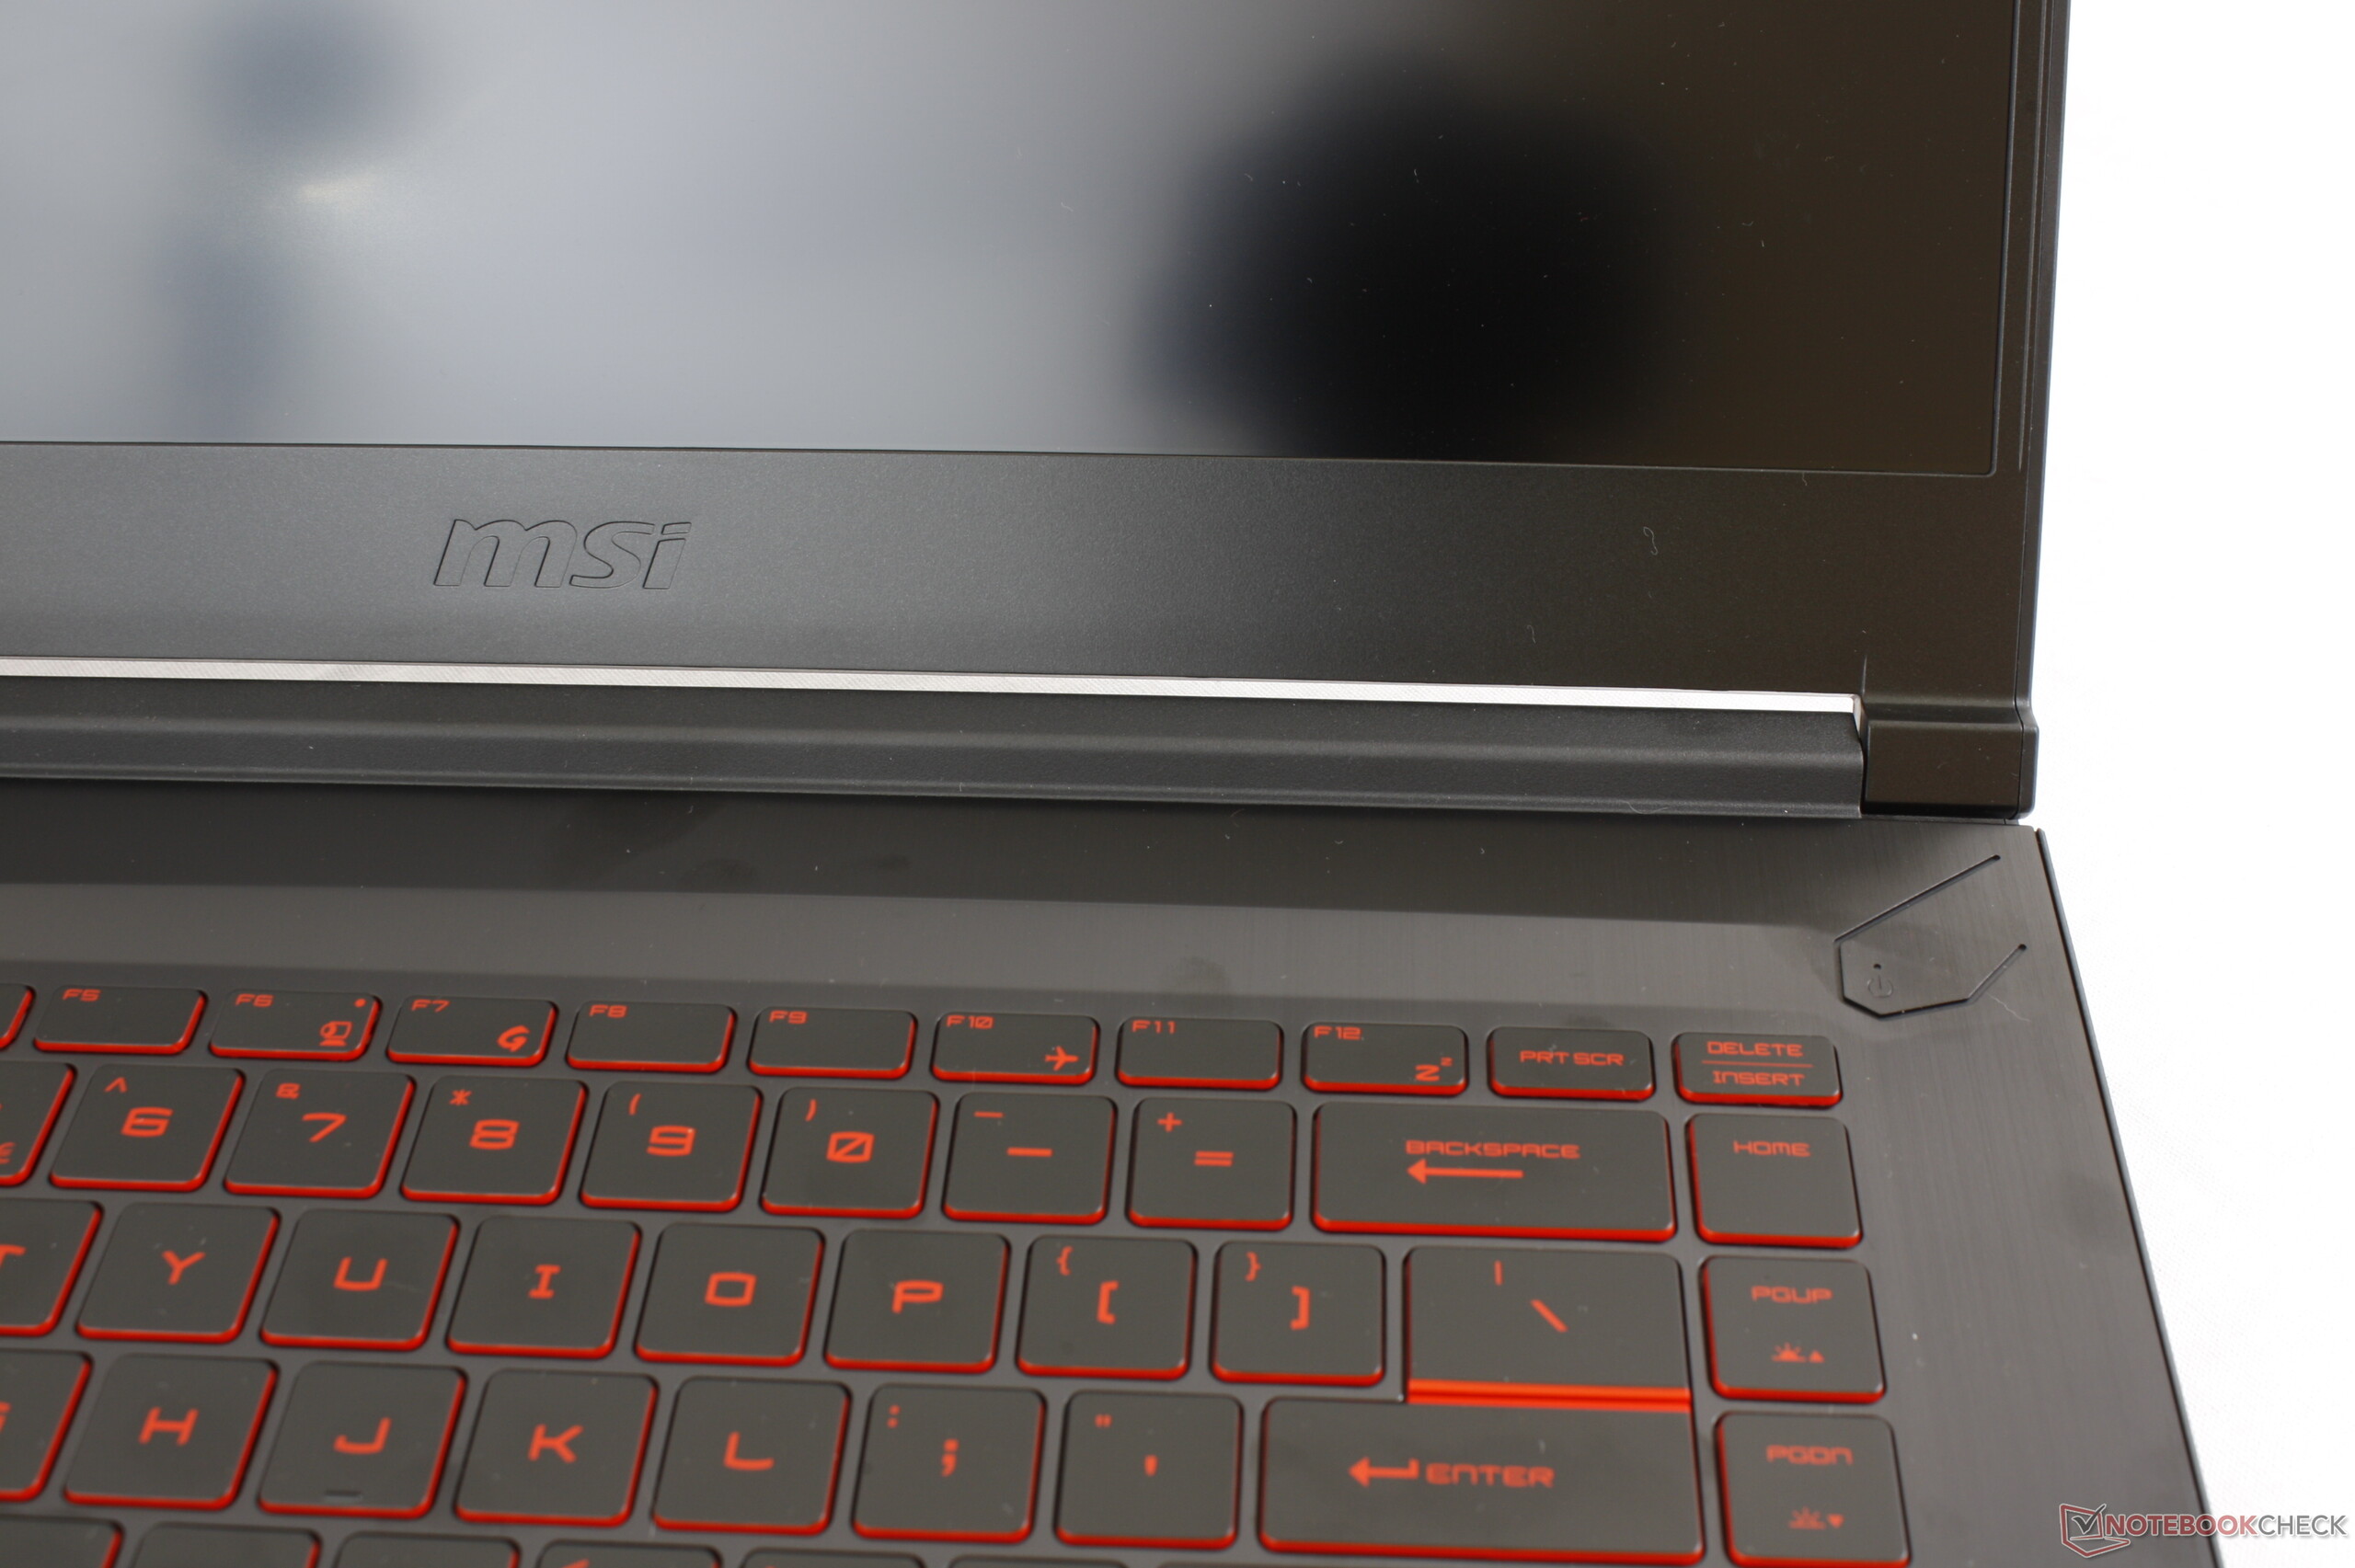
A fim de oferecer um portátil de jogos leve de 15,6 polegadas por um preço baixo, a MSI teve que deixar de lado vários recursos do GF62VR. Os compradores em potencial devem estar cientes de que o GF63 é mais simples, sem teclado numérico, iluminação RGB de zona tripla ou leitor SD. Os usuários que desejarem gráficos GTX 1060 também estarão sem sorte, já que a opção de GPU mais alta é a GTX 1050 Ti Max-Q. Felizmente, o desempenho do núcleo de jogos é confiável quando ligado na tomada e com uma bateria decente para tarefas menos exigentes.
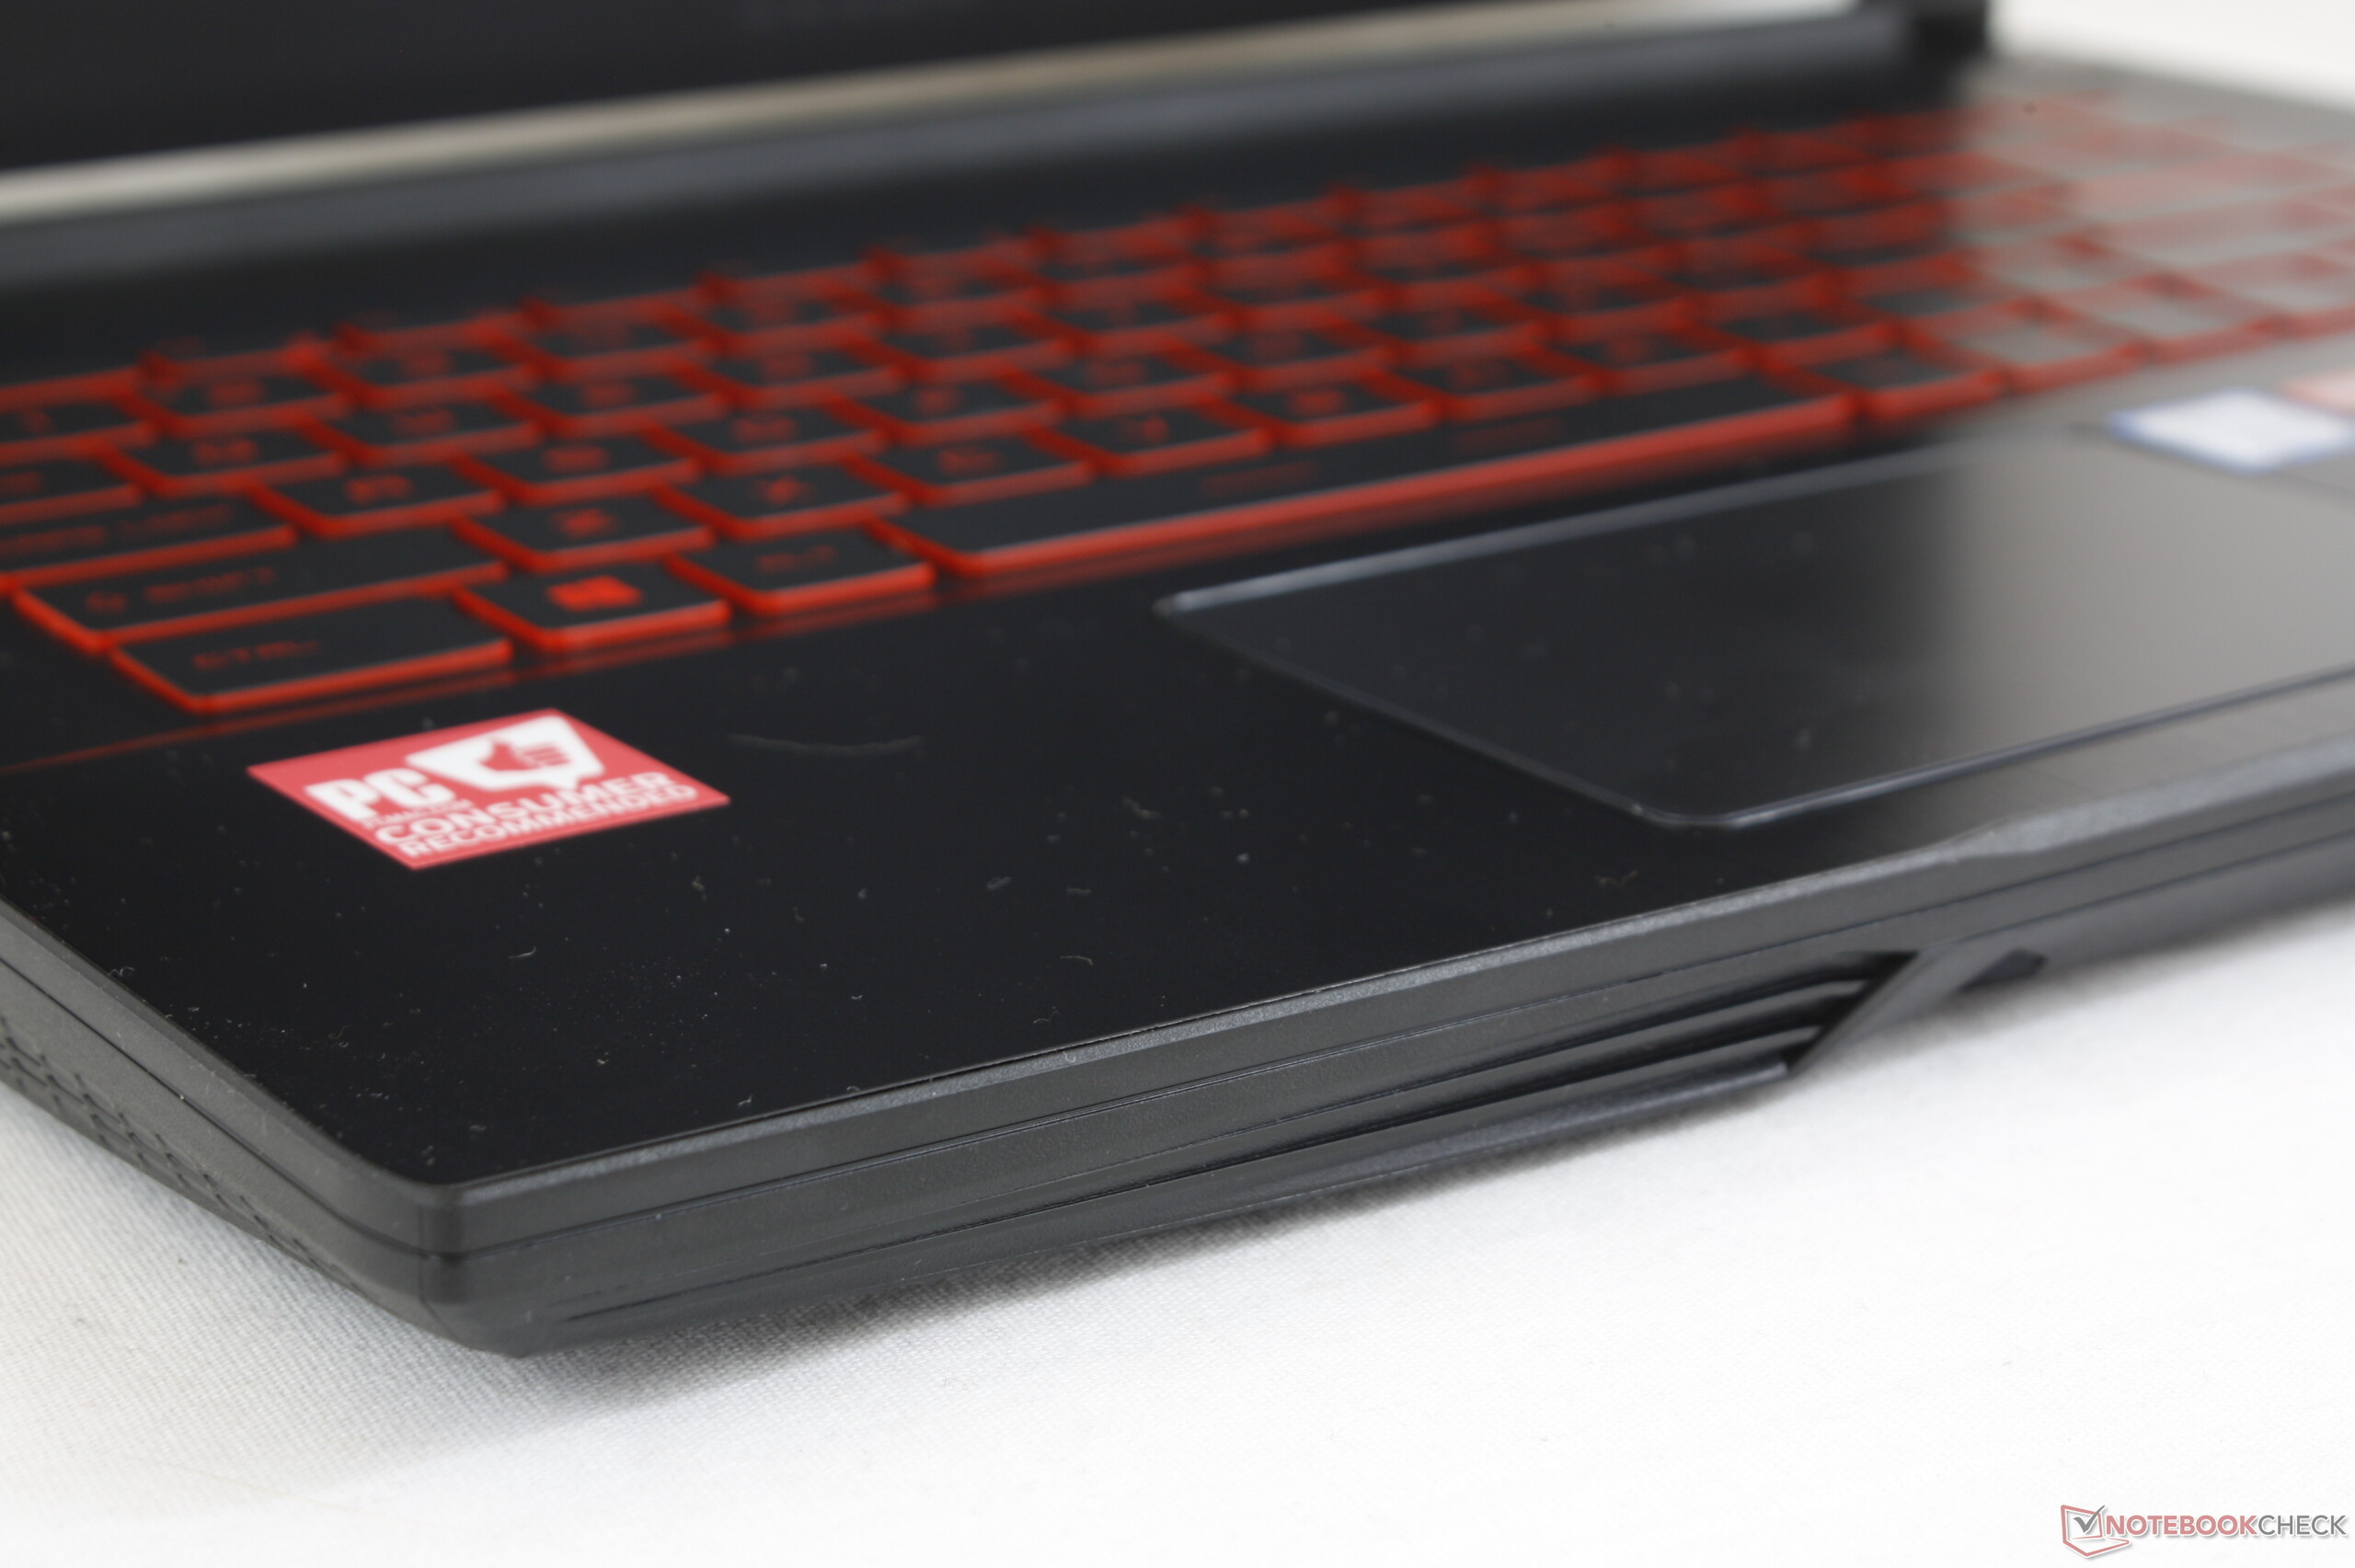
Talvez nossas maiores queixas com o sistema sejam seu clickpad esponjoso e rigidez média do chassi quando comparado a outros portáteis de 15,6 polegadas Asus GL504, HP Spectre x360 15, Razer Blade 15, ou Dell e Gigabyte mencionado anteriormente. Quando comparado com alternativas mais dentro de sua faixa de preço, como o Gigabyte Sabre 15, Dell G7, ou Acer Nitro 5, no entanto, o GF63 é a opção mais leve e mais versátil, no geral.
O MSI GF63 estabelece um melhor equilíbrio entre acessibilidade, portabilidade e desempenho de jogos do que muitos de seus concorrentes devido ao novo design de marcos estreitos. Se você é um gamer com um orçamento apertado e quer algo mais poderoso do que um Ultrabook tradicional, mas sem o peso adicional, o GF62 é uma excelente opção.
MSI GF63 8RC
- 10/23/2018 v6 (old)
Allen Ngo
Price comparison
