Breve Análise do Portátil MSI GT75 8RG Titan (i9-8950HK, GTX 1080, Full-HD)
| SD Card Reader | |
| average JPG Copy Test (av. of 3 runs) | |
| Aorus X9 DT (Toshiba Exceria Pro SDXC 64 GB UHS-II) | |
| Asus G703 (Toshiba Exceria Pro SDXC 64 GB UHS-II) | |
| Média da turma Gaming (20.9 - 210, n=54, últimos 2 anos) | |
| MSI GT75 8RG-090 Titan (Toshiba Exceria Pro SDXC 64 GB UHS-II) | |
| Acer Predator 17 X GX-792-76DL (Toshiba Exceria Pro SDXC 64 GB UHS-II) | |
| HP Omen X 17-ap0xx (Toshiba Exceria Pro SDXC 64 GB UHS-II) | |
| maximum AS SSD Seq Read Test (1GB) | |
| Aorus X9 DT (Toshiba Exceria Pro SDXC 64 GB UHS-II) | |
| Asus G703 (Toshiba Exceria Pro SDXC 64 GB UHS-II) | |
| Média da turma Gaming (25.5 - 261, n=51, últimos 2 anos) | |
| Acer Predator 17 X GX-792-76DL (Toshiba Exceria Pro SDXC 64 GB UHS-II) | |
| HP Omen X 17-ap0xx (Toshiba Exceria Pro SDXC 64 GB UHS-II) | |
| MSI GT75 8RG-090 Titan (Toshiba Exceria Pro SDXC 64 GB UHS-II) | |
| |||||||||||||||||||||||||
iluminação: 83 %
iluminação com acumulador: 240 cd/m²
Contraste: 1091:1 (Preto: 0.22 cd/m²)
ΔE ColorChecker Calman: 2.14 | ∀{0.5-29.43 Ø4.71}
calibrated: 1.54
ΔE Greyscale Calman: 1.62 | ∀{0.09-98 Ø4.96}
100% sRGB (Argyll 1.6.3 3D)
77% AdobeRGB 1998 (Argyll 1.6.3 3D)
86.2% AdobeRGB 1998 (Argyll 3D)
100% sRGB (Argyll 3D)
90.9% Display P3 (Argyll 3D)
Gamma: 2.28
CCT: 6846 K
| MSI GT75 8RG-090 Titan CMN N173HHE-G32 (CMN1747), TN, 1920x1080 | Aorus X9 DT AUO B173HAN03.0 (AUO309D), IPS, 1920x1080 | Asus G703 AUO B173HAN03.0 (AUO309D), IPS, 1920x1080 | Acer Predator 17 X GX-792-76DL LP173WF4-SPF5 (LGD056D), IPS, 1920x1080 | HP Omen X 17-ap0xx AU Optronics B173HW01, IPS, 1920x1080 | Alienware 17 R4 TN LED, 2560x1440 | |
|---|---|---|---|---|---|---|
| Display | -19% | -20% | -24% | -23% | -27% | |
| Display P3 Coverage (%) | 90.9 | 66.8 -27% | 65.5 -28% | 66 -27% | 63.7 -30% | 61.2 -33% |
| sRGB Coverage (%) | 100 | 92.1 -8% | 92.4 -8% | 83.7 -16% | 88.2 -12% | 82.9 -17% |
| AdobeRGB 1998 Coverage (%) | 86.2 | 67.3 -22% | 66.6 -23% | 61.2 -29% | 64.2 -26% | 60.5 -30% |
| Response Times | -122% | -110% | -432% | -457% | -202% | |
| Response Time Grey 50% / Grey 80% * (ms) | 8 ? | 18.4 ? -130% | 17.6 ? -120% | 45 ? -463% | 44 ? -450% | 30 ? -275% |
| Response Time Black / White * (ms) | 5.6 ? | 12 ? -114% | 11.2 ? -100% | 28 ? -400% | 31.6 ? -464% | 12.8 ? -129% |
| PWM Frequency (Hz) | 26000 ? | |||||
| Screen | 11% | -33% | -31% | -19% | -60% | |
| Brightness middle (cd/m²) | 240 | 280 17% | 274 14% | 380 58% | 343 43% | 402.3 68% |
| Brightness (cd/m²) | 248 | 262 6% | 268 8% | 362 46% | 332 34% | 372 50% |
| Brightness Distribution (%) | 83 | 86 4% | 80 -4% | 91 10% | 83 0% | 86 4% |
| Black Level * (cd/m²) | 0.22 | 0.22 -0% | 0.29 -32% | 0.37 -68% | 0.35 -59% | 0.62 -182% |
| Contrast (:1) | 1091 | 1273 17% | 945 -13% | 1027 -6% | 980 -10% | 649 -41% |
| Colorchecker dE 2000 * | 2.14 | 1.78 17% | 3.99 -86% | 4.12 -93% | 3.35 -57% | 5.6 -162% |
| Colorchecker dE 2000 max. * | 5.04 | 3.91 22% | 7.33 -45% | 8.19 -63% | 5.62 -12% | 9.8 -94% |
| Colorchecker dE 2000 calibrated * | 1.54 | 1.79 -16% | 2.5 -62% | |||
| Greyscale dE 2000 * | 1.62 | 0.74 54% | 4.14 -156% | 3.95 -144% | 2.4 -48% | 4.7 -190% |
| Gamma | 2.28 96% | 2.43 91% | 2.58 85% | 2.47 89% | 2.35 94% | 2.14 103% |
| CCT | 6846 95% | 6494 100% | 7352 88% | 6539 99% | 6495 100% | 7519 86% |
| Color Space (Percent of AdobeRGB 1998) (%) | 77 | 60 -22% | 60 -22% | 55 -29% | 57 -26% | 53.7 -30% |
| Color Space (Percent of sRGB) (%) | 100 | 92 -8% | 92 -8% | 84 -16% | 88 -12% | 82.2 -18% |
| Média Total (Programa/Configurações) | -43% /
-13% | -54% /
-40% | -162% /
-83% | -166% /
-74% | -96% /
-72% |
* ... menor é melhor
Exibir tempos de resposta
| ↔ Tempo de resposta preto para branco | ||
|---|---|---|
| 5.6 ms ... ascensão ↗ e queda ↘ combinadas | ↗ 3.8 ms ascensão | 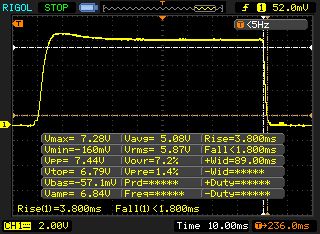 |
| ↘ 1.8 ms queda | ||
| A tela mostra taxas de resposta muito rápidas em nossos testes e deve ser muito adequada para jogos em ritmo acelerado. Em comparação, todos os dispositivos testados variam de 0.1 (mínimo) a 240 (máximo) ms. » 18 % de todos os dispositivos são melhores. Isso significa que o tempo de resposta medido é melhor que a média de todos os dispositivos testados (19.8 ms). | ||
| ↔ Tempo de resposta 50% cinza a 80% cinza | ||
| 8 ms ... ascensão ↗ e queda ↘ combinadas | ↗ 4.4 ms ascensão | 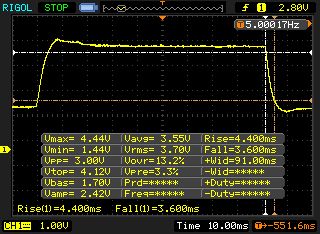 |
| ↘ 3.6 ms queda | ||
| A tela mostra taxas de resposta rápidas em nossos testes e deve ser adequada para jogos. Em comparação, todos os dispositivos testados variam de 0.165 (mínimo) a 636 (máximo) ms. » 21 % de todos os dispositivos são melhores. Isso significa que o tempo de resposta medido é melhor que a média de todos os dispositivos testados (31 ms). | ||
Cintilação da tela / PWM (modulação por largura de pulso)
| Tela tremeluzindo/PWM detectado | 26000 Hz | ≤ 19 % configuração de brilho | 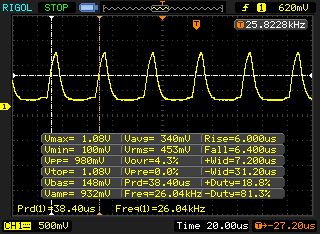 |
A luz de fundo da tela pisca em 26000 Hz (pior caso, por exemplo, utilizando PWM) Cintilação detectada em uma configuração de brilho de 19 % e abaixo. Não deve haver cintilação ou PWM acima desta configuração de brilho. A frequência de 26000 Hz é bastante alta, então a maioria dos usuários sensíveis ao PWM não deve notar nenhuma oscilação. [pwm_comparison] Em comparação: 52 % de todos os dispositivos testados não usam PWM para escurecer a tela. Se PWM foi detectado, uma média de 7757 (mínimo: 5 - máximo: 343500) Hz foi medida. | |||
| PCMark 10 - Score | |
| Média da turma Gaming (5828 - 12414, n=93, últimos 2 anos) | |
| MSI GT75 8RG-090 Titan | |
| Aorus X9 DT | |
| HP Omen X 17-ap0xx | |
| Asus G703 | |
| PCMark 8 Home Score Accelerated v2 | 5720 pontos | |
| PCMark 8 Work Score Accelerated v2 | 5801 pontos | |
| PCMark 10 Score | 6558 pontos | |
Ajuda | ||
| MSI GT75 8RG-090 Titan 2x Samsung PM961 MZVLW256HEHP (RAID 0) | Aorus X9 DT Transcend TS1TMTE850 | Asus G703 2x Samsung SM961 MZVKW512HMJP NVMe (RAID 0) | Acer Predator 17 X GX-792-76DL Toshiba NVMe THNSN5512GPU7 | HP Omen X 17-ap0xx Samsung PM961 MZVLW256HEHP | Alienware 17 R4 SK Hynix PC300 NVMe 512 GB | |
|---|---|---|---|---|---|---|
| AS SSD | -41% | 13% | -19% | -18% | -35% | |
| Seq Read (MB/s) | 3058 | 1518 -50% | 3177 4% | 2261 -26% | 2352 -23% | 1752 -43% |
| Seq Write (MB/s) | 2196 | 1019 -54% | 2556 16% | 1338 -39% | 1145 -48% | 735 -67% |
| 4K Read (MB/s) | 38.37 | 22.23 -42% | 47.61 24% | 39.52 3% | 44.81 17% | 35.61 -7% |
| 4K Write (MB/s) | 97.7 | 98.9 1% | 148.4 52% | 133.8 37% | 116.2 19% | 113.4 16% |
| Score Read (Points) | 1691 | 828 -51% | 1633 -3% | 1118 -34% | 1248 -26% | 831 -51% |
| Score Write (Points) | 1553 | 916 -41% | 1519 -2% | 930 -40% | 1029 -34% | 858 -45% |
| Score Total (Points) | 4066 | 2145 -47% | 3962 -3% | 2581 -37% | 2862 -30% | 2072 -49% |

| 3DMark - 1920x1080 Fire Strike Graphics | |
| Média da turma Gaming (12242 - 62849, n=115, últimos 2 anos) | |
| Acer Predator 17 X GX-792-76DL | |
| Aorus X9 DT | |
| Asus G703 | |
| Alienware 17 R4 | |
| MSI GT75 8RG-090 Titan | |
| HP Omen X 17-ap0xx | |
| 3DMark 11 Performance | 23175 pontos | |
| 3DMark Ice Storm Standard Score | 193287 pontos | |
| 3DMark Cloud Gate Standard Score | 42660 pontos | |
| 3DMark Fire Strike Score | 18738 pontos | |
Ajuda | ||
| The Witcher 3 - 1920x1080 Ultra Graphics & Postprocessing (HBAO+) | |
| Média da turma Gaming (104.7 - 240, n=7, últimos 2 anos) | |
| Alienware 17 R4 | |
| Asus G703 | |
| Aorus X9 DT | |
| MSI GT75 8RG-090 Titan | |
| Acer Predator 17 X GX-792-76DL | |
| HP Omen X 17-ap0xx | |
| baixo | média | alto | ultra | |
|---|---|---|---|---|
| The Witcher 3 (2015) | 148 | 76.8 | ||
| Ghost Recon Wildlands (2017) | 110 | 60.5 | ||
| FIFA 18 (2017) | 427 | 418 | ||
| Need for Speed Payback (2017) | 145 | 141 | ||
| Star Wars Battlefront 2 (2017) | 139 | 121 | ||
| Far Cry 5 (2018) | 120 | 113 |
Barulho
| Ocioso |
| 32 / 34 / 37 dB |
| HDD |
| 34 dB |
| Carga |
| 43 / 62 dB |
 | ||
30 dB silencioso 40 dB(A) audível 50 dB(A) ruidosamente alto |
||
min: | ||
| MSI GT75 8RG-090 Titan i9-8950HK, GeForce GTX 1080 Mobile | Aorus X9 DT i9-8950HK, GeForce GTX 1080 Mobile | Asus G703 i7-7820HK, GeForce GTX 1080 Mobile | Acer Predator 17 X GX-792-76DL i7-7820HK, GeForce GTX 1080 Mobile | HP Omen X 17-ap0xx i7-7820HK, GeForce GTX 1080 Mobile | Alienware 17 R4 i7-7820HK, GeForce GTX 1080 Mobile | |
|---|---|---|---|---|---|---|
| Noise | -7% | 1% | 3% | 11% | 1% | |
| desligado / ambiente * (dB) | 30 | 30 -0% | 30 -0% | 30 -0% | 28.3 6% | 28.2 6% |
| Idle Minimum * (dB) | 32 | 36 -13% | 35 -9% | 33 -3% | 31.5 2% | 35.6 -11% |
| Idle Average * (dB) | 34 | 37 -9% | 36 -6% | 35 -3% | 31.6 7% | 35.6 -5% |
| Idle Maximum * (dB) | 37 | 43 -16% | 38 -3% | 37 -0% | 31.6 15% | 35.7 4% |
| Load Average * (dB) | 43 | 50 -16% | 46 -7% | 40 7% | 36.8 14% | 50.2 -17% |
| Witcher 3 ultra * (dB) | 57 | 57 -0% | 48 16% | 48.2 15% | 50.2 12% | |
| Load Maximum * (dB) | 62 | 61 2% | 54 13% | 50 19% | 52.1 16% | 50.2 19% |
* ... menor é melhor
(-) A temperatura máxima no lado superior é 47 °C / 117 F, em comparação com a média de 40.4 °C / 105 F , variando de 21.2 a 68.8 °C para a classe Gaming.
(-) A parte inferior aquece até um máximo de 53 °C / 127 F, em comparação com a média de 43.2 °C / 110 F
(+) Em uso inativo, a temperatura média para o lado superior é 24.9 °C / 77 F, em comparação com a média do dispositivo de 33.9 °C / ### class_avg_f### F.
(±) Jogando The Witcher 3, a temperatura média para o lado superior é 35.9 °C / 97 F, em comparação com a média do dispositivo de 33.9 °C / ## #class_avg_f### F.
(+) Os apoios para as mãos e o touchpad são mais frios que a temperatura da pele, com um máximo de 30 °C / 86 F e, portanto, são frios ao toque.
(±) A temperatura média da área do apoio para as mãos de dispositivos semelhantes foi 28.8 °C / 83.8 F (-1.2 °C / -2.2 F).
| MSI GT75 8RG-090 Titan i9-8950HK, GeForce GTX 1080 Mobile | Aorus X9 DT i9-8950HK, GeForce GTX 1080 Mobile | Asus G703 i7-7820HK, GeForce GTX 1080 Mobile | Acer Predator 17 X GX-792-76DL i7-7820HK, GeForce GTX 1080 Mobile | HP Omen X 17-ap0xx i7-7820HK, GeForce GTX 1080 Mobile | Alienware 17 R4 i7-7820HK, GeForce GTX 1080 Mobile | |
|---|---|---|---|---|---|---|
| Heat | -2% | -13% | -5% | 14% | -9% | |
| Maximum Upper Side * (°C) | 47 | 43 9% | 55 -17% | 44.2 6% | 35.6 24% | 49.6 -6% |
| Maximum Bottom * (°C) | 53 | 55 -4% | 54 -2% | 43 19% | 39 26% | 56 -6% |
| Idle Upper Side * (°C) | 26 | 27 -4% | 29 -12% | 32.4 -25% | 24.2 7% | 29.6 -14% |
| Idle Bottom * (°C) | 27 | 29 -7% | 32 -19% | 32.8 -21% | 27.4 -1% | 29.2 -8% |
* ... menor é melhor
MSI GT75 8RG-090 Titan análise de áudio
(+) | os alto-falantes podem tocar relativamente alto (###valor### dB)
Graves 100 - 315Hz
(±) | graves reduzidos - em média 9.4% menor que a mediana
(±) | a linearidade dos graves é média (8.7% delta para a frequência anterior)
Médios 400 - 2.000 Hz
(±) | médios mais altos - em média 6.8% maior que a mediana
(±) | a linearidade dos médios é média (8.4% delta para frequência anterior)
Altos 2 - 16 kHz
(±) | máximos mais altos - em média 5% maior que a mediana
(±) | a linearidade dos máximos é média (7.8% delta para frequência anterior)
Geral 100 - 16.000 Hz
(+) | o som geral é linear (14.4% diferença em relação à mediana)
Comparado com a mesma classe
» 27% de todos os dispositivos testados nesta classe foram melhores, 7% semelhantes, 66% piores
» O melhor teve um delta de 6%, a média foi 18%, o pior foi 132%
Comparado com todos os dispositivos testados
» 18% de todos os dispositivos testados foram melhores, 4% semelhantes, 78% piores
» O melhor teve um delta de 4%, a média foi 23%, o pior foi 134%
Aorus X9 DT análise de áudio
(±) | o volume do alto-falante é médio, mas bom (###valor### dB)
Graves 100 - 315Hz
(±) | graves reduzidos - em média 9.3% menor que a mediana
(±) | a linearidade dos graves é média (9.6% delta para a frequência anterior)
Médios 400 - 2.000 Hz
(+) | médios equilibrados - apenas 2.5% longe da mediana
(+) | médios são lineares (3.9% delta para frequência anterior)
Altos 2 - 16 kHz
(±) | máximos reduzidos - em média 5.2% menor que a mediana
(±) | a linearidade dos máximos é média (7.4% delta para frequência anterior)
Geral 100 - 16.000 Hz
(+) | o som geral é linear (14.4% diferença em relação à mediana)
Comparado com a mesma classe
» 27% de todos os dispositivos testados nesta classe foram melhores, 7% semelhantes, 66% piores
» O melhor teve um delta de 6%, a média foi 18%, o pior foi 132%
Comparado com todos os dispositivos testados
» 18% de todos os dispositivos testados foram melhores, 4% semelhantes, 78% piores
» O melhor teve um delta de 4%, a média foi 23%, o pior foi 134%
| desligado | |
| Ocioso | |
| Carga |
|
Key:
min: | |
| MSI GT75 8RG-090 Titan i9-8950HK, GeForce GTX 1080 Mobile | Aorus X9 DT i9-8950HK, GeForce GTX 1080 Mobile | Asus G703 i7-7820HK, GeForce GTX 1080 Mobile | Acer Predator 17 X GX-792-76DL i7-7820HK, GeForce GTX 1080 Mobile | HP Omen X 17-ap0xx i7-7820HK, GeForce GTX 1080 Mobile | Alienware 17 R4 i7-7820HK, GeForce GTX 1080 Mobile | |
|---|---|---|---|---|---|---|
| Power Consumption | 7% | 11% | 17% | 31% | 9% | |
| Idle Minimum * (Watt) | 31 | 28 10% | 26 16% | 27 13% | 21.6 30% | 37.5 -21% |
| Idle Average * (Watt) | 35 | 37 -6% | 30 14% | 32 9% | 26.4 25% | 37.6 -7% |
| Idle Maximum * (Watt) | 45 | 40 11% | 37 18% | 41 9% | 26.6 41% | 37.6 16% |
| Load Average * (Watt) | 130 | 109 16% | 123 5% | 102 22% | 95.6 26% | 122.4 6% |
| Witcher 3 ultra * (Watt) | 268 | 256 4% | 257 4% | 221.7 17% | 180.3 33% | |
| Load Maximum * (Watt) | 374 | 353 6% | 341 9% | 248 34% | 199.6 47% | 277.4 26% |
* ... menor é melhor
| MSI GT75 8RG-090 Titan i9-8950HK, GeForce GTX 1080 Mobile, 75 Wh | Aorus X9 DT i9-8950HK, GeForce GTX 1080 Mobile, 94.24 Wh | Asus G703 i7-7820HK, GeForce GTX 1080 Mobile, 71 Wh | Acer Predator 17 X GX-792-76DL i7-7820HK, GeForce GTX 1080 Mobile, 88.8 Wh | HP Omen X 17-ap0xx i7-7820HK, GeForce GTX 1080 Mobile, 99 Wh | Alienware 17 R4 i7-7820HK, GeForce GTX 1080 Mobile, 99 Wh | |
|---|---|---|---|---|---|---|
| Duração da bateria | 15% | -16% | 30% | 68% | 15% | |
| Reader / Idle (h) | 3.8 | 4.2 11% | 3.3 -13% | 5.2 37% | 5.8 53% | 4.6 21% |
| H.264 (h) | 2.9 | 2.4 -17% | 3.4 17% | |||
| Load (h) | 1.1 | 1.3 18% | 0.9 -18% | 1.5 36% | 2 82% | 1.2 9% |
| WiFi v1.3 (h) | 3.2 | 2.5 | 4.2 | 5.6 | 3 |
Pro
Contra
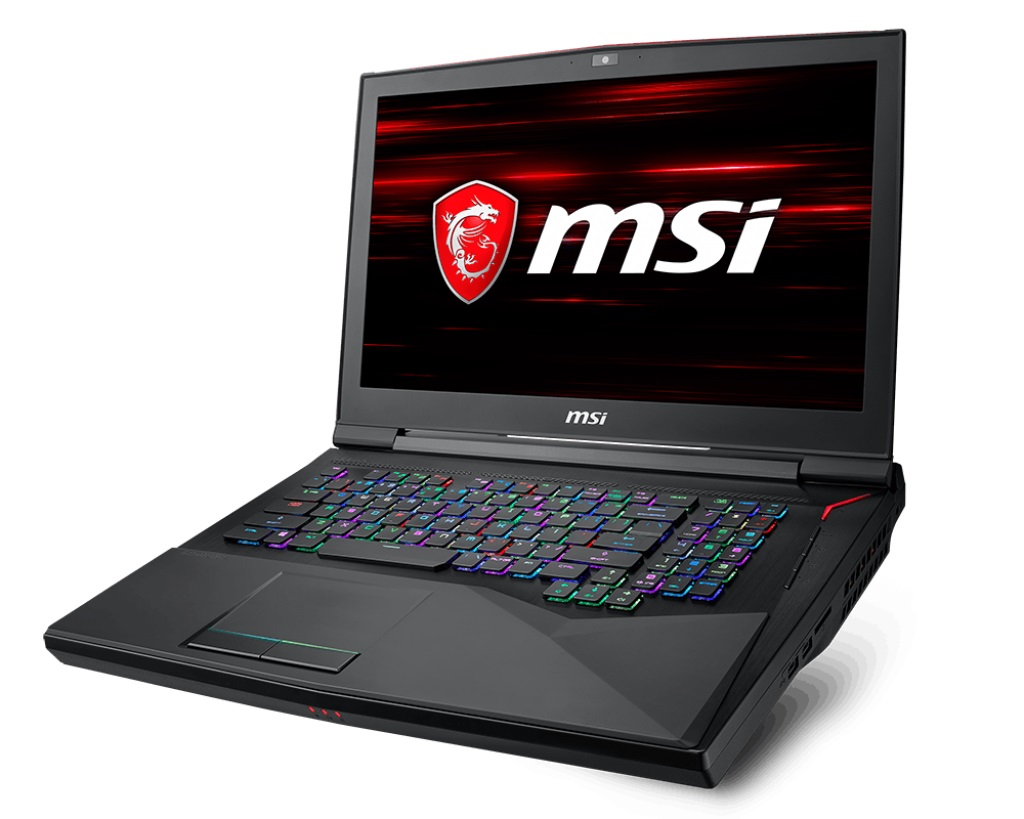
Se você aceitar o seu tamanho e peso, o MSI GT75 8RG é um substituto de desktop de alta qualidade, bem equipado e incrivelmente poderoso que lembra os clássicos PCs de torre. O GT75 tem extensas opções de manutenção e atualização e muitas conexões, entre outras coisas.
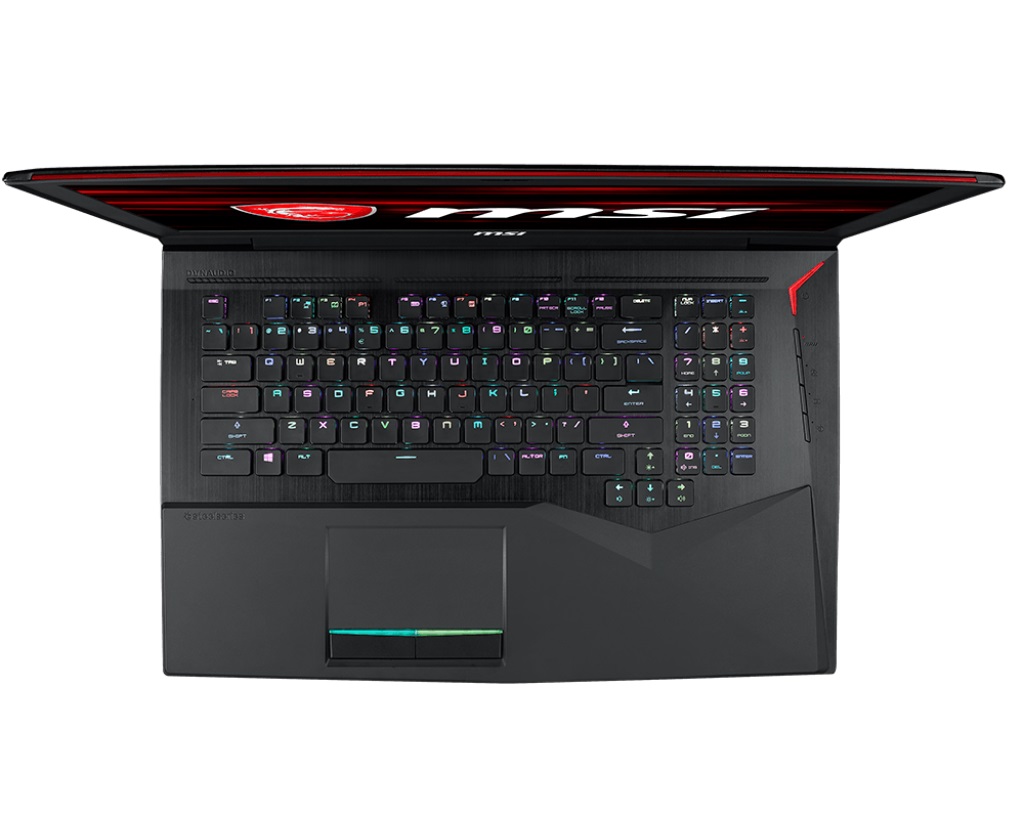
Além disso, a MSI integra uma tela de 120 Hz com alta velocidade e cores precisas e um sistema de som decente. Os dispositivos de entrada são igualmente impressionantes Um dos destaques do GT75 é seu teclado mecânico; cuja experiência de digitação está muito afrente da concorrência.
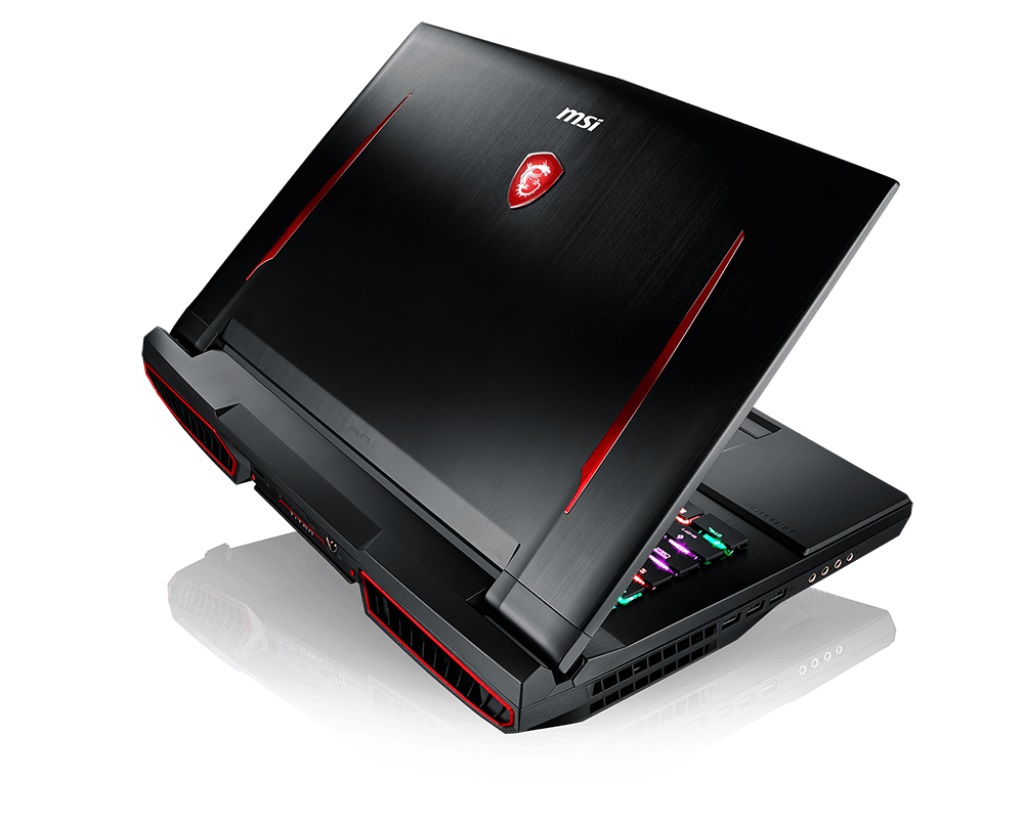
No entanto, não podemos recomendar totalmente o GT75 8RG. Como no seu predecessor, o ruído do ventilador é um verdadeiro ponto de atrito. Embora o dispositivo de 17 polegadas tenha praticamente 6 cm de espessura, os ventiladores são extremamente barulhentos sob uso intenso. Eles são tão barulhentos que você precisará usar fones de ouvido quando estiver jogando. O mesmo é verdade para o Aorus X9 DT, mas este dispositivo tem apenas 3 cm de espessura. Esse desempenho comparável mostra que o sistema de resfriamento da MSI é um pouco deficiente.
MSI GT75 8RG-090 Titan
- 05/16/2018 v6 (old)
Florian Glaser
Price comparison