Breve Análise do Portátil Microsoft Surface Laptop 2 (Core i5, 256 GB)
| |||||||||||||||||||||||||
iluminação: 89 %
iluminação com acumulador: 392 cd/m²
Contraste: 1633:1 (Preto: 0.24 cd/m²)
ΔE ColorChecker Calman: 3.2 | ∀{0.5-29.43 Ø4.71}
calibrated: 1.4
ΔE Greyscale Calman: 4.5 | ∀{0.09-98 Ø4.96}
95% sRGB (Argyll 1.6.3 3D)
63.9% AdobeRGB 1998 (Argyll 1.6.3 3D)
69.2% AdobeRGB 1998 (Argyll 3D)
94.7% sRGB (Argyll 3D)
68% Display P3 (Argyll 3D)
Gamma: 2.2
CCT: 7556 K
| Microsoft Surface Laptop 2-LQN-00004 VVX14T092N00, , 2256x1504, 13.5" | Microsoft Surface Laptop i5 ID: MEI96A2, Name: Panasonic VVX14T092N00, , 2256x1504, 13.5" | Microsoft Surface Pro 6, Core i7, 512 GB LGPhilips LP123WQ112604, , 2736x1824, 12.3" | Dell XPS 13 9370 i5 UHD ID: Sharp SHP148B, Name: LQ133D1, Dell P/N: 8XDHY, , 3840x2160, 13.3" | Apple MacBook Air 2018 APPA039, , 2560x1600, 13.3" | Asus ZenBook S UX391U AUO B133HAN04.9, , 1920x1080, 13.3" | |
|---|---|---|---|---|---|---|
| Display | 0% | -1% | 2% | 1% | -5% | |
| Display P3 Coverage (%) | 68 | 67.8 0% | 67.1 -1% | 68.9 1% | 67.8 0% | 64.4 -5% |
| sRGB Coverage (%) | 94.7 | 94.3 0% | 95.5 1% | 98.4 4% | 96.1 1% | 90.5 -4% |
| AdobeRGB 1998 Coverage (%) | 69.2 | 69.5 0% | 67.9 -2% | 69.5 0% | 69.8 1% | 65.2 -6% |
| Response Times | 24% | 42% | 7% | 42% | 36% | |
| Response Time Grey 50% / Grey 80% * (ms) | 69.2 ? | 50.8 ? 27% | 43 ? 38% | 67.2 ? 3% | 39.6 ? 43% | 44.8 ? 35% |
| Response Time Black / White * (ms) | 46.4 ? | 37.2 ? 20% | 25 ? 46% | 41.6 ? 10% | 28 ? 40% | 29.2 ? 37% |
| PWM Frequency (Hz) | 22000 ? | 2500 ? | 113600 ? | |||
| Screen | 6% | -3% | -6% | 16% | -29% | |
| Brightness middle (cd/m²) | 392 | 384.2 -2% | 484 23% | 496.4 27% | 320 -18% | 299 -24% |
| Brightness (cd/m²) | 390 | 378 -3% | 473 21% | 469 20% | 315 -19% | 300 -23% |
| Brightness Distribution (%) | 89 | 90 1% | 91 2% | 84 -6% | 95 7% | 92 3% |
| Black Level * (cd/m²) | 0.24 | 0.36 -50% | 0.33 -38% | 0.5 -108% | 0.29 -21% | 0.26 -8% |
| Contrast (:1) | 1633 | 1067 -35% | 1467 -10% | 993 -39% | 1103 -32% | 1150 -30% |
| Colorchecker dE 2000 * | 3.2 | 1.8 44% | 4.29 -34% | 2.9 9% | 1.2 63% | 5.6 -75% |
| Colorchecker dE 2000 max. * | 6.3 | 4.2 33% | 6.46 -3% | 5.26 17% | 3.2 49% | 9.1 -44% |
| Colorchecker dE 2000 calibrated * | 1.4 | 1.34 4% | 0.5 64% | 2.6 -86% | ||
| Greyscale dE 2000 * | 4.5 | 1.2 73% | 4.3 4% | 3.9 13% | 0.8 82% | 5.5 -22% |
| Gamma | 2.2 100% | 2.21 100% | 2.51 88% | 2.066 106% | 2.2 100% | 2.47 89% |
| CCT | 7556 86% | 6708 97% | 7315 89% | 7169 91% | 6548 99% | 7533 86% |
| Color Space (Percent of AdobeRGB 1998) (%) | 63.9 | 63.7 0% | 62 -3% | 63.9 0% | 62.1 -3% | 58.9 -8% |
| Color Space (Percent of sRGB) (%) | 95 | 94.2 -1% | 95 0% | 98.2 3% | 96 1% | 90.3 -5% |
| Média Total (Programa/Configurações) | 10% /
7% | 13% /
3% | 1% /
-3% | 20% /
16% | 1% /
-17% |
* ... menor é melhor
Exibir tempos de resposta
| ↔ Tempo de resposta preto para branco | ||
|---|---|---|
| 46.4 ms ... ascensão ↗ e queda ↘ combinadas | ↗ 26 ms ascensão | 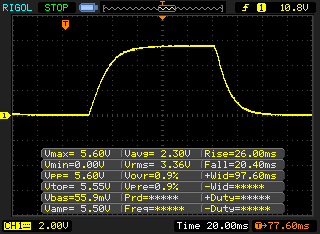 |
| ↘ 20.4 ms queda | ||
| A tela mostra taxas de resposta lentas em nossos testes e será insatisfatória para os jogadores. Em comparação, todos os dispositivos testados variam de 0.1 (mínimo) a 240 (máximo) ms. » 99 % de todos os dispositivos são melhores. Isso significa que o tempo de resposta medido é pior que a média de todos os dispositivos testados (19.8 ms). | ||
| ↔ Tempo de resposta 50% cinza a 80% cinza | ||
| 69.2 ms ... ascensão ↗ e queda ↘ combinadas | ↗ 34.8 ms ascensão | 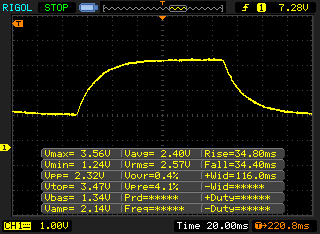 |
| ↘ 34.4 ms queda | ||
| A tela mostra taxas de resposta lentas em nossos testes e será insatisfatória para os jogadores. Em comparação, todos os dispositivos testados variam de 0.165 (mínimo) a 636 (máximo) ms. » 99 % de todos os dispositivos são melhores. Isso significa que o tempo de resposta medido é pior que a média de todos os dispositivos testados (30.9 ms). | ||
Cintilação da tela / PWM (modulação por largura de pulso)
| Tela tremeluzindo / PWM não detectado | 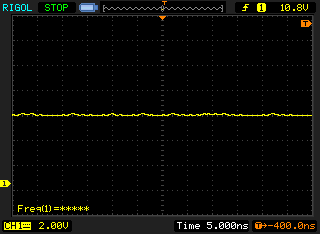 | ||
[pwm_comparison] Em comparação: 52 % de todos os dispositivos testados não usam PWM para escurecer a tela. Se PWM foi detectado, uma média de 7744 (mínimo: 5 - máximo: 343500) Hz foi medida. | |||

| PCMark 8 Home Score Accelerated v2 | 3153 pontos | |
| PCMark 8 Creative Score Accelerated v2 | 3927 pontos | |
| PCMark 8 Work Score Accelerated v2 | 4923 pontos | |
| PCMark 10 Score | 0 pontos | |
Ajuda | ||
| Microsoft Surface Laptop 2-LQN-00004 SK Hynix BC501 NVMe 256 GB | Microsoft Surface Pro 6, Core i7, 512 GB Toshiba KBG30ZPZ512G | Dell XPS 13 9370 i5 UHD Toshiba XG5 KXG50ZNV256G | Apple MacBook Air 2018 Apple SSD AP0256 | Asus ZenBook S UX391U Samsung PM961 NVMe MZVLW512HMJP | Média SK Hynix BC501 NVMe 256 GB | |
|---|---|---|---|---|---|---|
| CrystalDiskMark 5.2 / 6 | -5% | 29% | 17% | 41% | 10% | |
| Write 4K (MB/s) | 87.3 | 83.2 -5% | 121.4 39% | 118 35% | 98.9 13% | 110 ? 26% |
| Read 4K (MB/s) | 36.52 | 43.84 20% | 33.42 -8% | 29.97 -18% | 38.33 5% | 36.6 ? 0% |
| Write Seq (MB/s) | 716 | 636 -11% | 385.3 -46% | 1000 40% | 1414 97% | 699 ? -2% |
| Read Seq (MB/s) | 1009 | 900 -11% | 1958 94% | 1218 21% | 1051 4% | 1057 ? 5% |
| Write 4K Q32T1 (MB/s) | 324.1 | 192.9 -40% | 375.7 16% | 232.1 -28% | 370.7 14% | 359 ? 11% |
| Read 4K Q32T1 (MB/s) | 249 | 247.4 -1% | 364.1 46% | 254 2% | 251.4 1% | 339 ? 36% |
| Write Seq Q32T1 (MB/s) | 811 | 861 6% | 1069 32% | 1001 23% | 1606 98% | 813 ? 0% |
| Read Seq Q32T1 (MB/s) | 1631 | 1615 -1% | 2564 57% | 2555 57% | 3218 97% | 1670 ? 2% |

| 3DMark 11 Performance | 2065 pontos | |
| 3DMark Cloud Gate Standard Score | 8910 pontos | |
| 3DMark Fire Strike Score | 1162 pontos | |
| 3DMark Time Spy Score | 446 pontos | |
Ajuda | ||
| baixo | média | alto | ultra | |
|---|---|---|---|---|
| BioShock Infinite (2013) | 55.6 | 34.1 | 29.5 | 9.2 |
| The Witcher 3 (2015) | 16.6 | |||
| Rocket League (2017) | 93.9 | 34.8 | 21.6 |
Barulho
| Ocioso |
| 28.7 / 28.7 / 28.7 dB |
| Carga |
| 30 / 32.9 dB |
 | ||
30 dB silencioso 40 dB(A) audível 50 dB(A) ruidosamente alto |
||
min: | ||
| Microsoft Surface Laptop 2-LQN-00004 UHD Graphics 620, i5-8250U, SK Hynix BC501 NVMe 256 GB | Microsoft Surface Laptop i5 HD Graphics 620, i5-7200U, Toshiba THNSN0128GTYA | Microsoft Surface Pro 6, Core i7, 512 GB UHD Graphics 620, i7-8650U, Toshiba KBG30ZPZ512G | Dell XPS 13 9370 i5 UHD UHD Graphics 620, i5-8250U, Toshiba XG5 KXG50ZNV256G | Apple MacBook Air 2018 UHD Graphics 617, i5-8210Y, Apple SSD AP0256 | Asus ZenBook S UX391U UHD Graphics 620, i5-8550U, Samsung PM961 NVMe MZVLW512HMJP | |
|---|---|---|---|---|---|---|
| Noise | -3% | -6% | -6% | -4% | -8% | |
| desligado / ambiente * (dB) | 28.7 | 28.2 2% | 30.3 -6% | 29 -1% | 28.5 1% | 29.7 -3% |
| Idle Minimum * (dB) | 28.7 | 28.2 2% | 30.3 -6% | 29 -1% | 28.5 1% | 29.7 -3% |
| Idle Average * (dB) | 28.7 | 28.2 2% | 30.3 -6% | 29 -1% | 28.5 1% | 29.7 -3% |
| Idle Maximum * (dB) | 28.7 | 29 -1% | 30.3 -6% | 29 -1% | 28.5 1% | 30.1 -5% |
| Load Average * (dB) | 30 | 30.3 -1% | 33.5 -12% | 32 -7% | 30 -0% | 36.8 -23% |
| Load Maximum * (dB) | 32.9 | 39.3 -19% | 33.5 -2% | 40.1 -22% | 41.8 -27% | 36.8 -12% |
* ... menor é melhor
(+) A temperatura máxima no lado superior é 39.3 °C / 103 F, em comparação com a média de 35.9 °C / 97 F , variando de 21.4 a 59 °C para a classe Subnotebook.
(±) A parte inferior aquece até um máximo de 42 °C / 108 F, em comparação com a média de 39.2 °C / 103 F
(+) Em uso inativo, a temperatura média para o lado superior é 23 °C / 73 F, em comparação com a média do dispositivo de 30.8 °C / ### class_avg_f### F.
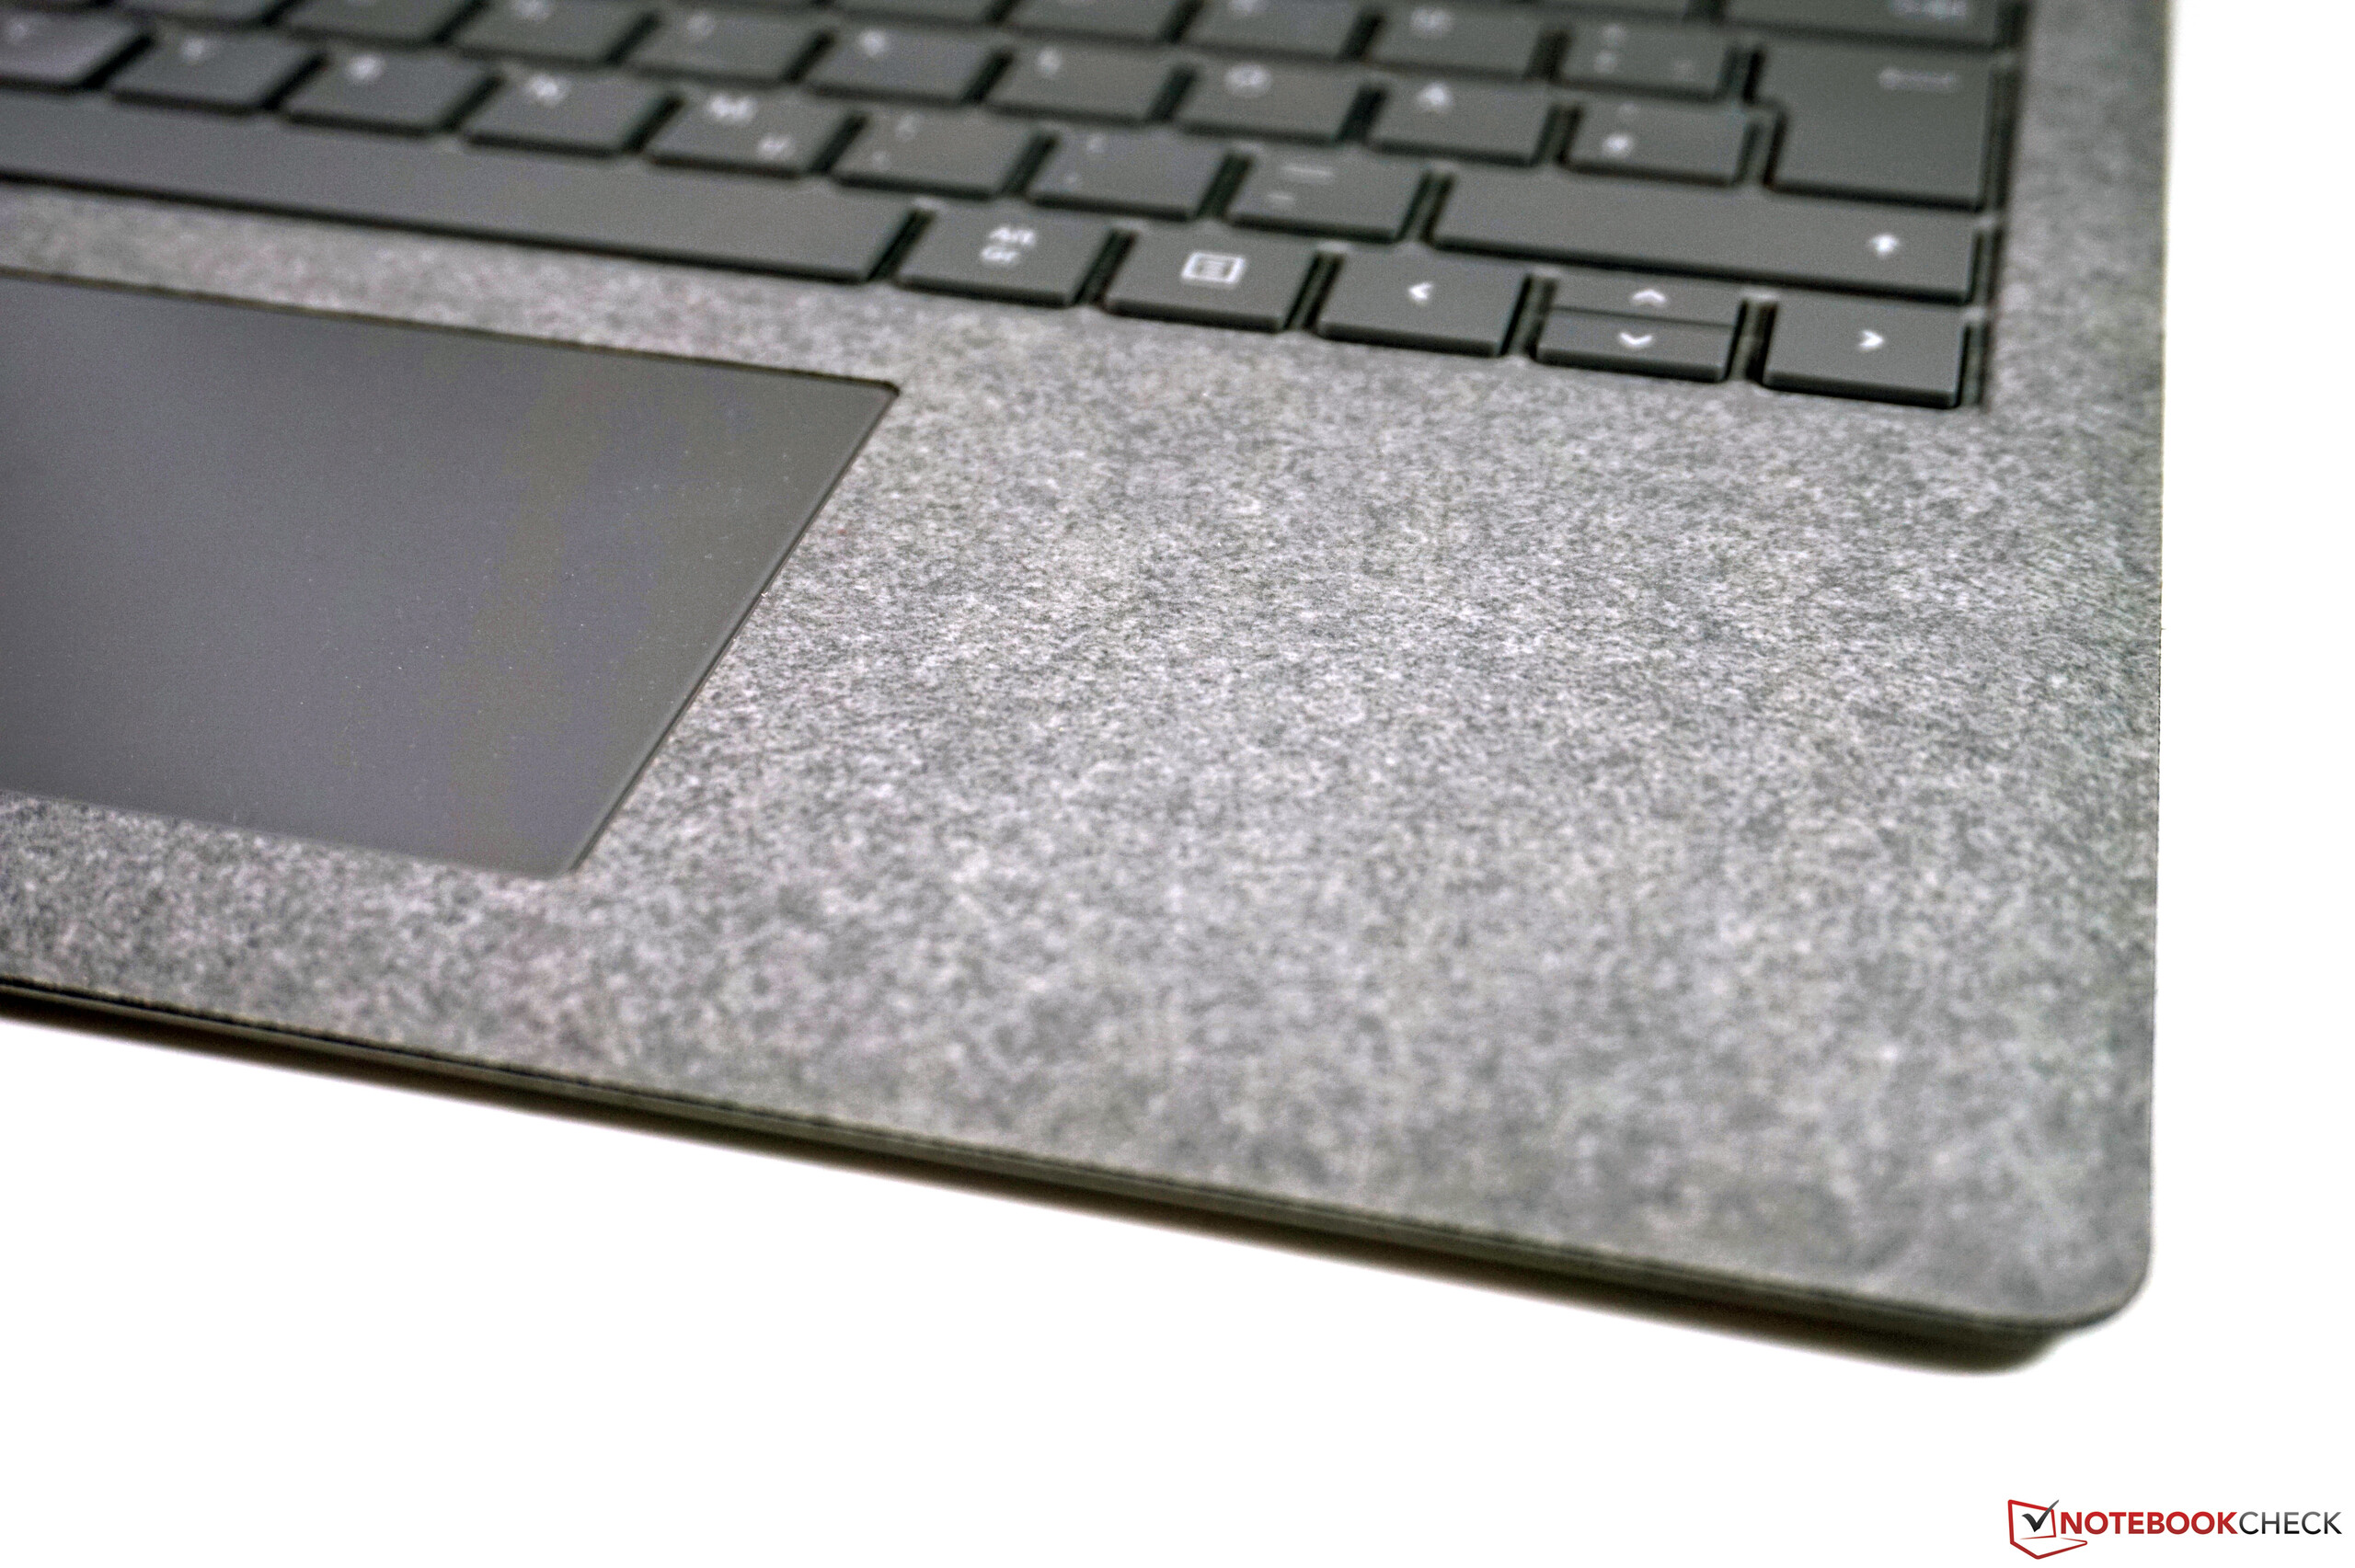
(+) Os apoios para as mãos e o touchpad são mais frios que a temperatura da pele, com um máximo de 29.2 °C / 84.6 F e, portanto, são frios ao toque.
(±) A temperatura média da área do apoio para as mãos de dispositivos semelhantes foi 28.2 °C / 82.8 F (-1 °C / -1.8 F).
Microsoft Surface Laptop 2-LQN-00004 análise de áudio
(±) | o volume do alto-falante é médio, mas bom (###valor### dB)
Graves 100 - 315Hz
(±) | graves reduzidos - em média 10.5% menor que a mediana
(±) | a linearidade dos graves é média (12.2% delta para a frequência anterior)
Médios 400 - 2.000 Hz
(+) | médios equilibrados - apenas 2.7% longe da mediana
(+) | médios são lineares (4.2% delta para frequência anterior)
Altos 2 - 16 kHz
(+) | agudos equilibrados - apenas 1.4% longe da mediana
(+) | os máximos são lineares (4.7% delta da frequência anterior)
Geral 100 - 16.000 Hz
(+) | o som geral é linear (14.5% diferença em relação à mediana)
Comparado com a mesma classe
» 29% de todos os dispositivos testados nesta classe foram melhores, 6% semelhantes, 65% piores
» O melhor teve um delta de 5%, a média foi 18%, o pior foi 53%
Comparado com todos os dispositivos testados
» 19% de todos os dispositivos testados foram melhores, 4% semelhantes, 77% piores
» O melhor teve um delta de 4%, a média foi 23%, o pior foi 134%
Apple MacBook Air 2018 análise de áudio
(±) | o volume do alto-falante é médio, mas bom (###valor### dB)
Graves 100 - 315Hz
(±) | graves reduzidos - em média 8.1% menor que a mediana
(±) | a linearidade dos graves é média (10% delta para a frequência anterior)
Médios 400 - 2.000 Hz
(+) | médios equilibrados - apenas 2.9% longe da mediana
(+) | médios são lineares (5.6% delta para frequência anterior)
Altos 2 - 16 kHz
(+) | agudos equilibrados - apenas 2.2% longe da mediana
(+) | os máximos são lineares (4.5% delta da frequência anterior)
Geral 100 - 16.000 Hz
(+) | o som geral é linear (12.3% diferença em relação à mediana)
Comparado com a mesma classe
» 16% de todos os dispositivos testados nesta classe foram melhores, 5% semelhantes, 79% piores
» O melhor teve um delta de 5%, a média foi 18%, o pior foi 53%
Comparado com todos os dispositivos testados
» 10% de todos os dispositivos testados foram melhores, 3% semelhantes, 87% piores
» O melhor teve um delta de 4%, a média foi 23%, o pior foi 134%
| desligado | |
| Ocioso | |
| Carga |
|
Key:
min: | |
| Microsoft Surface Laptop 2-LQN-00004 i5-8250U, UHD Graphics 620, SK Hynix BC501 NVMe 256 GB, IPS, 2256x1504, 13.5" | Microsoft Surface Laptop i5 i5-7200U, HD Graphics 620, Toshiba THNSN0128GTYA, IPS, 2256x1504, 13.5" | Microsoft Surface Pro 6, Core i7, 512 GB i7-8650U, UHD Graphics 620, Toshiba KBG30ZPZ512G, IPS, 2736x1824, 12.3" | Dell XPS 13 9370 i5 UHD i5-8250U, UHD Graphics 620, Toshiba XG5 KXG50ZNV256G, IPS, 3840x2160, 13.3" | Apple MacBook Air 2018 i5-8210Y, UHD Graphics 617, Apple SSD AP0256, IPS, 2560x1600, 13.3" | Asus ZenBook S UX391U i5-8550U, UHD Graphics 620, Samsung PM961 NVMe MZVLW512HMJP, IPS, 1920x1080, 13.3" | Média Intel UHD Graphics 620 | Média da turma Subnotebook | |
|---|---|---|---|---|---|---|---|---|
| Power Consumption | 11% | -7% | -21% | 16% | -7% | -8% | -17% | |
| Idle Minimum * (Watt) | 3 | 3.2 -7% | 3.2 -7% | 4.3 -43% | 2.2 27% | 3.24 -8% | 3.81 ? -27% | 3.73 ? -24% |
| Idle Average * (Watt) | 6.8 | 6.5 4% | 8.7 -28% | 8 -18% | 5.7 16% | 6.1 10% | 6.94 ? -2% | 6.57 ? 3% |
| Idle Maximum * (Watt) | 8.76 | 6.8 22% | 10.4 -19% | 8.1 8% | 10.3 -18% | 9.2 -5% | 8.75 ? -0% | 7.93 ? 9% |
| Load Average * (Watt) | 35.1 | 28.2 20% | 29.2 17% | 46.6 -33% | 25.6 27% | 38.8 -11% | 35 ? -0% | 42.1 ? -20% |
| Load Maximum * (Watt) | 42.6 | 36 15% | 40.8 4% | 49.8 -17% | 30.6 28% | 52.6 -23% | 47.5 ? -12% | 65.1 ? -53% |
* ... menor é melhor
| Microsoft Surface Laptop 2-LQN-00004 i5-8250U, UHD Graphics 620, 45 Wh | Microsoft Surface Laptop i5 i5-7200U, HD Graphics 620, 45 Wh | Microsoft Surface Pro 6, Core i7, 512 GB i7-8650U, UHD Graphics 620, 45 Wh | Dell XPS 13 9370 i5 UHD i5-8250U, UHD Graphics 620, 52 Wh | Apple MacBook Air 2018 i5-8210Y, UHD Graphics 617, 50.3 Wh | Asus ZenBook S UX391U i5-8550U, UHD Graphics 620, 50 Wh | Média da turma Subnotebook | |
|---|---|---|---|---|---|---|---|
| Duração da bateria | 16% | 6% | -14% | 17% | -2% | 30% | |
| Reader / Idle (h) | 20.8 | 22.5 8% | 18.1 -13% | 14.5 -30% | 22.3 7% | 26.4 ? 27% | |
| H.264 (h) | 13.6 | 12.3 -10% | 10.4 -24% | 15.3 ? 13% | |||
| WiFi v1.3 (h) | 9.1 | 10 10% | 8.5 -7% | 6.8 -25% | 11.1 22% | 8.2 -10% | 13.9 ? 53% |
| Load (h) | 1.6 | 2.1 31% | 2.2 38% | 1.8 13% | 2.2 38% | 1.9 19% | 2.04 ? 27% |
Pro
Contra
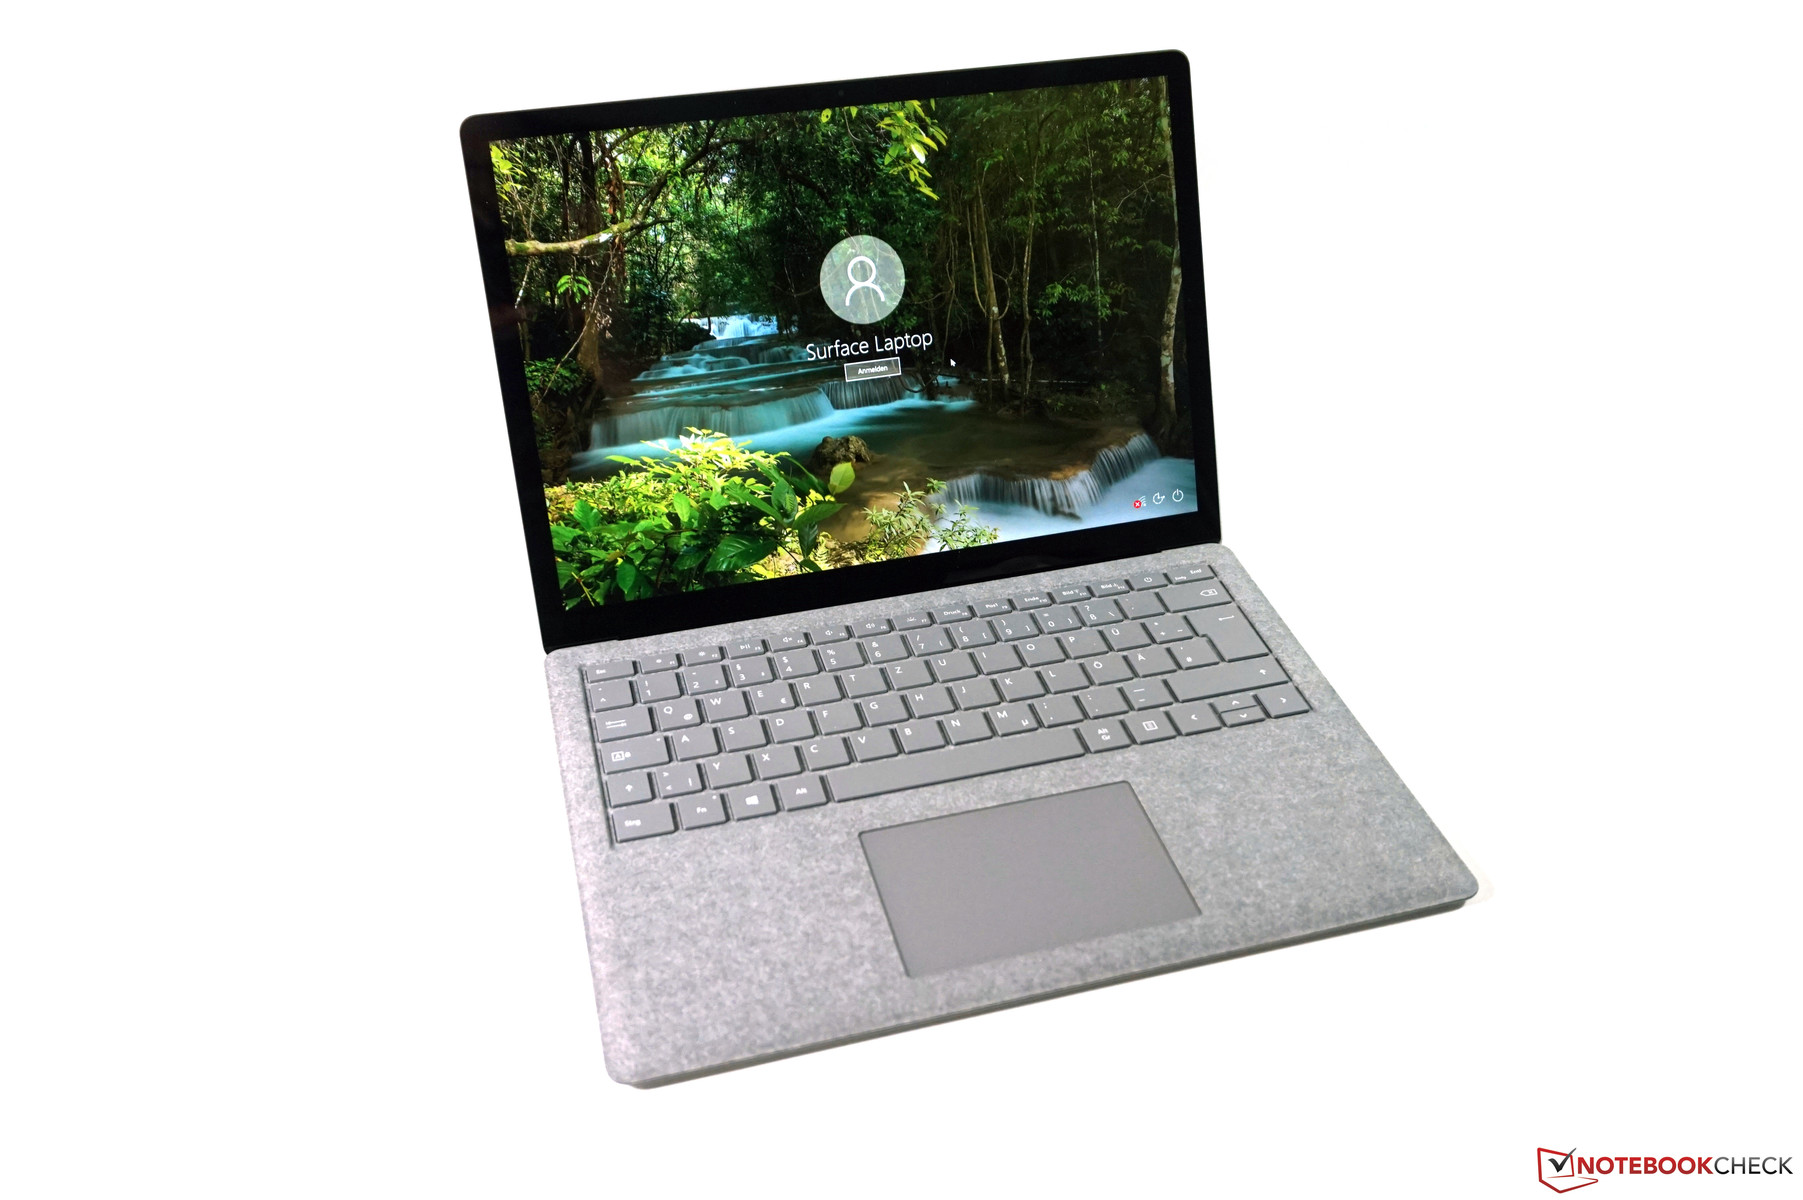
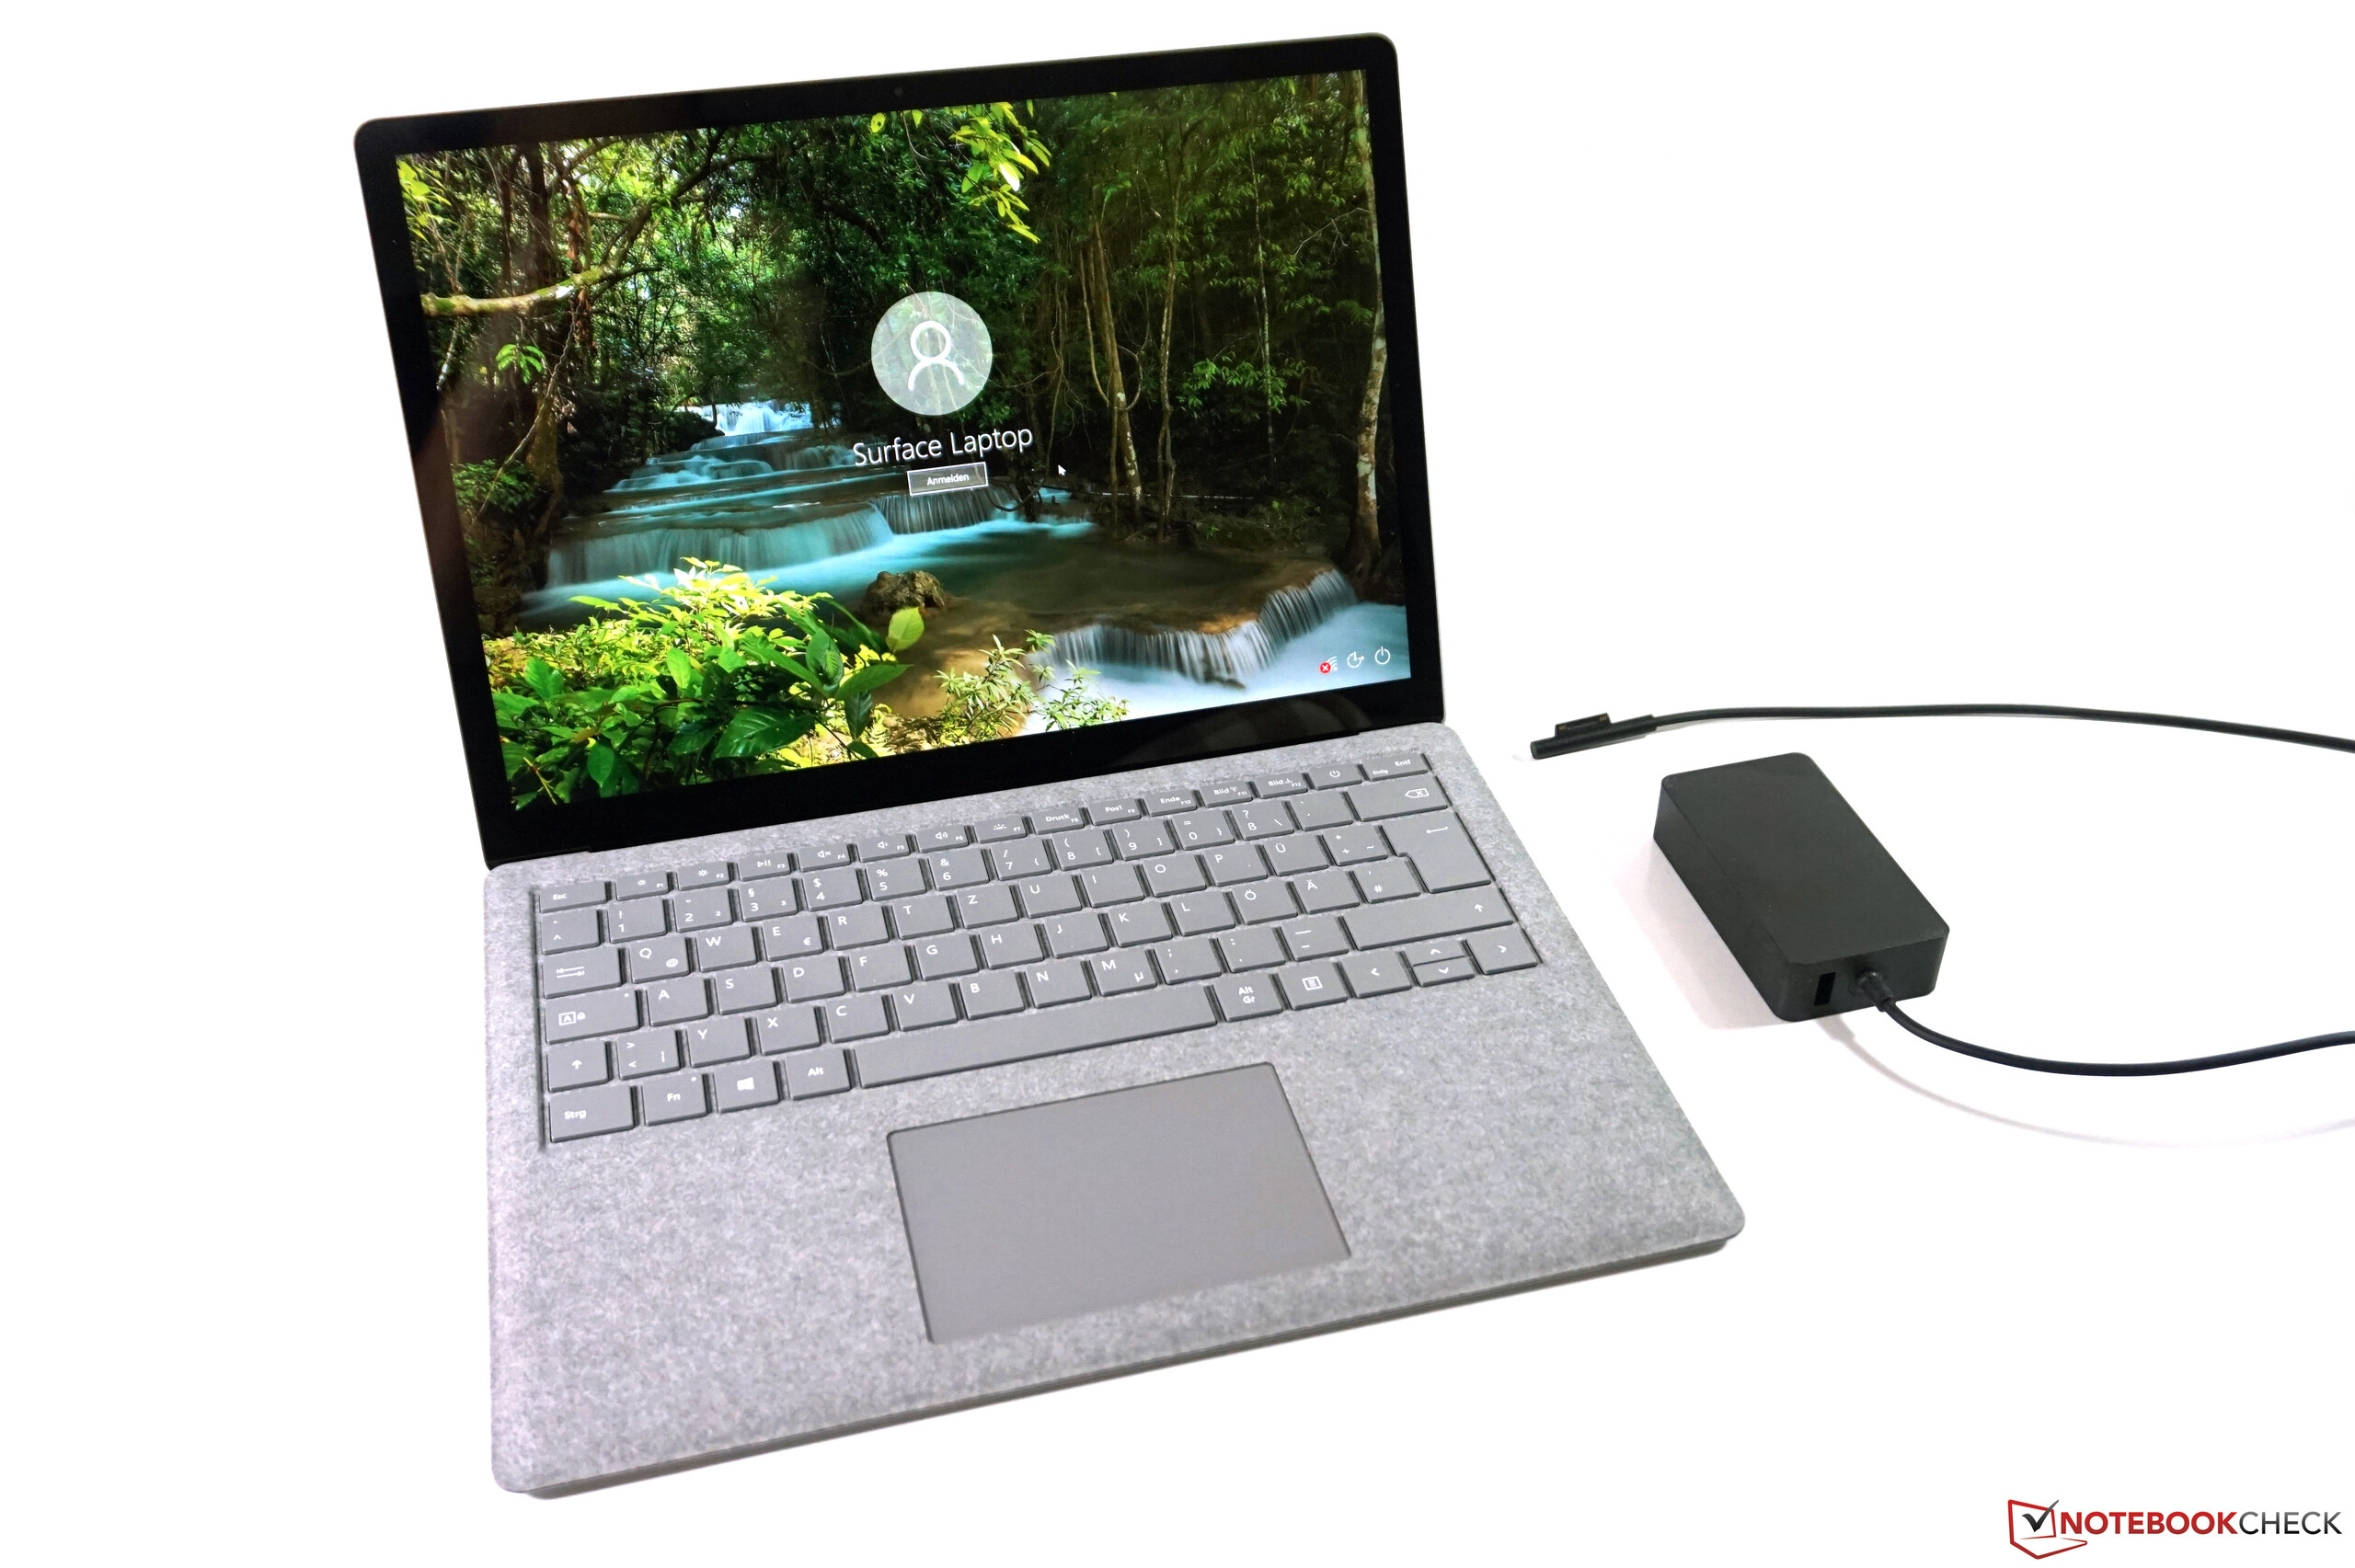
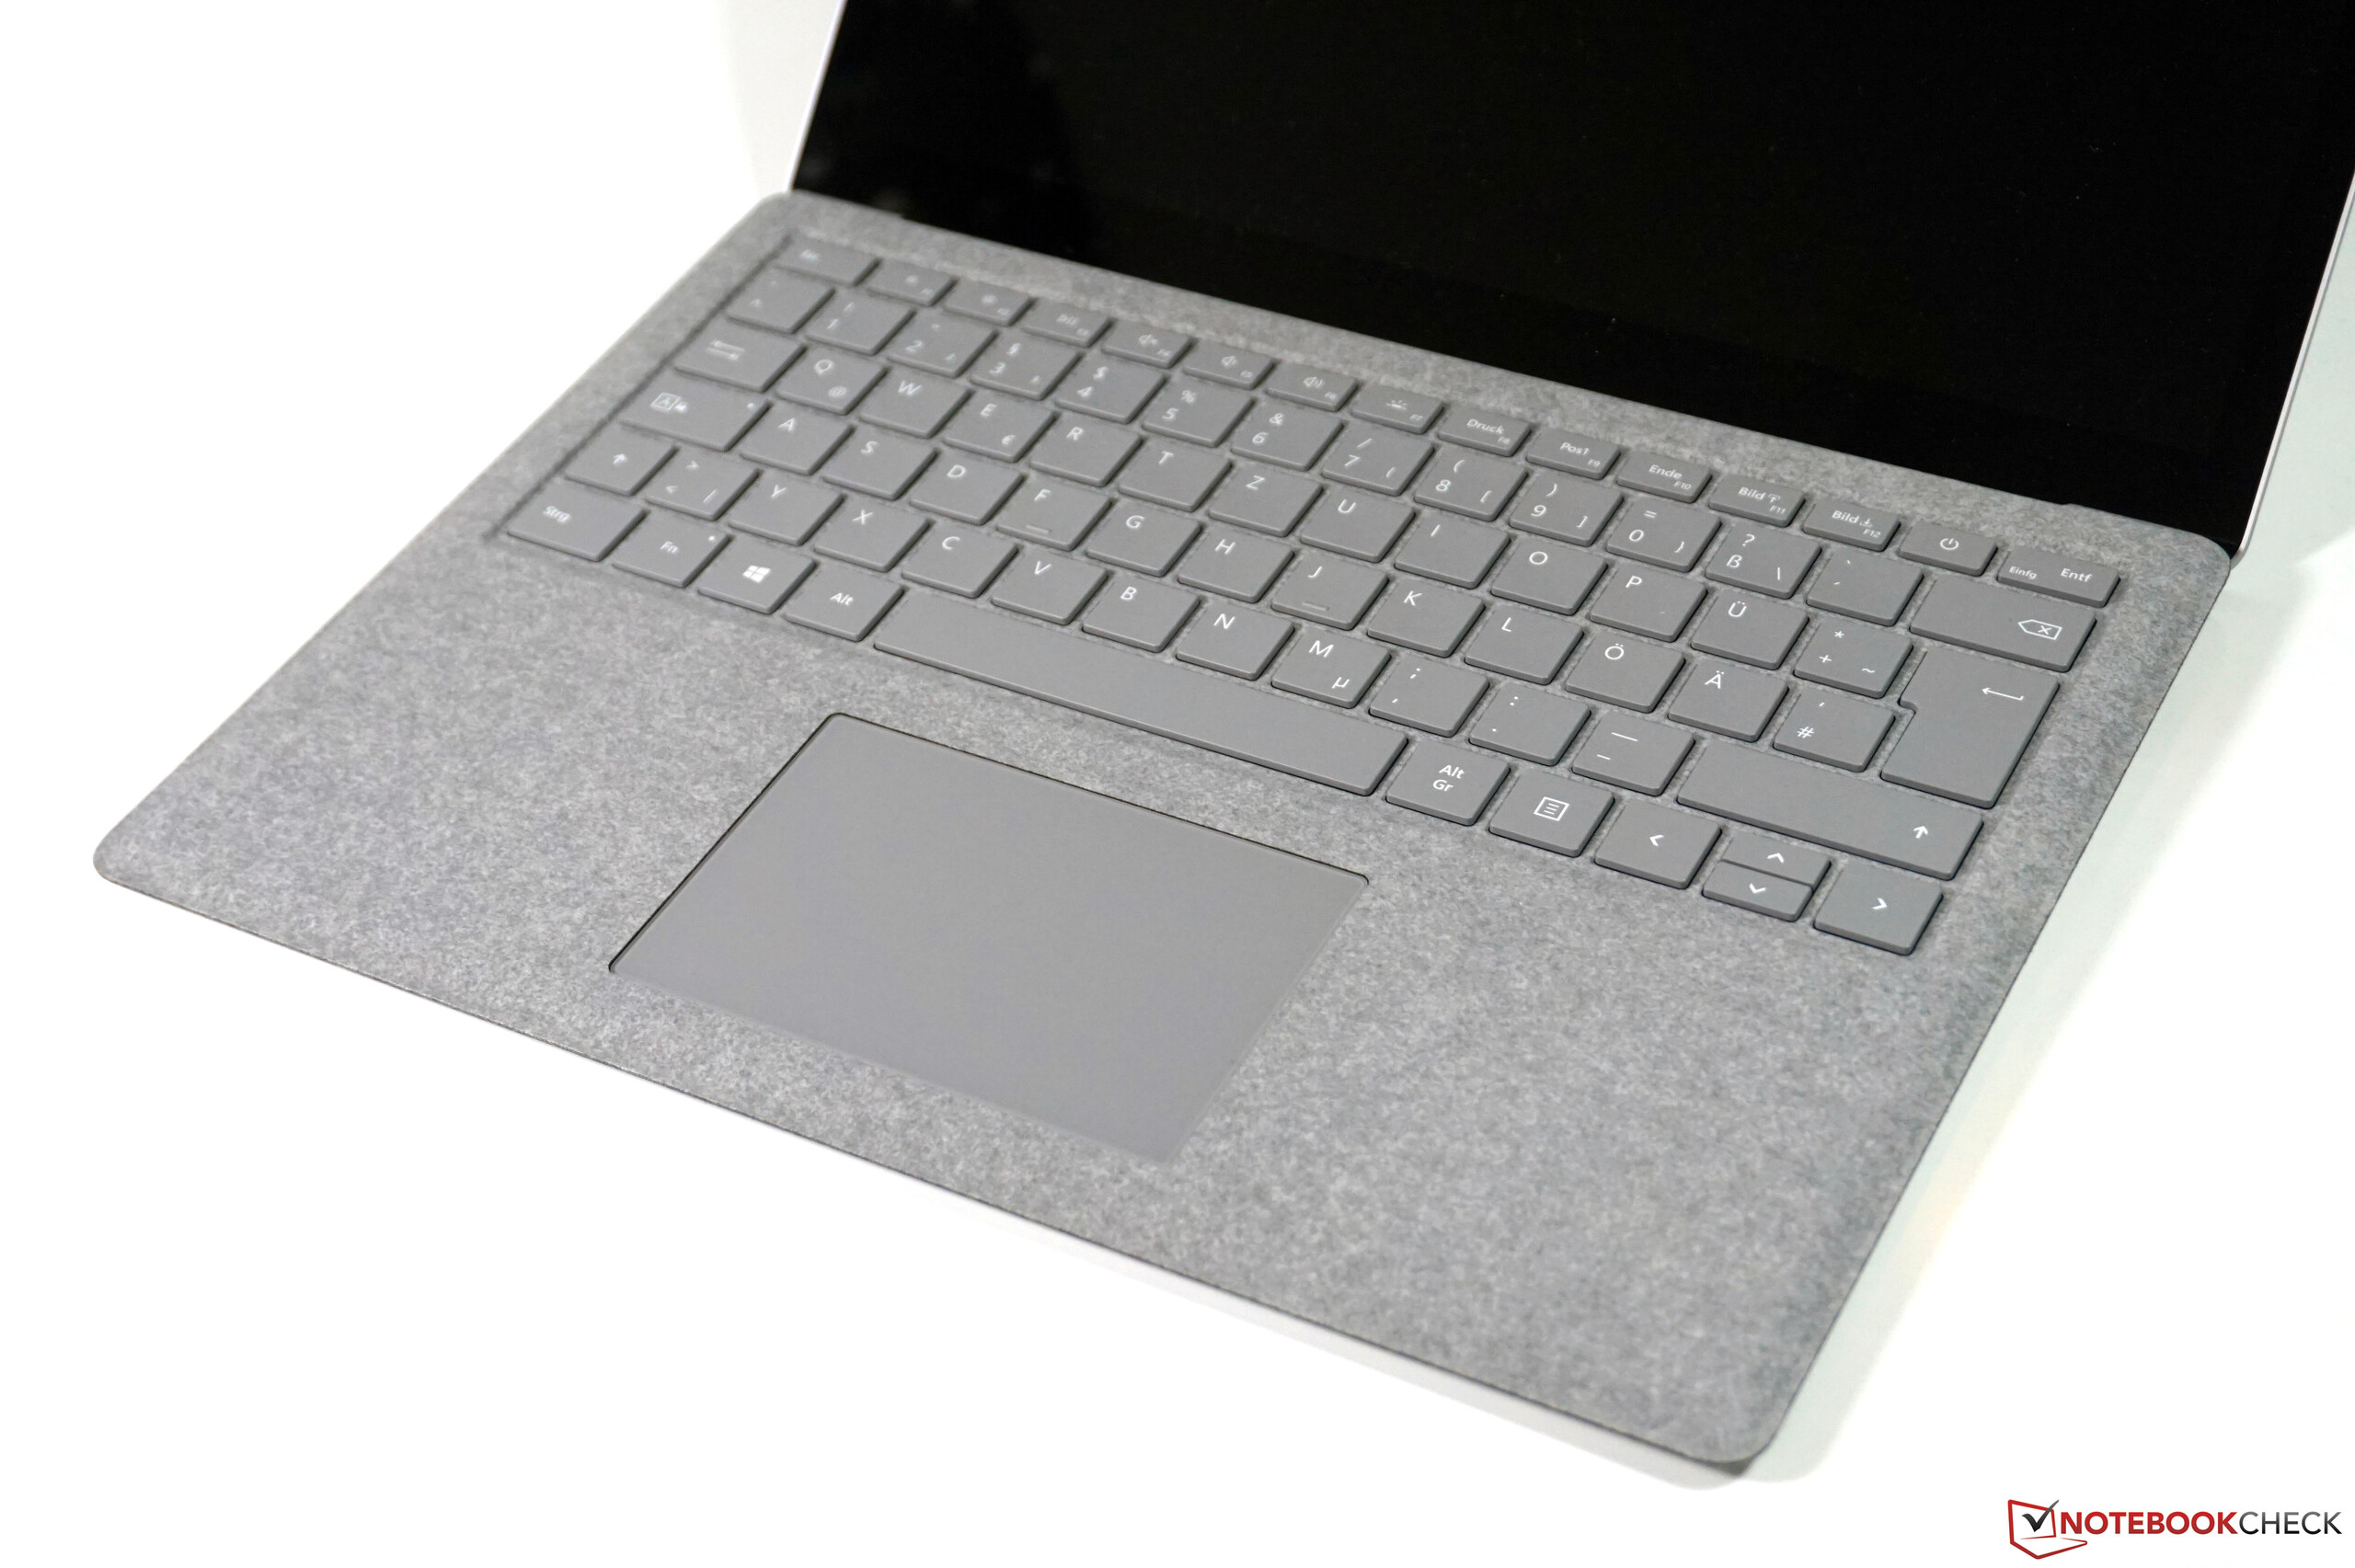
Como mencionado no início, a Microsoft atualizou principalmente o antigo modelo Surface. O portátil Surface 2 oferece processadores atualizados com quatro núcleos, um sistema de resfriamento mais silencioso, alto-falantes levemente aprimorados e uma nova variação de cores. A tela continua a representar o destaque do dispositivo e nos impressiona com sua tela com cores precisas combinadas com bom brilho e alto contraste. Enquanto as tela 4K oferecem maior resolução, a imagem do Surface Laptop 2 é muito realista e realmente gostamos. A tela 3: 2 oferece uma vantagem ao usar aplicativos produtivos. Se os usuários estiverem interessados principalmente em assistir a vídeos, eles podem estar melhor com um painel 16:9. Os dispositivos de entrada também são muito convincentes e o teclado oferece um deslocamento das teclas comparativamente longo, considerando o quão fino é o dispositivo. Como resultado, a digitação é muito confortável.
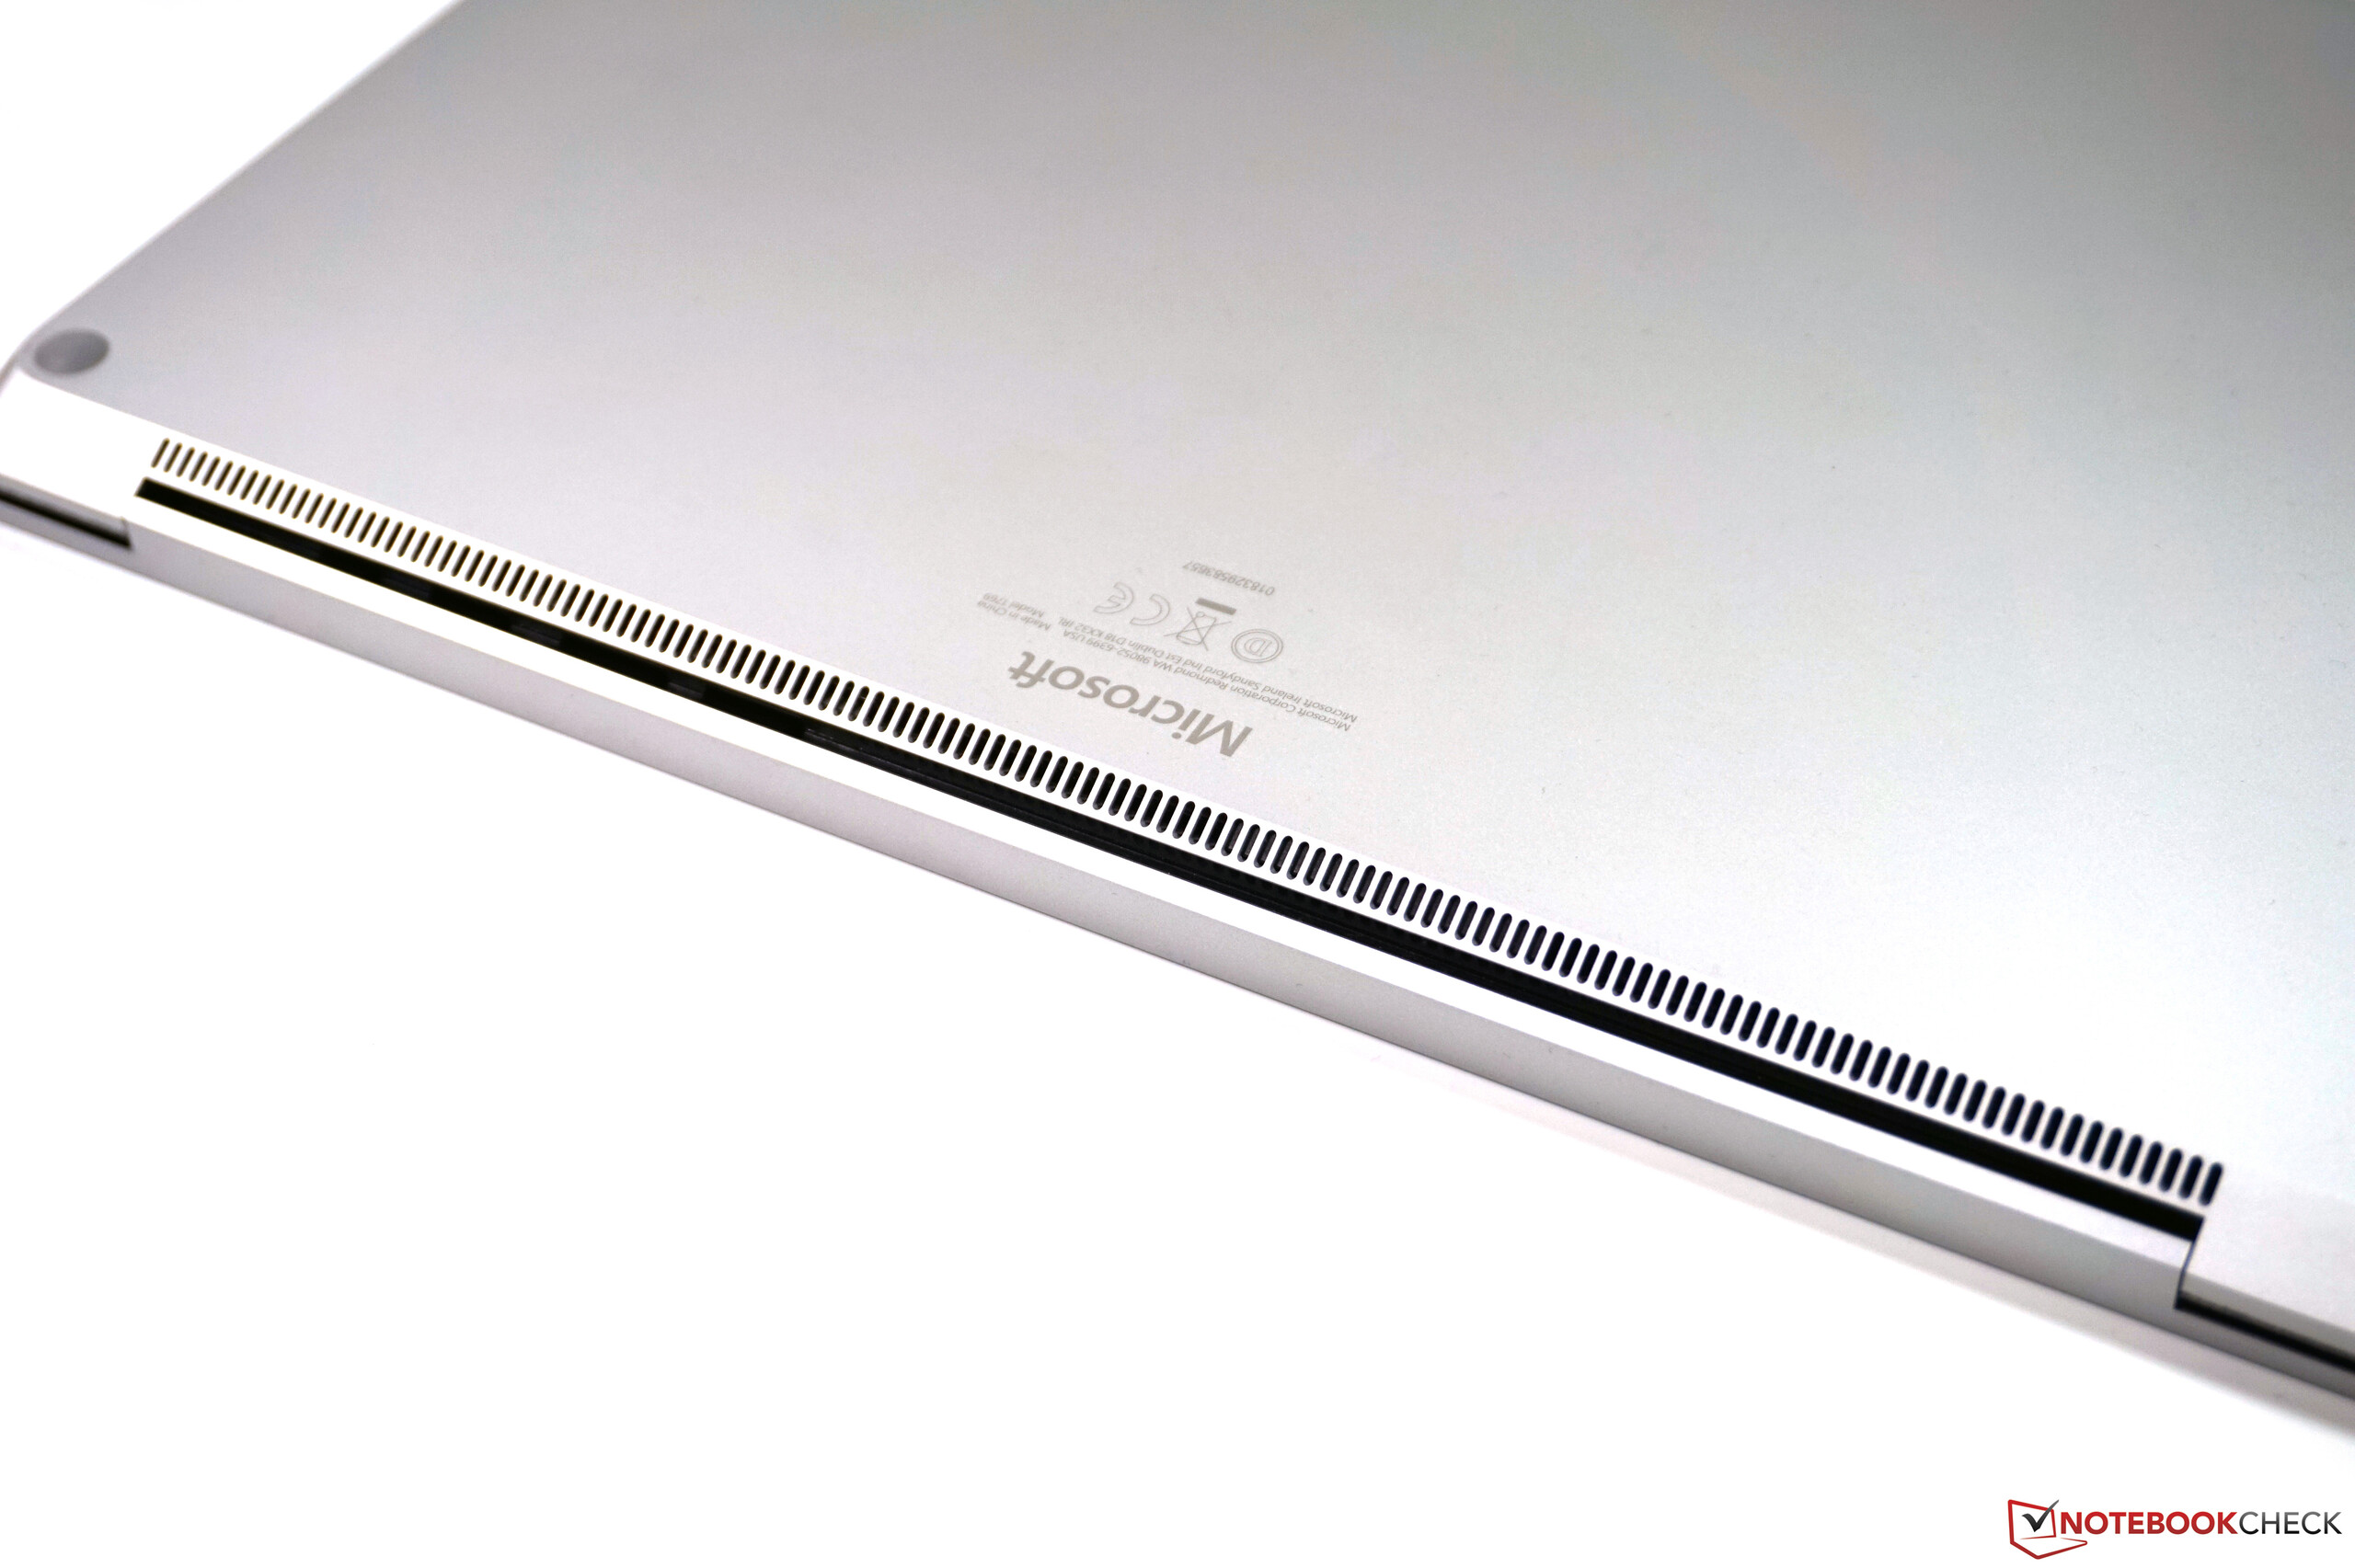
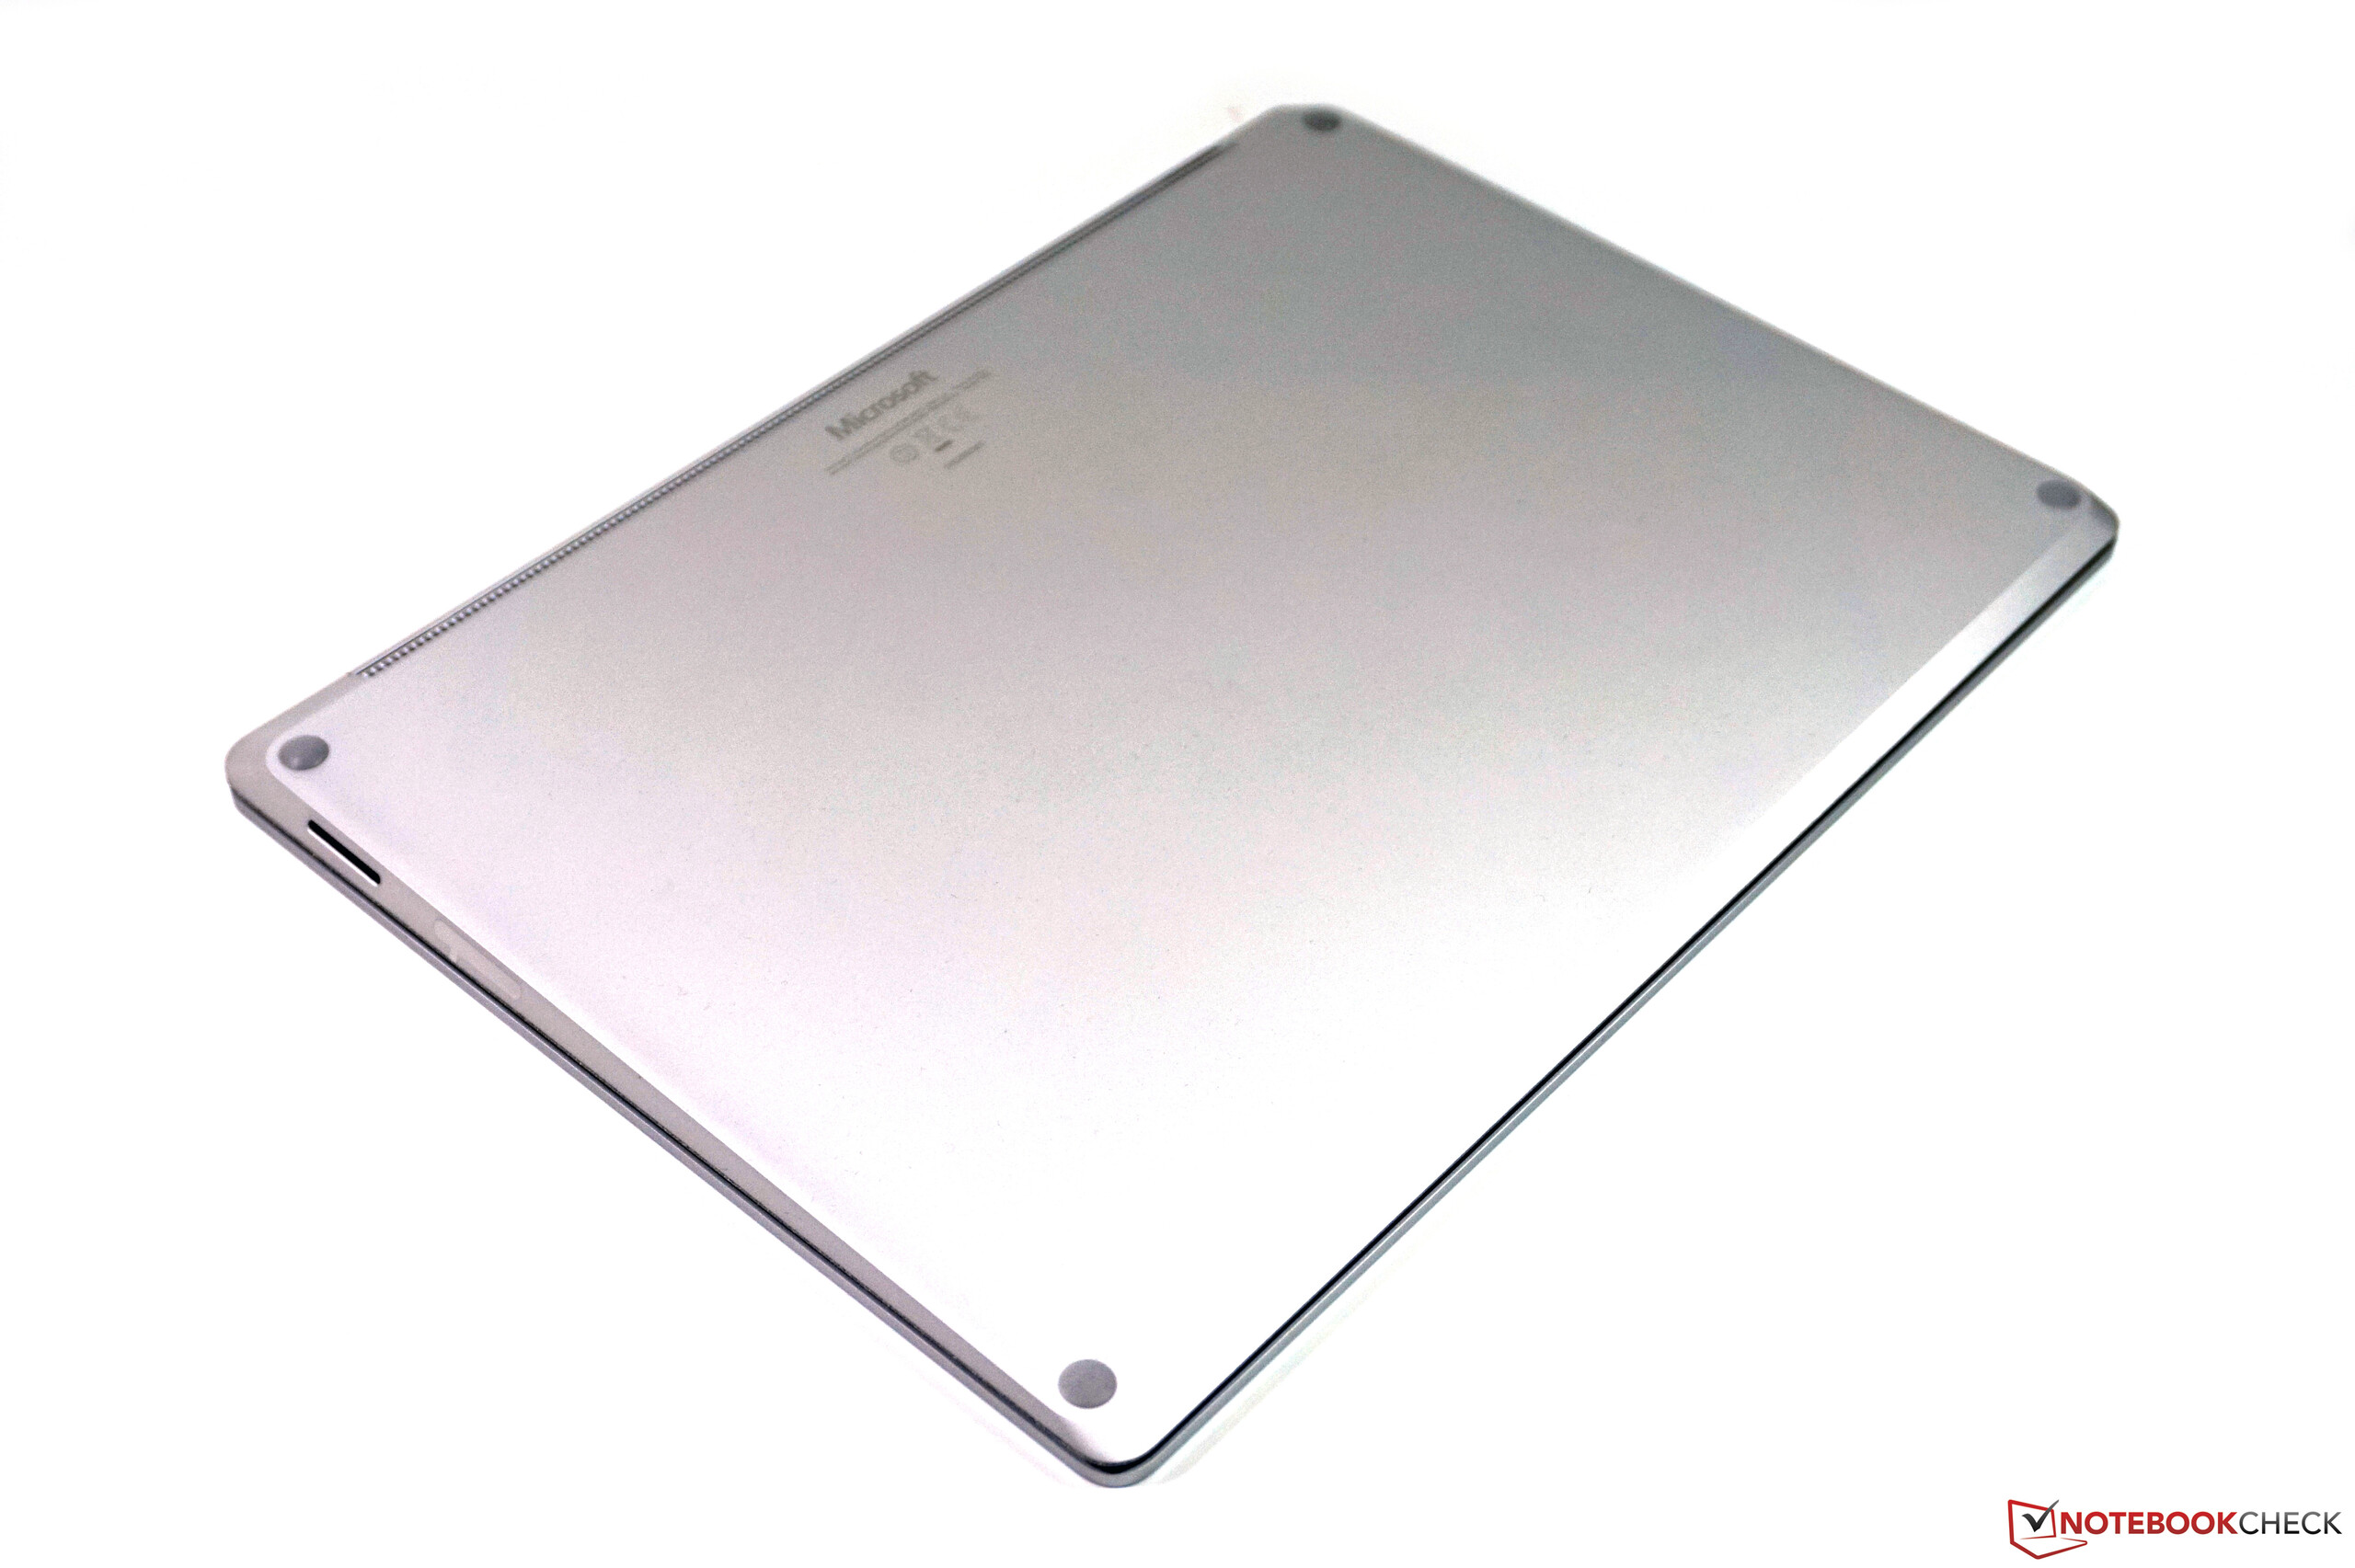
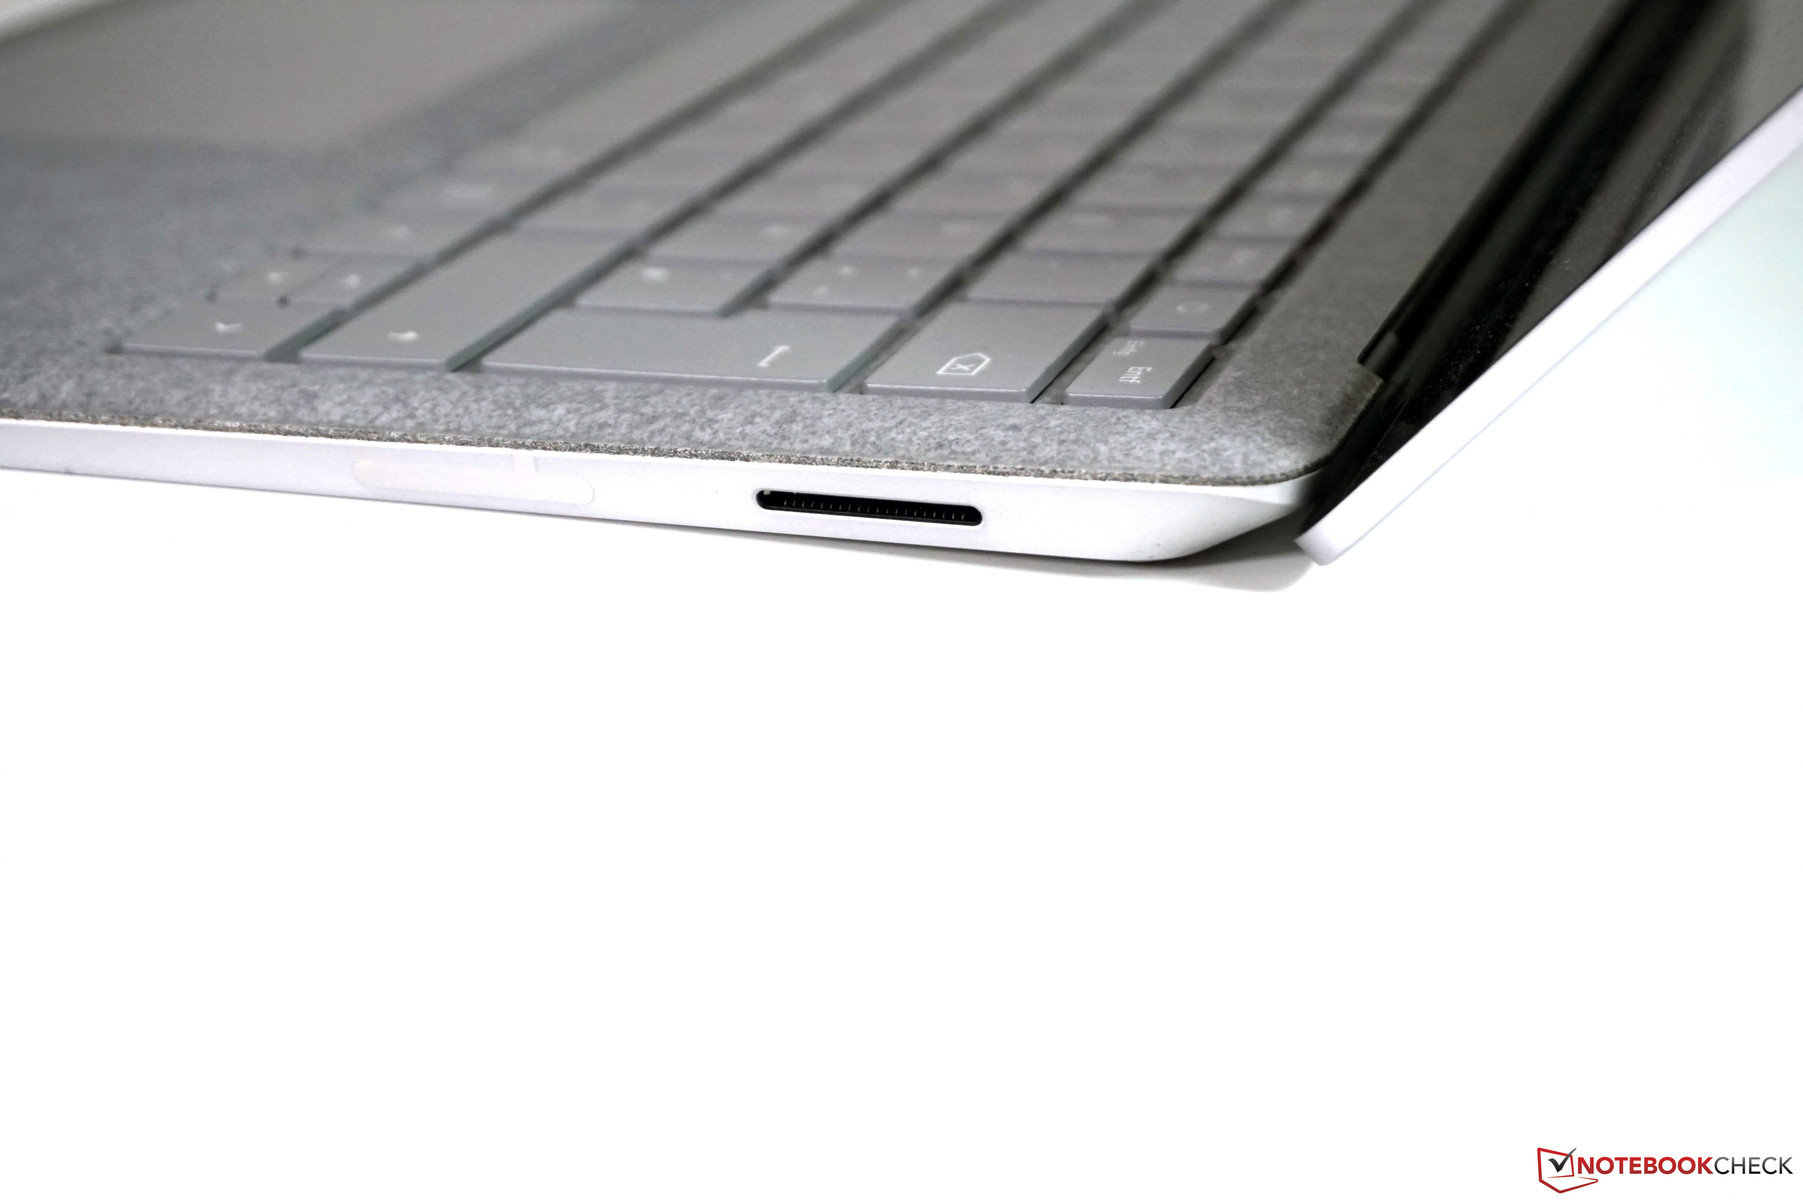
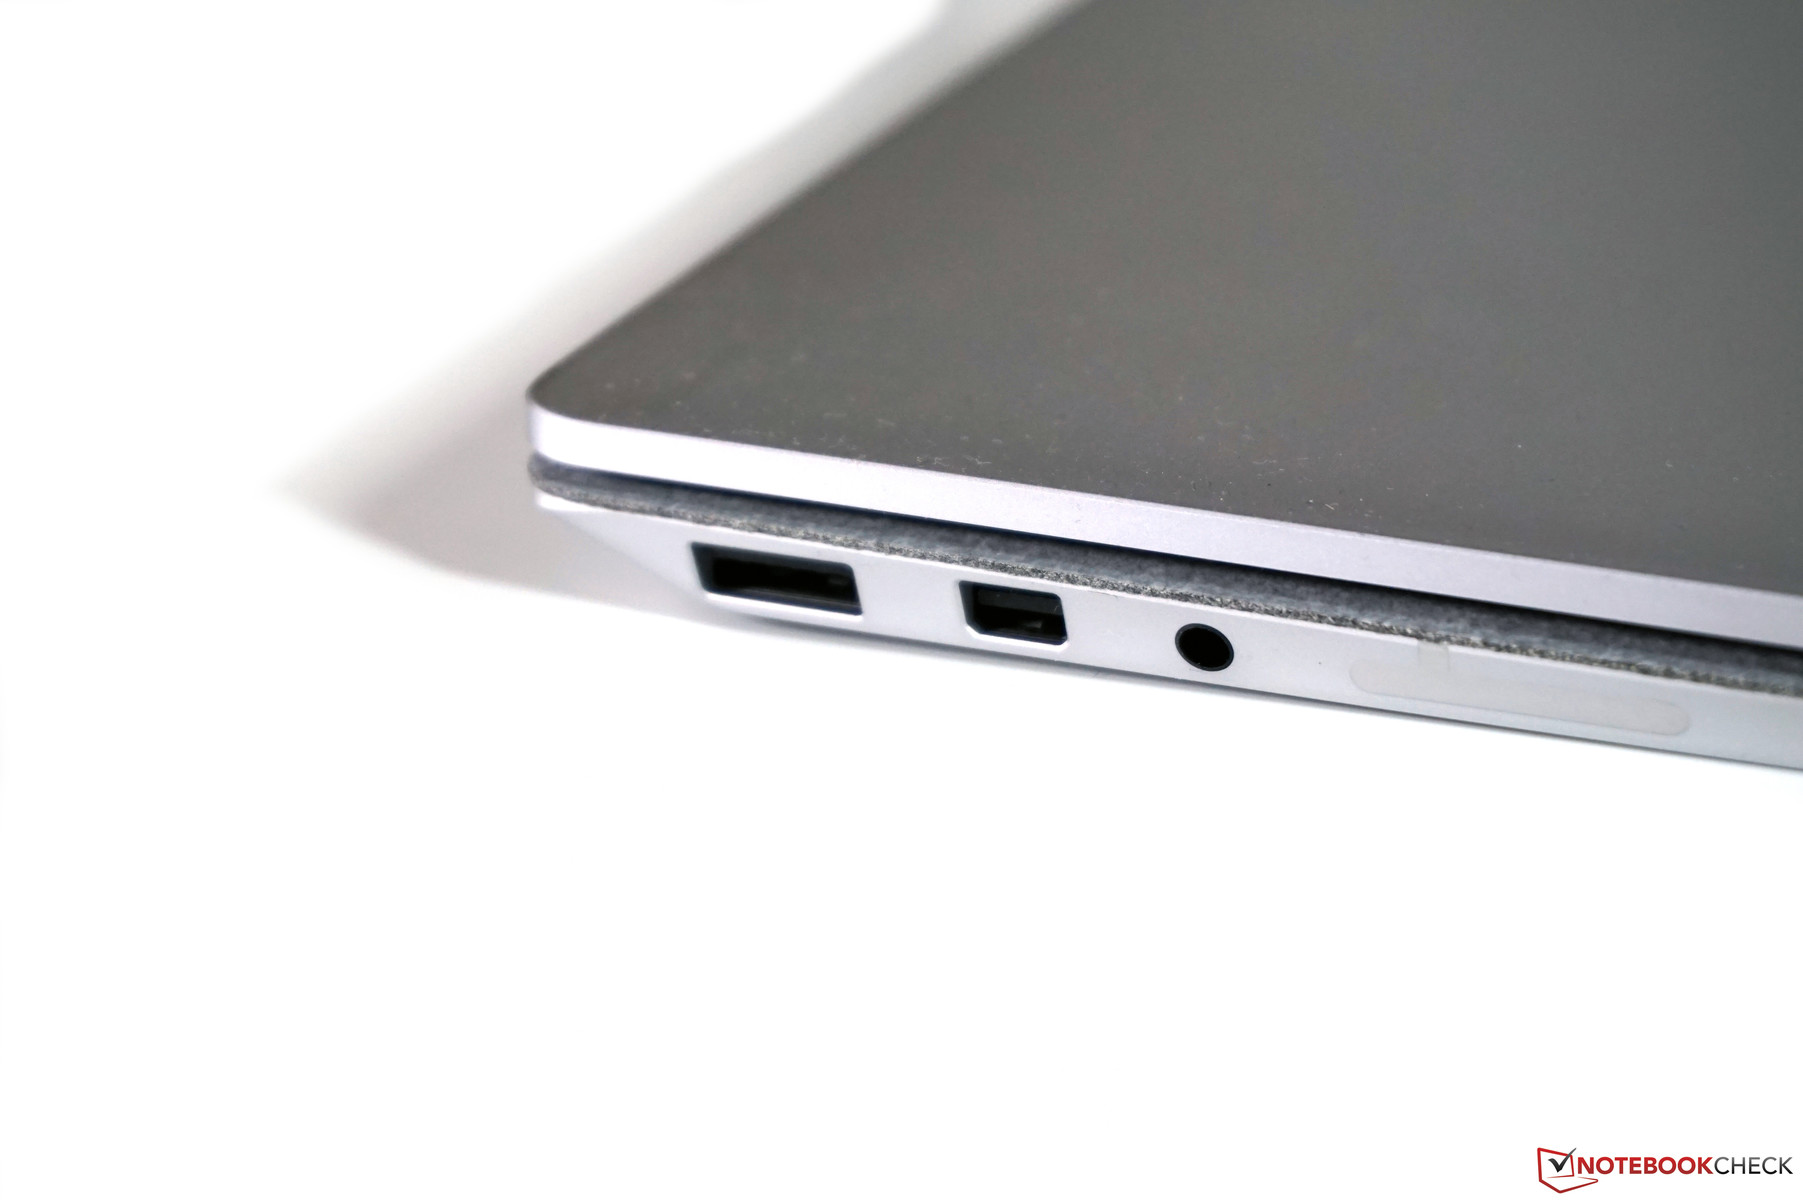
Encontramos dois pontos principais de crítica sobre este dispositivo. O primeiro é a própria carcaça, que, embora seja de alta qualidade e muito estável, é basicamente impossível de abrir. Isso significa que os usuários não são capazes de limpar o ventilador. O segundo problema é a falta da porta Thunderbolt 3. Em vez disso, o dispositivo oferece a porta Surface Connect para a qual a Microsoft possui uma série de dispositivos de conexão. Claro, faz sentido que a Microsoft queira manter esse conector; no entanto, o fabricante poderia ter incluído o Thunderbolt 3 em vez do mini-DisplayPort. Isso teria preparado o dispositivo para o futuro e permitido que os usuários que preferirem ter um único dispositivo para uso fixo e móvel possam conectar eGPUs. Uma outra desvantagem é a falta do leitor de cartões SD - particularmente porque o painel seria muito adequado para o processamento de imagens.
Se você estiver procurando por um portátil de alta qualidade com uma boa tela, operação silenciosa e bons dispositivos de entrada, o Surface Laptop 2 da Microsoft deve ser um bom candidato. Embora o fato de não haver porta Thunderbolt 3 seja decepcionante e incompreensível, isso não afeta atualmente o uso diário.
No entanto, o Surface Laptop 2 oferece um pacote muito bom, especialmente considerando seu grupo-alvo, que consiste de usuários casuais e pessoas que precisam de uma boa tela e tela táctil. A relação preço/desempenho é bom, embora infelizmente a Microsoft tenha estabelecido preços muito elevados para mais RAM e armazenamento SSD e os limites de configuração (dependendo da cor, RAM, etc.) tornam as coisas desnecessariamente complicadas. O Surface Laptop 2 derrota o MacBook Air em nossa comparação, e é provavelmente a melhor (e mais barata) opção para a maioria dos usuários, sem considerar o sistema operacional. Usuários que procuram um dispositivo ainda mais compacto devem dar uma olhada no XPS 13, que também oferece mais hardware e opções de manutenção.
Microsoft Surface Laptop 2-LQN-00004
- 10/22/2019 v7 (old)
Andreas Osthoff
Price comparison
