Breve Análise do Portátil Dell XPS 13 9370 (i5-8250U, 4K UHD)


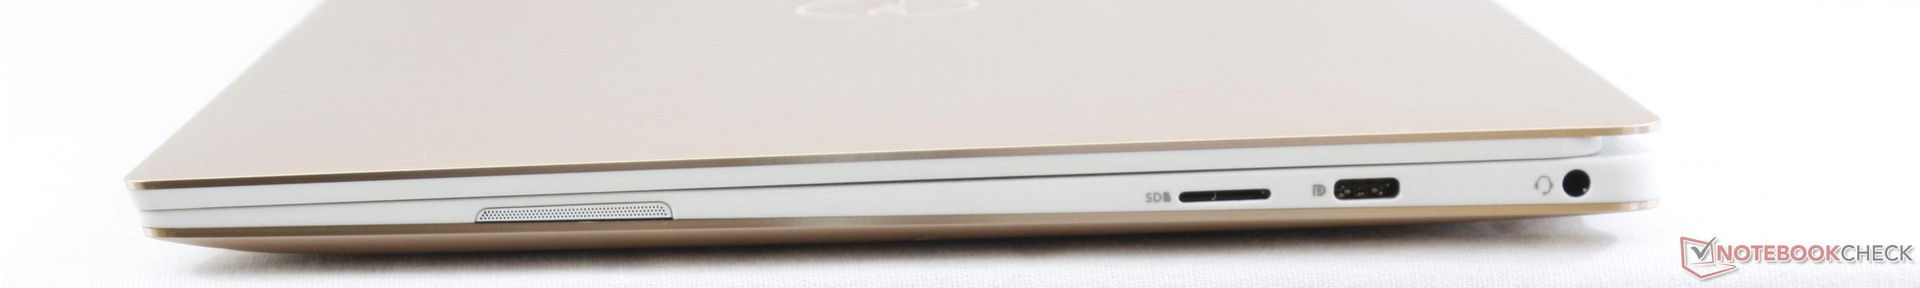
| SD Card Reader | |
| average JPG Copy Test (av. of 3 runs) | |
| Dell XPS 13 9370 i5 UHD | |
| Dell XPS 13 i7-8550U | |
| Dell XPS 15-9550 i7 | |
| maximum AS SSD Seq Read Test (1GB) | |
| Dell XPS 15-9550 i7 | |
| Dell XPS 13 9370 i5 UHD | |
| Dell XPS 13 i7-8550U | |
| Networking | |
| iperf3 transmit AX12 | |
| Dell XPS 13 9360 FHD i7 Iris | |
| Samsung Notebook 9 NP900X3N-K01US | |
| Dell XPS 13 9370 i5 UHD | |
| iperf3 receive AX12 | |
| Samsung Notebook 9 NP900X3N-K01US | |
| Dell XPS 13 9370 i5 UHD | |
| Dell XPS 13 9360 FHD i7 Iris | |
| |||||||||||||||||||||||||
iluminação: 84 %
iluminação com acumulador: 496.4 cd/m²
Contraste: 993:1 (Preto: 0.5 cd/m²)
ΔE ColorChecker Calman: 2.9 | ∀{0.5-29.43 Ø4.71}
ΔE Greyscale Calman: 3.9 | ∀{0.09-98 Ø4.96}
98.2% sRGB (Argyll 1.6.3 3D)
63.9% AdobeRGB 1998 (Argyll 1.6.3 3D)
69.5% AdobeRGB 1998 (Argyll 3D)
98.4% sRGB (Argyll 3D)
68.9% Display P3 (Argyll 3D)
Gamma: 2.066
CCT: 7169 K
| Dell XPS 13 9370 i5 UHD ID: Sharp SHP148B, Name: LQ133D1, Dell P/N: 8XDHY, IPS, 13.3", 3840x2160 | Dell XPS 13 9370 FHD i5 SHP1484, IPS, 13.3", 1920x1080 | Dell XPS 13 9360 QHD+ i7 Sharp SHP144A, IPS, 13.3", 3200x1800 | Samsung Notebook 9 NP900X3N-K01US ID: BOE06E1, Name: NV133FHB-N31, IPS, 13.3", 1920x1080 | Asus ZenBook 13 UX331UN B133HAN04.9, IPS LED, 13.3", 1920x1080 | Apple MacBook Pro 13 2017 APPA033, IPS, 13.3", 2560x1600 | Acer Swift 7 SF713-51 Chimei Innolux, N133HCE-GP1, IPS, WLED, 13.3", 1920x1080 | |
|---|---|---|---|---|---|---|---|
| Display | -1% | -8% | -9% | -5% | 24% | -7% | |
| Display P3 Coverage (%) | 68.9 | 68.9 0% | 62.8 -9% | 63.4 -8% | 65.4 -5% | 99.2 44% | 64.6 -6% |
| sRGB Coverage (%) | 98.4 | 96.6 -2% | 89.4 -9% | 88.6 -10% | 93.1 -5% | 99.9 2% | 89.1 -9% |
| AdobeRGB 1998 Coverage (%) | 69.5 | 69.6 0% | 64.6 -7% | 64 -8% | 66.4 -4% | 87.1 25% | 64.8 -7% |
| Response Times | -2% | 33% | 28% | 46% | 34% | 45% | |
| Response Time Grey 50% / Grey 80% * (ms) | 67.2 ? | 62.4 ? 7% | 43.6 ? 35% | 41.6 ? 38% | 22.4 ? 67% | 42.8 ? 36% | 31 ? 54% |
| Response Time Black / White * (ms) | 41.6 ? | 45.6 ? -10% | 29.2 ? 30% | 34 ? 18% | 31.2 ? 25% | 28.8 ? 31% | 27 ? 35% |
| PWM Frequency (Hz) | 2500 ? | 1008 ? | 210.1 ? | ||||
| Screen | 1% | -5% | -5% | -11% | 24% | -14% | |
| Brightness middle (cd/m²) | 496.4 | 428 -14% | 396.2 -20% | 510.7 3% | 338 -32% | 588 18% | 359 -28% |
| Brightness (cd/m²) | 469 | 405 -14% | 357 -24% | 481 3% | 321 -32% | 561 20% | 344 -27% |
| Brightness Distribution (%) | 84 | 87 4% | 84 0% | 90 7% | 90 7% | 92 10% | 92 10% |
| Black Level * (cd/m²) | 0.5 | 0.26 48% | 0.266 47% | 0.66 -32% | 0.35 30% | 0.45 10% | 0.25 50% |
| Contrast (:1) | 993 | 1646 66% | 1489 50% | 774 -22% | 966 -3% | 1307 32% | 1436 45% |
| Colorchecker dE 2000 * | 2.9 | 3.8 -31% | 3.9 -34% | 2.4 17% | 4.2 -45% | 1.7 41% | 4.57 -58% |
| Colorchecker dE 2000 max. * | 5.26 | 7.2 -37% | 7.58 -44% | 7.3 -39% | 6.5 -24% | 3.5 33% | 9.25 -76% |
| Greyscale dE 2000 * | 3.9 | 4.4 -13% | 4.16 -7% | 2.4 38% | 3.9 -0% | 1.9 51% | 5.2 -33% |
| Gamma | 2.066 106% | 2.21 100% | 2.31 95% | 2.23 99% | 2.43 91% | 2.33 94% | 2.47 89% |
| CCT | 7169 91% | 7067 92% | 6514 100% | 6747 96% | 7144 91% | 6738 96% | 6887 94% |
| Color Space (Percent of AdobeRGB 1998) (%) | 63.9 | 62.8 -2% | 57.5 -10% | 57 -11% | 60.4 -5% | 77.92 22% | 58 -9% |
| Color Space (Percent of sRGB) (%) | 98.2 | 96.4 -2% | 88.7 -10% | 88.1 -10% | 93.1 -5% | 99.94 2% | 89 -9% |
| Média Total (Programa/Configurações) | -1% /
0% | 7% /
-1% | 5% /
-1% | 10% /
-2% | 27% /
25% | 8% /
-5% |
* ... menor é melhor
Exibir tempos de resposta
| ↔ Tempo de resposta preto para branco | ||
|---|---|---|
| 41.6 ms ... ascensão ↗ e queda ↘ combinadas | ↗ 22.8 ms ascensão | 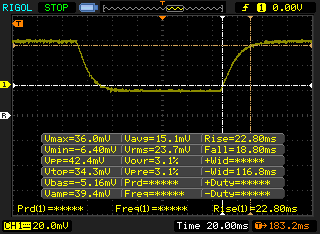 |
| ↘ 18.8 ms queda | ||
| A tela mostra taxas de resposta lentas em nossos testes e será insatisfatória para os jogadores. Em comparação, todos os dispositivos testados variam de 0.1 (mínimo) a 240 (máximo) ms. » 98 % de todos os dispositivos são melhores. Isso significa que o tempo de resposta medido é pior que a média de todos os dispositivos testados (19.8 ms). | ||
| ↔ Tempo de resposta 50% cinza a 80% cinza | ||
| 67.2 ms ... ascensão ↗ e queda ↘ combinadas | ↗ 31.6 ms ascensão | 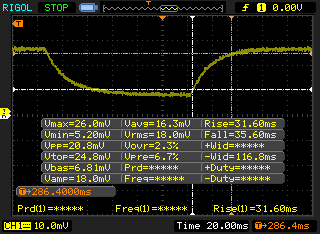 |
| ↘ 35.6 ms queda | ||
| A tela mostra taxas de resposta lentas em nossos testes e será insatisfatória para os jogadores. Em comparação, todos os dispositivos testados variam de 0.165 (mínimo) a 636 (máximo) ms. » 98 % de todos os dispositivos são melhores. Isso significa que o tempo de resposta medido é pior que a média de todos os dispositivos testados (31 ms). | ||
Cintilação da tela / PWM (modulação por largura de pulso)
| Tela tremeluzindo/PWM detectado | 2500 Hz | ≤ 20 % configuração de brilho | 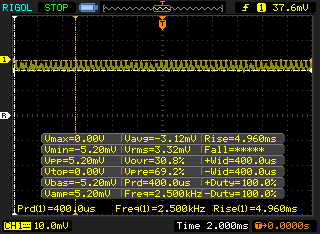 |
A luz de fundo da tela pisca em 2500 Hz (pior caso, por exemplo, utilizando PWM) Cintilação detectada em uma configuração de brilho de 20 % e abaixo. Não deve haver cintilação ou PWM acima desta configuração de brilho. A frequência de 2500 Hz é bastante alta, então a maioria dos usuários sensíveis ao PWM não deve notar nenhuma oscilação. [pwm_comparison] Em comparação: 52 % de todos os dispositivos testados não usam PWM para escurecer a tela. Se PWM foi detectado, uma média de 7754 (mínimo: 5 - máximo: 343500) Hz foi medida. | |||
XPS 13 9370 i5-8250U
XPS 13 9360 i5-8250U
| wPrime 2.10 - 1024m | |
| Lenovo IdeaPad Z40-59422614 | |
| Lenovo ThinkPad 25 | |
| Dell Inspiron 15 7000 7577 | |
| HP Envy x360 15m-bq121dx | |
| Dell XPS 13 9370 i5 UHD | |
* ... menor é melhor
| PCMark 8 Home Score Accelerated v2 | 3471 pontos | |
| PCMark 8 Creative Score Accelerated v2 | 4933 pontos | |
| PCMark 8 Work Score Accelerated v2 | 4140 pontos | |
| PCMark 10 Score | 3678 pontos | |
Ajuda | ||
| Dell XPS 13 9370 i5 UHD Toshiba XG5 KXG50ZNV256G | Dell XPS 13 9360 QHD+ i7 Toshiba NVMe THNSN5256GPUK | Samsung Notebook 9 NP900X3N-K01US Samsung CM871a MZNTY256HDHP | HP Spectre x360 13-ac033dx Samsung PM961 NVMe MZVLW512HMJP | Asus ZenBook 13 UX331UN SanDisk SD8SN8U512G1002 | |
|---|---|---|---|---|---|
| AS SSD | -13% | -38% | 65% | -57% | |
| Copy Game MB/s (MB/s) | 291.4 | 534 83% | 186.8 -36% | 1123 285% | 324.3 11% |
| Copy Program MB/s (MB/s) | 207 | 251.4 21% | 213 3% | 466.7 125% | 168.5 -19% |
| Copy ISO MB/s (MB/s) | 357.4 | 285.1 -20% | 335.9 -6% | 1672 368% | 405 13% |
| Score Total (Points) | 2437 | 1570 -36% | 1057 -57% | 2219 -9% | 907 -63% |
| Score Write (Points) | 1135 | 360 -68% | 350 -69% | 832 -27% | 253 -78% |
| Score Read (Points) | 894 | 822 -8% | 463 -48% | 945 6% | 433 -52% |
| Access Time Write * (ms) | 0.038 | 0.033 13% | 0.053 -39% | 0.031 18% | 0.09 -137% |
| Access Time Read * (ms) | 0.063 | 0.065 -3% | 0.066 -5% | 0.036 43% | 0.143 -127% |
| 4K-64 Write (MB/s) | 937 | 205.6 -78% | 223.8 -76% | 566 -40% | 174.9 -81% |
| 4K-64 Read (MB/s) | 657 | 655 0% | 379.4 -42% | 641 -2% | 362.8 -45% |
| 4K Write (MB/s) | 107.2 | 95.6 -11% | 79.2 -26% | 118.5 11% | 49.58 -54% |
| 4K Read (MB/s) | 33.81 | 31.64 -6% | 31.24 -8% | 48.18 43% | 25.47 -25% |
| Seq Write (MB/s) | 907 | 586 -35% | 466 -49% | 1476 63% | 283.3 -69% |
| Seq Read (MB/s) | 2037 | 1346 -34% | 520 -74% | 2556 25% | 448.2 -78% |
* ... menor é melhor

| 3DMark 11 Performance | 2033 pontos | |
| 3DMark Ice Storm Standard Score | 65803 pontos | |
| 3DMark Cloud Gate Standard Score | 8789 pontos | |
| 3DMark Fire Strike Score | 1108 pontos | |
| 3DMark Fire Strike Extreme Score | 520 pontos | |
Ajuda | ||
| baixo | média | alto | ultra | |
|---|---|---|---|---|
| BioShock Infinite (2013) | 70.9 | 34.5 | 29.9 | 10.1 |
| Rise of the Tomb Raider (2016) | 24.6 | 13.8 |
Barulho
| Ocioso |
| 29 / 29 / 29 dB |
| Carga |
| 32 / 40.1 dB |
 | ||
30 dB silencioso 40 dB(A) audível 50 dB(A) ruidosamente alto |
||
min: | ||
| Dell XPS 13 9370 i5 UHD UHD Graphics 620, i5-8250U, Toshiba XG5 KXG50ZNV256G | Dell XPS 13 9360 QHD+ i7 HD Graphics 620, i7-7500U, Toshiba NVMe THNSN5256GPUK | Samsung Notebook 9 NP900X3N-K01US HD Graphics 620, i5-7200U, Samsung CM871a MZNTY256HDHP | Asus ZenBook 13 UX331UN GeForce MX150, i5-8550U, SanDisk SD8SN8U512G1002 | Razer Blade Stealth QHD i7-8550U UHD Graphics 620, i5-8550U, Samsung PM961 NVMe MZVLW512HMJP | Apple MacBook Pro 13 2017 Iris Plus Graphics 640, i5-7360U, Apple SSD AP0128 | |
|---|---|---|---|---|---|---|
| Noise | 0% | 3% | -8% | -4% | -3% | |
| desligado / ambiente * (dB) | 29 | 28.8 1% | 28.4 2% | 29.6 -2% | 30.5 -5% | 30.2 -4% |
| Idle Minimum * (dB) | 29 | 28.8 1% | 28.4 2% | 29.6 -2% | 30.7 -6% | 30.2 -4% |
| Idle Average * (dB) | 29 | 28.8 1% | 28.4 2% | 29.6 -2% | 30.7 -6% | 30.2 -4% |
| Idle Maximum * (dB) | 29 | 30.8 -6% | 28.4 2% | 29.6 -2% | 32.11 -11% | 30.2 -4% |
| Load Average * (dB) | 32 | 34.8 -9% | 33.2 -4% | 41.7 -30% | 32.9 -3% | 32.9 -3% |
| Load Maximum * (dB) | 40.1 | 34.8 13% | 35.2 12% | 43.5 -8% | 36.4 9% | 39.3 2% |
| Witcher 3 ultra * (dB) | 43.5 |
* ... menor é melhor
(±) A temperatura máxima no lado superior é 43.2 °C / 110 F, em comparação com a média de 35.9 °C / 97 F , variando de 21.4 a 59 °C para a classe Subnotebook.
(-) A parte inferior aquece até um máximo de 46.2 °C / 115 F, em comparação com a média de 39.2 °C / 103 F
(+) Em uso inativo, a temperatura média para o lado superior é 26.2 °C / 79 F, em comparação com a média do dispositivo de 30.8 °C / ### class_avg_f### F.
(+) Os apoios para as mãos e o touchpad são mais frios que a temperatura da pele, com um máximo de 27.4 °C / 81.3 F e, portanto, são frios ao toque.
(±) A temperatura média da área do apoio para as mãos de dispositivos semelhantes foi 28.2 °C / 82.8 F (+0.8 °C / 1.5 F).
Dell XPS 13 9370 i5 UHD análise de áudio
(-) | alto-falantes não muito altos (###valor### dB)
Graves 100 - 315Hz
(±) | graves reduzidos - em média 8.3% menor que a mediana
(+) | o baixo é linear (5.6% delta para a frequência anterior)
Médios 400 - 2.000 Hz
(+) | médios equilibrados - apenas 3.8% longe da mediana
(+) | médios são lineares (5.6% delta para frequência anterior)
Altos 2 - 16 kHz
(+) | agudos equilibrados - apenas 2.5% longe da mediana
(+) | os máximos são lineares (6% delta da frequência anterior)
Geral 100 - 16.000 Hz
(±) | a linearidade do som geral é média (15.7% diferença em relação à mediana)
Comparado com a mesma classe
» 37% de todos os dispositivos testados nesta classe foram melhores, 5% semelhantes, 57% piores
» O melhor teve um delta de 5%, a média foi 18%, o pior foi 53%
Comparado com todos os dispositivos testados
» 24% de todos os dispositivos testados foram melhores, 5% semelhantes, 71% piores
» O melhor teve um delta de 4%, a média foi 23%, o pior foi 134%
Apple MacBook 12 (Early 2016) 1.1 GHz análise de áudio
(+) | os alto-falantes podem tocar relativamente alto (###valor### dB)
Graves 100 - 315Hz
(±) | graves reduzidos - em média 11.3% menor que a mediana
(±) | a linearidade dos graves é média (14.2% delta para a frequência anterior)
Médios 400 - 2.000 Hz
(+) | médios equilibrados - apenas 2.4% longe da mediana
(+) | médios são lineares (5.5% delta para frequência anterior)
Altos 2 - 16 kHz
(+) | agudos equilibrados - apenas 2% longe da mediana
(+) | os máximos são lineares (4.5% delta da frequência anterior)
Geral 100 - 16.000 Hz
(+) | o som geral é linear (10.2% diferença em relação à mediana)
Comparado com a mesma classe
» 7% de todos os dispositivos testados nesta classe foram melhores, 2% semelhantes, 90% piores
» O melhor teve um delta de 5%, a média foi 18%, o pior foi 53%
Comparado com todos os dispositivos testados
» 5% de todos os dispositivos testados foram melhores, 1% semelhantes, 94% piores
» O melhor teve um delta de 4%, a média foi 23%, o pior foi 134%
| desligado | |
| Ocioso | |
| Carga |
|
Key:
min: | |
| Dell XPS 13 9370 i5 UHD i5-8250U, UHD Graphics 620, Toshiba XG5 KXG50ZNV256G, IPS, 3840x2160, 13.3" | Dell XPS 13 i5-8250U i5-8250U, UHD Graphics 620, Toshiba XG5 KXG50ZNV256G, IGZO IPS, 3200x1800, 13.3" | Dell XPS 13 9360 FHD i7 Iris i7-7560U, Iris Plus Graphics 640, Toshiba XG4 NVMe (THNSN5512GPUK), IPS, 1920x1080, 13.3" | Dell XPS 13 9360 FHD i5 i5-7200U, HD Graphics 620, Toshiba NVMe THNSN5256GPUK, IPS, 1920x1080, 13.3" | Dell XPS 13 9365-4537 2-in-1 i5-7Y54, HD Graphics 615, Toshiba NVMe THNSN5256GPUK, IPS, 3200x1800, 13.3" | Dell XPS 13 9350 WQXGA 6560U, Iris Graphics 540, Samsung PM951 NVMe 512 GB, IPS, 3200x1800, 13.3" | |
|---|---|---|---|---|---|---|
| Power Consumption | 7% | 24% | 37% | -16% | -11% | |
| Idle Minimum * (Watt) | 4.3 | 3.6 16% | 3.32 23% | 4.1 5% | 8.2 -91% | 7.2 -67% |
| Idle Average * (Watt) | 8 | 7.9 1% | 5.27 34% | 4.2 47% | 10.8 -35% | 9.3 -16% |
| Idle Maximum * (Watt) | 8.1 | 8.5 -5% | 6.32 22% | 5.1 37% | 12.7 -57% | 11.6 -43% |
| Load Average * (Watt) | 46.6 | 43 8% | 32 31% | 22.1 53% | 22.6 52% | 31.9 32% |
| Load Maximum * (Watt) | 49.8 | 43 14% | 45.9 8% | 29.4 41% | 24.6 51% | 29.9 40% |
* ... menor é melhor
| Dell XPS 13 9370 i5 UHD i5-8250U, UHD Graphics 620, 52 Wh | Samsung Notebook 9 NP900X3N-K01US i5-7200U, HD Graphics 620, 30 Wh | Asus ZenBook 13 UX331UN i5-8550U, GeForce MX150, 50 Wh | Razer Blade Stealth QHD i7-8550U i5-8550U, UHD Graphics 620, 53.6 Wh | Apple MacBook Pro 13 2017 i5-7360U, Iris Plus Graphics 640, 54.5 Wh | Dell XPS 13 9360 QHD+ i7 i7-7500U, HD Graphics 620, 60 Wh | |
|---|---|---|---|---|---|---|
| Duração da bateria | -32% | 29% | -12% | 20% | 23% | |
| Reader / Idle (h) | 14.5 | 11.6 -20% | 22 52% | 17.6 21% | ||
| WiFi v1.3 (h) | 6.8 | 4.7 -31% | 8.4 24% | 6 -12% | 11.4 68% | 8.6 26% |
| Load (h) | 1.8 | 1 -44% | 2 11% | 1.3 -28% | 2.2 22% | |
| Witcher 3 ultra (h) | 1.9 |
Pro
Contra
Será que o XPS 13 9370 é inequivocamente melhor que o XPS 13 9360? É um passo em frente em vários aspectos, enquanto outras áreas da série não melhoraram. A duração da bateria, por exemplo, é em grande parte a mesma, se não pior, como as teclas do teclado, os tempos de resposta da tela e a rigidez do chassi. Embora nenhum desses problemas tenham sido importantes no passado, sentimos que o novo aparelho mais fino pode ter tido prioridade sobre essas outras qualidades igualmente importantes do portátil. Os tempos de resposta da tela excepcionalmente lentos, em particular, provavelmente ofenderão usuários avançados que estejam acostumados a monitores de 5 ms/120 Hz.
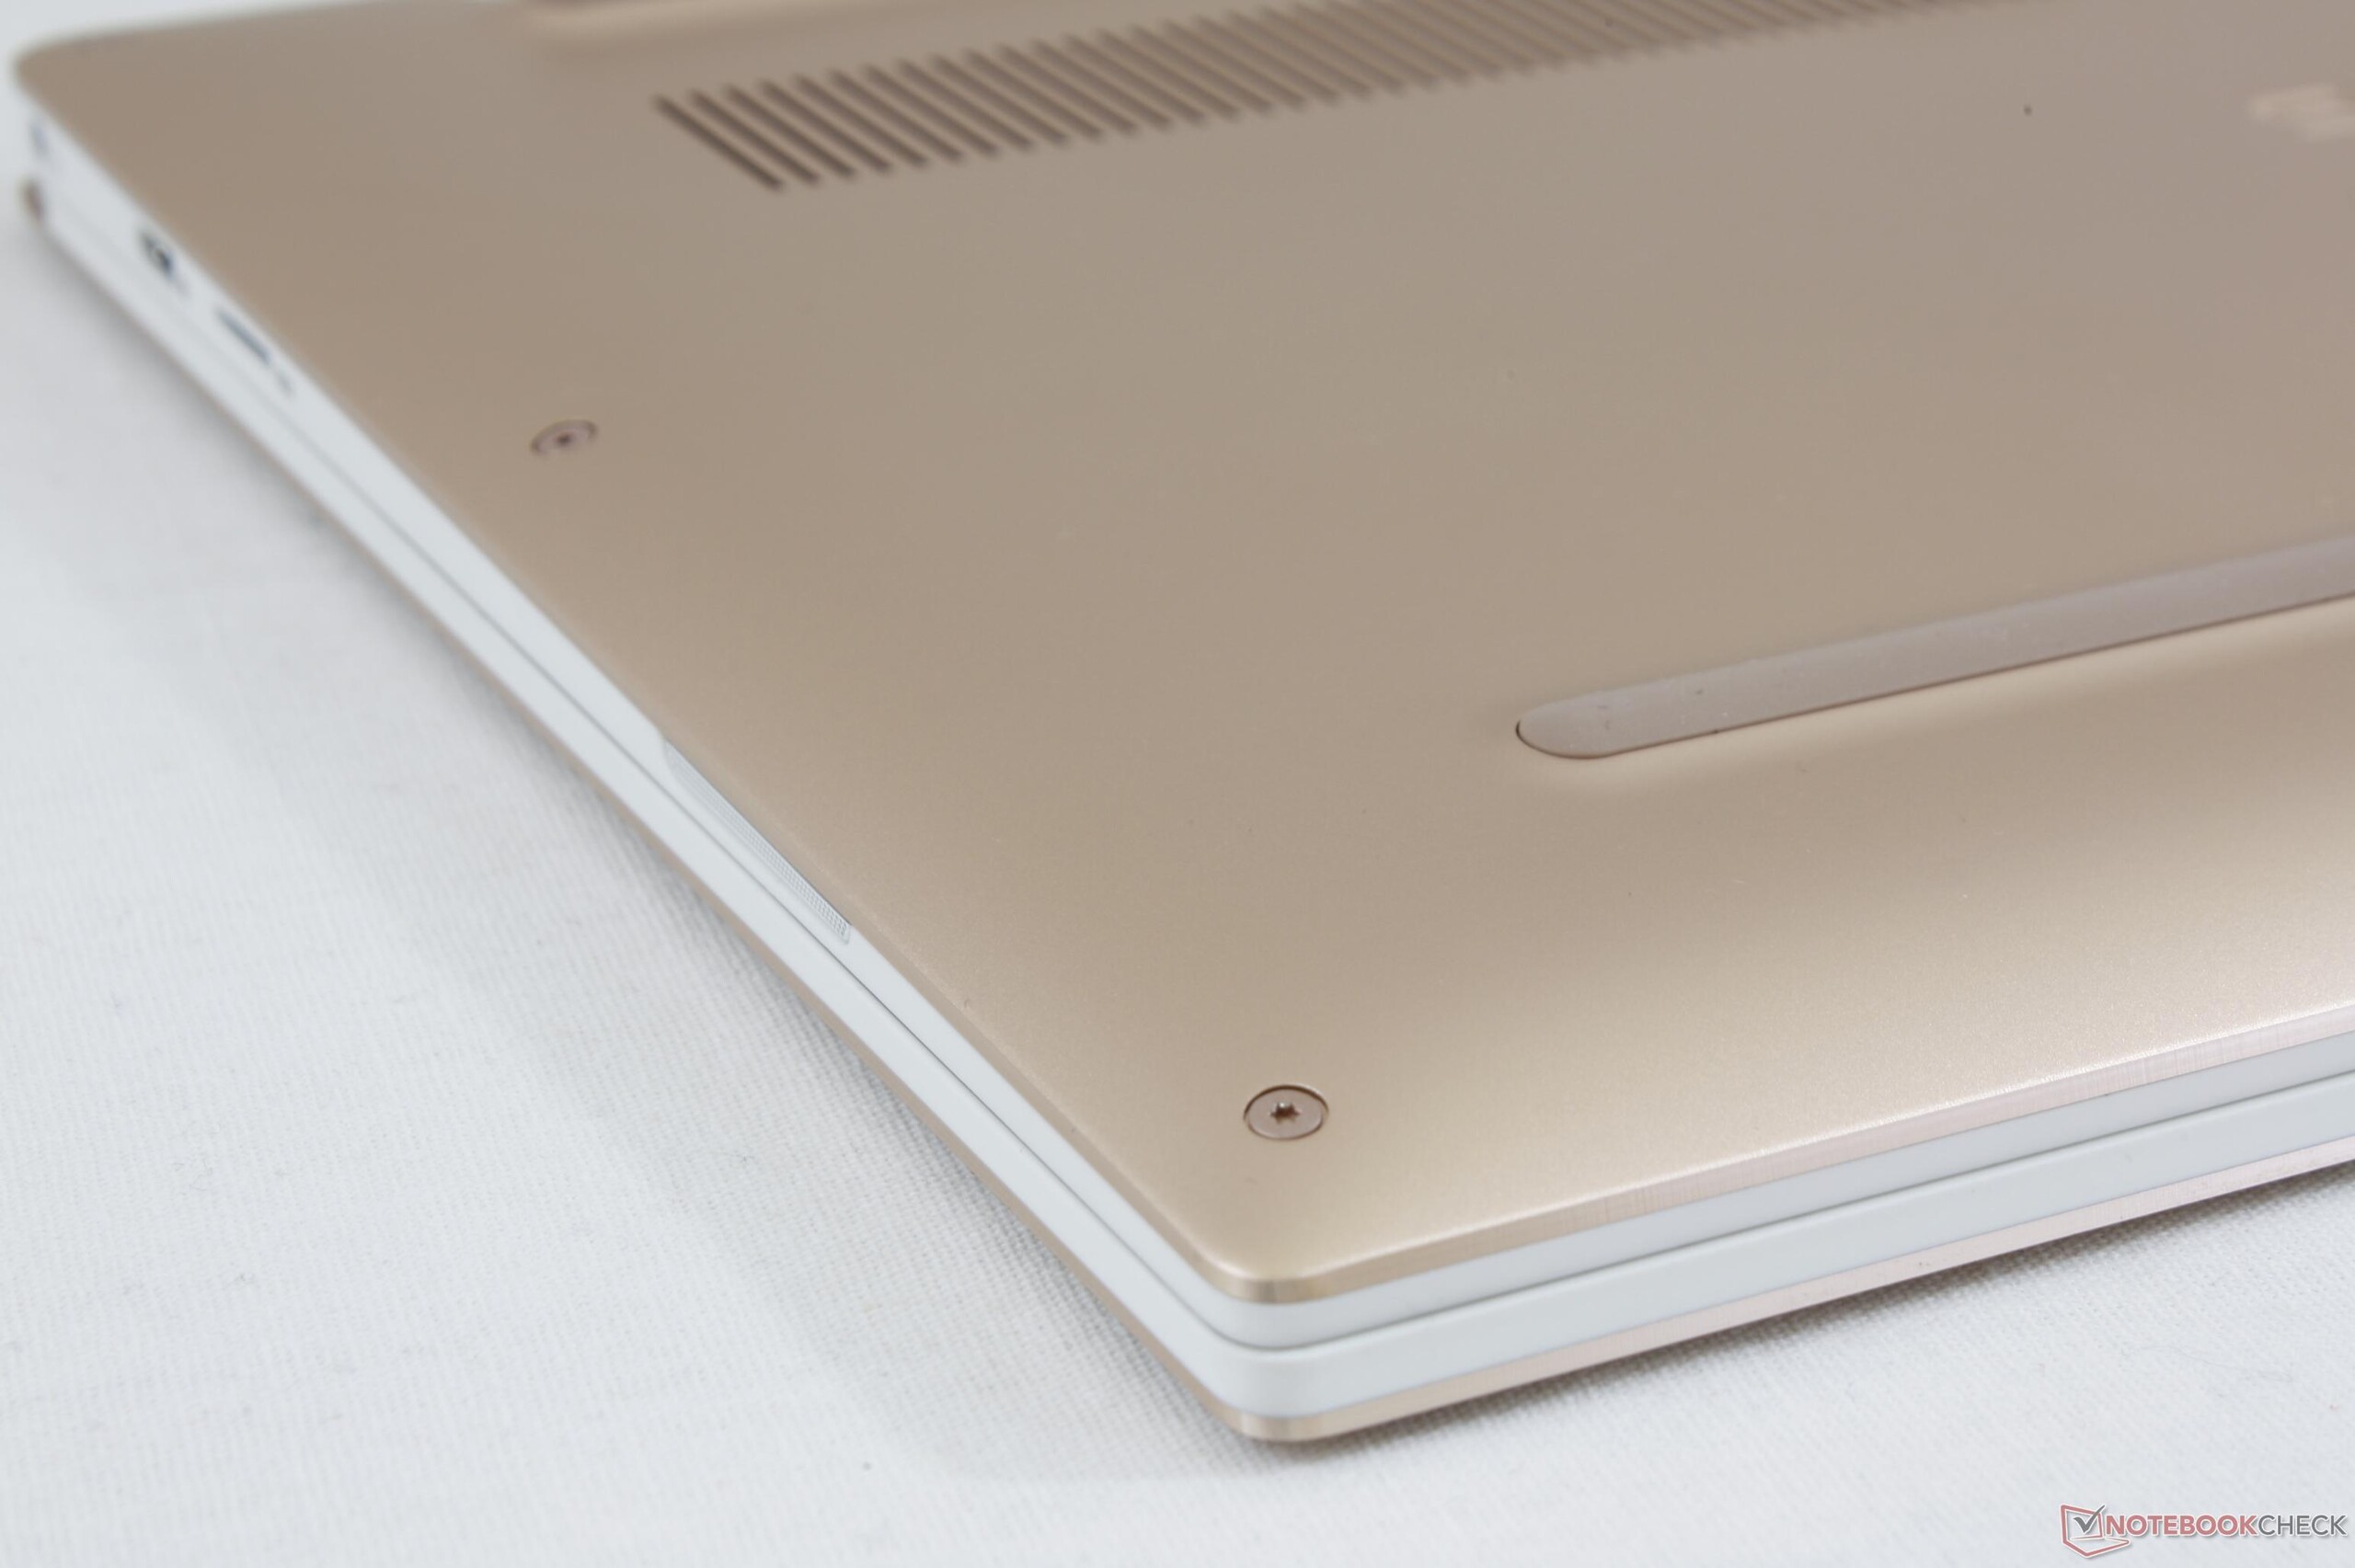
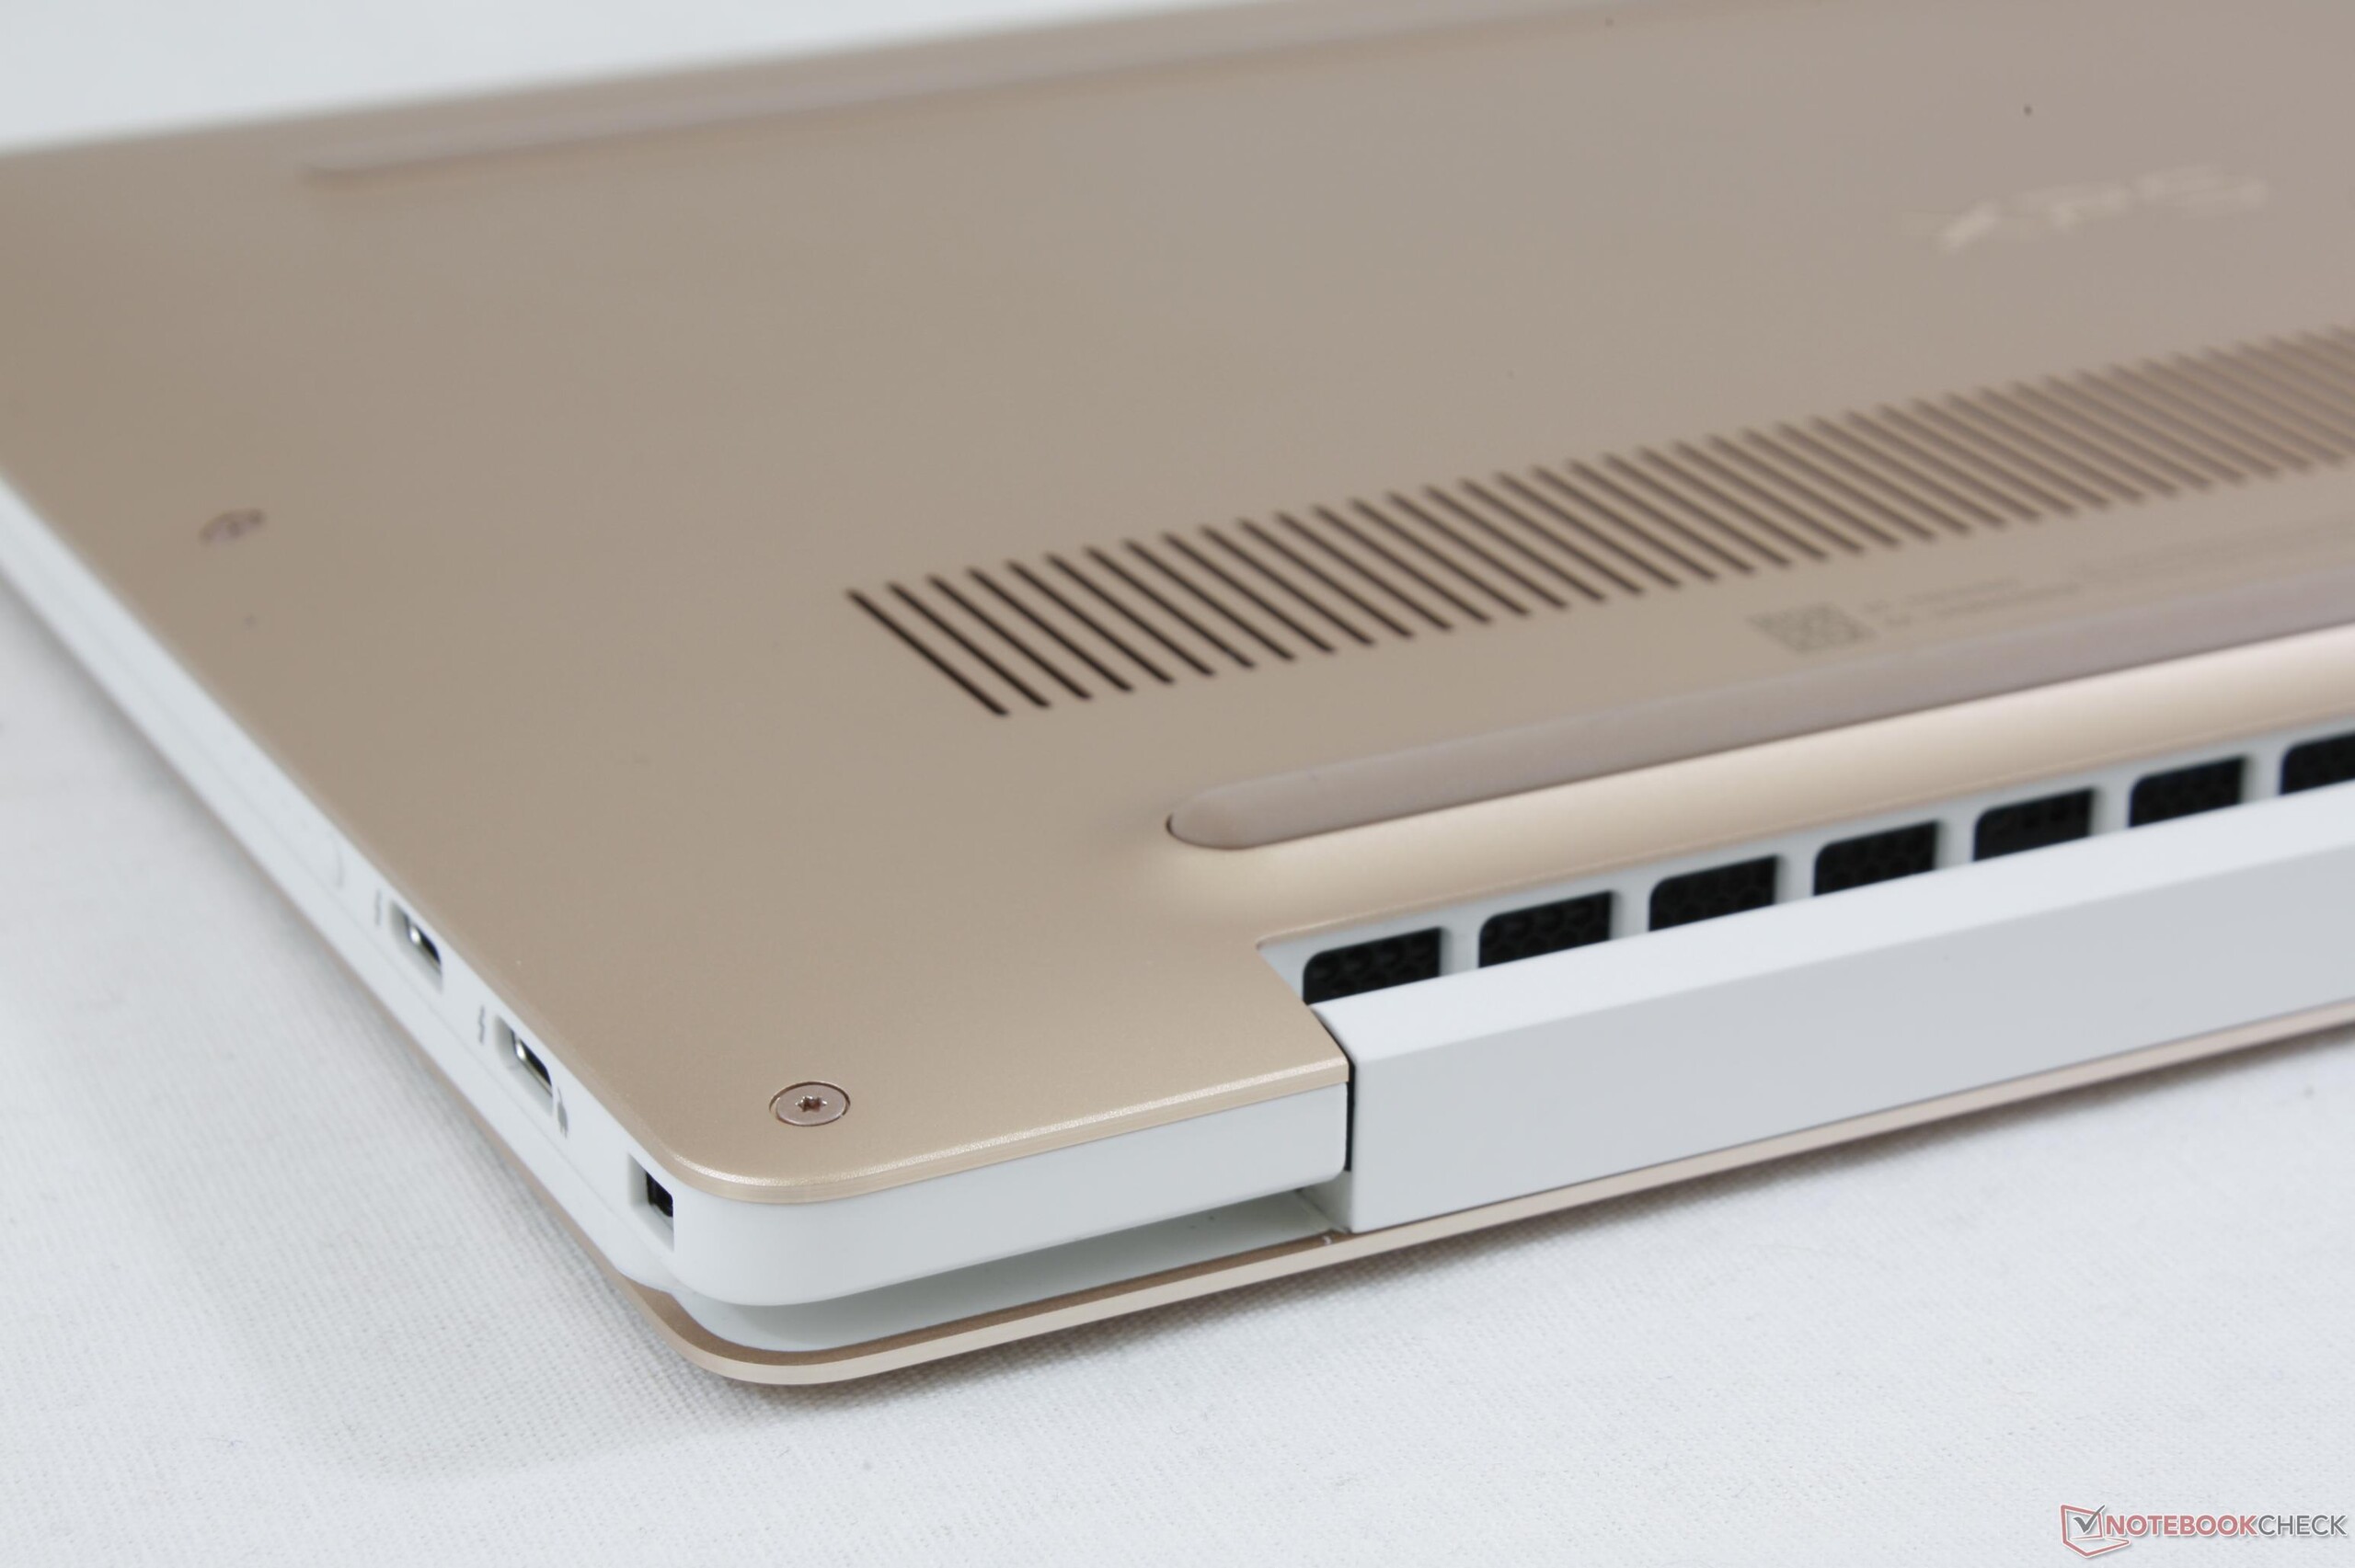
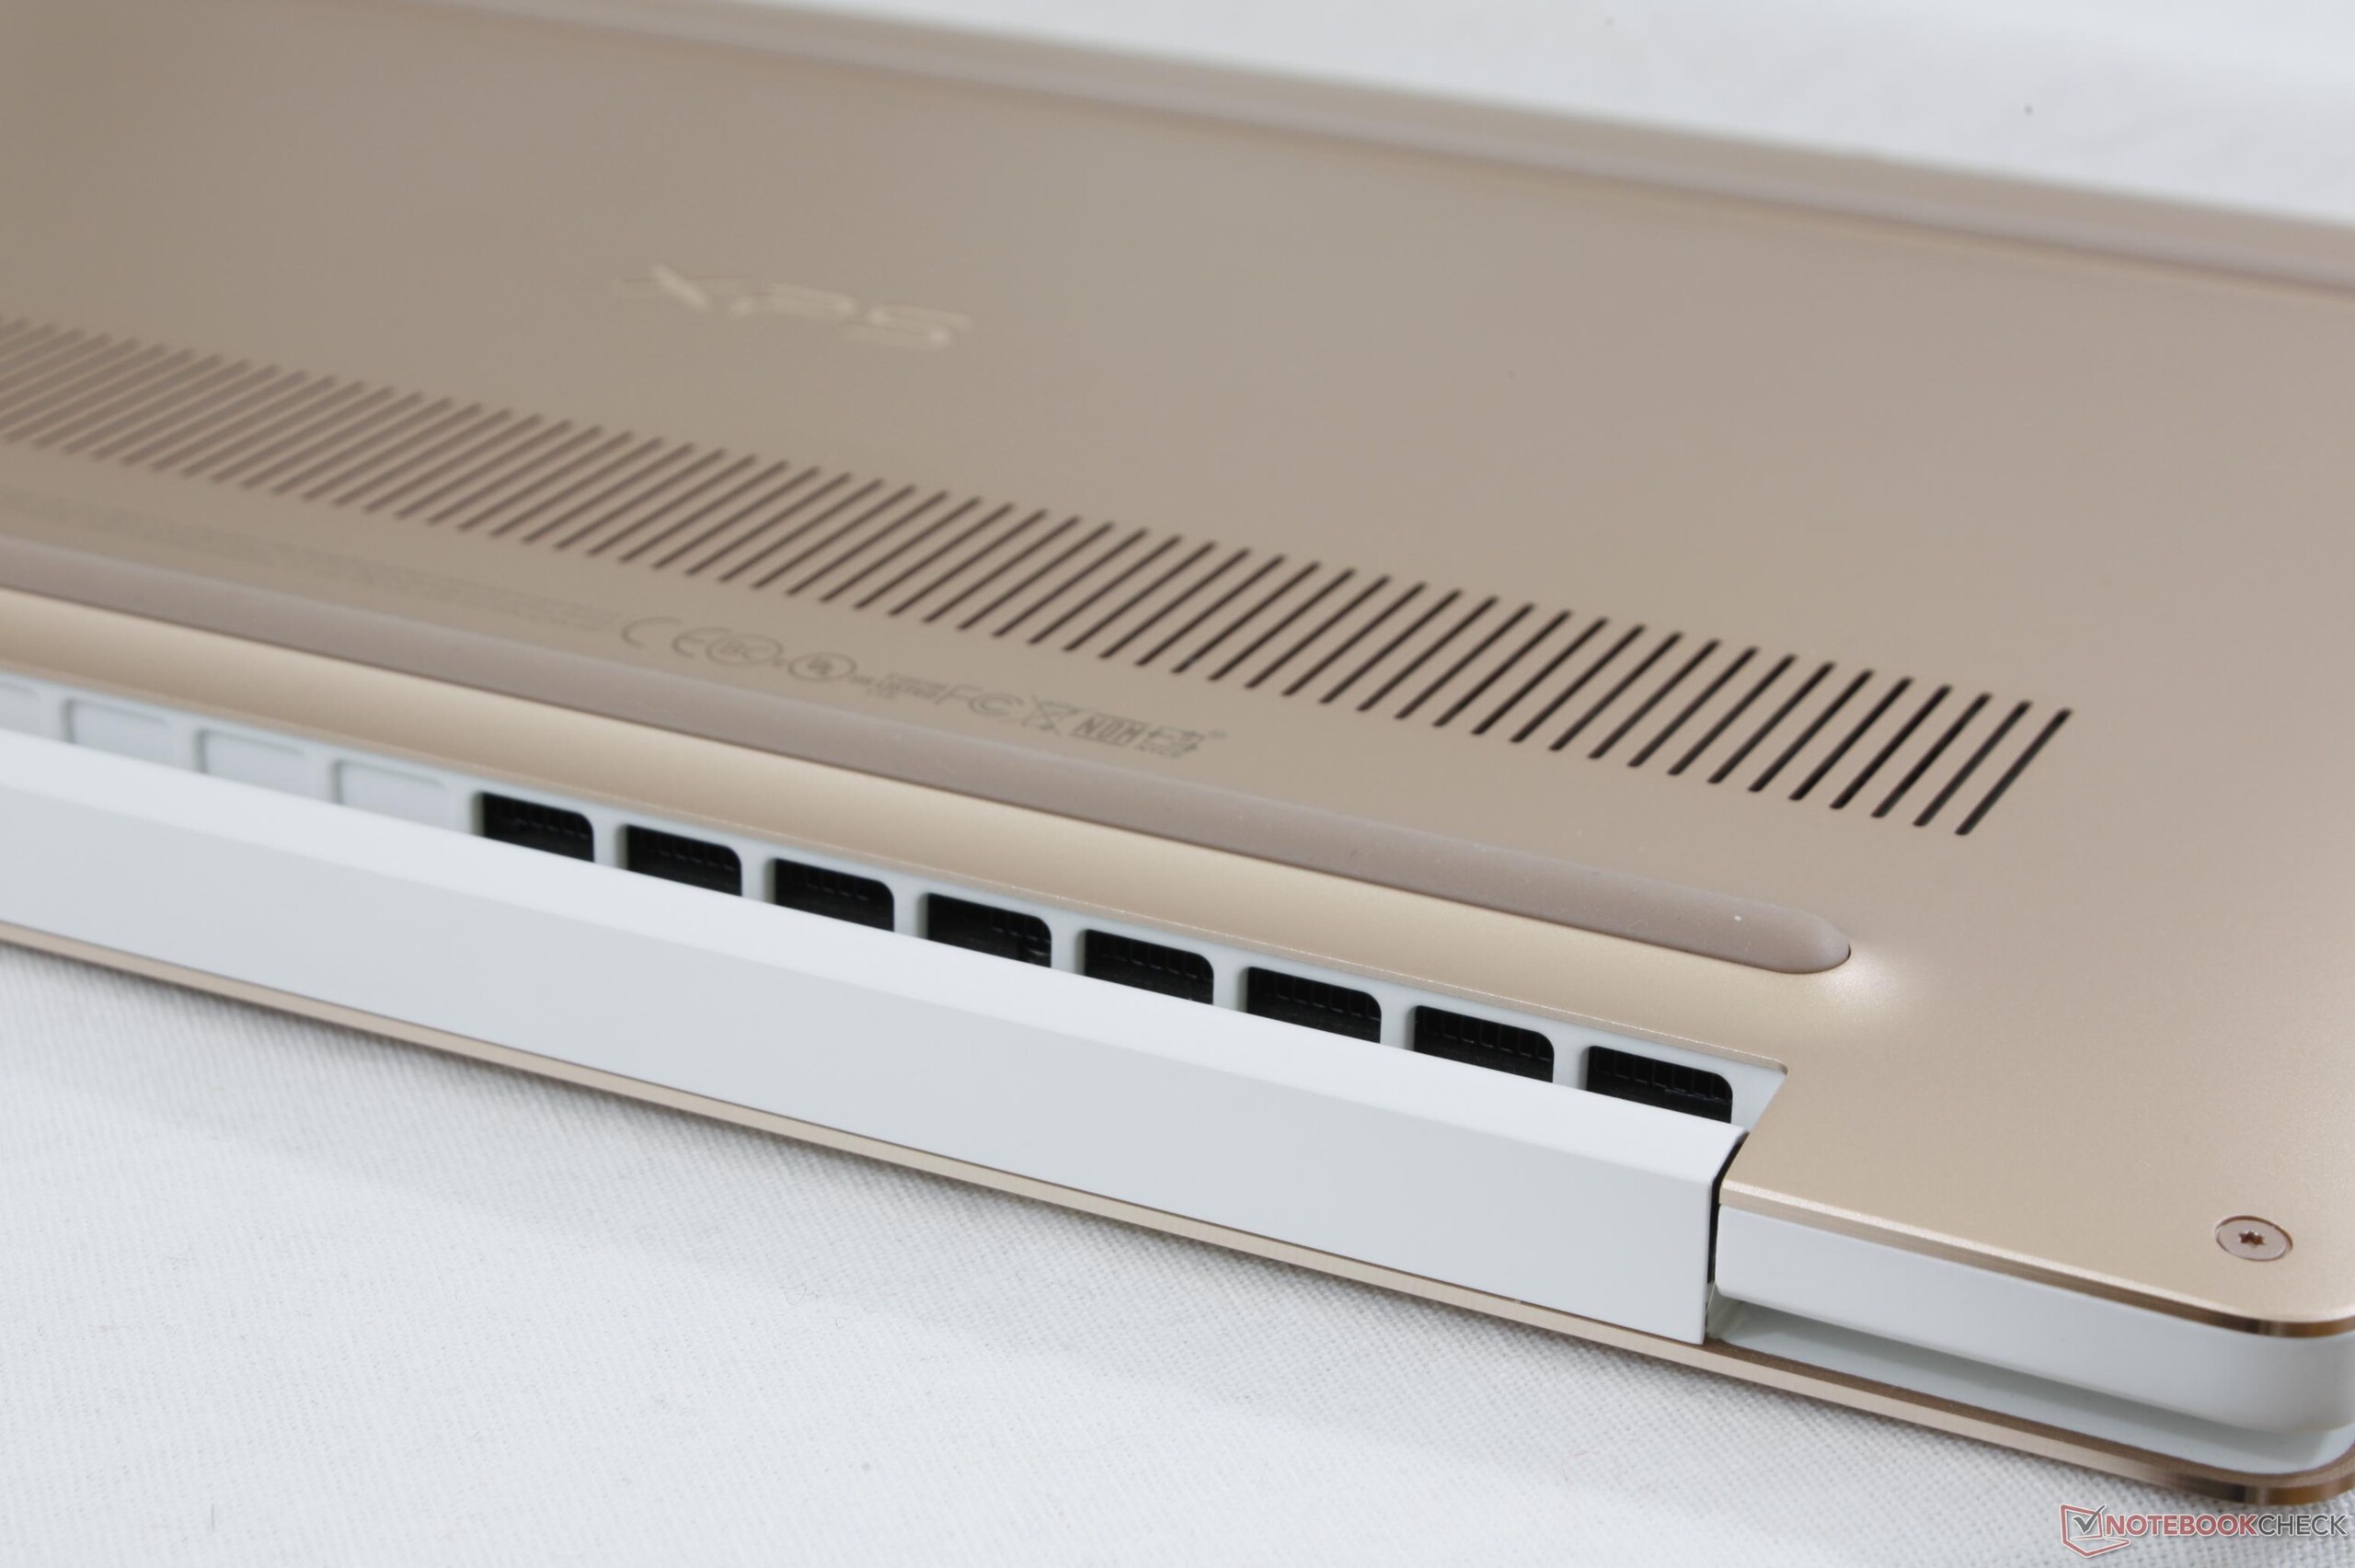
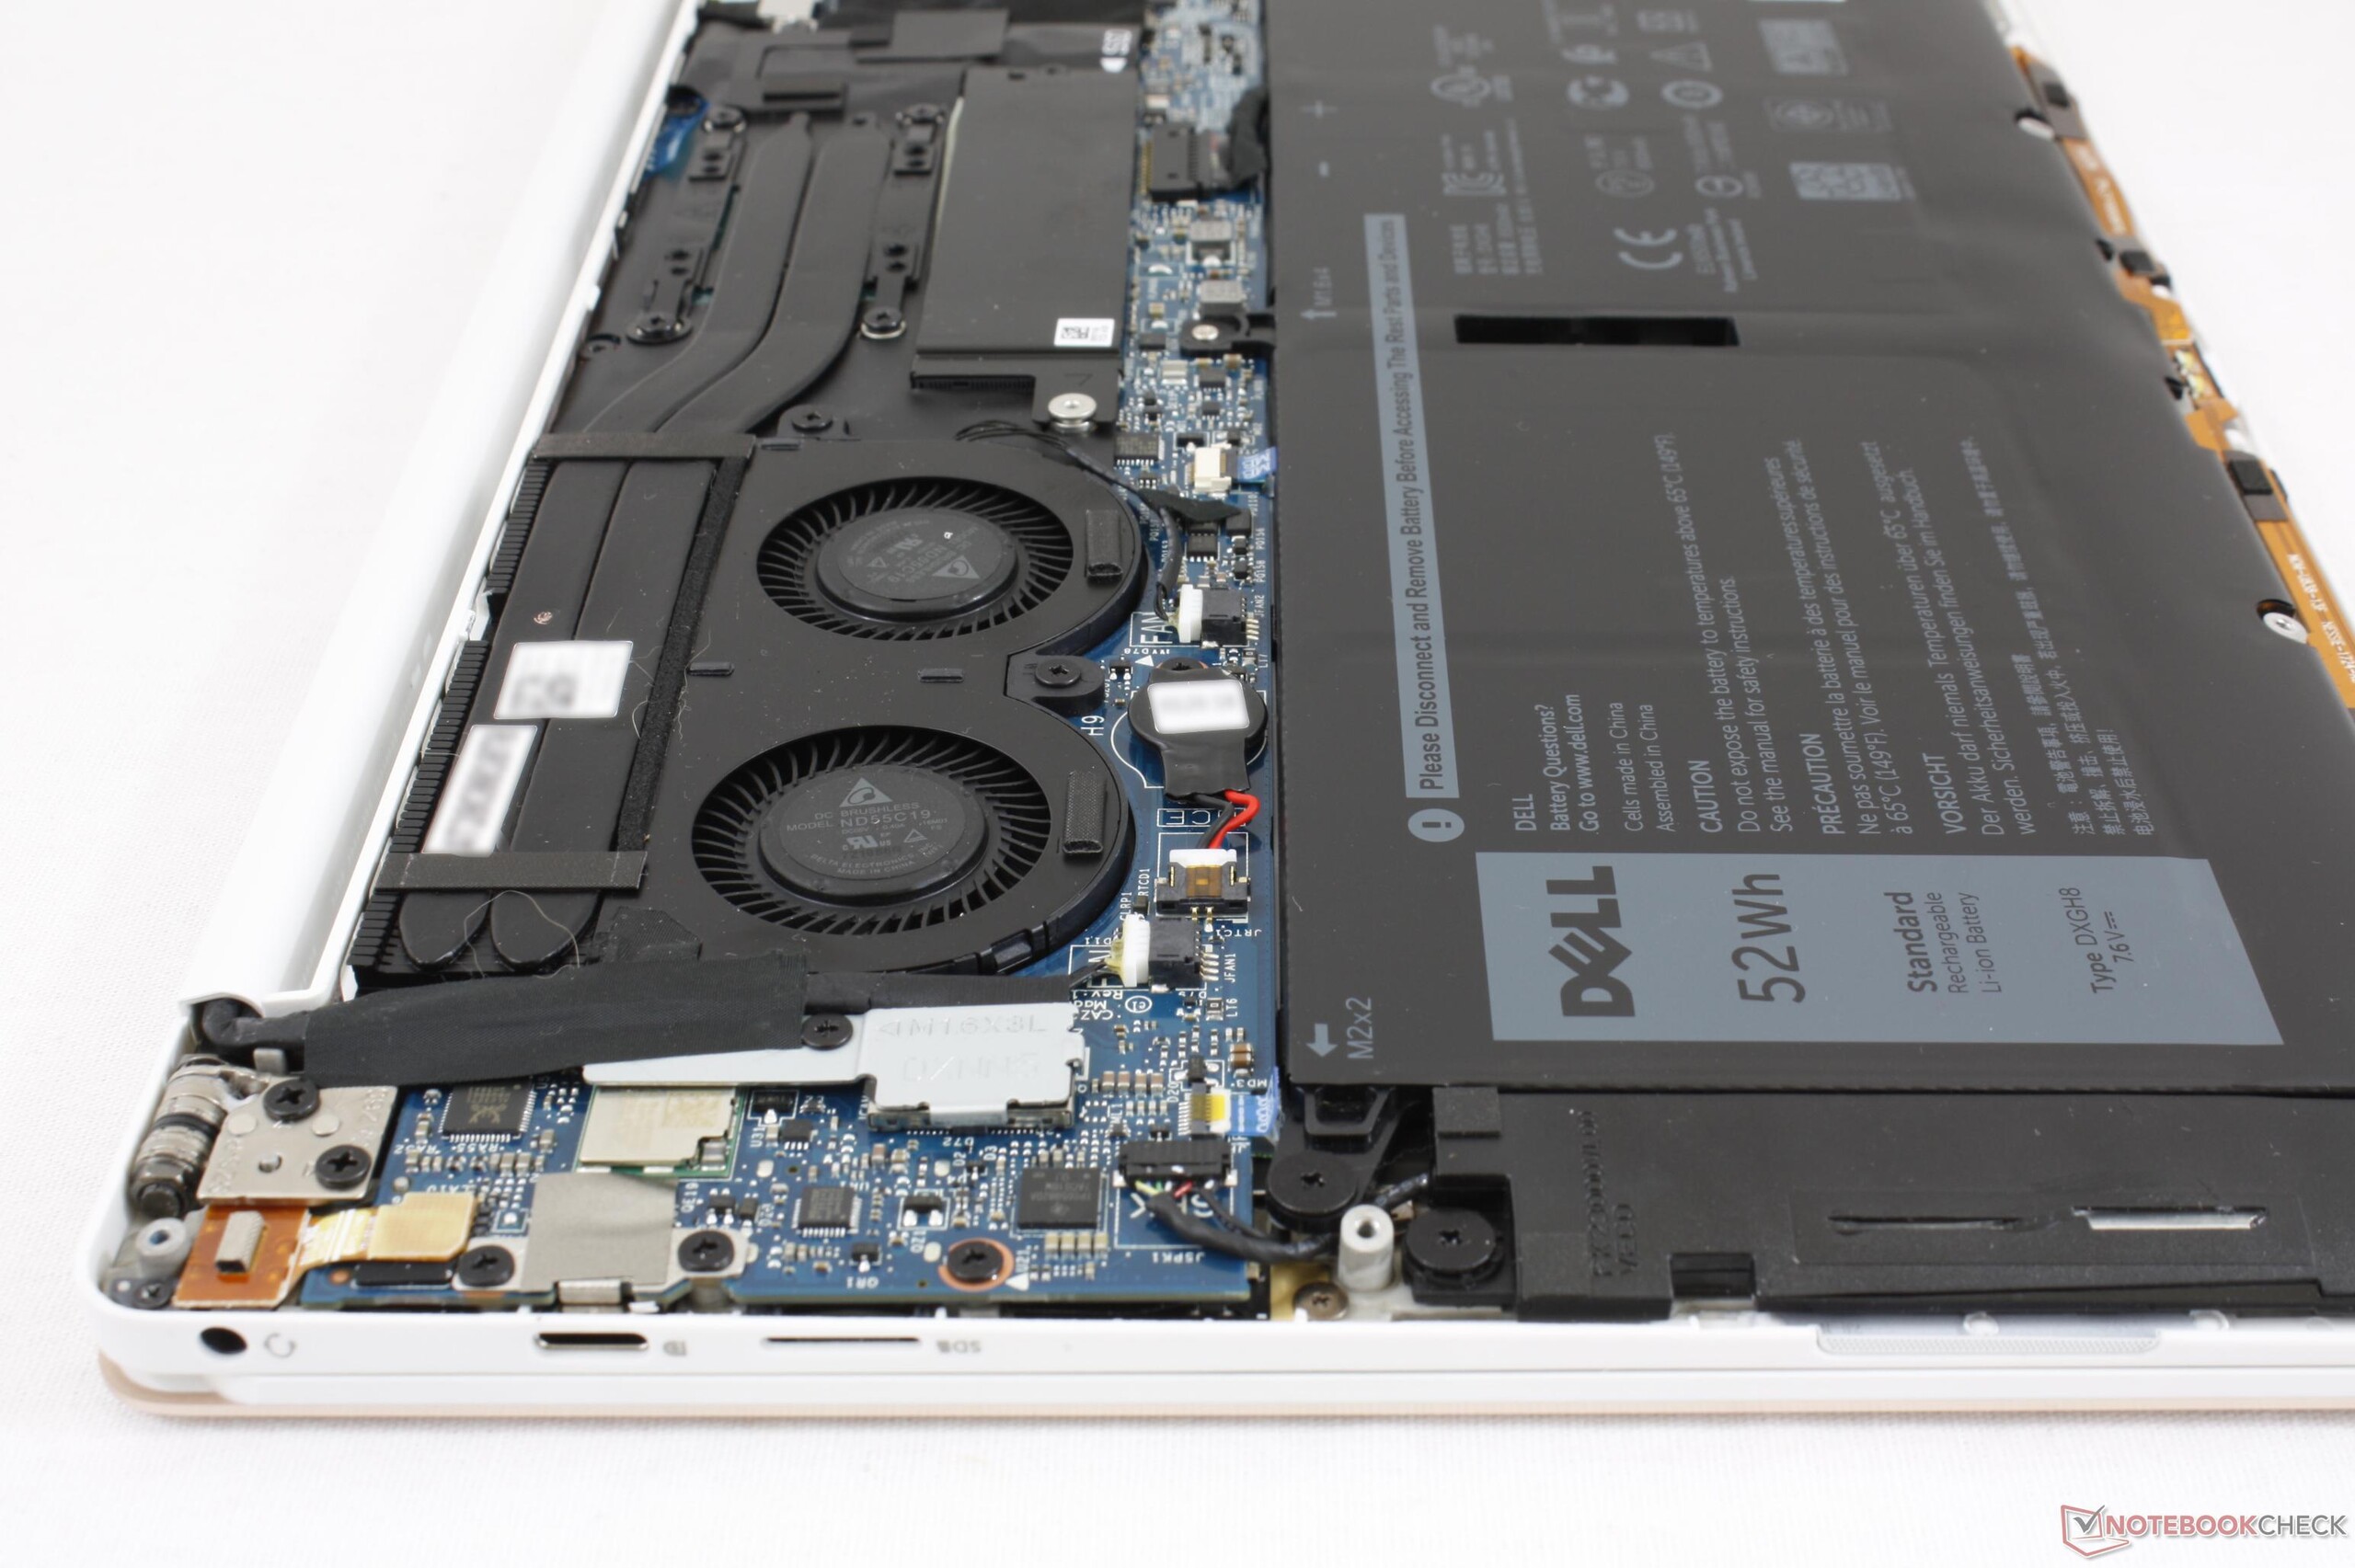
Internamente, muitas das mudanças servem para reduzir a temperatura da superfície e o ruído do ventilador, pois ambos são problemas comuns quando o aparelho é afinado cada vez mais. O sistema de resfriamento maior e a introdução do tecido GORE termicamente isolado permitiram que o sistema funcionasse de maneira mais fria ao toque sem necessariamente aumentar as RPMs do ventilador.
Por fim, a Política de Energia Dinâmica merece elogios por espremer o máximo de desempenho possível do processador ULV. É uma façanha notável porque o processador i5-8250U funciona mais quente no XPS 13 9370 do que no XPS 13 9360, enquanto mantém as temperaturas da superfície e o ruído do ventilador sob controle.
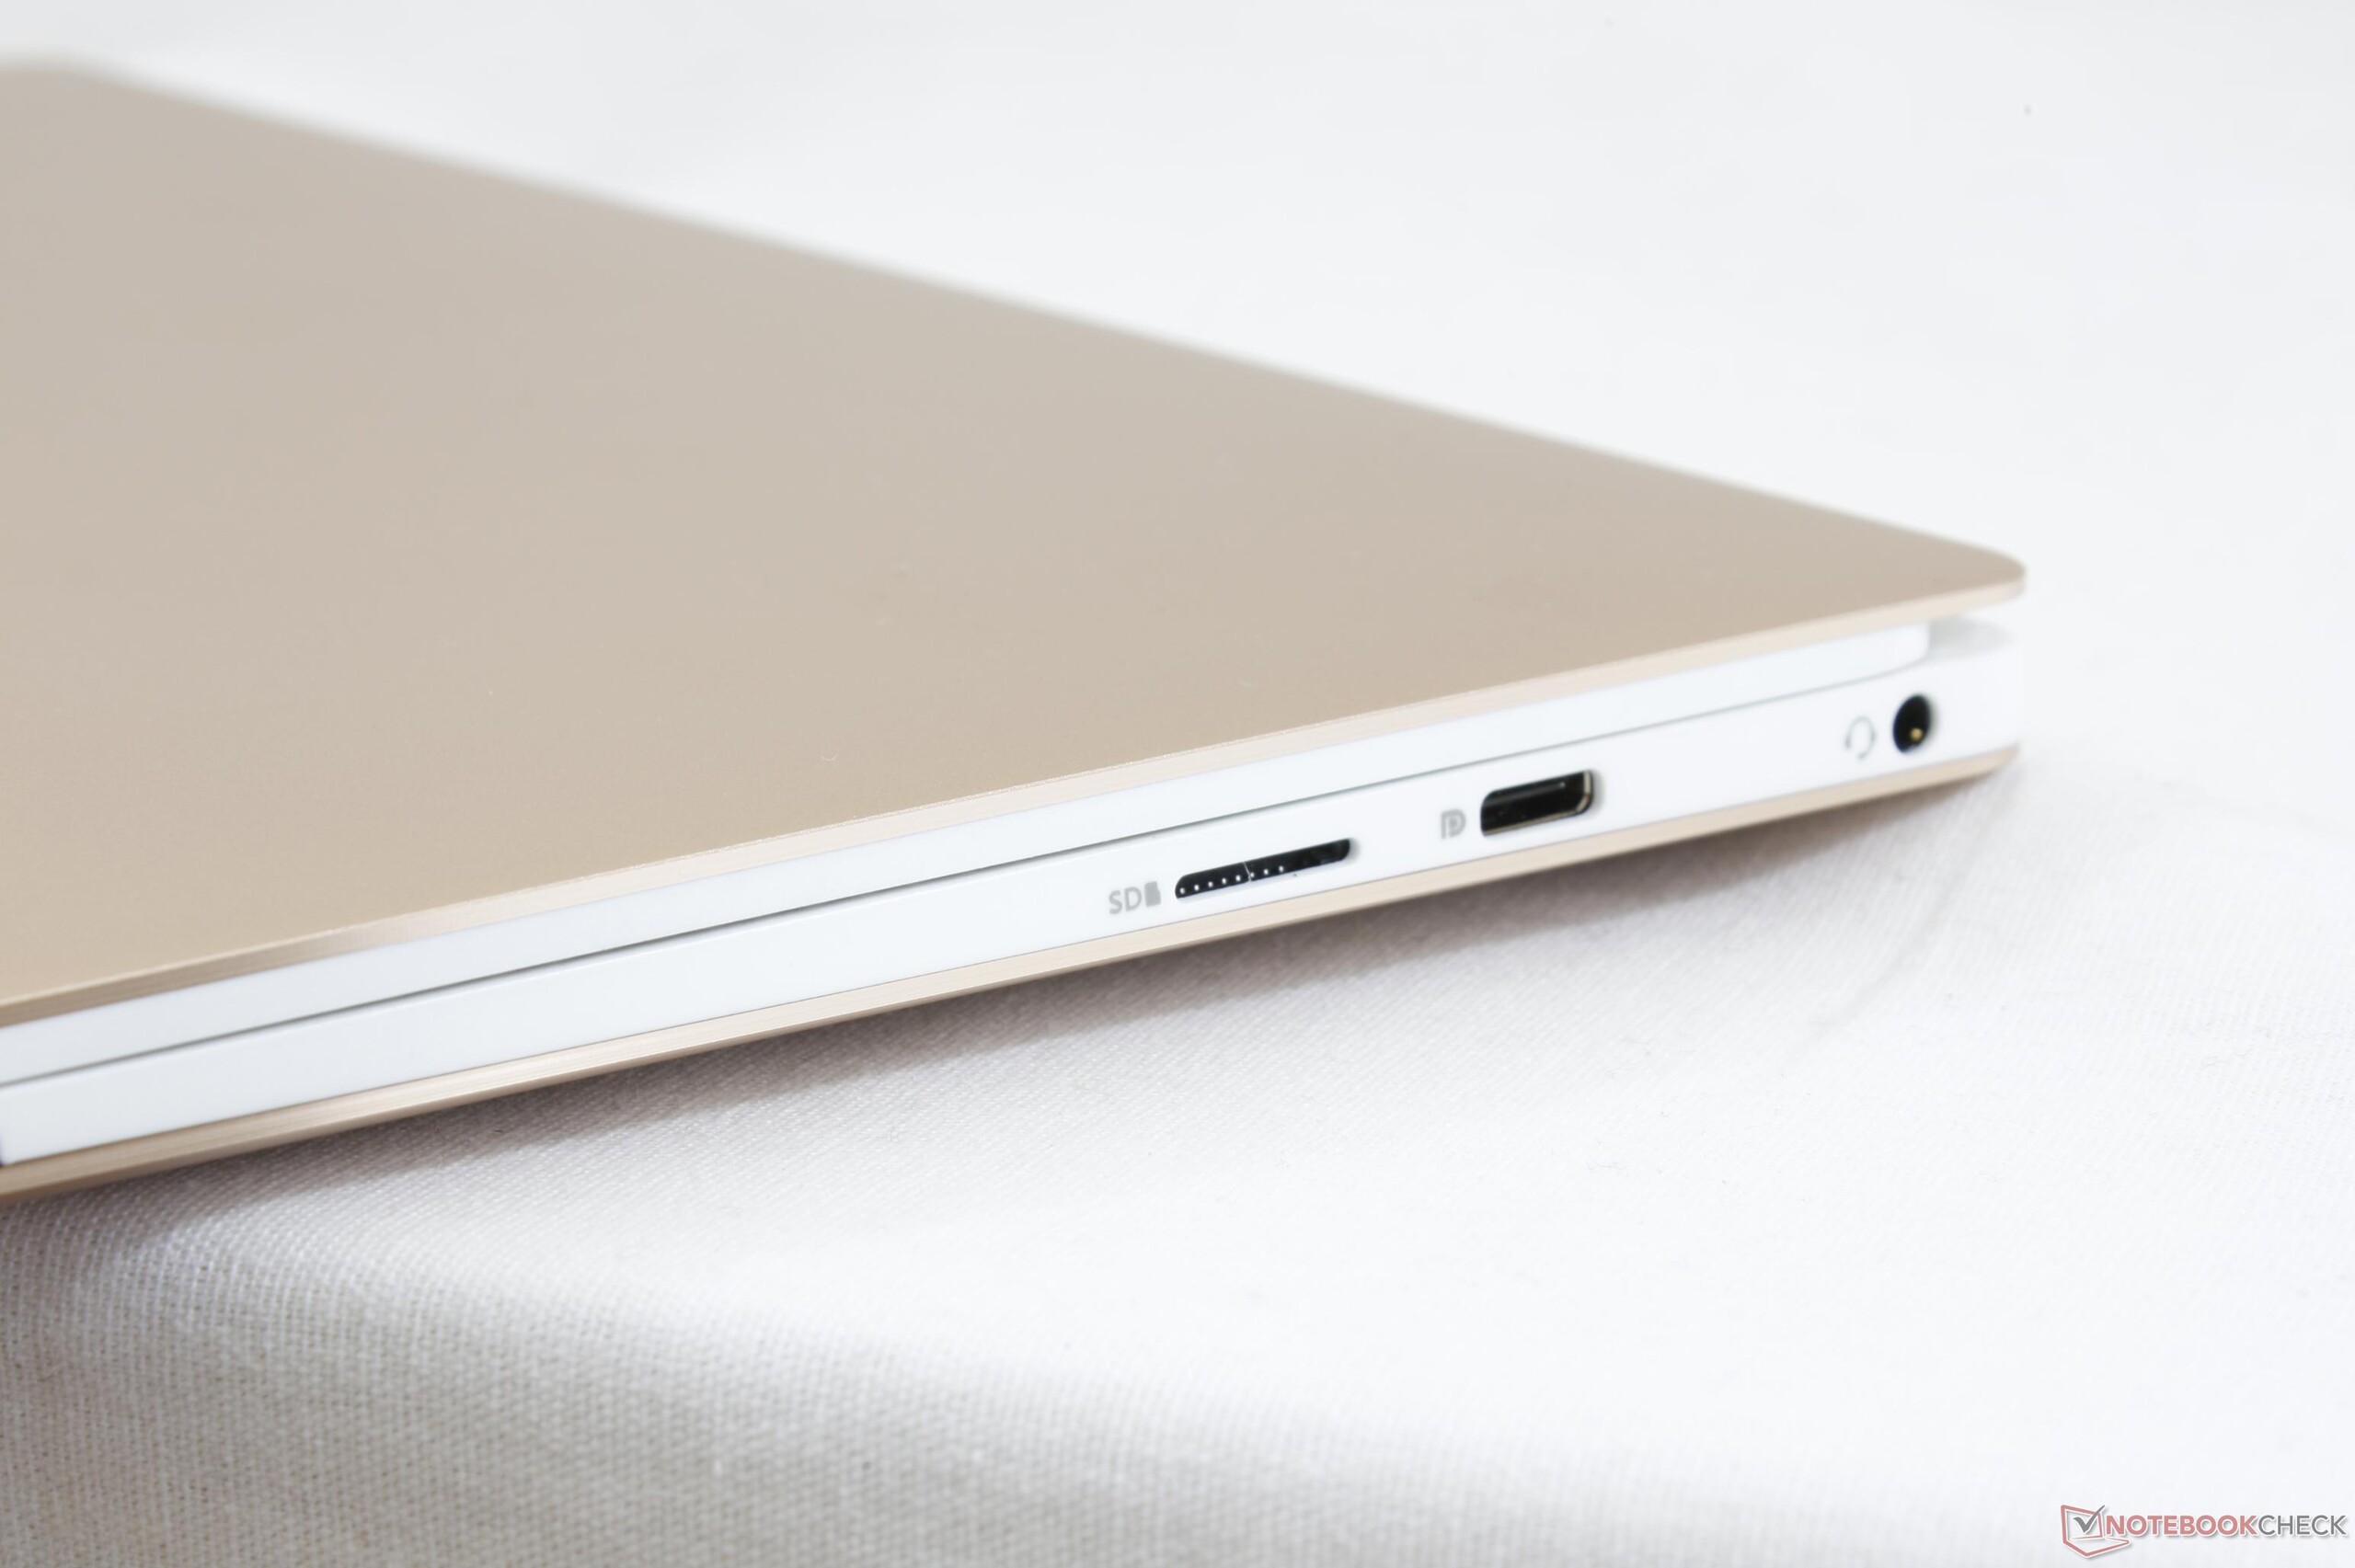
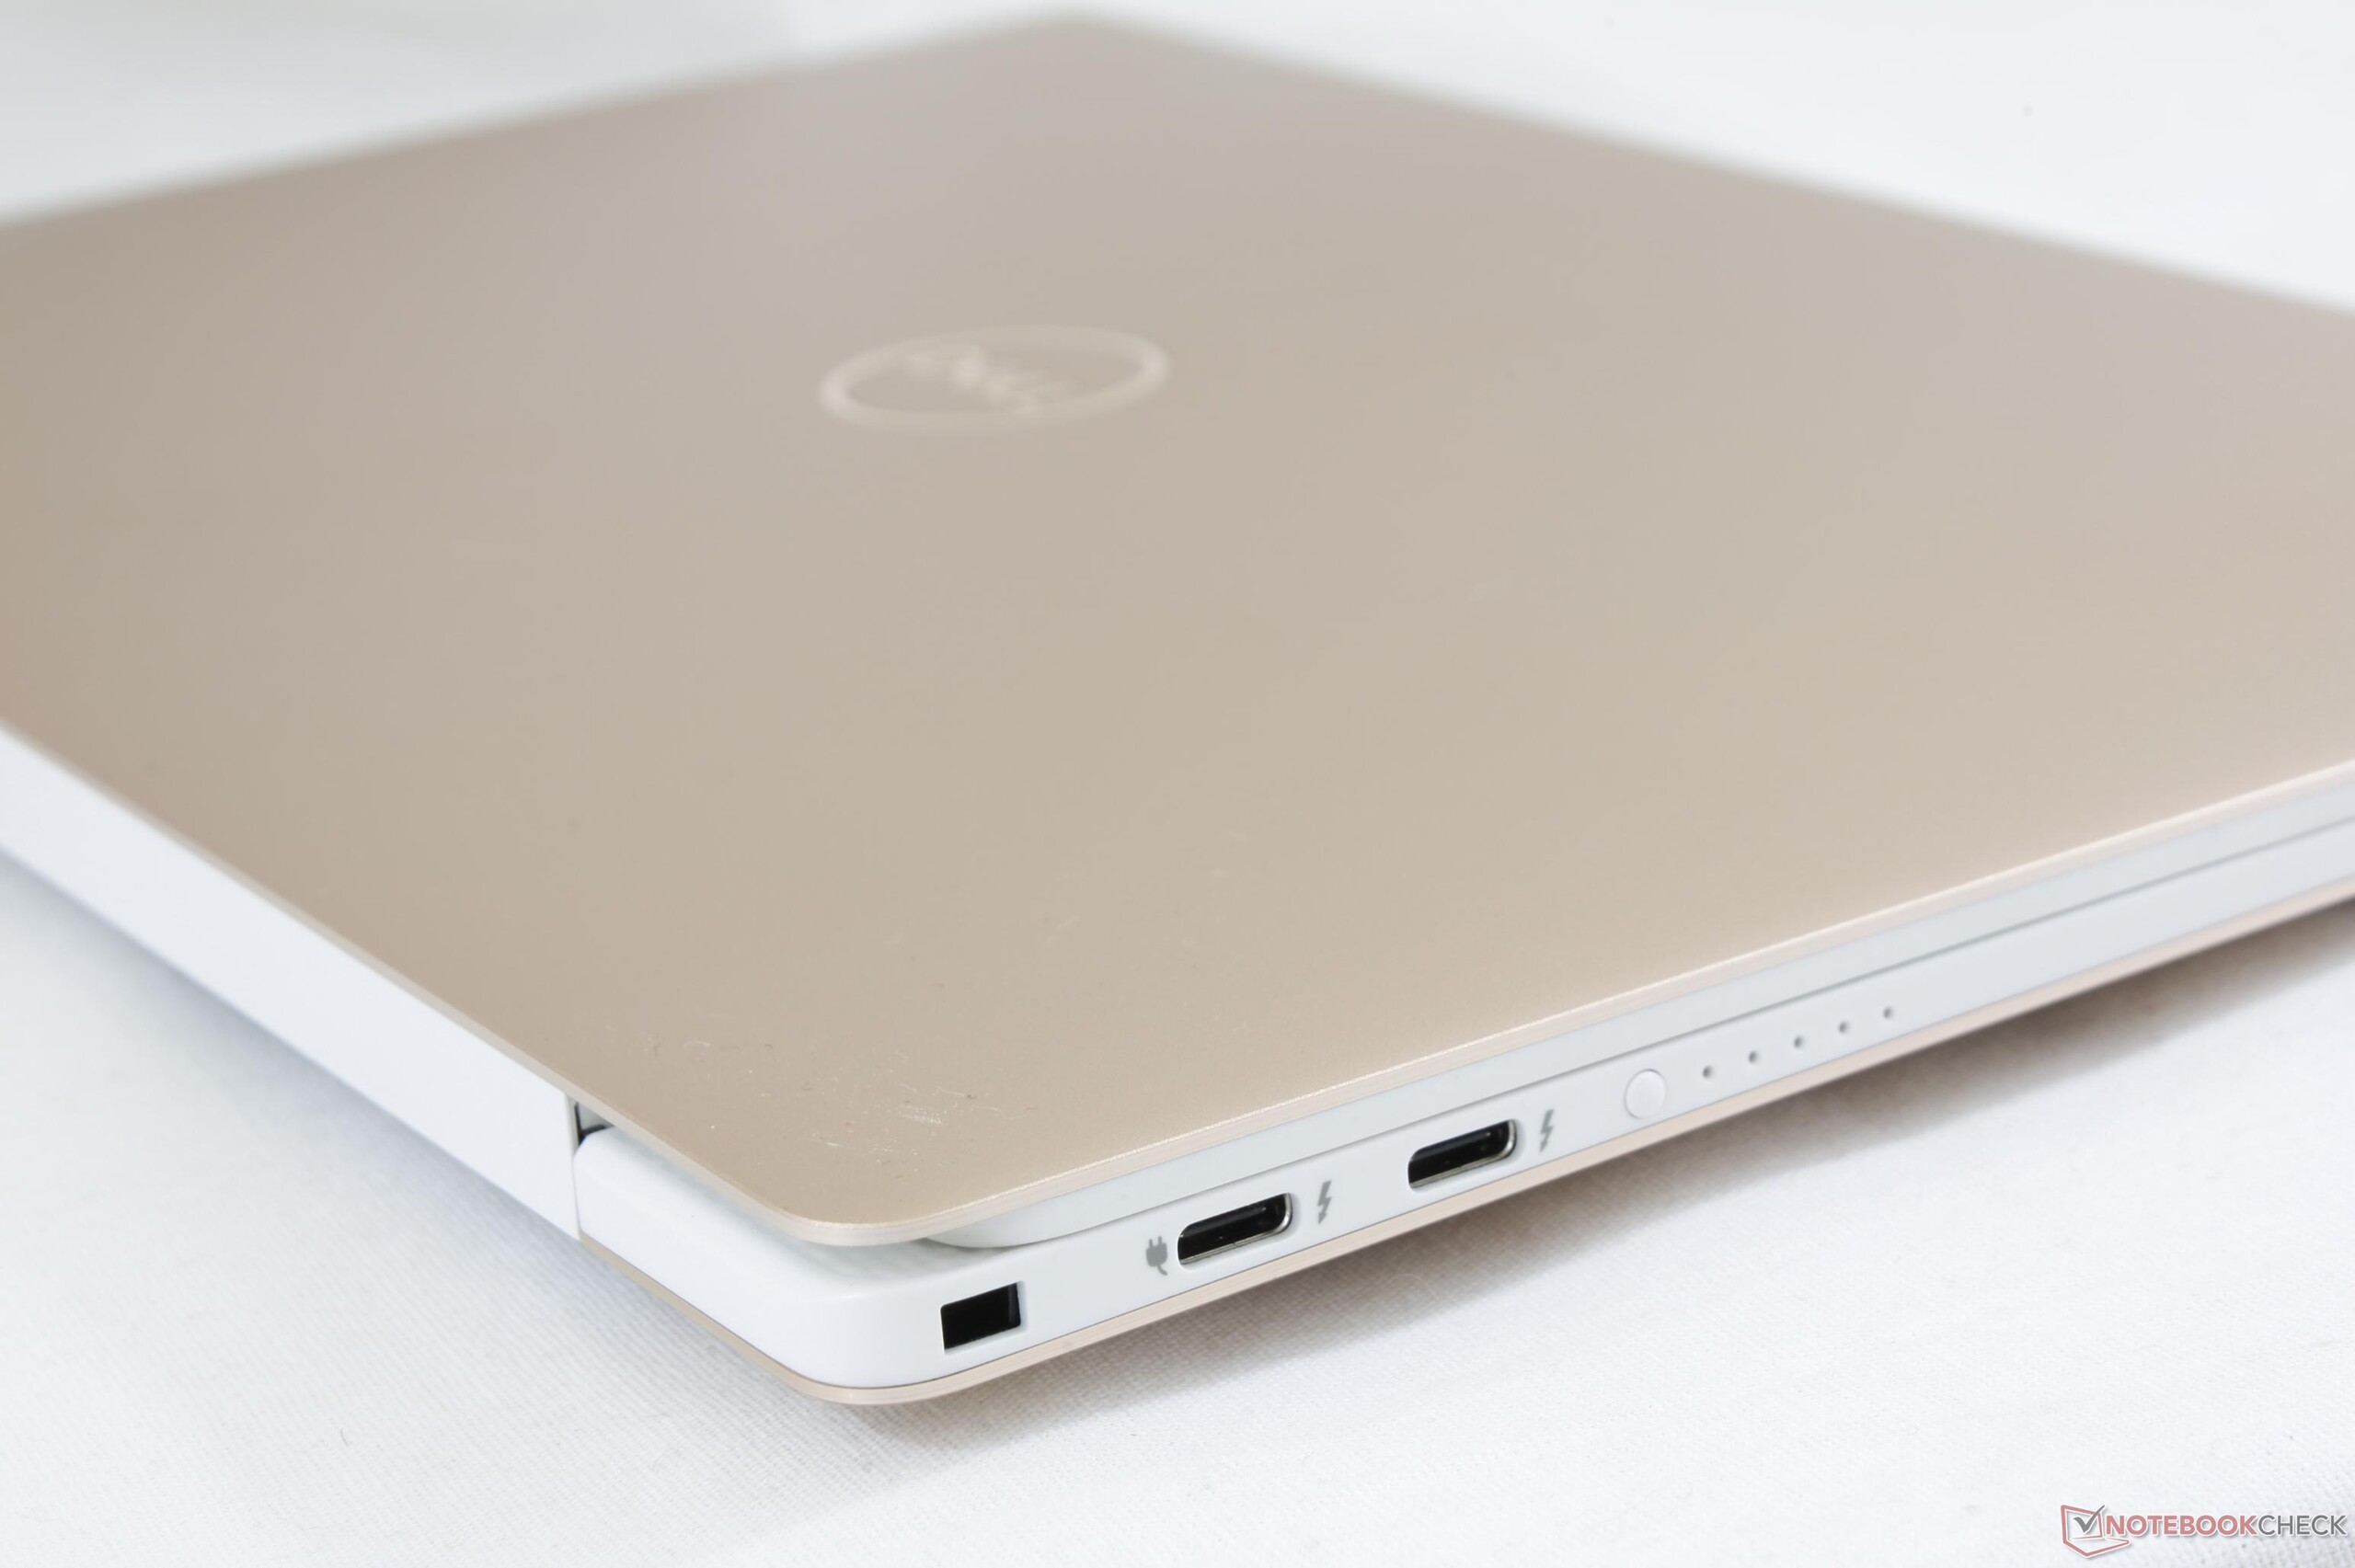
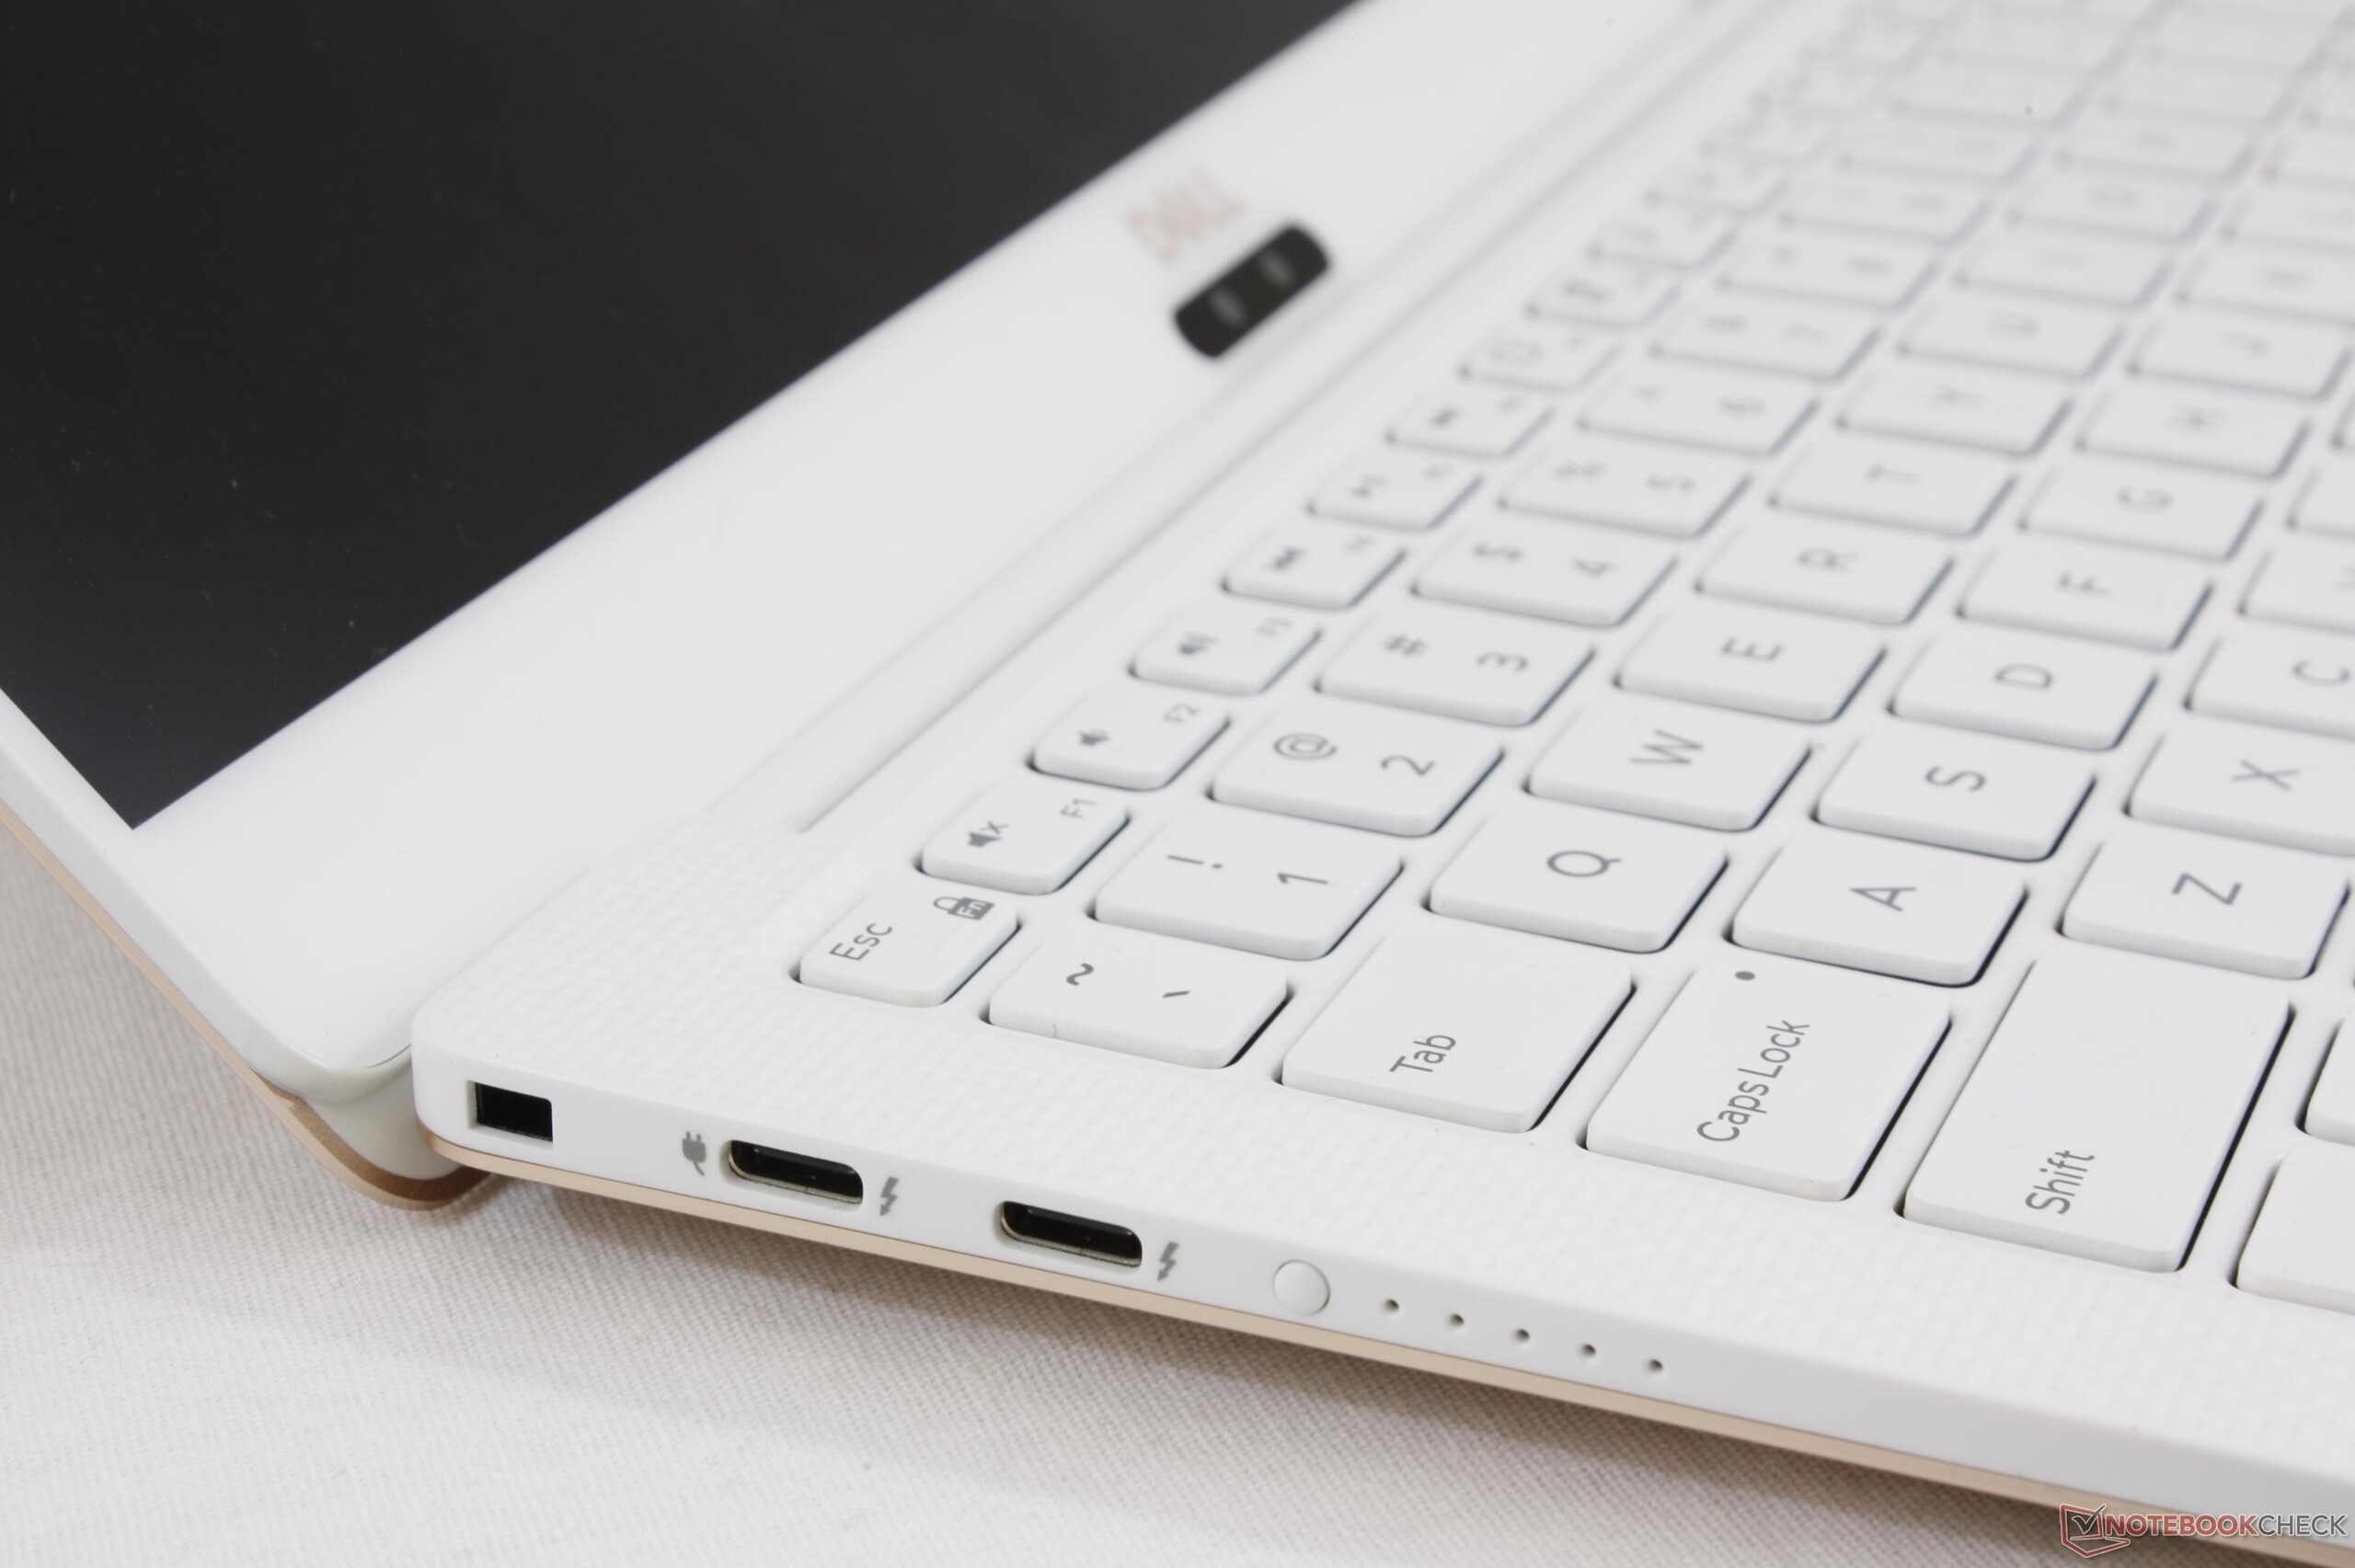
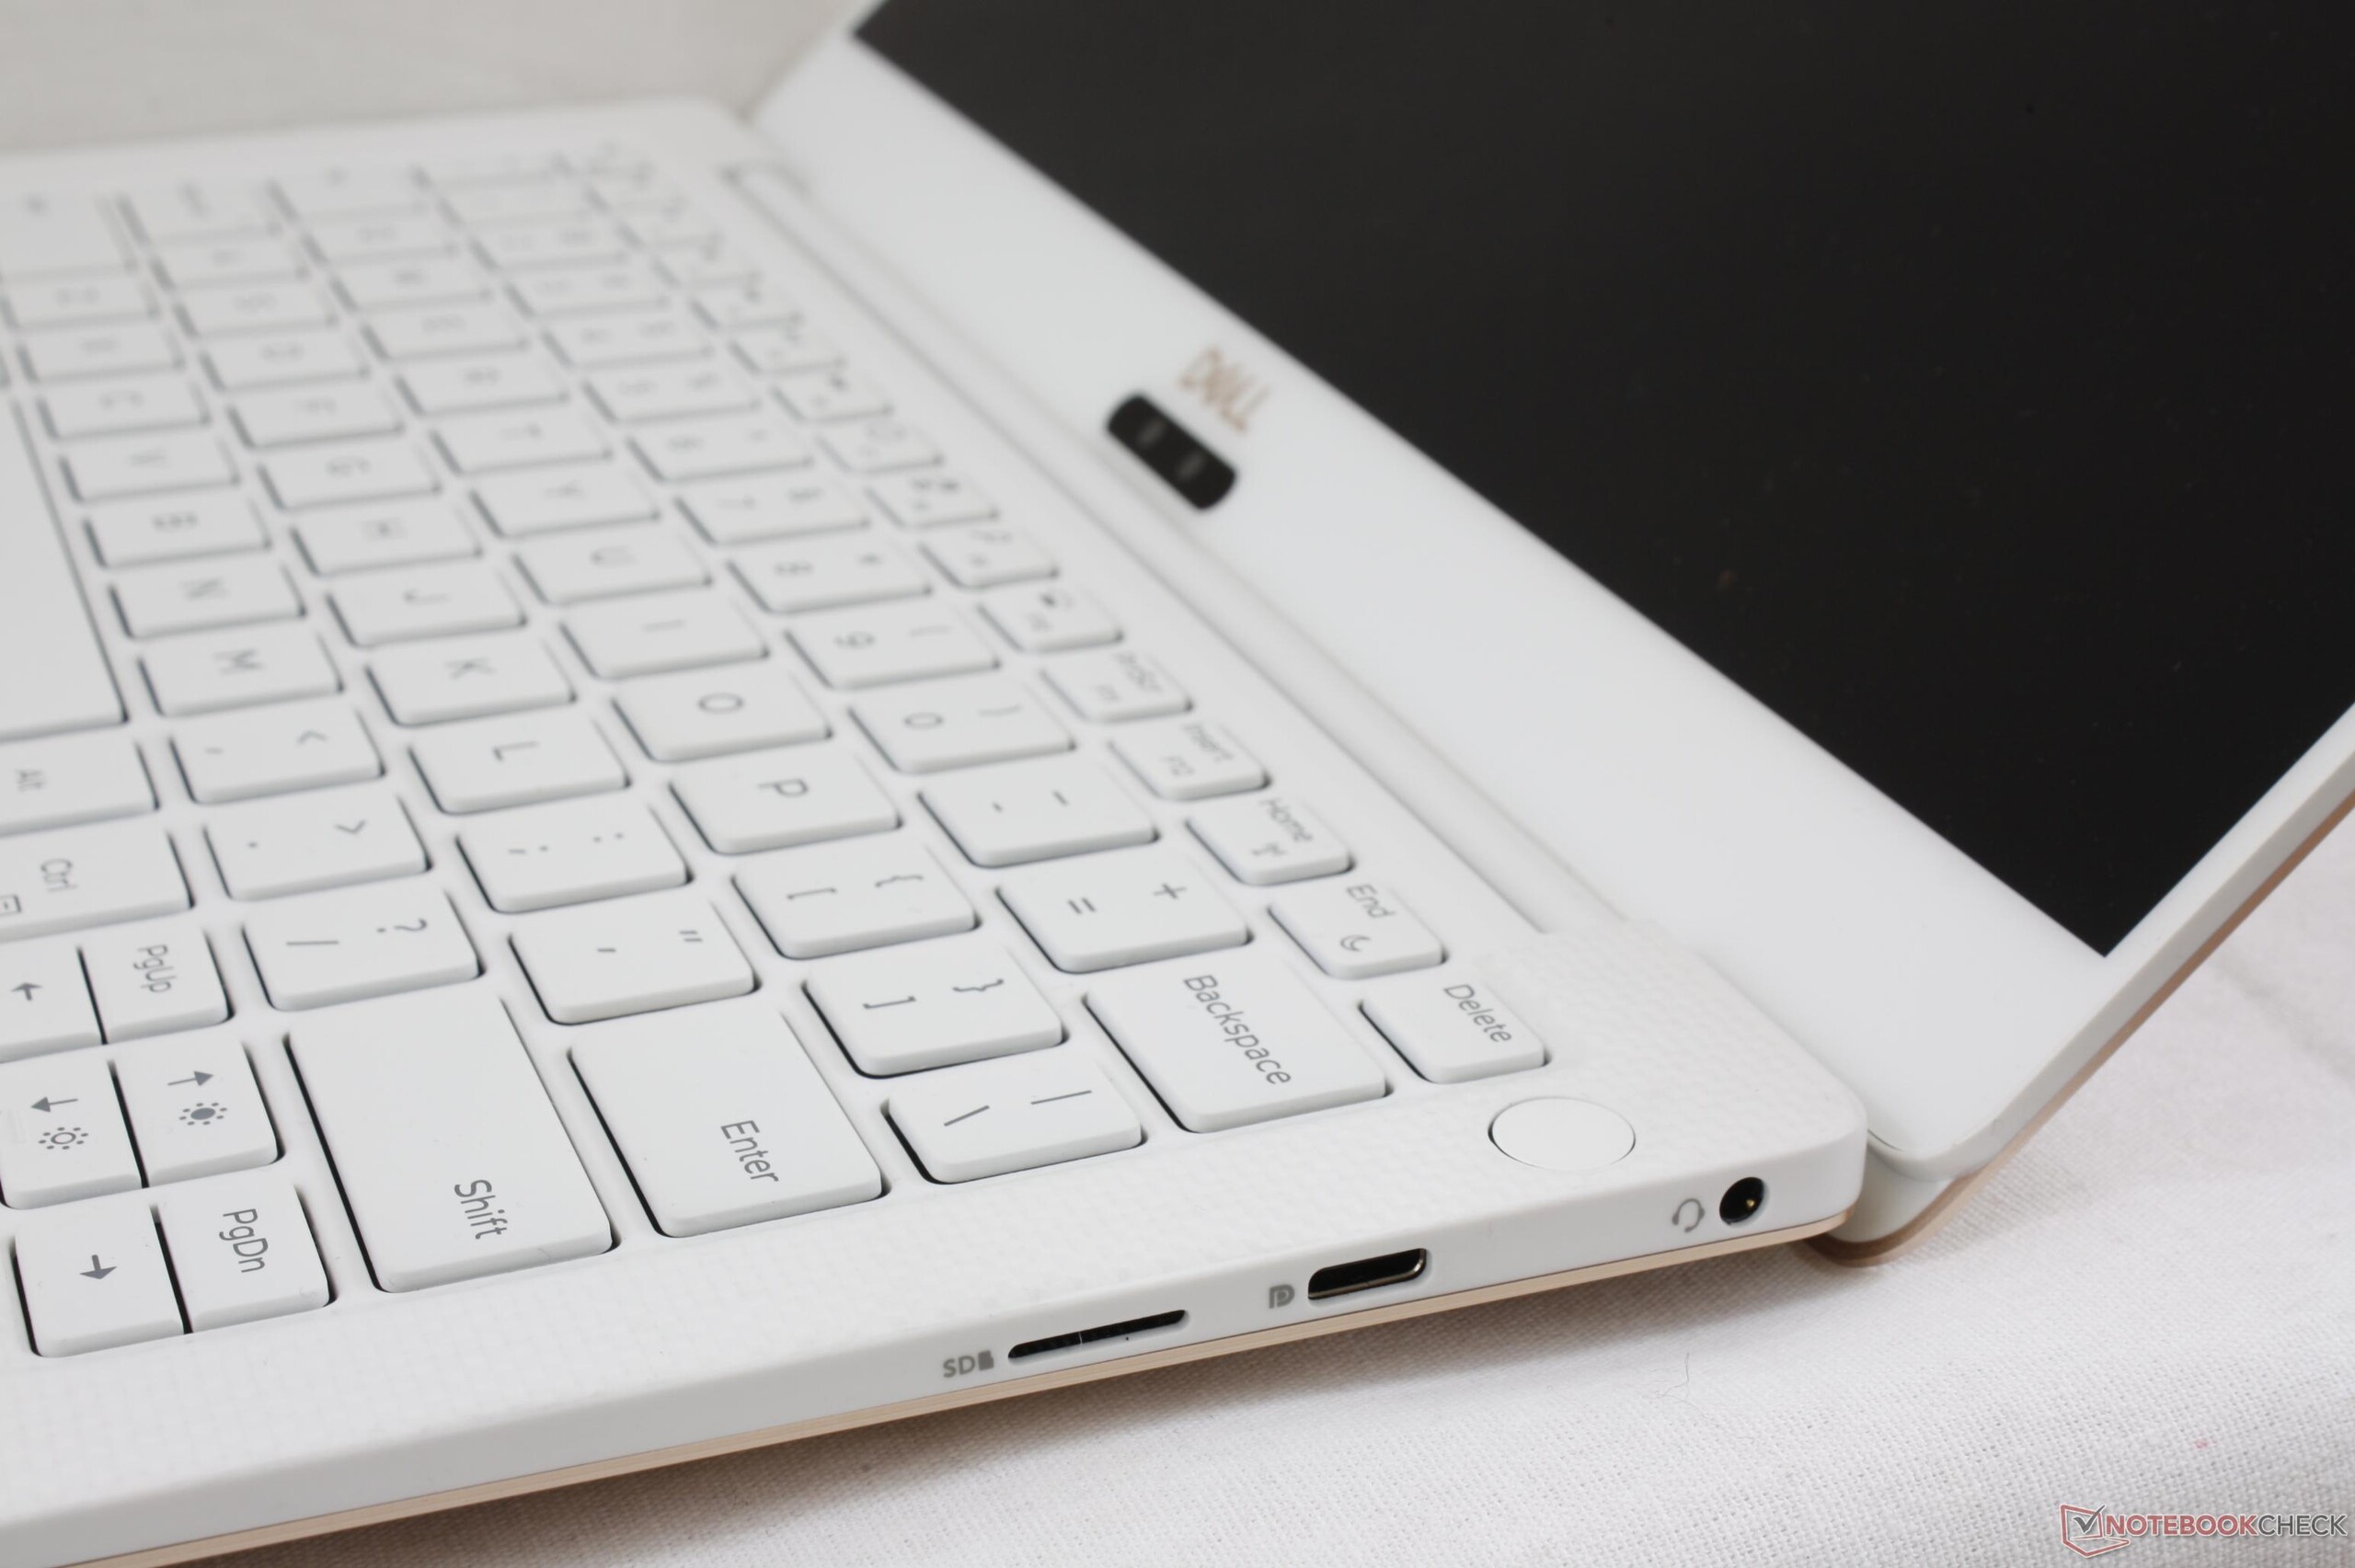
Com isso dito, os proprietários do XPS 13 9360 não estão perdendo muito nesta última revisão, considerando que o teclado, o peso, o processador, os alto-falantes, a webcam e o chassi são iguais ou não tão diferentes. A nova escala de desempenho é agradável, mas é praticamente imperceptível para cargas comuns médias-baixas, como processamento de texto, navegação ou reprodução de vídeo. Assim, os maiores incentivos para que os proprietários existentes atualizem são coisas muito profundas. Se os marcos mais estreitos, a luz de fundo mais brilhante e o perfil mais fino não são atraentes, então há poucos motivos para atualizar, pois você realmente perderia as portas tipo USB A, um leitor SD de tamanho normal, um chassi ligeiramente mais forte e uma bateria maior.
Para os proprietários de Ultrabooks concorrentes, o XPS 13 9370 é mais uma razão para os usuários fazerem a mudança. O XPS 13 9360 anterior ainda é atraente, pois traz um punhado de vantagens em relação ao XPS 9370, como mencionado acima. Os usuários do MacBook Pro 13 não tem nada com que se preocupar, já que o sistema Apple ainda é mais potente, mais brilhante, mais duradouro e com um trackpad sem dúvida fácil de usar.
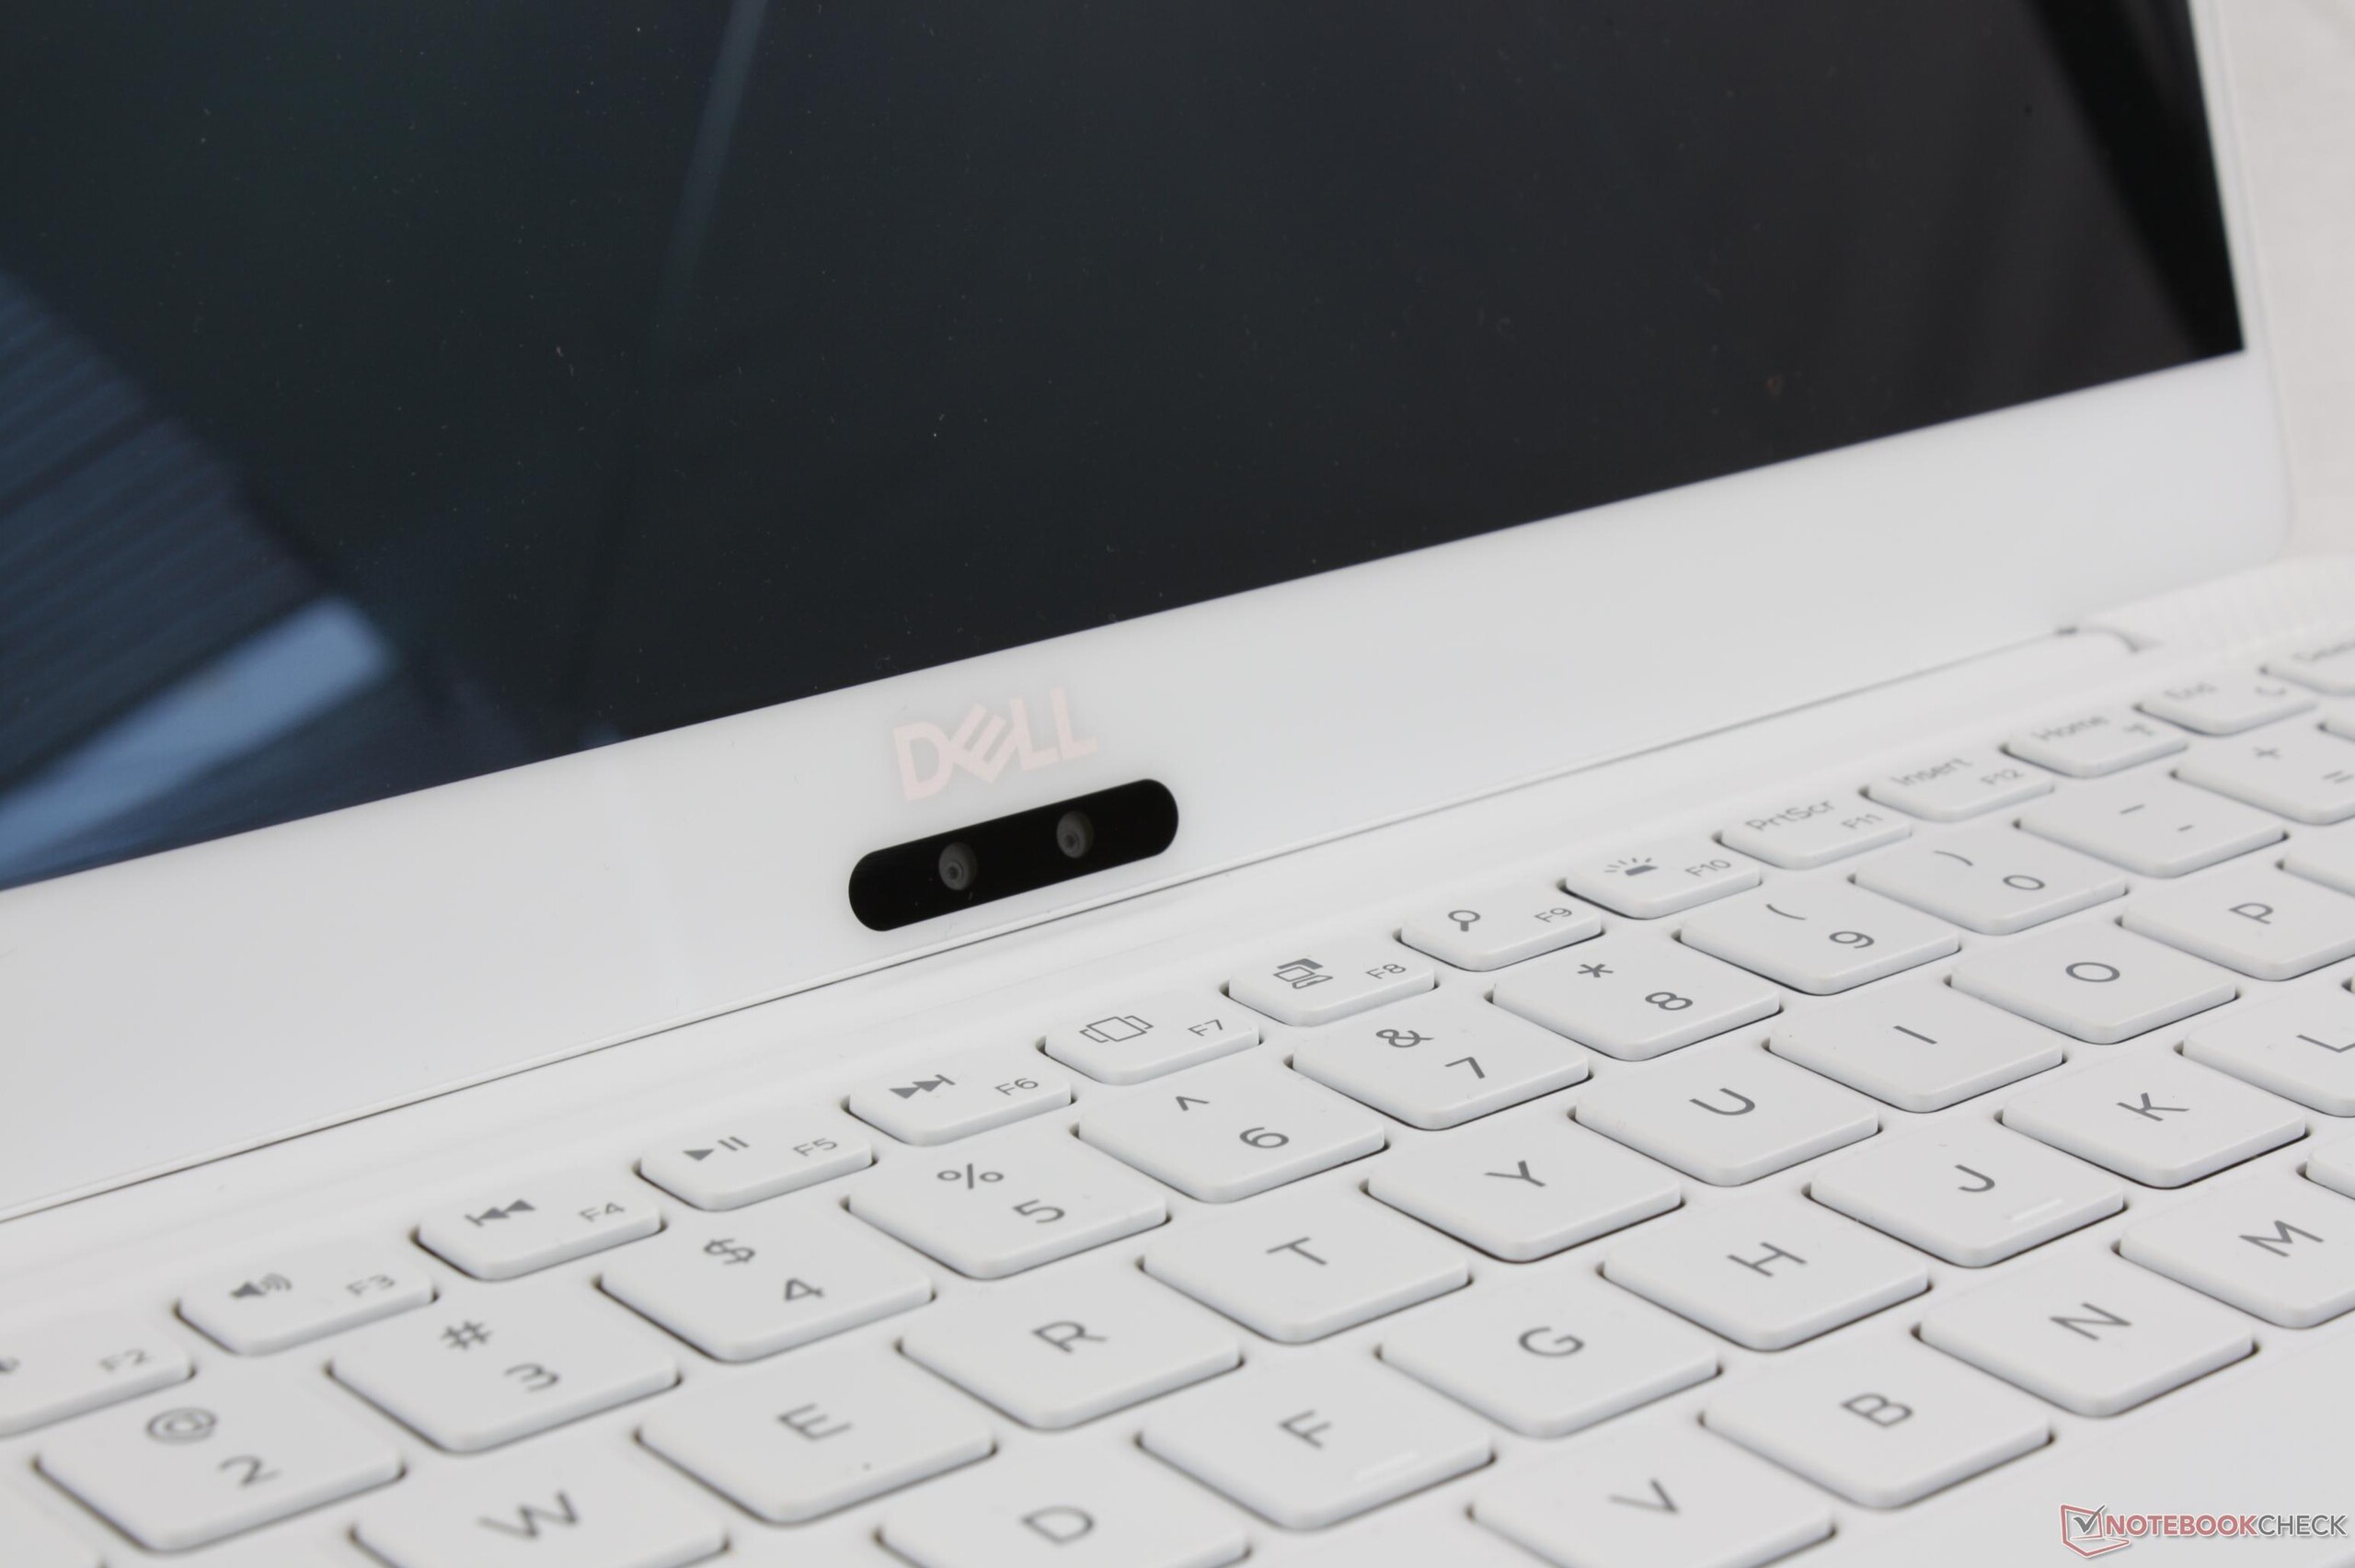
O XPS 13 9370 é o exemplo clássico de dar alguns passos para a frente e alguns passos para trás. É uma melhoria em relação à última geração, se a aparência, o tamanho, a resolução e o brilho são as principais preocupações, mas outros aspectos importantes, como a duração da bateria, tempos de resposta, rigidez, localização da webcam e conectividade, parecem ter ocupado um banco traseiro.
Dell XPS 13 9370 i5 UHD
- 02/01/2018 v6 (old)
Allen Ngo
Price comparison
