Breve Análise do Portátil PC Specialist Proteus V (i7-7700HQ, GTX 1060, Full HD)
| SD Card Reader | |
| average JPG Copy Test (av. of 3 runs) | |
| PC Zentrum Proteus V (Toshiba Exceria Pro SDXC 64 GB UHS-II) | |
| Schenker XMG Core 15 (Toshiba Exceria Pro SDXC 64 GB UHS-II) | |
| Gigabyte P55W v7 (Toshiba Exceria Pro SDXC 64 GB UHS-II) | |
| MSI GS63VR 7RF-228US (Toshiba Exceria Pro SDXC 64 GB UHS-II) | |
| Acer Aspire VN7-593G-73HP V15 Nitro BE | |
| maximum AS SSD Seq Read Test (1GB) | |
| PC Zentrum Proteus V (Toshiba Exceria Pro SDXC 64 GB UHS-II) | |
| Gigabyte P55W v7 (Toshiba Exceria Pro SDXC 64 GB UHS-II) | |
| Schenker XMG Core 15 (Toshiba Exceria Pro SDXC 64 GB UHS-II) | |
| Acer Aspire VN7-593G-73HP V15 Nitro BE | |
| MSI GS63VR 7RF-228US (Toshiba Exceria Pro SDXC 64 GB UHS-II) | |
| |||||||||||||||||||||||||
iluminação: 85 %
iluminação com acumulador: 242 cd/m²
Contraste: 1152:1 (Preto: 0.21 cd/m²)
ΔE ColorChecker Calman: 4.27 | ∀{0.5-29.43 Ø4.71}
ΔE Greyscale Calman: 2.17 | ∀{0.09-98 Ø4.96}
58% sRGB (Argyll 1.6.3 3D)
37% AdobeRGB 1998 (Argyll 1.6.3 3D)
40.42% AdobeRGB 1998 (Argyll 3D)
58% sRGB (Argyll 3D)
39.13% Display P3 (Argyll 3D)
Gamma: 2.38
CCT: 6912 K
| PC Zentrum Proteus V BOEhydis NV156FHM-N42 (BOE06C6), 1920x1080, 15.6" | Schenker XMG Core 15 LG Philips LP156WF6 (LGD046F), 1920x1080, 15.6" | MSI GS63VR 7RF-228US 3840x2160, 15.6" | Acer Aspire VN7-593G-73HP V15 Nitro BE LG Display LP156WF6-SPP1, 1920x1080, 15.6" | Gigabyte P55W v7 LG Philips LP156WF6 (LGD046F), 1920x1080, 15.6" | |
|---|---|---|---|---|---|
| Display | 52% | 24% | 56% | 50% | |
| Display P3 Coverage (%) | 39.13 | 64.3 64% | 48.21 23% | 65.8 68% | 63.5 62% |
| sRGB Coverage (%) | 58 | 83 43% | 72.6 25% | 85.1 47% | 82 41% |
| AdobeRGB 1998 Coverage (%) | 40.42 | 60.6 50% | 49.81 23% | 62.2 54% | 59.9 48% |
| Response Times | 23% | 44% | 18% | 34% | |
| Response Time Grey 50% / Grey 80% * (ms) | 52.8 ? | 40.8 ? 23% | 28 ? 47% | 41 ? 22% | 37 ? 30% |
| Response Time Black / White * (ms) | 39.6 ? | 30.4 ? 23% | 23.6 ? 40% | 34 ? 14% | 25 ? 37% |
| PWM Frequency (Hz) | 21930 ? | 20490 ? | 1351 ? | ||
| Screen | -11% | -59% | -2% | -6% | |
| Brightness middle (cd/m²) | 242 | 297 23% | 274.2 13% | 322 33% | 287 19% |
| Brightness (cd/m²) | 235 | 276 17% | 263 12% | 297 26% | 289 23% |
| Brightness Distribution (%) | 85 | 87 2% | 92 8% | 86 1% | 87 2% |
| Black Level * (cd/m²) | 0.21 | 0.3 -43% | 0.44 -110% | 0.31 -48% | 0.29 -38% |
| Contrast (:1) | 1152 | 990 -14% | 623 -46% | 1039 -10% | 990 -14% |
| Colorchecker dE 2000 * | 4.27 | 5.25 -23% | 8 -87% | 4.73 -11% | 4.92 -15% |
| Colorchecker dE 2000 max. * | 7.09 | 10.3 -45% | 14.6 -106% | 12.37 -74% | 11 -55% |
| Greyscale dE 2000 * | 2.17 | 4.64 -114% | 9.1 -319% | 2.99 -38% | 3.66 -69% |
| Gamma | 2.38 92% | 2.39 92% | 2.24 98% | 2.32 95% | 2.32 95% |
| CCT | 6912 94% | 6600 98% | 5020 129% | 6905 94% | 6482 100% |
| Color Space (Percent of AdobeRGB 1998) (%) | 37 | 54 46% | 45.7 24% | 56 51% | 54 46% |
| Color Space (Percent of sRGB) (%) | 58 | 83 43% | 72.1 24% | 85 47% | 82 41% |
| Média Total (Programa/Configurações) | 21% /
6% | 3% /
-29% | 24% /
12% | 26% /
11% |
* ... menor é melhor
Exibir tempos de resposta
| ↔ Tempo de resposta preto para branco | ||
|---|---|---|
| 39.6 ms ... ascensão ↗ e queda ↘ combinadas | ↗ 22.4 ms ascensão | 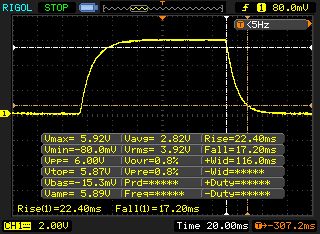 |
| ↘ 17.2 ms queda | ||
| A tela mostra taxas de resposta lentas em nossos testes e será insatisfatória para os jogadores. Em comparação, todos os dispositivos testados variam de 0.1 (mínimo) a 240 (máximo) ms. » 97 % de todos os dispositivos são melhores. Isso significa que o tempo de resposta medido é pior que a média de todos os dispositivos testados (19.8 ms). | ||
| ↔ Tempo de resposta 50% cinza a 80% cinza | ||
| 52.8 ms ... ascensão ↗ e queda ↘ combinadas | ↗ 25.2 ms ascensão | 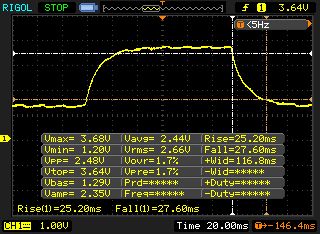 |
| ↘ 27.6 ms queda | ||
| A tela mostra taxas de resposta lentas em nossos testes e será insatisfatória para os jogadores. Em comparação, todos os dispositivos testados variam de 0.165 (mínimo) a 636 (máximo) ms. » 89 % de todos os dispositivos são melhores. Isso significa que o tempo de resposta medido é pior que a média de todos os dispositivos testados (31 ms). | ||
Cintilação da tela / PWM (modulação por largura de pulso)
| Tela tremeluzindo/PWM detectado | 21930 Hz | ≤ 95 % configuração de brilho | 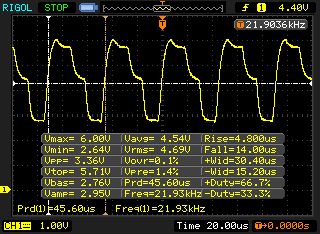 |
A luz de fundo da tela pisca em 21930 Hz (pior caso, por exemplo, utilizando PWM) Cintilação detectada em uma configuração de brilho de 95 % e abaixo. Não deve haver cintilação ou PWM acima desta configuração de brilho. A frequência de 21930 Hz é bastante alta, então a maioria dos usuários sensíveis ao PWM não deve notar nenhuma oscilação. [pwm_comparison] Em comparação: 52 % de todos os dispositivos testados não usam PWM para escurecer a tela. Se PWM foi detectado, uma média de 7754 (mínimo: 5 - máximo: 343500) Hz foi medida. | |||
| Cinebench R11.5 | |
| CPU Single 64Bit | |
| Schenker XMG Core 15 | |
| MSI GS63VR 7RF-228US | |
| PC Zentrum Proteus V | |
| CPU Multi 64Bit | |
| MSI GS63VR 7RF-228US | |
| PC Zentrum Proteus V | |
| Schenker XMG Core 15 | |
| PCMark 8 - Home Score Accelerated v2 | |
| PC Zentrum Proteus V | |
| Schenker XMG Core 15 | |
| MSI GS63VR 7RF-228US | |
| Gigabyte P55W v7 | |
| PCMark 10 - Score | |
| Schenker XMG Core 15 | |
| PC Zentrum Proteus V | |
| PCMark 8 Home Score Accelerated v2 | 4916 pontos | |
| PCMark 10 Score | 3904 pontos | |
Ajuda | ||
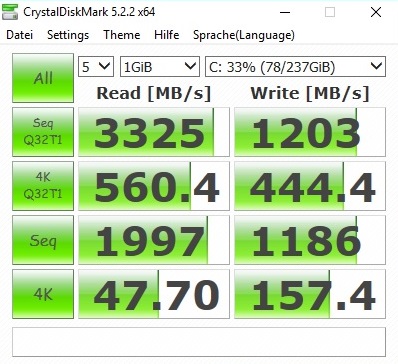
| PC Zentrum Proteus V Samsung PM961 MZVLW256HEHP | Schenker XMG Core 15 Samsung SSD 960 Evo 250GB m.2 NVMe | MSI GS63VR 7RF-228US Samsung SM961 MZVKW512HMJP m.2 PCI-e | Acer Aspire VN7-593G-73HP V15 Nitro BE Seagate Mobile HDD 1TB ST1000LM035 | Gigabyte P55W v7 Liteonit CV3-8D256 | |
|---|---|---|---|---|---|
| AS SSD | 20% | 26% | -68% | ||
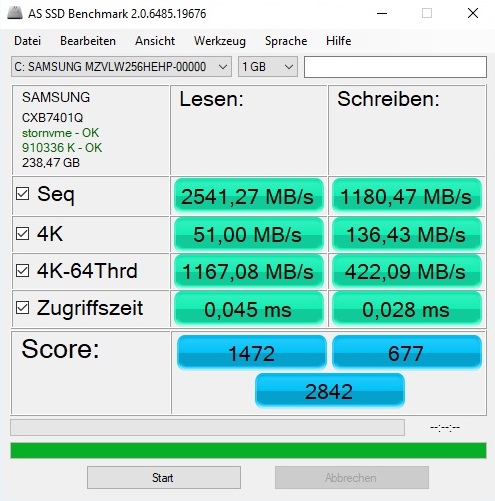
| Seq Read (MB/s) | 2541 | 2678 5% | 2719 7% | 514 -80% | |
| Seq Write (MB/s) | 1180 | 1172 -1% | 1550 31% | 328.1 -72% | |
| 4K Read (MB/s) | 51 | 46.56 -9% | 48.01 -6% | 23.34 -54% | |
| 4K Write (MB/s) | 136.4 | 142.9 5% | 127.6 -6% | 48.47 -64% | |
| Score Read (Points) | 1472 | 1639 11% | 1549 5% | 393 -73% | |
| Score Write (Points) | 677 | 1323 95% | 1468 117% | 248 -63% | |
| Score Total (Points) | 2842 | 3728 31% | 3756 32% | 840 -70% |

| 3DMark - 1920x1080 Fire Strike Graphics | |
| PC Zentrum Proteus V | |
| Acer Aspire VN7-593G-73HP V15 Nitro BE | |
| Gigabyte P55W v7 | |
| Schenker XMG Core 15 | |
| MSI GS63VR 7RF-228US | |
| 3DMark 11 - 1280x720 Performance GPU | |
| PC Zentrum Proteus V | |
| Acer Aspire VN7-593G-73HP V15 Nitro BE | |
| Gigabyte P55W v7 | |
| Schenker XMG Core 15 | |
| MSI GS63VR 7RF-228US | |
| 3DMark 11 Performance | 12205 pontos | |
| 3DMark Ice Storm Standard Score | 143270 pontos | |
| 3DMark Cloud Gate Standard Score | 26044 pontos | |
| 3DMark Fire Strike Score | 10010 pontos | |
Ajuda | ||
| The Witcher 3 | |
| 1920x1080 Ultra Graphics & Postprocessing (HBAO+) | |
| PC Zentrum Proteus V | |
| MSI GS63VR 7RF-228US | |
| Gigabyte P55W v7 | |
| Acer Aspire VN7-593G-73HP V15 Nitro BE | |
| Schenker XMG Core 15 | |
| 1920x1080 High Graphics & Postprocessing (Nvidia HairWorks Off) | |
| MSI GS63VR 7RF-228US | |
| PC Zentrum Proteus V | |
| Gigabyte P55W v7 | |
| Schenker XMG Core 15 | |
| Acer Aspire VN7-593G-73HP V15 Nitro BE | |
| baixo | média | alto | ultra | |
|---|---|---|---|---|
| The Witcher 3 (2015) | 72.2 | 39.9 | ||
| Middle-earth: Shadow of War (2017) | 68 | 52 | ||
| The Evil Within 2 (2017) | 43.4 | 41.8 | ||
| ELEX (2017) | 68.1 | 51.9 | ||
| Destiny 2 (2017) | 94.1 | 78.4 | ||
| Wolfenstein II: The New Colossus (2017) | 77.4 | 70.7 | ||
| Assassin´s Creed Origins (2017) | 57 | 47 | ||
| Call of Duty WWII (2017) | 93.8 | 70.4 | ||
| Need for Speed Payback (2017) | 77.8 | 73.7 | ||
| Star Wars Battlefront 2 (2017) | 80.6 | 62.3 |
Barulho
| Ocioso |
| 37 / 38 / 39 dB |
| Carga |
| 47 / 52 dB |
 | ||
30 dB silencioso 40 dB(A) audível 50 dB(A) ruidosamente alto |
||
min: | ||
| PC Zentrum Proteus V GeForce GTX 1060 Mobile, i7-7700HQ | Schenker XMG Core 15 GeForce GTX 1060 Mobile, i7-7700HQ | MSI GS63VR 7RF-228US GeForce GTX 1060 Mobile, i7-7700HQ | Acer Aspire VN7-593G-73HP V15 Nitro BE GeForce GTX 1060 Mobile, i7-7700HQ | Gigabyte P55W v7 GeForce GTX 1060 Mobile, i7-7700HQ | |
|---|---|---|---|---|---|
| Noise | 12% | 10% | 11% | 9% | |
| desligado / ambiente * (dB) | 31 | 29 6% | 28.8 7% | 30.4 2% | 30 3% |
| Idle Minimum * (dB) | 37 | 31 16% | 33.1 11% | 30.9 16% | 33 11% |
| Idle Average * (dB) | 38 | 32 16% | 33.1 13% | 30.9 19% | 34 11% |
| Idle Maximum * (dB) | 39 | 34 13% | 34 13% | 31.5 19% | 35 10% |
| Load Average * (dB) | 47 | 41 13% | 37.2 21% | 40.7 13% | 39 17% |
| Witcher 3 ultra * (dB) | 43 | 39 9% | 46.1 -7% | 45.5 -6% | |
| Load Maximum * (dB) | 52 | 47 10% | 47.1 9% | 43.9 16% | 50 4% |
* ... menor é melhor
(±) A temperatura máxima no lado superior é 44 °C / 111 F, em comparação com a média de 40.4 °C / 105 F , variando de 21.2 a 68.8 °C para a classe Gaming.
(-) A parte inferior aquece até um máximo de 53 °C / 127 F, em comparação com a média de 43.2 °C / 110 F
(+) Em uso inativo, a temperatura média para o lado superior é 26.9 °C / 80 F, em comparação com a média do dispositivo de 33.9 °C / ### class_avg_f### F.
(±) Jogando The Witcher 3, a temperatura média para o lado superior é 36.6 °C / 98 F, em comparação com a média do dispositivo de 33.9 °C / ## #class_avg_f### F.
(+) Os apoios para as mãos e o touchpad estão atingindo a temperatura máxima da pele (33 °C / 91.4 F) e, portanto, não estão quentes.
(-) A temperatura média da área do apoio para as mãos de dispositivos semelhantes foi 28.8 °C / 83.8 F (-4.2 °C / -7.6 F).
| PC Zentrum Proteus V GeForce GTX 1060 Mobile, i7-7700HQ | Schenker XMG Core 15 GeForce GTX 1060 Mobile, i7-7700HQ | MSI GS63VR 7RF-228US GeForce GTX 1060 Mobile, i7-7700HQ | Acer Aspire VN7-593G-73HP V15 Nitro BE GeForce GTX 1060 Mobile, i7-7700HQ | Gigabyte P55W v7 GeForce GTX 1060 Mobile, i7-7700HQ | |
|---|---|---|---|---|---|
| Heat | -23% | 0% | -6% | 8% | |
| Maximum Upper Side * (°C) | 44 | 53 -20% | 51.9 -18% | 49.6 -13% | |
| Maximum Bottom * (°C) | 53 | 61 -15% | 54.6 -3% | 47.7 10% | |
| Idle Upper Side * (°C) | 29 | 35 -21% | 28.4 2% | 29.1 -0% | 23.6 19% |
| Idle Bottom * (°C) | 29 | 39 -34% | 29.6 -2% | 29.3 -1% | 24.6 15% |
* ... menor é melhor
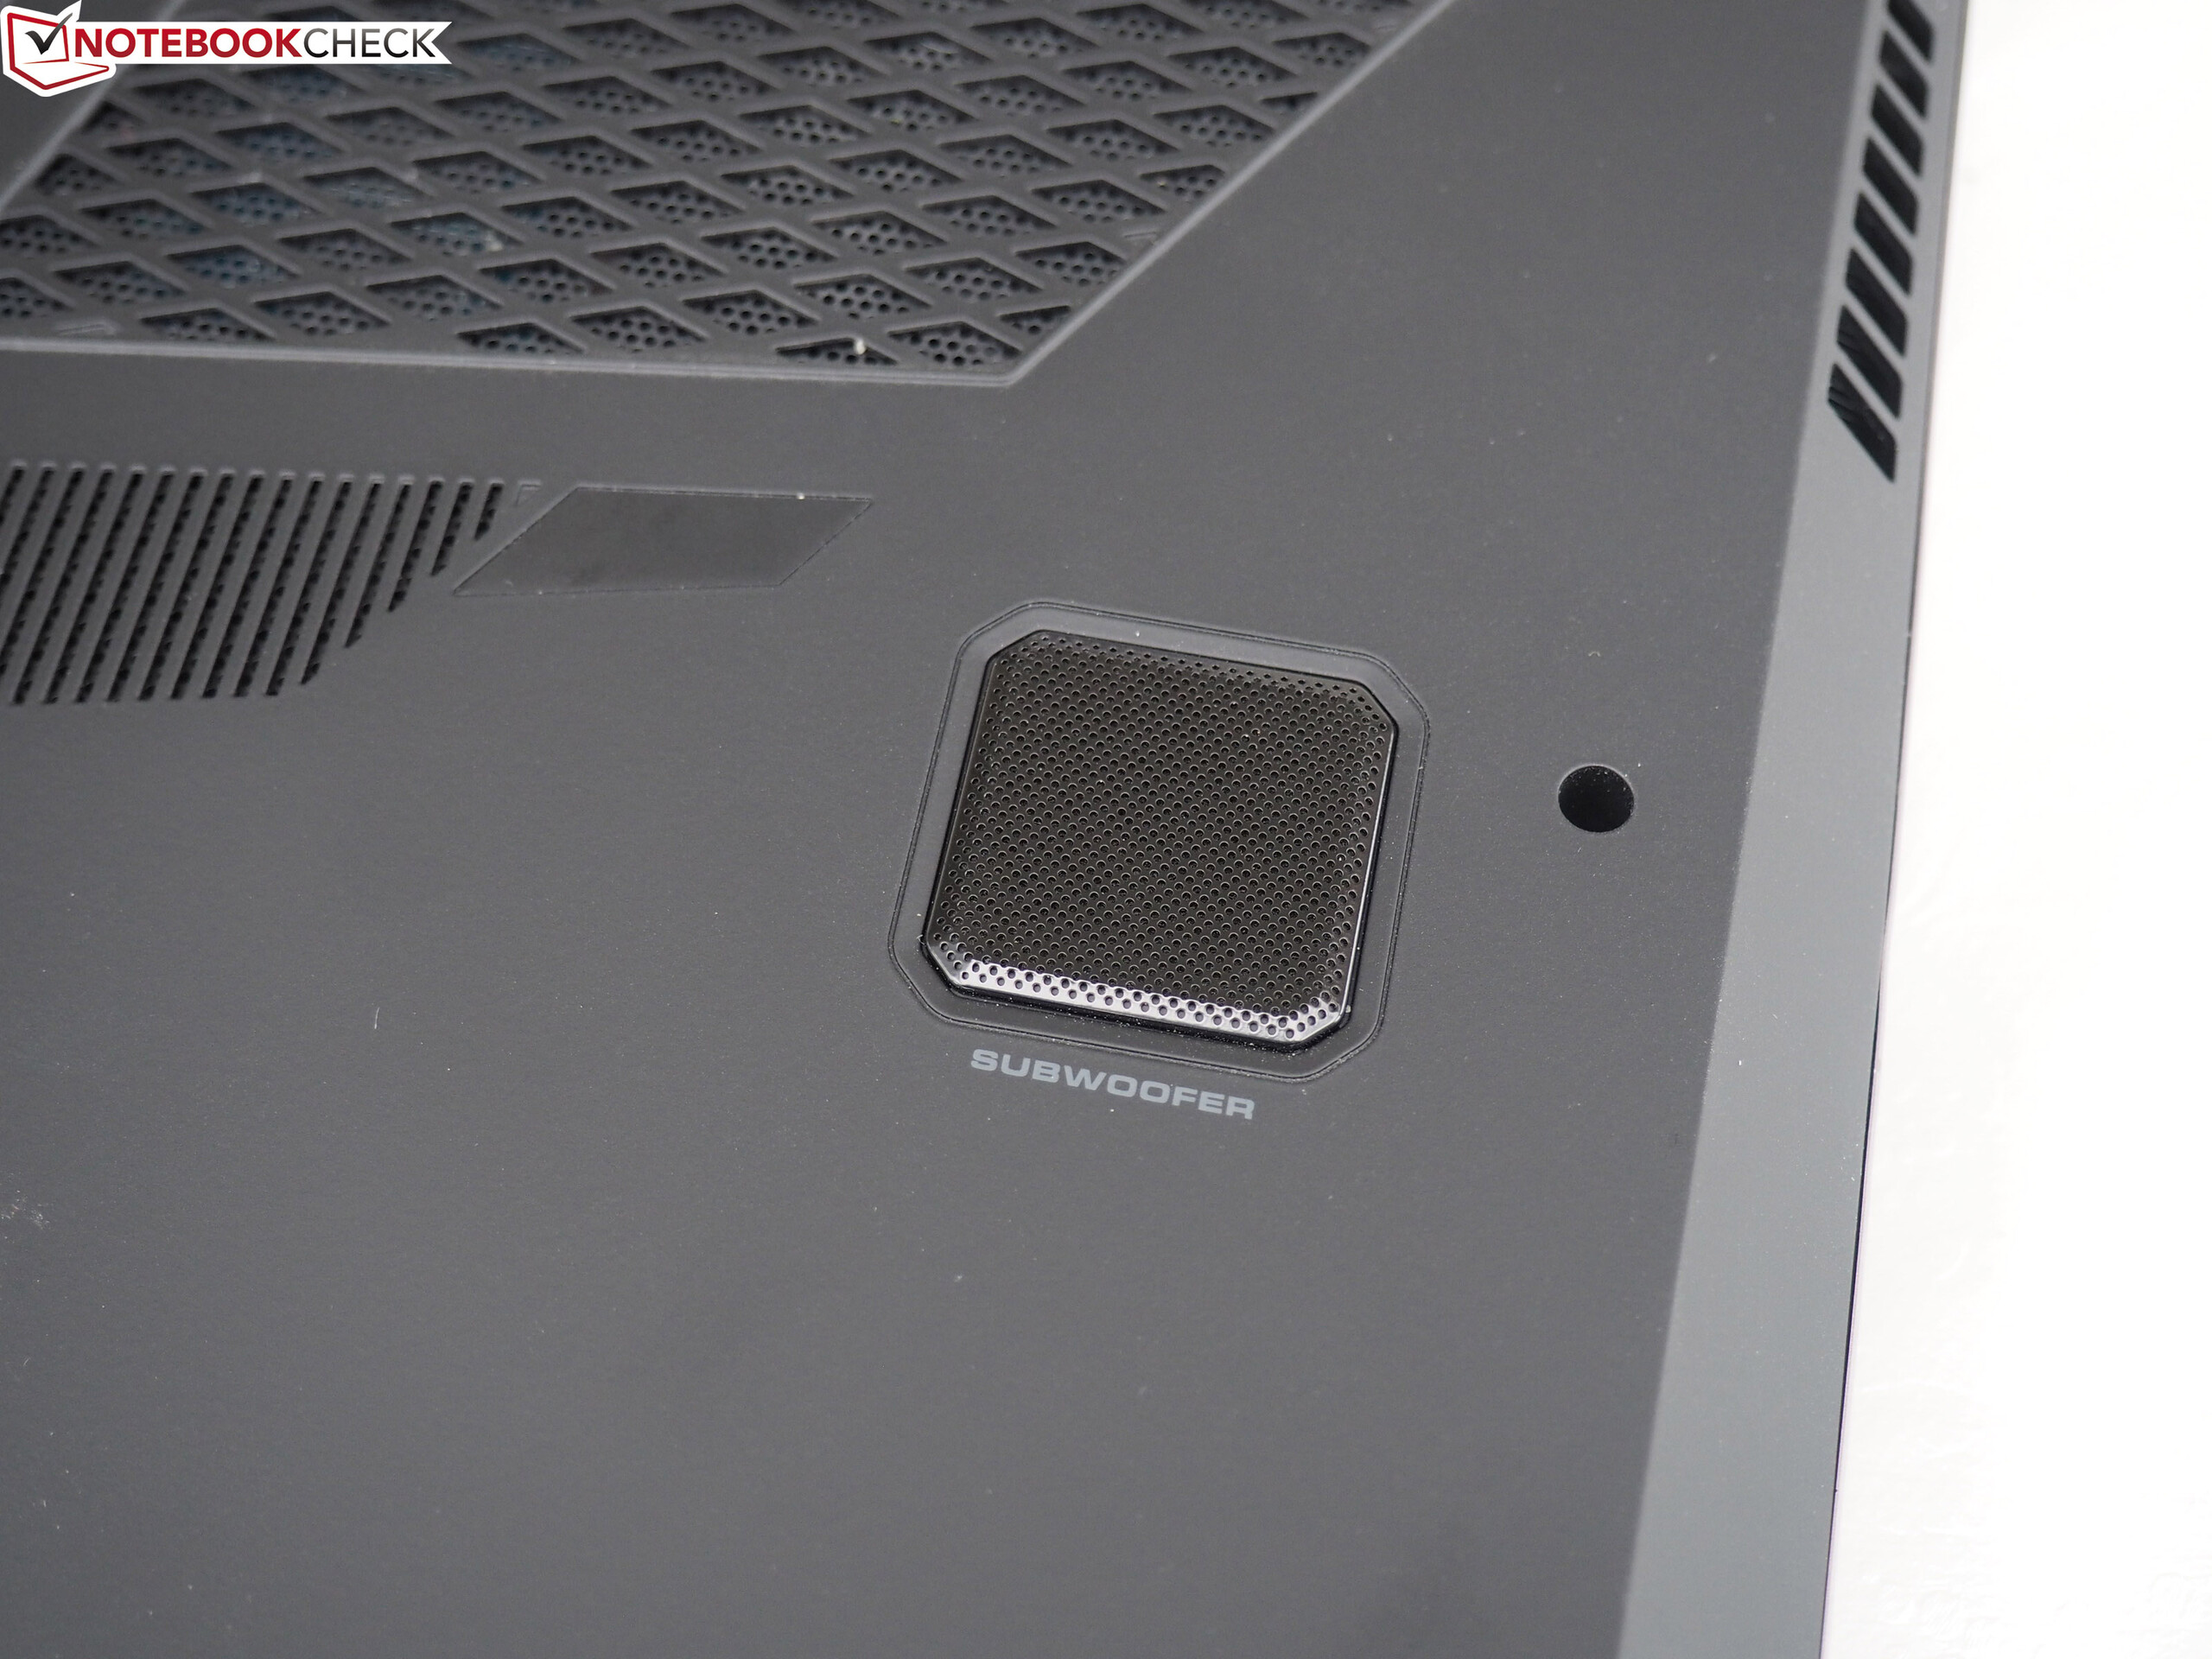
PC Zentrum Proteus V análise de áudio
(-) | alto-falantes não muito altos (###valor### dB)
Graves 100 - 315Hz
(±) | graves reduzidos - em média 9.3% menor que a mediana
(±) | a linearidade dos graves é média (14.5% delta para a frequência anterior)
Médios 400 - 2.000 Hz
(+) | médios equilibrados - apenas 3.5% longe da mediana
(±) | a linearidade dos médios é média (7% delta para frequência anterior)
Altos 2 - 16 kHz
(+) | agudos equilibrados - apenas 2.8% longe da mediana
(±) | a linearidade dos máximos é média (8.9% delta para frequência anterior)
Geral 100 - 16.000 Hz
(±) | a linearidade do som geral é média (22.6% diferença em relação à mediana)
Comparado com a mesma classe
» 81% de todos os dispositivos testados nesta classe foram melhores, 5% semelhantes, 14% piores
» O melhor teve um delta de 6%, a média foi 18%, o pior foi 132%
Comparado com todos os dispositivos testados
» 67% de todos os dispositivos testados foram melhores, 6% semelhantes, 28% piores
» O melhor teve um delta de 4%, a média foi 23%, o pior foi 134%
Schenker XMG Core 15 análise de áudio
(±) | o volume do alto-falante é médio, mas bom (###valor### dB)
Graves 100 - 315Hz
(±) | graves reduzidos - em média 8% menor que a mediana
(±) | a linearidade dos graves é média (11.7% delta para a frequência anterior)
Médios 400 - 2.000 Hz
(±) | médios mais altos - em média 10.1% maior que a mediana
(±) | a linearidade dos médios é média (13.2% delta para frequência anterior)
Altos 2 - 16 kHz
(+) | agudos equilibrados - apenas 1.9% longe da mediana
(±) | a linearidade dos máximos é média (7.5% delta para frequência anterior)
Geral 100 - 16.000 Hz
(±) | a linearidade do som geral é média (23.6% diferença em relação à mediana)
Comparado com a mesma classe
» 86% de todos os dispositivos testados nesta classe foram melhores, 4% semelhantes, 10% piores
» O melhor teve um delta de 6%, a média foi 18%, o pior foi 132%
Comparado com todos os dispositivos testados
» 71% de todos os dispositivos testados foram melhores, 6% semelhantes, 23% piores
» O melhor teve um delta de 4%, a média foi 23%, o pior foi 134%
| desligado | |
| Ocioso | |
| Carga |
|
Key:
min: | |
| PC Zentrum Proteus V GeForce GTX 1060 Mobile, i7-7700HQ | Schenker XMG Core 15 GeForce GTX 1060 Mobile, i7-7700HQ | MSI GS63VR 7RF-228US GeForce GTX 1060 Mobile, i7-7700HQ | Acer Aspire VN7-593G-73HP V15 Nitro BE GeForce GTX 1060 Mobile, i7-7700HQ | Gigabyte P55W v7 GeForce GTX 1060 Mobile, i7-7700HQ | |
|---|---|---|---|---|---|
| Power Consumption | 14% | 28% | 35% | 41% | |
| Idle Minimum * (Watt) | 28 | 18 36% | 14.5 48% | 7.2 74% | 8 71% |
| Idle Average * (Watt) | 32 | 22 31% | 17.3 46% | 10.5 67% | 13 59% |
| Idle Maximum * (Watt) | 38 | 26 32% | 17.4 54% | 16 58% | 18 53% |
| Load Average * (Watt) | 91 | 93 -2% | 93 -2% | 82 10% | 76 16% |
| Witcher 3 ultra * (Watt) | 124 | 119 4% | 128.8 -4% | 124 -0% | |
| Load Maximum * (Watt) | 152 | 175 -15% | 155 -2% | 143 6% |
* ... menor é melhor
| PC Zentrum Proteus V GeForce GTX 1060 Mobile, i7-7700HQ, Wh | Schenker XMG Core 15 GeForce GTX 1060 Mobile, i7-7700HQ, 82 Wh | MSI GS63VR 7RF-228US GeForce GTX 1060 Mobile, i7-7700HQ, 65 Wh | Acer Aspire VN7-593G-73HP V15 Nitro BE GeForce GTX 1060 Mobile, i7-7700HQ, 69 Wh | Gigabyte P55W v7 GeForce GTX 1060 Mobile, i7-7700HQ, 63 Wh | |
|---|---|---|---|---|---|
| Duração da bateria | 21% | 26% | 90% | 113% | |
| Reader / Idle (h) | 3.7 | 5 35% | 6.4 73% | 8.4 127% | 13.2 257% |
| H.264 (h) | 3.3 | 3.9 18% | |||
| WiFi v1.3 (h) | 3.3 | 4.7 42% | 3.9 18% | 6 82% | 5.8 76% |
| Load (h) | 1.5 | 1.3 -13% | 1.3 -13% | 2.4 60% | 1.6 7% |
Pro
Contra
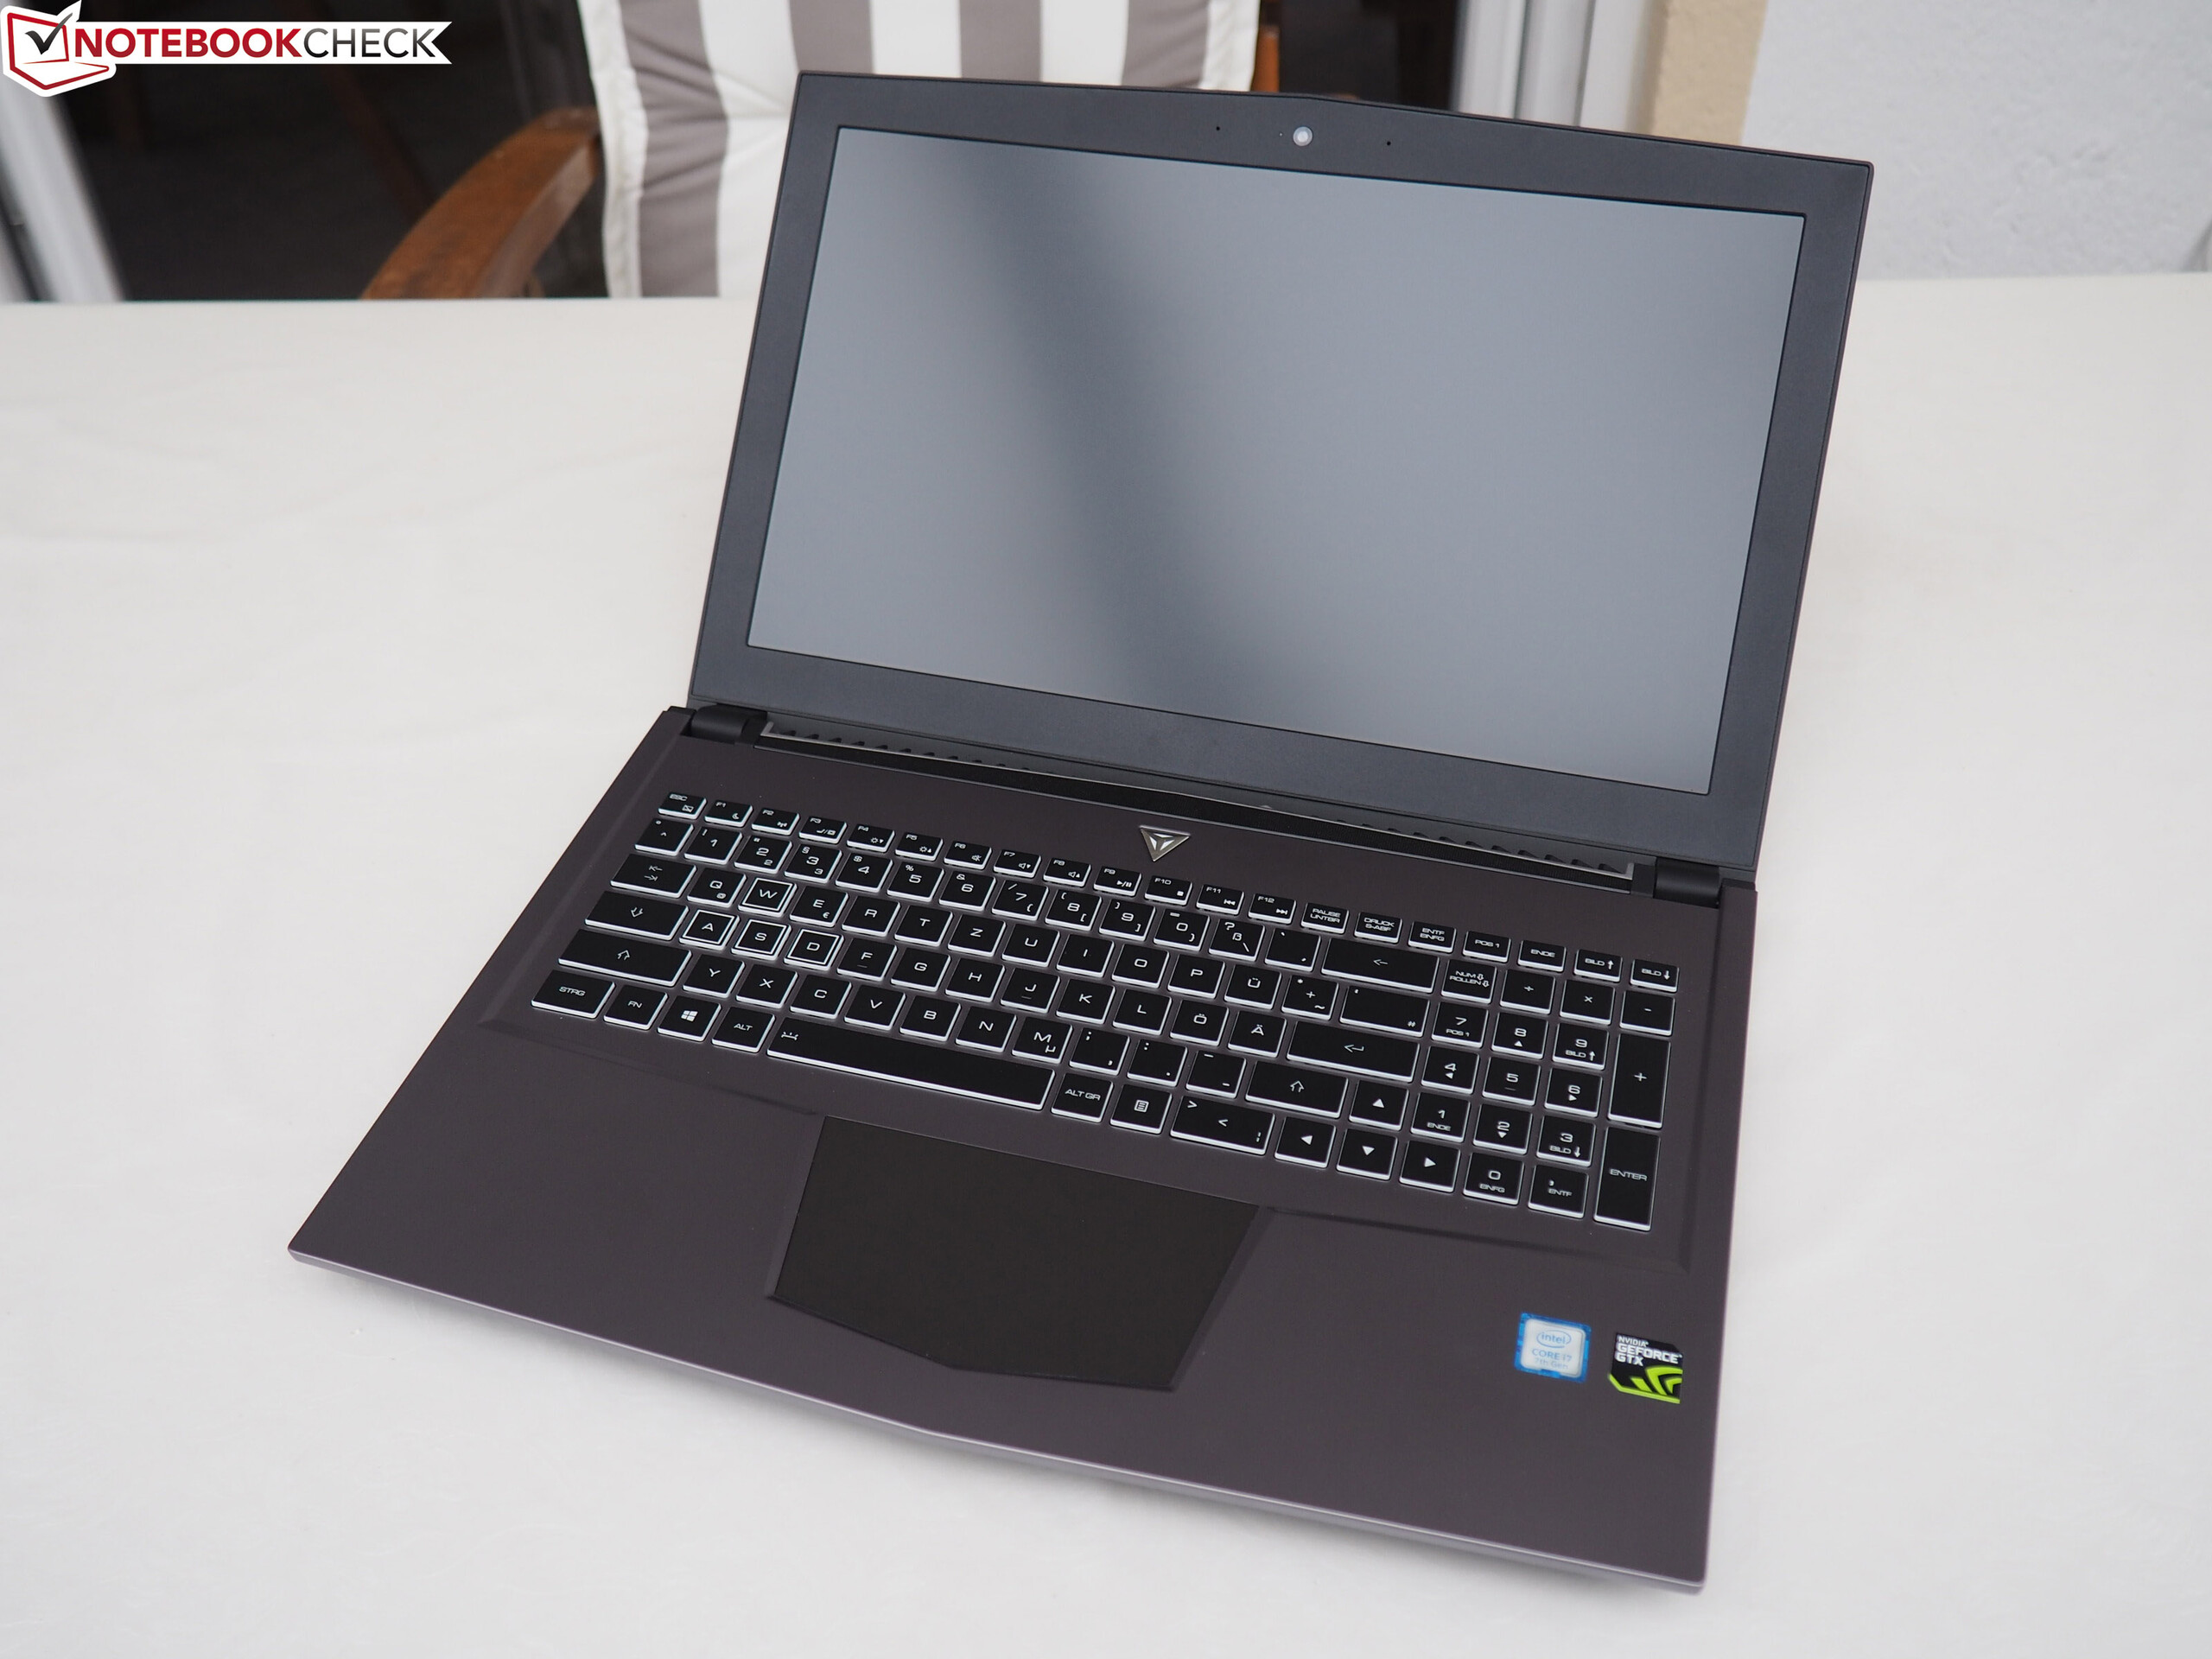
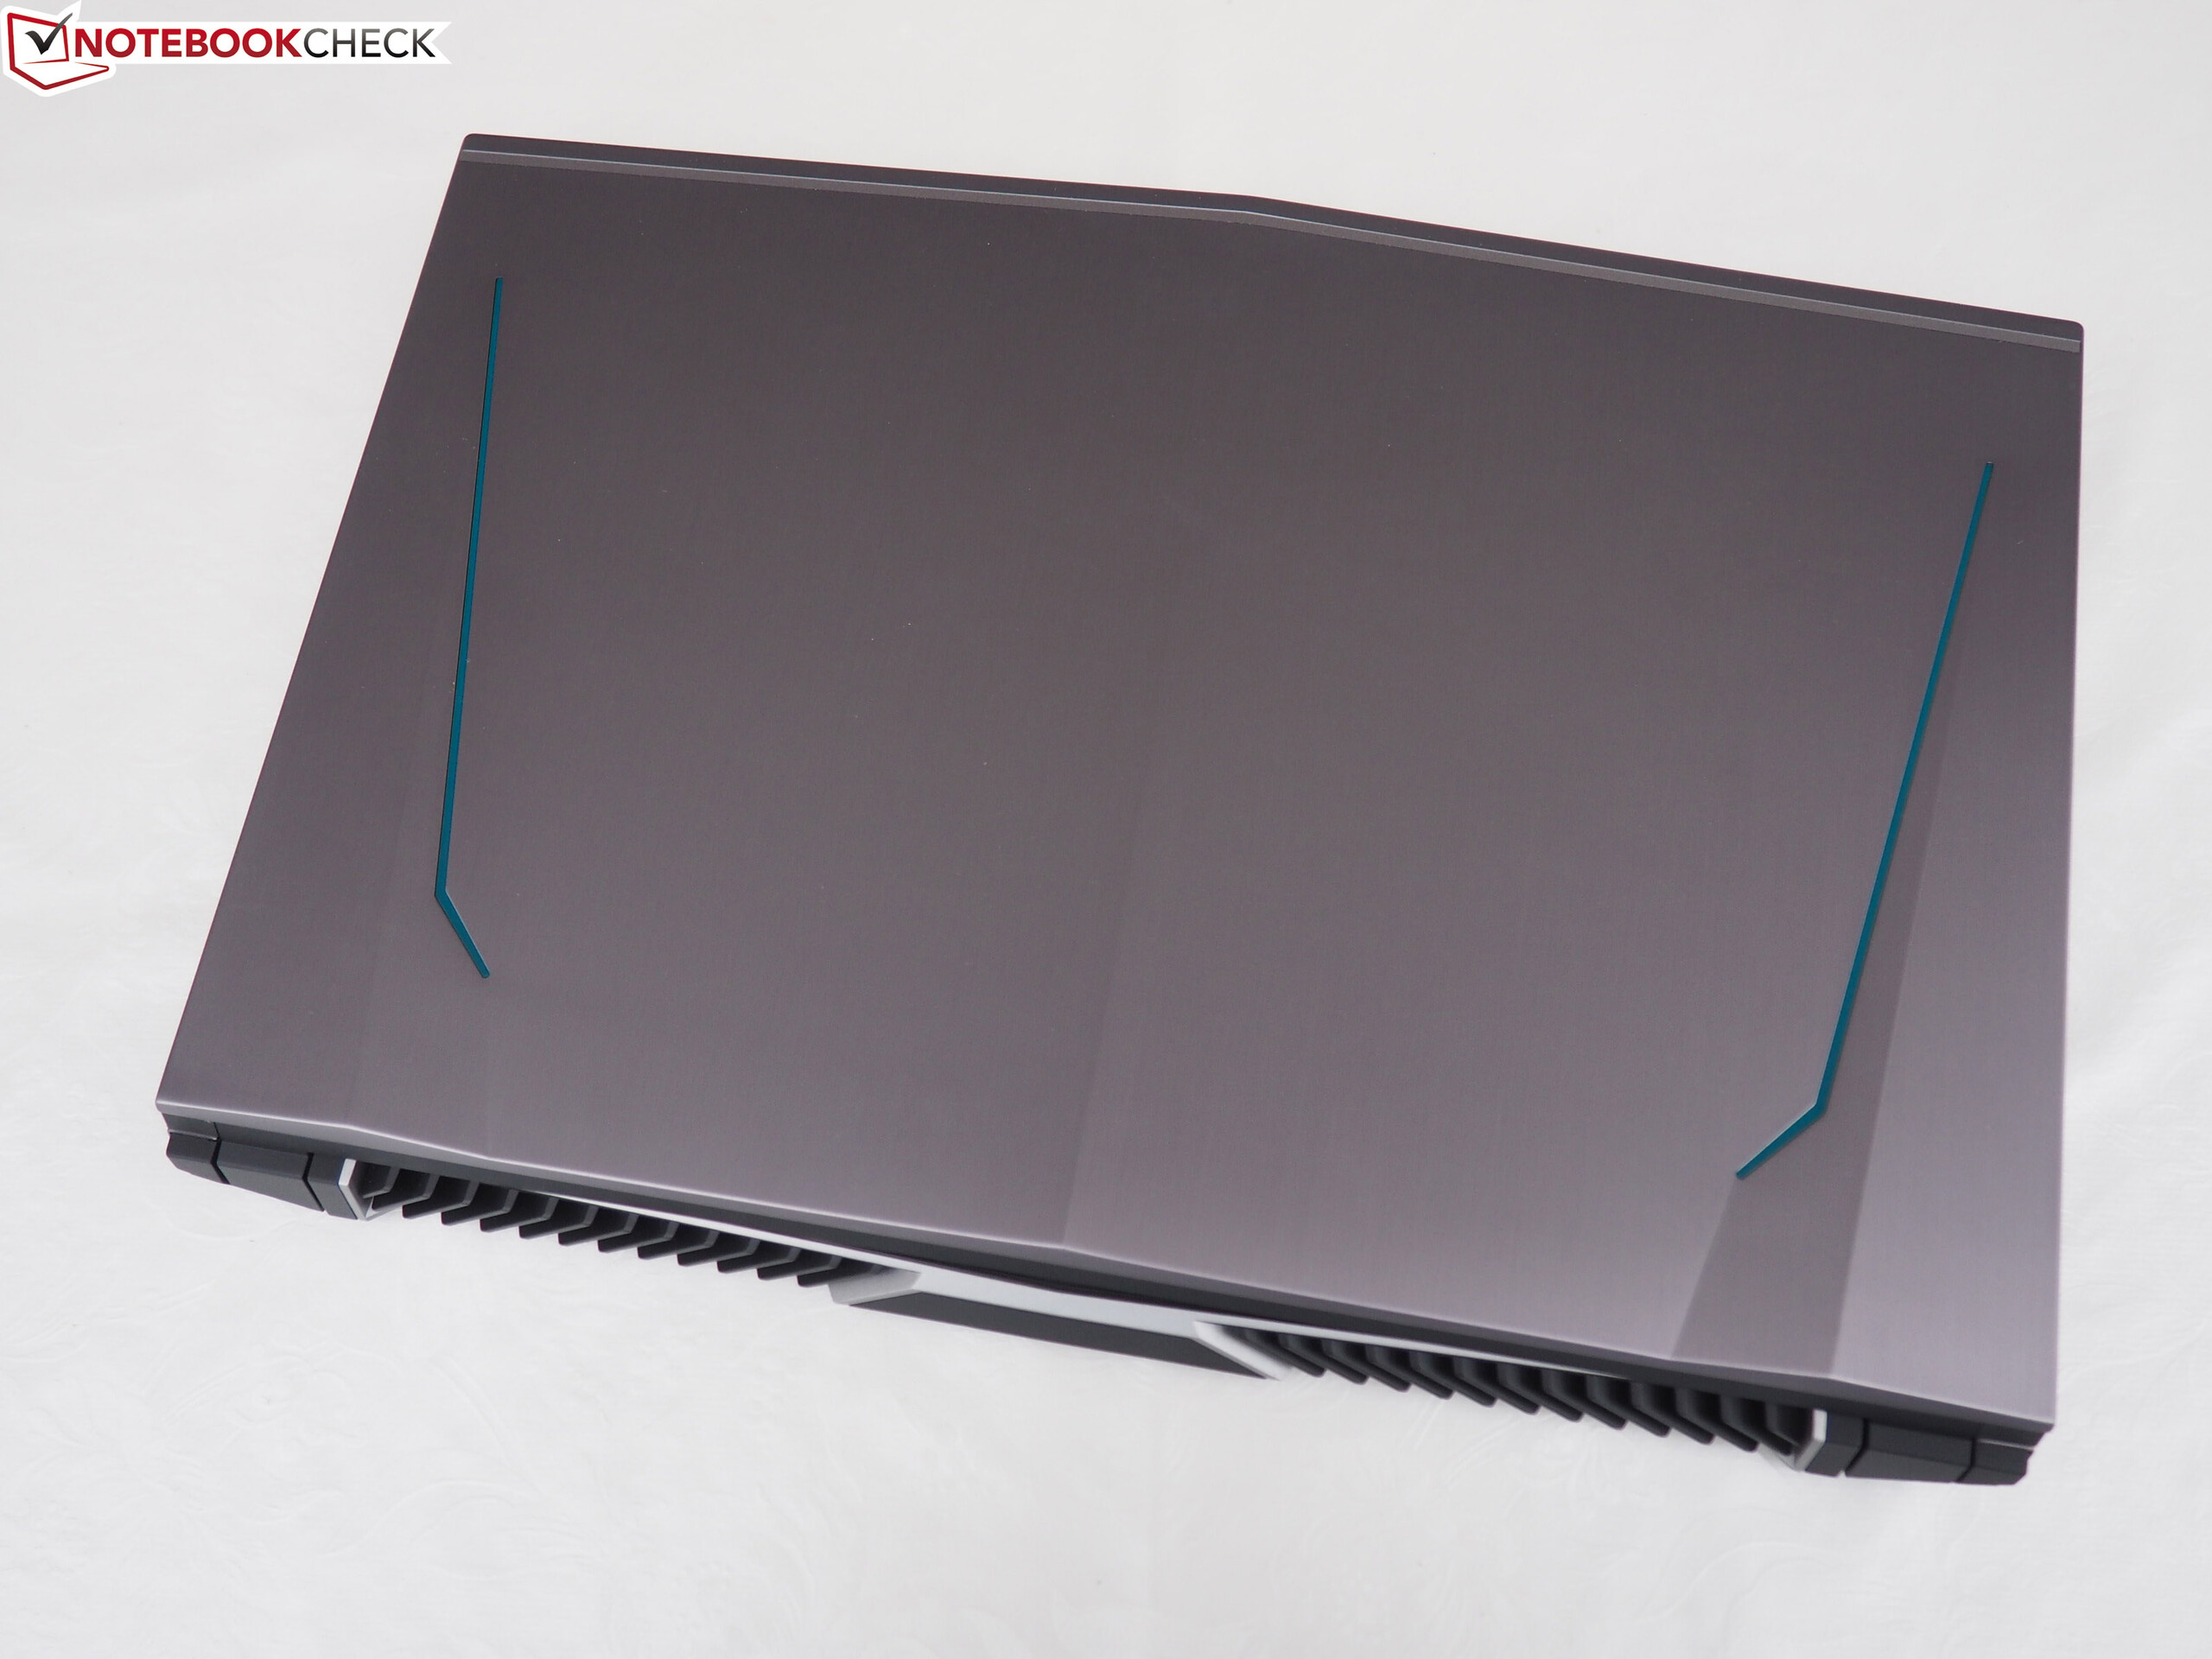
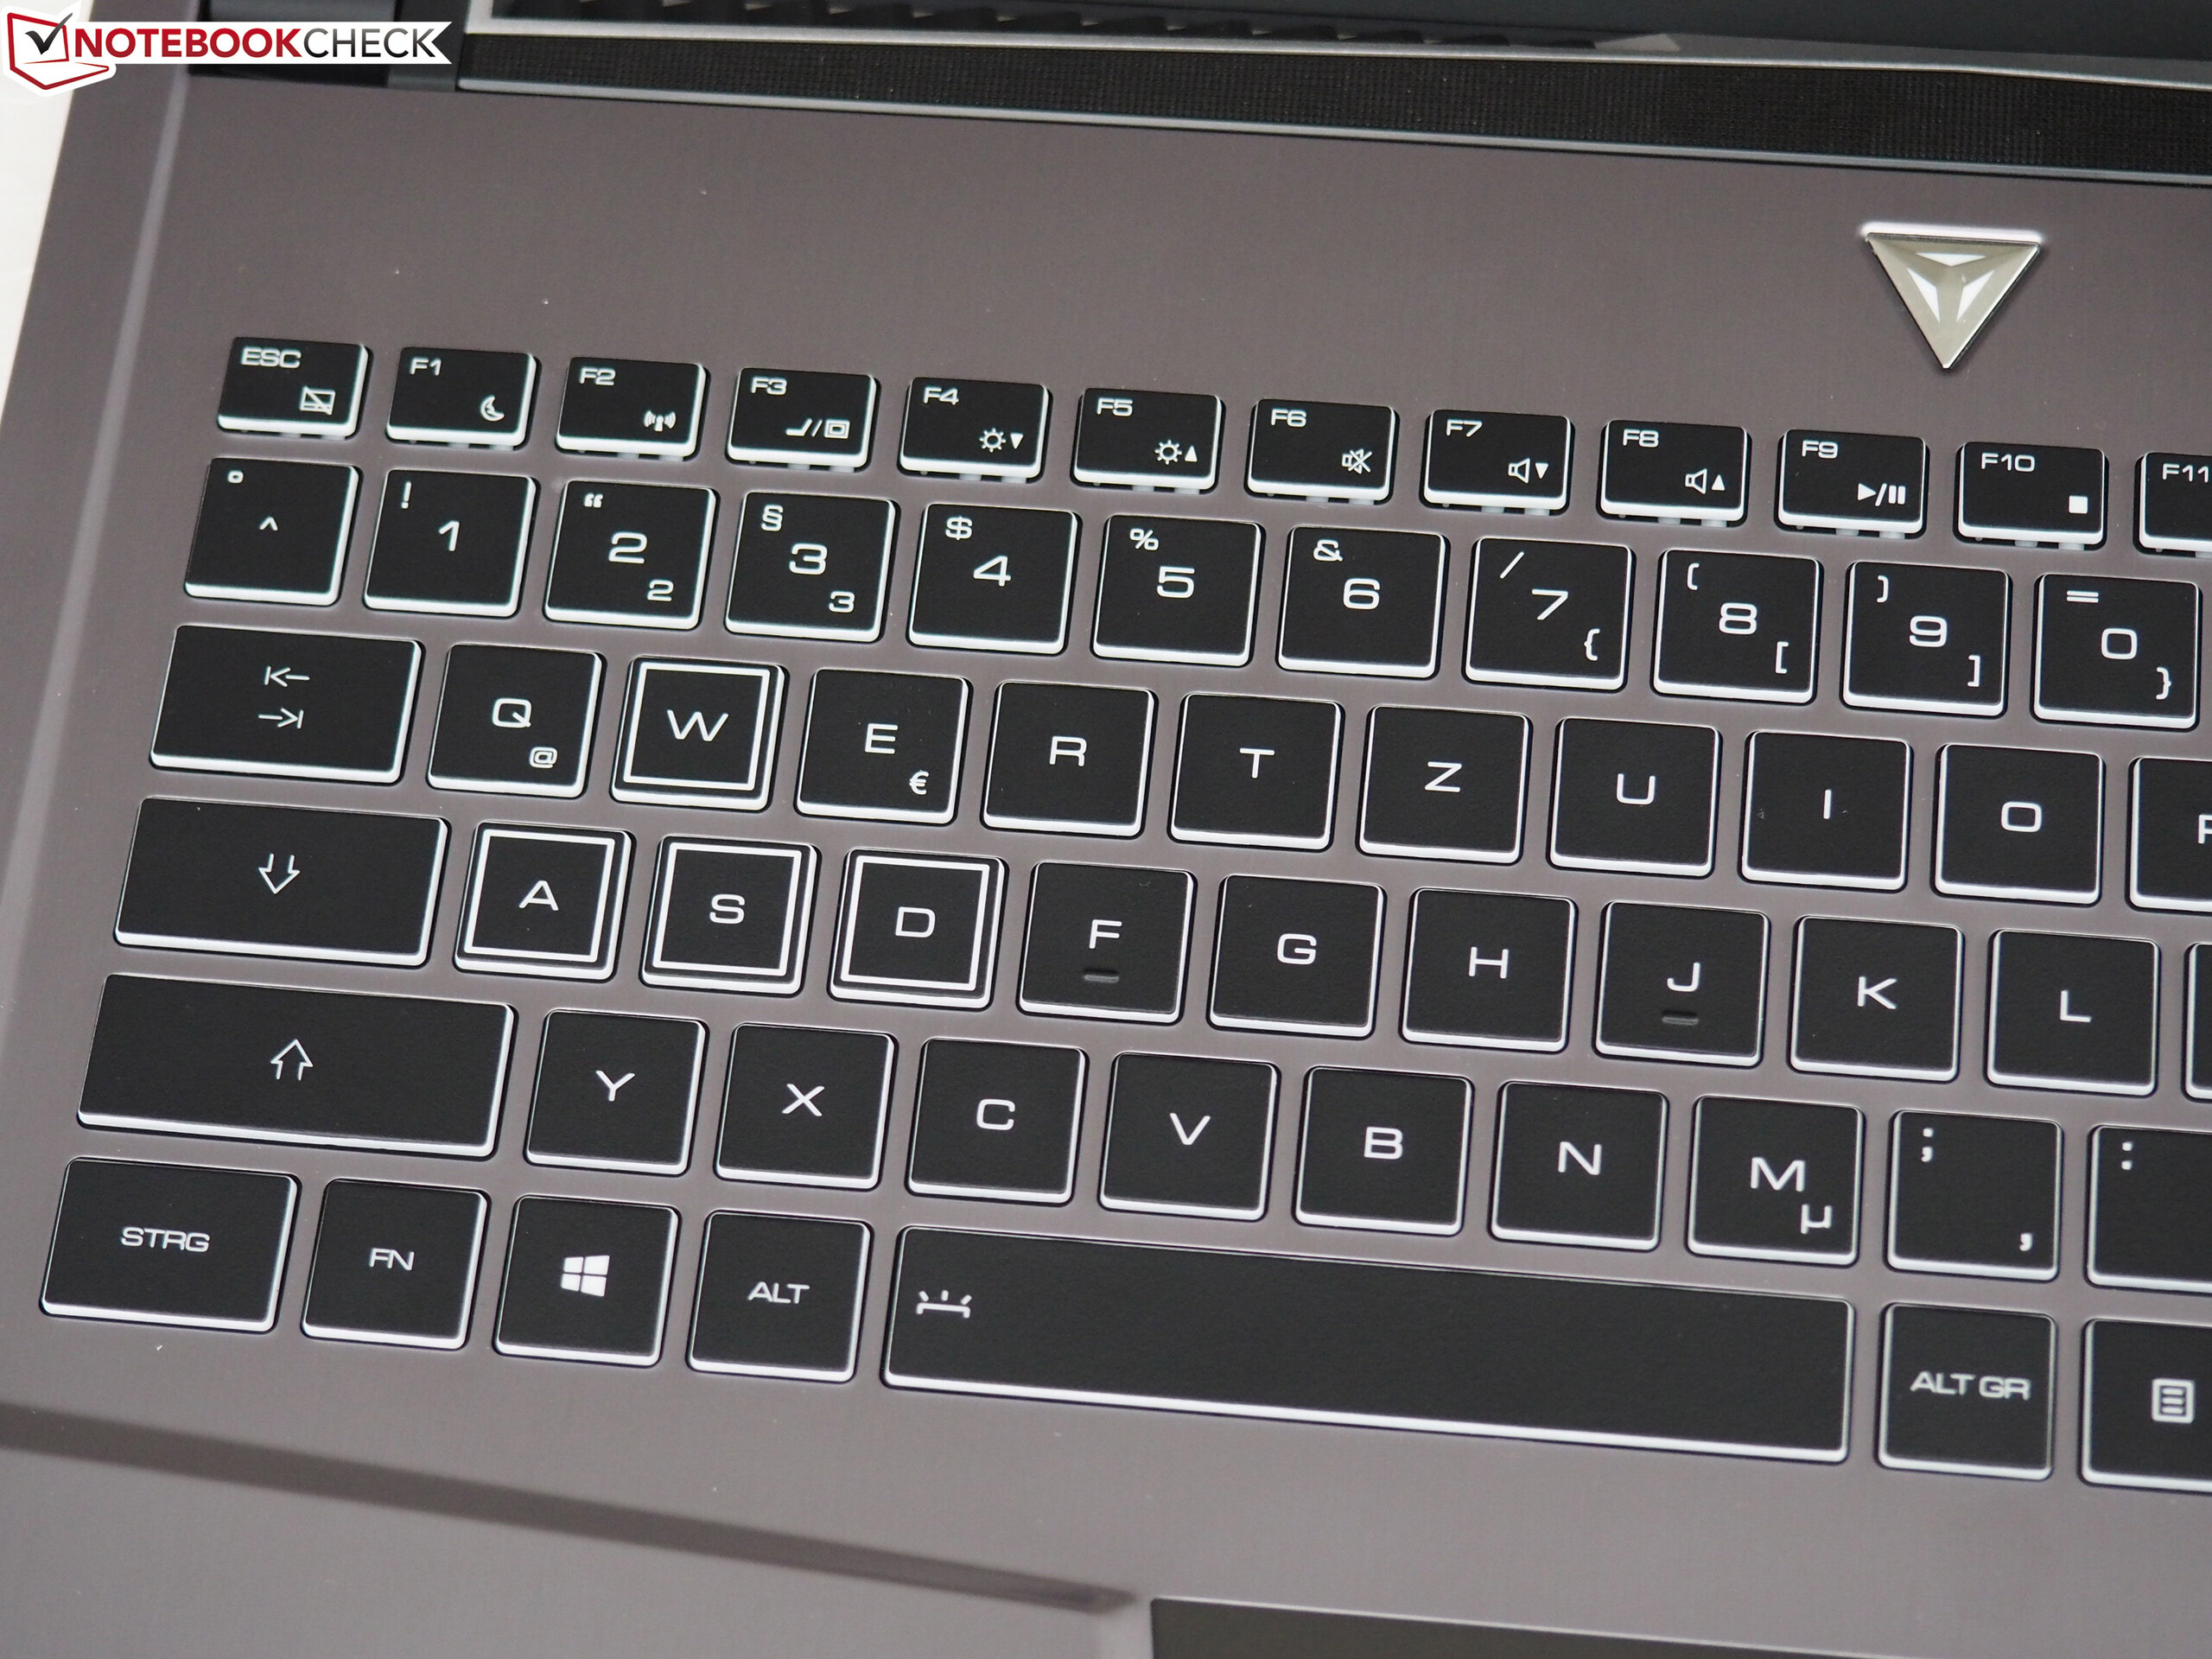
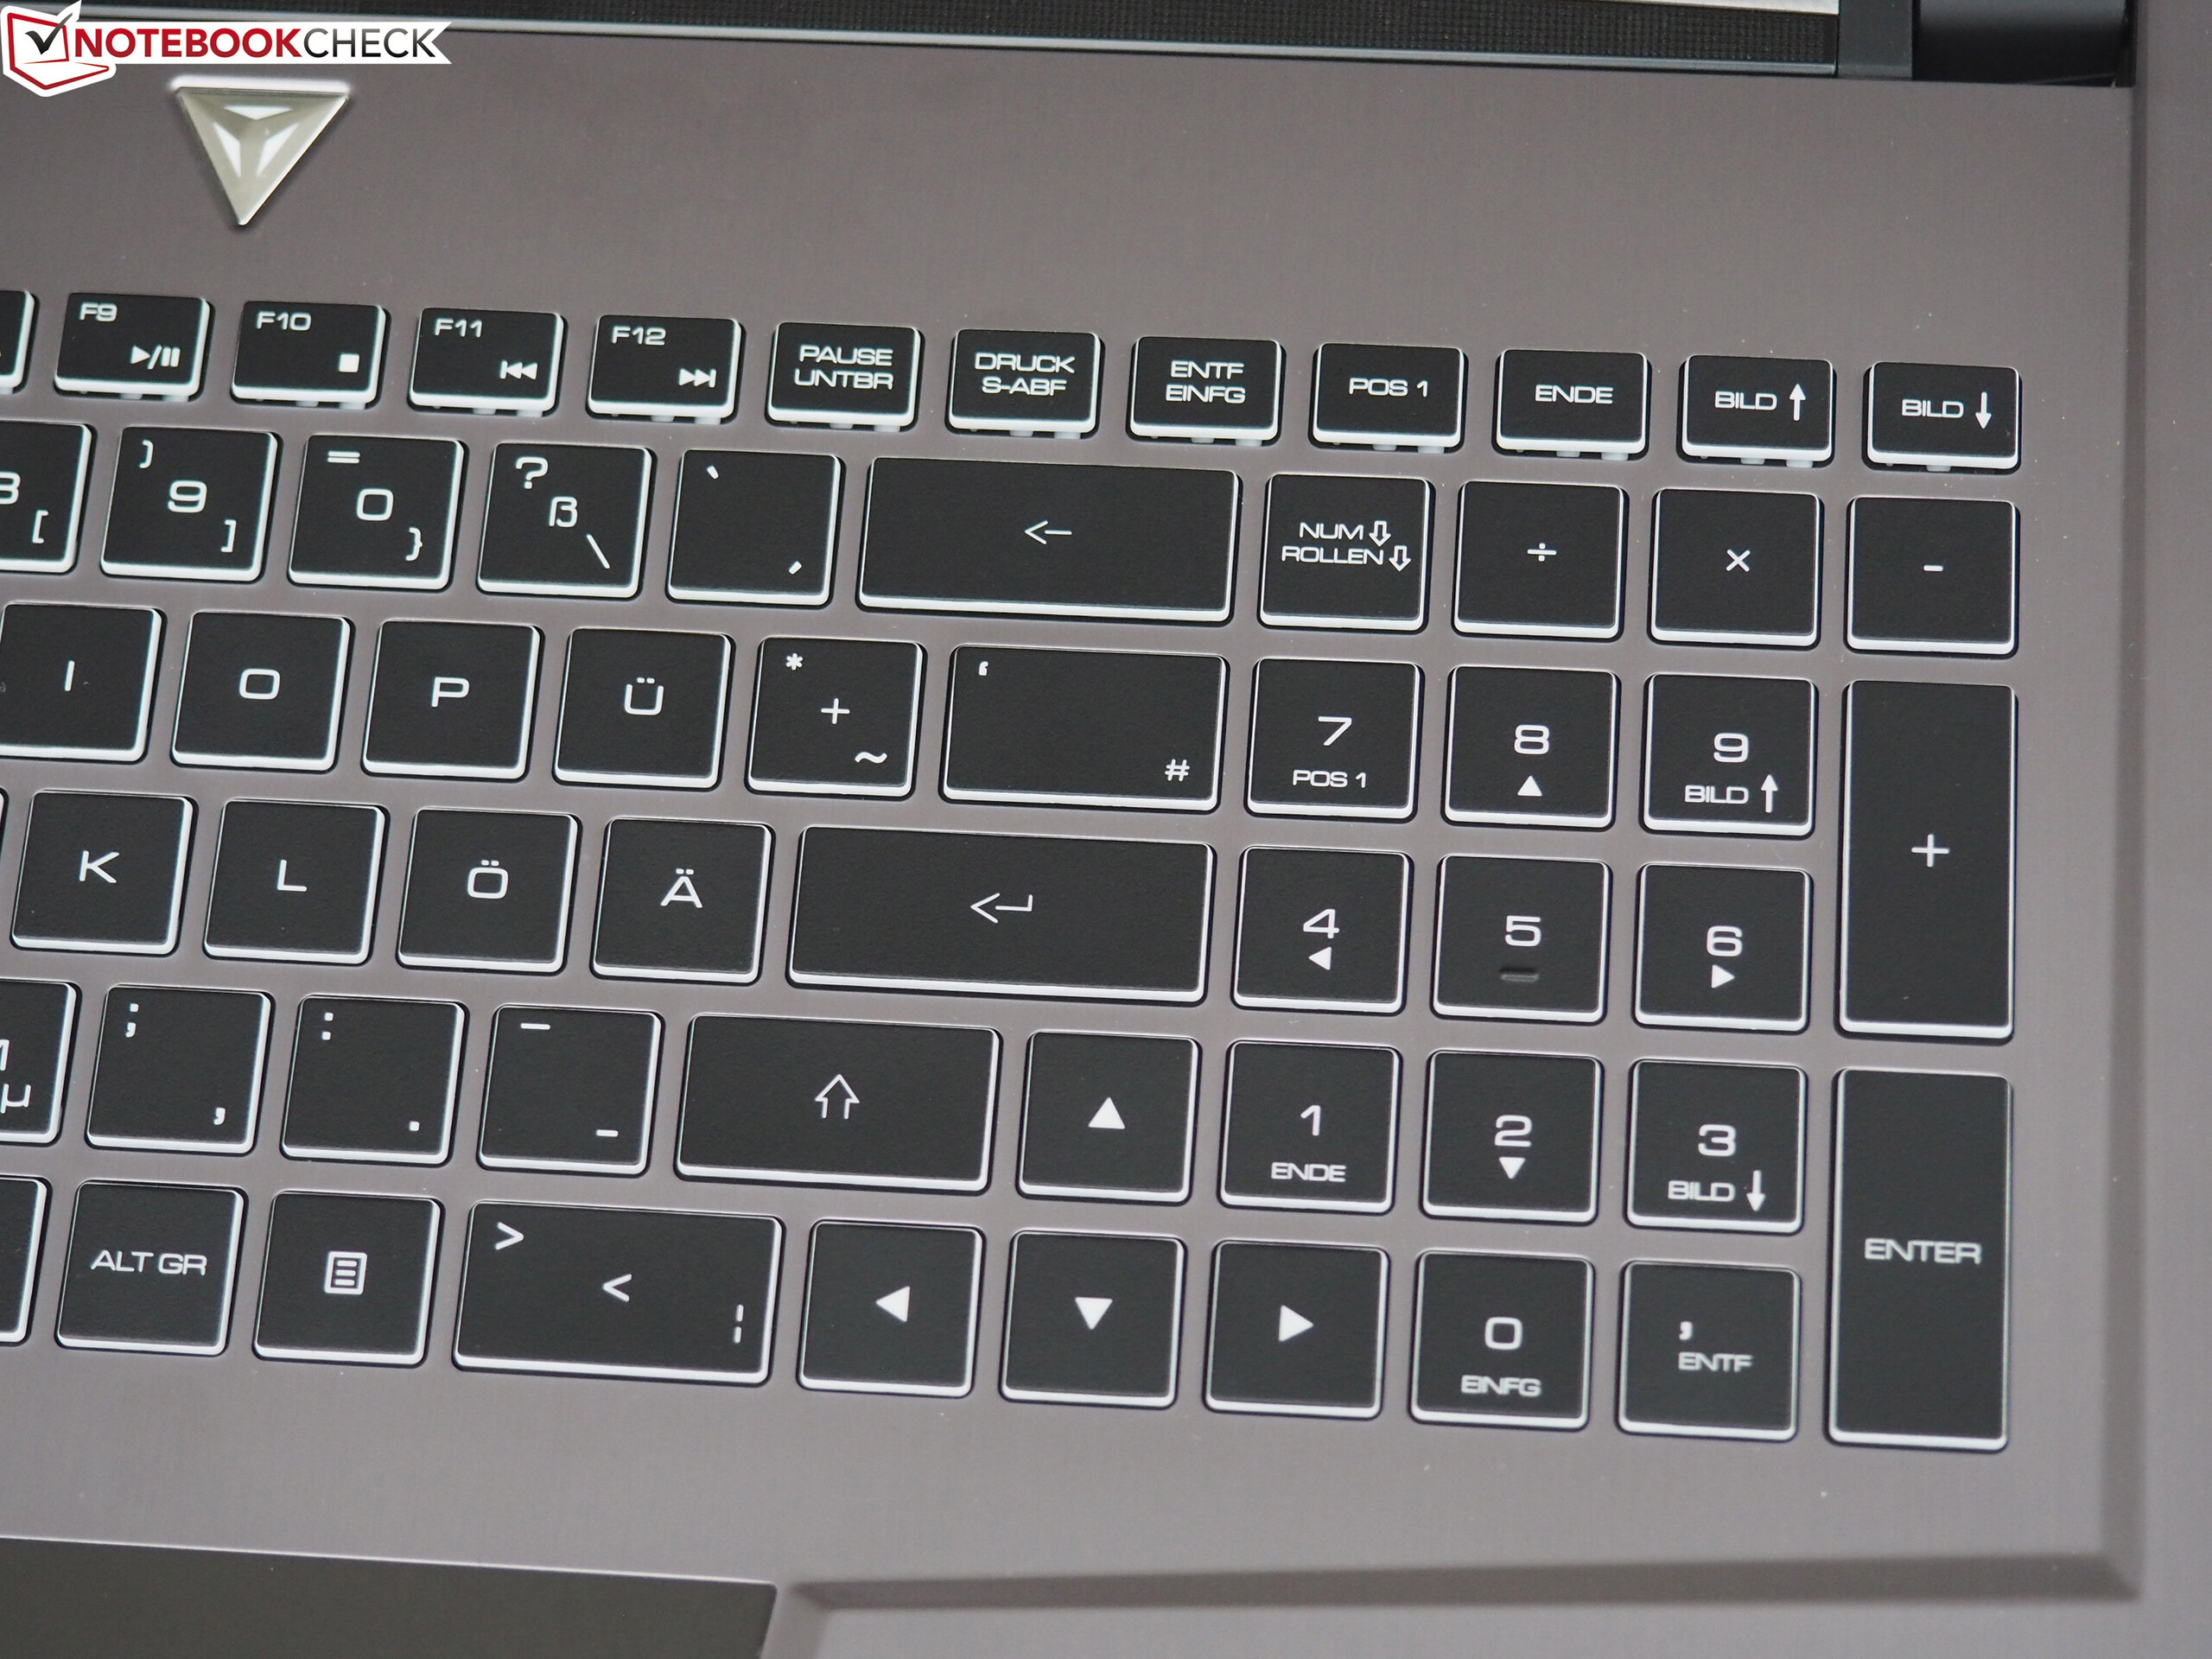
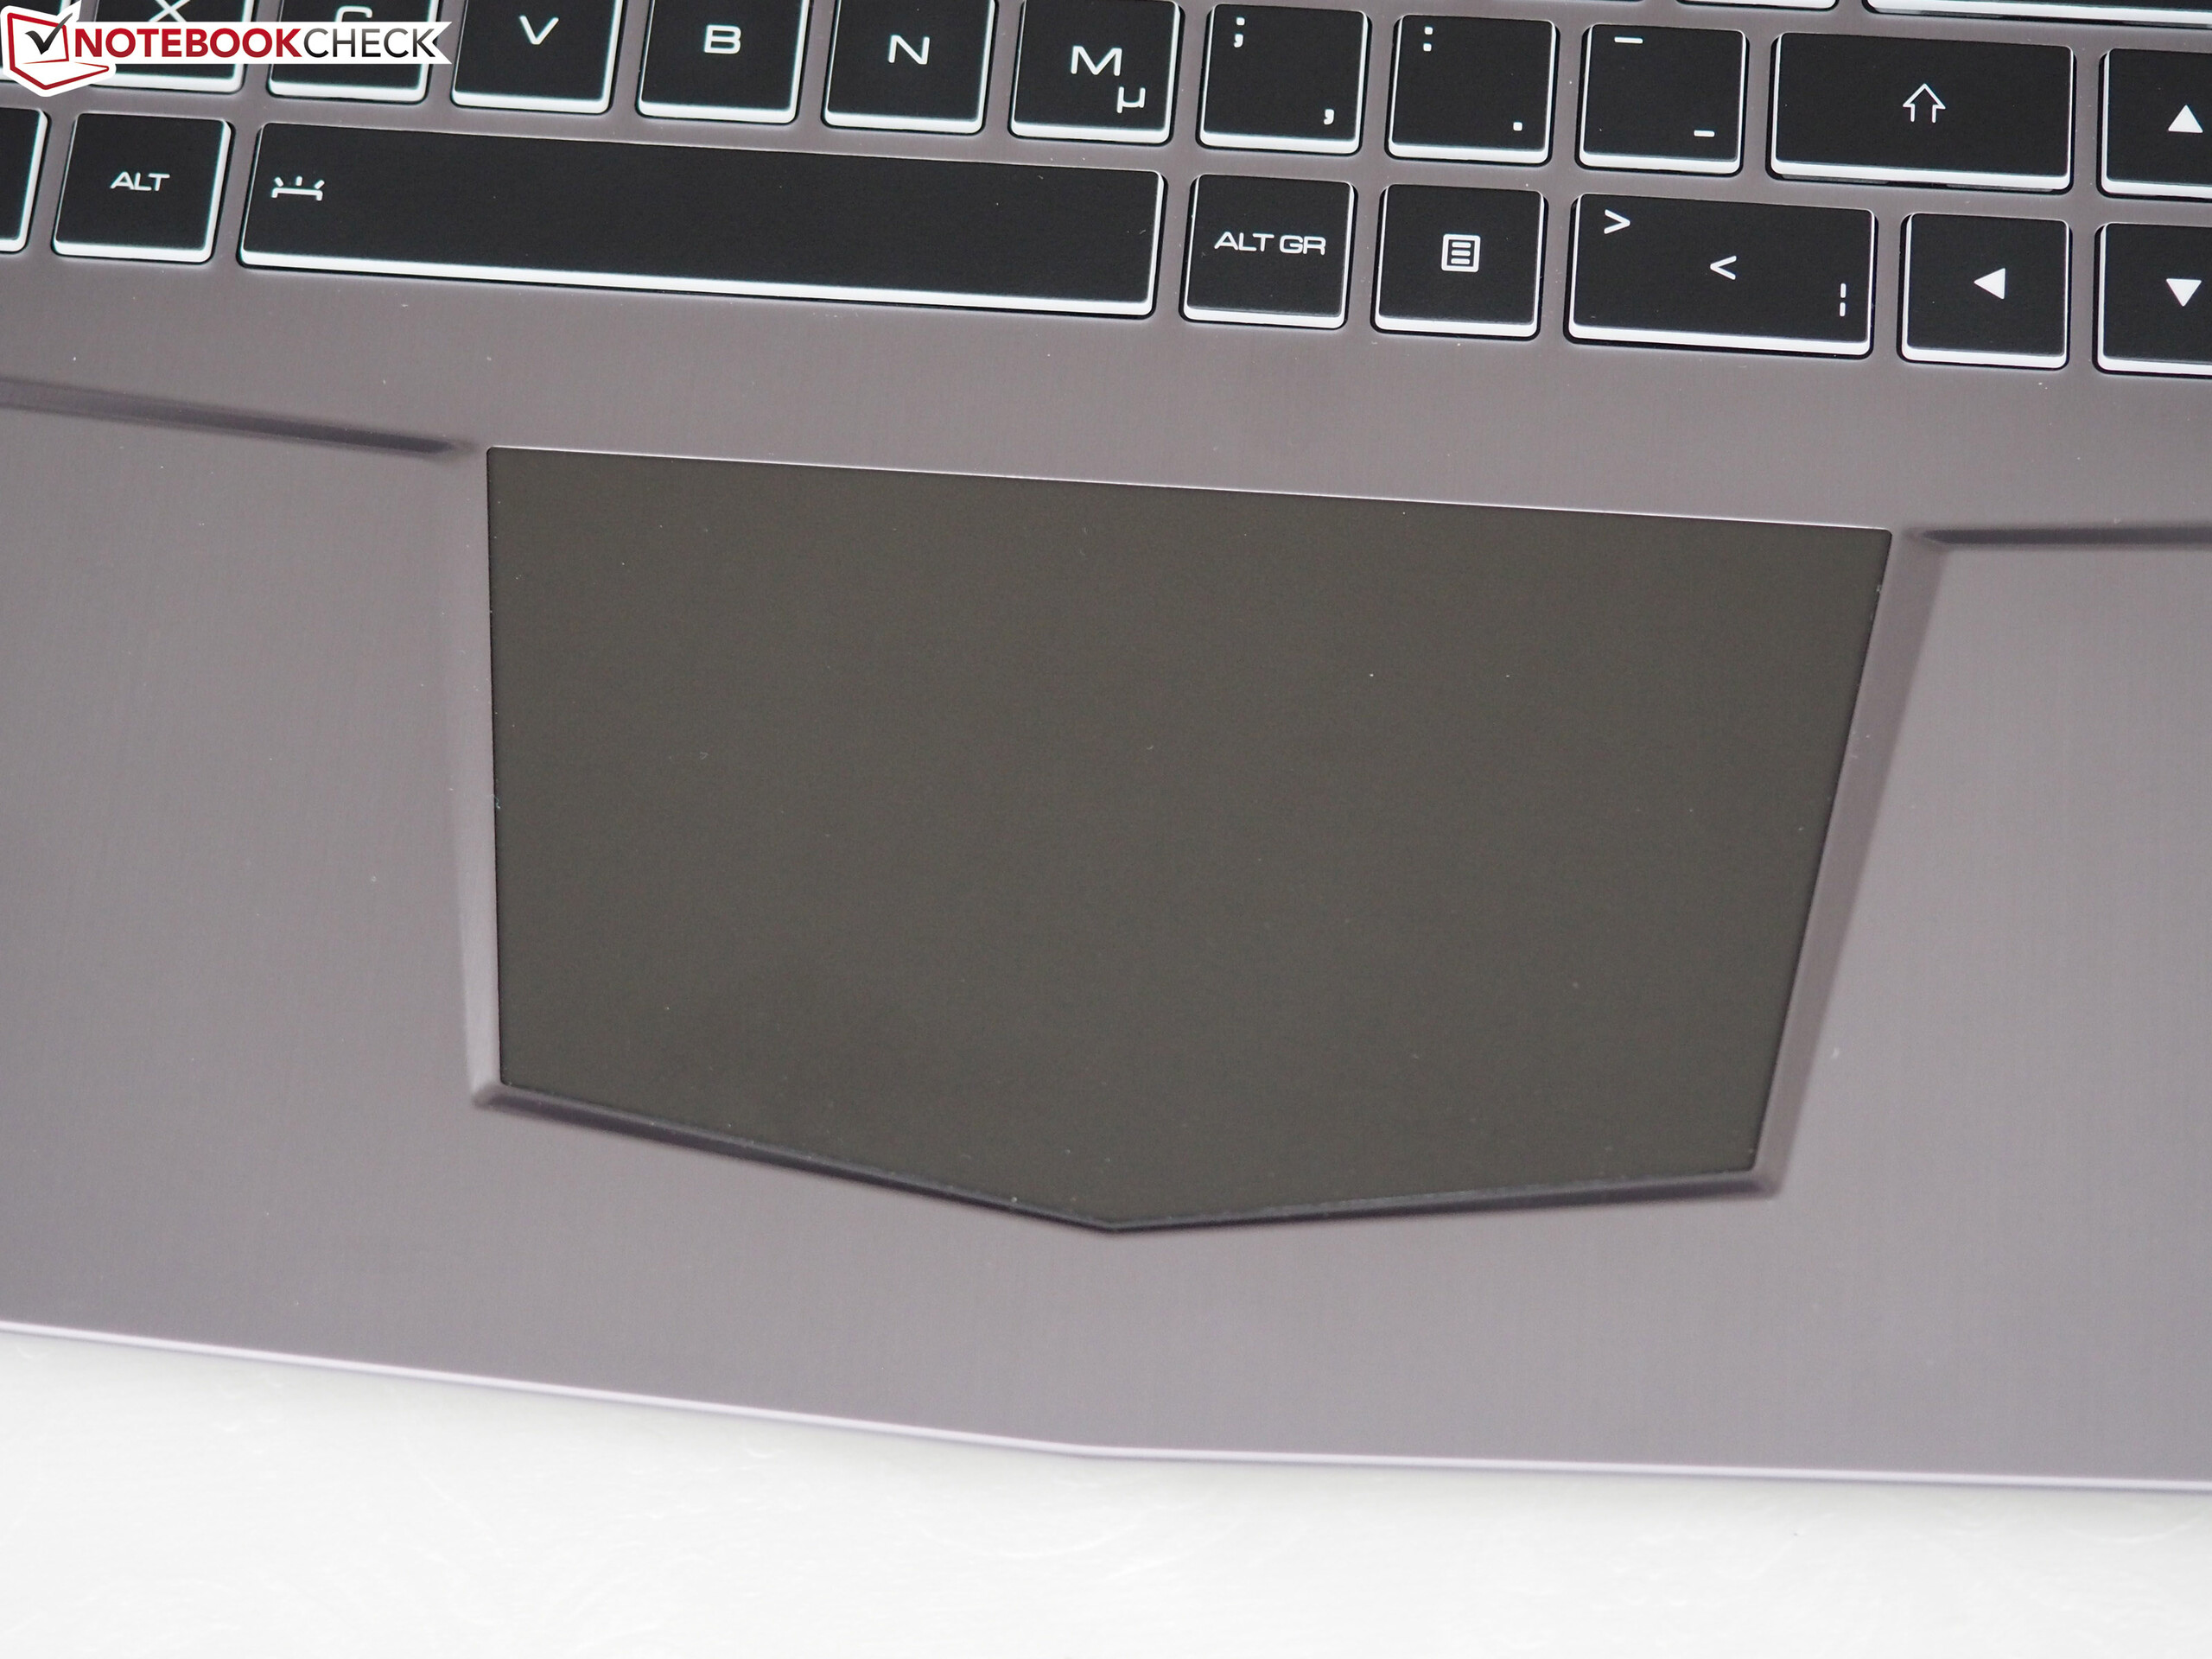
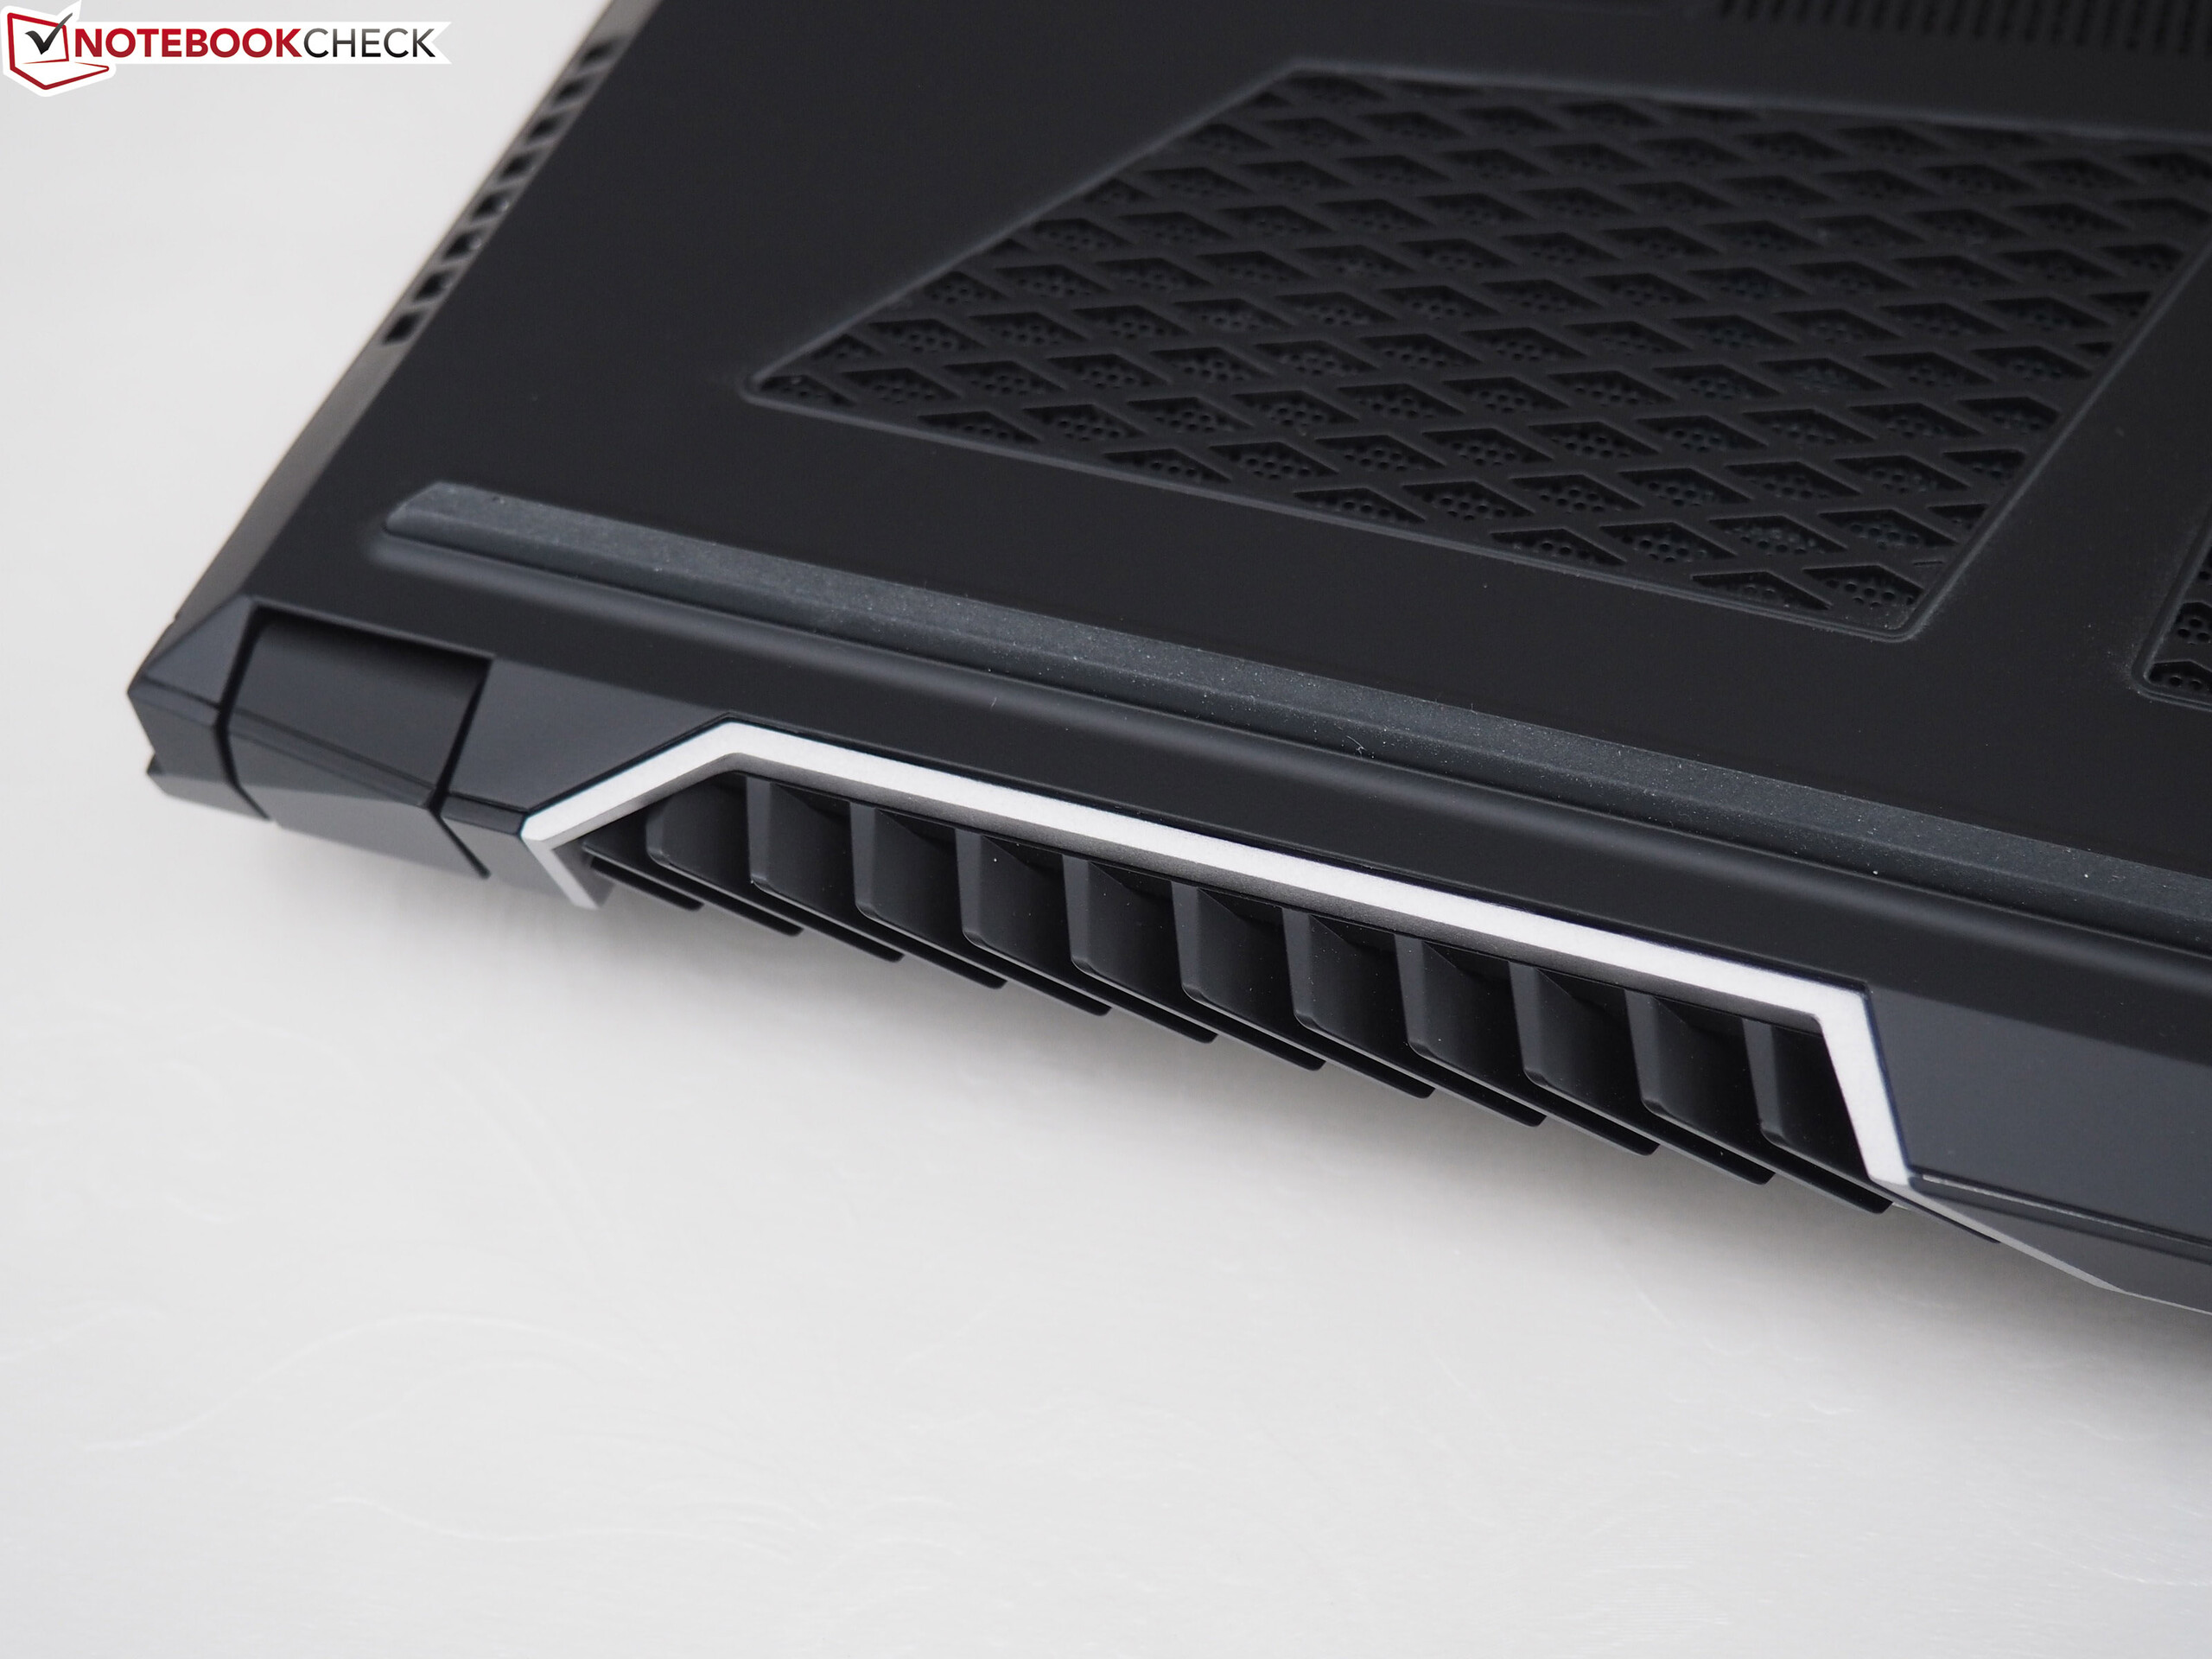
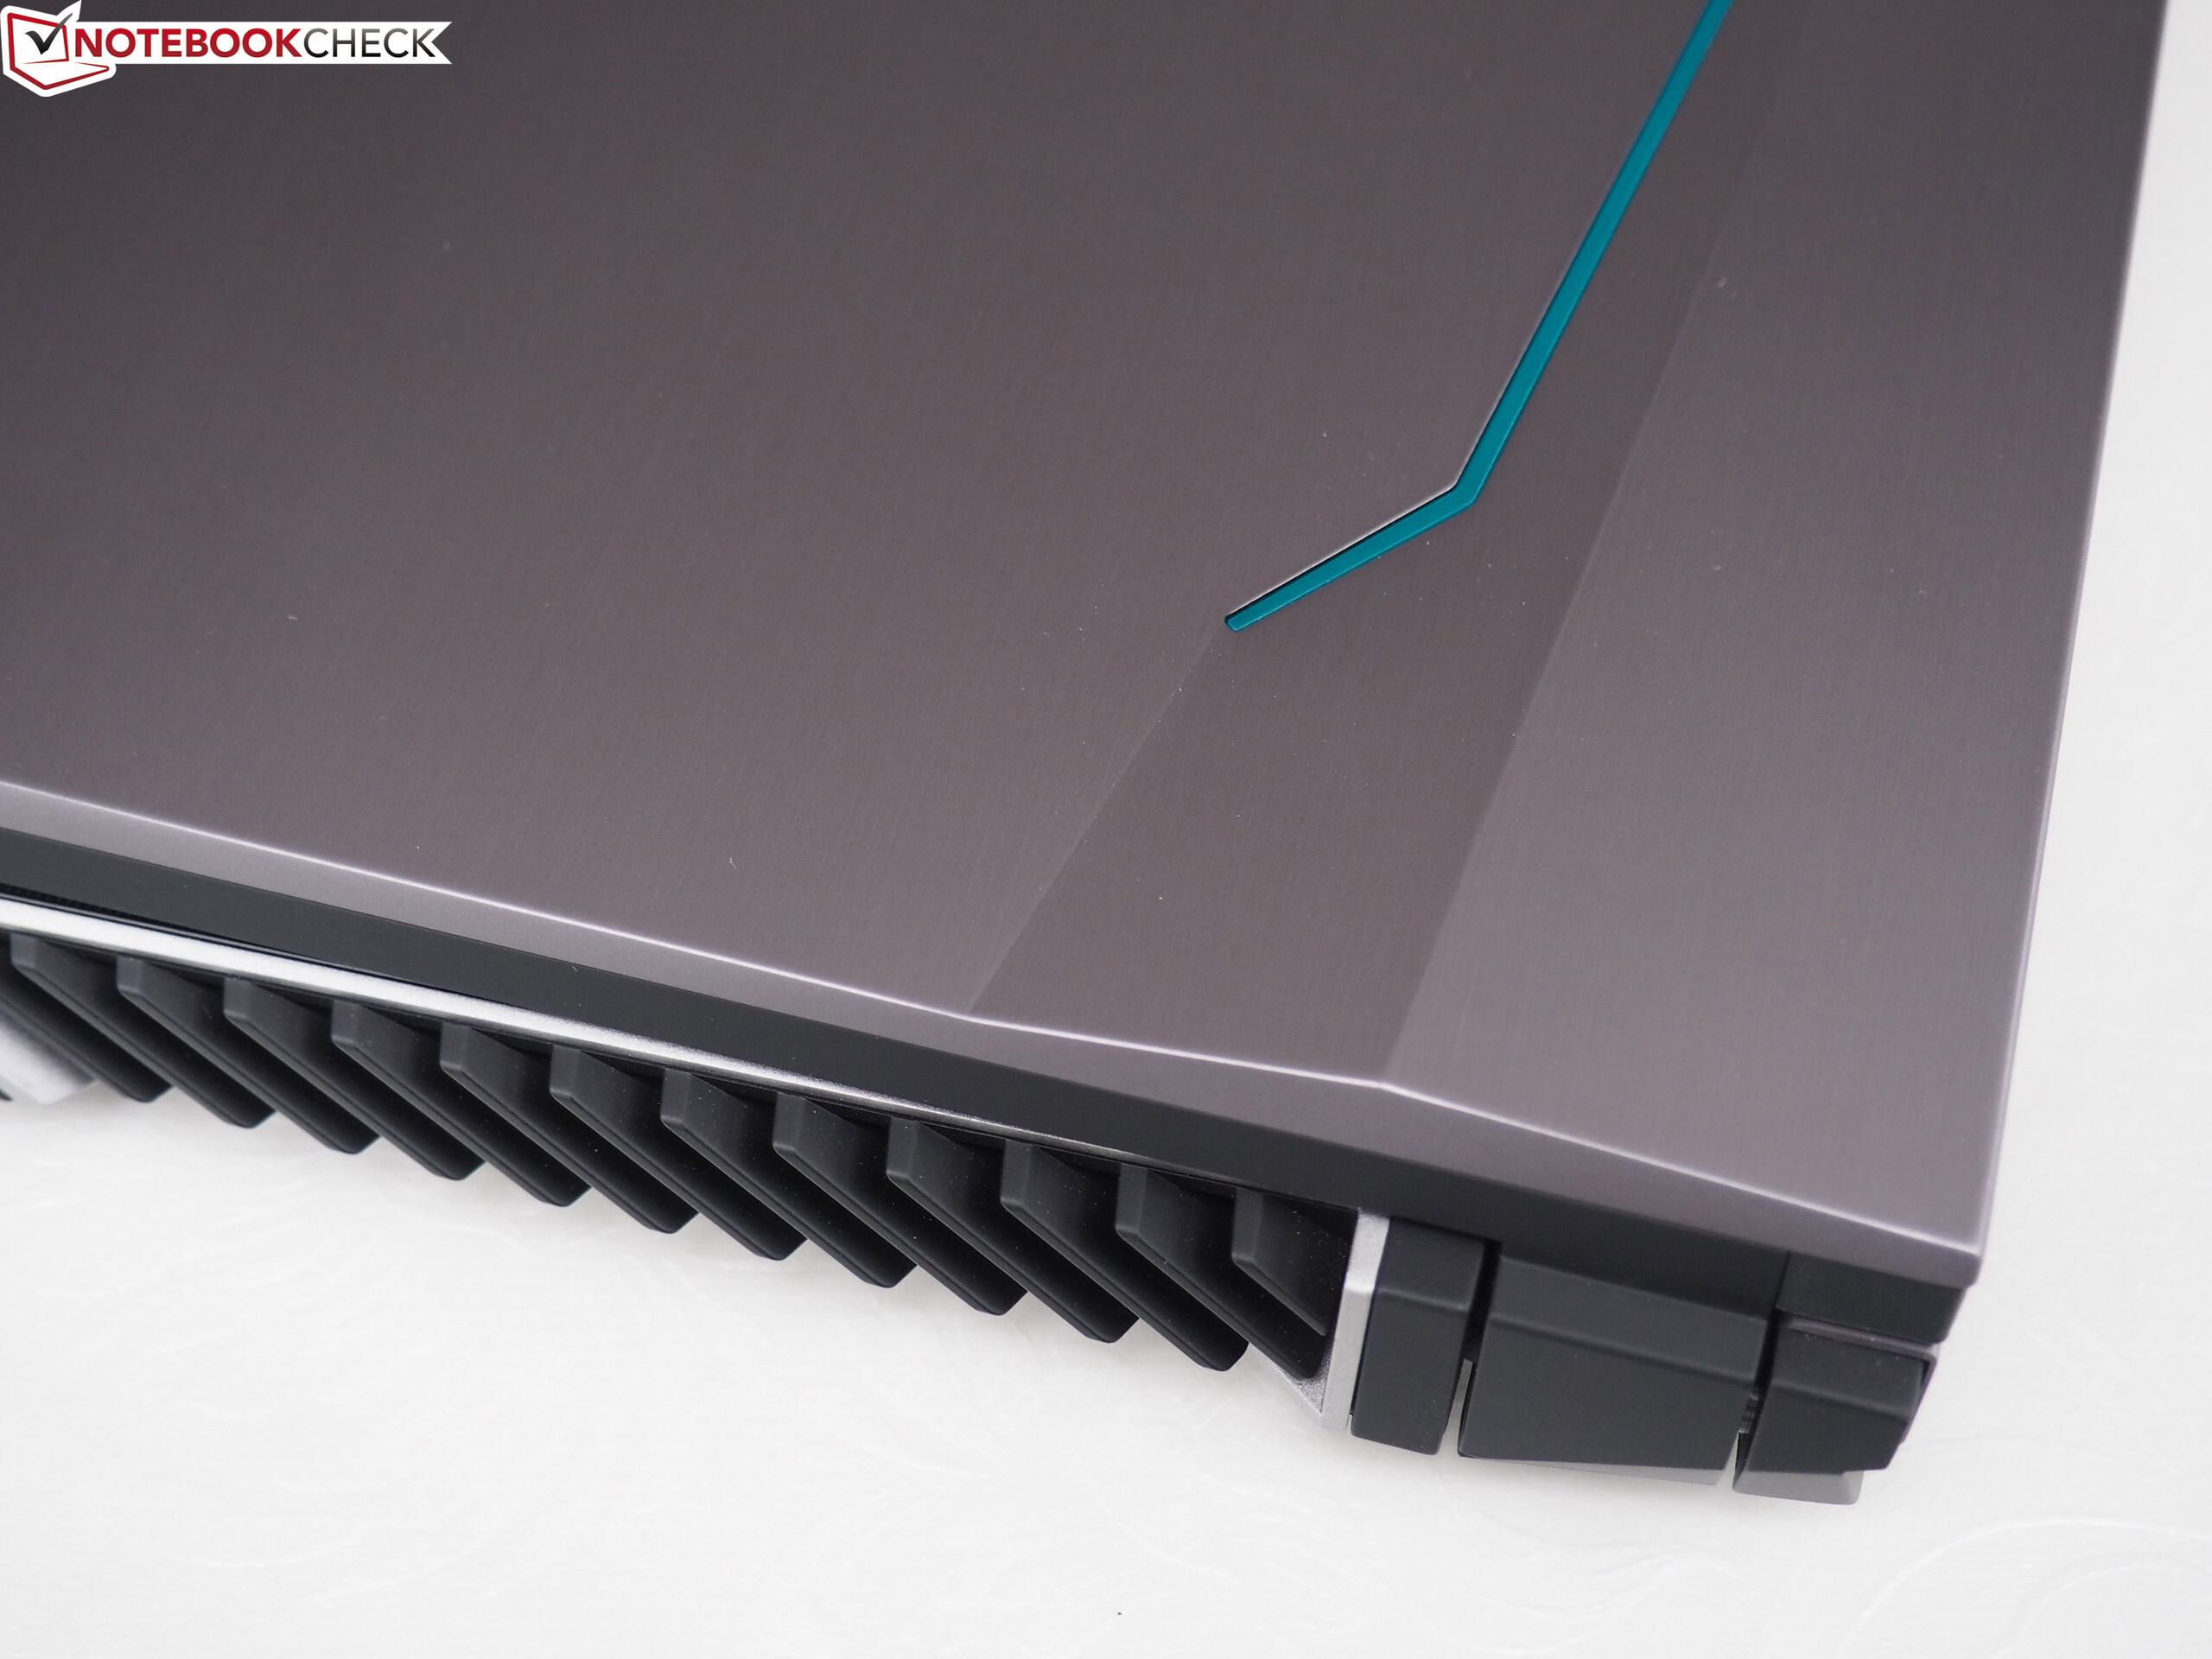
Se a duração da bateria não é importante e nem os alto-falantes internos para ouvir música, assistir filmes ou jogar, então o Proteus V da PC Specialist pode ser uma alternativa viável a um preço justo. Além da elegante carcaça feita parcialmente de alumínio, também gostamos dos dispositivos de entrada.
Seu desempenho geral é mais do que decente. Equipado com 16 GB de RAM DDR4 e um SSD, o Proteus V pode facilmente acompanhar o nível da Acer, Asus ou MSI. Os jogos modernos funcionam sem problemas na resolução FHD nativa do dispositivo de 1920x1080 graças ao processador Core i7-7700HQ e placa de vídeo GTX 1060.
Infelizmente, a tela FHD mostrou-se bastante pobre. Apesar de sua alta relação de contraste e baixo nível de preto, ela simplesmente não é suficientemente brilhante para deixar uma impressão positiva duradoura e sofre de cobertura de espaço de cores pobre, para iniciar. Os controles de velocidade do ventilador precisam de uma renovação maciça o mais rápido possível. As baixas temperaturas do dispositivo são um sinal de ventoinhas muito agressivas; As ventoinhas têm o potencial de irritar os usuários do portátil com bastante rapidez. Esperemos que a PC Specialist melhore isso com uma futura atualização do BIOS.
Assim, no momento da redação, preferimos recomendar o um pouco mais quente e significativamente mais silencioso Schenker XMG Core 15 apesar de sua falta de brilhantes superfícies metálicas. Outros concorrentes de 15 polegadas podem ser encontrados em nossa Lista dos Top 10 (portáteis) https://www.notebookcheck.net/Notebookcheck-s-Top-10-Gaming-Laptops.98628.0.html e a pagina de benchmarks da GTX 1060.
PC Zentrum Proteus V
- 12/16/2017 v6 (old)
Florian Glaser
Price comparison