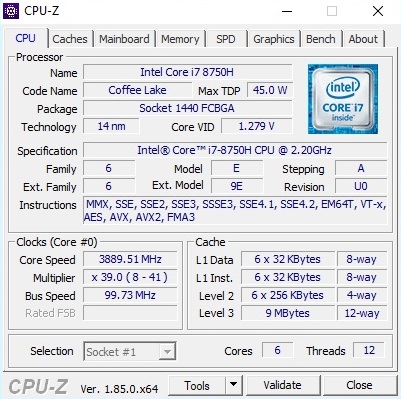
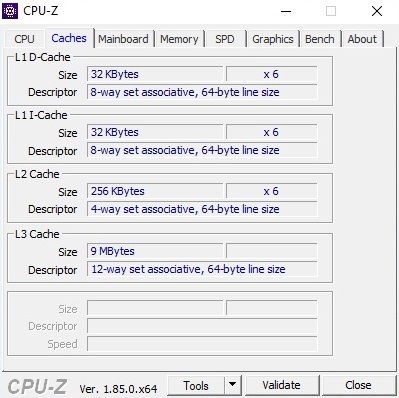
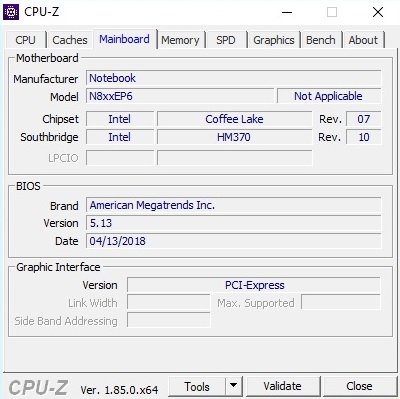
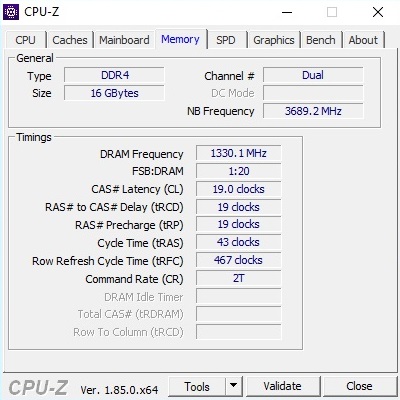
Breve Análise do Portátil Schenker XMG A517 (Clevo N850EP6)
| SD Card Reader | |
| average JPG Copy Test (av. of 3 runs) | |
| Eurocom Q6 (Toshiba Exceria Pro SDXC 64 GB UHS-II) | |
| Média da turma Gaming (20.9 - 210, n=54, últimos 2 anos) | |
| Schenker XMG A517 (Toshiba Exceria Pro SDXC 64 GB UHS-II) | |
| Schenker XMG A517 Coffee Lake (Toshiba Exceria Pro SDXC 64 GB UHS-II) | |
| MSI GP63 Leopard 8RE-013US (Toshiba Exceria Pro SDXC 64 GB UHS-II) | |
| maximum AS SSD Seq Read Test (1GB) | |
| Eurocom Q6 (Toshiba Exceria Pro SDXC 64 GB UHS-II) | |
| Média da turma Gaming (25.5 - 261, n=51, últimos 2 anos) | |
| Schenker XMG A517 (Toshiba Exceria Pro SDXC 64 GB UHS-II) | |
| Schenker XMG A517 Coffee Lake (Toshiba Exceria Pro SDXC 64 GB UHS-II) | |
| MSI GP63 Leopard 8RE-013US (Toshiba Exceria Pro SDXC 64 GB UHS-II) | |
| |||||||||||||||||||||||||
iluminação: 81 %
iluminação com acumulador: 298 cd/m²
Contraste: 1104:1 (Preto: 0.27 cd/m²)
ΔE ColorChecker Calman: 2.88 | ∀{0.5-29.43 Ø4.72}
calibrated: 1.25
ΔE Greyscale Calman: 3.44 | ∀{0.09-98 Ø4.97}
93% sRGB (Argyll 1.6.3 3D)
60% AdobeRGB 1998 (Argyll 1.6.3 3D)
64.6% AdobeRGB 1998 (Argyll 3D)
93.7% sRGB (Argyll 3D)
63.5% Display P3 (Argyll 3D)
Gamma: 2.45
CCT: 7042 K
| Schenker XMG A517 Coffee Lake LGD05C0, IPS, 1920x1080 | Schenker XMG A517 LG Philips LP156WF6 (LGD046F), IPS, 1920x1080 | Asus ROG GU501GM-BI7N8 AU Optronics AUO45ED, IPS, 1920x1080 | MSI GP63 Leopard 8RE-013US Chi Mei CMN15F4 (N156HHE-GA1 CMN), TN LED, 120 Hz, 1920x1080 | Eurocom Q6 LG Philips LGD05C0, IPS, 1920x1080 | |
|---|---|---|---|---|---|
| Display | -4% | -3% | 28% | 2% | |
| Display P3 Coverage (%) | 63.5 | 65 2% | 63.4 0% | 91.5 44% | 65.1 3% |
| sRGB Coverage (%) | 93.7 | 85.1 -9% | 87.7 -6% | 100 7% | 94.4 1% |
| AdobeRGB 1998 Coverage (%) | 64.6 | 62.2 -4% | 85.9 33% | 66.2 2% | |
| Response Times | -111% | -111% | -8% | 10% | |
| Response Time Grey 50% / Grey 80% * (ms) | 16.8 ? | 36 ? -114% | 30.8 ? -83% | 24 ? -43% | 15.2 ? 10% |
| Response Time Black / White * (ms) | 11.6 ? | 24 ? -107% | 27.6 ? -138% | 8.4 ? 28% | 10.4 ? 10% |
| PWM Frequency (Hz) | 21000 ? | 26040 ? | |||
| Screen | -20% | -11% | -58% | 0% | |
| Brightness middle (cd/m²) | 298 | 320 7% | 286.7 -4% | 368.5 24% | 326.6 10% |
| Brightness (cd/m²) | 281 | 311 11% | 281 0% | 341 21% | 312 11% |
| Brightness Distribution (%) | 81 | 90 11% | 92 14% | 87 7% | 88 9% |
| Black Level * (cd/m²) | 0.27 | 0.36 -33% | 0.39 -44% | 0.34 -26% | 0.42 -56% |
| Contrast (:1) | 1104 | 889 -19% | 735 -33% | 1084 -2% | 778 -30% |
| Colorchecker dE 2000 * | 2.88 | 5.08 -76% | 4.17 -45% | 8.91 -209% | 2.54 12% |
| Colorchecker dE 2000 max. * | 6.48 | 10.73 -66% | 7.22 -11% | 14.39 -122% | 4.7 27% |
| Colorchecker dE 2000 calibrated * | 1.25 | 2.87 -130% | 1.63 -30% | ||
| Greyscale dE 2000 * | 3.44 | 4.04 -17% | 2.5 27% | 12 -249% | 1.9 45% |
| Gamma | 2.45 90% | 2.34 94% | 2.274 97% | 1.825 121% | 2.14 103% |
| CCT | 7042 92% | 7029 92% | 6885 94% | 11519 56% | 6562 99% |
| Color Space (Percent of AdobeRGB 1998) (%) | 60 | 56 -7% | 57 -5% | 85.94 43% | 60.9 1% |
| Color Space (Percent of sRGB) (%) | 93 | 85 -9% | 87 -6% | 99.98 8% | 94.5 2% |
| Média Total (Programa/Configurações) | -45% /
-29% | -42% /
-24% | -13% /
-35% | 4% /
2% |
* ... menor é melhor
Exibir tempos de resposta
| ↔ Tempo de resposta preto para branco | ||
|---|---|---|
| 11.6 ms ... ascensão ↗ e queda ↘ combinadas | ↗ 6.8 ms ascensão | 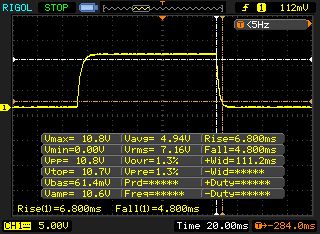 |
| ↘ 4.8 ms queda | ||
| A tela mostra boas taxas de resposta em nossos testes, mas pode ser muito lenta para jogadores competitivos. Em comparação, todos os dispositivos testados variam de 0.1 (mínimo) a 240 (máximo) ms. » 31 % de todos os dispositivos são melhores. Isso significa que o tempo de resposta medido é melhor que a média de todos os dispositivos testados (19.8 ms). | ||
| ↔ Tempo de resposta 50% cinza a 80% cinza | ||
| 16.8 ms ... ascensão ↗ e queda ↘ combinadas | ↗ 8.4 ms ascensão | 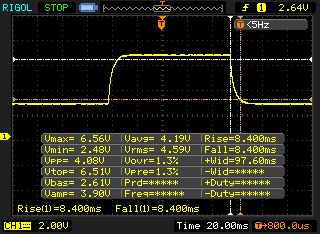 |
| ↘ 8.4 ms queda | ||
| A tela mostra boas taxas de resposta em nossos testes, mas pode ser muito lenta para jogadores competitivos. Em comparação, todos os dispositivos testados variam de 0.165 (mínimo) a 636 (máximo) ms. » 31 % de todos os dispositivos são melhores. Isso significa que o tempo de resposta medido é melhor que a média de todos os dispositivos testados (31 ms). | ||
Cintilação da tela / PWM (modulação por largura de pulso)
| Tela tremeluzindo / PWM não detectado | 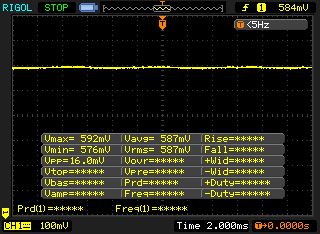 | ||
[pwm_comparison] Em comparação: 52 % de todos os dispositivos testados não usam PWM para escurecer a tela. Se PWM foi detectado, uma média de 7763 (mínimo: 5 - máximo: 343500) Hz foi medida. | |||
| PCMark 10 - Score | |
| Média da turma Gaming (5828 - 11574, n=95, últimos 2 anos) | |
| Eurocom Q6 | |
| Asus ROG GU501GM-BI7N8 | |
| Schenker XMG A517 Coffee Lake | |
| Schenker XMG A517 | |
| PCMark 8 Home Score Accelerated v2 | 4523 pontos | |
| PCMark 8 Work Score Accelerated v2 | 5697 pontos | |
| PCMark 10 Score | 5019 pontos | |
Ajuda | ||
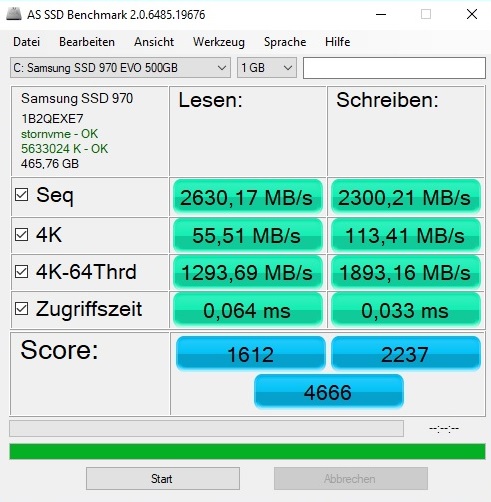
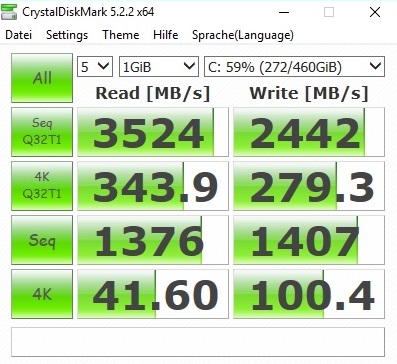
| Schenker XMG A517 Coffee Lake Samsung SSD 970 EVO 500GB | Schenker XMG A517 Samsung SSD 960 Evo 500GB m.2 NVMe | Asus ROG GU501GM-BI7N8 Kingston RBUSNS8154P3128GJ | MSI GP63 Leopard 8RE-013US Samsung PM871b MZNLN128HAHQ | Eurocom Q6 Samsung SSD 960 Pro 512 GB m.2 | |
|---|---|---|---|---|---|
| AS SSD | -7% | -70% | -74% | -19% | |
| Seq Read (MB/s) | 2630 | 2694 2% | 841 -68% | 504 -81% | 2523 -4% |
| Seq Write (MB/s) | 2300 | 1662 -28% | 404.7 -82% | 462.9 -80% | 1943 -16% |
| 4K Read (MB/s) | 55.5 | 48 -14% | 22.62 -59% | 21.88 -61% | 29.62 -47% |
| 4K Write (MB/s) | 113.4 | 147 30% | 67.1 -41% | 60.8 -46% | 96.2 -15% |
| Score Read (Points) | 1612 | 1677 4% | 377 -77% | 325 -80% | 1477 -8% |
| Score Write (Points) | 2237 | 1575 -30% | 345 -85% | 245 -89% | 1693 -24% |
| Score Total (Points) | 4666 | 4063 -13% | 900 -81% | 742 -84% | 3894 -17% |

| 3DMark - 1920x1080 Fire Strike Graphics | |
| Média da turma Gaming (12242 - 62849, n=118, últimos 2 anos) | |
| Eurocom Q6 | |
| MSI GP63 Leopard 8RE-013US | |
| Schenker XMG A517 Coffee Lake | |
| Asus ROG GU501GM-BI7N8 | |
| Schenker XMG A517 | |
| 3DMark 11 Performance | 13684 pontos | |
| 3DMark Cloud Gate Standard Score | 33942 pontos | |
| 3DMark Fire Strike Score | 10451 pontos | |
Ajuda | ||
| The Witcher 3 - 1920x1080 Ultra Graphics & Postprocessing (HBAO+) | |
| Média da turma Gaming (95 - 240, n=7, últimos 2 anos) | |
| Eurocom Q6 | |
| MSI GP63 Leopard 8RE-013US | |
| Schenker XMG A517 | |
| Asus ROG GU501GM-BI7N8 | |
| Schenker XMG A517 Coffee Lake | |
| Schenker XMG A517 Coffee Lake | |
| baixo | média | alto | ultra | |
|---|---|---|---|---|
| The Witcher 3 (2015) | 70 | 37.8 | ||
| FIFA 18 (2017) | 250 | 247 | ||
| Wolfenstein II: The New Colossus (2017) | 83.4 | 76.3 | ||
| Call of Duty WWII (2017) | 96.3 | 70.5 | ||
| Need for Speed Payback (2017) | 84.8 | 77 | ||
| Star Wars Battlefront 2 (2017) | 74.3 | 62 | ||
| Fortnite (2018) | 114 | 81.2 | ||
| Far Cry 5 (2018) | 69 | 65 |
Barulho
| Ocioso |
| 30 / 31 / 42 dB |
| Carga |
| 45 / 51 dB |
 | ||
30 dB silencioso 40 dB(A) audível 50 dB(A) ruidosamente alto |
||
min: | ||
| Schenker XMG A517 Coffee Lake i7-8750H, GeForce GTX 1060 Mobile | Schenker XMG A517 i7-7700HQ, GeForce GTX 1060 Mobile | Asus ROG GU501GM-BI7N8 i7-8750H, GeForce GTX 1060 Mobile | MSI GP63 Leopard 8RE-013US i7-8750H, GeForce GTX 1060 Mobile | Eurocom Q6 i7-8750H, GeForce GTX 1070 Max-Q | Média da turma Gaming | |
|---|---|---|---|---|---|---|
| Noise | 1% | 2% | 3% | 6% | 12% | |
| desligado / ambiente * (dB) | 30 | 30 -0% | 28.6 5% | 28.4 5% | 28.3 6% | 24.1 ? 20% |
| Idle Minimum * (dB) | 30 | 30 -0% | 31.4 -5% | 32.8 -9% | 30.4 -1% | 25.9 ? 14% |
| Idle Average * (dB) | 31 | 35 -13% | 31.4 -1% | 32.8 -6% | 30.5 2% | 27.4 ? 12% |
| Idle Maximum * (dB) | 42 | 40 5% | 34.2 19% | 33 21% | 33.3 21% | 30 ? 29% |
| Load Average * (dB) | 45 | 43 4% | 42.8 5% | 35.8 20% | 42.3 6% | 42.9 ? 5% |
| Witcher 3 ultra * (dB) | 48 | 43 10% | 50.9 -6% | 51 -6% | 43.3 10% | |
| Load Maximum * (dB) | 51 | 49 4% | 50.9 -0% | 52.3 -3% | 50.8 -0% | 54.1 ? -6% |
* ... menor é melhor
(-) A temperatura máxima no lado superior é 47 °C / 117 F, em comparação com a média de 40.4 °C / 105 F , variando de 21.2 a 68.8 °C para a classe Gaming.
(-) A parte inferior aquece até um máximo de 47 °C / 117 F, em comparação com a média de 43.2 °C / 110 F
(+) Em uso inativo, a temperatura média para o lado superior é 28 °C / 82 F, em comparação com a média do dispositivo de 33.9 °C / ### class_avg_f### F.
(-) Jogando The Witcher 3, a temperatura média para o lado superior é 42.7 °C / 109 F, em comparação com a média do dispositivo de 33.9 °C / ## #class_avg_f### F.
(-) Os apoios para as mãos e o touchpad podem ficar muito quentes ao toque, com um máximo de 44 °C / 111.2 F.
(-) A temperatura média da área do apoio para as mãos de dispositivos semelhantes foi 28.8 °C / 83.8 F (-15.2 °C / -27.4 F).
| Schenker XMG A517 Coffee Lake i7-8750H, GeForce GTX 1060 Mobile | Schenker XMG A517 i7-7700HQ, GeForce GTX 1060 Mobile | Asus ROG GU501GM-BI7N8 i7-8750H, GeForce GTX 1060 Mobile | MSI GP63 Leopard 8RE-013US i7-8750H, GeForce GTX 1060 Mobile | Eurocom Q6 i7-8750H, GeForce GTX 1070 Max-Q | Média da turma Gaming | |
|---|---|---|---|---|---|---|
| Heat | -2% | 5% | 5% | -5% | 1% | |
| Maximum Upper Side * (°C) | 47 | 53 -13% | 43 9% | 42.2 10% | 49 -4% | 45.2 ? 4% |
| Maximum Bottom * (°C) | 47 | 49 -4% | 46.6 1% | 47.8 -2% | 53 -13% | 48.2 ? -3% |
| Idle Upper Side * (°C) | 32 | 33 -3% | 29.2 9% | 29.6 7% | 32.4 -1% | 31 ? 3% |
| Idle Bottom * (°C) | 34 | 30 12% | 34 -0% | 32.6 4% | 34 -0% | 34.4 ? -1% |
* ... menor é melhor
Schenker XMG A517 Coffee Lake análise de áudio
(±) | o volume do alto-falante é médio, mas bom (###valor### dB)
Graves 100 - 315Hz
(-) | quase nenhum baixo - em média 24.1% menor que a mediana
(±) | a linearidade dos graves é média (9.7% delta para a frequência anterior)
Médios 400 - 2.000 Hz
(±) | médios mais altos - em média 8.1% maior que a mediana
(±) | a linearidade dos médios é média (13.4% delta para frequência anterior)
Altos 2 - 16 kHz
(+) | agudos equilibrados - apenas 4.3% longe da mediana
(±) | a linearidade dos máximos é média (11.6% delta para frequência anterior)
Geral 100 - 16.000 Hz
(±) | a linearidade do som geral é média (28.7% diferença em relação à mediana)
Comparado com a mesma classe
» 94% de todos os dispositivos testados nesta classe foram melhores, 1% semelhantes, 4% piores
» O melhor teve um delta de 6%, a média foi 18%, o pior foi 132%
Comparado com todos os dispositivos testados
» 86% de todos os dispositivos testados foram melhores, 3% semelhantes, 11% piores
» O melhor teve um delta de 4%, a média foi 23%, o pior foi 134%
Asus ROG GU501GM-BI7N8 análise de áudio
(±) | o volume do alto-falante é médio, mas bom (###valor### dB)
Graves 100 - 315Hz
(+) | bons graves - apenas 3.8% longe da mediana
(±) | a linearidade dos graves é média (10.3% delta para a frequência anterior)
Médios 400 - 2.000 Hz
(+) | médios equilibrados - apenas 2.3% longe da mediana
(+) | médios são lineares (5.1% delta para frequência anterior)
Altos 2 - 16 kHz
(+) | agudos equilibrados - apenas 4.6% longe da mediana
(+) | os máximos são lineares (6.8% delta da frequência anterior)
Geral 100 - 16.000 Hz
(+) | o som geral é linear (12.6% diferença em relação à mediana)
Comparado com a mesma classe
» 15% de todos os dispositivos testados nesta classe foram melhores, 4% semelhantes, 81% piores
» O melhor teve um delta de 6%, a média foi 18%, o pior foi 132%
Comparado com todos os dispositivos testados
» 11% de todos os dispositivos testados foram melhores, 3% semelhantes, 86% piores
» O melhor teve um delta de 4%, a média foi 23%, o pior foi 134%
| desligado | |
| Ocioso | |
| Carga |
|
Key:
min: | |
| Schenker XMG A517 Coffee Lake i7-8750H, GeForce GTX 1060 Mobile | Schenker XMG A517 i7-7700HQ, GeForce GTX 1060 Mobile | Asus ROG GU501GM-BI7N8 i7-8750H, GeForce GTX 1060 Mobile | MSI GP63 Leopard 8RE-013US i7-8750H, GeForce GTX 1060 Mobile | Eurocom Q6 i7-8750H, GeForce GTX 1070 Max-Q | Média da turma Gaming | |
|---|---|---|---|---|---|---|
| Power Consumption | 4% | -13% | 3% | -8% | -27% | |
| Idle Minimum * (Watt) | 12 | 8 33% | 12.35 -3% | 7.99 33% | 11.6 3% | 13 ? -8% |
| Idle Average * (Watt) | 16 | 12 25% | 19.98 -25% | 12.15 24% | 16.3 -2% | 18.7 ? -17% |
| Idle Maximum * (Watt) | 23 | 25 -9% | 25.44 -11% | 13.4 42% | 21.5 7% | 24.3 ? -6% |
| Load Average * (Watt) | 64 | 85 -33% | 94.28 -47% | 103.62 -62% | 100.7 -57% | 108.2 ? -69% |
| Witcher 3 ultra * (Watt) | 117 | 110 6% | 132.9 -14% | 156.1 -33% | 140.1 -20% | |
| Load Maximum * (Watt) | 188 | 180 4% | 140.63 25% | 164.29 13% | 150.3 20% | 254 ? -35% |
* ... menor é melhor
| Schenker XMG A517 Coffee Lake i7-8750H, GeForce GTX 1060 Mobile, 62 Wh | Schenker XMG A517 i7-7700HQ, GeForce GTX 1060 Mobile, 62 Wh | Asus ROG GU501GM-BI7N8 i7-8750H, GeForce GTX 1060 Mobile, 55 Wh | MSI GP63 Leopard 8RE-013US i7-8750H, GeForce GTX 1060 Mobile, 51 Wh | Eurocom Q6 i7-8750H, GeForce GTX 1070 Max-Q, 55 Wh | Média da turma Gaming | |
|---|---|---|---|---|---|---|
| Duração da bateria | 13% | -30% | -4% | -20% | 31% | |
| Reader / Idle (h) | 5.7 | 7.5 32% | 4.5 -21% | 7.5 32% | 5.1 -11% | 8.71 ? 53% |
| WiFi v1.3 (h) | 4.7 | 5 6% | 4 -15% | 4.8 2% | 3.7 -21% | 7.06 ? 50% |
| Load (h) | 1.7 | 1.7 0% | 0.8 -53% | 0.9 -47% | 1.2 -29% | 1.51 ? -11% |
| H.264 (h) | 5.2 | 8.9 ? |
Pro
Contra
O Schenker XMG A517 não está em uma posição fácil. Embora os dispositivos de entrada, as opções de manutenção, as conexões e o equipamento saibam como agradar, o som e a qualidade da carcaça não estão fazendo justiça ao preço de compra.
A carcaça se sente muito plástica (palavra-chave: ruído de rangidos) e mostra alguma fraquezas no acabamento e estabilidade quando examinada de perto.
Também há coisas boas e ruins nas outras categorias. Por exemplo, o painel de 144 Hz, muito responsivo, com ângulos de visão estáveis, só atende de forma limitada a falta de desempenho. Independentemente de se tratar de um bug de software ou de um resfriamento insuficiente, o departamento de garantia de qualidade deve ter percebido que a GPU reduz a velocidade em alguns aplicativos de jogos 3D.
Sem essa falha, o XMG A517 seria um portátil de jogos decente e uma alternativa séria ao Asus ROG GU501GM e MSI GP63 8RE.
Schenker XMG A517 Coffee Lake
- 07/07/2018 v6 (old)
Florian Glaser
Price comparison