Breve Análise do Portátil Nexoc G739 (Clevo N870HK1)
| SD Card Reader | |
| average JPG Copy Test (av. of 3 runs) | |
| Nexoc G739 | |
| Asus Strix GL753VD-GC045T | |
| HP Omen 17-w100ng | |
| Asus GL702VM-GC102D | |
| MSI GE72 7RE-046 | |
| maximum AS SSD Seq Read Test (1GB) | |
| HP Omen 17-w100ng | |
| Nexoc G739 | |
| Asus Strix GL753VD-GC045T | |
| Asus GL702VM-GC102D | |
| MSI GE72 7RE-046 | |
| Networking | |
| iperf3 transmit AX12 | |
| Asus Strix GL753VD-GC045T | |
| HP Omen 17-w100ng | |
| Nexoc G739 | |
| MSI GE72 7RE-046 | |
| iperf3 receive AX12 | |
| HP Omen 17-w100ng | |
| Asus Strix GL753VD-GC045T | |
| Nexoc G739 | |
| MSI GE72 7RE-046 | |
| |||||||||||||||||||||||||
iluminação: 85 %
iluminação com acumulador: 312 cd/m²
Contraste: 1357:1 (Preto: 0.23 cd/m²)
ΔE ColorChecker Calman: 4.19 | ∀{0.5-29.43 Ø4.71}
ΔE Greyscale Calman: 3.72 | ∀{0.09-98 Ø4.96}
91% sRGB (Argyll 1.6.3 3D)
59% AdobeRGB 1998 (Argyll 1.6.3 3D)
66.4% AdobeRGB 1998 (Argyll 3D)
91% sRGB (Argyll 3D)
66.7% Display P3 (Argyll 3D)
Gamma: 2.29
CCT: 7104 K
| Nexoc G739 CMN1738, 1920x1080, 17.3" | Asus Strix GL753VD-GC045T LP173WF4-SPF3, 1920x1080, 17.3" | HP Omen 17-w100ng LG Philips LGD046E, 1920x1080, 17.3" | MSI GE72 7RE-046 N173HHE-G32 (CMN1747), 1920x1080, 17.3" | Asus GL702VM-GC102D LG Philips LP173WF4-SPF3, 1920x1080, 17.3" | |
|---|---|---|---|---|---|
| Display | -4% | -3% | 25% | -6% | |
| Display P3 Coverage (%) | 66.7 | 67.1 1% | 67.2 1% | 90.7 36% | 65.1 -2% |
| sRGB Coverage (%) | 91 | 84.8 -7% | 86.6 -5% | 99.9 10% | 83.5 -8% |
| AdobeRGB 1998 Coverage (%) | 66.4 | 62 -7% | 63.3 -5% | 85.2 28% | 61.1 -8% |
| Response Times | 12% | 17% | 54% | 17% | |
| Response Time Grey 50% / Grey 80% * (ms) | 45 ? | 33.2 ? 26% | 35 ? 22% | 27 ? 40% | 38 ? 16% |
| Response Time Black / White * (ms) | 28 ? | 28.8 ? -3% | 25 ? 11% | 9 ? 68% | 23 ? 18% |
| PWM Frequency (Hz) | 450 ? | ||||
| Screen | -21% | -6% | -16% | -35% | |
| Brightness middle (cd/m²) | 312 | 349 12% | 342 10% | 253 -19% | 326 4% |
| Brightness (cd/m²) | 304 | 337 11% | 331 9% | 230 -24% | 312 3% |
| Brightness Distribution (%) | 85 | 91 7% | 84 -1% | 86 1% | 91 7% |
| Black Level * (cd/m²) | 0.23 | 0.58 -152% | 0.32 -39% | 0.24 -4% | 0.5 -117% |
| Contrast (:1) | 1357 | 602 -56% | 1069 -21% | 1054 -22% | 652 -52% |
| Colorchecker dE 2000 * | 4.19 | 4.5 -7% | 4.35 -4% | 5.01 -20% | 6.3 -50% |
| Colorchecker dE 2000 max. * | 8.7 | 10.2 -17% | 9.24 -6% | 10.4 -20% | 11.69 -34% |
| Greyscale dE 2000 * | 3.72 | 3.3 11% | 3.73 -0% | 7.26 -95% | 7.37 -98% |
| Gamma | 2.29 96% | 2.15 102% | 2.23 99% | 2.09 105% | 2.37 93% |
| CCT | 7104 91% | 6103 107% | 6801 96% | 6329 103% | 7116 91% |
| Color Space (Percent of AdobeRGB 1998) (%) | 59 | 55.7 -6% | 57 -3% | 76 29% | 55 -7% |
| Color Space (Percent of sRGB) (%) | 91 | 75.7 -17% | 86 -5% | 100 10% | 83 -9% |
| Média Total (Programa/Configurações) | -4% /
-14% | 3% /
-2% | 21% /
1% | -8% /
-22% |
* ... menor é melhor
Exibir tempos de resposta
| ↔ Tempo de resposta preto para branco | ||
|---|---|---|
| 28 ms ... ascensão ↗ e queda ↘ combinadas | ↗ 7 ms ascensão | 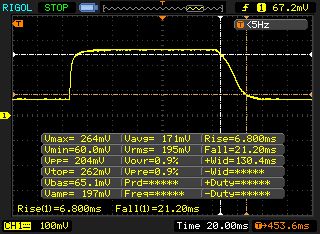 |
| ↘ 21 ms queda | ||
| A tela mostra taxas de resposta relativamente lentas em nossos testes e pode ser muito lenta para os jogadores. Em comparação, todos os dispositivos testados variam de 0.1 (mínimo) a 240 (máximo) ms. » 71 % de todos os dispositivos são melhores. Isso significa que o tempo de resposta medido é pior que a média de todos os dispositivos testados (19.8 ms). | ||
| ↔ Tempo de resposta 50% cinza a 80% cinza | ||
| 45 ms ... ascensão ↗ e queda ↘ combinadas | ↗ 20 ms ascensão | 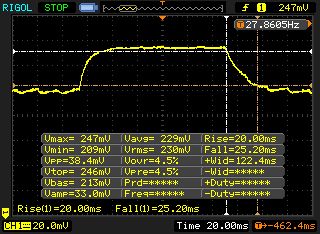 |
| ↘ 25 ms queda | ||
| A tela mostra taxas de resposta lentas em nossos testes e será insatisfatória para os jogadores. Em comparação, todos os dispositivos testados variam de 0.165 (mínimo) a 636 (máximo) ms. » 77 % de todos os dispositivos são melhores. Isso significa que o tempo de resposta medido é pior que a média de todos os dispositivos testados (31 ms). | ||
Cintilação da tela / PWM (modulação por largura de pulso)
| Tela tremeluzindo/PWM detectado | 450 Hz | ≤ 90 % configuração de brilho | 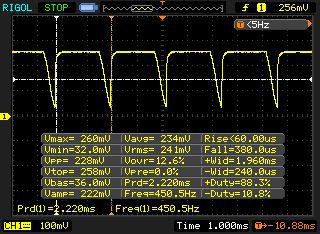 |
A luz de fundo da tela pisca em 450 Hz (pior caso, por exemplo, utilizando PWM) Cintilação detectada em uma configuração de brilho de 90 % e abaixo. Não deve haver cintilação ou PWM acima desta configuração de brilho. A frequência de 450 Hz é relativamente alta, portanto, a maioria dos usuários sensíveis ao PWM não deve notar nenhuma oscilação. No entanto, há relatos de que alguns usuários ainda são sensíveis ao PWM em 500 Hz e acima, portanto, esteja atento. [pwm_comparison] Em comparação: 52 % de todos os dispositivos testados não usam PWM para escurecer a tela. Se PWM foi detectado, uma média de 7754 (mínimo: 5 - máximo: 343500) Hz foi medida. | |||
| Cinebench R15 | |
| CPU Single 64Bit | |
| Nexoc G739 | |
| Asus Strix GL753VD-GC045T | |
| MSI GE72 7RE-046 | |
| Asus GL702VM-GC102D | |
| HP Omen 17-w100ng | |
| CPU Multi 64Bit | |
| Nexoc G739 | |
| Asus Strix GL753VD-GC045T | |
| MSI GE72 7RE-046 | |
| Asus GL702VM-GC102D | |
| HP Omen 17-w100ng | |
| Cinebench R11.5 | |
| CPU Single 64Bit | |
| Nexoc G739 | |
| Asus Strix GL753VD-GC045T | |
| MSI GE72 7RE-046 | |
| Asus GL702VM-GC102D | |
| HP Omen 17-w100ng | |
| CPU Multi 64Bit | |
| Nexoc G739 | |
| Asus Strix GL753VD-GC045T | |
| MSI GE72 7RE-046 | |
| Asus GL702VM-GC102D | |
| HP Omen 17-w100ng | |
| PCMark 8 | |
| Home Score Accelerated v2 | |
| HP Omen 17-w100ng | |
| Asus GL702VM-GC102D | |
| Nexoc G739 | |
| Asus Strix GL753VD-GC045T | |
| Work Score Accelerated v2 | |
| HP Omen 17-w100ng | |
| Nexoc G739 | |
| Asus GL702VM-GC102D | |
| PCMark 7 - Score | |
| Nexoc G739 | |
| HP Omen 17-w100ng | |
| MSI GE72 7RE-046 | |
| Asus GL702VM-GC102D | |
| PCMark 7 Score | 6331 pontos | |
| PCMark 8 Home Score Accelerated v2 | 4270 pontos | |
| PCMark 8 Creative Score Accelerated v2 | 5420 pontos | |
| PCMark 8 Work Score Accelerated v2 | 5243 pontos | |
Ajuda | ||
| Nexoc G739 Samsung PM961 MZVLW256HEHP | Asus Strix GL753VD-GC045T Micron SSD 1100 (MTFDDAV256TBN) | HP Omen 17-w100ng SanDisk Z400s SD8SNAT-128G | MSI GE72 7RE-046 Toshiba HG6 THNSNJ256G8NY | Asus GL702VM-GC102D HGST Travelstar 7K1000 HTS721010A9E630 | |
|---|---|---|---|---|---|
| CrystalDiskMark 3.0 | -60% | -70% | -51% | -96% | |
| Read Seq (MB/s) | 1666 | 475.7 -71% | 495 -70% | 540 -68% | 134.6 -92% |
| Write Seq (MB/s) | 1192 | 419.1 -65% | 180.2 -85% | 495.7 -58% | 130.6 -89% |
| Read 512 (MB/s) | 857 | 336.1 -61% | 315.5 -63% | 455.1 -47% | 44.85 -95% |
| Write 512 (MB/s) | 827 | 346.6 -58% | 172.4 -79% | 481.4 -42% | 63.3 -92% |
| Read 4k (MB/s) | 60.7 | 24.7 -59% | 20.25 -67% | 22.7 -63% | 0.602 -99% |
| Write 4k (MB/s) | 154.5 | 76.8 -50% | 76.1 -51% | 112.9 -27% | 1.146 -99% |
| Read 4k QD32 (MB/s) | 636 | 247.6 -61% | 141.6 -78% | 372.5 -41% | 1.106 -100% |
| Write 4k QD32 (MB/s) | 544 | 234.9 -57% | 170.8 -69% | 212.9 -61% | 1.186 -100% |

| 3DMark 11 - 1280x720 Performance GPU | |
| HP Omen 17-w100ng | |
| Asus GL702VM-GC102D | |
| MSI GE72 7RE-046 | |
| Nexoc G739 | |
| Asus Strix GL753VD-GC045T | |
| 3DMark | |
| 1280x720 Cloud Gate Standard Graphics | |
| Asus GL702VM-GC102D | |
| HP Omen 17-w100ng | |
| Nexoc G739 | |
| MSI GE72 7RE-046 | |
| Asus Strix GL753VD-GC045T | |
| 1920x1080 Fire Strike Graphics | |
| HP Omen 17-w100ng | |
| Asus GL702VM-GC102D | |
| MSI GE72 7RE-046 | |
| Nexoc G739 | |
| Asus Strix GL753VD-GC045T | |
| Asus Strix GL753VD-GC045T | |
| 3DMark 11 Performance | 9687 pontos | |
| 3DMark Cloud Gate Standard Score | 22876 pontos | |
| 3DMark Fire Strike Score | 6950 pontos | |
| 3DMark Time Spy Score | 2519 pontos | |
Ajuda | ||
| Battlefield 1 | |
| 1920x1080 Ultra Preset AA:T | |
| Asus GL702VM-GC102D | |
| HP Omen 17-w100ng | |
| MSI GE72 7RE-046 | |
| Nexoc G739 | |
| Asus Strix GL753VD-GC045T | |
| 1920x1080 High Preset AA:T | |
| Asus GL702VM-GC102D | |
| HP Omen 17-w100ng | |
| MSI GE72 7RE-046 | |
| Nexoc G739 | |
| Asus Strix GL753VD-GC045T | |
| The Witcher 3 | |
| 1920x1080 Ultra Graphics & Postprocessing (HBAO+) | |
| Nexoc G739 | |
| MSI GE72 7RE-046 | |
| Asus Strix GL753VD-GC045T | |
| 1920x1080 High Graphics & Postprocessing (Nvidia HairWorks Off) | |
| Nexoc G739 | |
| MSI GE72 7RE-046 | |
| Asus Strix GL753VD-GC045T | |
| Rise of the Tomb Raider | |
| 1920x1080 Very High Preset AA:FX AF:16x | |
| Nexoc G739 | |
| MSI GE72 7RE-046 | |
| Asus Strix GL753VD-GC045T | |
| 1920x1080 High Preset AA:FX AF:4x | |
| Nexoc G739 | |
| MSI GE72 7RE-046 | |
| Asus Strix GL753VD-GC045T | |
| For Honor | |
| 1920x1080 Extreme Preset AA:T AF:16x | |
| Nexoc G739 | |
| MSI GE72 7RE-046 | |
| 1920x1080 High Preset AA:T AF:8x | |
| MSI GE72 7RE-046 | |
| Nexoc G739 | |
| BioShock Infinite - 1920x1080 Ultra Preset, DX11 (DDOF) | |
| HP Omen 17-w100ng | |
| Asus GL702VM-GC102D | |
| Nexoc G739 | |
| baixo | média | alto | ultra | |
|---|---|---|---|---|
| BioShock Infinite (2013) | 72.5 | |||
| The Witcher 3 (2015) | 89.8 | 50.4 | 27.6 | |
| Rise of the Tomb Raider (2016) | 84.2 | 47.6 | 40.7 | |
| Battlefield 1 (2016) | 79.2 | 55.7 | 50.8 | |
| For Honor (2017) | 65.8 | 62.1 | 46.1 |
Barulho
| Ocioso |
| 31 / 32 / 38 dB |
| HDD |
| 31 dB |
| Carga |
| 44 / 50 dB |
 | ||
30 dB silencioso 40 dB(A) audível 50 dB(A) ruidosamente alto |
||
min: | ||
| Nexoc G739 GeForce GTX 1050 Ti Mobile, i7-7700HQ | Asus Strix GL753VD-GC045T GeForce GTX 1050 Mobile, i7-7700HQ | HP Omen 17-w100ng GeForce GTX 1060 Mobile, 6300HQ | MSI GE72 7RE-046 GeForce GTX 1050 Ti Mobile, i7-7700HQ | Asus GL702VM-GC102D GeForce GTX 1060 Mobile, 6700HQ | |
|---|---|---|---|---|---|
| Noise | -0% | -6% | -1% | 5% | |
| desligado / ambiente * (dB) | 30 | 28.8 4% | 31 -3% | 30 -0% | 30.5 -2% |
| Idle Minimum * (dB) | 31 | 33.9 -9% | 35 -13% | 34 -10% | 31.4 -1% |
| Idle Average * (dB) | 32 | 33.9 -6% | 36 -13% | 35 -9% | 31.4 2% |
| Idle Maximum * (dB) | 38 | 37.8 1% | 37 3% | 36 5% | 31.5 17% |
| Load Average * (dB) | 44 | 42.7 3% | 44 -0% | 41 7% | 40.9 7% |
| Load Maximum * (dB) | 50 | 47.4 5% | 54 -8% | 49 2% | 46.2 8% |
* ... menor é melhor
(-) A temperatura máxima no lado superior é 50.6 °C / 123 F, em comparação com a média de 40.4 °C / 105 F , variando de 21.2 a 68.8 °C para a classe Gaming.
(-) A parte inferior aquece até um máximo de 50.8 °C / 123 F, em comparação com a média de 43.2 °C / 110 F
(+) Em uso inativo, a temperatura média para o lado superior é 25.6 °C / 78 F, em comparação com a média do dispositivo de 33.9 °C / ### class_avg_f### F.
(-) Os apoios para as mãos e o touchpad podem ficar muito quentes ao toque, com um máximo de 42.8 °C / 109 F.
(-) A temperatura média da área do apoio para as mãos de dispositivos semelhantes foi 28.8 °C / 83.8 F (-14 °C / -25.2 F).
| Nexoc G739 GeForce GTX 1050 Ti Mobile, i7-7700HQ | Asus Strix GL753VD-GC045T GeForce GTX 1050 Mobile, i7-7700HQ | HP Omen 17-w100ng GeForce GTX 1060 Mobile, 6300HQ | MSI GE72 7RE-046 GeForce GTX 1050 Ti Mobile, i7-7700HQ | Asus GL702VM-GC102D GeForce GTX 1060 Mobile, 6700HQ | |
|---|---|---|---|---|---|
| Heat | 19% | 2% | 0% | -8% | |
| Maximum Upper Side * (°C) | 50.6 | 37.7 25% | 41.5 18% | 45.8 9% | 53.1 -5% |
| Maximum Bottom * (°C) | 50.8 | 36.3 29% | 45.5 10% | 45.2 11% | 44.9 12% |
| Idle Upper Side * (°C) | 28.7 | 25.7 10% | 31.8 -11% | 31.7 -10% | 32.9 -15% |
| Idle Bottom * (°C) | 27.1 | 24.4 10% | 29.6 -9% | 29.9 -10% | 33.4 -23% |
* ... menor é melhor
Nexoc G739 análise de áudio
(±) | o volume do alto-falante é médio, mas bom (###valor### dB)
Graves 100 - 315Hz
(-) | quase nenhum baixo - em média 23.2% menor que a mediana
(±) | a linearidade dos graves é média (13.3% delta para a frequência anterior)
Médios 400 - 2.000 Hz
(±) | médios mais altos - em média 7.8% maior que a mediana
(±) | a linearidade dos médios é média (8% delta para frequência anterior)
Altos 2 - 16 kHz
(±) | máximos mais altos - em média 6.4% maior que a mediana
(±) | a linearidade dos máximos é média (12.4% delta para frequência anterior)
Geral 100 - 16.000 Hz
(-) | o som geral não é linear (31.5% diferença em relação à mediana)
Comparado com a mesma classe
» 97% de todos os dispositivos testados nesta classe foram melhores, 1% semelhantes, 2% piores
» O melhor teve um delta de 6%, a média foi 18%, o pior foi 132%
Comparado com todos os dispositivos testados
» 90% de todos os dispositivos testados foram melhores, 2% semelhantes, 8% piores
» O melhor teve um delta de 4%, a média foi 23%, o pior foi 134%
Asus Strix GL753VD-GC045T análise de áudio
(±) | o volume do alto-falante é médio, mas bom (###valor### dB)
Graves 100 - 315Hz
(-) | quase nenhum baixo - em média 15.8% menor que a mediana
(±) | a linearidade dos graves é média (12.2% delta para a frequência anterior)
Médios 400 - 2.000 Hz
(+) | médios equilibrados - apenas 3.1% longe da mediana
(±) | a linearidade dos médios é média (7% delta para frequência anterior)
Altos 2 - 16 kHz
(±) | máximos mais altos - em média 6.3% maior que a mediana
(+) | os máximos são lineares (5.4% delta da frequência anterior)
Geral 100 - 16.000 Hz
(±) | a linearidade do som geral é média (17.2% diferença em relação à mediana)
Comparado com a mesma classe
» 47% de todos os dispositivos testados nesta classe foram melhores, 11% semelhantes, 42% piores
» O melhor teve um delta de 6%, a média foi 18%, o pior foi 132%
Comparado com todos os dispositivos testados
» 32% de todos os dispositivos testados foram melhores, 8% semelhantes, 60% piores
» O melhor teve um delta de 4%, a média foi 23%, o pior foi 134%
| desligado | |
| Ocioso | |
| Carga |
|
Key:
min: | |
| Nexoc G739 GeForce GTX 1050 Ti Mobile, i7-7700HQ | Asus Strix GL753VD-GC045T GeForce GTX 1050 Mobile, i7-7700HQ | HP Omen 17-w100ng GeForce GTX 1060 Mobile, 6300HQ | MSI GE72 7RE-046 GeForce GTX 1050 Ti Mobile, i7-7700HQ | Asus GL702VM-GC102D GeForce GTX 1060 Mobile, 6700HQ | |
|---|---|---|---|---|---|
| Power Consumption | 16% | -40% | -27% | -32% | |
| Idle Minimum * (Watt) | 7 | 6.2 11% | 17 -143% | 14 -100% | 15.6 -123% |
| Idle Average * (Watt) | 14 | 12.2 13% | 22 -57% | 20 -43% | 20.2 -44% |
| Idle Maximum * (Watt) | 23 | 14.8 36% | 29 -26% | 25 -9% | 21.4 7% |
| Load Average * (Watt) | 82 | 84.9 -4% | 72 12% | 82 -0% | 90 -10% |
| Load Maximum * (Watt) | 163 | 120.7 26% | 141 13% | 135 17% | 147 10% |
* ... menor é melhor
| Nexoc G739 GeForce GTX 1050 Ti Mobile, i7-7700HQ, 62 Wh | Asus Strix GL753VD-GC045T GeForce GTX 1050 Mobile, i7-7700HQ, 48 Wh | HP Omen 17-w100ng GeForce GTX 1060 Mobile, 6300HQ, 95.8 Wh | MSI GE72 7RE-046 GeForce GTX 1050 Ti Mobile, i7-7700HQ, 51.4 Wh | Asus GL702VM-GC102D GeForce GTX 1060 Mobile, 6700HQ, 76 Wh | |
|---|---|---|---|---|---|
| Duração da bateria | -29% | 7% | -37% | -26% | |
| Reader / Idle (h) | 10.2 | 8.6 -16% | 9.1 -11% | 5.9 -42% | |
| H.264 (h) | 5.4 | 5.2 -4% | 3.3 -39% | 4.4 -19% | |
| WiFi v1.3 (h) | 4.8 | 4.4 -8% | 6.1 27% | 3.1 -35% | 4.2 -12% |
| Load (h) | 2.1 | 0.8 -62% | 2.4 14% | 1.5 -29% |
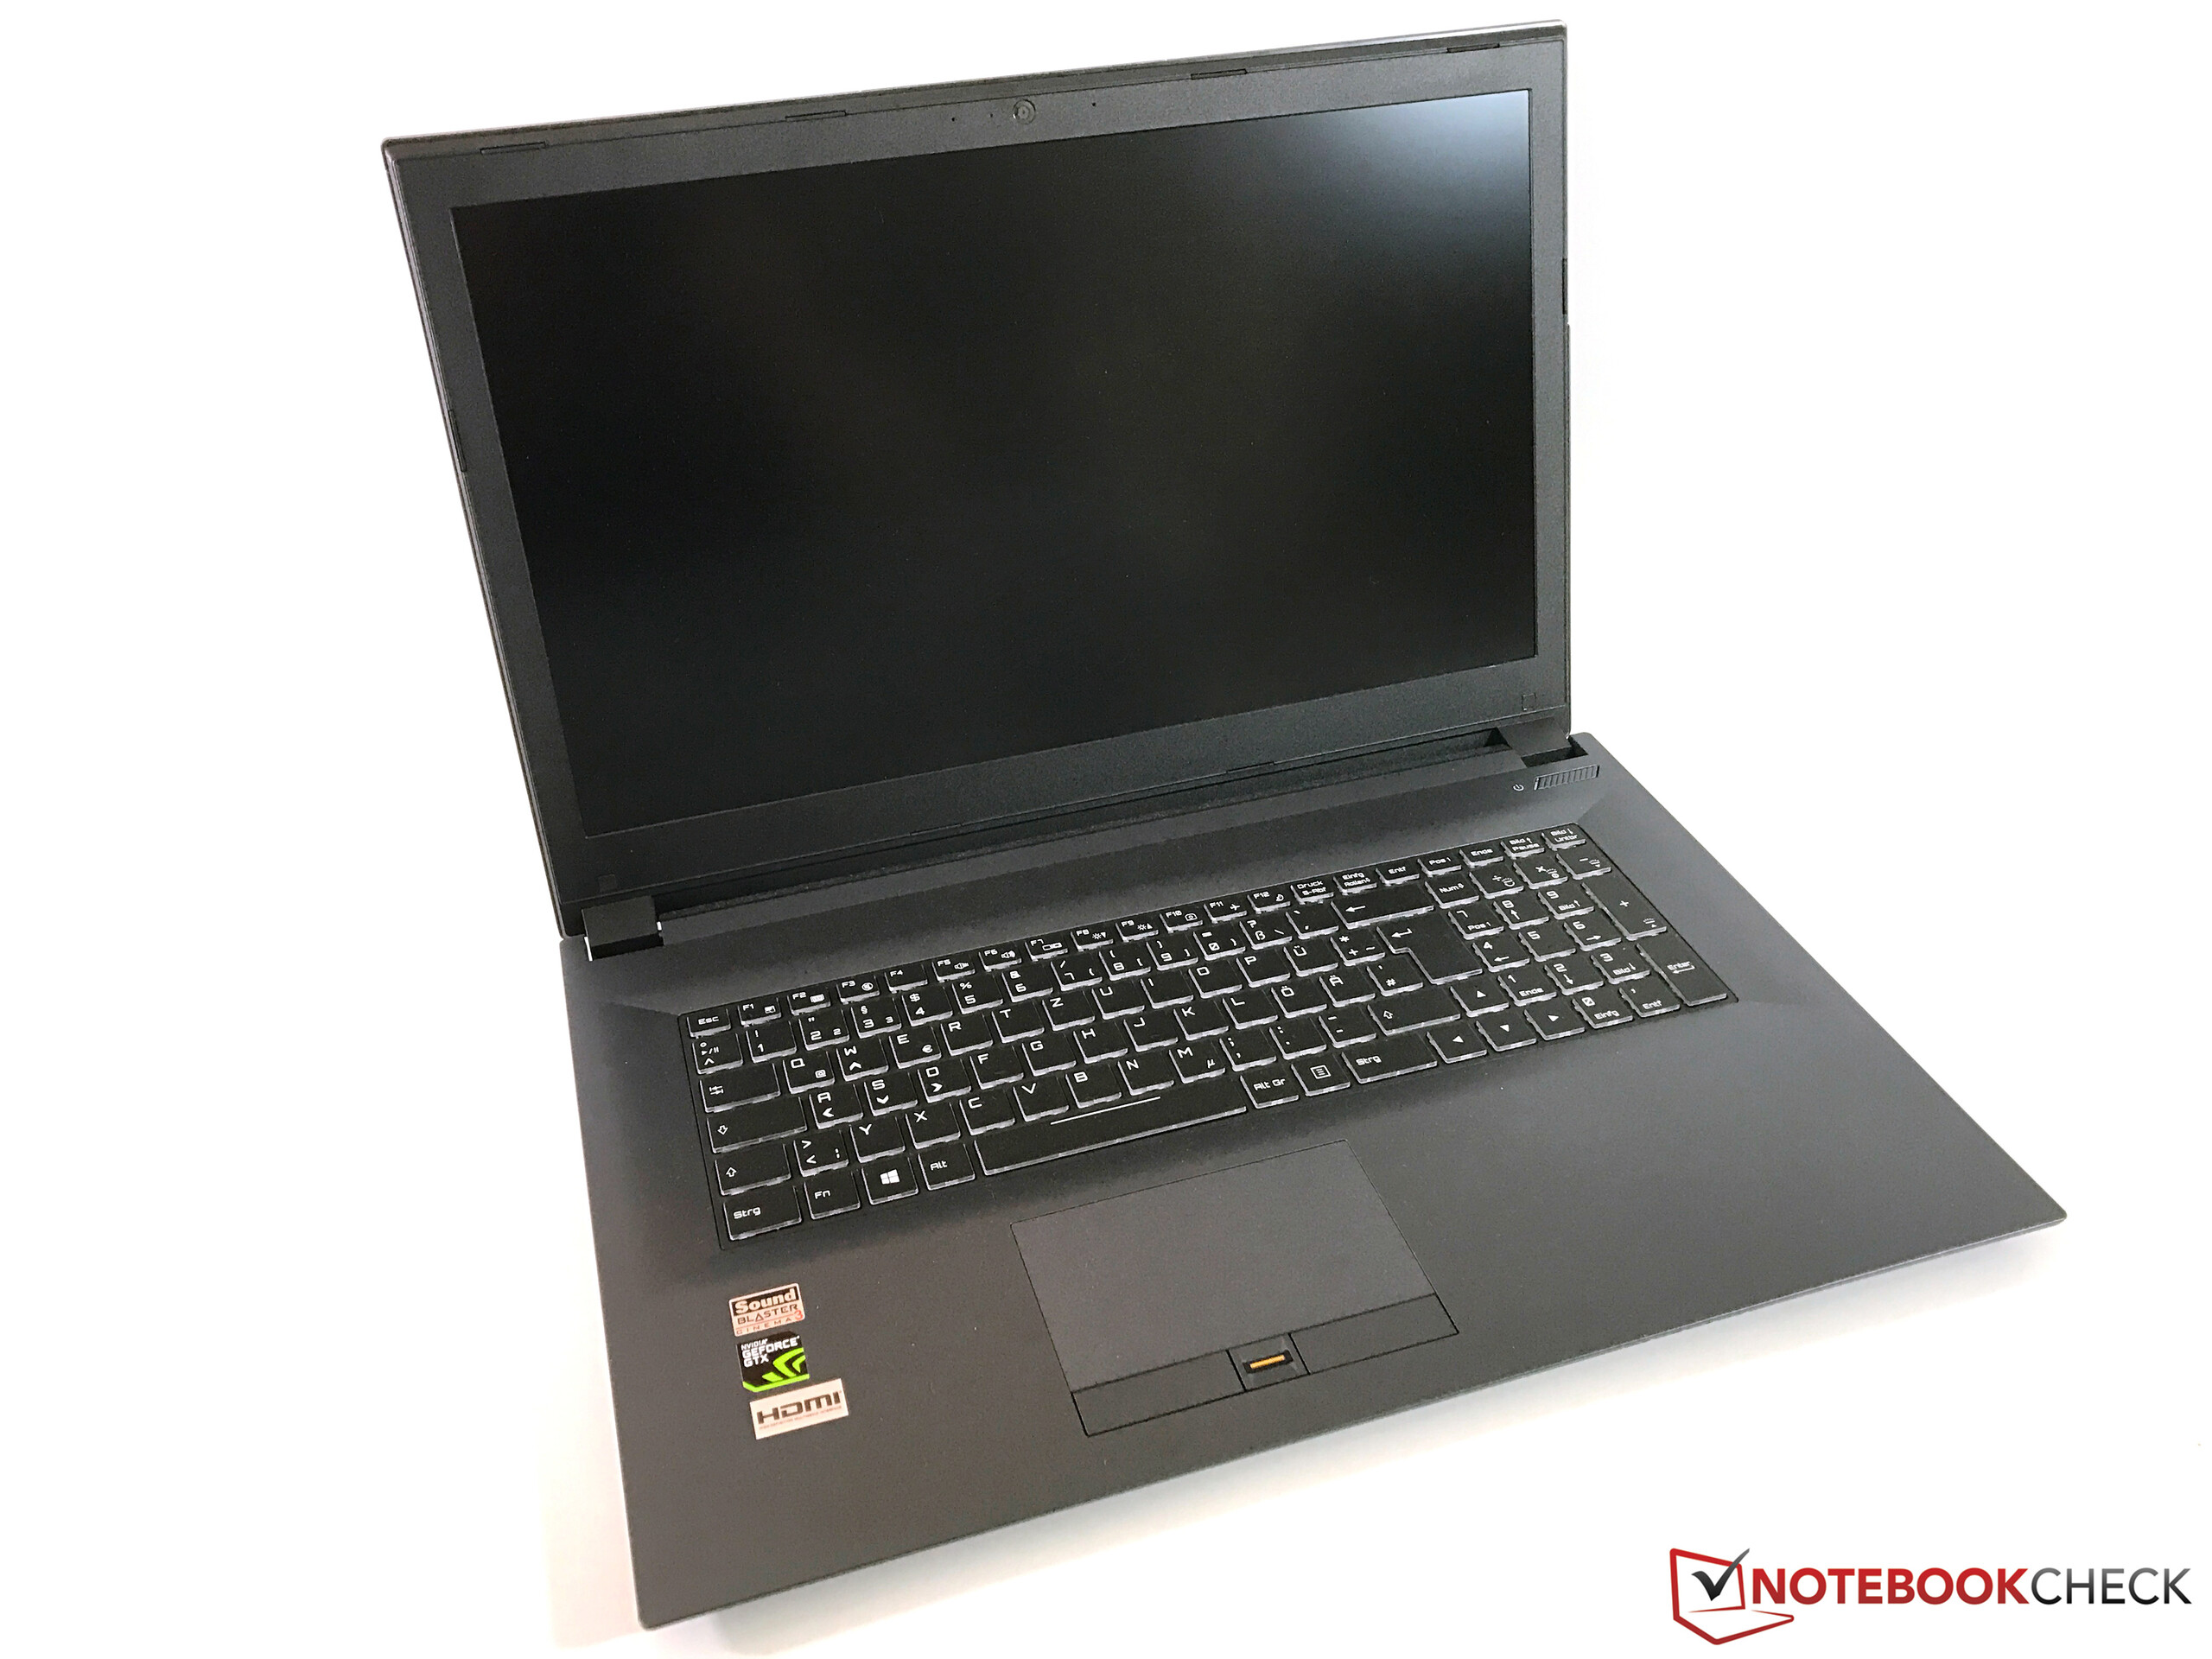
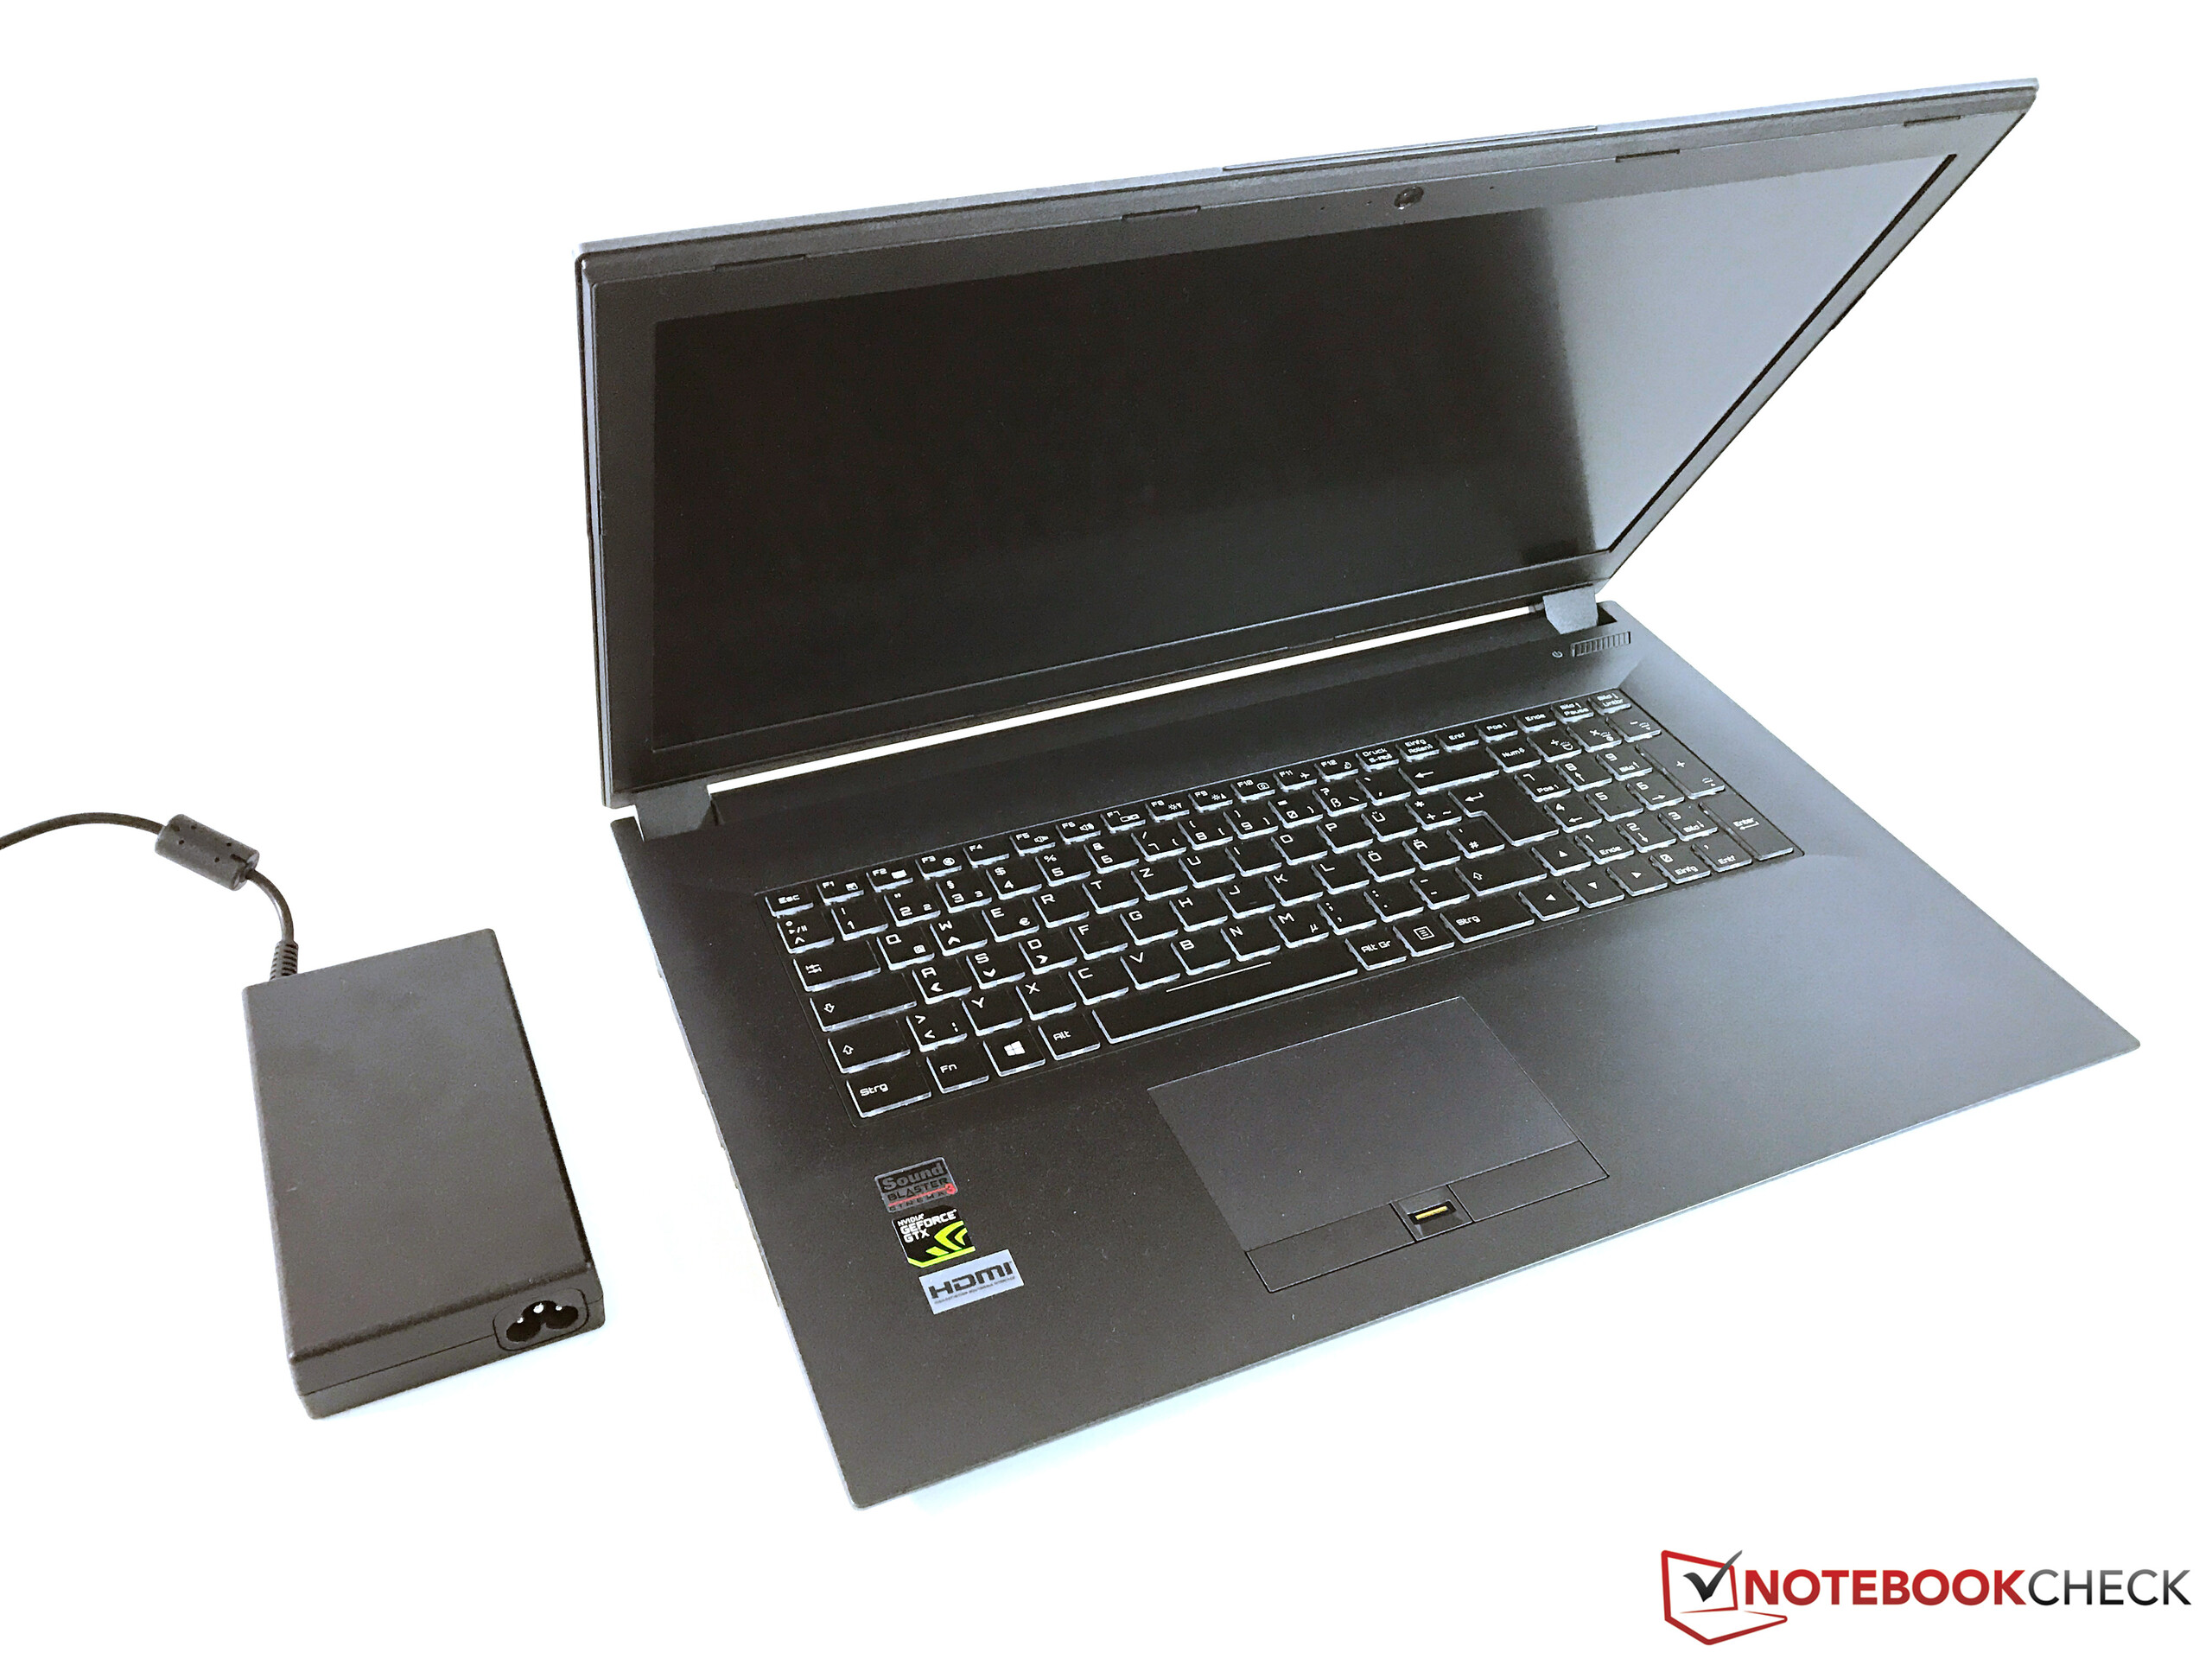
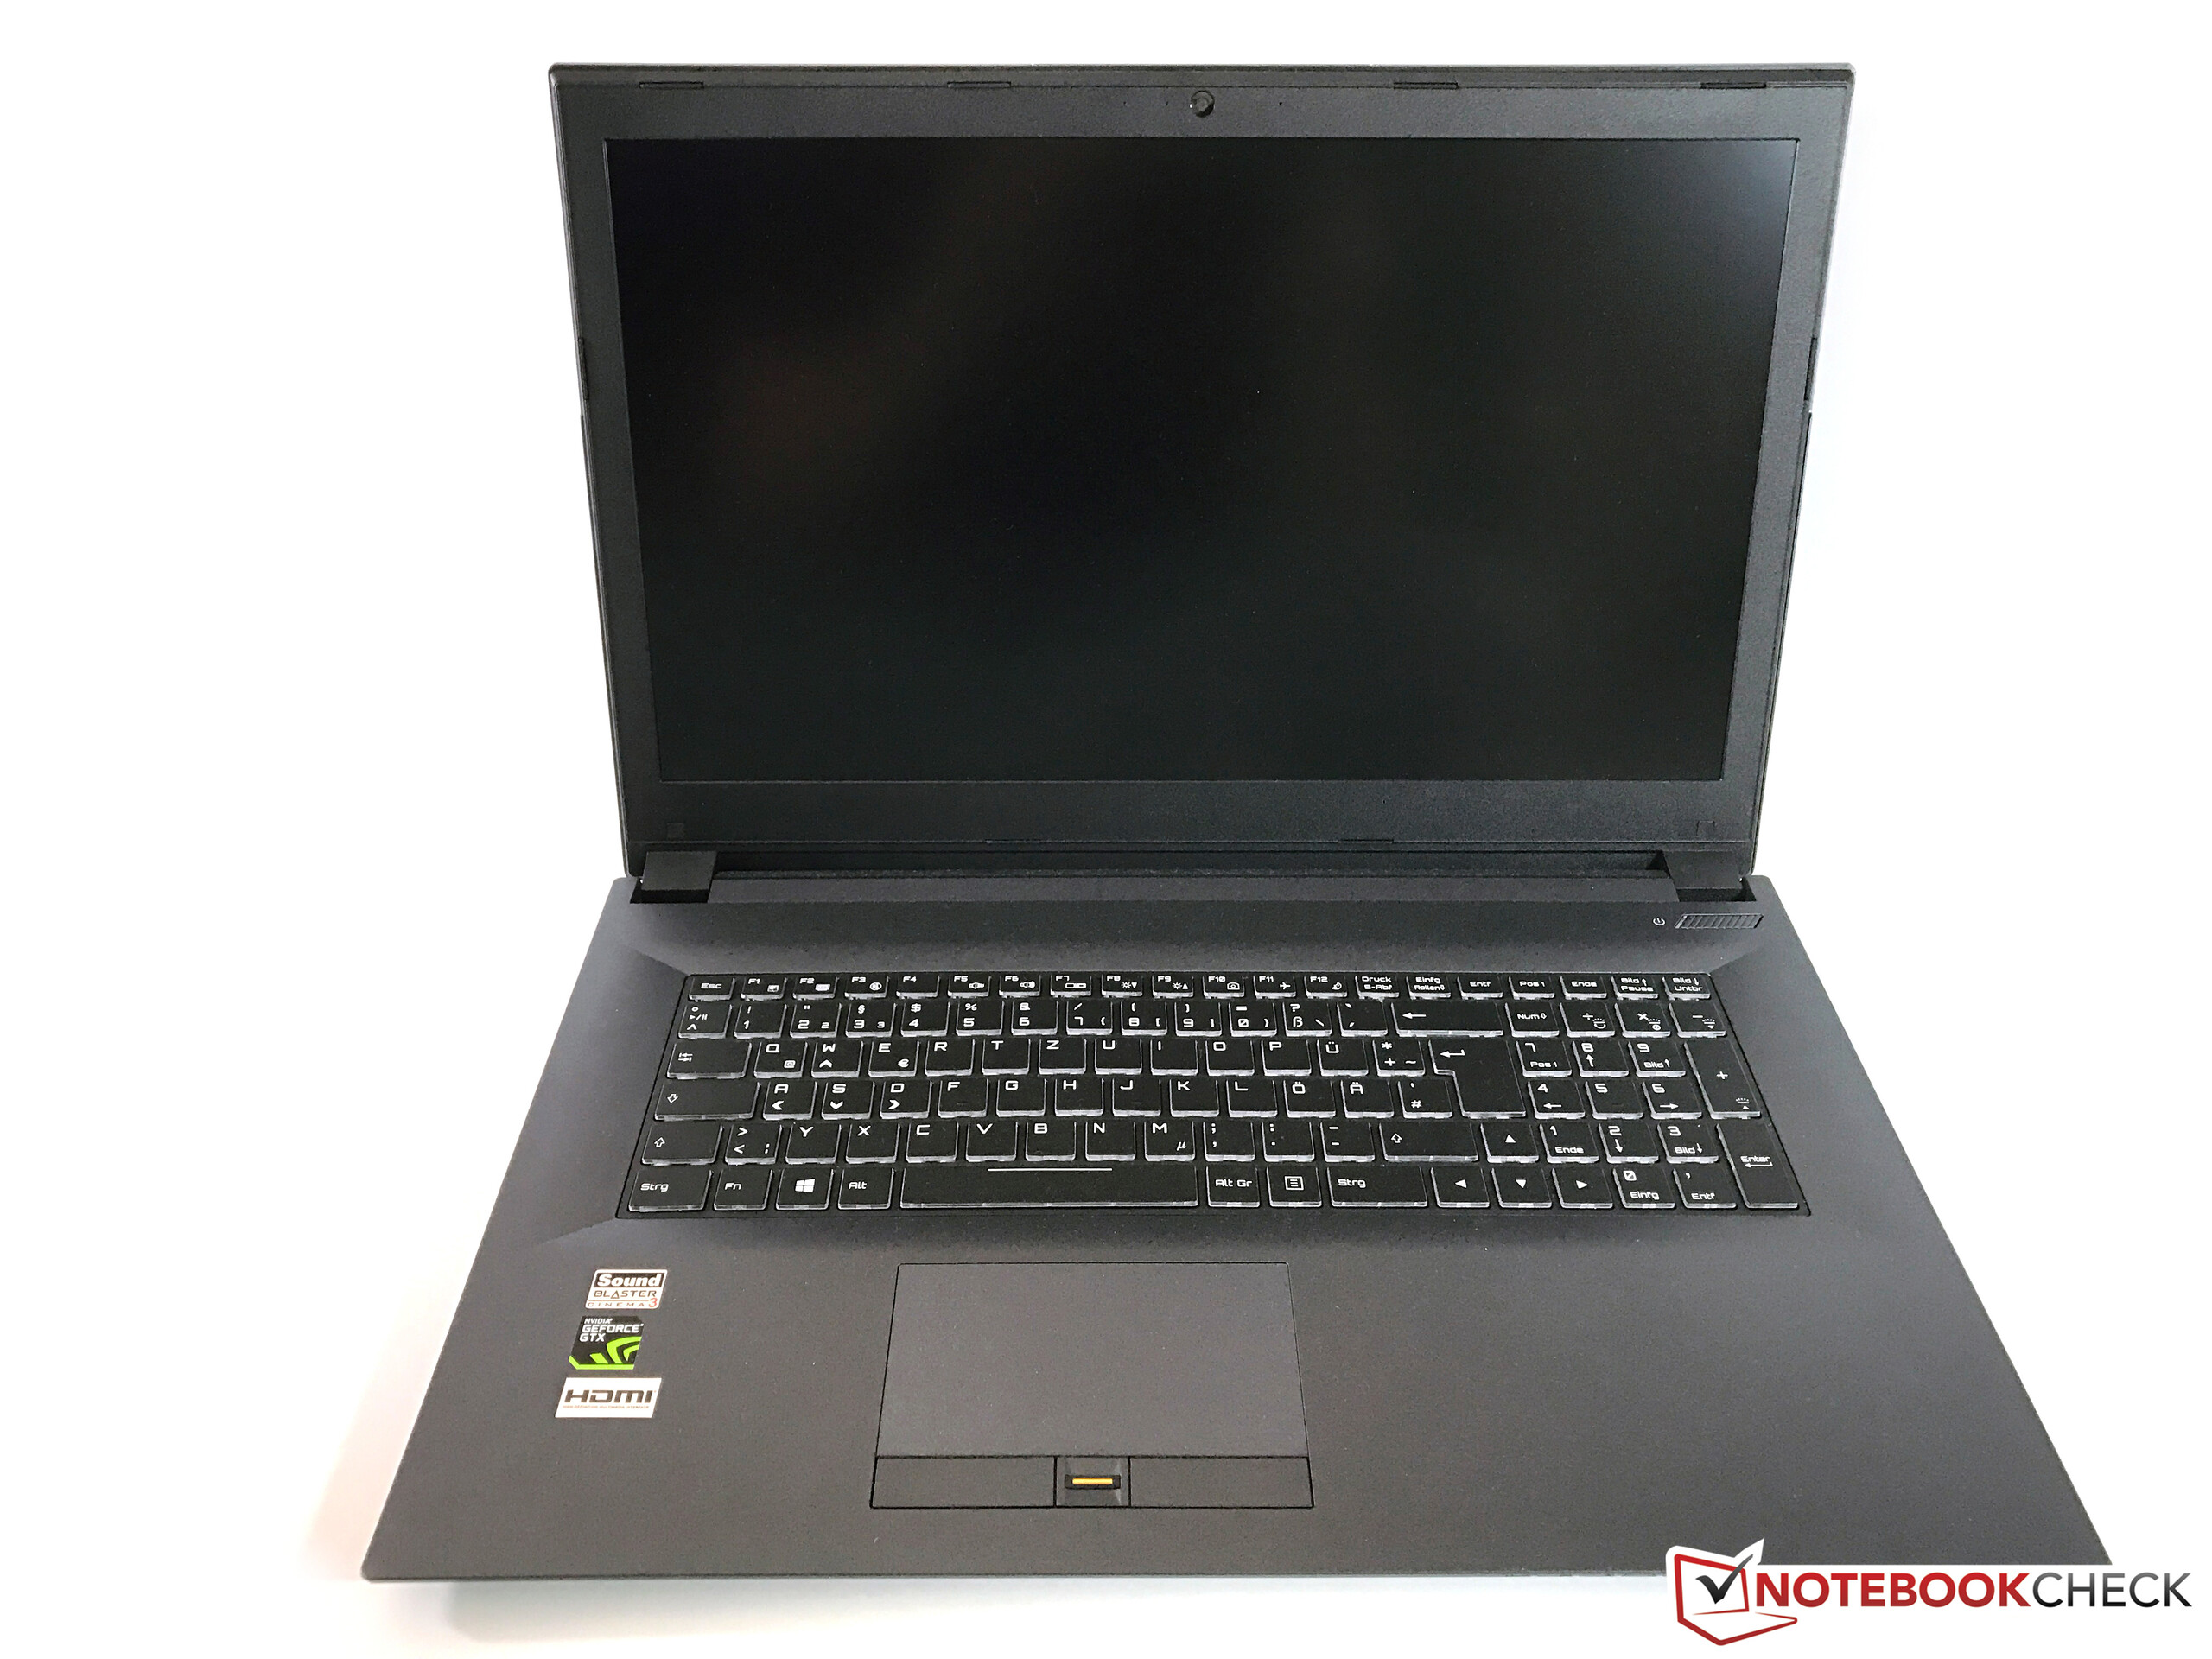
Graças ao poderoso hardware, o Nexoc G739 é um portátil de nível de entrada com muita capacidade. A placa de vídeo harmoniza bem com a tela Full-HD, que é suficientemente brilhante e, de doutra forma, também alcança bons resultados. Mas em muitas outras áreas, como, por exemplo, as conexões, a carcaça, e os dispositivos de entrada, o aparelho de teste é apenas médio.
Em termos de desempenho, o Nexoc G739 não apenas mostra que não possui fraquezas e consegue lidar com jogos exigentes, mas as emissões do Clevo-N870HK1 Barebones poderiam melhorar.
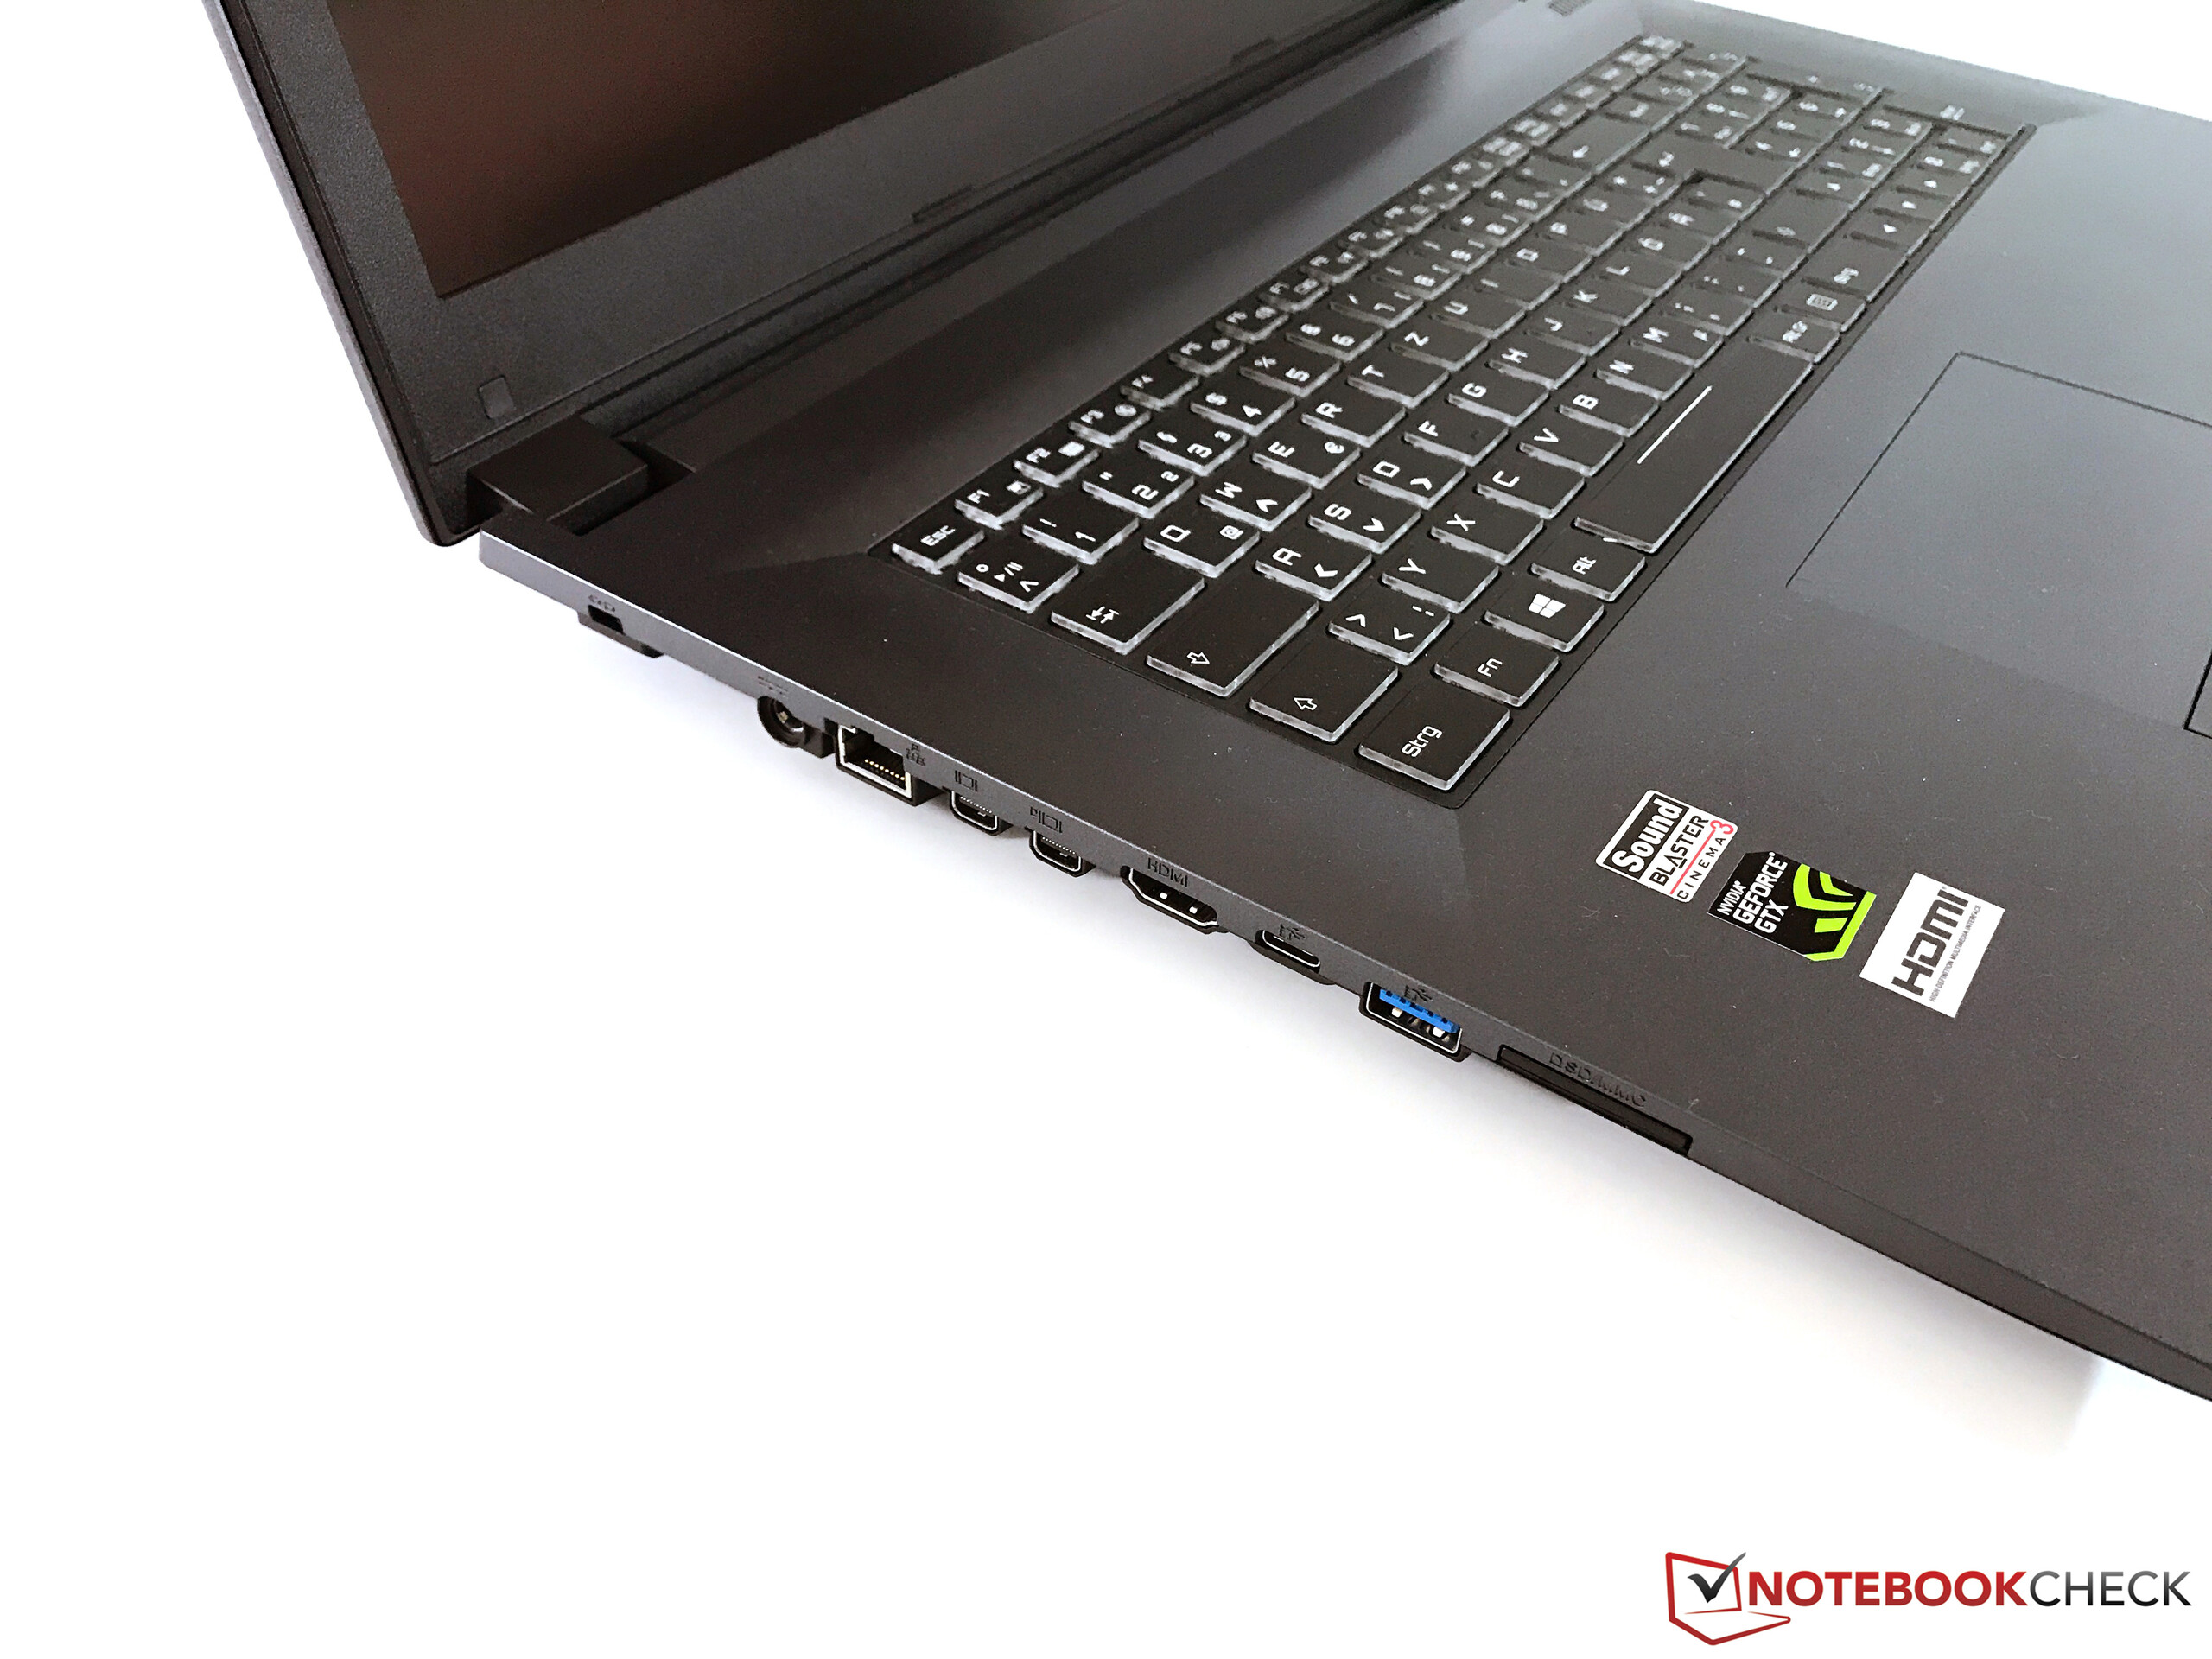
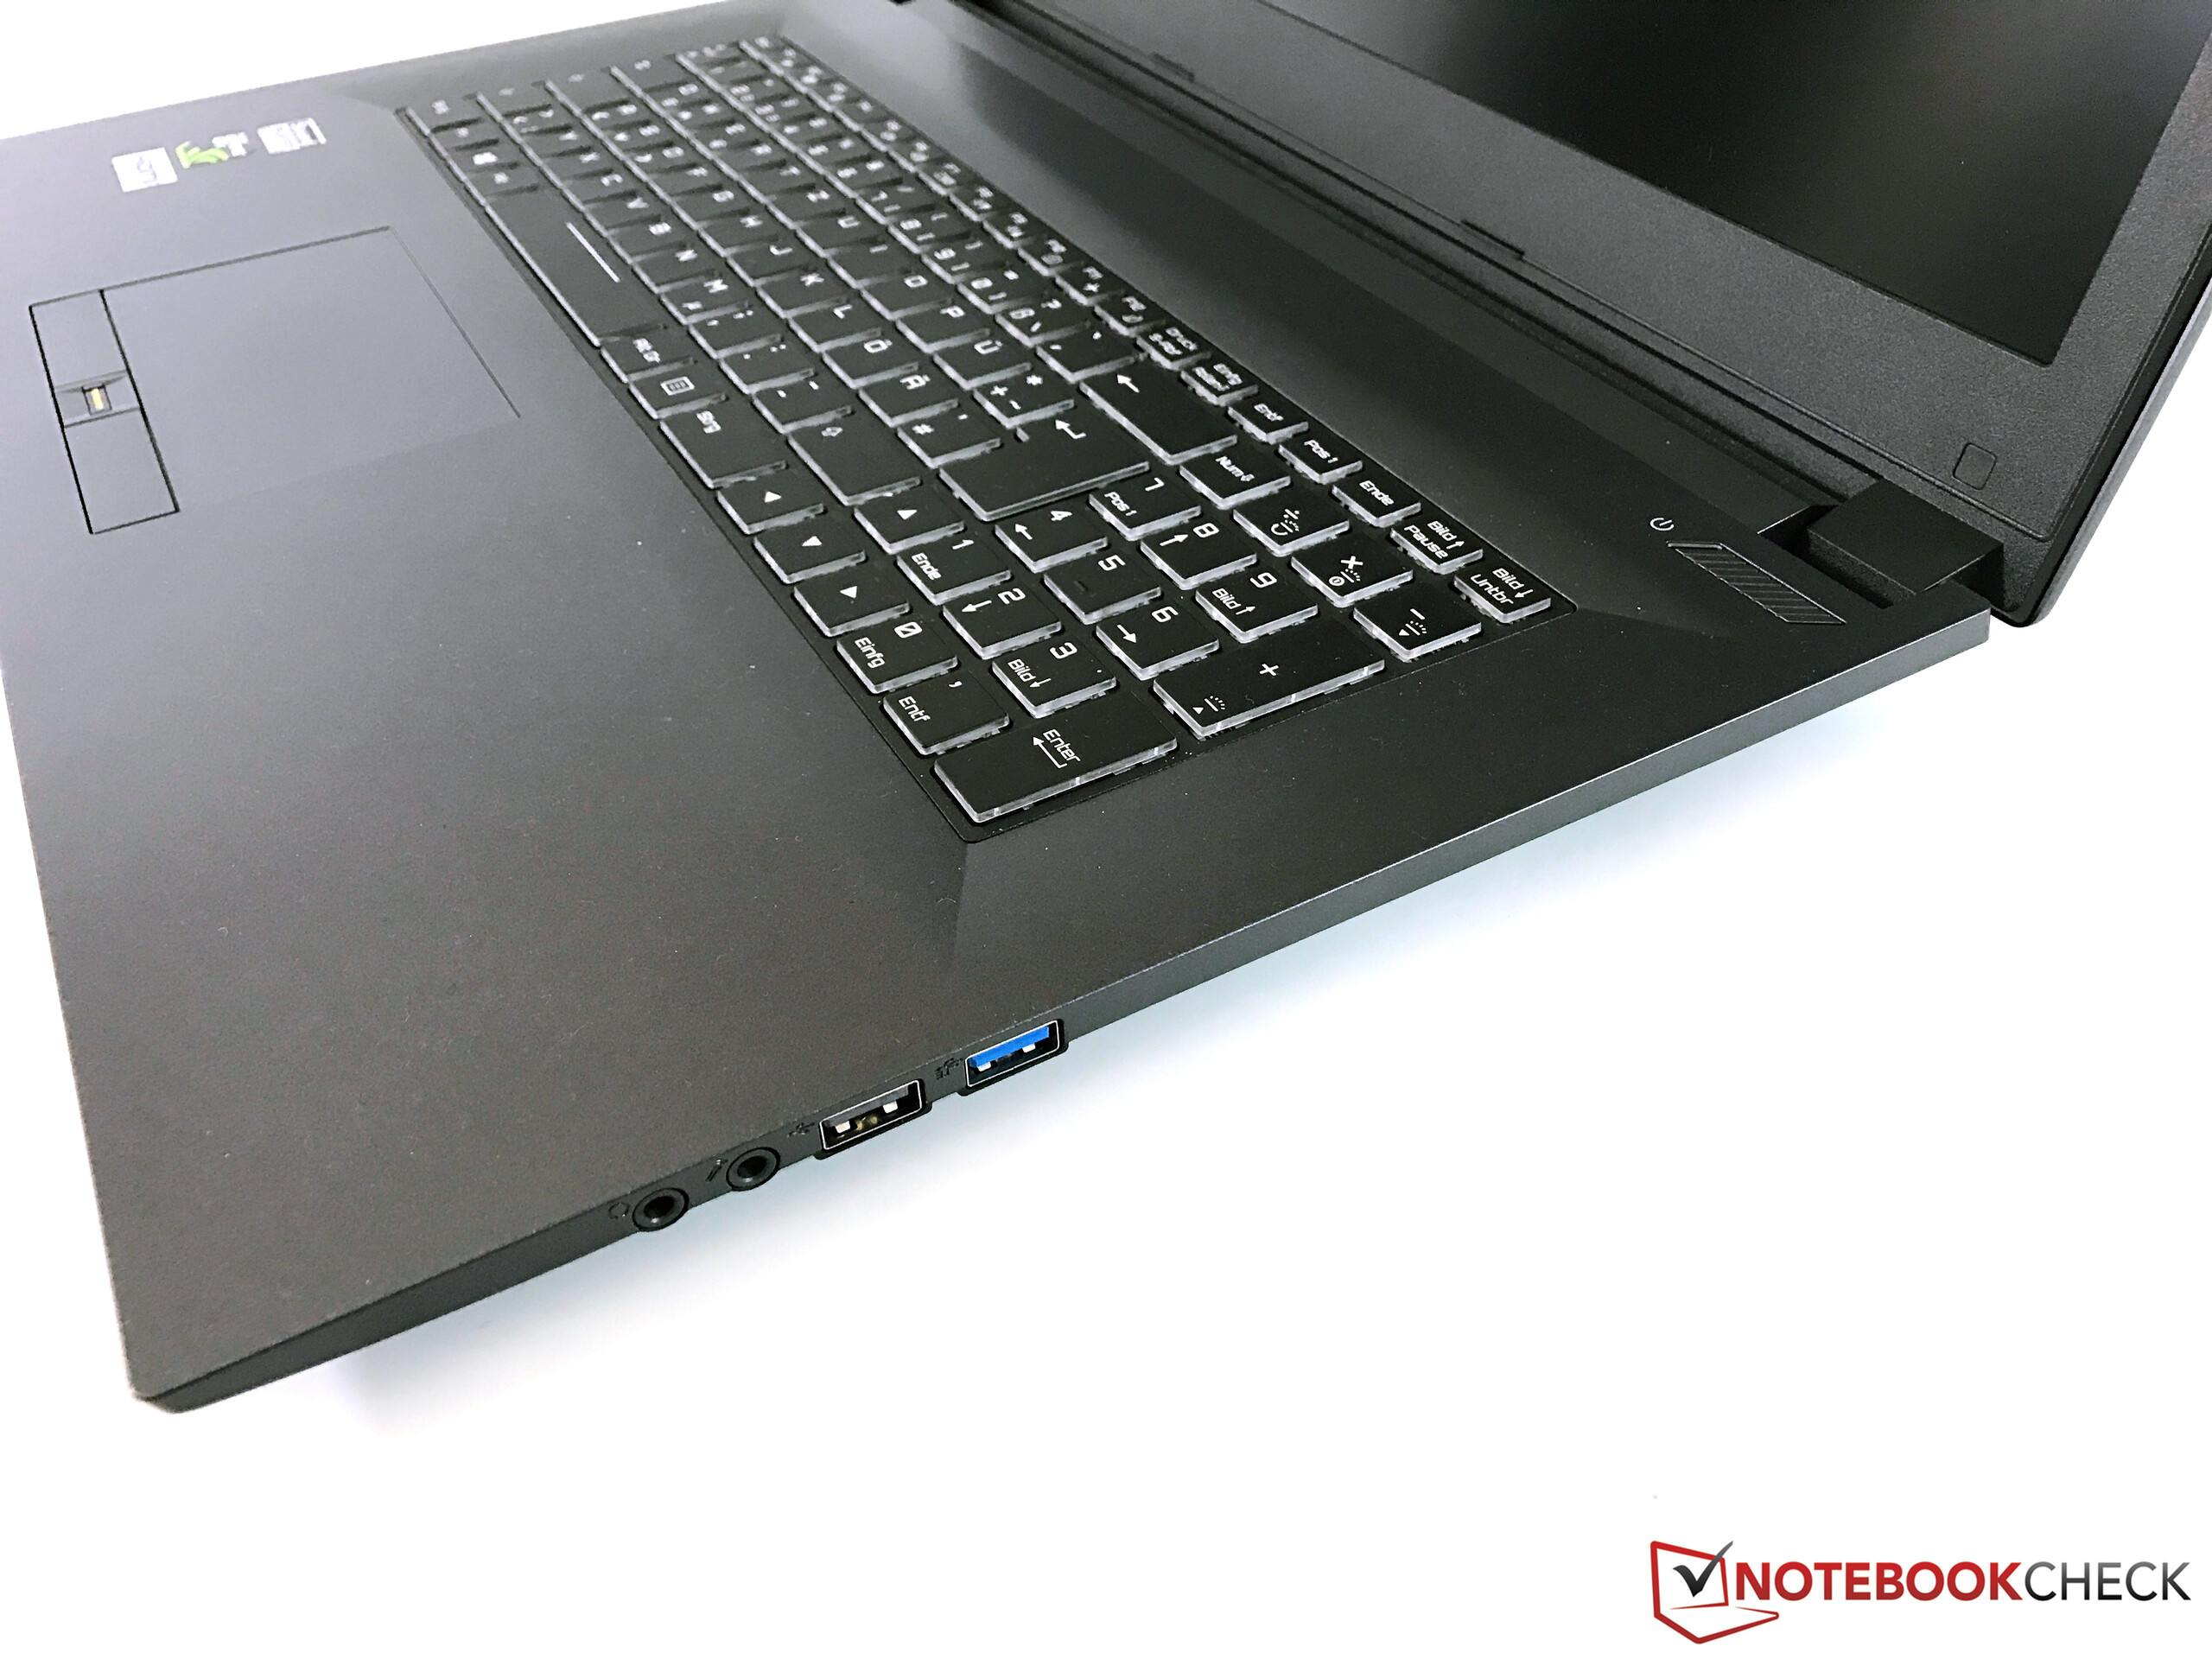
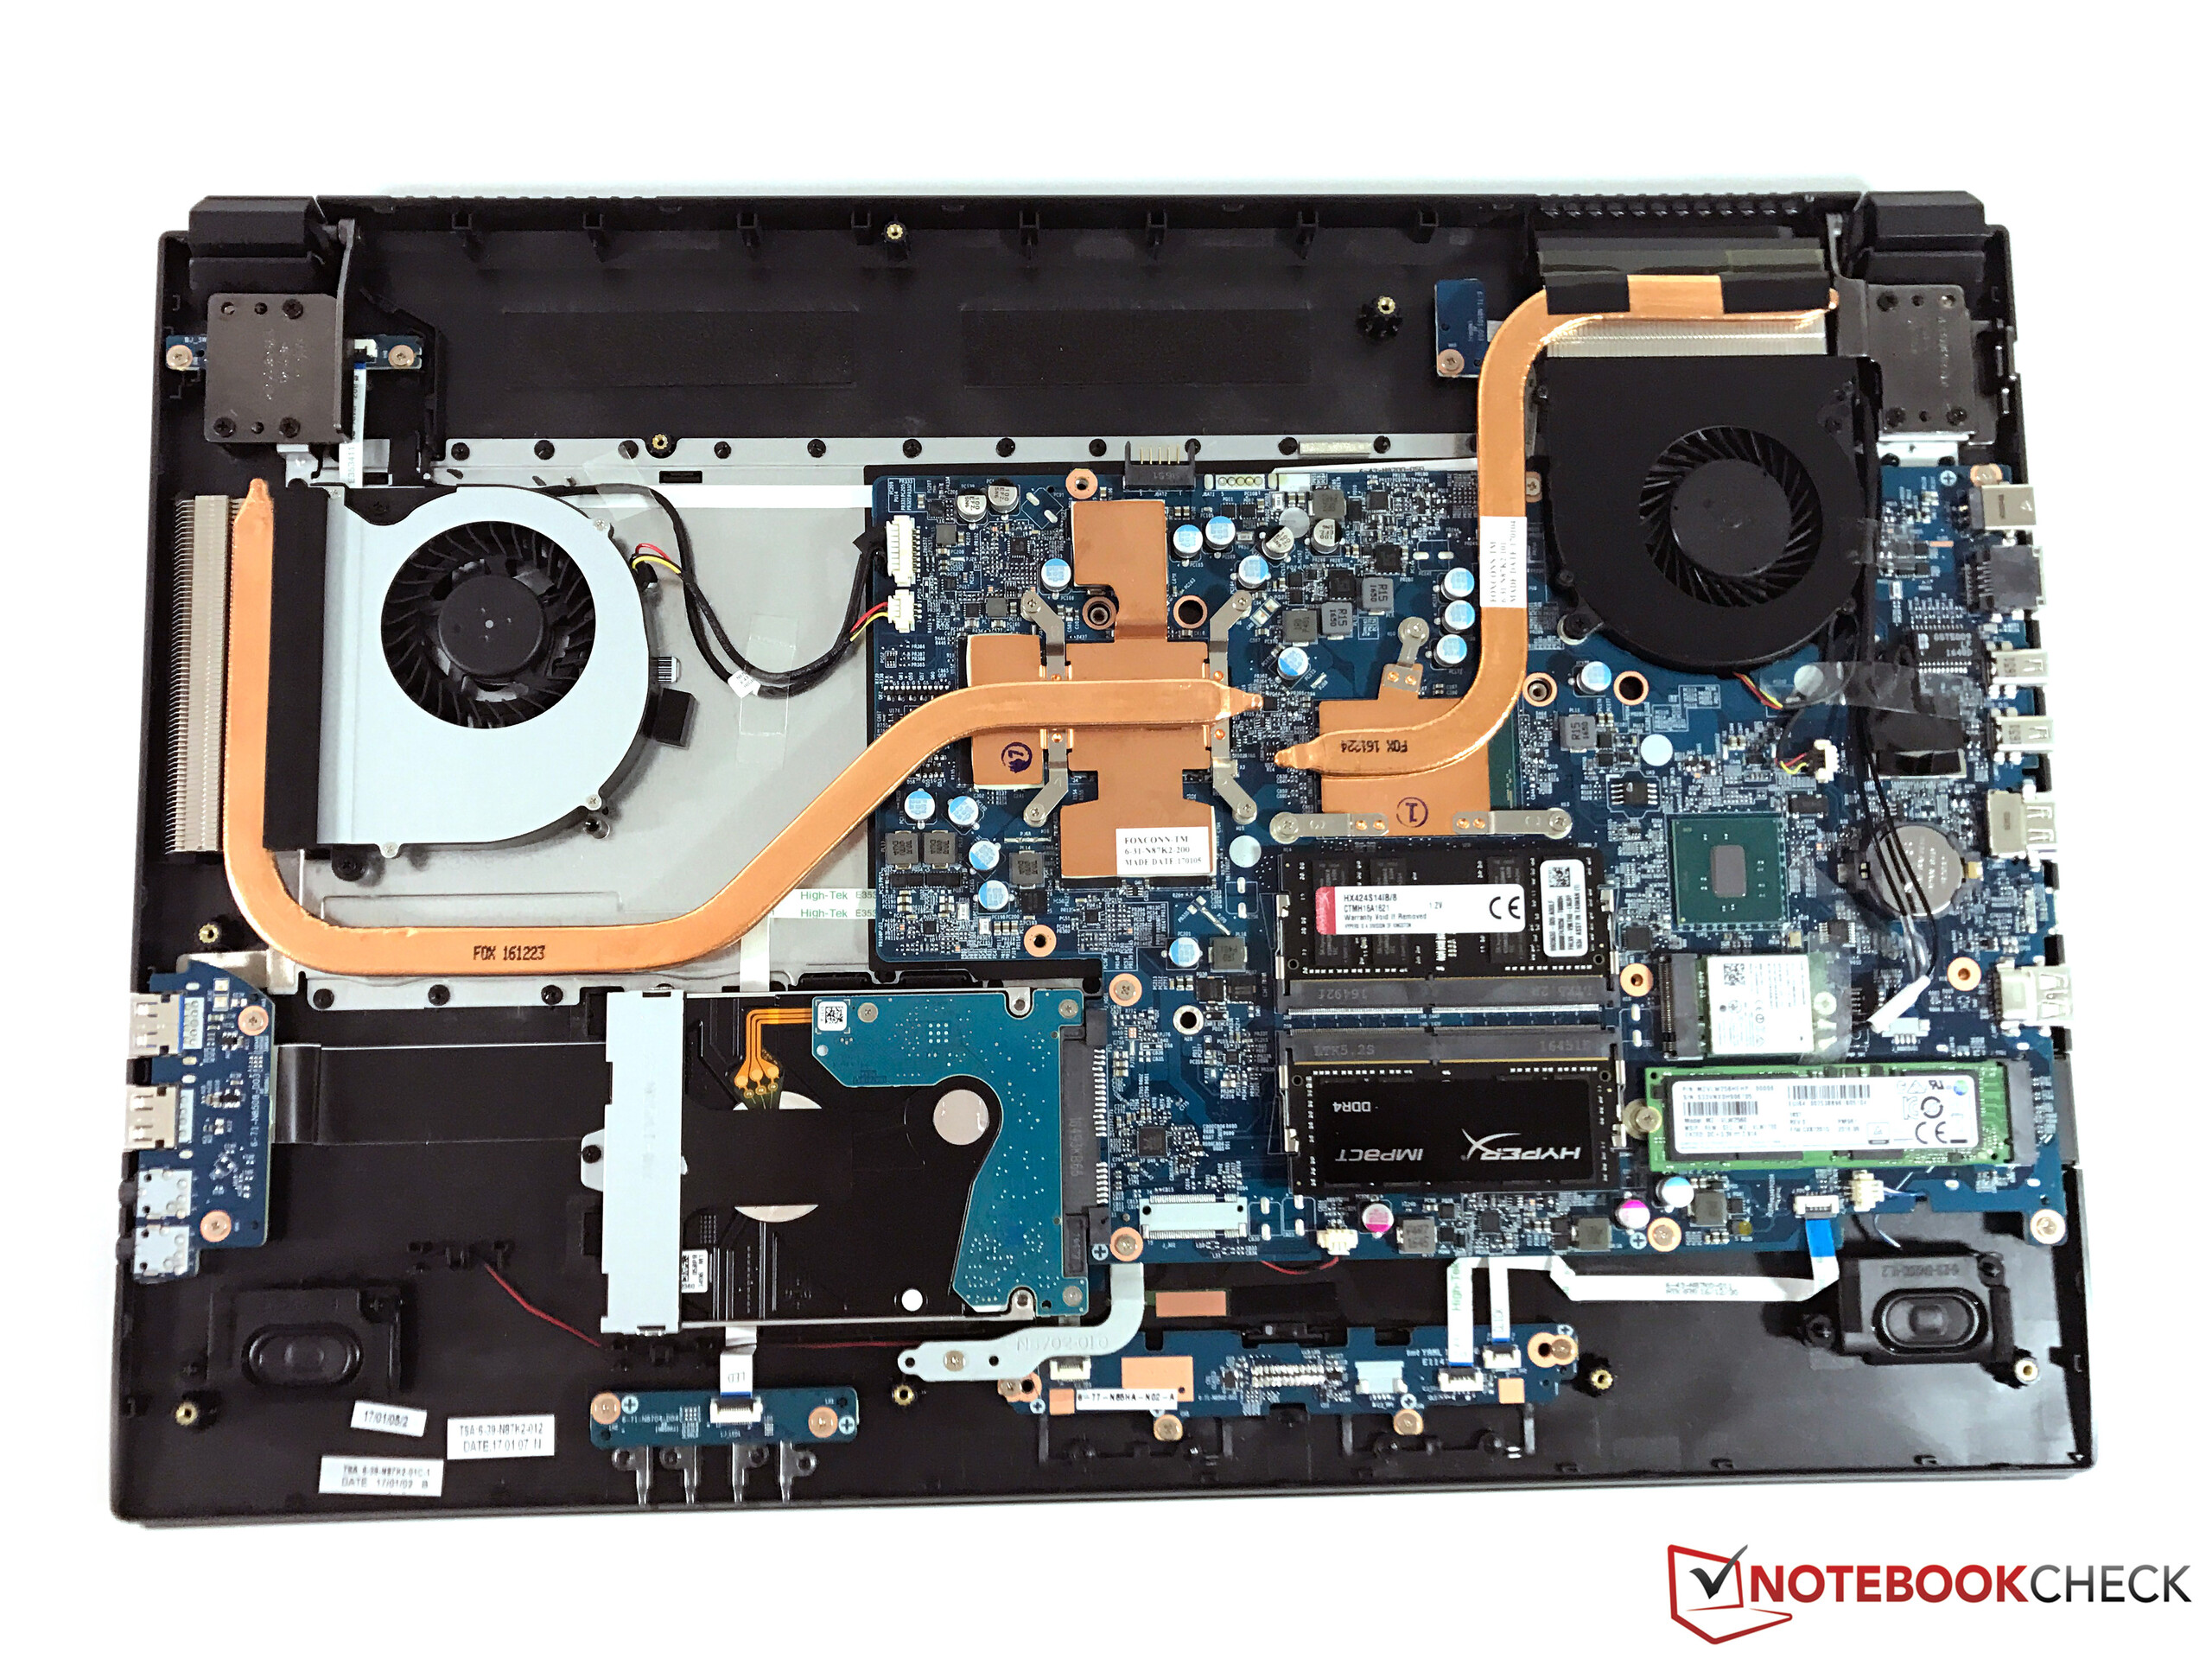
Os pontos fracos claramente incluem a temperatura e a geração de ruído. A carcaça ofereceria suficiente espaço para um sistema de resfriamento mais potente, mas ambas as ventoinhas pequenas fazem muito ruído e a carcaça também esquenta muito. Também há necessidade de melhorias nos conectores (sem Thunderbolt), e procuramos por recursos de jogos particulares como G-Sync em vão aqui.
No geral, o Nexoc G739, com certeza não é um mal portátil para jogos, mas dar uma olhada na concorrência não pode machucar.
Pro
Contra
Thanks to the powerful hardware, the Nexoc G739 is a capable entry-level notebook. The graphics card harmonizes well with the Full-HD display, which is sufficiently bright and otherwise achieves decent results as well. But in many other areas, such as for example the connections, casing, and input devices, the test device is only average.
In terms of the performance, the Nexoc G739 does not show any weaknesses and handles also demanding games, but the emissions of the Clevo-N870HK1 Barebones could be improved.
The weak points clearly include the temperature and noise generation. The casing would offer sufficient space for a stronger cooling system, but both small fans make a lot of noise and the casing gets very warm as well. There is also need for improvements in the connectors (no Thunderbolt), and we looked for particular gaming features such as G-Sync here in vain as well.
Overall, the Nexoc G739 sure is not a bad gaming notebook, but a look at the competition cannot hurt.
Nexoc G739
- 06/23/2018 v6 (old)
Andreas Osthoff