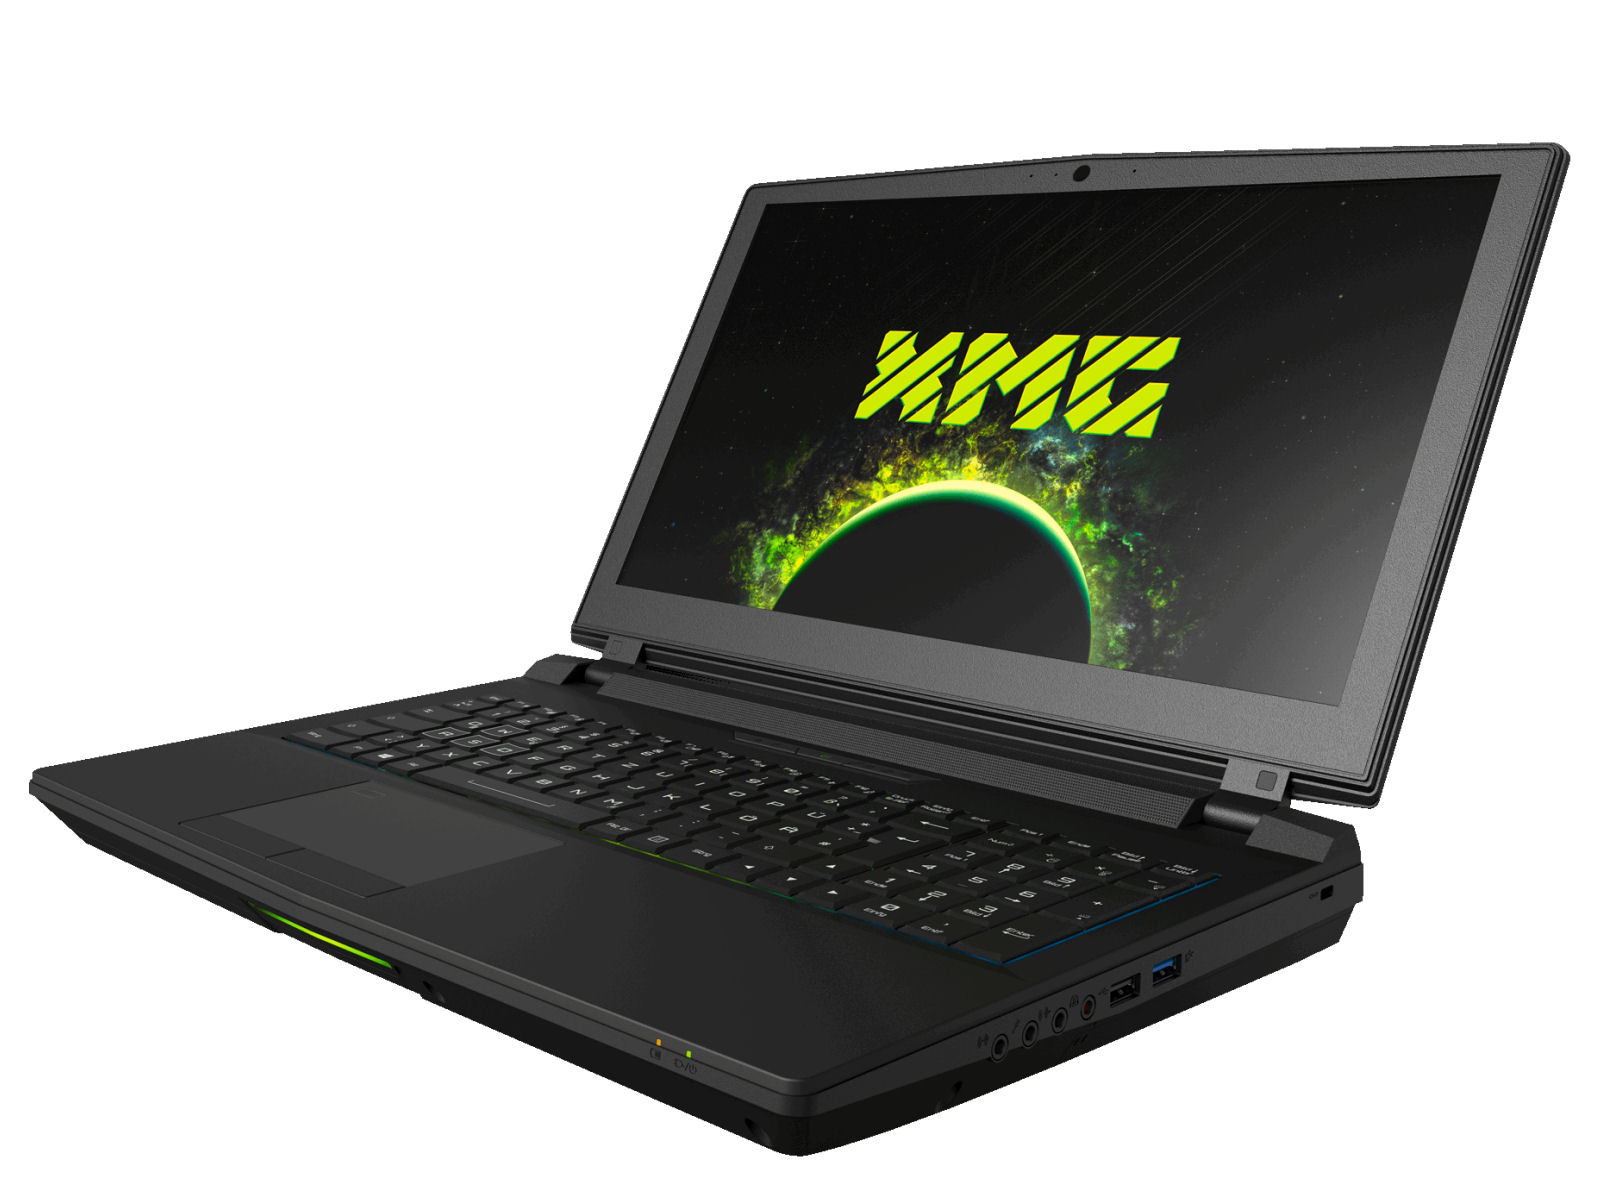
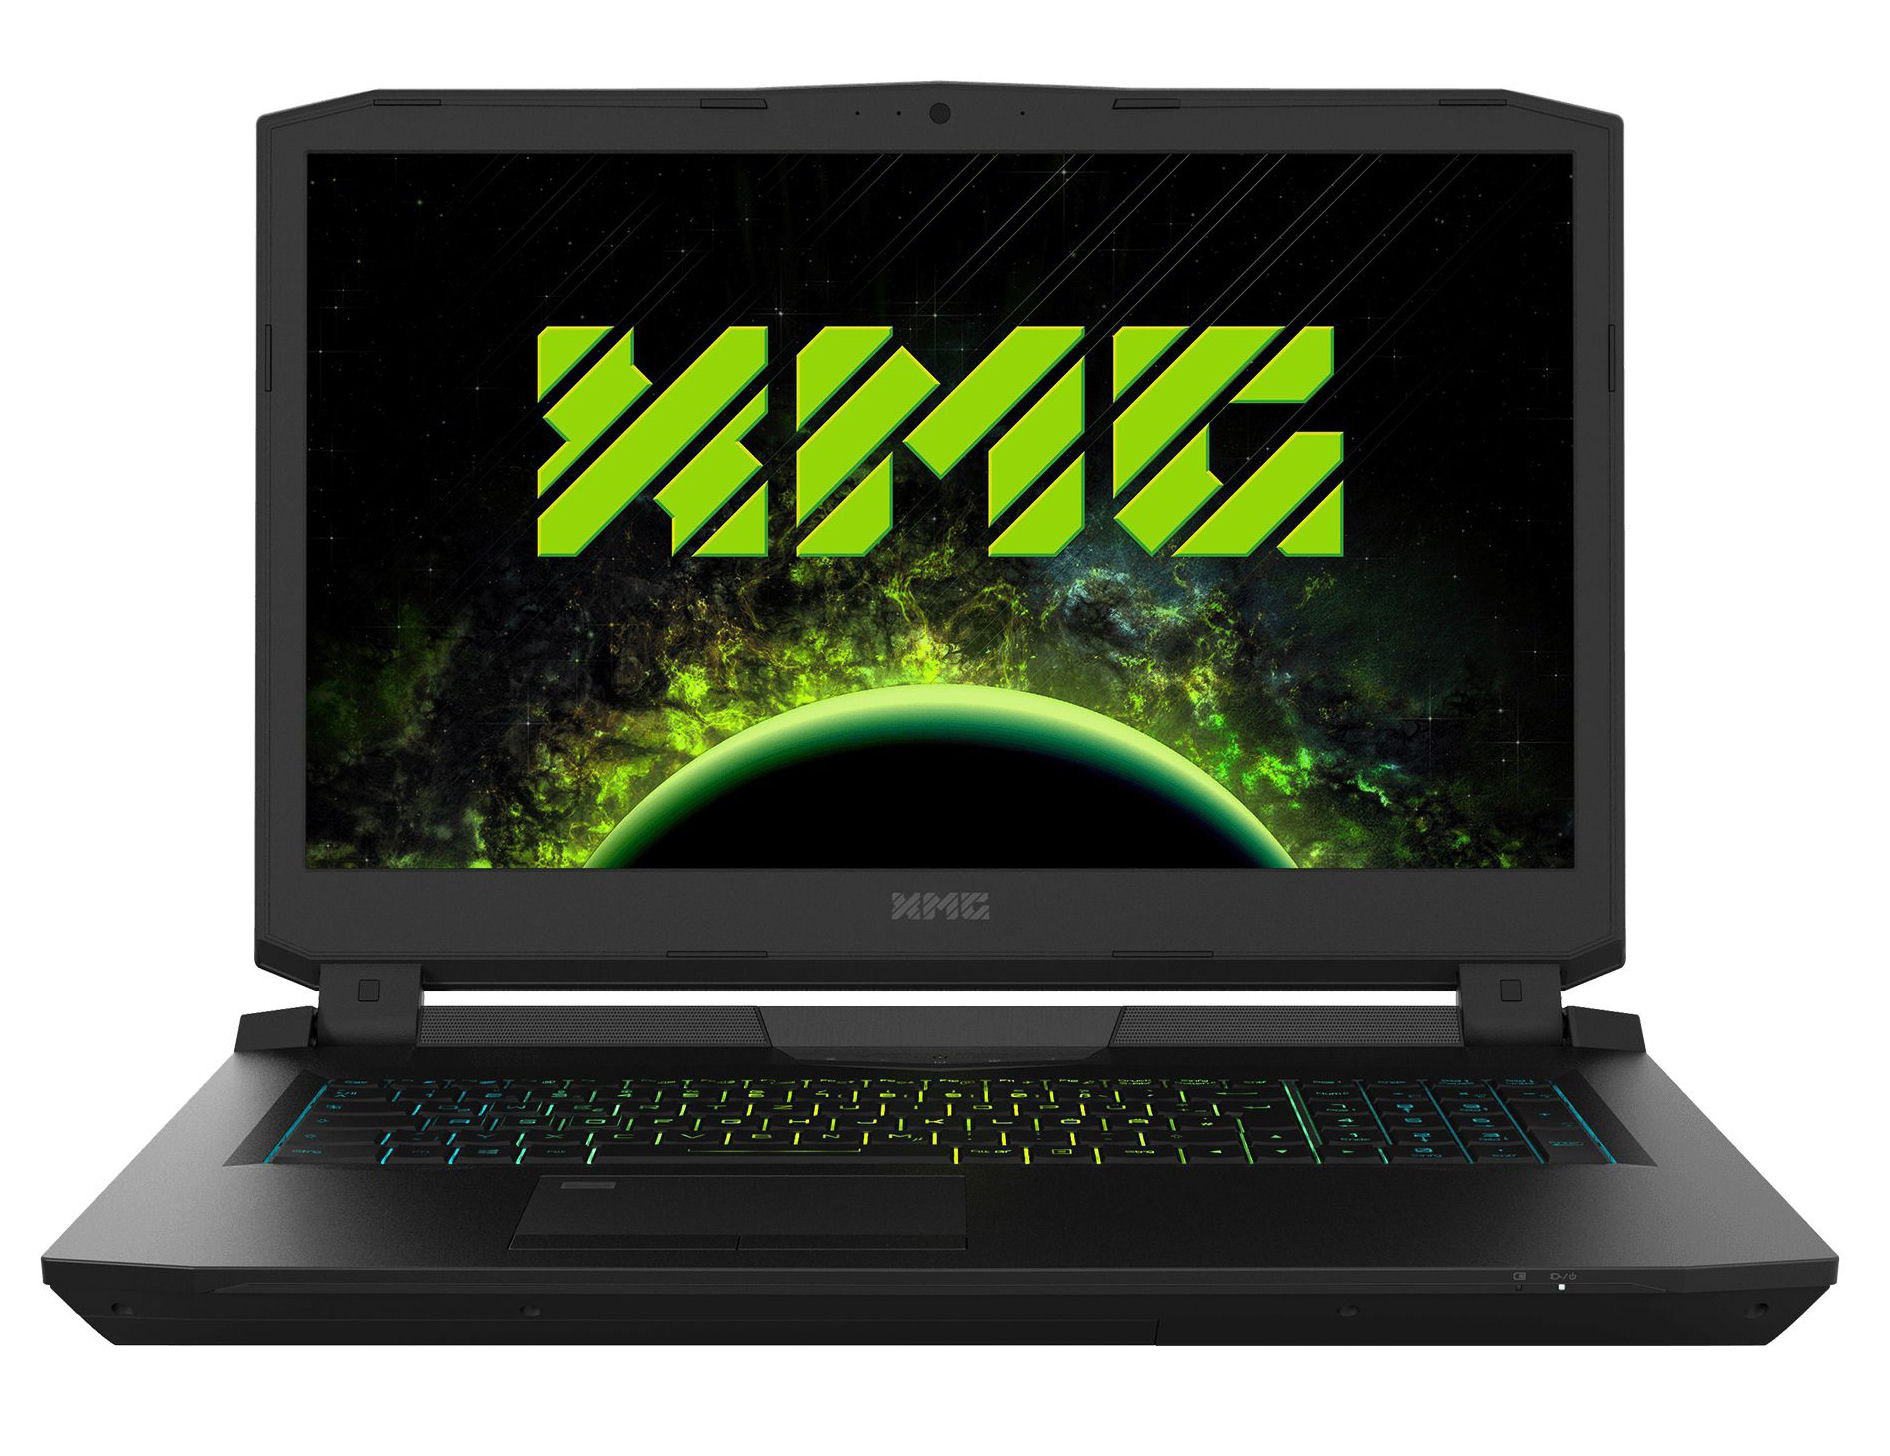
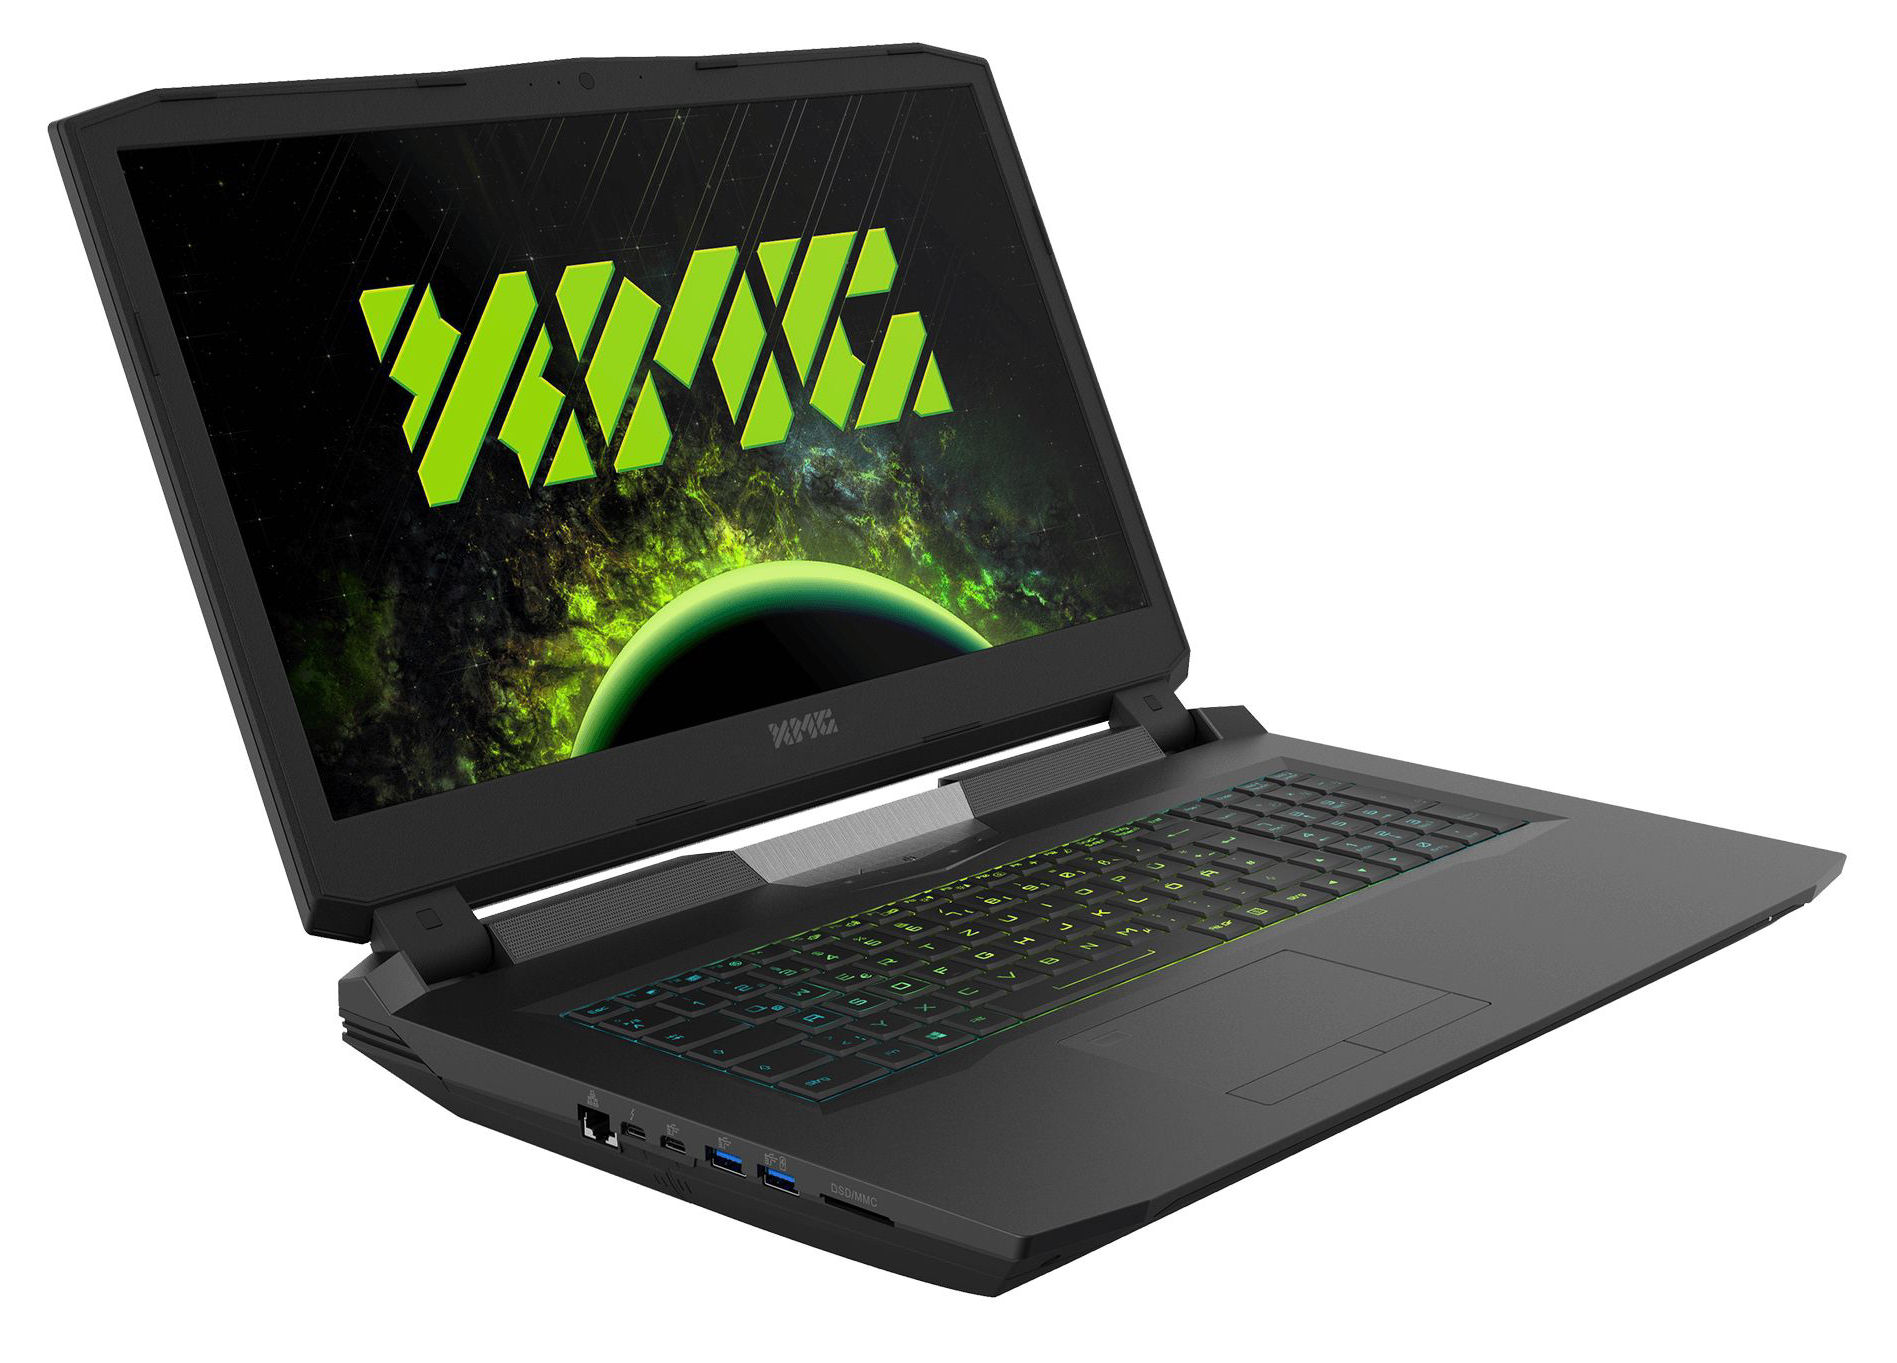
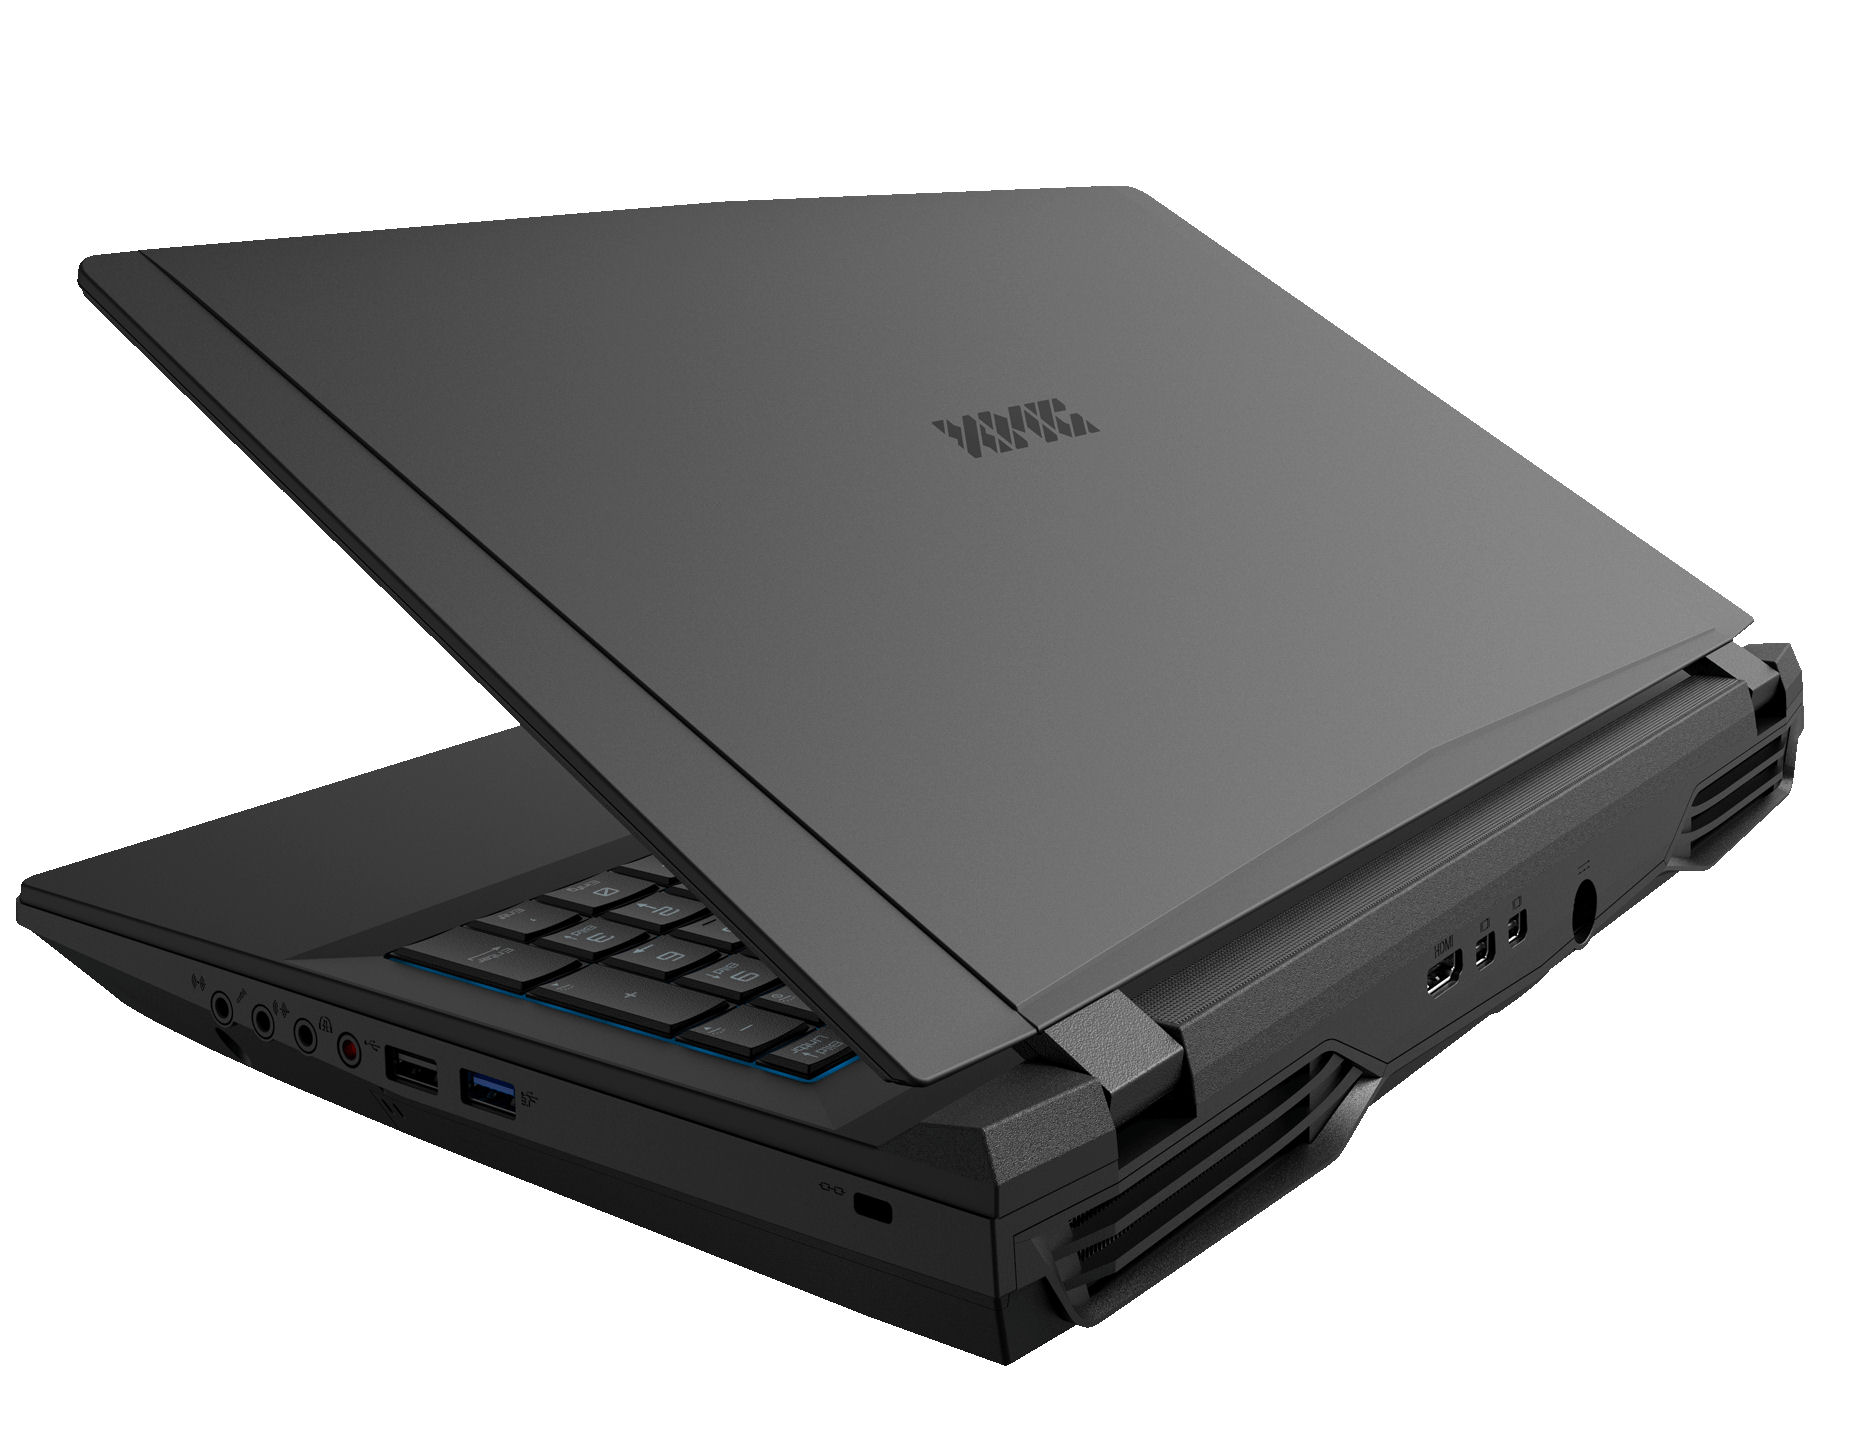
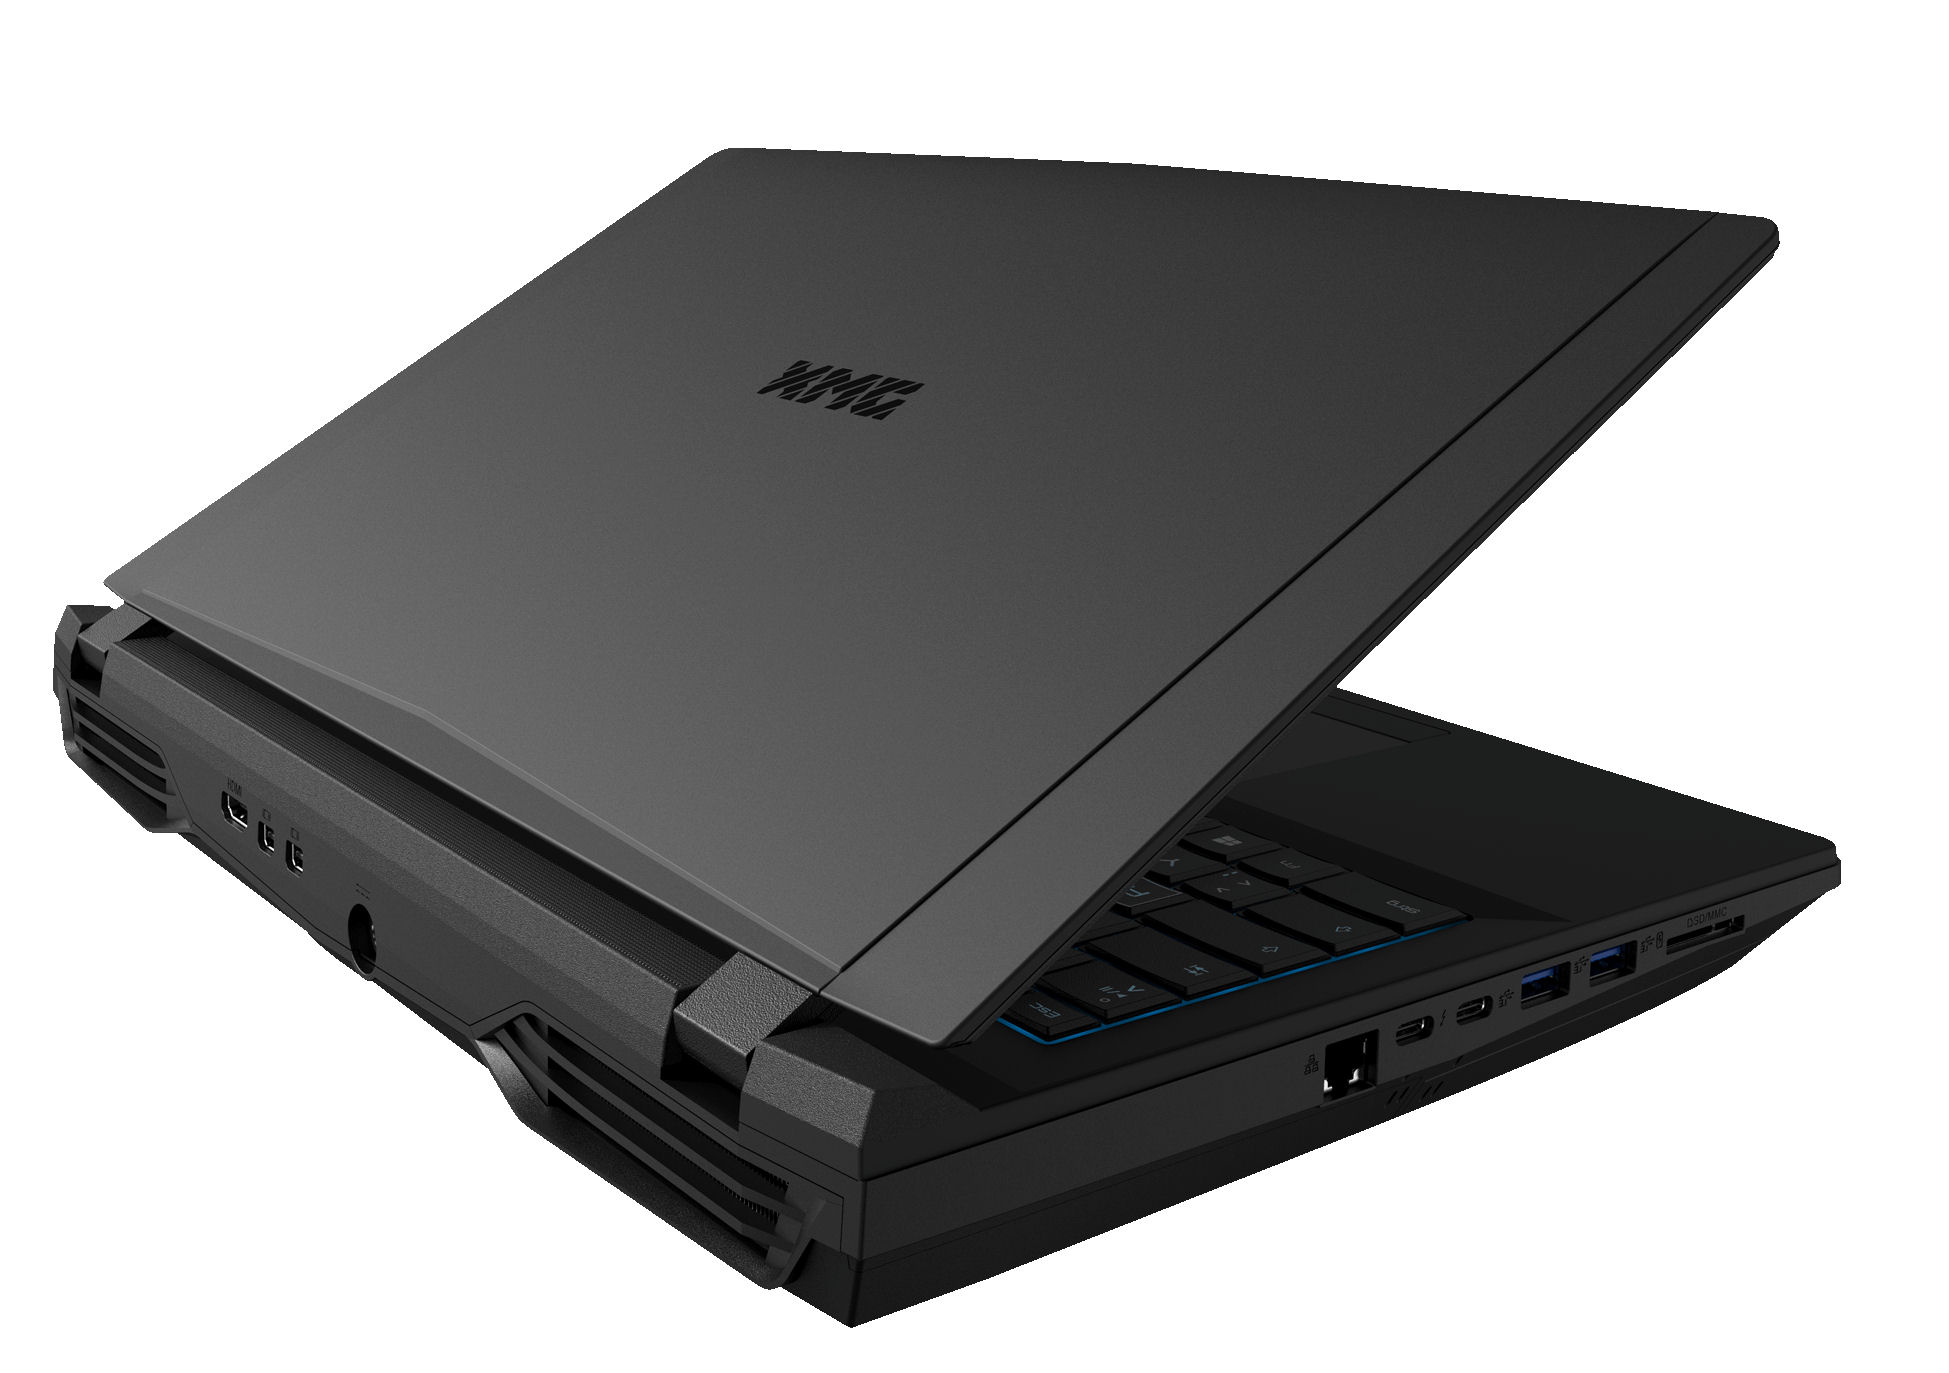
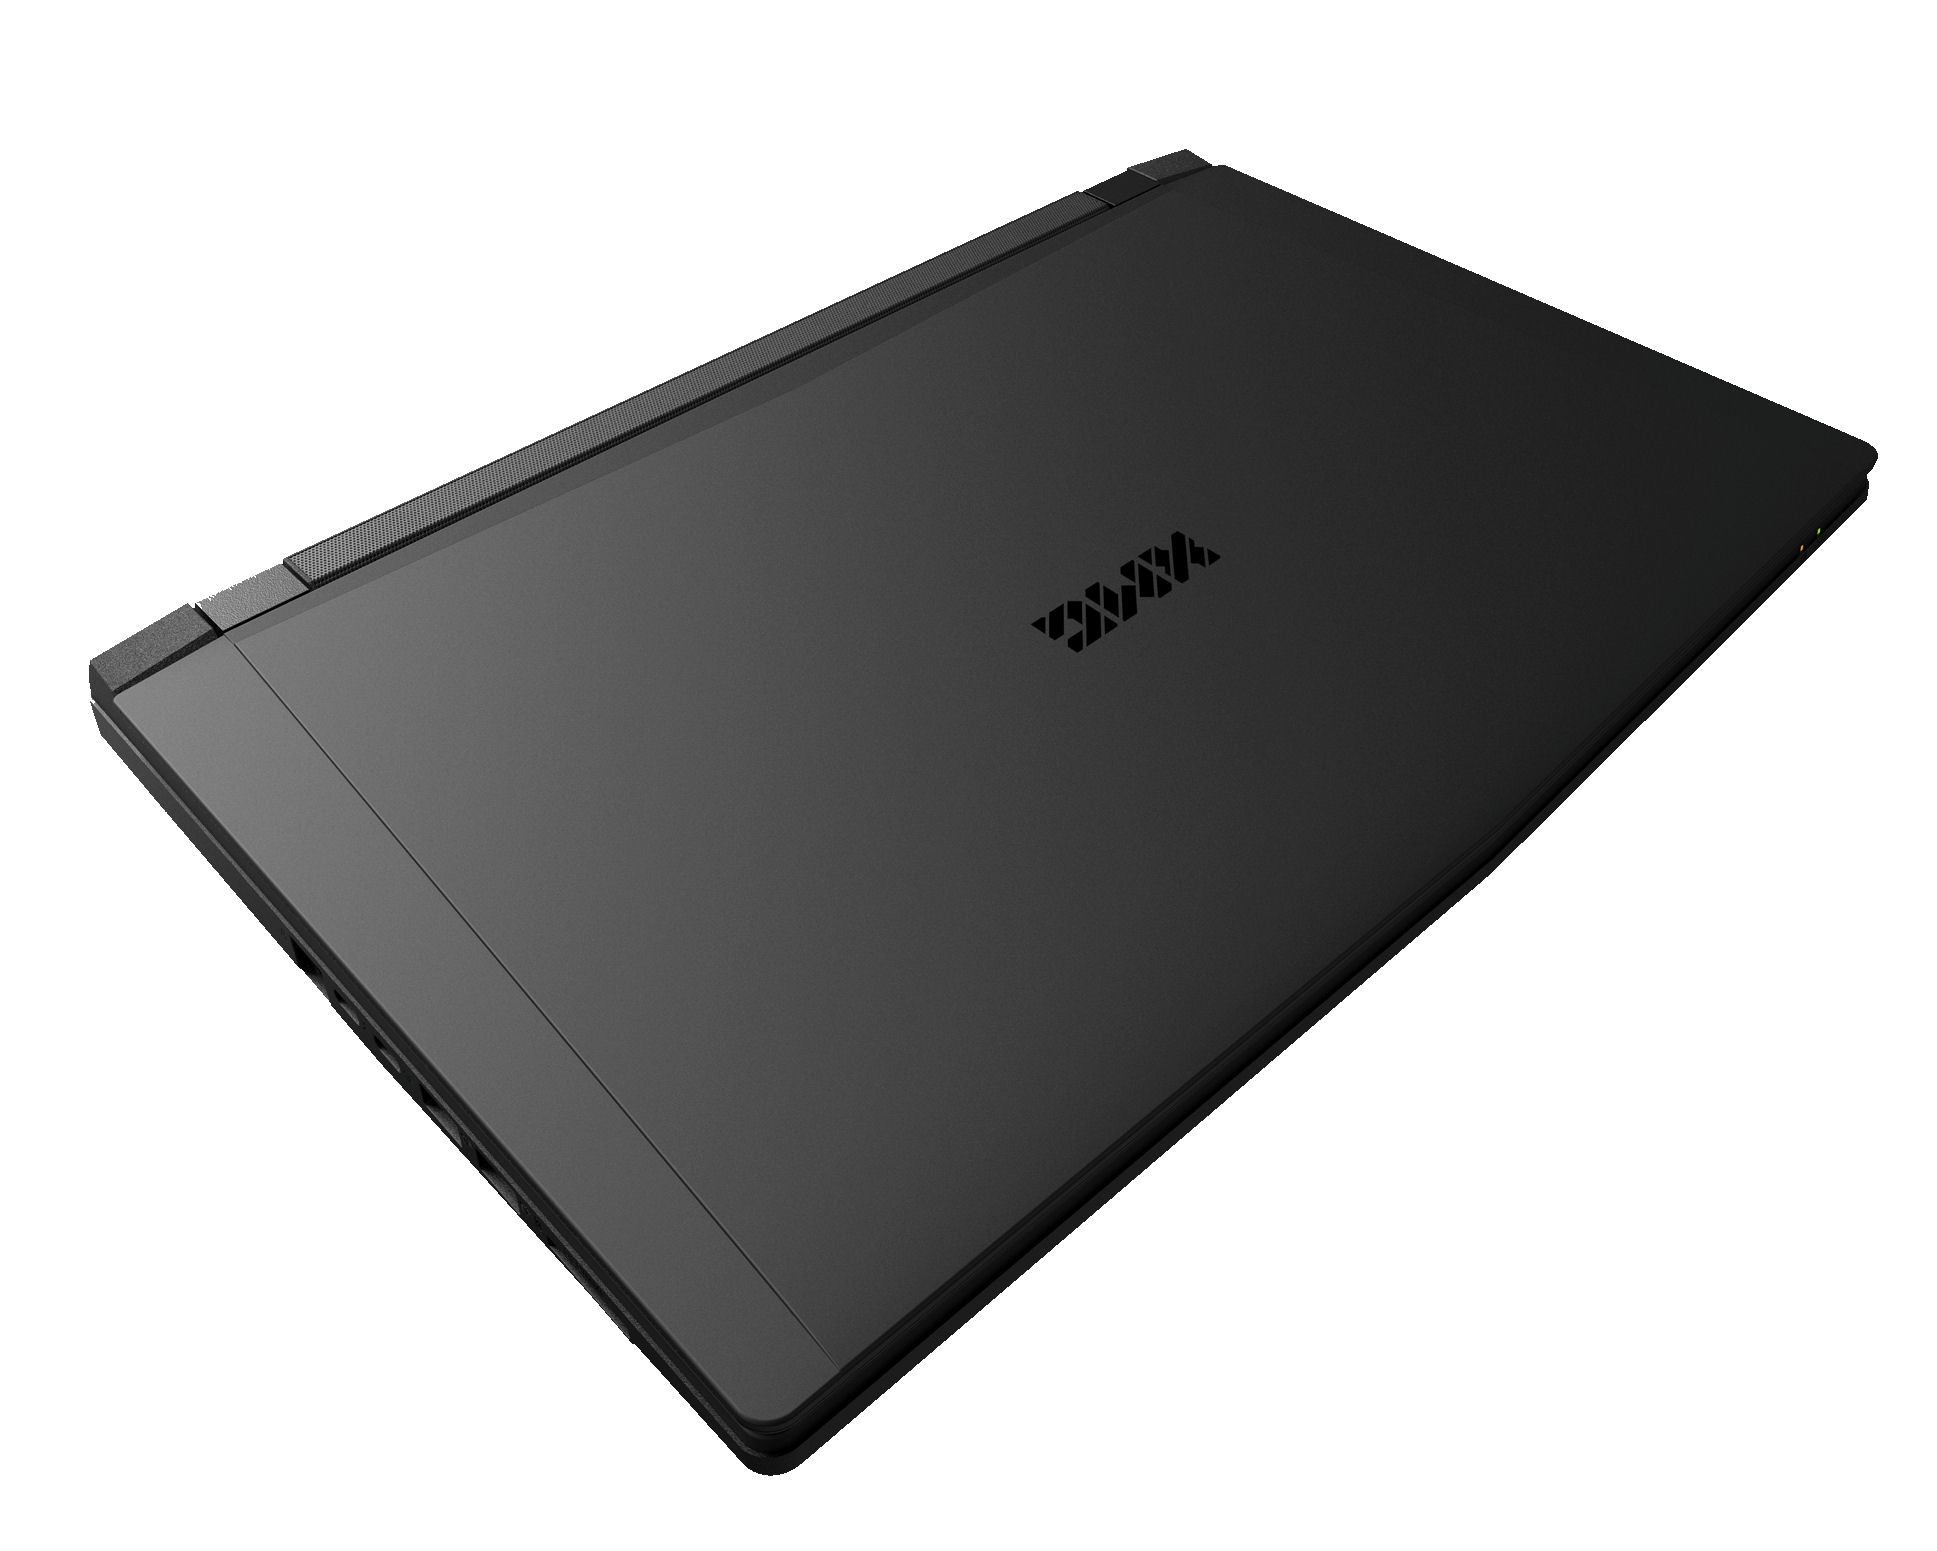
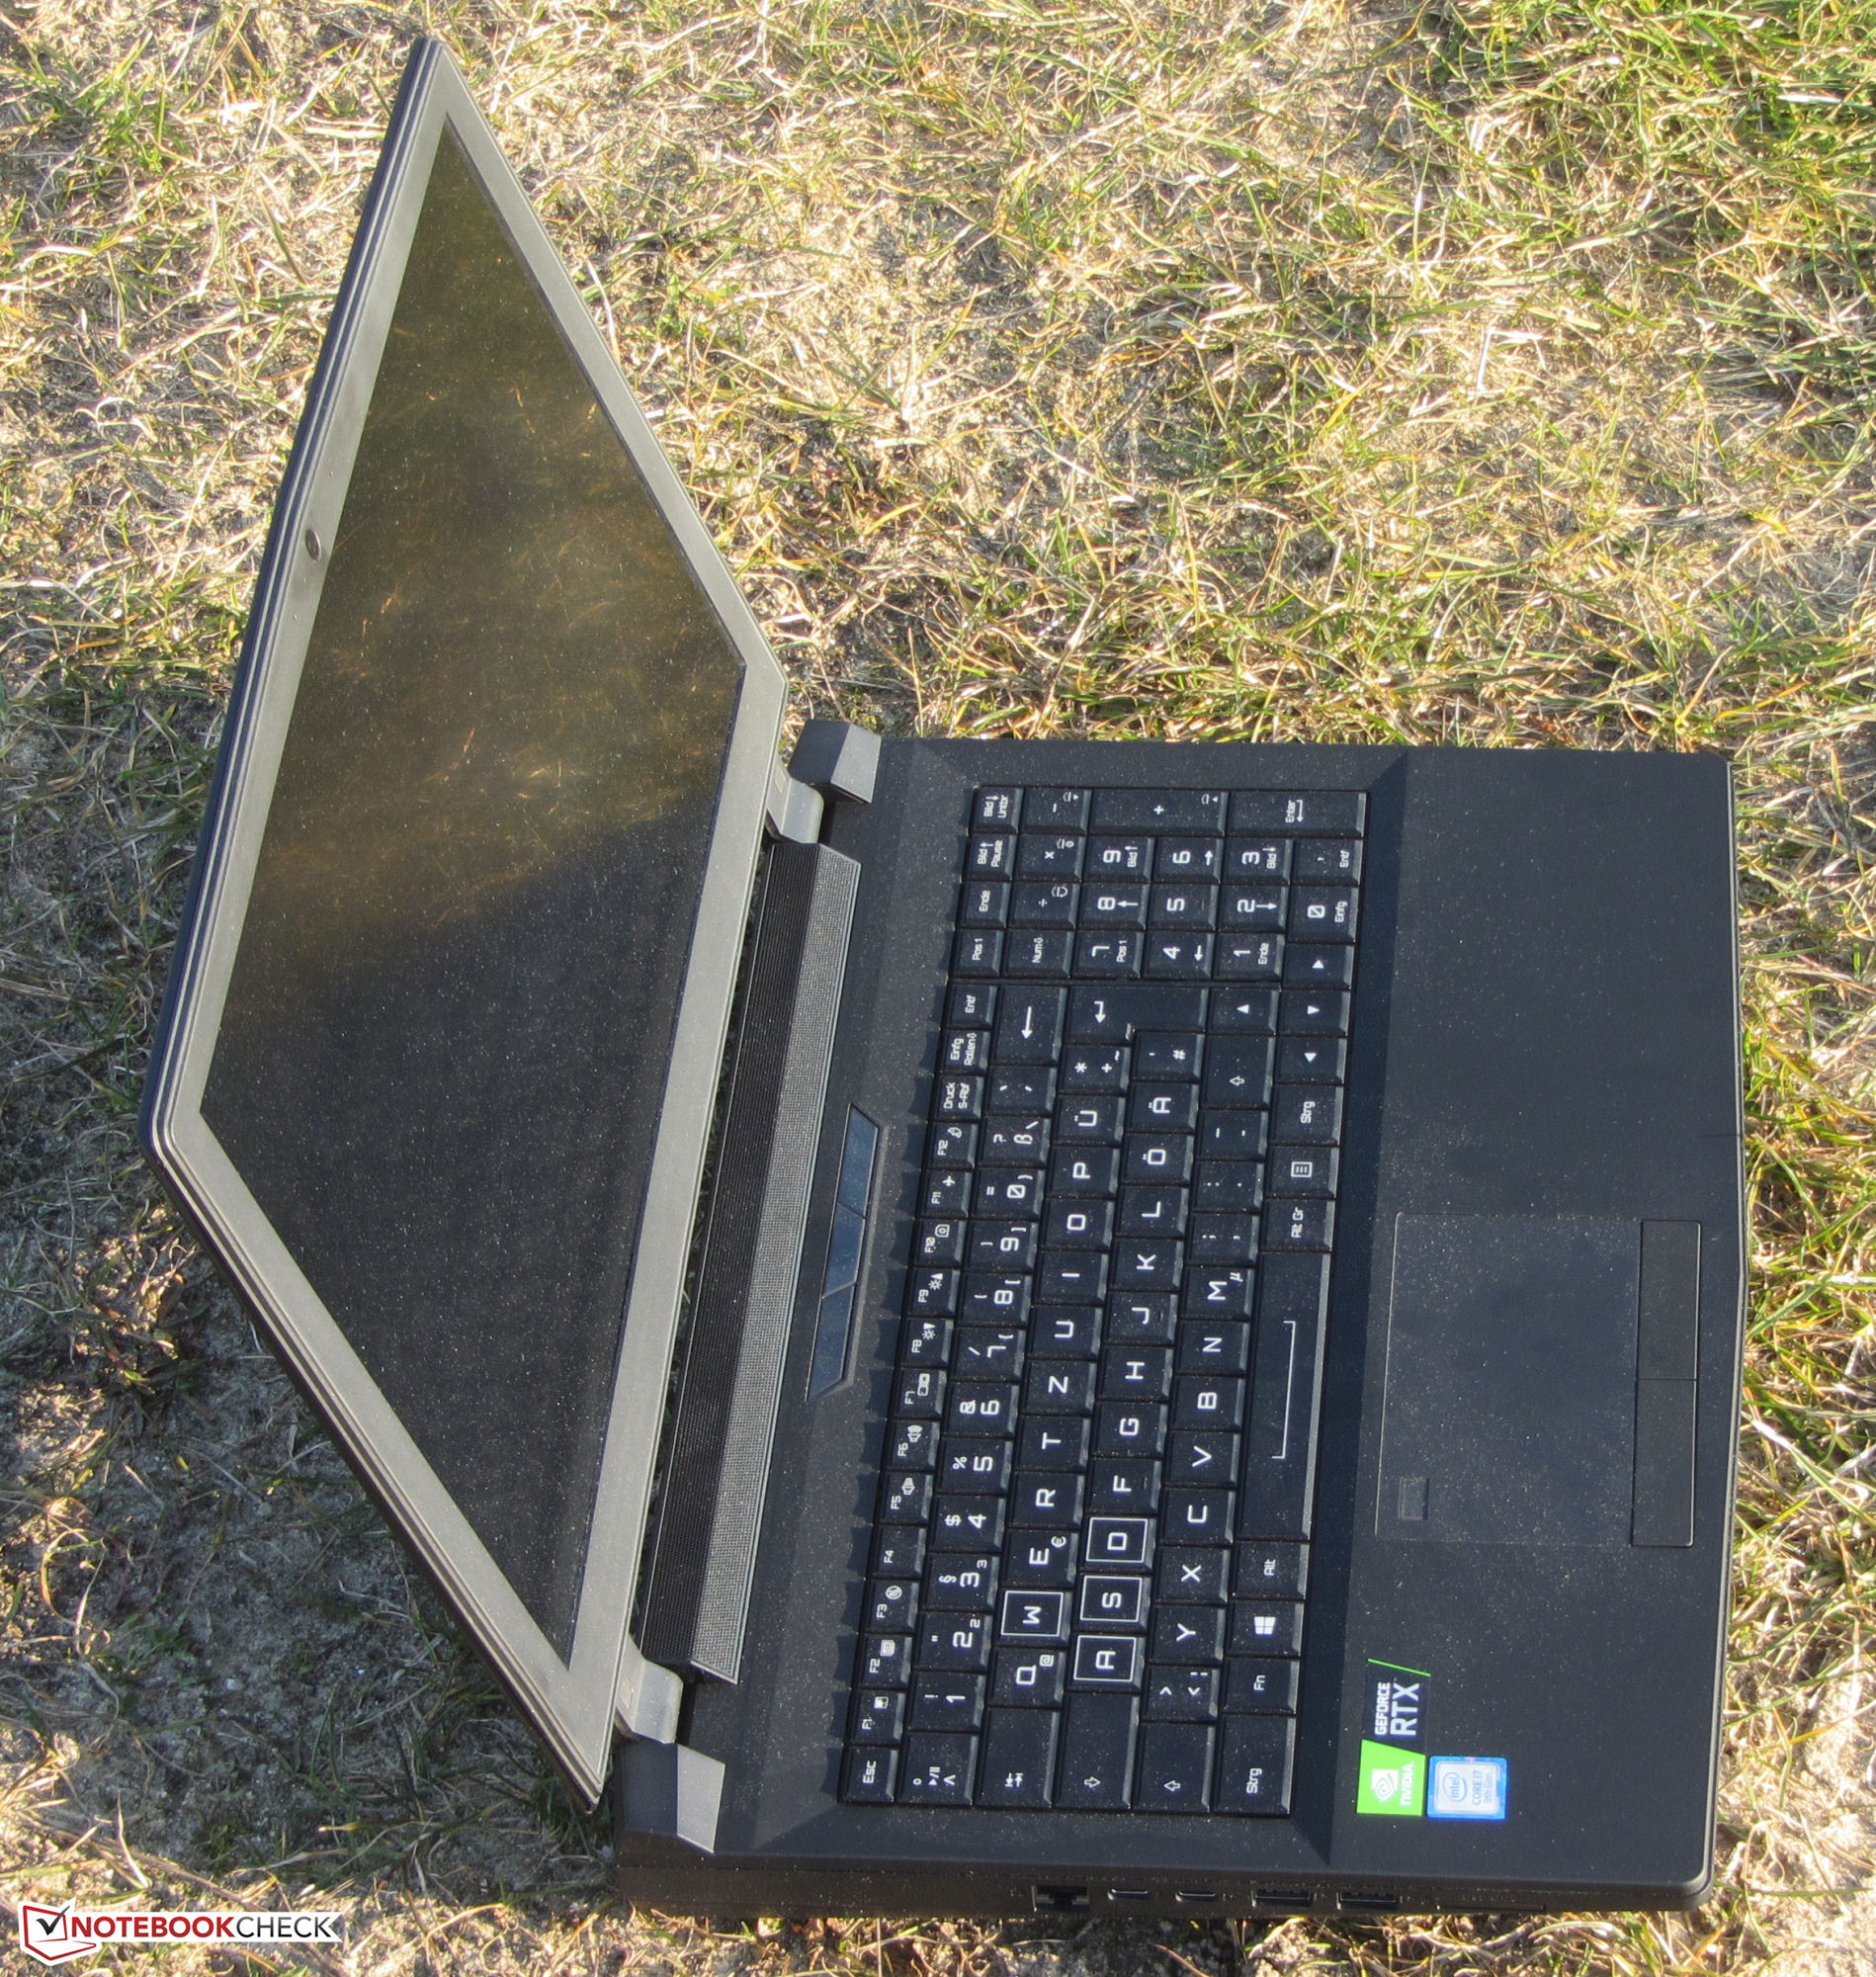
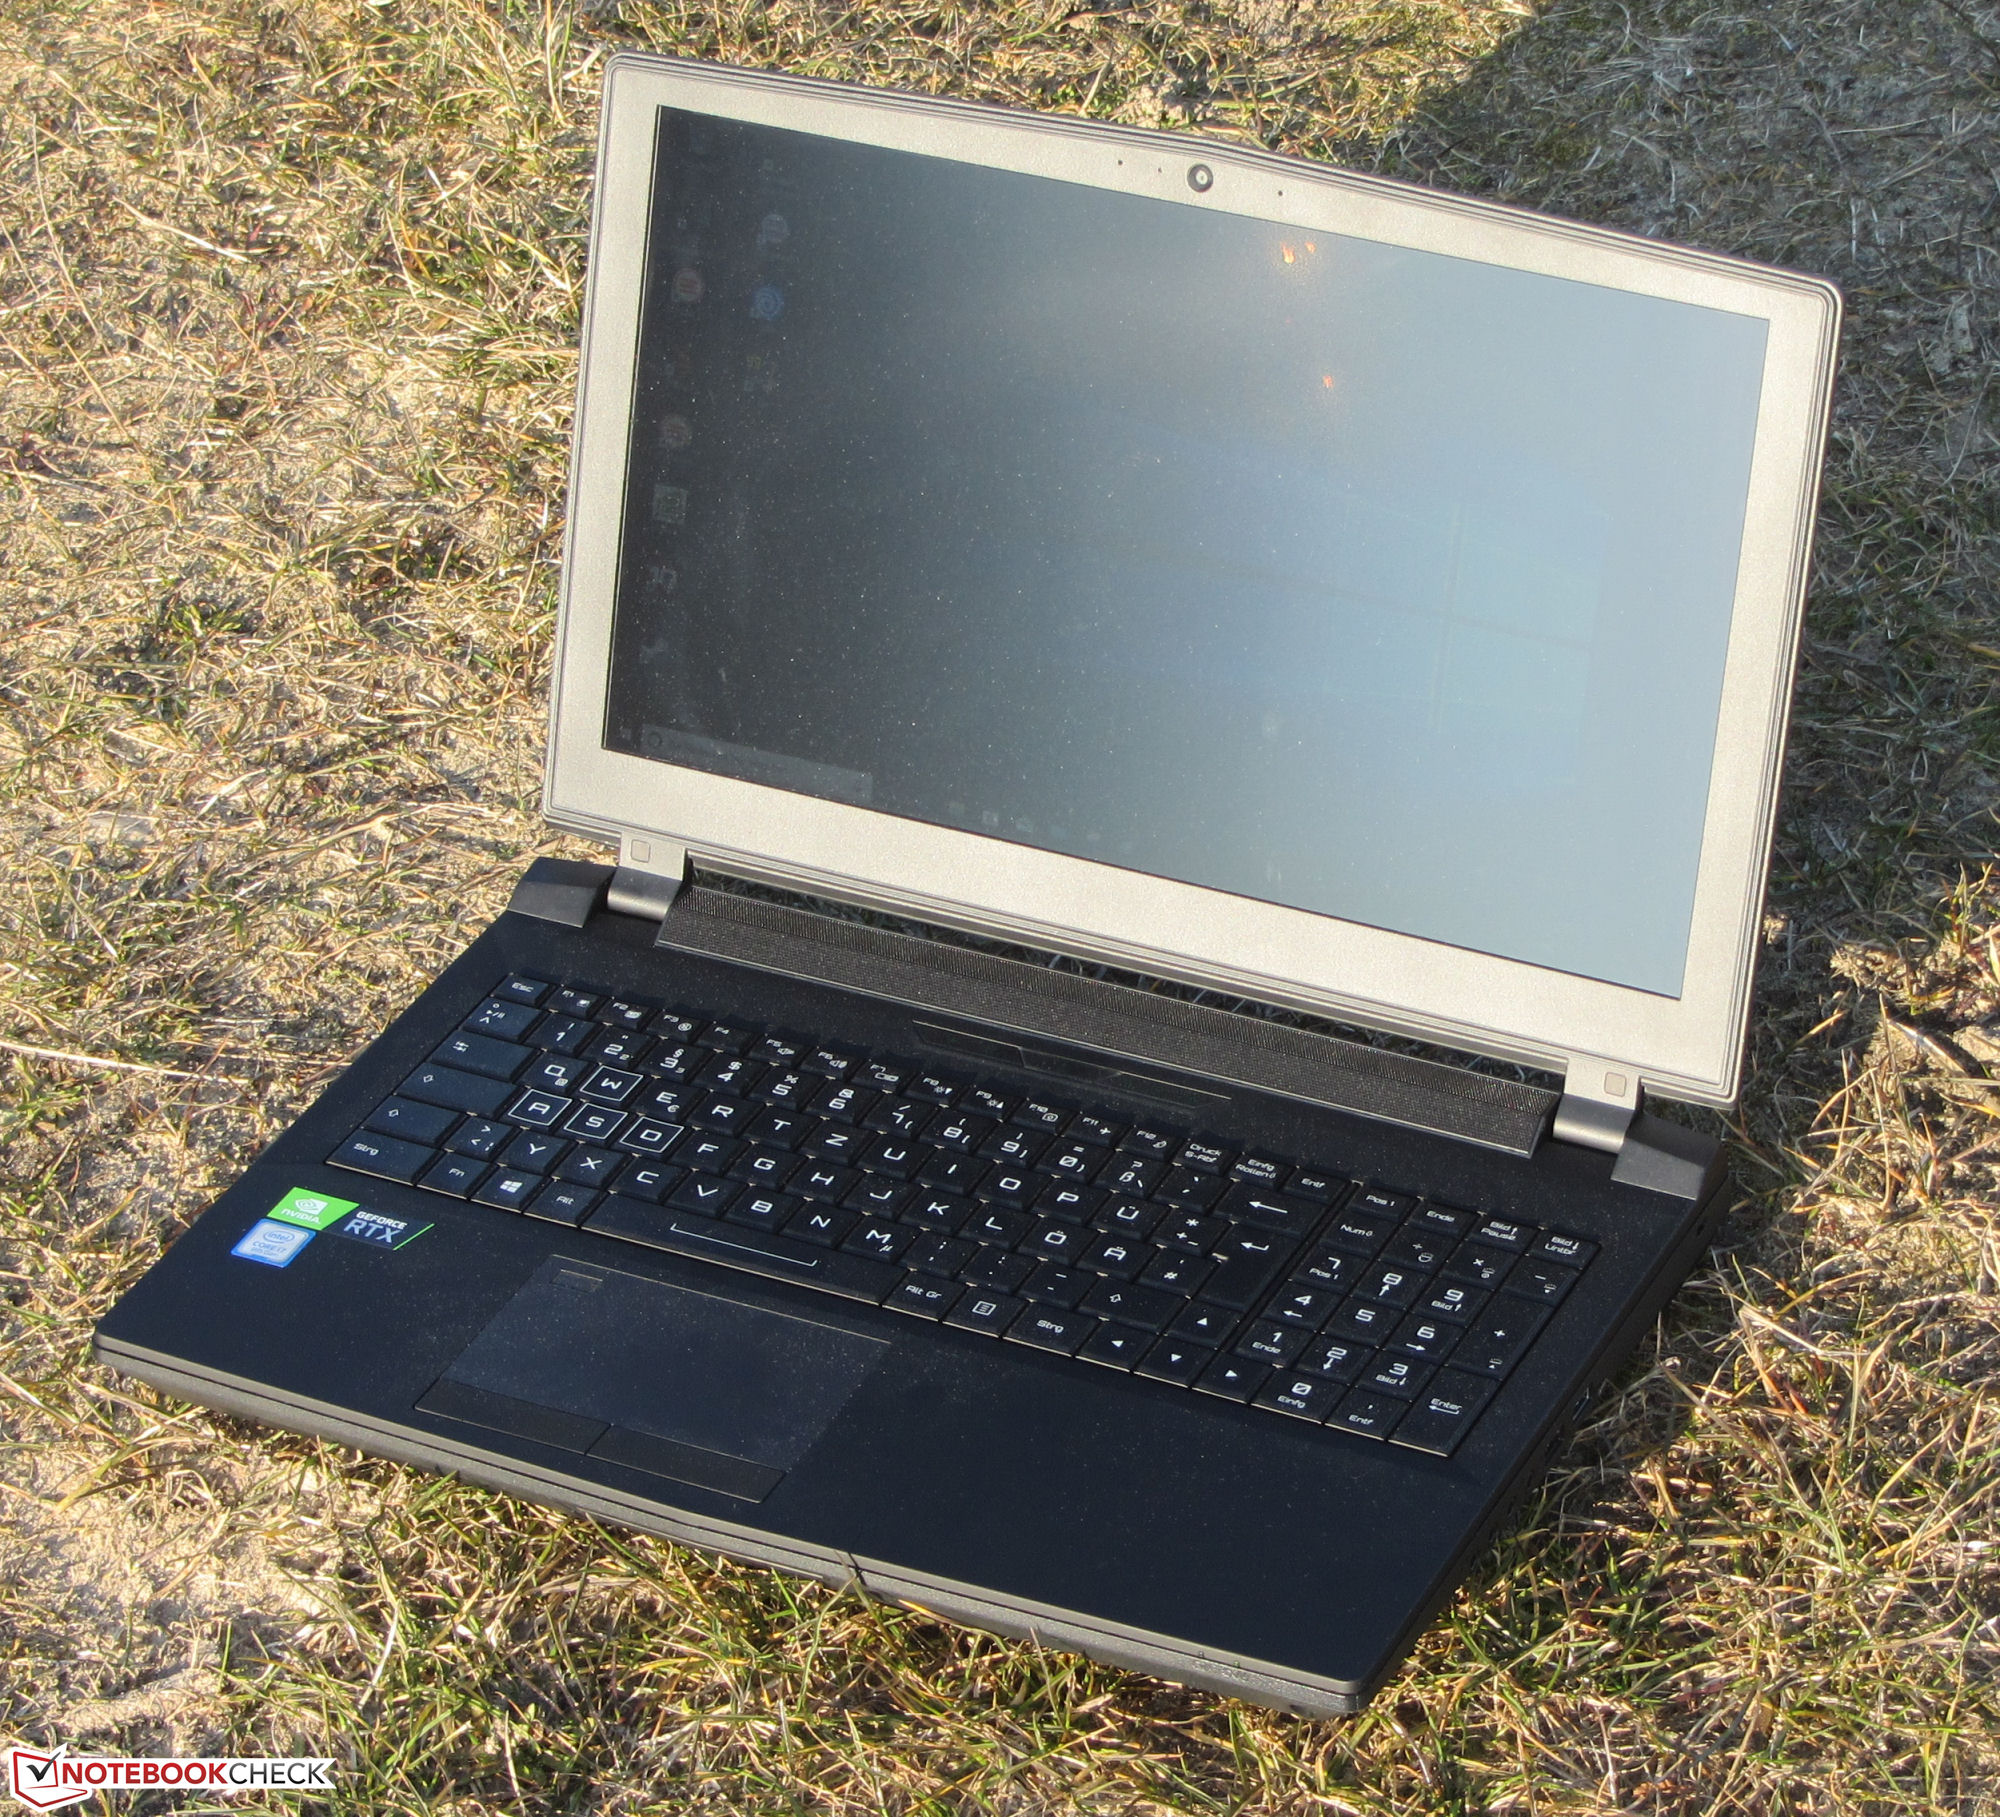
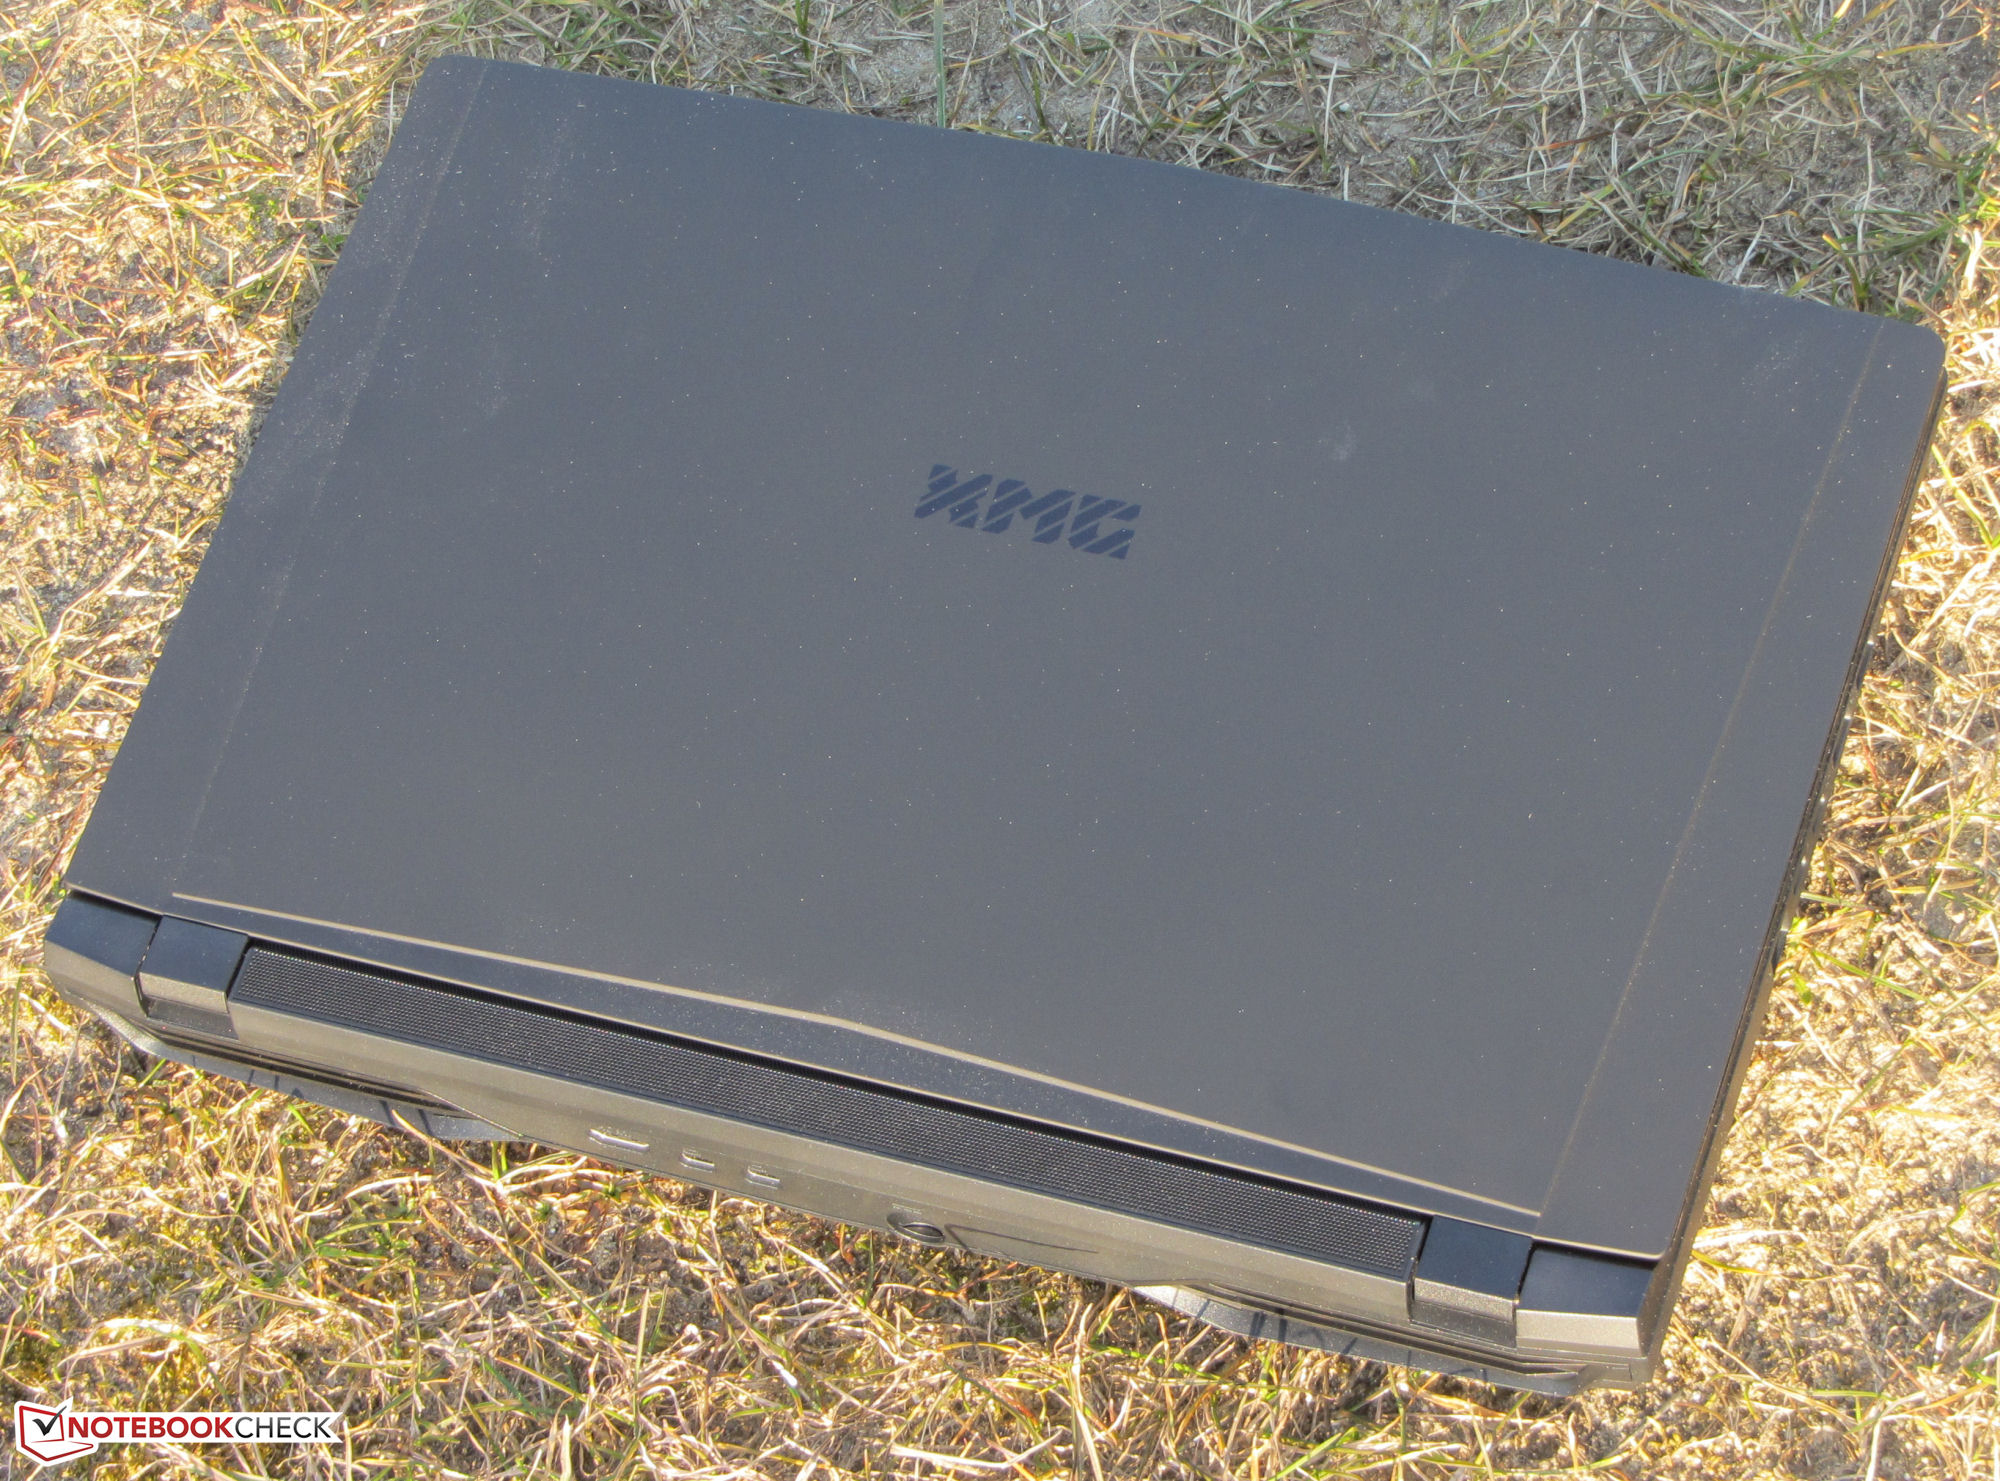
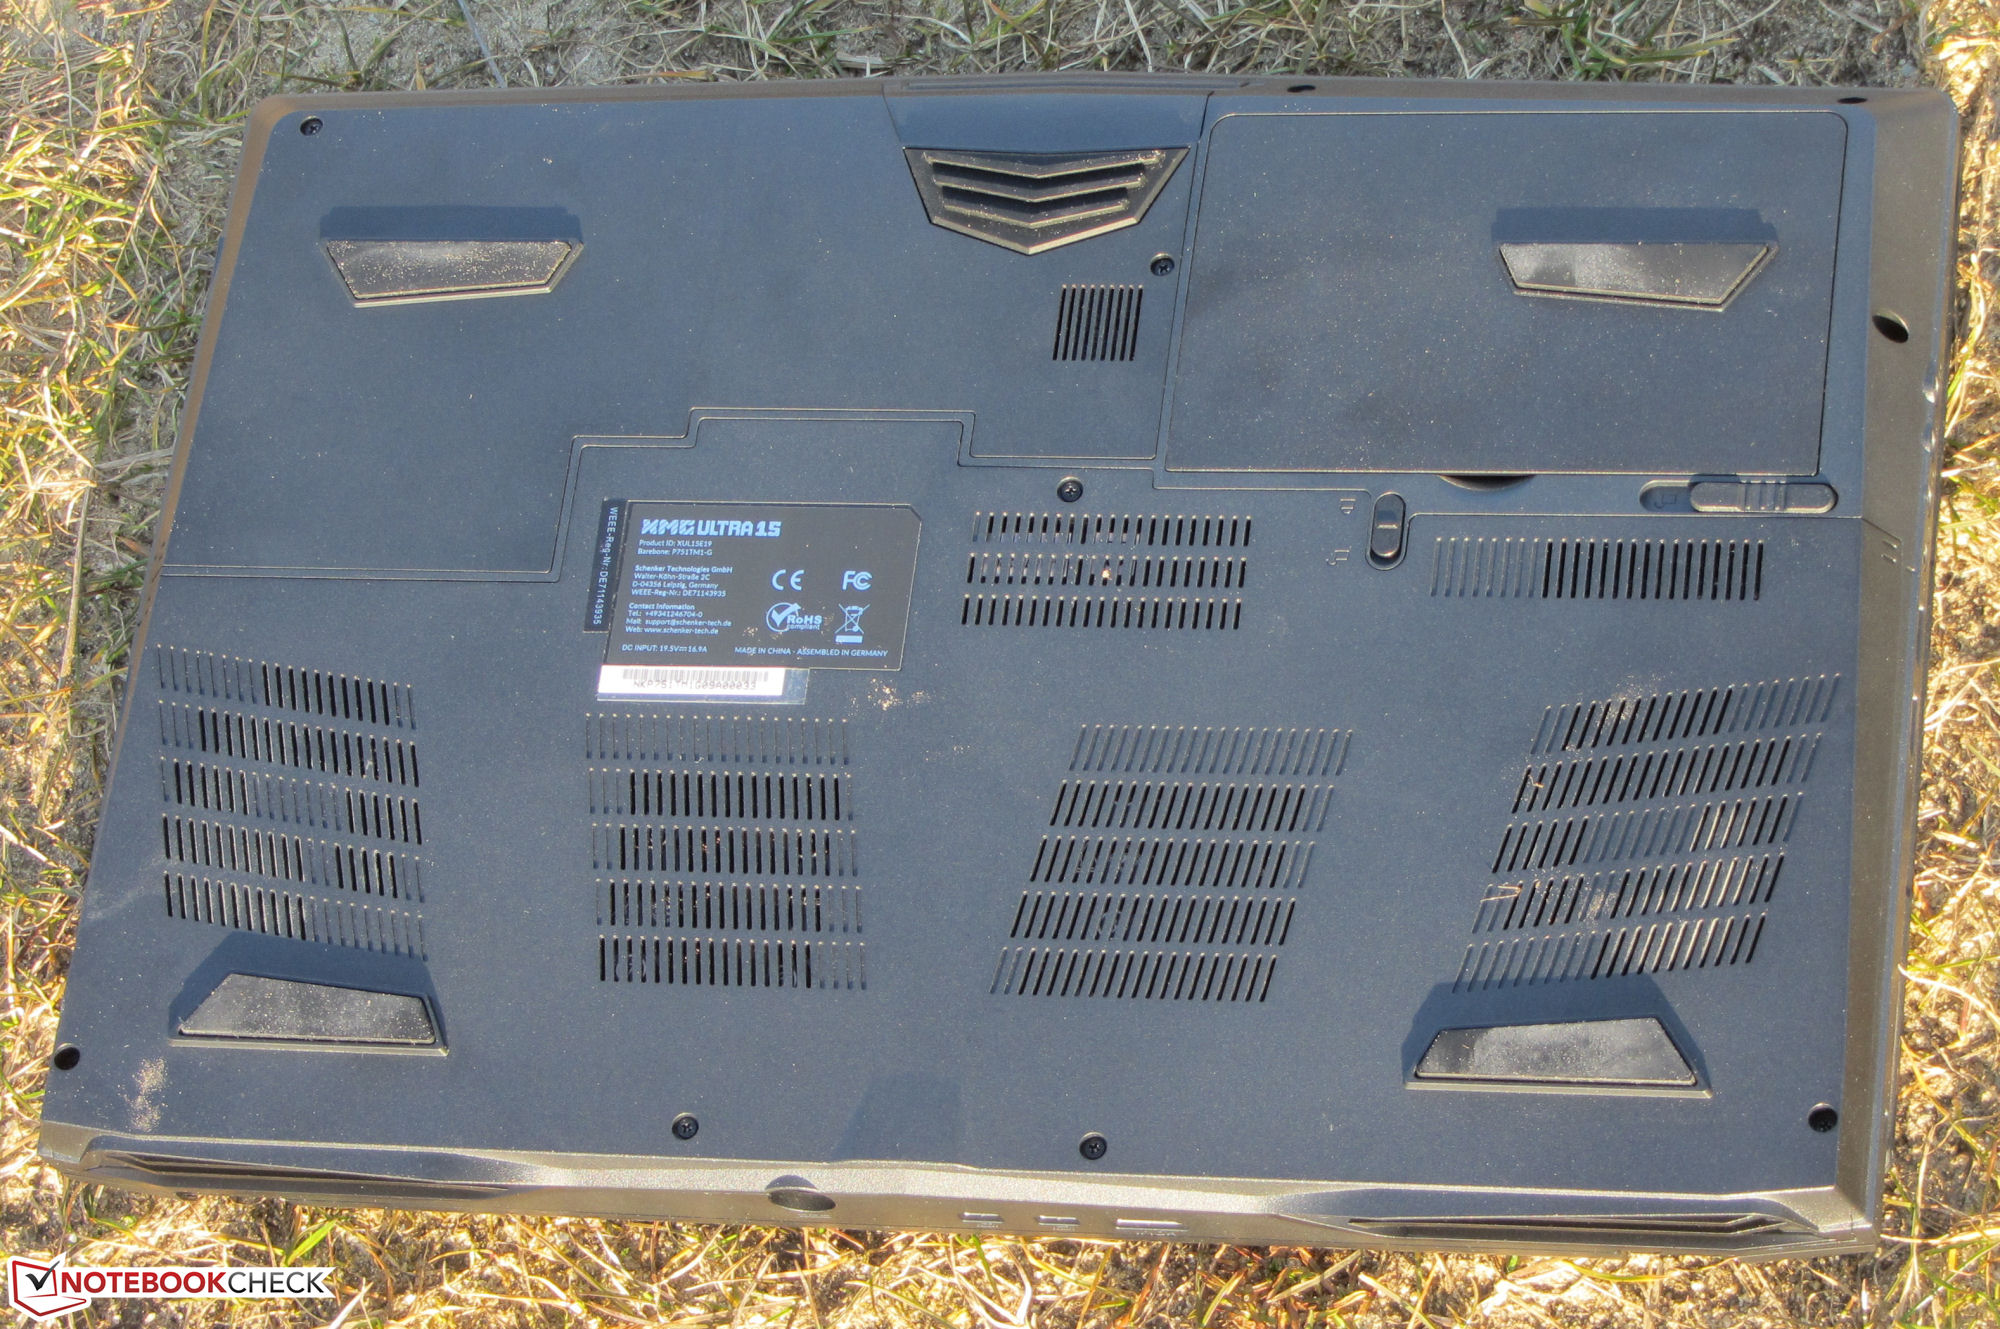
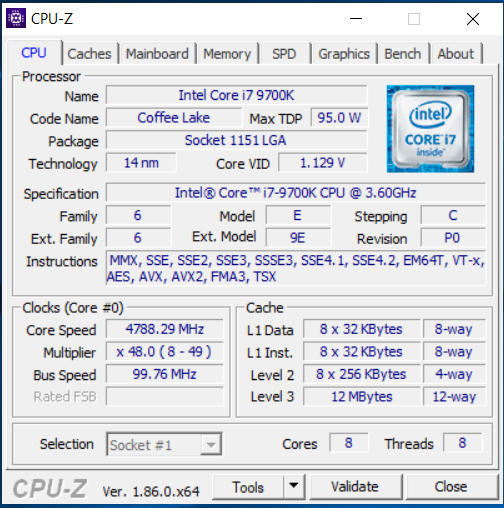
Breve Análise do Portátil Schenker XMG Ultra 15 (i7-9700K, RTX 2070) Clevo P751TM1-G
| SD Card Reader | |
| average JPG Copy Test (av. of 3 runs) | |
| Gigabyte Aero 15-X9 (Toshiba Exceria Pro SDXC 64 GB UHS-II) | |
| Schenker XMG Ultra 15 Turing (Toshiba Exceria Pro SDXC 64 GB UHS-II) | |
| Schenker XMG Ultra 15 (Toshiba Exceria Pro SDXC 64 GB UHS-II) | |
| Média da turma Gaming (20.9 - 210, n=55, últimos 2 anos) | |
| maximum AS SSD Seq Read Test (1GB) | |
| Gigabyte Aero 15-X9 (Toshiba Exceria Pro SDXC 64 GB UHS-II) | |
| Schenker XMG Ultra 15 Turing (Toshiba Exceria Pro SDXC 64 GB UHS-II) | |
| Schenker XMG Ultra 15 (Toshiba Exceria Pro SDXC 64 GB UHS-II) | |
| Média da turma Gaming (25.5 - 261, n=52, últimos 2 anos) | |
| |||||||||||||||||||||||||
iluminação: 89 %
iluminação com acumulador: 263 cd/m²
Contraste: 1547:1 (Preto: 0.17 cd/m²)
ΔE ColorChecker Calman: 4.45 | ∀{0.5-29.43 Ø4.71}
calibrated: 1.93
ΔE Greyscale Calman: 4.77 | ∀{0.09-98 Ø4.96}
93% sRGB (Argyll 1.6.3 3D)
60% AdobeRGB 1998 (Argyll 1.6.3 3D)
67.1% AdobeRGB 1998 (Argyll 3D)
92.6% sRGB (Argyll 3D)
66.1% Display P3 (Argyll 3D)
Gamma: 2.52
CCT: 7767 K
| Schenker XMG Ultra 15 Turing AU Optronics B156HAN07.0 (AUO70ED), IPS, 1920x1080 | Schenker XMG Ultra 15 AU Optronics B156HTN05.2 (AUO52ED), TN, 1920x1080 | Alienware 15 R4 LG Philips LP156WF6 (LGD0540), IPS, 1920x1080 | Gigabyte Aero 15-X9 LGD05C0, IPS, 1920x1080 | Razer Blade 15 RTX 2070 Max-Q LG Philips LGD05C0, IPS, 1920x1080 | Acer Predator Triton 500 AU Optronics B156HAN08.2 (AUO82ED), IPS, 1920x1080 | |
|---|---|---|---|---|---|---|
| Display | -1% | -5% | -2% | 0% | -2% | |
| Display P3 Coverage (%) | 66.1 | 66.8 1% | 65.7 -1% | 63.5 -4% | 65.3 -1% | 64.2 -3% |
| sRGB Coverage (%) | 92.6 | 90.7 -2% | 86.4 -7% | 93.1 1% | 94.9 2% | 92.6 0% |
| AdobeRGB 1998 Coverage (%) | 67.1 | 66.3 -1% | 63.1 -6% | 64.5 -4% | 66.3 -1% | 65.7 -2% |
| Response Times | 0% | -101% | 1% | 7% | 34% | |
| Response Time Grey 50% / Grey 80% * (ms) | 17.6 ? | 24.2 ? -37% | 37.6 ? -114% | 16.4 ? 7% | 16.8 ? 5% | 8 ? 55% |
| Response Time Black / White * (ms) | 12.8 ? | 8 ? 37% | 24 ? -88% | 13.6 ? -6% | 11.6 ? 9% | 11.2 ? 13% |
| PWM Frequency (Hz) | 20830 ? | |||||
| Screen | -47% | -14% | 8% | -0% | -8% | |
| Brightness middle (cd/m²) | 263 | 363 38% | 292 11% | 250 -5% | 314.7 20% | 304 16% |
| Brightness (cd/m²) | 264 | 365 38% | 278 5% | 235 -11% | 312 18% | 299 13% |
| Brightness Distribution (%) | 89 | 74 -17% | 88 -1% | 85 -4% | 90 1% | 89 0% |
| Black Level * (cd/m²) | 0.17 | 0.58 -241% | 0.29 -71% | 0.29 -71% | 0.38 -124% | 0.27 -59% |
| Contrast (:1) | 1547 | 626 -60% | 1007 -35% | 862 -44% | 828 -46% | 1126 -27% |
| Colorchecker dE 2000 * | 4.45 | 8.7 -96% | 4.9 -10% | 1.46 67% | 2.56 42% | 4.66 -5% |
| Colorchecker dE 2000 max. * | 8.33 | 12.91 -55% | 10.08 -21% | 2.47 70% | 4.89 41% | 9.65 -16% |
| Colorchecker dE 2000 calibrated * | 1.93 | 2.36 -22% | 2.27 -18% | 1.71 11% | 1.72 11% | |
| Greyscale dE 2000 * | 4.77 | 9.26 -94% | 4.89 -3% | 1.27 73% | 3.4 29% | 5.53 -16% |
| Gamma | 2.52 87% | 2.16 102% | 2.36 93% | 2.4 92% | 2.3 96% | 2.5 88% |
| CCT | 7767 84% | 9390 69% | 7598 86% | 6749 96% | 6435 101% | 8028 81% |
| Color Space (Percent of AdobeRGB 1998) (%) | 60 | 59 -2% | 56 -7% | 60 0% | 60.7 1% | 60 0% |
| Color Space (Percent of sRGB) (%) | 93 | 91 -2% | 86 -8% | 93 0% | 94.6 2% | 93 0% |
| Média Total (Programa/Configurações) | -16% /
-32% | -40% /
-23% | 2% /
5% | 2% /
1% | 8% /
-1% |
* ... menor é melhor
Exibir tempos de resposta
| ↔ Tempo de resposta preto para branco | ||
|---|---|---|
| 12.8 ms ... ascensão ↗ e queda ↘ combinadas | ↗ 7.6 ms ascensão | 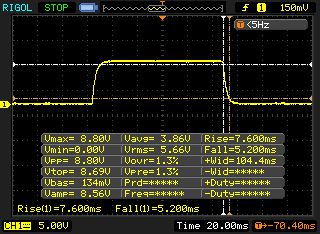 |
| ↘ 5.2 ms queda | ||
| A tela mostra boas taxas de resposta em nossos testes, mas pode ser muito lenta para jogadores competitivos. Em comparação, todos os dispositivos testados variam de 0.1 (mínimo) a 240 (máximo) ms. » 33 % de todos os dispositivos são melhores. Isso significa que o tempo de resposta medido é melhor que a média de todos os dispositivos testados (19.8 ms). | ||
| ↔ Tempo de resposta 50% cinza a 80% cinza | ||
| 17.6 ms ... ascensão ↗ e queda ↘ combinadas | ↗ 9.2 ms ascensão | 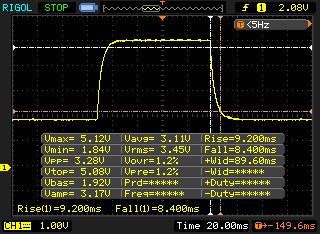 |
| ↘ 8.4 ms queda | ||
| A tela mostra boas taxas de resposta em nossos testes, mas pode ser muito lenta para jogadores competitivos. Em comparação, todos os dispositivos testados variam de 0.165 (mínimo) a 636 (máximo) ms. » 32 % de todos os dispositivos são melhores. Isso significa que o tempo de resposta medido é melhor que a média de todos os dispositivos testados (30.9 ms). | ||
Cintilação da tela / PWM (modulação por largura de pulso)
| Tela tremeluzindo / PWM não detectado | 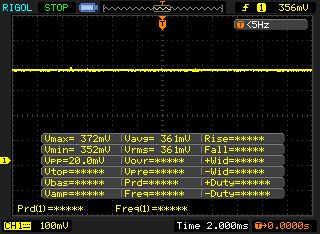 | ||
[pwm_comparison] Em comparação: 52 % de todos os dispositivos testados não usam PWM para escurecer a tela. Se PWM foi detectado, uma média de 7748 (mínimo: 5 - máximo: 343500) Hz foi medida. | |||
| Cinebench R10 | |
| Rendering Single 32Bit | |
| Média da turma Gaming (7457 - 12575, n=9, últimos 2 anos) | |
| Schenker XMG Ultra 15 Turing | |
| Schenker XMG Ultra 15 | |
| Gigabyte Aero 15-X9 | |
| Rendering Multiple CPUs 32Bit | |
| Média da turma Gaming (42932 - 102066, n=9, últimos 2 anos) | |
| Schenker XMG Ultra 15 Turing | |
| Gigabyte Aero 15-X9 | |
| Schenker XMG Ultra 15 | |
| Geekbench 3 | |
| 32 Bit Multi-Core Score | |
| Schenker XMG Ultra 15 Turing | |
| Gigabyte Aero 15-X9 | |
| Schenker XMG Ultra 15 | |
| 32 Bit Single-Core Score | |
| Schenker XMG Ultra 15 Turing | |
| Schenker XMG Ultra 15 | |
| Gigabyte Aero 15-X9 | |
| Geekbench 4.0 | |
| 64 Bit Multi-Core Score | |
| Média da turma Gaming (40469 - 76142, n=4, últimos 2 anos) | |
| Schenker XMG Ultra 15 Turing | |
| Gigabyte Aero 15-X9 | |
| 64 Bit Single-Core Score | |
| Média da turma Gaming (7589 - 9053, n=4, últimos 2 anos) | |
| Schenker XMG Ultra 15 Turing | |
| Gigabyte Aero 15-X9 | |
| Geekbench 4.4 | |
| 64 Bit Multi-Core Score | |
| Média da turma Gaming (89200 - 101054, n=3, últimos 2 anos) | |
| Schenker XMG Ultra 15 Turing | |
| Gigabyte Aero 15-X9 | |
| 64 Bit Single-Core Score | |
| Média da turma Gaming (9335 - 9775, n=3, últimos 2 anos) | |
| Schenker XMG Ultra 15 Turing | |
| Gigabyte Aero 15-X9 | |
| Mozilla Kraken 1.1 - Total | |
| Gigabyte Aero 15-X9 (Edge 44) | |
| Razer Blade 15 RTX 2070 Max-Q (Edge 44.17763.1.0) | |
| Schenker XMG Ultra 15 (Edge 41) | |
| Schenker XMG Ultra 15 Turing (Edge 44) | |
| Média da turma Gaming (391 - 590, n=101, últimos 2 anos) | |
| Octane V2 - Total Score | |
| Média da turma Gaming (93292 - 139447, n=27, últimos 2 anos) | |
| Schenker XMG Ultra 15 Turing (Edge 44) | |
| Gigabyte Aero 15-X9 (Edge 44) | |
| Razer Blade 15 RTX 2070 Max-Q (Edge 44.17763.1.0) | |
| JetStream 1.1 - 1.1 Total | |
| Média da turma Gaming (549 - 647, n=3, últimos 2 anos) | |
| Schenker XMG Ultra 15 Turing (Edge 44) | |
| Razer Blade 15 RTX 2070 Max-Q (Edge 44.17763.1.0) | |
| Schenker XMG Ultra 15 (Edge 41) | |
| Gigabyte Aero 15-X9 (Edge 44) | |
* ... menor é melhor
| PCMark 7 Score | 8114 pontos | |
| PCMark 8 Home Score Accelerated v2 | 5485 pontos | |
| PCMark 8 Creative Score Accelerated v2 | 6780 pontos | |
| PCMark 8 Work Score Accelerated v2 | 6258 pontos | |
| PCMark 10 Score | 6868 pontos | |
Ajuda | ||

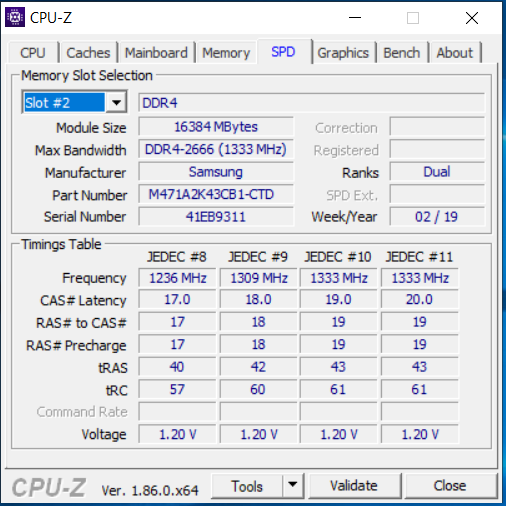
| Schenker XMG Ultra 15 Turing Samsung SSD 970 EVO Plus 1TB | Schenker XMG Ultra 15 Samsung SSD 960 Evo 500GB m.2 NVMe | Alienware 15 R4 Toshiba XG5 KXG50ZNV256G | Gigabyte Aero 15-X9 Intel SSD 760p SSDPEKKW010T8 | Razer Blade 15 RTX 2070 Max-Q Samsung SSD PM981 MZVLB512HAJQ | Acer Predator Triton 500 2x WDC PC SN720 SDAPNTW-256G-1014 (RAID 0) | |
|---|---|---|---|---|---|---|
| CrystalDiskMark 5.2 / 6 | -5% | -27% | -15% | -16% | -2% | |
| Write 4K (MB/s) | 129.9 | 147.7 14% | 96.8 -25% | 97.1 -25% | 93.9 -28% | 93.6 -28% |
| Read 4K (MB/s) | 47.15 | 44.02 -7% | 35.73 -24% | 53.7 14% | 40.56 -14% | 38.82 -18% |
| Write Seq (MB/s) | 1840 | 1641 -11% | 362.3 -80% | 1526 -17% | 1468 -20% | 2455 33% |
| Read Seq (MB/s) | 1775 | 1830 3% | 2110 19% | 2020 14% | 1540 -13% | 2107 19% |
| Write 4K Q32T1 (MB/s) | 294.5 | 325.9 11% | 318.6 8% | 285.6 -3% | 293.5 0% | 298.7 1% |
| Read 4K Q32T1 (MB/s) | 373.6 | 369.1 -1% | 366.7 -2% | 321.8 -14% | 346 -7% | 338.7 -9% |
| Write Seq Q32T1 (MB/s) | 3295 | 1847 -44% | 351 -89% | 1533 -53% | 1941 -41% | 2902 -12% |
| Read Seq Q32T1 (MB/s) | 3535 | 3344 -5% | 2813 -20% | 2351 -33% | 3266 -8% | 3536 0% |
| 3DMark 06 Standard Score | 43781 pontos | |
| 3DMark 11 Performance | 22748 pontos | |
| 3DMark Ice Storm Standard Score | 227837 pontos | |
| 3DMark Cloud Gate Standard Score | 43983 pontos | |
| 3DMark Fire Strike Score | 18616 pontos | |
| 3DMark Time Spy Score | 7832 pontos | |
Ajuda | ||
| baixo | média | alto | ultra | |
|---|---|---|---|---|
| BioShock Infinite (2013) | 400.7 | 346 | 320.9 | 187.8 |
| The Witcher 3 (2015) | 331.2 | 223.1 | 128.4 | 73 |
| Batman: Arkham Knight (2015) | 214 | 202 | 159 | 108 |
| Ashes of the Singularity (2016) | 112.4 | 102 | 98.6 | |
| Civilization 6 (2016) | 224.1 | 163.6 | 129.8 | 121.1 |
| Destiny 2 (2017) | 206.1 | 181.2 | 169.5 | 144.5 |
| X-Plane 11.11 (2018) | 128.4 | 114.1 | 92.5 | |
| Far Cry 5 (2018) | 147 | 125 | 115 | 109 |
| The Witcher 3 - 1920x1080 Ultra Graphics & Postprocessing (HBAO+) | |
| Média da turma Gaming (104.7 - 240, n=7, últimos 2 anos) | |
| Acer Predator Triton 500 | |
| Schenker XMG Ultra 15 Turing | |
| Razer Blade 15 RTX 2070 Max-Q | |
| Schenker XMG Ultra 15 | |
| Alienware 15 R4 | |
| Gigabyte Aero 15-X9 | |
| BioShock Infinite - 1920x1080 Ultra Preset, DX11 (DDOF) | |
| Schenker XMG Ultra 15 Turing | |
| Razer Blade 15 RTX 2070 Max-Q | |
| Gigabyte Aero 15-X9 | |
| Far Cry 5 - 1920x1080 Ultra Preset AA:T | |
| Média da turma Gaming (70 - 151, n=6, últimos 2 anos) | |
| Schenker XMG Ultra 15 Turing | |
| Alienware 15 R4 | |
| Gigabyte Aero 15-X9 | |
Barulho
| Ocioso |
| 32 / 33 / 36 dB |
| Carga |
| 55 / 59 dB |
 | ||
30 dB silencioso 40 dB(A) audível 50 dB(A) ruidosamente alto |
||
min: | ||
| Schenker XMG Ultra 15 Turing i7-9700K, GeForce RTX 2070 Mobile | Schenker XMG Ultra 15 i5-8600K, GeForce GTX 1070 Mobile | Alienware 15 R4 i9-8950HK, GeForce GTX 1070 Mobile | Acer Predator Triton 500 i7-8750H, GeForce RTX 2080 Max-Q | Gigabyte Aero 15-X9 i7-8750H, GeForce RTX 2070 Max-Q | Razer Blade 15 RTX 2070 Max-Q i7-8750H, GeForce RTX 2070 Max-Q | Média da turma Gaming | |
|---|---|---|---|---|---|---|---|
| Noise | 3% | -0% | 11% | 9% | 18% | 17% | |
| desligado / ambiente * (dB) | 30 | 30 -0% | 29 3% | 29 3% | 30 -0% | 28.8 4% | 24.1 ? 20% |
| Idle Minimum * (dB) | 32 | 32 -0% | 32 -0% | 30 6% | 32 -0% | 28.8 10% | 26 ? 19% |
| Idle Average * (dB) | 33 | 33 -0% | 33 -0% | 32 3% | 34 -3% | 28.8 13% | 27.5 ? 17% |
| Idle Maximum * (dB) | 36 | 35 3% | 50 -39% | 34 6% | 36 -0% | 29.4 18% | 30.1 ? 16% |
| Load Average * (dB) | 55 | 46 16% | 50 9% | 44 20% | 42 24% | 35.7 35% | 43.8 ? 20% |
| Witcher 3 ultra * (dB) | 57 | 54 5% | 51 11% | 46 19% | 44 23% | 42.5 25% | |
| Load Maximum * (dB) | 59 | 62 -5% | 51 14% | 47 20% | 48 19% | 45 24% | 54.3 ? 8% |
* ... menor é melhor
(±) A temperatura máxima no lado superior é 45 °C / 113 F, em comparação com a média de 40.4 °C / 105 F , variando de 21.2 a 68.8 °C para a classe Gaming.
(-) A parte inferior aquece até um máximo de 48 °C / 118 F, em comparação com a média de 43.2 °C / 110 F
(+) Em uso inativo, a temperatura média para o lado superior é 28.7 °C / 84 F, em comparação com a média do dispositivo de 33.9 °C / ### class_avg_f### F.
(±) Jogando The Witcher 3, a temperatura média para o lado superior é 32.3 °C / 90 F, em comparação com a média do dispositivo de 33.9 °C / ## #class_avg_f### F.
(+) Os apoios para as mãos e o touchpad estão atingindo a temperatura máxima da pele (34 °C / 93.2 F) e, portanto, não estão quentes.
(-) A temperatura média da área do apoio para as mãos de dispositivos semelhantes foi 28.8 °C / 83.8 F (-5.2 °C / -9.4 F).
| Schenker XMG Ultra 15 Turing i7-9700K, GeForce RTX 2070 Mobile | Schenker XMG Ultra 15 i5-8600K, GeForce GTX 1070 Mobile | Alienware 15 R4 i9-8950HK, GeForce GTX 1070 Mobile | Acer Predator Triton 500 i7-8750H, GeForce RTX 2080 Max-Q | Gigabyte Aero 15-X9 i7-8750H, GeForce RTX 2070 Max-Q | Razer Blade 15 RTX 2070 Max-Q i7-8750H, GeForce RTX 2070 Max-Q | Média da turma Gaming | |
|---|---|---|---|---|---|---|---|
| Heat | 2% | -30% | -13% | -11% | 3% | -4% | |
| Maximum Upper Side * (°C) | 45 | 42 7% | 53 -18% | 49 -9% | 56 -24% | 49 -9% | 45.2 ? -0% |
| Maximum Bottom * (°C) | 48 | 50 -4% | 68 -42% | 58 -21% | 66 -38% | 49 -2% | 48.2 ? -0% |
| Idle Upper Side * (°C) | 30 | 29 3% | 39 -30% | 33 -10% | 27 10% | 25.4 15% | 31 ? -3% |
| Idle Bottom * (°C) | 30 | 29 3% | 39 -30% | 33 -10% | 27 10% | 27.2 9% | 34.2 ? -14% |
* ... menor é melhor
Schenker XMG Ultra 15 Turing análise de áudio
(±) | o volume do alto-falante é médio, mas bom (###valor### dB)
Graves 100 - 315Hz
(±) | graves reduzidos - em média 11.1% menor que a mediana
(±) | a linearidade dos graves é média (12.7% delta para a frequência anterior)
Médios 400 - 2.000 Hz
(+) | médios equilibrados - apenas 1.9% longe da mediana
(+) | médios são lineares (4.3% delta para frequência anterior)
Altos 2 - 16 kHz
(+) | agudos equilibrados - apenas 3.6% longe da mediana
(+) | os máximos são lineares (3.3% delta da frequência anterior)
Geral 100 - 16.000 Hz
(+) | o som geral é linear (14.5% diferença em relação à mediana)
Comparado com a mesma classe
» 27% de todos os dispositivos testados nesta classe foram melhores, 7% semelhantes, 66% piores
» O melhor teve um delta de 6%, a média foi 18%, o pior foi 132%
Comparado com todos os dispositivos testados
» 19% de todos os dispositivos testados foram melhores, 4% semelhantes, 77% piores
» O melhor teve um delta de 4%, a média foi 23%, o pior foi 134%
Schenker XMG Ultra 15 análise de áudio
(±) | o volume do alto-falante é médio, mas bom (###valor### dB)
Graves 100 - 315Hz
(±) | graves reduzidos - em média 10.7% menor que a mediana
(±) | a linearidade dos graves é média (12.1% delta para a frequência anterior)
Médios 400 - 2.000 Hz
(+) | médios equilibrados - apenas 1.5% longe da mediana
(+) | médios são lineares (3.2% delta para frequência anterior)
Altos 2 - 16 kHz
(+) | agudos equilibrados - apenas 2.2% longe da mediana
(+) | os máximos são lineares (3.1% delta da frequência anterior)
Geral 100 - 16.000 Hz
(+) | o som geral é linear (13.3% diferença em relação à mediana)
Comparado com a mesma classe
» 19% de todos os dispositivos testados nesta classe foram melhores, 5% semelhantes, 76% piores
» O melhor teve um delta de 6%, a média foi 18%, o pior foi 132%
Comparado com todos os dispositivos testados
» 14% de todos os dispositivos testados foram melhores, 3% semelhantes, 83% piores
» O melhor teve um delta de 4%, a média foi 23%, o pior foi 134%
Alienware 15 R4 análise de áudio
(+) | os alto-falantes podem tocar relativamente alto (###valor### dB)
Graves 100 - 315Hz
(-) | quase nenhum baixo - em média 21% menor que a mediana
(±) | a linearidade dos graves é média (9.8% delta para a frequência anterior)
Médios 400 - 2.000 Hz
(±) | médios mais altos - em média 6.1% maior que a mediana
(+) | médios são lineares (5.8% delta para frequência anterior)
Altos 2 - 16 kHz
(+) | agudos equilibrados - apenas 2.2% longe da mediana
(+) | os máximos são lineares (4.3% delta da frequência anterior)
Geral 100 - 16.000 Hz
(±) | a linearidade do som geral é média (16.6% diferença em relação à mediana)
Comparado com a mesma classe
» 43% de todos os dispositivos testados nesta classe foram melhores, 7% semelhantes, 50% piores
» O melhor teve um delta de 6%, a média foi 18%, o pior foi 132%
Comparado com todos os dispositivos testados
» 29% de todos os dispositivos testados foram melhores, 6% semelhantes, 65% piores
» O melhor teve um delta de 4%, a média foi 23%, o pior foi 134%
| desligado | |
| Ocioso | |
| Carga |
|
Key:
min: | |
| Schenker XMG Ultra 15 Turing i7-9700K, GeForce RTX 2070 Mobile | Schenker XMG Ultra 15 i5-8600K, GeForce GTX 1070 Mobile | Alienware 15 R4 i9-8950HK, GeForce GTX 1070 Mobile | Acer Predator Triton 500 i7-8750H, GeForce RTX 2080 Max-Q | Gigabyte Aero 15-X9 i7-8750H, GeForce RTX 2070 Max-Q | Razer Blade 15 RTX 2070 Max-Q i7-8750H, GeForce RTX 2070 Max-Q | Média da turma Gaming | |
|---|---|---|---|---|---|---|---|
| Power Consumption | 11% | 24% | 37% | 45% | 47% | 36% | |
| Idle Minimum * (Watt) | 35 | 28 20% | 23 34% | 16 54% | 16 54% | 10.4 70% | 13 ? 63% |
| Idle Average * (Watt) | 39 | 31 21% | 26 33% | 22 44% | 18 54% | 14.6 63% | 19 ? 51% |
| Idle Maximum * (Watt) | 47 | 38 19% | 30 36% | 32 32% | 23 51% | 16.3 65% | 24.5 ? 48% |
| Load Average * (Watt) | 117 | 100 15% | 111 5% | 89 24% | 88 25% | 88.5 24% | 111.1 ? 5% |
| Witcher 3 ultra * (Watt) | 196 | 206 -5% | 182 7% | 147 25% | 120 39% | 155.4 21% | |
| Load Maximum * (Watt) | 299 | 309 -3% | 222 26% | 173 42% | 167 44% | 182.4 39% | 260 ? 13% |
* ... menor é melhor
| Schenker XMG Ultra 15 Turing i7-9700K, GeForce RTX 2070 Mobile, 82 Wh | Schenker XMG Ultra 15 i5-8600K, GeForce GTX 1070 Mobile, 82 Wh | Alienware 15 R4 i9-8950HK, GeForce GTX 1070 Mobile, 99 Wh | Acer Predator Triton 500 i7-8750H, GeForce RTX 2080 Max-Q, 82 Wh | Gigabyte Aero 15-X9 i7-8750H, GeForce RTX 2070 Max-Q, 94.24 Wh | Razer Blade 15 RTX 2070 Max-Q i7-8750H, GeForce RTX 2070 Max-Q, 80 Wh | Média da turma Gaming | |
|---|---|---|---|---|---|---|---|
| Duração da bateria | 25% | 54% | 33% | 144% | 138% | 140% | |
| Reader / Idle (h) | 3.2 | 3.7 16% | 6.2 94% | 5.6 75% | 9.2 187% | 11.4 256% | 8.27 ? 158% |
| H.264 (h) | 2.6 | 3.1 19% | 6.1 135% | 8.32 ? 220% | |||
| WiFi v1.3 (h) | 2.6 | 3.2 23% | 5.1 96% | 3.2 23% | 6.4 146% | 6.5 150% | 7.11 ? 173% |
| Load (h) | 1.4 | 2 43% | 1 -29% | 1.4 0% | 2.9 107% | 1.5 7% | 1.502 ? 7% |
Pro
Contra
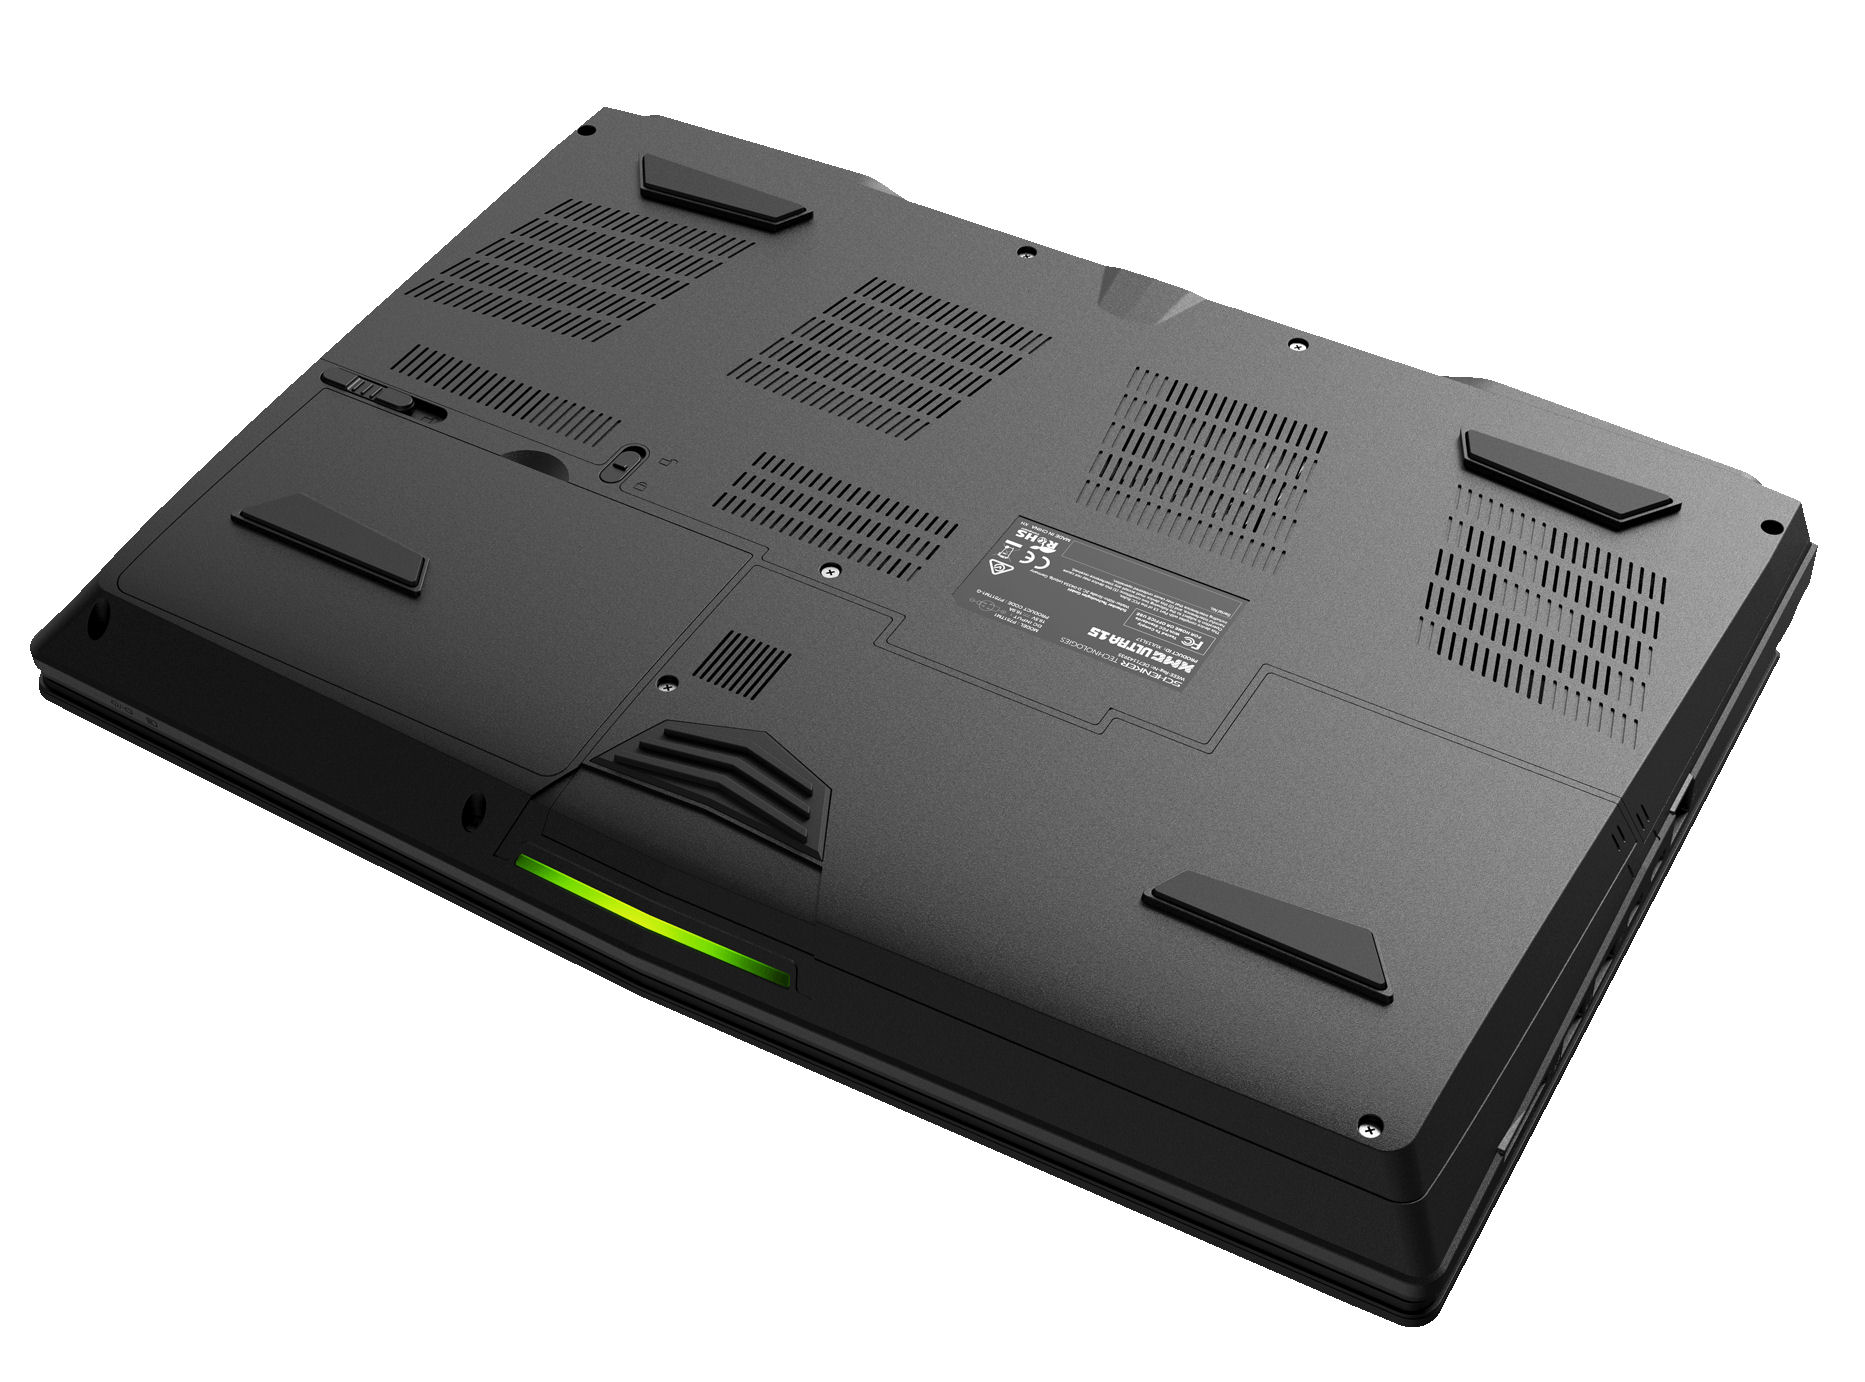
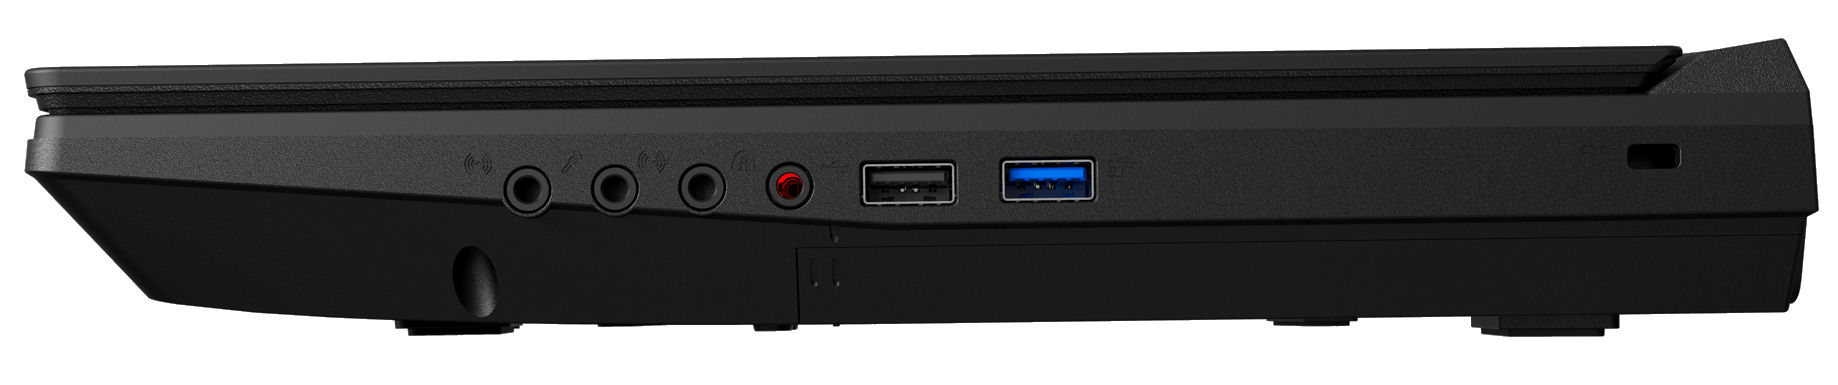
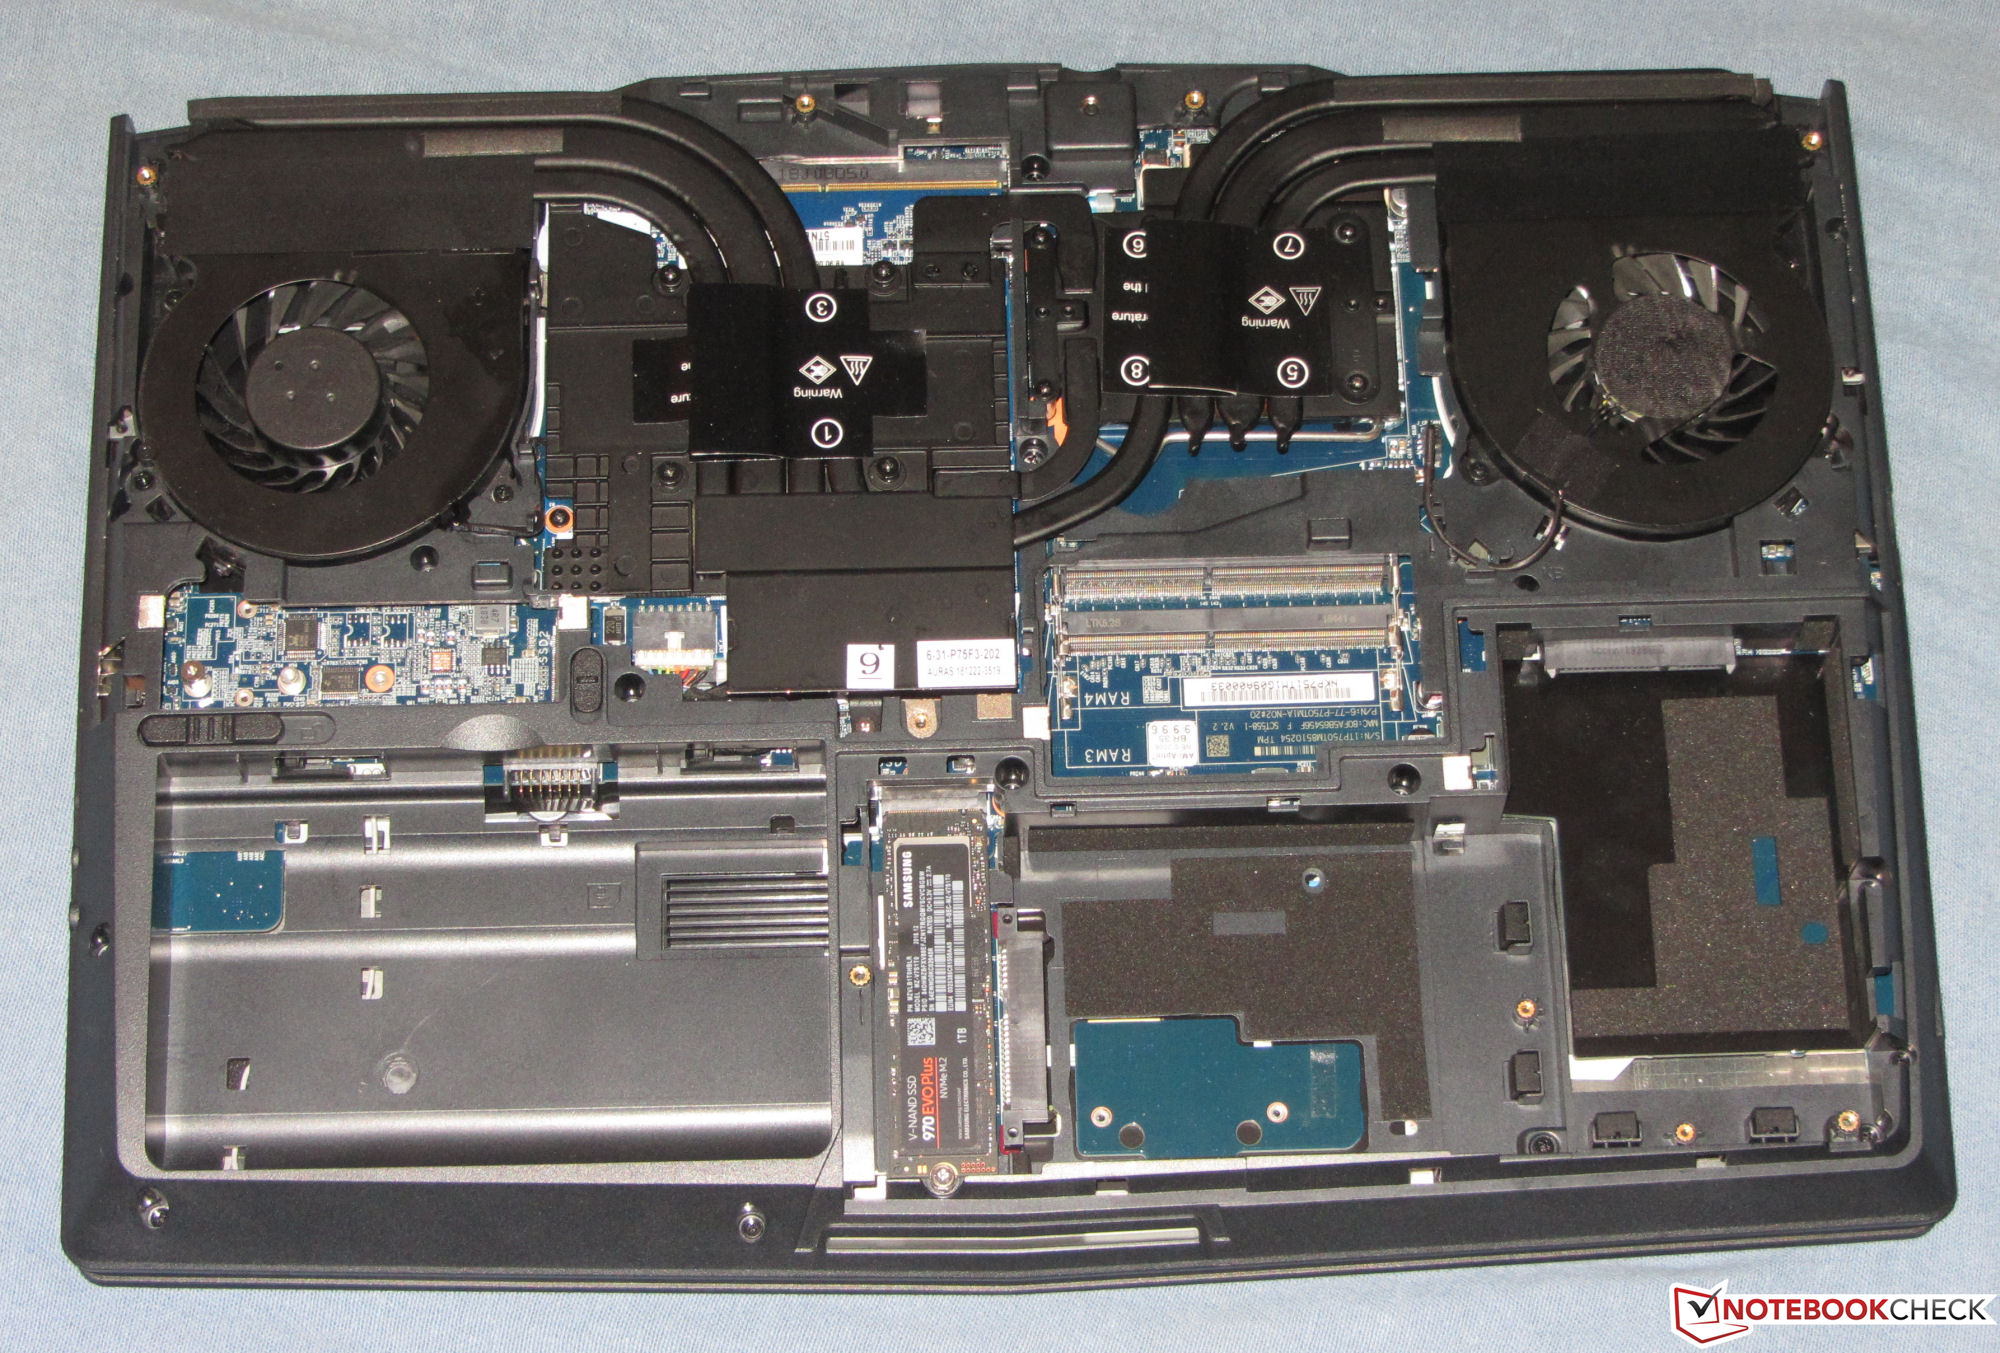
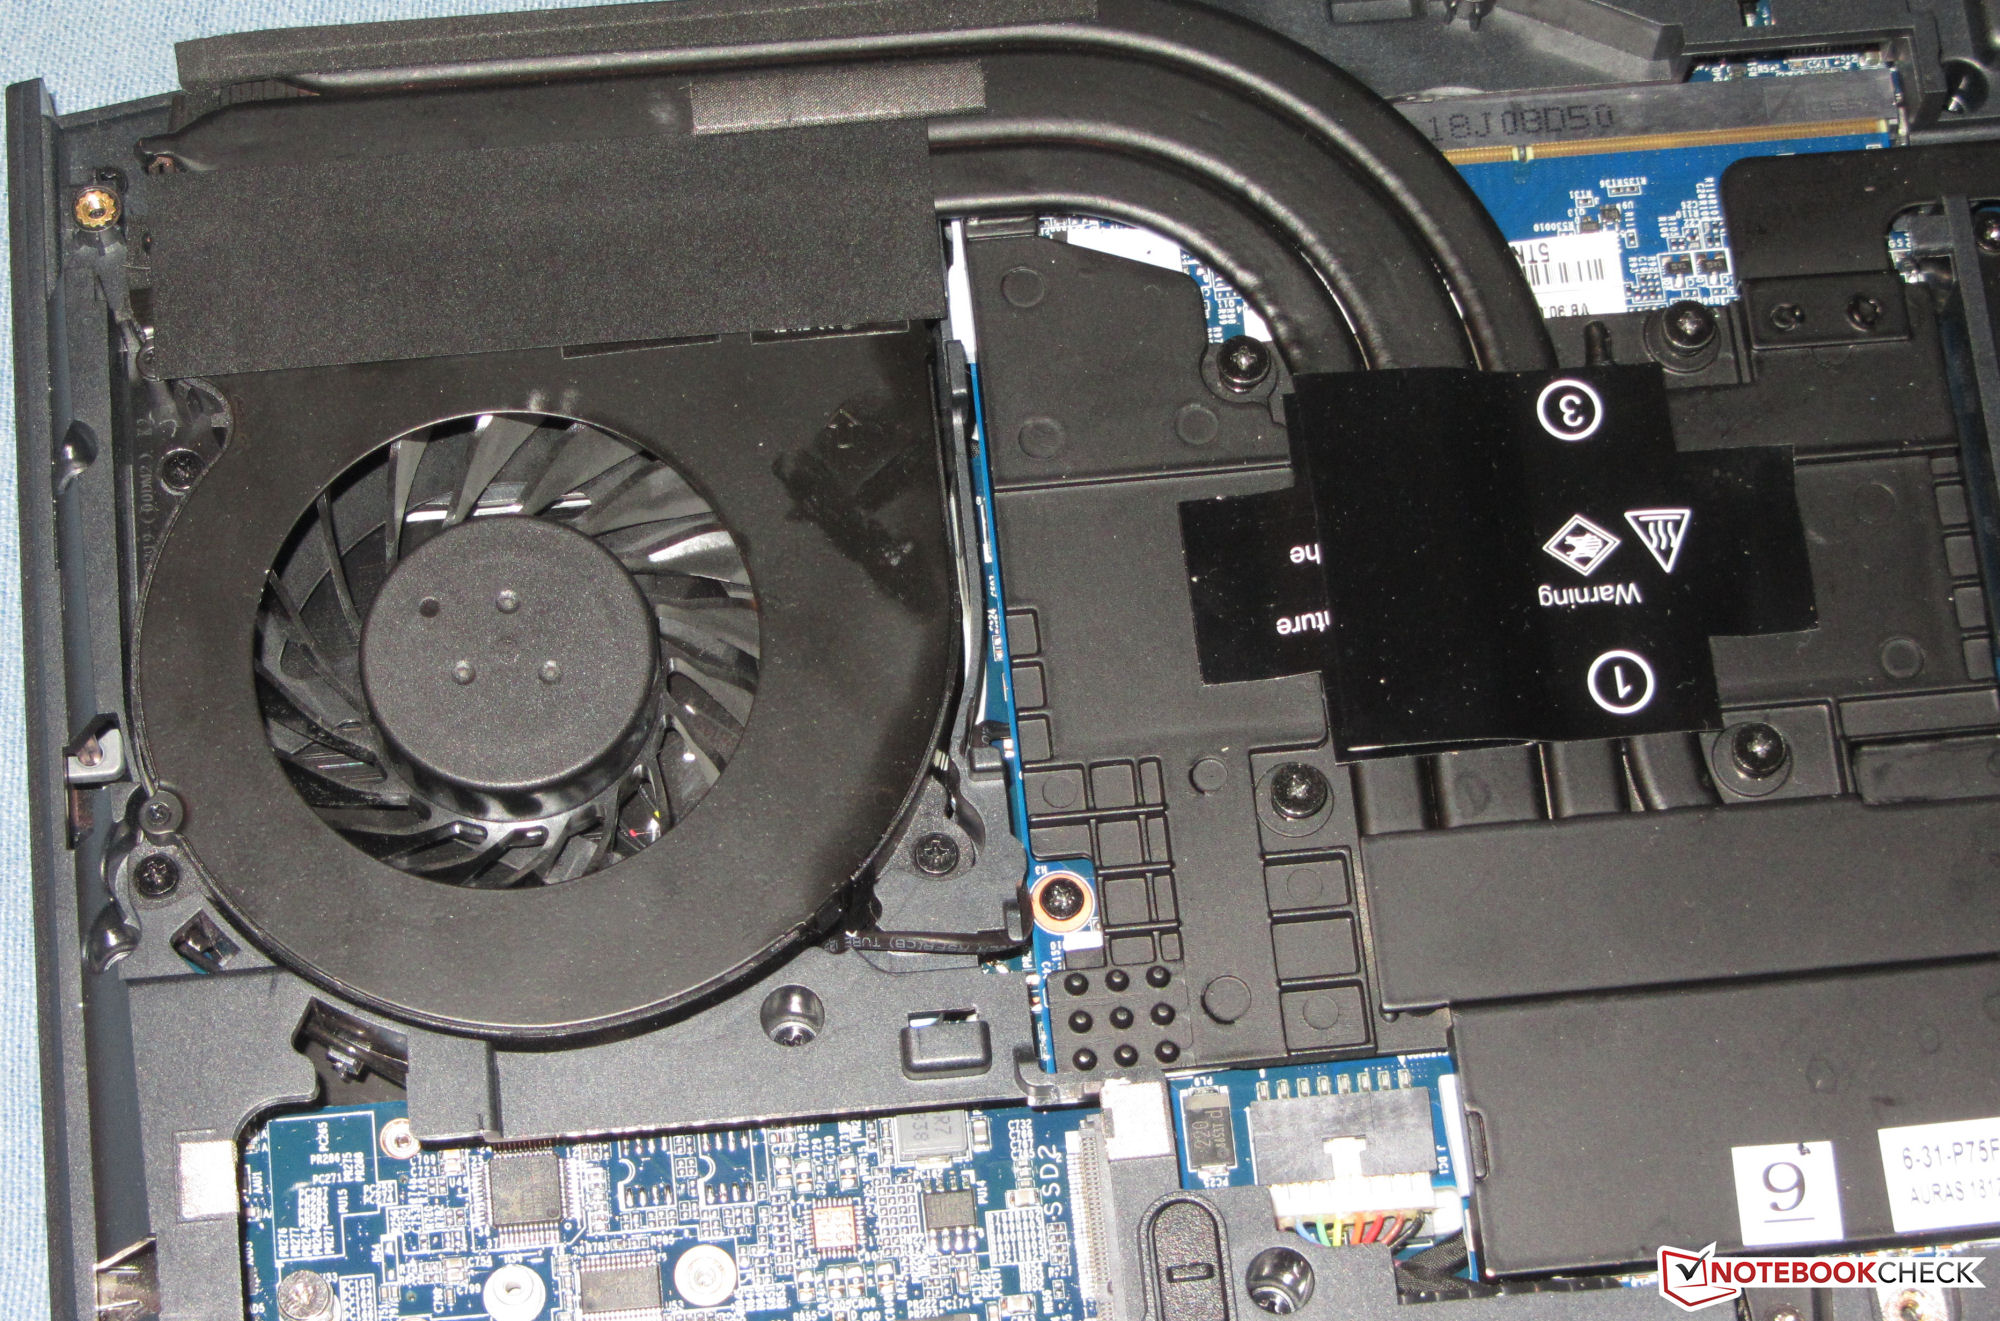
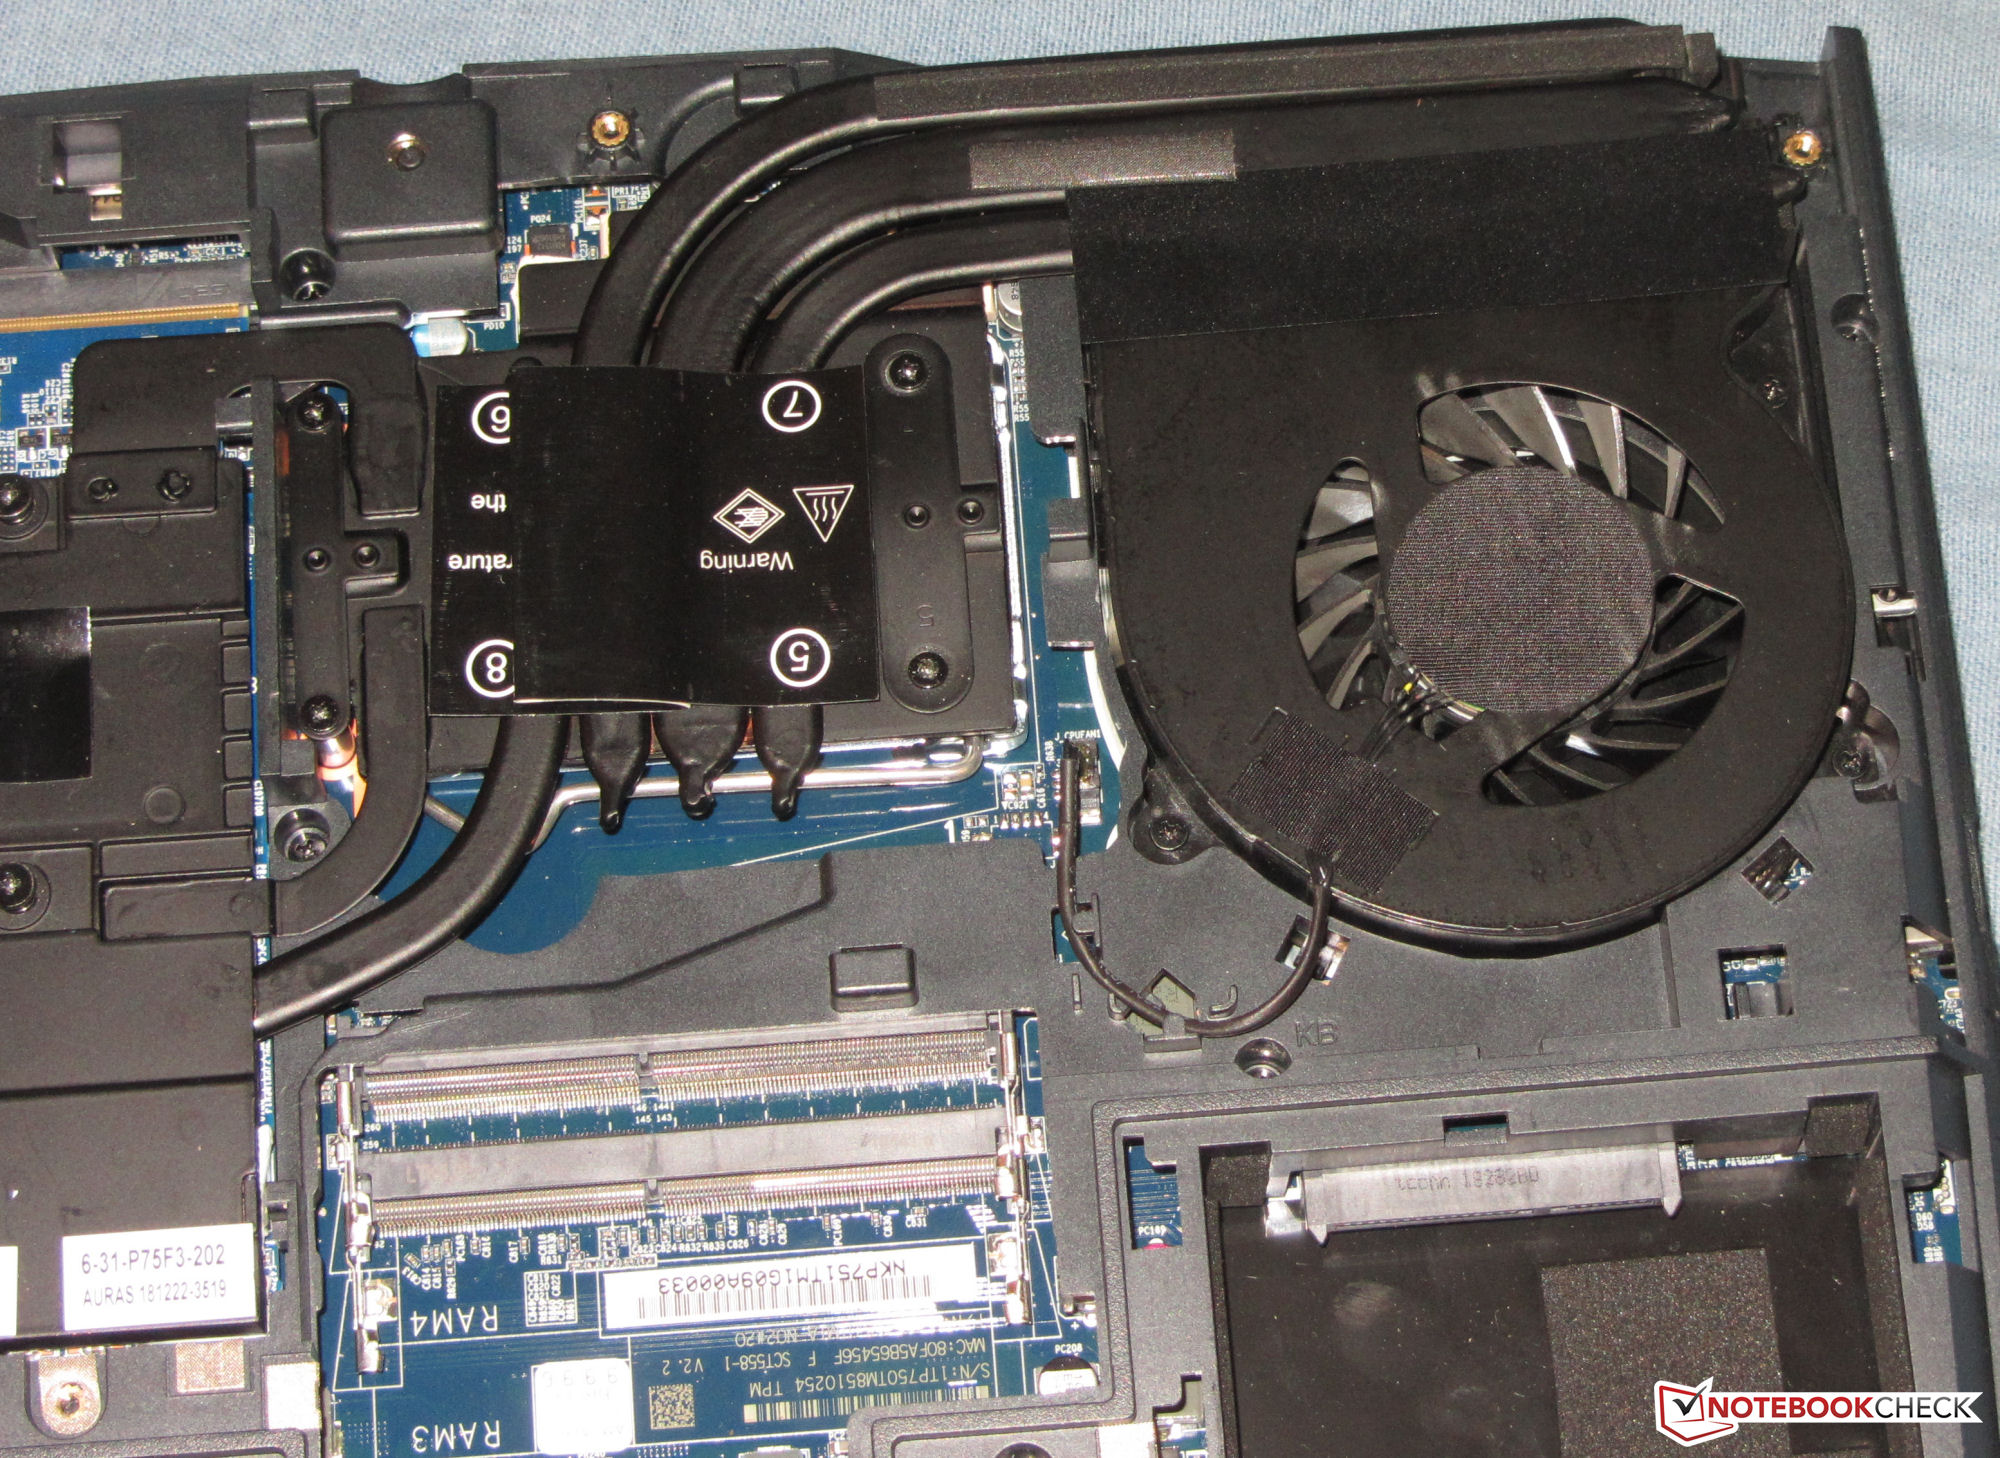
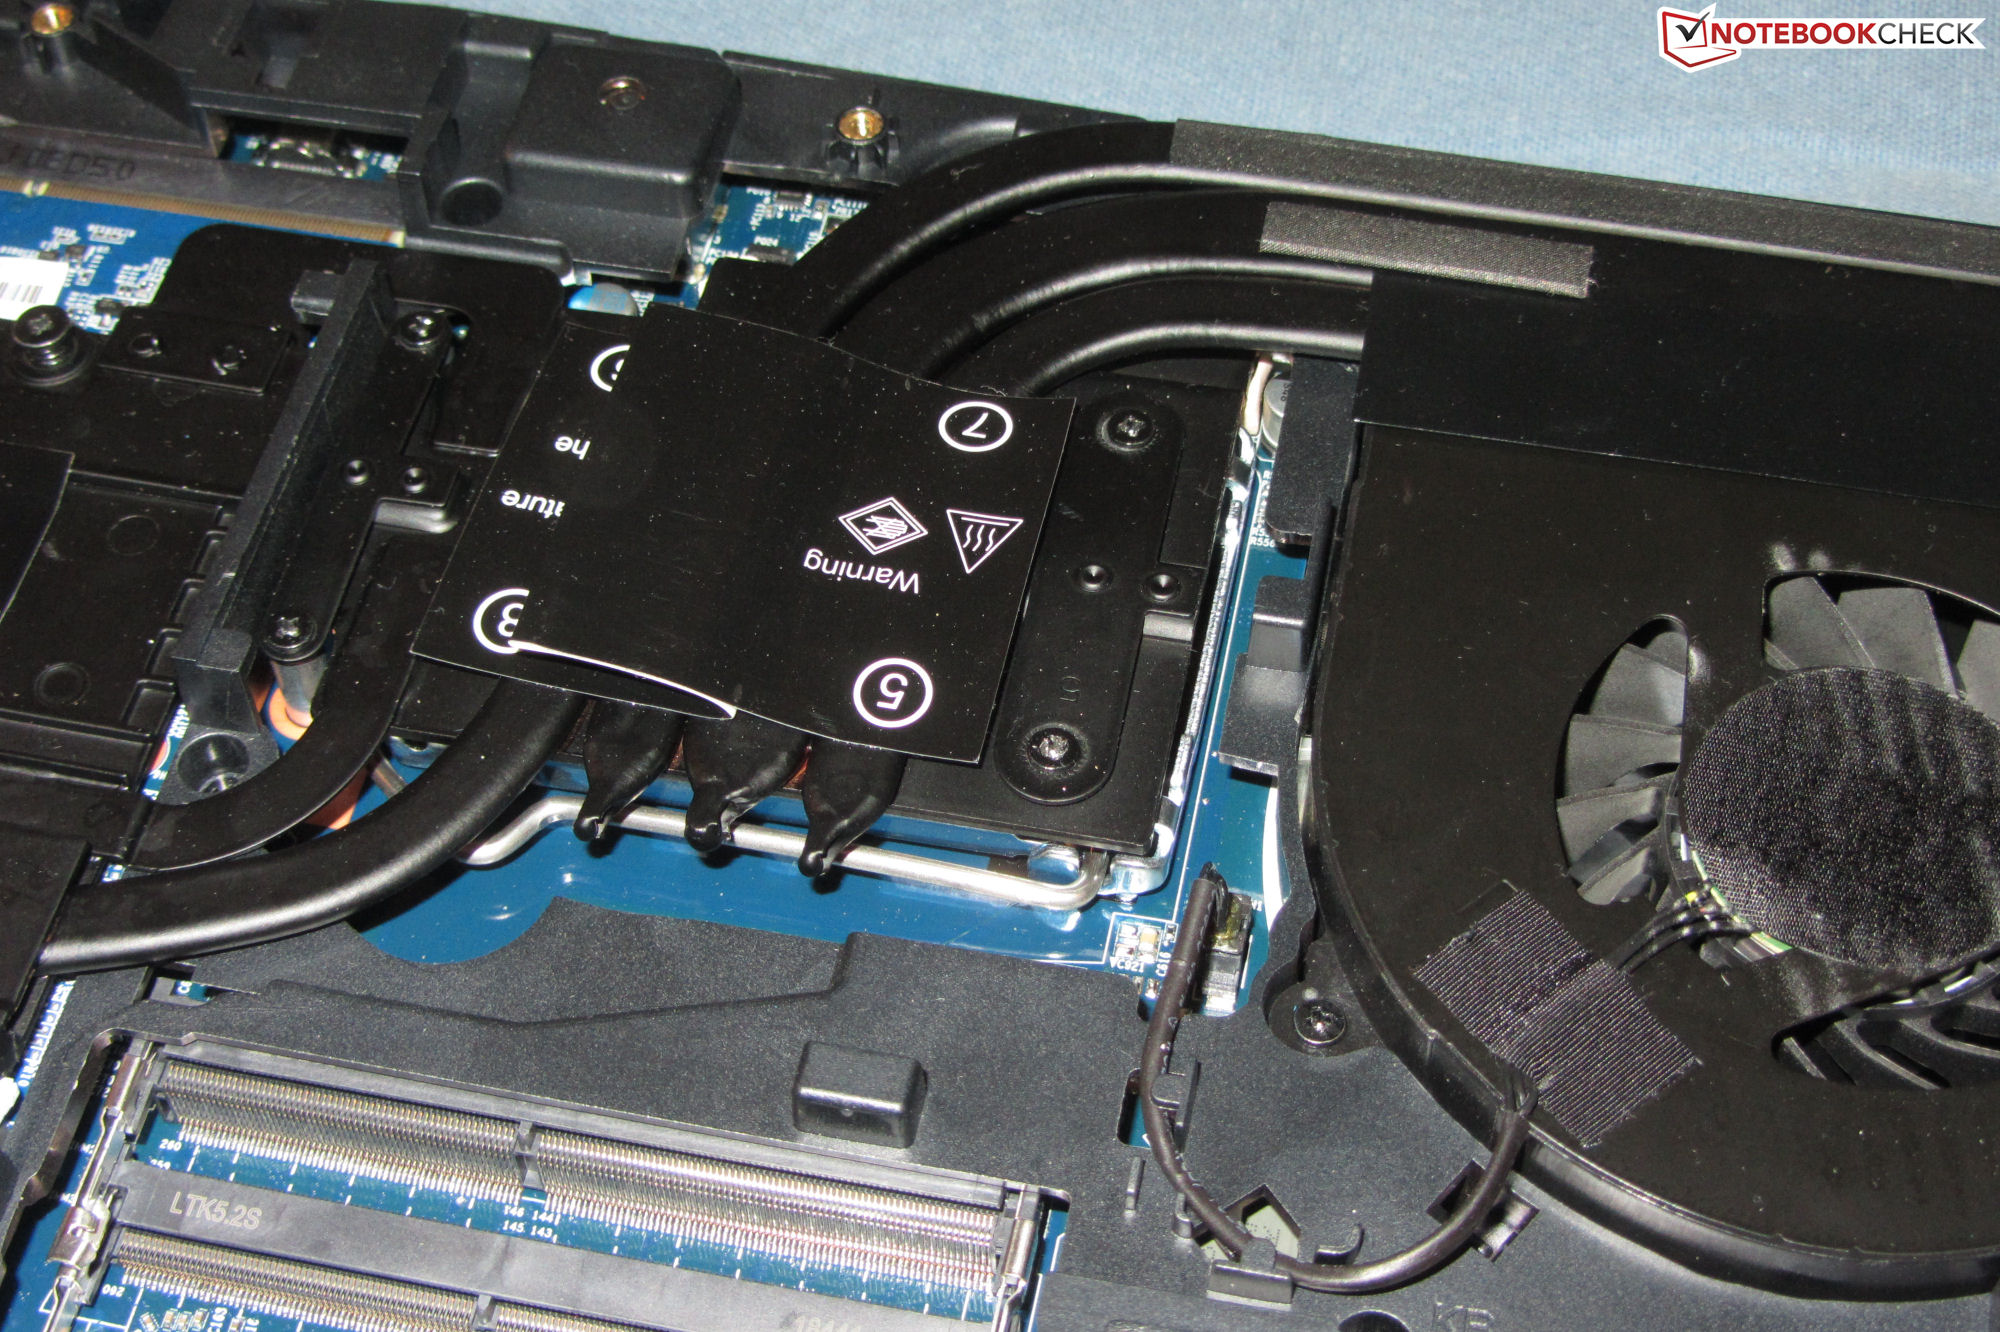
O XMG Ultra 15 da Schenker é um dispositivo grande Seu tamanho e peso enormes são devidos a uma especialidade que raramente pode ser encontrada em portáteis modernos: CPU e GPU encaixadas e, portanto, trocáveis (o último como módulo MXM).
mais recente iteração XMG Ultra 15 da Schenker é um portátil de jogos de alta qualidade bem feito para aqueles que se beneficiam da capacidade de atualização.
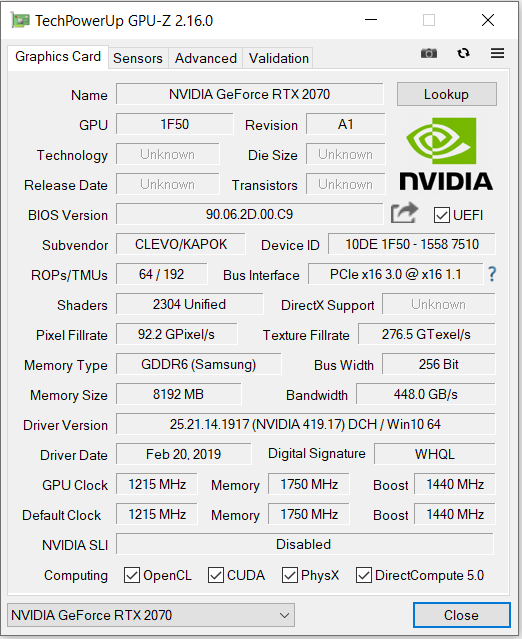
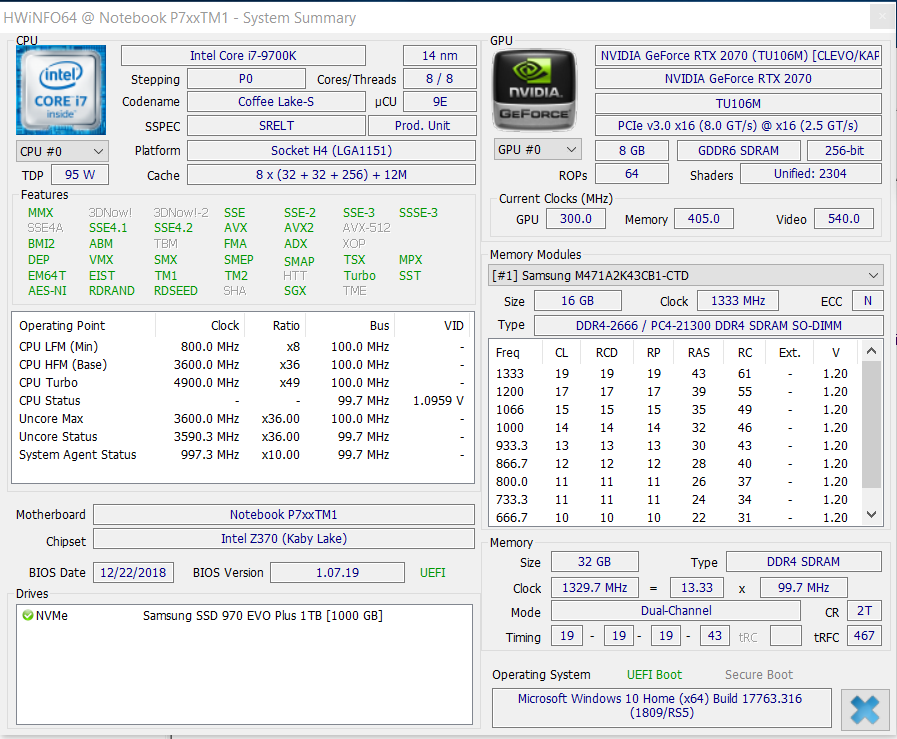
A combinação de uma CPU Core i7 2670QM octa-core e uma GeForce GTX 2070 GPU foi mais do que capaz de renderizar todos os jogos atuais sem problemas na tela FHD mate com detalhes altos ou até máximos. A GPU era claramente capaz de resoluções ainda maiores.
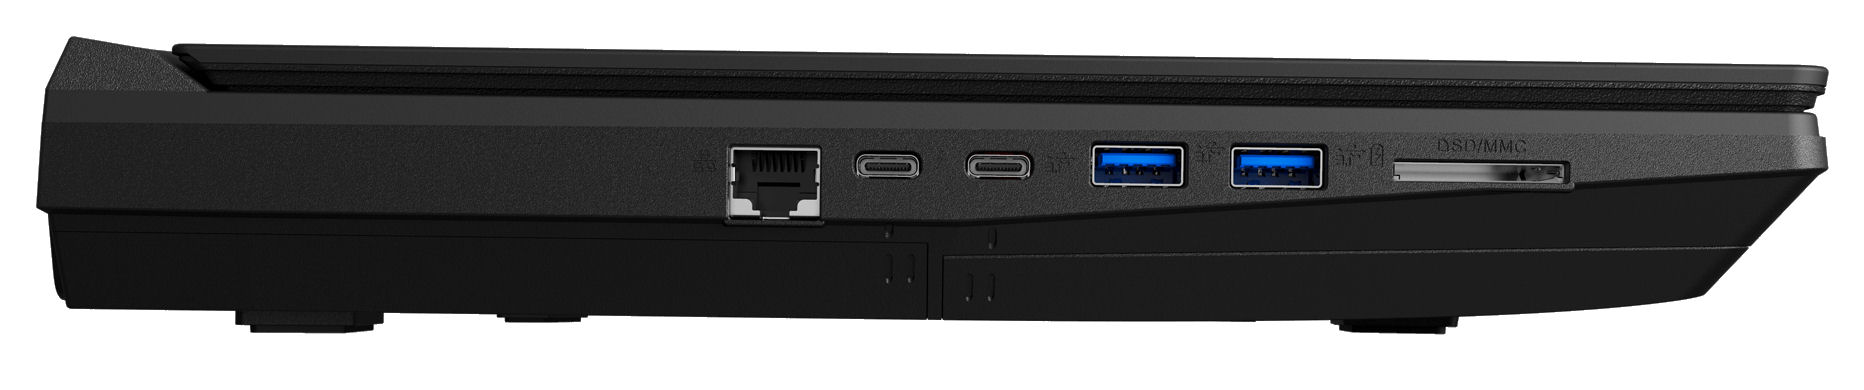
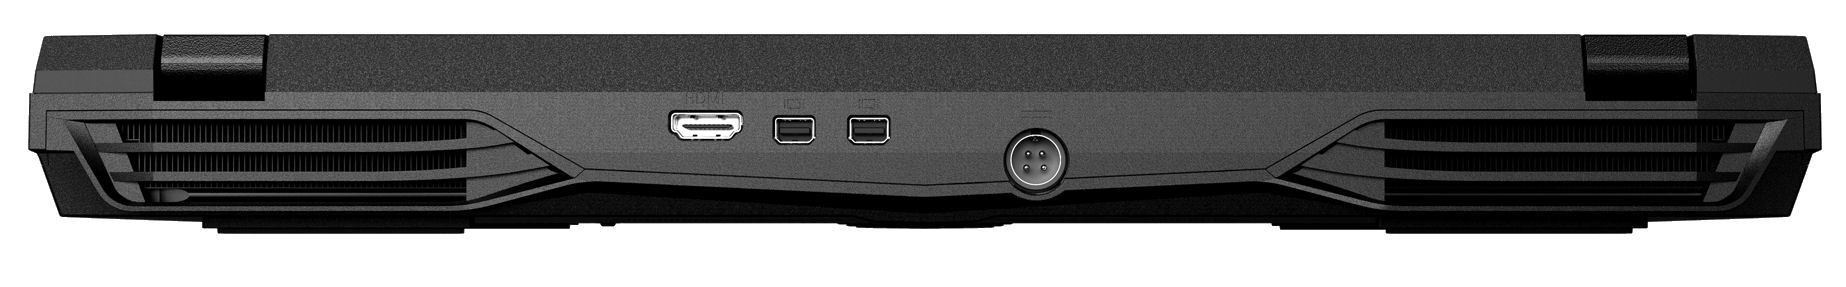
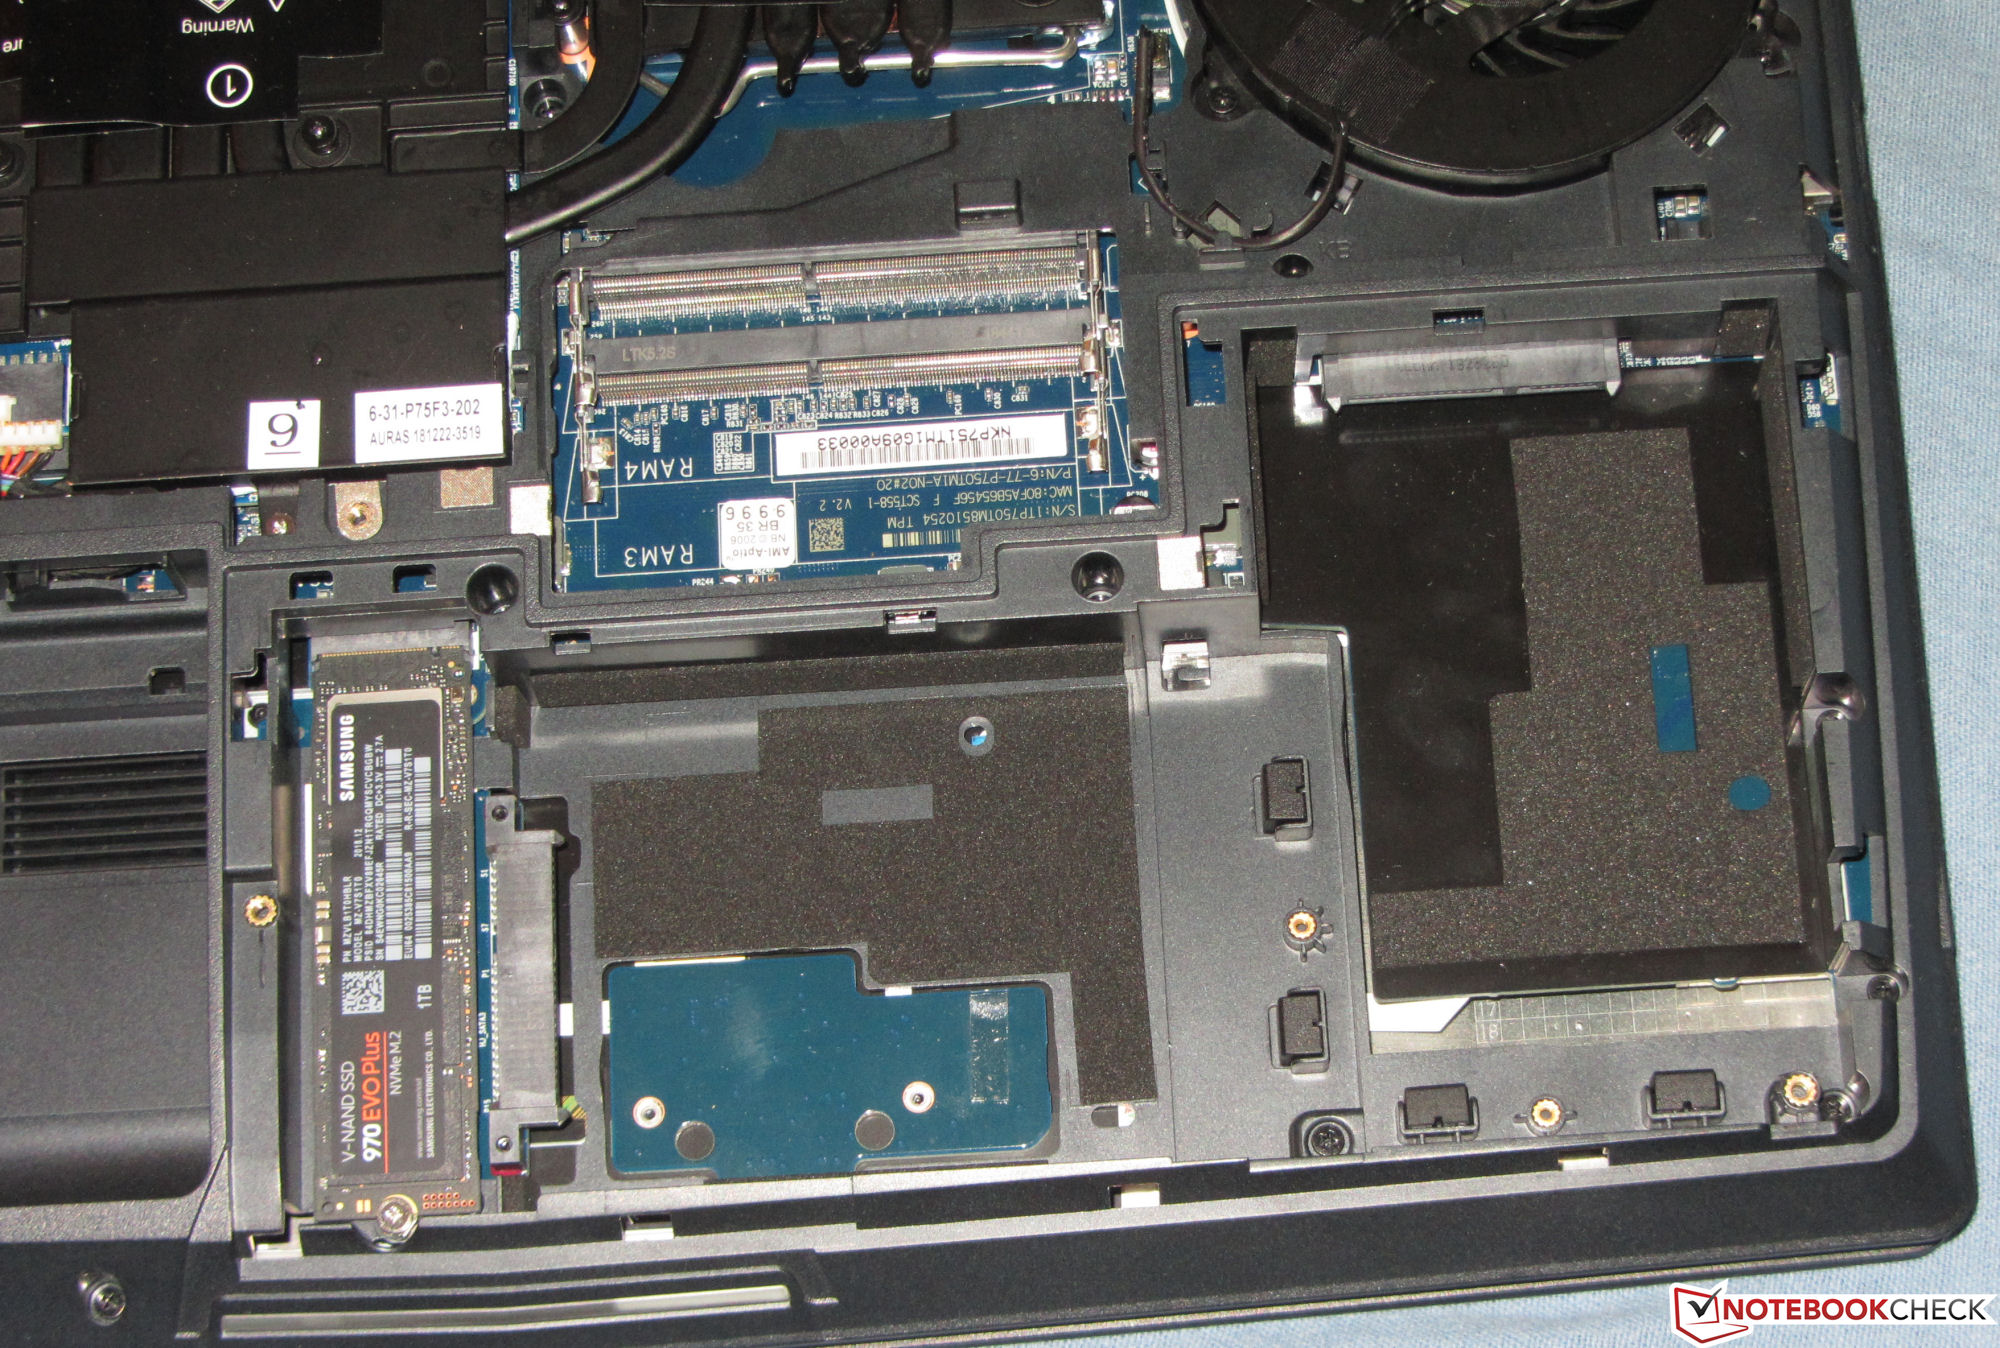
Graças a Nvidia G-Sync e uma tela IPS de 144 Hz, o resultado foi incrivelmente suave. A tela apresentava uma ótima relação de contraste, tempos de resposta curtos e amplos ângulos de visão. Nossa única queixa era que seu brilho máximo era muito baixo. Um SSD NVMe incrivelmente rápido garantiu um desempenho do sistema fluente e rápido, e a carcaça tinha espaço para outro SSD M.2, além de dois HDs de 2,5 polegadas. O teclado com iluminação RGB foi surpreendentemente bom, e a conectividade é muito decente. Em troca, a duração da bateria era tão fraca que mal dava para mencionar.
O gerenciamento de ventiladores definitivamente tem espaço para melhorias. Sob carga, os ventiladores funcionam muito mais rápido do que o necessário para garantir um resfriamento adequado. Suspeitamos que o sistema de resfriamento foi projetado e desenvolvido para um SKU muito mais potente (Core i9-9900K, GeForce RTX 2080).
Schenker XMG Ultra 15 Turing
- 03/04/2019 v6 (old)
Sascha Mölck
Price comparison
