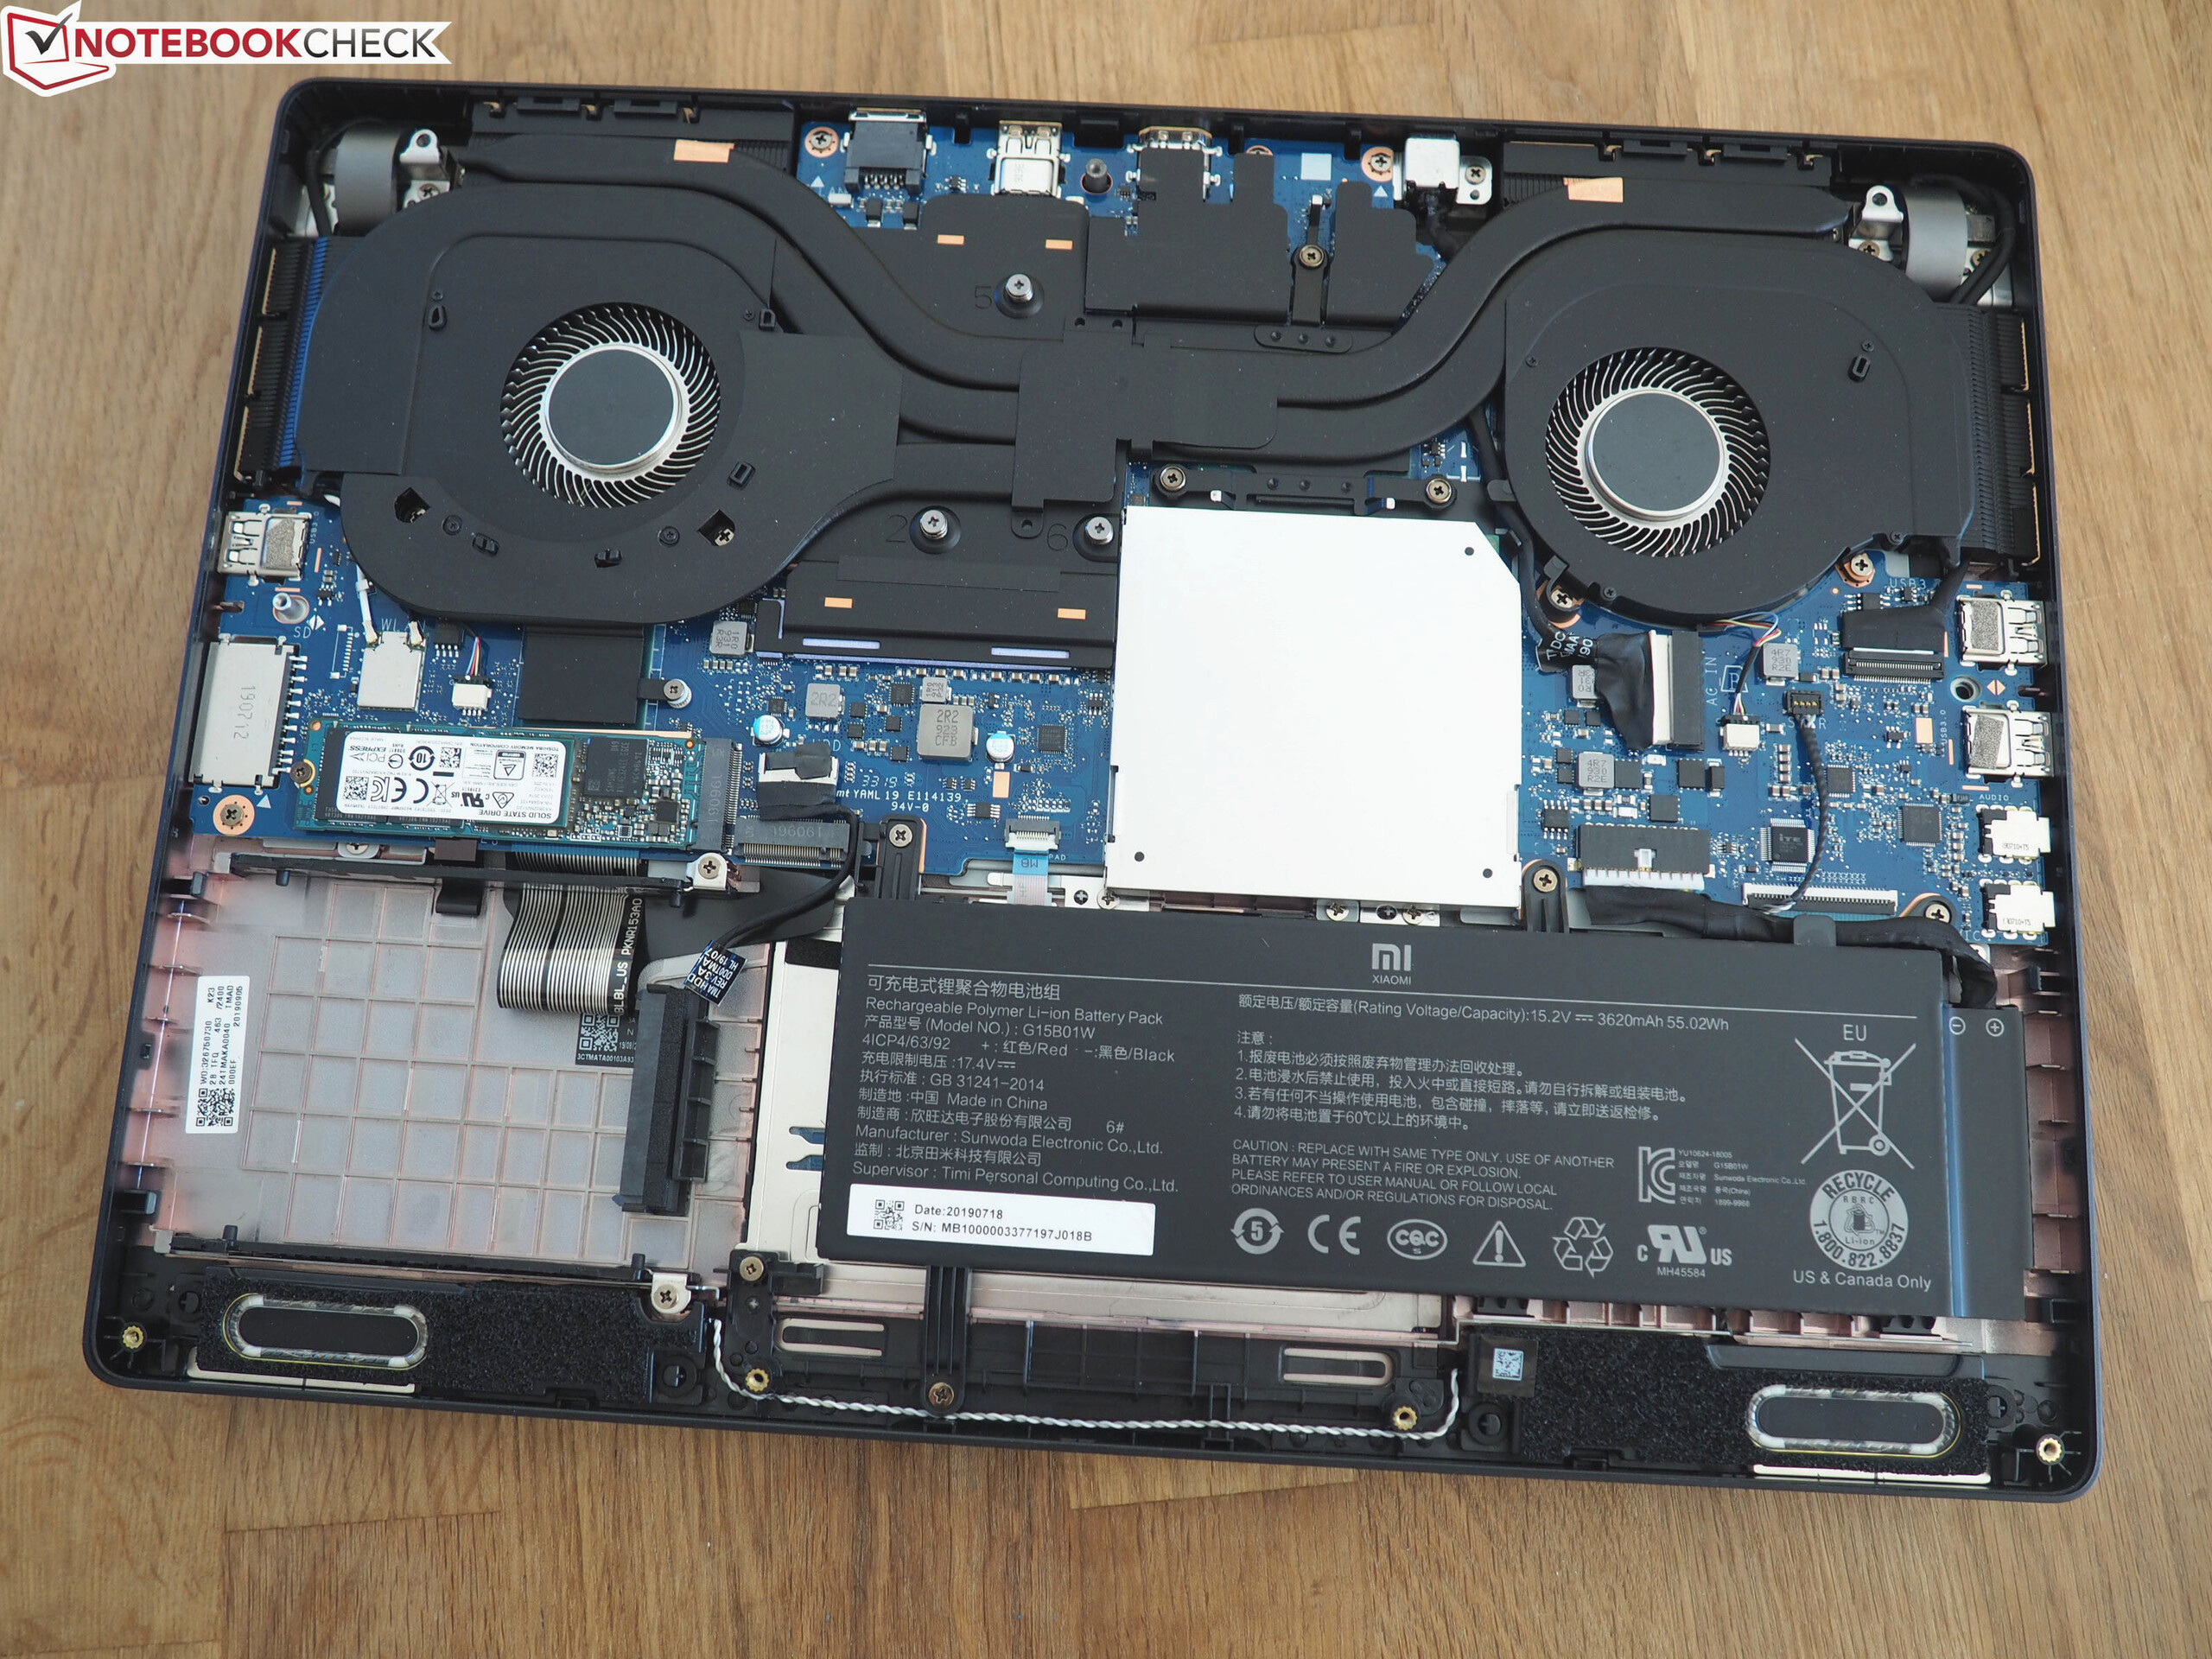
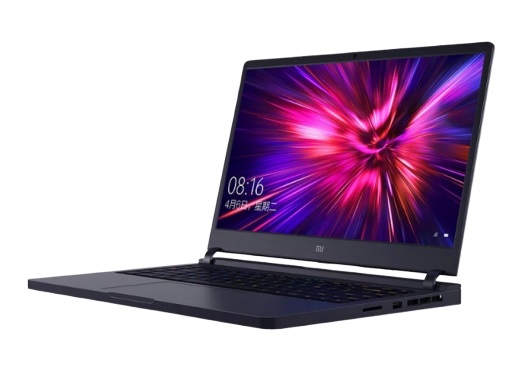
Breve Análise do Portátil Xiaomi Mi Gaming Laptop 2019: Retorno do Exótico
Avaliação | Data | Modelo | Peso | Altura | Size | Resolução | Preço |
|---|---|---|---|---|---|---|---|
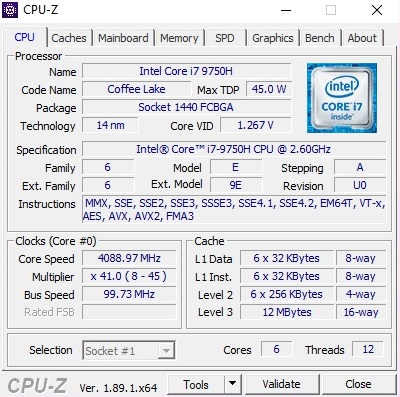
| 82.3 % v7 (old) | 11/2019 | Xiaomi Mi Gaming Laptop 2019 i7-9750H, GeForce RTX 2060 Mobile | 2.6 kg | 21 mm | 15.60" | 1920x1080 | |
| 80.8 % v7 (old) | 10/2019 | MSI GL65 9SEK i7-9750H, GeForce RTX 2060 Mobile | 2.3 kg | 27.5 mm | 15.60" | 1920x1080 | |
| 85.7 % v6 (old) | 08/2019 | Lenovo Legion Y540-15IRH i7-9750H, GeForce RTX 2060 Mobile | 2.3 kg | 26 mm | 15.60" | 1920x1080 | |
| 84.4 % v7 (old) | 08/2019 | Asus Strix GL531GV-PB74 i7-9750H, GeForce RTX 2060 Mobile | 2.4 kg | 25.9 mm | 15.60" | 1920x1080 | |
| 87.3 % v7 (old) | 11/2019 | Acer ConceptD 7 CN715-71-743N i7-9750H, GeForce RTX 2060 Mobile | 2.2 kg | 17.9 mm | 15.60" | 3840x2160 |
| SD Card Reader | |
| average JPG Copy Test (av. of 3 runs) | |
| Média da turma Gaming (20.9 - 210, n=54, últimos 2 anos) | |
| Xiaomi Mi Gaming Laptop 2019 (Toshiba Exceria Pro SDXC 64 GB UHS-II) | |
| maximum AS SSD Seq Read Test (1GB) | |
| Média da turma Gaming (25.5 - 261, n=51, últimos 2 anos) | |
| Xiaomi Mi Gaming Laptop 2019 (Toshiba Exceria Pro SDXC 64 GB UHS-II) | |
| Networking | |
| iperf3 transmit AX12 | |
| Xiaomi Mi Gaming Laptop 2019 | |
| iperf3 receive AX12 | |
| Xiaomi Mi Gaming Laptop 2019 | |
| |||||||||||||||||||||||||
iluminação: 87 %
iluminação com acumulador: 279 cd/m²
Contraste: 1374:1 (Preto: 0.23 cd/m²)
ΔE ColorChecker Calman: 3.84 | ∀{0.5-29.43 Ø4.72}
calibrated: 1.64
ΔE Greyscale Calman: 3.66 | ∀{0.09-98 Ø4.97}
92% sRGB (Argyll 1.6.3 3D)
60% AdobeRGB 1998 (Argyll 1.6.3 3D)
66.4% AdobeRGB 1998 (Argyll 3D)
92.1% sRGB (Argyll 3D)
65.2% Display P3 (Argyll 3D)
Gamma: 2.62
CCT: 7165 K
| Xiaomi Mi Gaming Laptop 2019 NV156FHM-N4G (BOE0867), IPS, 1920x1080, 15.6" | MSI GL65 9SEK AU Optronics B156HAN13.0, IPS, 1920x1080, 15.6" | Lenovo Legion Y540-15IRH BOE NV156FHM-N4G (BOE084D), IPS, 1920x1080, 15.6" | Asus Strix GL531GV-PB74 Panda LM156LF-GL02, IPS, 1920x1080, 15.6" | Acer ConceptD 7 CN715-71-743N AU Optronics AUO31EB, IPS, 3840x2160, 15.6" | |
|---|---|---|---|---|---|
| Display | -42% | -1% | -37% | 30% | |
| Display P3 Coverage (%) | 65.2 | 36.63 -44% | 64.5 -1% | 40.13 -38% | 85.7 31% |
| sRGB Coverage (%) | 92.1 | 55 -40% | 91.6 -1% | 60.3 -35% | 100 9% |
| AdobeRGB 1998 Coverage (%) | 66.4 | 37.85 -43% | 65.9 -1% | 41.48 -38% | 99 49% |
| Response Times | -175% | 9% | -154% | -304% | |
| Response Time Grey 50% / Grey 80% * (ms) | 8.8 ? | 26.4 ? -200% | 8.8 ? -0% | 26 ? -195% | 49 ? -457% |
| Response Time Black / White * (ms) | 12 ? | 30 ? -150% | 10 ? 17% | 25.6 ? -113% | 30 ? -150% |
| PWM Frequency (Hz) | |||||
| Screen | -49% | -8% | -65% | 28% | |
| Brightness middle (cd/m²) | 316 | 277.3 -12% | 284 -10% | 290.1 -8% | 365 16% |
| Brightness (cd/m²) | 295 | 256 -13% | 277 -6% | 274 -7% | 357 21% |
| Brightness Distribution (%) | 87 | 86 -1% | 87 0% | 86 -1% | 84 -3% |
| Black Level * (cd/m²) | 0.23 | 0.2 13% | 0.3 -30% | 0.54 -135% | 0.275 -20% |
| Contrast (:1) | 1374 | 1387 1% | 947 -31% | 537 -61% | 1327 -3% |
| Colorchecker dE 2000 * | 3.84 | 5.25 -37% | 3.53 8% | 5.16 -34% | 0.99 74% |
| Colorchecker dE 2000 max. * | 5.69 | 19.43 -241% | 6.11 -7% | 18.09 -218% | 1.89 67% |
| Colorchecker dE 2000 calibrated * | 1.64 | 4.39 -168% | 1.81 -10% | 4.35 -165% | 1.01 38% |
| Greyscale dE 2000 * | 3.66 | 3.5 4% | 3.56 3% | 4.4 -20% | 1.29 65% |
| Gamma | 2.62 84% | 2.1 105% | 2.47 89% | 2.1 105% | 2.2 100% |
| CCT | 7165 91% | 6895 94% | 7257 90% | 7362 88% | 6548 99% |
| Color Space (Percent of AdobeRGB 1998) (%) | 60 | 35 -42% | 59 -2% | 38.1 -36% | 88 47% |
| Color Space (Percent of sRGB) (%) | 92 | 55 -40% | 91 -1% | 60 -35% | 100 9% |
| Média Total (Programa/Configurações) | -89% /
-63% | 0% /
-5% | -85% /
-71% | -82% /
-13% |
* ... menor é melhor
Exibir tempos de resposta
| ↔ Tempo de resposta preto para branco | ||
|---|---|---|
| 12 ms ... ascensão ↗ e queda ↘ combinadas | ↗ 6.8 ms ascensão | 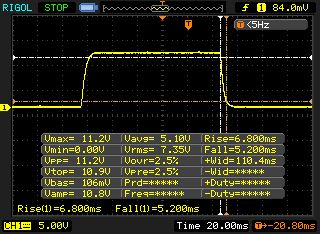 |
| ↘ 5.2 ms queda | ||
| A tela mostra boas taxas de resposta em nossos testes, mas pode ser muito lenta para jogadores competitivos. Em comparação, todos os dispositivos testados variam de 0.1 (mínimo) a 240 (máximo) ms. » 32 % de todos os dispositivos são melhores. Isso significa que o tempo de resposta medido é melhor que a média de todos os dispositivos testados (19.8 ms). | ||
| ↔ Tempo de resposta 50% cinza a 80% cinza | ||
| 8.8 ms ... ascensão ↗ e queda ↘ combinadas | ↗ 4.4 ms ascensão | 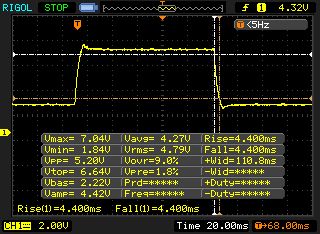 |
| ↘ 4.4 ms queda | ||
| A tela mostra taxas de resposta rápidas em nossos testes e deve ser adequada para jogos. Em comparação, todos os dispositivos testados variam de 0.165 (mínimo) a 636 (máximo) ms. » 22 % de todos os dispositivos são melhores. Isso significa que o tempo de resposta medido é melhor que a média de todos os dispositivos testados (31 ms). | ||
Cintilação da tela / PWM (modulação por largura de pulso)
| Tela tremeluzindo / PWM não detectado | 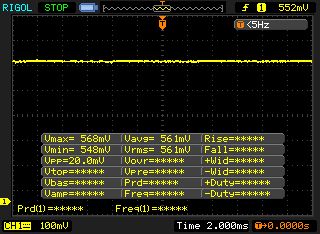 | ||
[pwm_comparison] Em comparação: 52 % de todos os dispositivos testados não usam PWM para escurecer a tela. Se PWM foi detectado, uma média de 7763 (mínimo: 5 - máximo: 343500) Hz foi medida. | |||
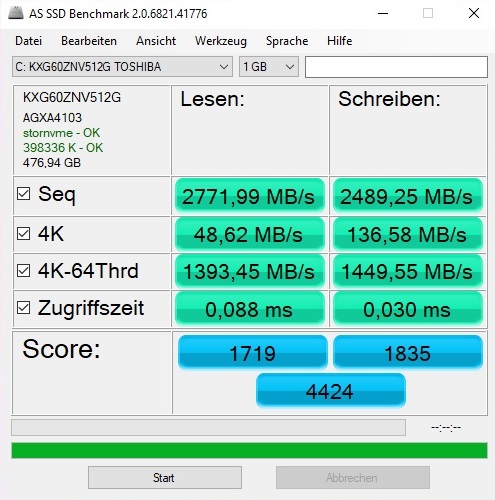
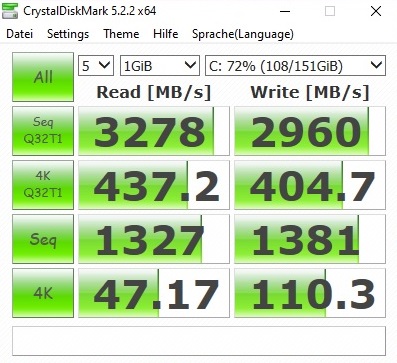
| Xiaomi Mi Gaming Laptop 2019 Toshiba XG6 KXG60ZNV512G | MSI GL65 9SEK WDC PC SN520 SDAPNUW-512G | Lenovo Legion Y540-15IRH Samsung PM981a MZVLB1T0HBLR | Asus Strix GL531GV-PB74 Intel SSD 660p SSDPEKNW512G8 | Acer ConceptD 7 CN715-71-743N WDC PC SN720 SDAPNTW-512G | |
|---|---|---|---|---|---|
| CrystalDiskMark 5.2 / 6 | -3% | 10% | -16% | 14% | |
| Write 4K (MB/s) | 110.3 | 150.2 36% | 131.7 19% | 121.9 11% | 109 -1% |
| Read 4K (MB/s) | 47.17 | 43.46 -8% | 48.06 2% | 53.6 14% | 41.33 -12% |
| Write Seq (MB/s) | 1381 | 1412 2% | 1234 -11% | 967 -30% | 2535 84% |
| Read Seq (MB/s) | 1327 | 1340 1% | 973 -27% | 1461 10% | 1538 16% |
| Write 4K Q32T1 (MB/s) | 404.7 | 482.2 19% | 576 42% | 431.4 7% | 396.6 -2% |
| Read 4K Q32T1 (MB/s) | 437.2 | 535 22% | 655 50% | 337.3 -23% | 603 38% |
| Write Seq Q32T1 (MB/s) | 2960 | 1454 -51% | 3012 2% | 972 -67% | 2542 -14% |
| Read Seq Q32T1 (MB/s) | 3278 | 1744 -47% | 3481 6% | 1727 -47% | 3324 1% |

| 3DMark 11 Performance | 18262 pontos | |
| 3DMark Cloud Gate Standard Score | 35196 pontos | |
| 3DMark Fire Strike Score | 15004 pontos | |
| 3DMark Time Spy Score | 6209 pontos | |
Ajuda | ||
| The Witcher 3 | |
| 1920x1080 High Graphics & Postprocessing (Nvidia HairWorks Off) | |
| Média da turma Gaming (181 - 341, n=2, últimos 2 anos) | |
| MSI GL65 9SEK | |
| Asus Strix GL531GV-PB74 | |
| Xiaomi Mi Gaming Laptop 2019 | |
| Acer ConceptD 7 CN715-71-743N | |
| 1920x1080 Ultra Graphics & Postprocessing (HBAO+) | |
| Média da turma Gaming (95 - 240, n=7, últimos 2 anos) | |
| Asus Strix GL531GV-PB74 | |
| Xiaomi Mi Gaming Laptop 2019 | |
| MSI GL65 9SEK | |
| Acer ConceptD 7 CN715-71-743N | |
| Lenovo Legion Y540-15IRH | |
| baixo | média | alto | ultra | QHD | 4K | |
|---|---|---|---|---|---|---|
| The Witcher 3 (2015) | 113 | 60.6 | ||||
| Fortnite (2018) | 130 | 107 | ||||
| Kingdom Come: Deliverance (2018) | 87.4 | 62.3 | ||||
| Assassin´s Creed Odyssey (2018) | 68 | 50 | ||||
| Battlefield V (2018) | 106 | 103 | ||||
| Darksiders III (2018) | 106 | 93.4 | ||||
| Just Cause 4 (2018) | 89.2 | 82.1 | ||||
| Dirt Rally 2.0 (2019) | 127 | 74 | ||||
| Anno 1800 (2019) | 67.1 | 37.3 | ||||
| Need for Speed Heat (2019) | 99.6 | 93.2 | 87.7 | 74.9 | 54.4 | 29.6 |
| Star Wars Jedi Fallen Order (2019) | 99.6 | 93.8 | 87.6 | 61.9 | 30.1 |
Barulho
| Ocioso |
| 31 / 32 / 42 dB |
| Carga |
| 52 / 59 dB |
 | ||
30 dB silencioso 40 dB(A) audível 50 dB(A) ruidosamente alto |
||
min: | ||
| Xiaomi Mi Gaming Laptop 2019 i7-9750H, GeForce RTX 2060 Mobile | MSI GL65 9SEK i7-9750H, GeForce RTX 2060 Mobile | Lenovo Legion Y540-15IRH i7-9750H, GeForce RTX 2060 Mobile | Asus Strix GL531GV-PB74 i7-9750H, GeForce RTX 2060 Mobile | Acer ConceptD 7 CN715-71-743N i7-9750H, GeForce RTX 2060 Mobile | Média da turma Gaming | |
|---|---|---|---|---|---|---|
| Noise | 7% | 10% | 11% | 14% | 17% | |
| desligado / ambiente * (dB) | 30 | 28.1 6% | 30 -0% | 28.2 6% | 30.4 -1% | 24.1 ? 20% |
| Idle Minimum * (dB) | 31 | 31.4 -1% | 30 3% | 28.8 7% | 30.6 1% | 25.9 ? 16% |
| Idle Average * (dB) | 32 | 31.5 2% | 32 -0% | 31.4 2% | 30.6 4% | 27.5 ? 14% |
| Idle Maximum * (dB) | 42 | 33.5 20% | 34 19% | 33.3 21% | 30.6 27% | 30 ? 29% |
| Load Average * (dB) | 52 | 49.3 5% | 44 15% | 46.2 11% | 44 15% | 43 ? 17% |
| Witcher 3 ultra * (dB) | 59 | 51.3 13% | 48 19% | 50.5 14% | 43.9 26% | |
| Load Maximum * (dB) | 59 | 58 2% | 52 12% | 51.3 13% | 44.2 25% | 54.2 ? 8% |
* ... menor é melhor
(-) A temperatura máxima no lado superior é 51 °C / 124 F, em comparação com a média de 40.4 °C / 105 F , variando de 21.2 a 68.8 °C para a classe Gaming.
(-) A parte inferior aquece até um máximo de 57 °C / 135 F, em comparação com a média de 43.2 °C / 110 F
(+) Em uso inativo, a temperatura média para o lado superior é 24.7 °C / 76 F, em comparação com a média do dispositivo de 33.9 °C / ### class_avg_f### F.
(-) Jogando The Witcher 3, a temperatura média para o lado superior é 40.7 °C / 105 F, em comparação com a média do dispositivo de 33.9 °C / ## #class_avg_f### F.
(+) Os apoios para as mãos e o touchpad são mais frios que a temperatura da pele, com um máximo de 30 °C / 86 F e, portanto, são frios ao toque.
(±) A temperatura média da área do apoio para as mãos de dispositivos semelhantes foi 28.8 °C / 83.8 F (-1.2 °C / -2.2 F).
| Xiaomi Mi Gaming Laptop 2019 i7-9750H, GeForce RTX 2060 Mobile | MSI GL65 9SEK i7-9750H, GeForce RTX 2060 Mobile | Lenovo Legion Y540-15IRH i7-9750H, GeForce RTX 2060 Mobile | Asus Strix GL531GV-PB74 i7-9750H, GeForce RTX 2060 Mobile | Acer ConceptD 7 CN715-71-743N i7-9750H, GeForce RTX 2060 Mobile | Média da turma Gaming | |
|---|---|---|---|---|---|---|
| Heat | -25% | -25% | -5% | 1% | -7% | |
| Maximum Upper Side * (°C) | 51 | 49 4% | 47 8% | 43.4 15% | 44.6 13% | 45.2 ? 11% |
| Maximum Bottom * (°C) | 57 | 54.2 5% | 60 -5% | 49.2 14% | 57.2 -0% | 48.2 ? 15% |
| Idle Upper Side * (°C) | 27 | 40.4 -50% | 37 -37% | 30.8 -14% | 27.4 -1% | 31 ? -15% |
| Idle Bottom * (°C) | 25 | 40 -60% | 41 -64% | 34 -36% | 27.6 -10% | 34.4 ? -38% |
* ... menor é melhor
Xiaomi Mi Gaming Laptop 2019 análise de áudio
(+) | os alto-falantes podem tocar relativamente alto (###valor### dB)
Graves 100 - 315Hz
(-) | quase nenhum baixo - em média 16.9% menor que a mediana
(±) | a linearidade dos graves é média (7.7% delta para a frequência anterior)
Médios 400 - 2.000 Hz
(+) | médios equilibrados - apenas 3.6% longe da mediana
(+) | médios são lineares (6.9% delta para frequência anterior)
Altos 2 - 16 kHz
(+) | agudos equilibrados - apenas 3.9% longe da mediana
(+) | os máximos são lineares (4.8% delta da frequência anterior)
Geral 100 - 16.000 Hz
(±) | a linearidade do som geral é média (15% diferença em relação à mediana)
Comparado com a mesma classe
» 32% de todos os dispositivos testados nesta classe foram melhores, 6% semelhantes, 62% piores
» O melhor teve um delta de 6%, a média foi 18%, o pior foi 132%
Comparado com todos os dispositivos testados
» 21% de todos os dispositivos testados foram melhores, 4% semelhantes, 75% piores
» O melhor teve um delta de 4%, a média foi 24%, o pior foi 134%
Lenovo Legion Y540-15IRH análise de áudio
(+) | os alto-falantes podem tocar relativamente alto (###valor### dB)
Graves 100 - 315Hz
(±) | graves reduzidos - em média 14.6% menor que a mediana
(±) | a linearidade dos graves é média (14.5% delta para a frequência anterior)
Médios 400 - 2.000 Hz
(+) | médios equilibrados - apenas 3.9% longe da mediana
(+) | médios são lineares (3.8% delta para frequência anterior)
Altos 2 - 16 kHz
(+) | agudos equilibrados - apenas 3% longe da mediana
(+) | os máximos são lineares (6.5% delta da frequência anterior)
Geral 100 - 16.000 Hz
(+) | o som geral é linear (14.3% diferença em relação à mediana)
Comparado com a mesma classe
» 26% de todos os dispositivos testados nesta classe foram melhores, 7% semelhantes, 67% piores
» O melhor teve um delta de 6%, a média foi 18%, o pior foi 132%
Comparado com todos os dispositivos testados
» 17% de todos os dispositivos testados foram melhores, 4% semelhantes, 78% piores
» O melhor teve um delta de 4%, a média foi 24%, o pior foi 134%
| desligado | |
| Ocioso | |
| Carga |
|
Key:
min: | |
| Xiaomi Mi Gaming Laptop 2019 i7-9750H, GeForce RTX 2060 Mobile | MSI GL65 9SEK i7-9750H, GeForce RTX 2060 Mobile | Lenovo Legion Y540-15IRH i7-9750H, GeForce RTX 2060 Mobile | Asus Strix GL531GV-PB74 i7-9750H, GeForce RTX 2060 Mobile | Acer ConceptD 7 CN715-71-743N i7-9750H, GeForce RTX 2060 Mobile | Média da turma Gaming | |
|---|---|---|---|---|---|---|
| Power Consumption | -115% | -25% | -17% | 7% | -27% | |
| Idle Minimum * (Watt) | 10 | 41 -310% | 15 -50% | 10.9 -9% | 7.6 24% | 13 ? -30% |
| Idle Average * (Watt) | 13 | 45.3 -248% | 20 -54% | 14.7 -13% | 13.6 -5% | 18.7 ? -44% |
| Idle Maximum * (Watt) | 20 | 47.1 -136% | 33 -65% | 32.4 -62% | 18.2 9% | 24.3 ? -22% |
| Load Average * (Watt) | 100 | 94.9 5% | 88 12% | 121.9 -22% | 102 -2% | 108.2 ? -8% |
| Witcher 3 ultra * (Watt) | 159 | 149.4 6% | 128 19% | 143.5 10% | 144 9% | |
| Load Maximum * (Watt) | 196 | 214.2 -9% | 213 -9% | 209.6 -7% | 183 7% | 254 ? -30% |
* ... menor é melhor
| Xiaomi Mi Gaming Laptop 2019 i7-9750H, GeForce RTX 2060 Mobile, 55 Wh | MSI GL65 9SEK i7-9750H, GeForce RTX 2060 Mobile, 51 Wh | Lenovo Legion Y540-15IRH i7-9750H, GeForce RTX 2060 Mobile, 57 Wh | Asus Strix GL531GV-PB74 i7-9750H, GeForce RTX 2060 Mobile, 66 Wh | Acer ConceptD 7 CN715-71-743N i7-9750H, GeForce RTX 2060 Mobile, 84 Wh | Média da turma Gaming | |
|---|---|---|---|---|---|---|
| Duração da bateria | -6% | -9% | -57% | 105% | 63% | |
| Reader / Idle (h) | 6.2 | 4.4 -29% | 3.9 -37% | 13.7 121% | 8.71 ? 40% | |
| WiFi v1.3 (h) | 4.4 | 3.8 -14% | 3.2 -27% | 1.9 -57% | 8.6 95% | 7 ? 59% |
| Load (h) | 0.8 | 1 25% | 1.1 38% | 1.6 100% | 1.51 ? 89% | |
| H.264 (h) | 6.5 | 8.9 ? |
Pro
Contra
Os prós e contras da edição 2019 da Xiaomi do Mi Gaming Laptop são praticamente idênticos aos do seu predecessor.
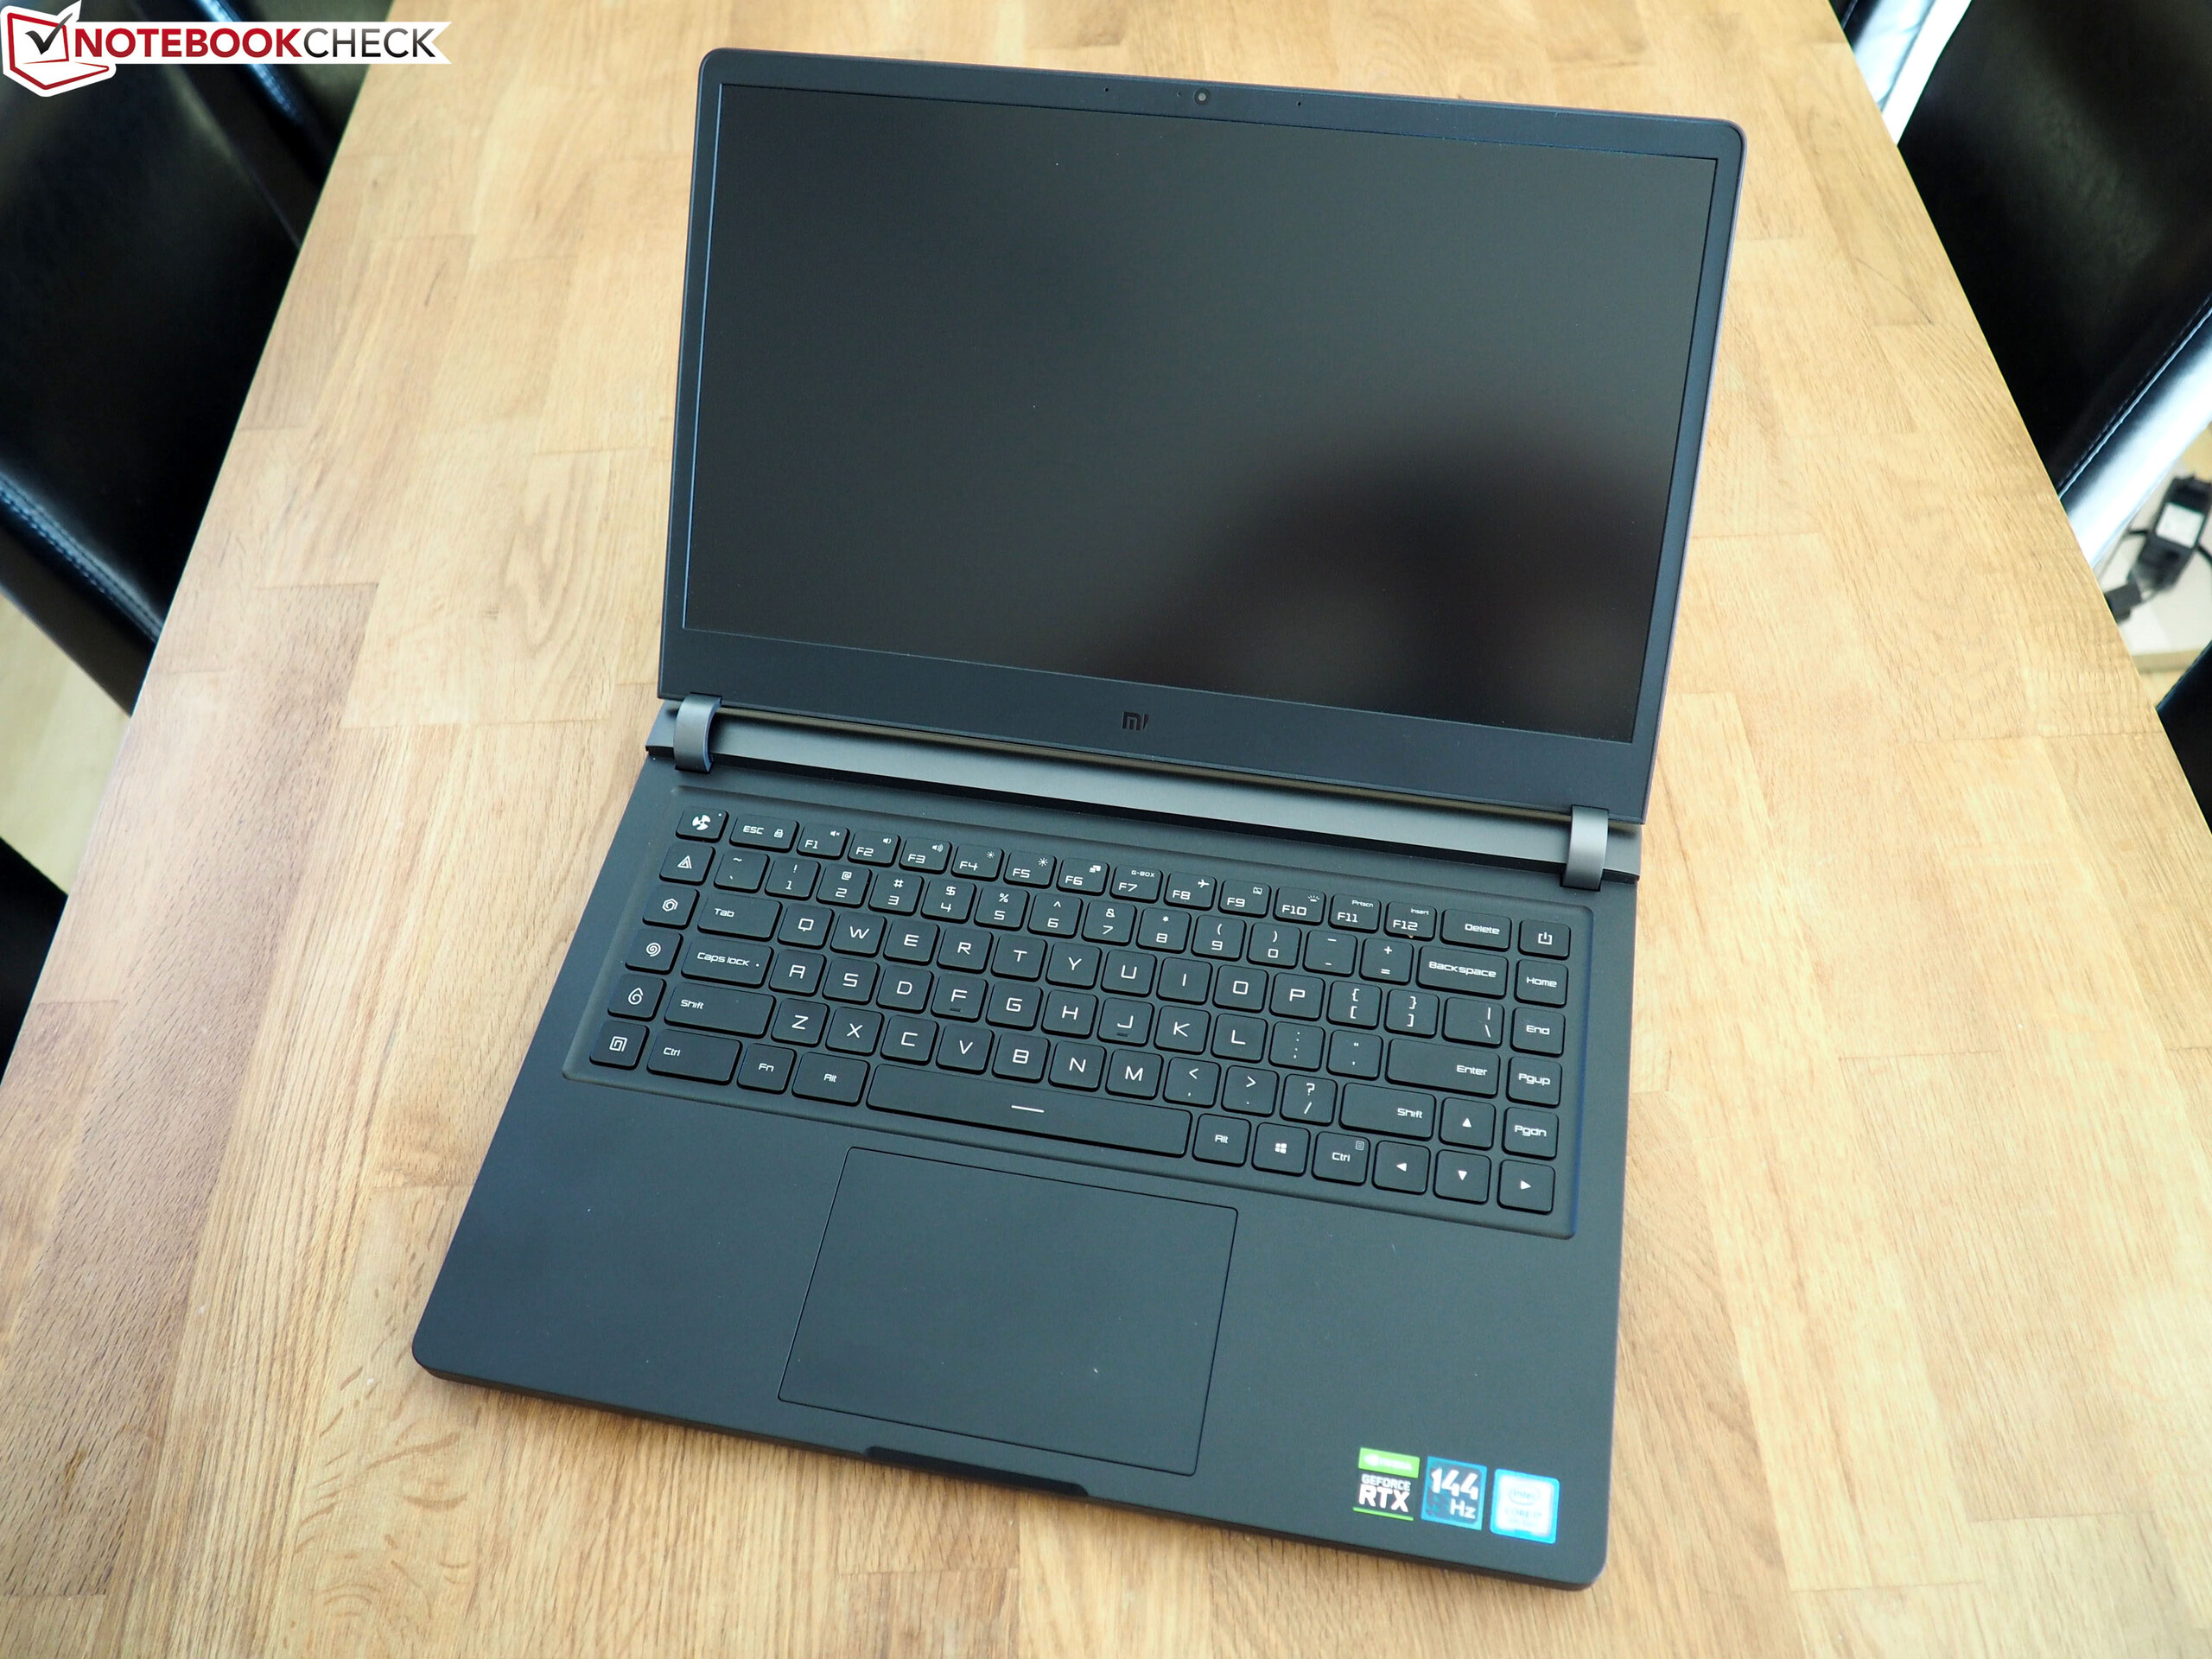
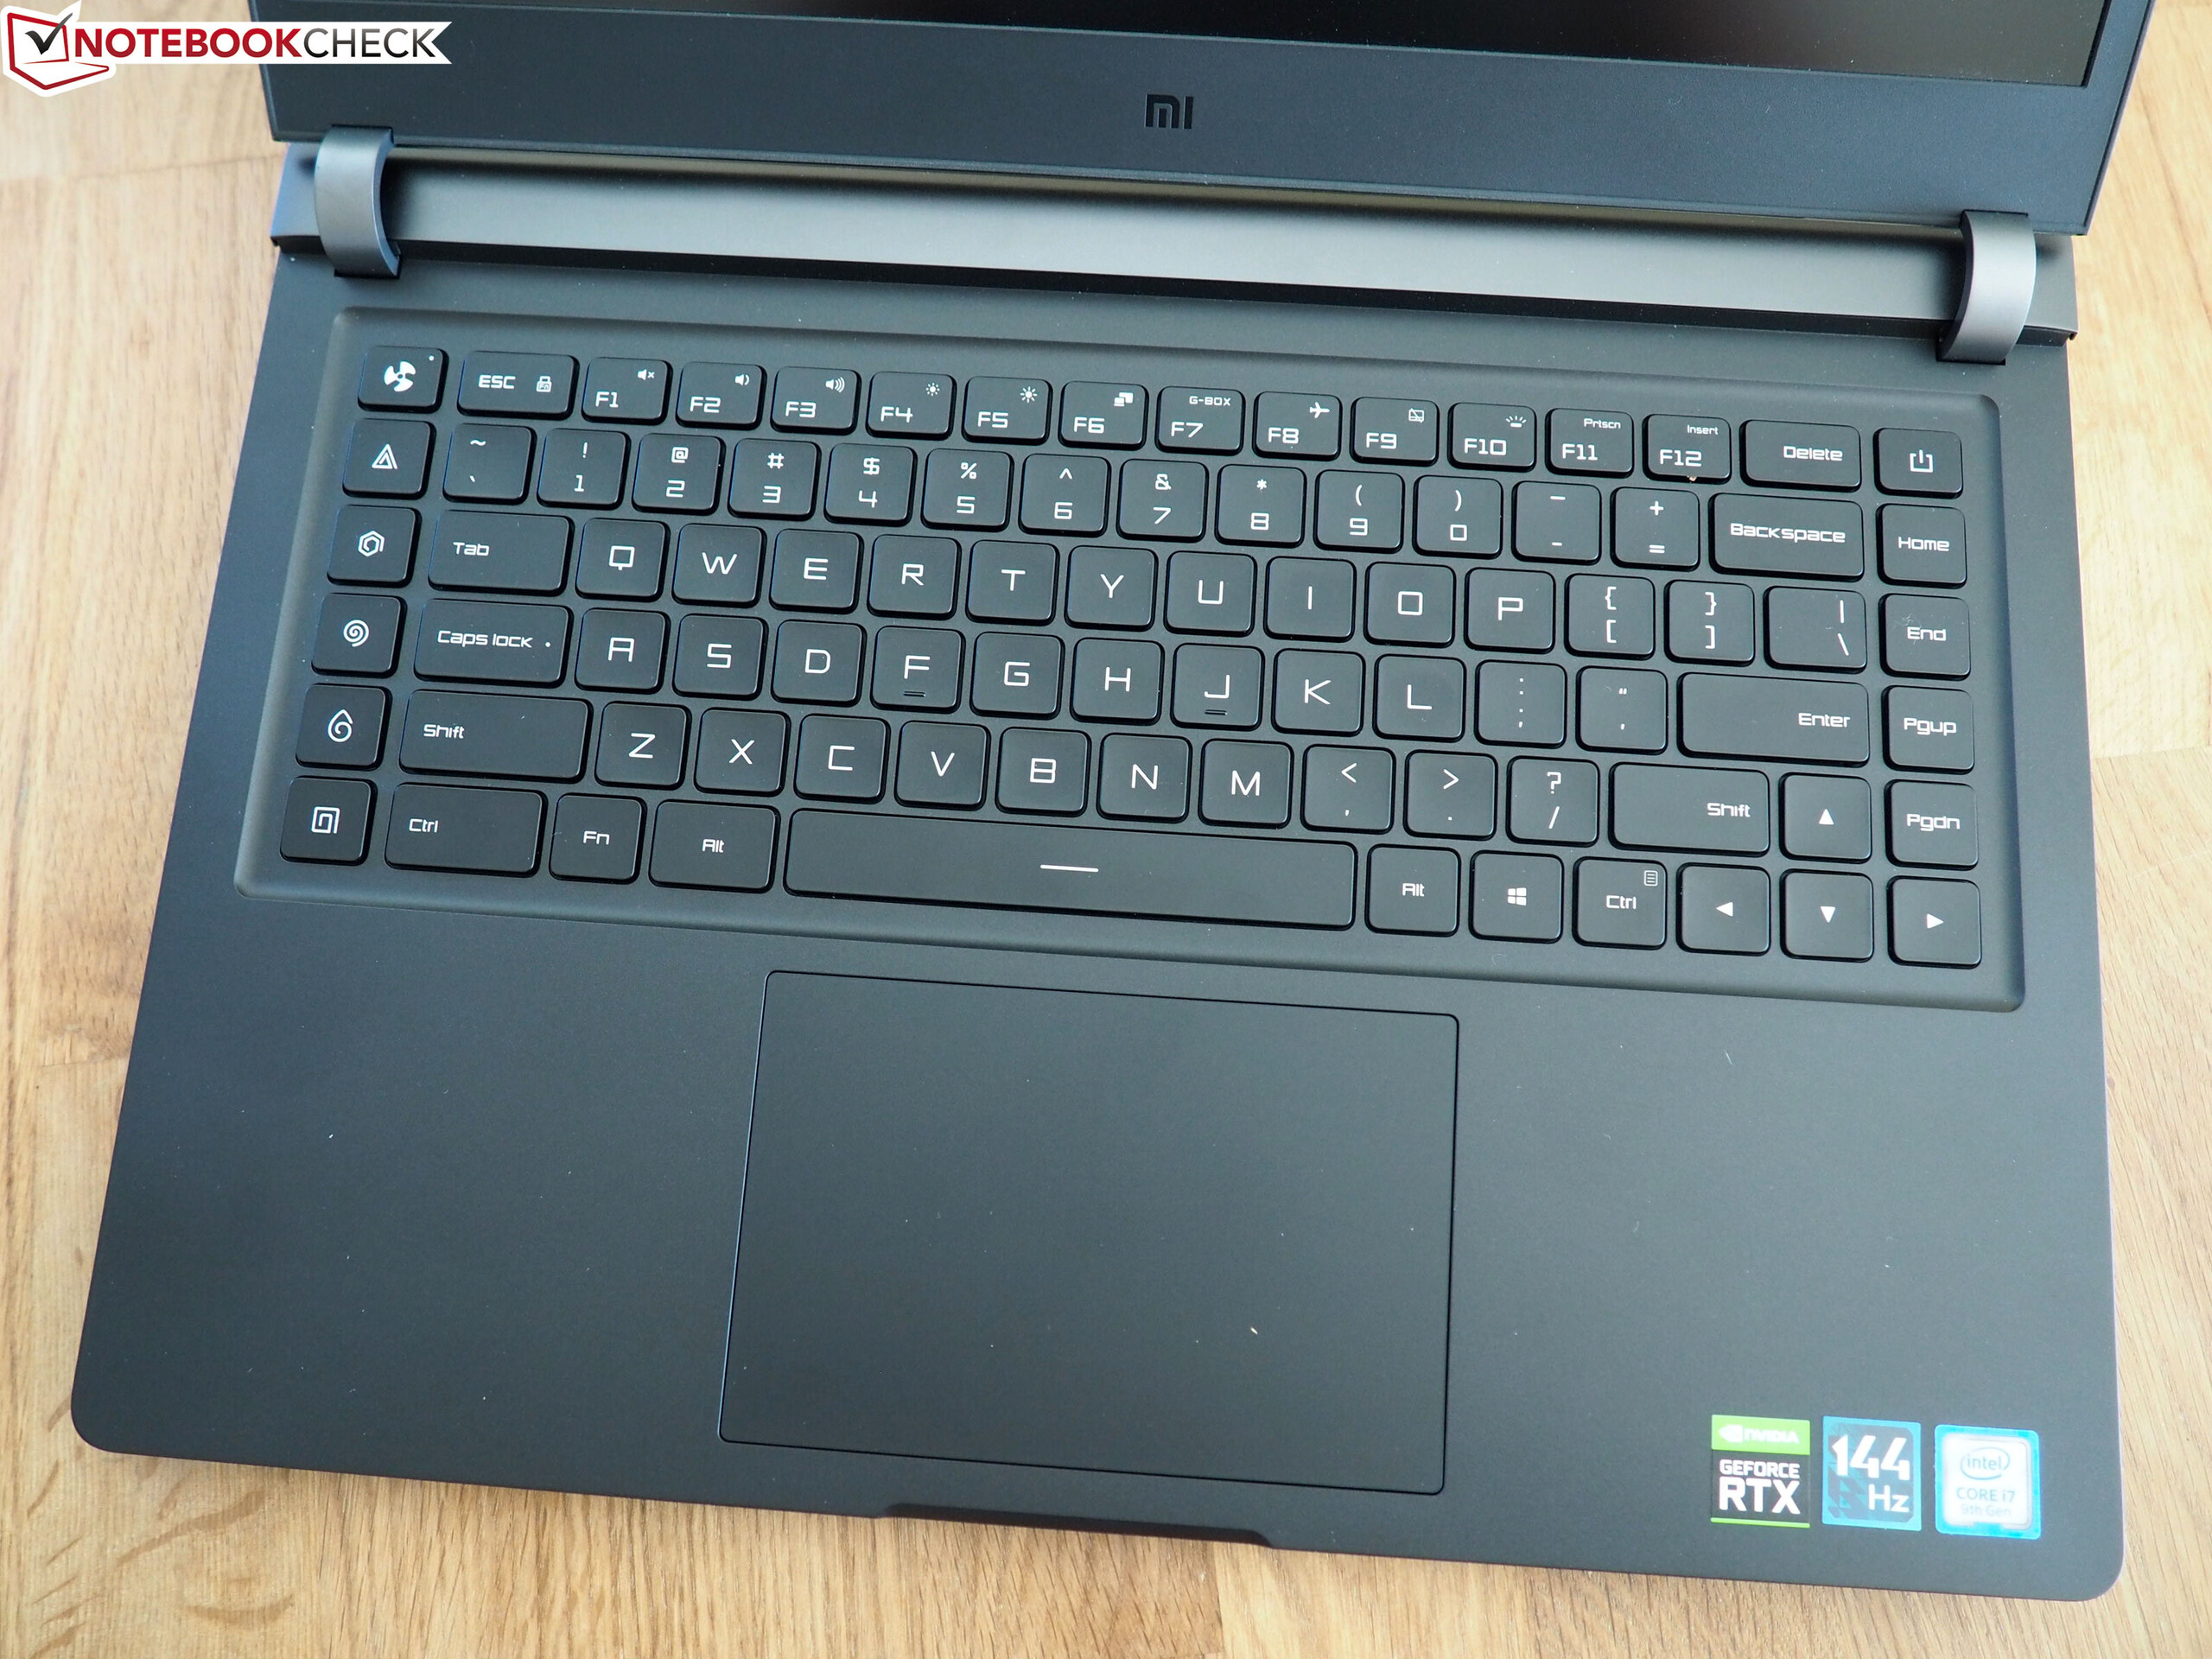
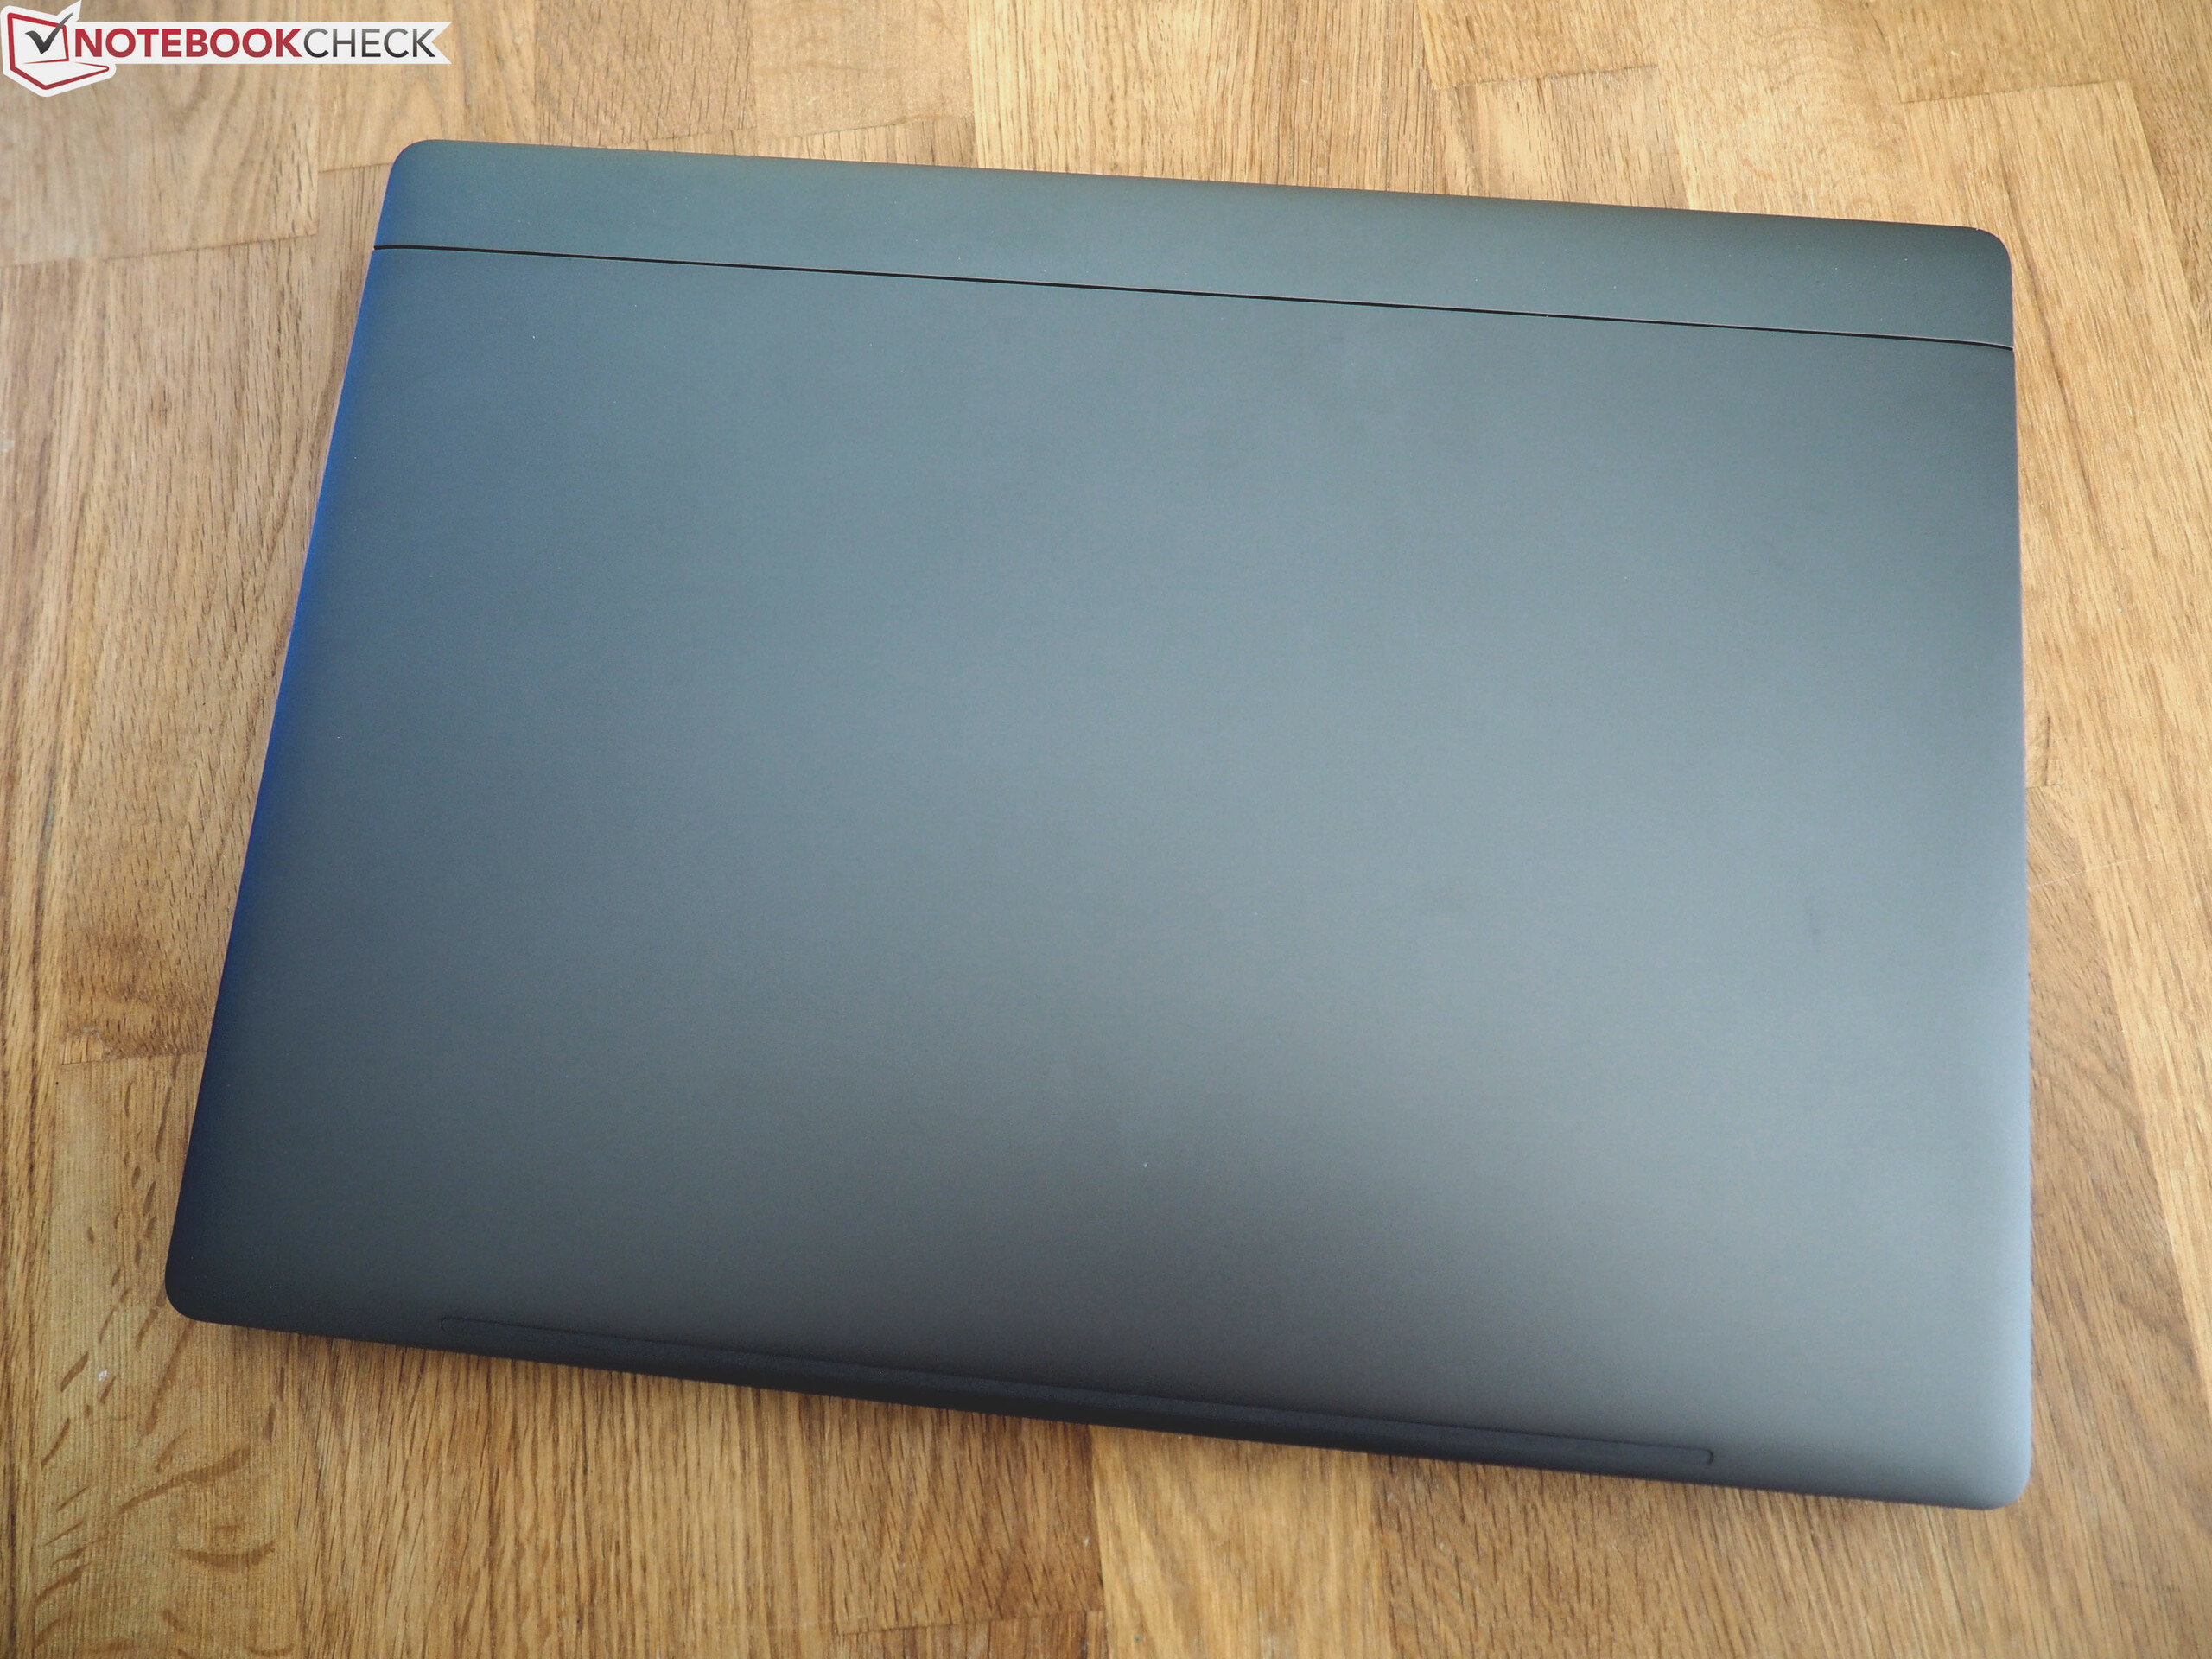
No lado positivo, temos uma carcaça robusta e de alta qualidade, com seu design simples que se encaixa em praticamente todos os lugares. Também gostamos de seus dispositivos de entrada, pois eles eram adequados para o escritório e jogos. A falta do Thunderbolt 3 é compensada por uma tela rápida de 144 Hz e um leitor de cartões mais rápido.
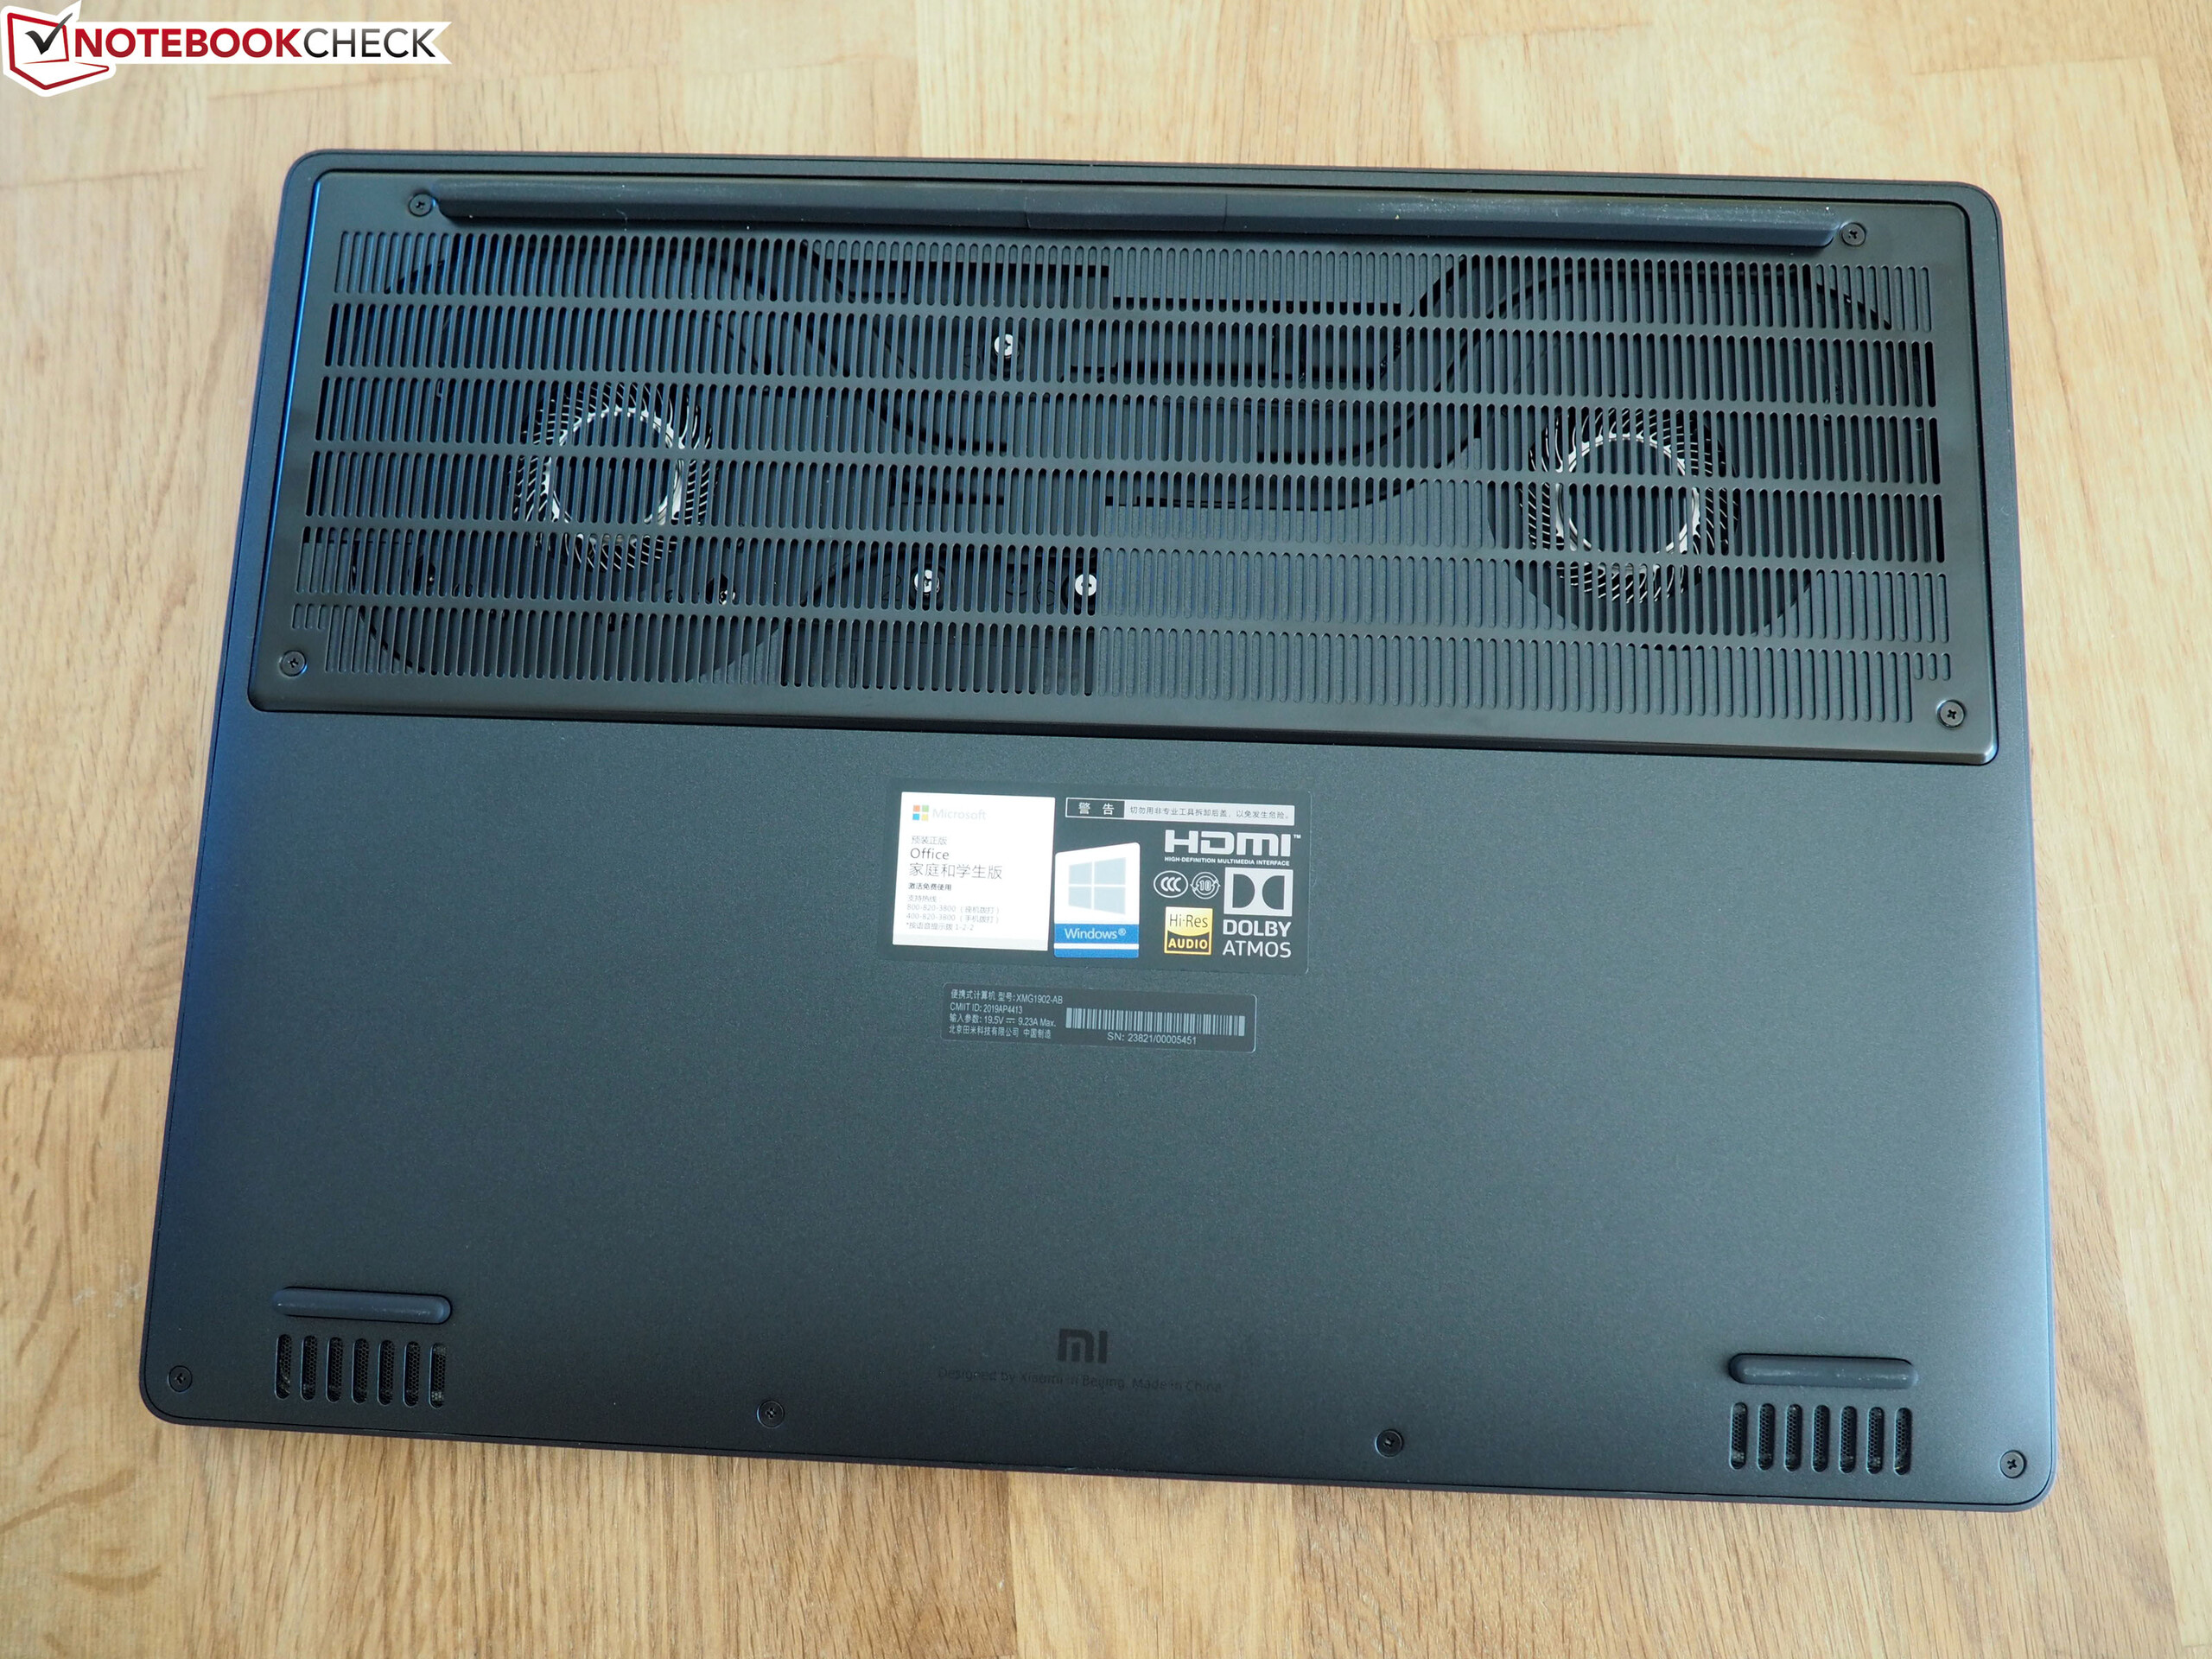
Suas maiores desvantagens são as emissões de ruído, principalmente em 3D. Simplificando, o portátil de 15 polegadas é significativamente barulhento demais, algo que nem mesmo a excelente relação preço-desempenho pode compensar.
Xiaomi Mi Gaming Laptop 2019
- 05/14/2020 v7 (old)
Florian Glaser
Price comparison