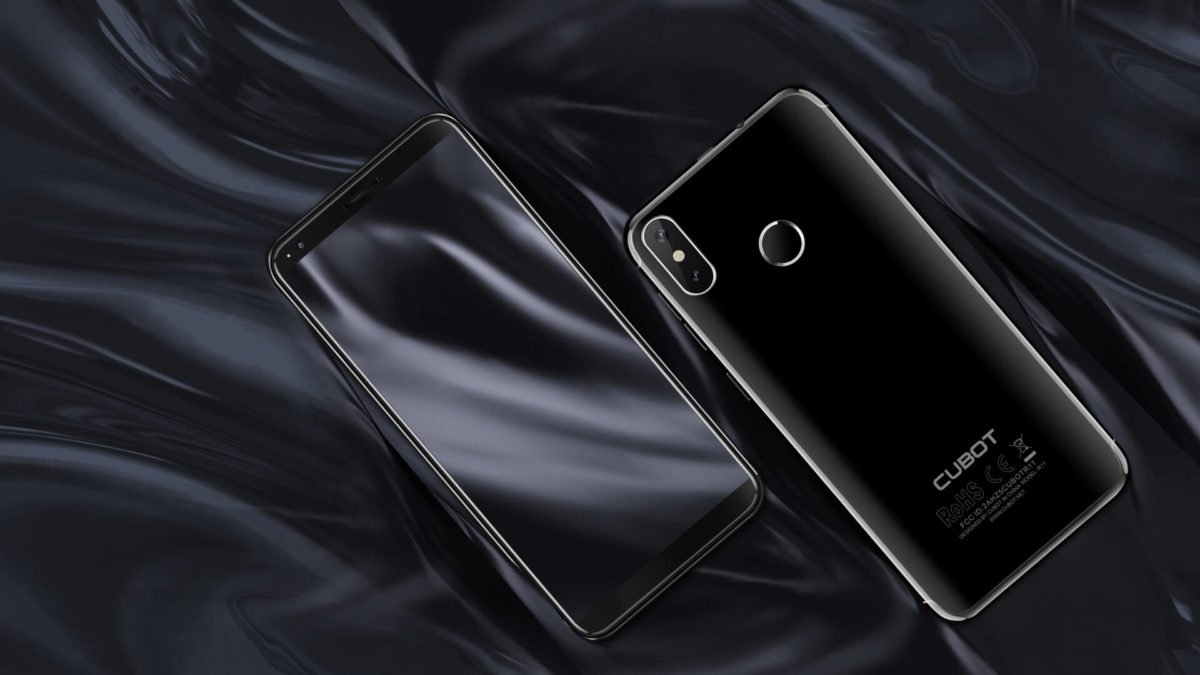
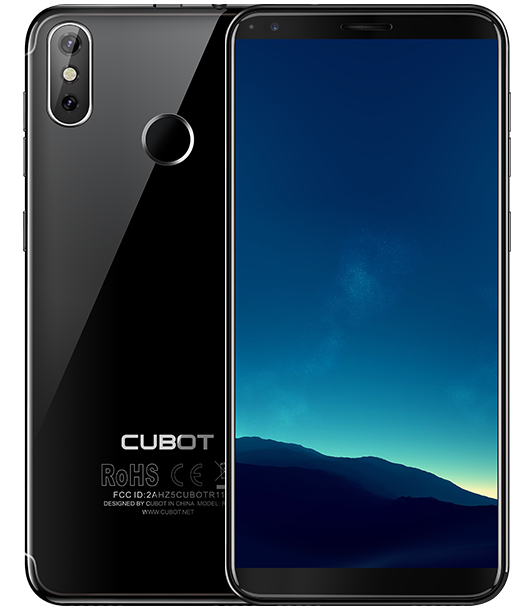
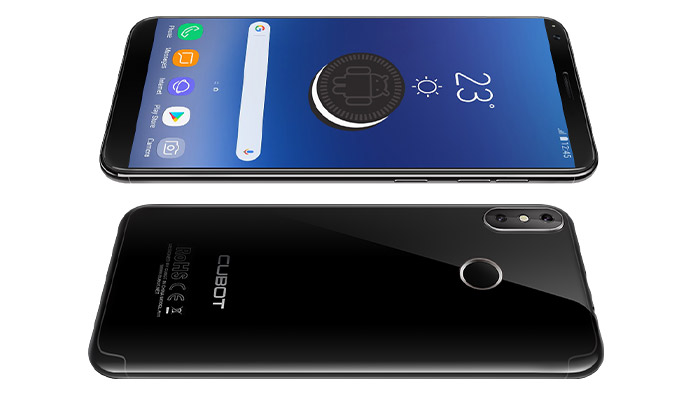
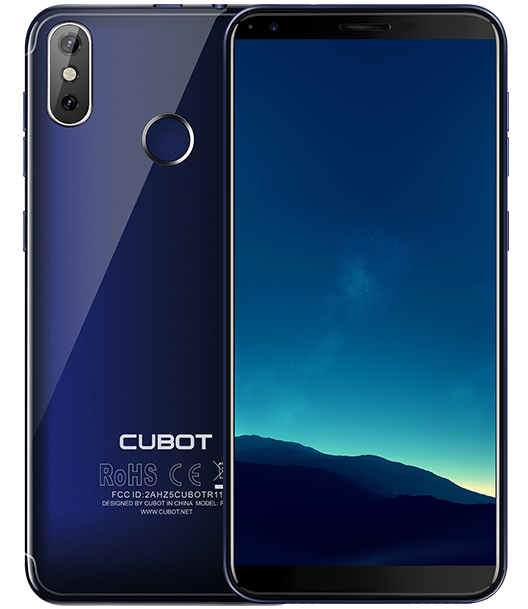
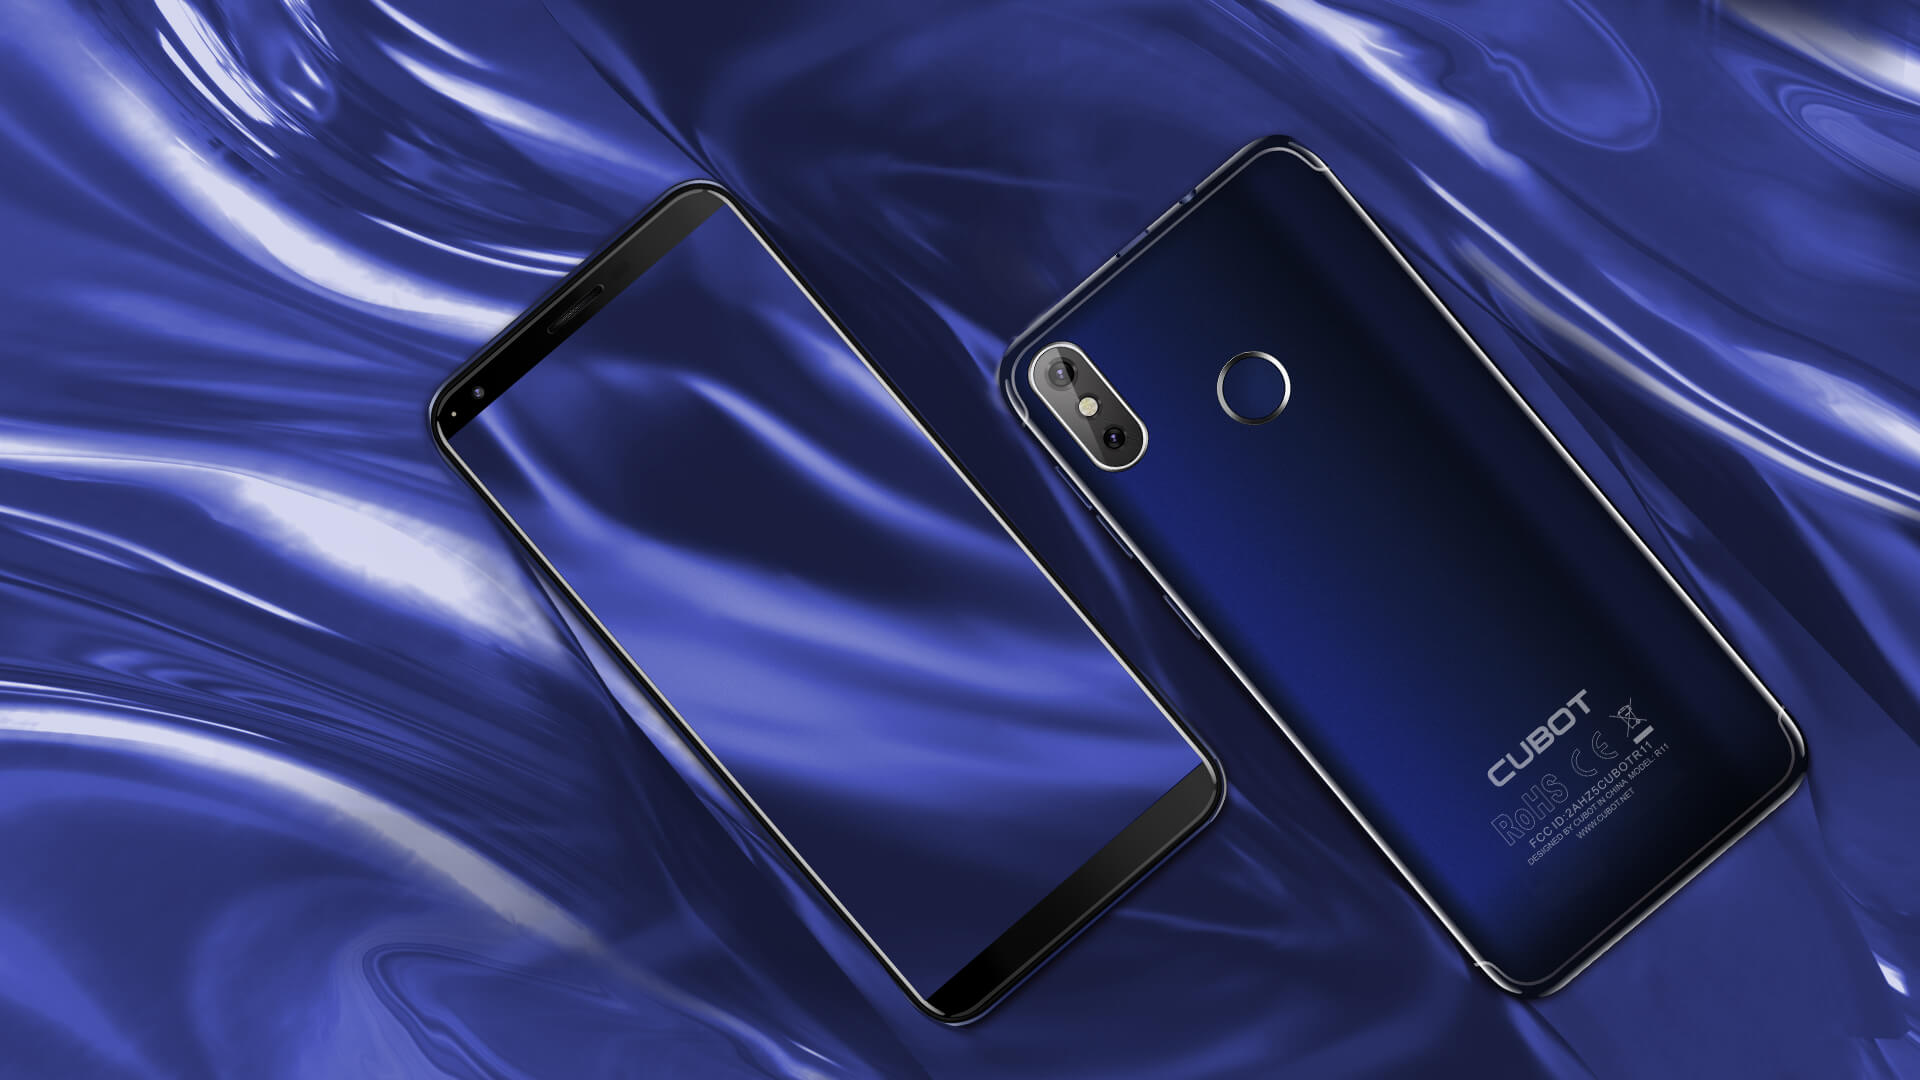
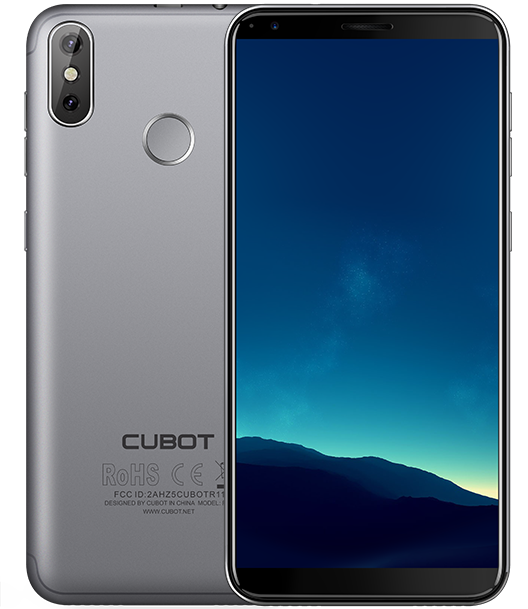
Breve Análise do Smartphone CUBOT R11
| Networking | |
| iperf3 transmit AX12 | |
| Cubot R11 | |
| Nokia 1 | |
| Xiaomi Redmi 5A | |
| Lenovo Moto E4 | |
| Blackview A20 | |
| iperf3 receive AX12 | |
| Cubot R11 | |
| Nokia 1 | |
| Xiaomi Redmi 5A | |
| Blackview A20 | |
| Lenovo Moto E4 | |

| |||||||||||||||||||||||||
iluminação: 72 %
iluminação com acumulador: 428 cd/m²
Contraste: 486:1 (Preto: 0.88 cd/m²)
ΔE ColorChecker Calman: 6.29 | ∀{0.5-29.43 Ø4.71}
ΔE Greyscale Calman: 6.9 | ∀{0.09-98 Ø4.96}
89.7% sRGB (Calman 2D)
Gamma: 2.718
CCT: 7296 K
| Cubot R11 IPS, 1440x720, 5.5" | Blackview A20 IPS, 960x480, 5.5" | Xiaomi Redmi 5A IPS, 1280x720, 5" | Lenovo Moto E4 IPS, 1280x720, 5" | Nokia 1 IPS, 854x480, 4.5" | |
|---|---|---|---|---|---|
| Screen | -18% | 20% | 53% | 54% | |
| Brightness middle (cd/m²) | 428 | 364 -15% | 503 18% | 488 14% | 256 -40% |
| Brightness (cd/m²) | 401 | 375 -6% | 499 24% | 474 18% | 251 -37% |
| Brightness Distribution (%) | 72 | 90 25% | 84 17% | 87 21% | 89 24% |
| Black Level * (cd/m²) | 0.88 | 0.71 19% | 0.73 17% | 0.3 66% | 0.12 86% |
| Contrast (:1) | 486 | 513 6% | 689 42% | 1627 235% | 2133 339% |
| Colorchecker dE 2000 * | 6.29 | 10.12 -61% | 5.44 14% | 5.4 14% | 4.82 23% |
| Colorchecker dE 2000 max. * | 13.2 | 19.63 -49% | 10.01 24% | 9 32% | 11.75 11% |
| Greyscale dE 2000 * | 6.9 | 11.1 -61% | 6.8 1% | 5.5 20% | 5.2 25% |
| Gamma | 2.718 81% | 2.722 81% | 2.451 90% | 2.27 97% | 2.3 96% |
| CCT | 7296 89% | 10121 64% | 6590 99% | 7397 88% | 7107 91% |
* ... menor é melhor
Cintilação da tela / PWM (modulação por largura de pulso)
| Tela tremeluzindo / PWM não detectado |  | ||
[pwm_comparison] Em comparação: 52 % de todos os dispositivos testados não usam PWM para escurecer a tela. Se PWM foi detectado, uma média de 7741 (mínimo: 5 - máximo: 343500) Hz foi medida. | |||
Exibir tempos de resposta
| ↔ Tempo de resposta preto para branco | ||
|---|---|---|
| 28 ms ... ascensão ↗ e queda ↘ combinadas | ↗ 15 ms ascensão | 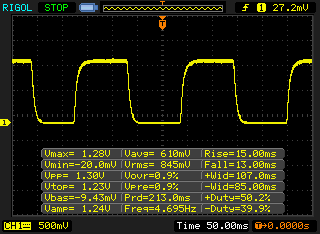 |
| ↘ 13 ms queda | ||
| A tela mostra taxas de resposta relativamente lentas em nossos testes e pode ser muito lenta para os jogadores. Em comparação, todos os dispositivos testados variam de 0.1 (mínimo) a 240 (máximo) ms. » 71 % de todos os dispositivos são melhores. Isso significa que o tempo de resposta medido é pior que a média de todos os dispositivos testados (19.8 ms). | ||
| ↔ Tempo de resposta 50% cinza a 80% cinza | ||
| 42 ms ... ascensão ↗ e queda ↘ combinadas | ↗ 21 ms ascensão | 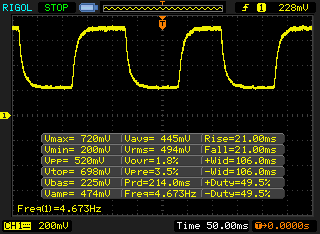 |
| ↘ 21 ms queda | ||
| A tela mostra taxas de resposta lentas em nossos testes e será insatisfatória para os jogadores. Em comparação, todos os dispositivos testados variam de 0.165 (mínimo) a 636 (máximo) ms. » 67 % de todos os dispositivos são melhores. Isso significa que o tempo de resposta medido é pior que a média de todos os dispositivos testados (30.9 ms). | ||
| AnTuTu v6 - Total Score (classificar por valor) | |
| Cubot R11 | |
| Blackview A20 | |
| Xiaomi Redmi 5A | |
| Lenovo Moto E4 | |
| Nokia 1 | |
| Média Mediatek MT6580M (15185 - 25237, n=10) | |
| AnTuTu v7 - Total Score (classificar por valor) | |
| Cubot R11 | |
| Blackview A20 | |
| Xiaomi Redmi 5A | |
| Nokia 1 | |
| Média Mediatek MT6580M (17073 - 21088, n=4) | |
| PCMark for Android - Work performance score (classificar por valor) | |
| Cubot R11 | |
| Blackview A20 | |
| Xiaomi Redmi 5A | |
| Lenovo Moto E4 | |
| Nokia 1 | |
| Média Mediatek MT6580M (2516 - 3041, n=12) | |
| 3DMark | |
| 1280x720 offscreen Ice Storm Unlimited Score (classificar por valor) | |
| Cubot R11 | |
| Blackview A20 | |
| Xiaomi Redmi 5A | |
| Lenovo Moto E4 | |
| Média Mediatek MT6580M (2841 - 2946, n=12) | |
| 1280x720 offscreen Ice Storm Unlimited Graphics Score (classificar por valor) | |
| Cubot R11 | |
| Blackview A20 | |
| Xiaomi Redmi 5A | |
| Lenovo Moto E4 | |
| Média Mediatek MT6580M (2396 - 2485, n=12) | |
| 1280x720 offscreen Ice Storm Unlimited Physics (classificar por valor) | |
| Cubot R11 | |
| Blackview A20 | |
| Xiaomi Redmi 5A | |
| Lenovo Moto E4 | |
| Média Mediatek MT6580M (7498 - 8913, n=12) | |
| JetStream 1.1 - 1.1 Total | |
| Xiaomi Redmi 5A (Chrome 67) | |
| Lenovo Moto E4 (Chrome 60) | |
| Média Mediatek MT6580M (10.8 - 14.5, n=10) | |
| Cubot R11 (Chrome 67) | |
| Nokia 1 (Chrome 66) | |
| Blackview A20 (Chrome 67) | |
| Octane V2 - Total Score | |
| Média da turma Smartphone (2800 - 126661, n=141, últimos 2 anos) | |
| Xiaomi Redmi 5A (Chrome 67) | |
| Lenovo Moto E4 (Chrome 60) | |
| Cubot R11 (Chrome 67) | |
| Média Mediatek MT6580M (1645 - 2280, n=10) | |
| Nokia 1 (Chrome 66) | |
| Blackview A20 (Chrome 67) | |
| Mozilla Kraken 1.1 - Total | |
| Cubot R11 (Chrome 67) | |
| Blackview A20 (Chrome 67) | |
| Nokia 1 (Chrome 66) | |
| Lenovo Moto E4 (Chrome 60) | |
| Média Mediatek MT6580M (14579 - 21257, n=11) | |
| Xiaomi Redmi 5A (Chrome 67) | |
| Média da turma Smartphone (257 - 28190, n=120, últimos 2 anos) | |
* ... menor é melhor
| Cubot R11 | Blackview A20 | Xiaomi Redmi 5A | Lenovo Moto E4 | Nokia 1 | Média 16 GB eMMC Flash | Média da turma Smartphone | |
|---|---|---|---|---|---|---|---|
| AndroBench 3-5 | -12% | 293% | 215% | 13% | 158% | 2420% | |
| Sequential Read 256KB (MB/s) | 135.8 | 90.2 -34% | 293.8 116% | 187.6 38% | 208.3 53% | 164.5 ? 21% | 2236 ? 1547% |
| Sequential Write 256KB (MB/s) | 52 | 8 -85% | 49.86 -4% | 45.3 -13% | 51.8 0% | 43 ? -17% | 1921 ? 3594% |
| Random Read 4KB (MB/s) | 22.1 | 11.3 -49% | 42.32 91% | 18.7 -15% | 25.7 16% | 21.7 ? -2% | 311 ? 1307% |
| Random Write 4KB (MB/s) | 10.8 | 3.4 -69% | 9.28 -14% | 29.2 170% | 9.1 -16% | 8.08 ? -25% | 360 ? 3233% |
| Sequential Read 256KB SDCard (MB/s) | 10.8 ? | 20.6 ? 91% | 84.9 ? 686% | 65.4 506% | 59.1 ? 447% | ||
| Sequential Write 256KB SDCard (MB/s) | 6.38 ? | 11.2 ? 76% | 62.6 ? 881% | 44.9 604% | 39.8 ? 524% |
(±) A temperatura máxima no lado superior é 41.2 °C / 106 F, em comparação com a média de 35.3 °C / 96 F , variando de 21.9 a 247 °C para a classe Smartphone.
(±) A parte inferior aquece até um máximo de 40.3 °C / 105 F, em comparação com a média de 34 °C / 93 F
(+) Em uso inativo, a temperatura média para o lado superior é 29.7 °C / 85 F, em comparação com a média do dispositivo de 33 °C / ### class_avg_f### F.
Cubot R11 análise de áudio
(±) | o volume do alto-falante é médio, mas bom (###valor### dB)
Graves 100 - 315Hz
(-) | quase nenhum baixo - em média 57.8% menor que a mediana
(+) | o baixo é linear (0% delta para a frequência anterior)
Médios 400 - 2.000 Hz
(-) | quase nenhum médio - em média 57.8% menor que a mediana
(+) | médios são lineares (0% delta para frequência anterior)
Altos 2 - 16 kHz
(-) | quase nenhum máximo - em média 57.8% menor que a mediana
(+) | os máximos são lineares (0% delta da frequência anterior)
Geral 100 - 16.000 Hz
(-) | o som geral não é linear (119.8% diferença em relação à mediana)
Comparado com a mesma classe
» 89% de todos os dispositivos testados nesta classe foram melhores, 8% semelhantes, 3% piores
» O melhor teve um delta de 11%, a média foi 34%, o pior foi 134%
Comparado com todos os dispositivos testados
» 97% de todos os dispositivos testados foram melhores, 2% semelhantes, 1% piores
» O melhor teve um delta de 4%, a média foi 23%, o pior foi 134%
Xiaomi Redmi 5A análise de áudio
(±) | o volume do alto-falante é médio, mas bom (###valor### dB)
Graves 100 - 315Hz
(-) | quase nenhum baixo - em média 31.8% menor que a mediana
(±) | a linearidade dos graves é média (10.7% delta para a frequência anterior)
Médios 400 - 2.000 Hz
(+) | médios equilibrados - apenas 2.2% longe da mediana
(+) | médios são lineares (5.9% delta para frequência anterior)
Altos 2 - 16 kHz
(+) | agudos equilibrados - apenas 3.1% longe da mediana
(+) | os máximos são lineares (3.1% delta da frequência anterior)
Geral 100 - 16.000 Hz
(±) | a linearidade do som geral é média (28.5% diferença em relação à mediana)
Comparado com a mesma classe
» 75% de todos os dispositivos testados nesta classe foram melhores, 5% semelhantes, 21% piores
» O melhor teve um delta de 11%, a média foi 34%, o pior foi 134%
Comparado com todos os dispositivos testados
» 86% de todos os dispositivos testados foram melhores, 3% semelhantes, 11% piores
» O melhor teve um delta de 4%, a média foi 23%, o pior foi 134%
| desligado | |
| Ocioso | |
| Carga |
|
Key:
min: | |
| Cubot R11 2800 mAh | Blackview A20 3000 mAh | Xiaomi Redmi 5A 3000 mAh | Lenovo Moto E4 2800 mAh | Nokia 1 2150 mAh | Média Mediatek MT6580M | Média da turma Smartphone | |
|---|---|---|---|---|---|---|---|
| Power Consumption | -8% | 8% | 2% | 12% | 0% | -21% | |
| Idle Minimum * (Watt) | 0.9 | 1.1 -22% | 1.2 -33% | 0.87 3% | 0.9 -0% | 0.805 ? 11% | 0.879 ? 2% |
| Idle Average * (Watt) | 1.5 | 1.5 -0% | 1.5 -0% | 2.38 -59% | 1.5 -0% | 1.736 ? -16% | 1.474 ? 2% |
| Idle Maximum * (Watt) | 2.2 | 2.3 -5% | 1.8 18% | 2.47 -12% | 2 9% | 2.1 ? 5% | 1.663 ? 24% |
| Load Average * (Watt) | 4.6 | 4.8 -4% | 2.9 37% | 2.63 43% | 3.5 24% | 4.82 ? -5% | 6.75 ? -47% |
| Load Maximum * (Watt) | 6 | 6.5 -8% | 4.8 20% | 3.86 36% | 4.3 28% | 5.68 ? 5% | 11.2 ? -87% |
* ... menor é melhor
| Cubot R11 2800 mAh | Blackview A20 3000 mAh | Xiaomi Redmi 5A 3000 mAh | Lenovo Moto E4 2800 mAh | Nokia 1 2150 mAh | |
|---|---|---|---|---|---|
| Duração da bateria | -12% | 58% | -18% | -13% | |
| WiFi v1.3 (h) | 10.6 | 9.3 -12% | 16.8 58% | 8.7 -18% | 9.2 -13% |
| Reader / Idle (h) | 21.7 | ||||
| H.264 (h) | 10.1 | ||||
| Load (h) | 5.3 |
Pro
Contra
O CUBOT R11 é um dispositivo de menos de €100 que impressiona com sua carcaça robusta e longa duração da bateria. No entanto, agora há muitos dispositivos com preços semelhantes que oferecem mais potência, melhores câmeras e suporte para LTE. No lado positivo, o CUBOT R11 tem uma bateria substituível, uma relação de aspecto de 2:1 e dimensões compactas, a última das quais beneficiará aqueles com mãos menores.
O CUBOT R11 é um smartphone de baixo custo que tem boa duração de bateria, uma bateria substituível e uma carcaça robusta. No entanto, um SoC mais poderoso teria feito maravilhas.
No geral, o CUBOT R11 é um típico smartphone de nível básico que se sai bem em algumas áreas, mas em outras nem tanto.
Cubot R11
- 07/26/2018 v6 (old)
Florian Wimmer
Price comparison
