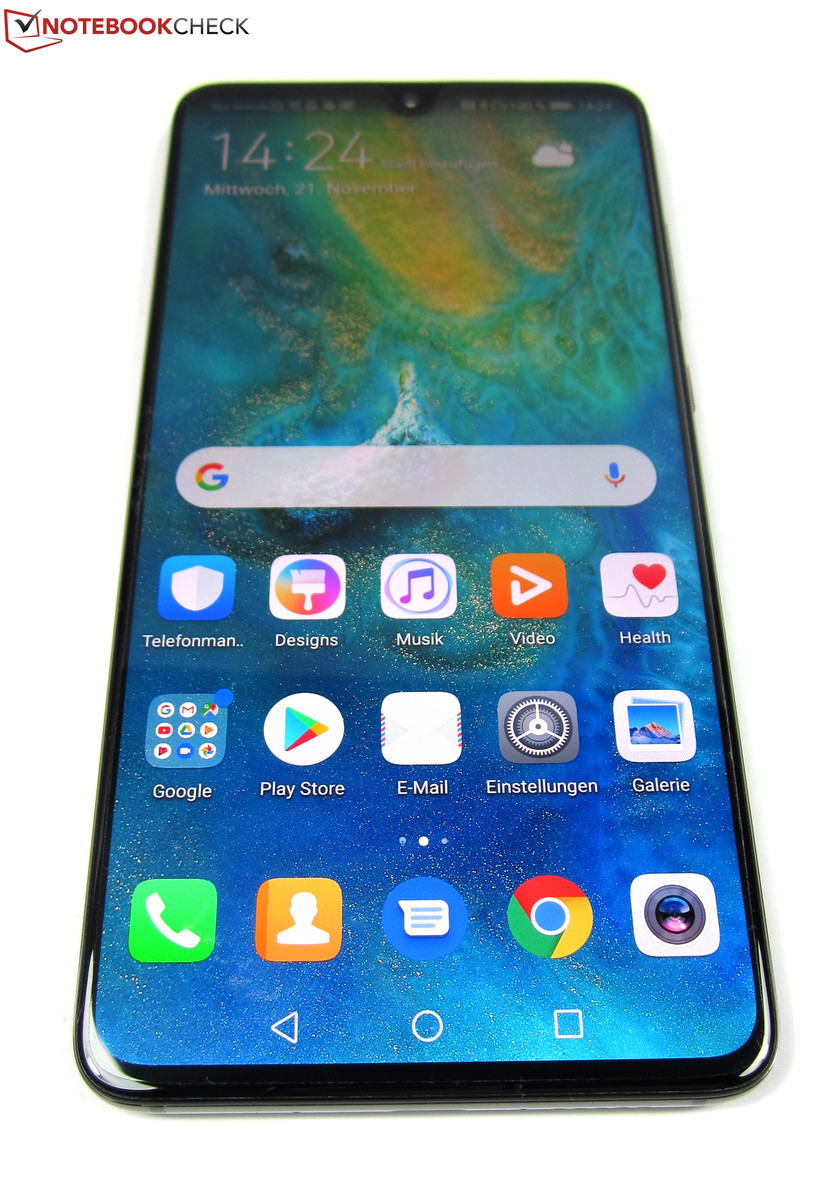
Breve Análise do Smartphone Huawei Mate 20


| |||||||||||||||||||||||||
iluminação: 94 %
iluminação com acumulador: 782 cd/m²
Contraste: 2172:1 (Preto: 0.36 cd/m²)
ΔE ColorChecker Calman: 2.3 | ∀{0.5-29.43 Ø4.71}
ΔE Greyscale Calman: 2.4 | ∀{0.09-98 Ø4.96}
97.4% sRGB (Calman 2D)
Gamma: 2.22
CCT: 6839 K
| Huawei Mate 20 TFT-LCD (IPS), 2244x1080, 6.5" | HTC U12 Plus Super LCD 6, 2880x1440, 6" | Huawei Mate 20 Pro OLED, 3120x1440, 6.3" | Huawei Mate 10 IPS, 2560x1440, 5.9" | LG V30 OLED, 2880x1440, 6" | OnePlus 6T Optic AMOLED, 2340x1080, 6.4" | Xiaomi Mi 8 Explorer Edition Super AMOLED, 2248x1080, 6.2" | |
|---|---|---|---|---|---|---|---|
| Screen | -3% | 12% | 4% | -54% | -5% | -26% | |
| Brightness middle (cd/m²) | 782 | 395 -49% | 576 -26% | 704 -10% | 432 -45% | 437 -44% | 429 -45% |
| Brightness (cd/m²) | 784 | 402 -49% | 582 -26% | 692 -12% | 428 -45% | 442 -44% | 432 -45% |
| Brightness Distribution (%) | 94 | 90 -4% | 90 -4% | 94 0% | 87 -7% | 95 1% | 88 -6% |
| Black Level * (cd/m²) | 0.36 | 0.37 -3% | 0.28 22% | ||||
| Contrast (:1) | 2172 | 1068 -51% | 2514 16% | ||||
| Colorchecker dE 2000 * | 2.3 | 1.6 30% | 1.3 43% | 2.4 -4% | 4.18 -82% | 2.21 4% | 3.39 -47% |
| Colorchecker dE 2000 max. * | 7 | 3.4 51% | 3.5 50% | 4.2 40% | 8.53 -22% | 4.27 39% | 5.25 25% |
| Greyscale dE 2000 * | 2.4 | 1.1 54% | 1.6 33% | 2.8 -17% | 5.3 -121% | 2.1 12% | 3.3 -38% |
| Gamma | 2.22 99% | 2.14 103% | 2.18 101% | 2.34 94% | 2.33 94% | 2.307 95% | 2.238 98% |
| CCT | 6839 95% | 6536 99% | 6561 99% | 6423 101% | 7487 87% | 6353 102% | 7135 91% |
* ... menor é melhor
Cintilação da tela / PWM (modulação por largura de pulso)
| Tela tremeluzindo/PWM detectado | 14880 Hz | ≤ 28 % configuração de brilho | 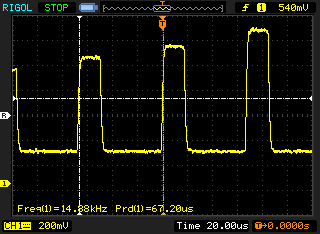 |
A luz de fundo da tela pisca em 14880 Hz (pior caso, por exemplo, utilizando PWM) Cintilação detectada em uma configuração de brilho de 28 % e abaixo. Não deve haver cintilação ou PWM acima desta configuração de brilho. A frequência de 14880 Hz é bastante alta, então a maioria dos usuários sensíveis ao PWM não deve notar nenhuma oscilação. [pwm_comparison] Em comparação: 52 % de todos os dispositivos testados não usam PWM para escurecer a tela. Se PWM foi detectado, uma média de 7748 (mínimo: 5 - máximo: 343500) Hz foi medida. | |||
Exibir tempos de resposta
| ↔ Tempo de resposta preto para branco | ||
|---|---|---|
| 26 ms ... ascensão ↗ e queda ↘ combinadas | ↗ 8.4 ms ascensão | 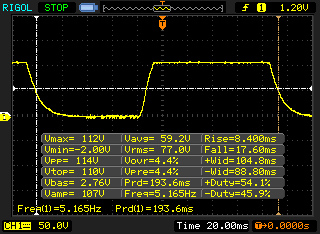 |
| ↘ 17.6 ms queda | ||
| A tela mostra taxas de resposta relativamente lentas em nossos testes e pode ser muito lenta para os jogadores. Em comparação, todos os dispositivos testados variam de 0.1 (mínimo) a 240 (máximo) ms. » 63 % de todos os dispositivos são melhores. Isso significa que o tempo de resposta medido é pior que a média de todos os dispositivos testados (19.8 ms). | ||
| ↔ Tempo de resposta 50% cinza a 80% cinza | ||
| 59.2 ms ... ascensão ↗ e queda ↘ combinadas | ↗ 26.8 ms ascensão | 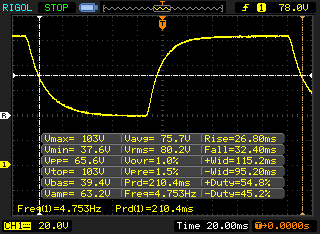 |
| ↘ 32.4 ms queda | ||
| A tela mostra taxas de resposta lentas em nossos testes e será insatisfatória para os jogadores. Em comparação, todos os dispositivos testados variam de 0.165 (mínimo) a 636 (máximo) ms. » 95 % de todos os dispositivos são melhores. Isso significa que o tempo de resposta medido é pior que a média de todos os dispositivos testados (30.9 ms). | ||
| AnTuTu v7 - Total Score (classificar por valor) | |
| Huawei Mate 20 | |
| HTC U12 Plus | |
| Huawei Mate 20 Pro | |
| OnePlus 6T | |
| Xiaomi Mi 8 Explorer Edition | |
| Média HiSilicon Kirin 980 (268359 - 322616, n=10) | |
| AnTuTu v6 - Total Score (classificar por valor) | |
| Huawei Mate 20 | |
| HTC U12 Plus | |
| Huawei Mate 20 Pro | |
| Huawei Mate 10 | |
| LG V30 | |
| OnePlus 6T | |
| Xiaomi Mi 8 Explorer Edition | |
| Média HiSilicon Kirin 980 (245662 - 254229, n=9) | |
| JetStream 1.1 - 1.1 Total | |
| Huawei Mate 20 Pro (Chrome 69) | |
| Huawei Mate 20 (Chrome 70.0.3538.80) | |
| Média HiSilicon Kirin 980 (93.2 - 109.9, n=9) | |
| HTC U12 Plus (Chrome 66) | |
| OnePlus 6T (Chrome 70) | |
| Xiaomi Mi 8 Explorer Edition (Chrome 69) | |
| Huawei Mate 10 (Chrome Version 63) | |
| LG V30 (Chrome 62) | |
| Octane V2 - Total Score | |
| Média da turma Smartphone (2800 - 126661, n=141, últimos 2 anos) | |
| Huawei Mate 20 Pro (Chrome 69) | |
| Huawei Mate 20 (Chrome 70.0.3538.80) | |
| Média HiSilicon Kirin 980 (20618 - 23285, n=10) | |
| OnePlus 6T (Chrome 70) | |
| HTC U12 Plus (Chrome 66) | |
| Xiaomi Mi 8 Explorer Edition (Chrome 69) | |
| Huawei Mate 10 (Chrome Version 63) | |
| LG V30 (Chrome 62) | |
| Mozilla Kraken 1.1 - Total | |
| Huawei Mate 10 (Chrome Version 63) | |
| LG V30 (Chrome 62) | |
| HTC U12 Plus (Chrome 66) | |
| Xiaomi Mi 8 Explorer Edition (Chrome 69) | |
| OnePlus 6T (Chrome 70) | |
| Média HiSilicon Kirin 980 (1948 - 3098, n=10) | |
| Huawei Mate 20 Pro (Chrome 69) | |
| Huawei Mate 20 (Chrome 70.0.3538.80) | |
| Média da turma Smartphone (257 - 28190, n=120, últimos 2 anos) | |
| WebXPRT 3 - Overall | |
| Média da turma Smartphone (104 - 380, n=12, últimos 2 anos) | |
| Huawei Mate 20 (Chrome 70.0.3538.80) | |
| Huawei Mate 20 Pro (Chrome 69) | |
| Média HiSilicon Kirin 980 (86 - 124, n=10) | |
| HTC U12 Plus (Chrome 66) | |
| WebXPRT 2015 - Overall | |
| Huawei Mate 20 Pro (Chrome 69) | |
| Huawei Mate 20 (Chrome 70.0.3538.80) | |
| Média HiSilicon Kirin 980 (228 - 334, n=5) | |
| OnePlus 6T (Chrome 70) | |
| HTC U12 Plus (Chrome 66) | |
| Xiaomi Mi 8 Explorer Edition (Chrome 69) | |
| Huawei Mate 10 (Chrome Version 63) | |
| LG V30 (Chrome 62) | |
* ... menor é melhor
| Huawei Mate 20 | HTC U12 Plus | Huawei Mate 20 Pro | Huawei Mate 10 | LG V30 | OnePlus 6T | Xiaomi Mi 8 Explorer Edition | Média 128 GB UFS 2.1 Flash | Média da turma Smartphone | |
|---|---|---|---|---|---|---|---|---|---|
| AndroBench 3-5 | -14% | 0% | -8% | -38% | -27% | -29% | -0% | 317% | |
| Sequential Read 256KB (MB/s) | 840 | 709 -16% | 853 2% | 790 -6% | 669 -20% | 735 -12% | 692 -18% | 762 ? -9% | 2236 ? 166% |
| Sequential Write 256KB (MB/s) | 196.7 | 195.8 0% | 196.4 0% | 201.7 3% | 193.2 -2% | 204.4 4% | 205.2 4% | 300 ? 53% | 1918 ? 875% |
| Random Read 4KB (MB/s) | 157.9 | 118.1 -25% | 157.4 0% | 169.7 7% | 78.2 -50% | 138.5 -12% | 135.2 -14% | 154.7 ? -2% | 312 ? 98% |
| Random Write 4KB (MB/s) | 158.1 | 104.2 -34% | 157.8 0% | 105.3 -33% | 10.21 -94% | 22 -86% | 22.65 -86% | 131.1 ? -17% | 359 ? 127% |
| Sequential Read 256KB SDCard (MB/s) | 83.2 ? | 84.3 ? 1% | 83.2 ? 0% | 80.6 ? -3% | 62.8 -25% | 76 ? -9% | |||
| Sequential Write 256KB SDCard (MB/s) | 72.3 ? | 63.6 ? -12% | 72.4 ? 0% | 62.9 ? -13% | 47.2 -35% | 59.6 ? -18% |
Asphalt 9: Legends
PUBG Mobile
(+) A temperatura máxima no lado superior é 37.3 °C / 99 F, em comparação com a média de 35.3 °C / 96 F , variando de 21.9 a 247 °C para a classe Smartphone.
(+) A parte inferior aquece até um máximo de 36.4 °C / 98 F, em comparação com a média de 34 °C / 93 F
(±) Em uso inativo, a temperatura média para o lado superior é 32.3 °C / 90 F, em comparação com a média do dispositivo de 33 °C / ### class_avg_f### F.
Huawei Mate 20 análise de áudio
(±) | o volume do alto-falante é médio, mas bom (###valor### dB)
Graves 100 - 315Hz
(-) | quase nenhum baixo - em média 18.1% menor que a mediana
(±) | a linearidade dos graves é média (12.5% delta para a frequência anterior)
Médios 400 - 2.000 Hz
(+) | médios equilibrados - apenas 4.5% longe da mediana
(+) | médios são lineares (4.8% delta para frequência anterior)
Altos 2 - 16 kHz
(±) | máximos mais altos - em média 7.5% maior que a mediana
(+) | os máximos são lineares (6.2% delta da frequência anterior)
Geral 100 - 16.000 Hz
(±) | a linearidade do som geral é média (23.2% diferença em relação à mediana)
Comparado com a mesma classe
» 53% de todos os dispositivos testados nesta classe foram melhores, 7% semelhantes, 40% piores
» O melhor teve um delta de 11%, a média foi 34%, o pior foi 134%
Comparado com todos os dispositivos testados
» 70% de todos os dispositivos testados foram melhores, 5% semelhantes, 25% piores
» O melhor teve um delta de 4%, a média foi 23%, o pior foi 134%
Huawei Mate 20 Pro análise de áudio
(±) | o volume do alto-falante é médio, mas bom (###valor### dB)
Graves 100 - 315Hz
(±) | graves reduzidos - em média 14.2% menor que a mediana
(±) | a linearidade dos graves é média (12.4% delta para a frequência anterior)
Médios 400 - 2.000 Hz
(±) | médios mais altos - em média 6.7% maior que a mediana
(+) | médios são lineares (5.5% delta para frequência anterior)
Altos 2 - 16 kHz
(±) | máximos mais altos - em média 7.3% maior que a mediana
(+) | os máximos são lineares (6.7% delta da frequência anterior)
Geral 100 - 16.000 Hz
(±) | a linearidade do som geral é média (22.9% diferença em relação à mediana)
Comparado com a mesma classe
» 51% de todos os dispositivos testados nesta classe foram melhores, 7% semelhantes, 42% piores
» O melhor teve um delta de 11%, a média foi 34%, o pior foi 134%
Comparado com todos os dispositivos testados
» 68% de todos os dispositivos testados foram melhores, 6% semelhantes, 26% piores
» O melhor teve um delta de 4%, a média foi 23%, o pior foi 134%
| desligado | |
| Ocioso | |
| Carga |
|
Key:
min: | |
| Huawei Mate 20 4000 mAh | HTC U12 Plus 3500 mAh | Huawei Mate 20 Pro 4200 mAh | Huawei Mate 10 4000 mAh | LG V30 3300 mAh | OnePlus 6T 3700 mAh | Xiaomi Mi 8 Explorer Edition 3000 mAh | Média HiSilicon Kirin 980 | Média da turma Smartphone | |
|---|---|---|---|---|---|---|---|---|---|
| Power Consumption | -7% | 4% | -5% | 24% | 18% | -50% | 4% | -4% | |
| Idle Minimum * (Watt) | 0.69 | 0.77 -12% | 0.95 -38% | 0.89 -29% | 0.72 -4% | 0.7 -1% | 1.8 -161% | 0.802 ? -16% | 0.885 ? -28% |
| Idle Average * (Watt) | 2.28 | 2.18 4% | 2.17 5% | 2.31 -1% | 1.37 40% | 1.1 52% | 2.9 -27% | 2.07 ? 9% | 1.483 ? 35% |
| Idle Maximum * (Watt) | 2.52 | 2.21 12% | 2.25 11% | 2.38 6% | 1.41 44% | 2.1 17% | 3.5 -39% | 2.37 ? 6% | 1.671 ? 34% |
| Load Average * (Watt) | 5.21 | 6.25 -20% | 4.47 14% | 4.87 7% | 3.46 34% | 4.2 19% | 4.8 8% | 4.87 ? 7% | 6.73 ? -29% |
| Load Maximum * (Watt) | 8.49 | 10.16 -20% | 6.15 28% | 9.16 -8% | 7.83 8% | 8.3 2% | 11.2 -32% | 7.46 ? 12% | 11.2 ? -32% |
* ... menor é melhor
| Huawei Mate 20 4000 mAh | HTC U12 Plus 3500 mAh | Huawei Mate 20 Pro 4200 mAh | Huawei Mate 10 4000 mAh | LG V30 3300 mAh | OnePlus 6T 3700 mAh | Xiaomi Mi 8 Explorer Edition 3000 mAh | |
|---|---|---|---|---|---|---|---|
| Duração da bateria | -36% | -10% | -7% | -10% | -5% | -23% | |
| Reader / Idle (h) | 31.5 | 24.2 -23% | 29.1 -8% | 27.9 -11% | 31.9 1% | 32.3 3% | 23.4 -26% |
| H.264 (h) | 17.2 | 7.7 -55% | 14.2 -17% | 16.7 -3% | 13.7 -20% | 15.1 -12% | 15.4 -10% |
| WiFi v1.3 (h) | 14.8 | 8.5 -43% | 12.8 -14% | 14.4 -3% | 12.9 -13% | 14.4 -3% | 11.6 -22% |
| Load (h) | 4.8 | 3.8 -21% | 4.7 -2% | 4.3 -10% | 4.5 -6% | 4.4 -8% | 3.2 -33% |
Pro
Contra
O Huawei Mate 20 é um carro-chefe parecido ao seu irmão mais caro, o Mate 20 Pro. A Huawei equipou o Mate 20 com o seu SoC Kirin 980, o que torna o dispositivo tão poderoso quanto o modelo Pro. Além disso, a tela de resolução mais baixa do primeiro ajuda a conseguir uma excelente duração da bateria, enquanto a inclusão de um conector de fone de ouvido é um bônus bem-vindo. O Mate 20 carece de alguns dos recursos extravagantes do Mate 20 Pro, como a digitalização facial 3D, o sensor de digitais na tela ou o carregamento sem fio, o que pode frustrar algumas pessoas.
O Huawei Mate 20 é um smartphone fantástico, mas que renuncia a alguns dos recursos premium do Mate 20 Pro. No entanto, em nossa opinião, vale a pena economizar os 200-Euros (~$225).
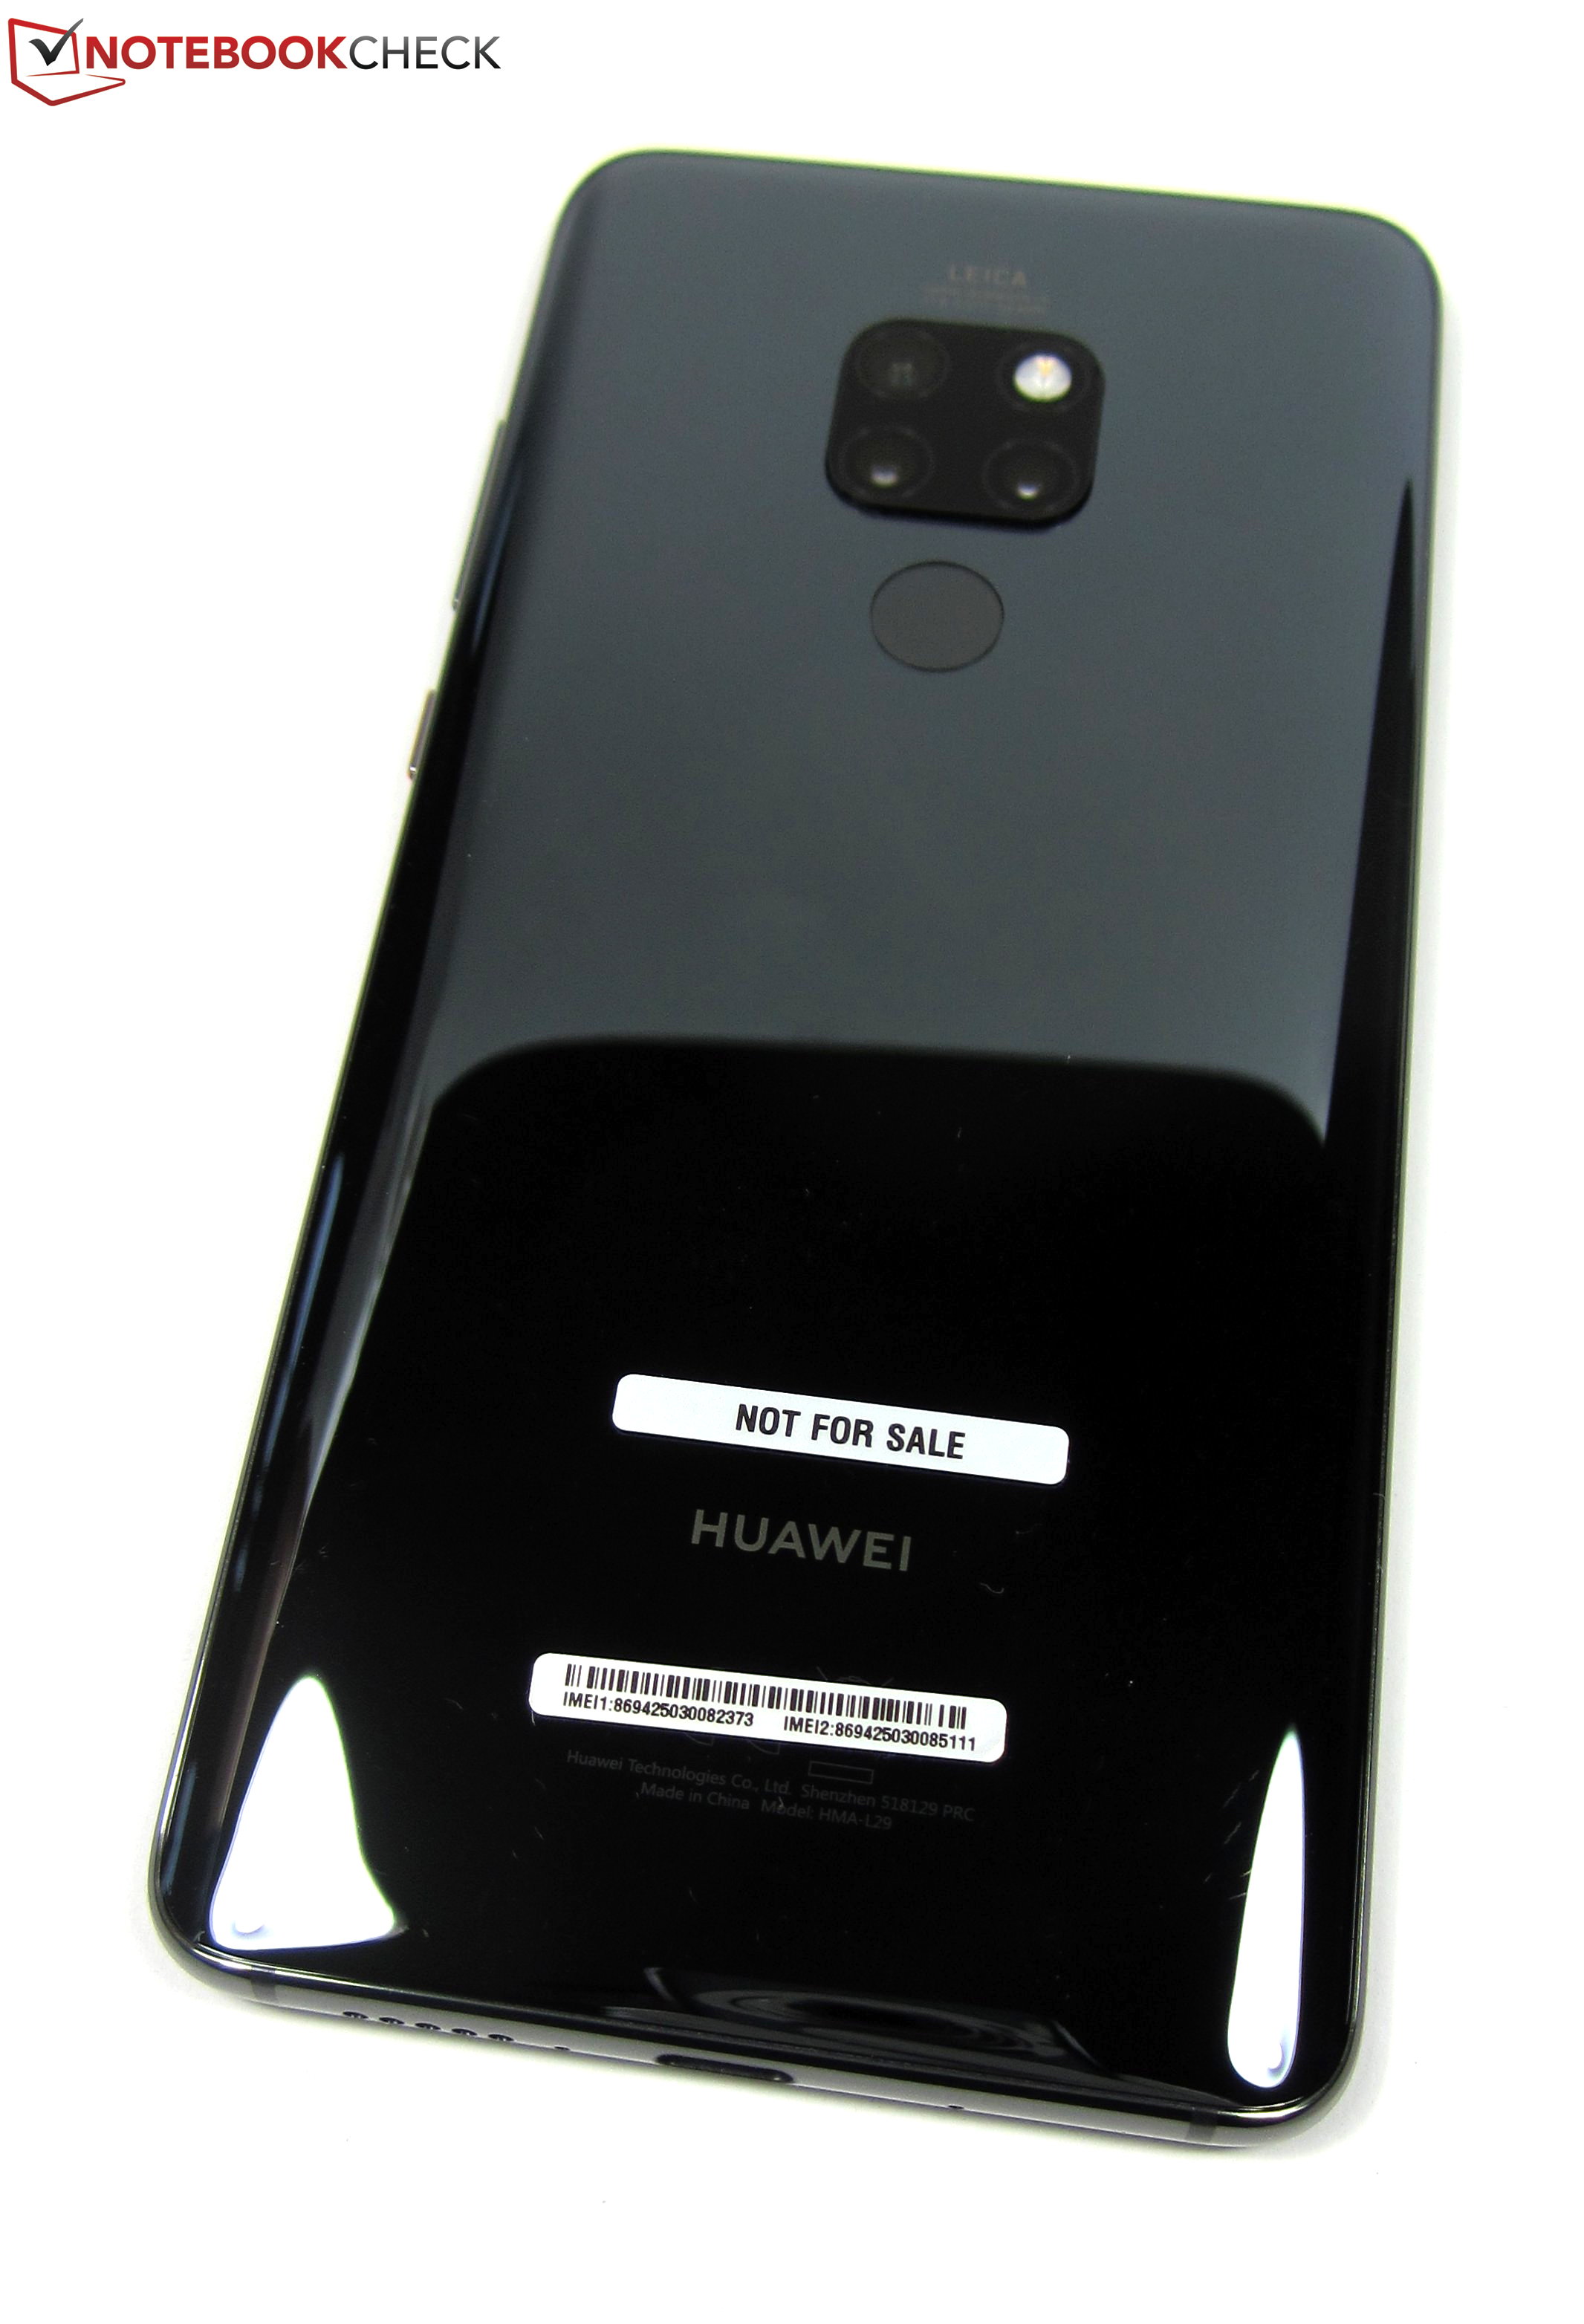
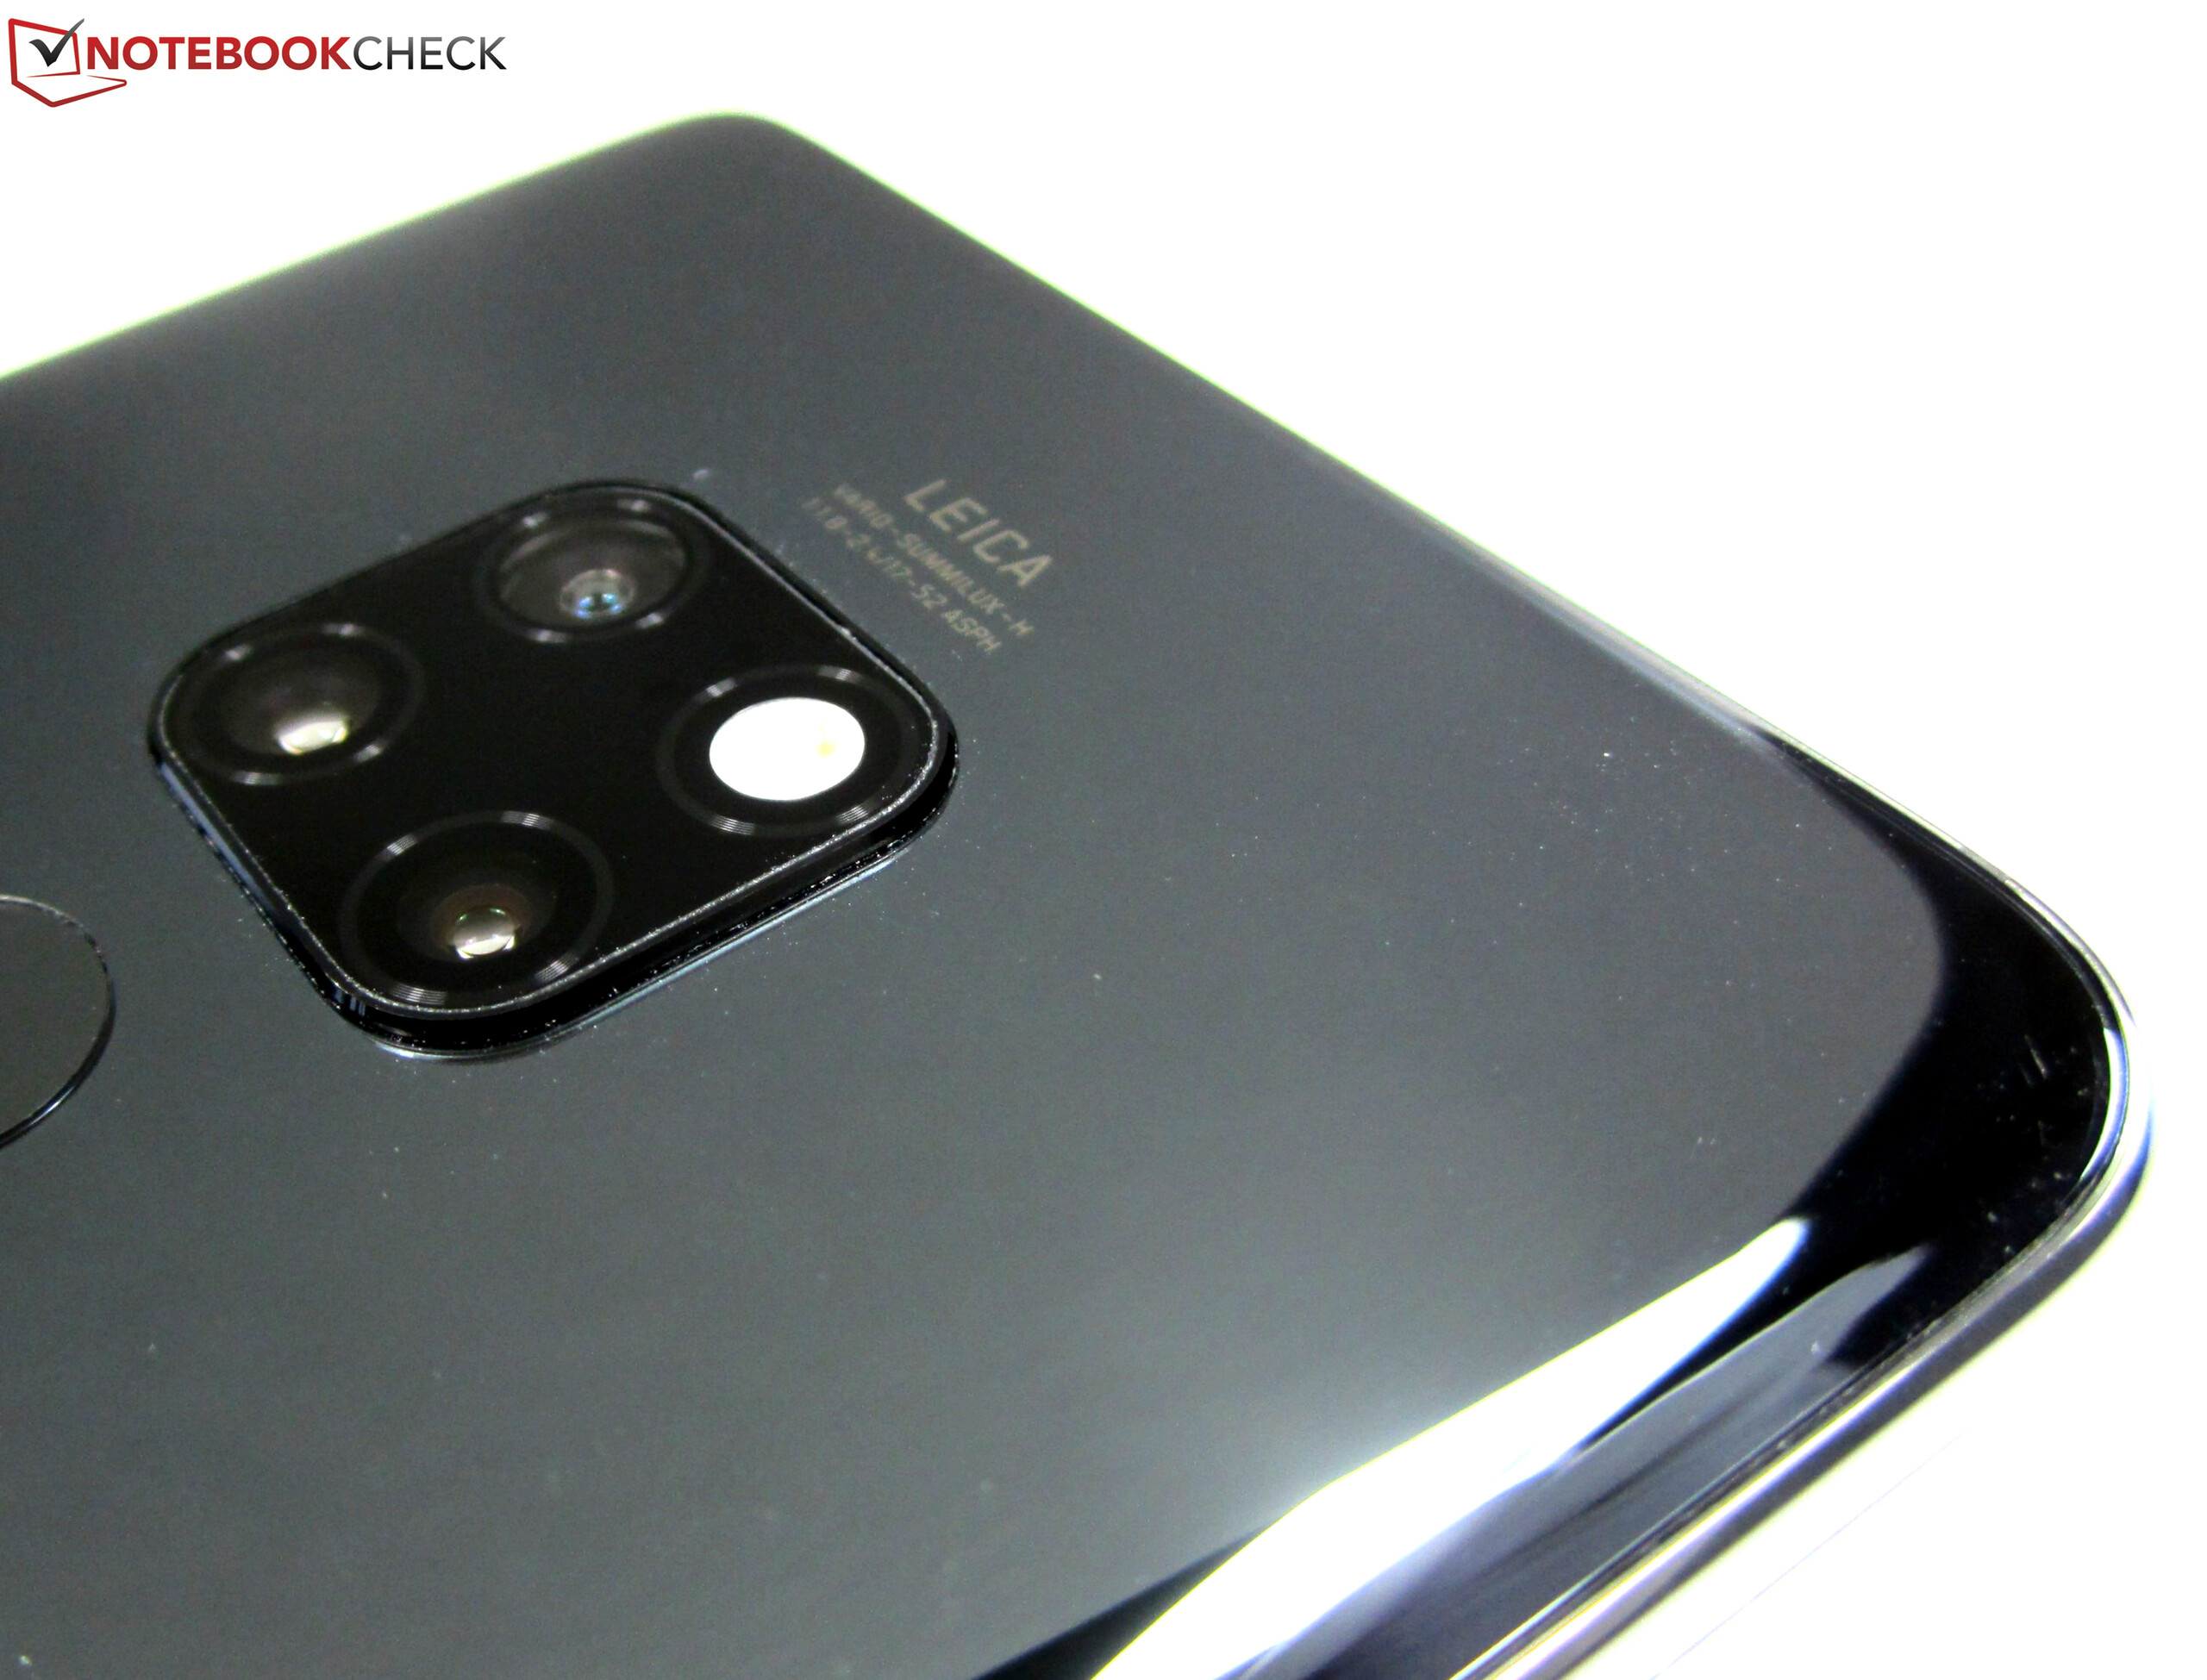
Além disso, o Mate 20 usa uma matriz de câmeras triplas Leica inferior, que apresenta um desempenho notavelmente pior com pouca luz. No entanto, as câmeras ainda estão no mesmo nível do que outros carros-chefe de 2018 oferecem. No entanto, é um compromisso. Da mesma forma, a Huawei equipou o dispositivo com um monitor LCD plano, comparado ao painel OLED curvo do Mate 20 Pro. Finalmente, o dispositivo tem uma classificação IP inferior, para a qual não podemos oferecer explicações. O IP53 simplesmente não é bom o suficiente para um smartphone topo de gama lançado em 2018, particularmente quando muitos dos seus concorrentes são classificados como IP67/68. Nossas preocupações sobre a menor fonte de energia eram infundadas, embora o Mate 20 carregasse rapidamente. No geral, o Mate 20 tem uma excelente relação qualidade/preço e é uma excelente alternativa ao Mate 20 Pro, mas o primeiro não possui algumas das características mais comentadas do último.
Huawei Mate 20
- 11/27/2018 v6 (old)
Manuel Masiero
Price comparison
