Breve Análise do Smartphone Xiaomi Mi 8 Explorer Edition


| |||||||||||||||||||||||||
iluminação: 88 %
iluminação com acumulador: 429 cd/m²
Contraste: ∞:1 (Preto: 0 cd/m²)
ΔE ColorChecker Calman: 3.39 | ∀{0.5-29.43 Ø4.71}
ΔE Greyscale Calman: 3.3 | ∀{0.09-98 Ø4.96}
99% sRGB (Calman 2D)
Gamma: 2.238
CCT: 7135 K
| Xiaomi Mi 8 Explorer Edition Super AMOLED, 2248x1080, 6.2" | Xiaomi Mi 6 IPS, 1920x1080, 5.2" | Xiaomi Black Shark IPS, 2160x1080, 6" | Xiaomi Mi Mix 2S IPS, 2160x1080, 6" | Huawei P20 LTPS, 2240x1080, 5.8" | OnePlus 6 Optic AMOLED, 2280x1080, 6.3" | HTC U12 Plus Super LCD 6, 2880x1440, 6" | Samsung Galaxy S9 Super AMOLED, 2960x1440, 5.8" | |
|---|---|---|---|---|---|---|---|---|
| Screen | -15% | -37% | -0% | 54% | 12% | 24% | 32% | |
| Brightness middle (cd/m²) | 429 | 620 45% | 549 28% | 492 15% | 753 76% | 430 0% | 395 -8% | 529 23% |
| Brightness (cd/m²) | 432 | 586 36% | 541 25% | 463 7% | 748 73% | 437 1% | 402 -7% | 527 22% |
| Brightness Distribution (%) | 88 | 89 1% | 95 8% | 90 2% | 96 9% | 87 -1% | 90 2% | 96 9% |
| Black Level * (cd/m²) | 0.28 | 0.42 | 0.59 | 0.37 | 0.37 | |||
| Colorchecker dE 2000 * | 3.39 | 4.8 -42% | 6.08 -79% | 2.4 29% | 1.3 62% | 2.3 32% | 1.6 53% | 1.4 59% |
| Colorchecker dE 2000 max. * | 5.25 | 8.8 -68% | 10.69 -104% | 6.2 -18% | 2.3 56% | 4.6 12% | 3.4 35% | 4 24% |
| Greyscale dE 2000 * | 3.3 | 5.3 -61% | 6.6 -100% | 4.5 -36% | 1.7 48% | 2.4 27% | 1.1 67% | 1.6 52% |
| Gamma | 2.238 98% | 2.25 98% | 2.305 95% | 2.25 98% | 2.18 101% | 2.28 96% | 2.14 103% | 2.16 102% |
| CCT | 7135 91% | 7473 87% | 8399 77% | 6395 102% | 66.76 9736% | 6160 106% | 6536 99% | 6358 102% |
| Contrast (:1) | 2214 | 1307 | 834 | 2035 | 1068 |
* ... menor é melhor
Cintilação da tela / PWM (modulação por largura de pulso)
| Tela tremeluzindo/PWM detectado | 100 Hz | 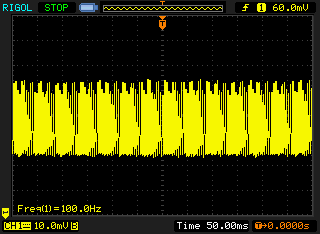 | |
A luz de fundo da tela pisca em 100 Hz (pior caso, por exemplo, utilizando PWM) . A frequência de 100 Hz é muito baixa, portanto a oscilação pode causar fadiga ocular e dores de cabeça após uso prolongado. [pwm_comparison] Em comparação: 52 % de todos os dispositivos testados não usam PWM para escurecer a tela. Se PWM foi detectado, uma média de 7754 (mínimo: 5 - máximo: 343500) Hz foi medida. | |||
Exibir tempos de resposta
| ↔ Tempo de resposta preto para branco | ||
|---|---|---|
| 8 ms ... ascensão ↗ e queda ↘ combinadas | ↗ 5 ms ascensão | 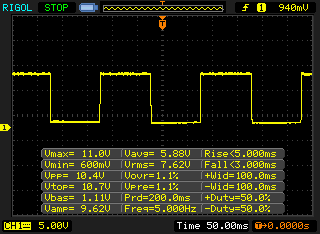 |
| ↘ 3 ms queda | ||
| A tela mostra taxas de resposta rápidas em nossos testes e deve ser adequada para jogos. Em comparação, todos os dispositivos testados variam de 0.1 (mínimo) a 240 (máximo) ms. » 22 % de todos os dispositivos são melhores. Isso significa que o tempo de resposta medido é melhor que a média de todos os dispositivos testados (19.8 ms). | ||
| ↔ Tempo de resposta 50% cinza a 80% cinza | ||
| 10 ms ... ascensão ↗ e queda ↘ combinadas | ↗ 5 ms ascensão | 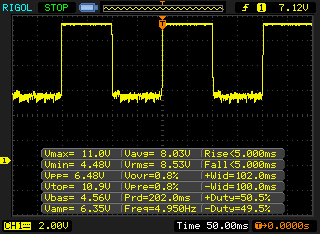 |
| ↘ 5 ms queda | ||
| A tela mostra boas taxas de resposta em nossos testes, mas pode ser muito lenta para jogadores competitivos. Em comparação, todos os dispositivos testados variam de 0.165 (mínimo) a 636 (máximo) ms. » 23 % de todos os dispositivos são melhores. Isso significa que o tempo de resposta medido é melhor que a média de todos os dispositivos testados (31 ms). | ||
| JetStream 1.1 - 1.1 Total | |
| OnePlus 6 (Chrome 66) | |
| HTC U12 Plus (Chrome 66) | |
| Xiaomi Mi 8 Explorer Edition (Chrome 69) | |
| Média Qualcomm Snapdragon 845 (22.5 - 90.9, n=25) | |
| Xiaomi Mi 6 (Chrome Version 58) | |
| Xiaomi Mi Mix 2S (Chrome 66.0.3359.158) | |
| Samsung Galaxy S9 (Samsung Browser 7.0) | |
| Huawei P20 (Chrome 66.0.3359.126) | |
| Xiaomi Black Shark | |
| Octane V2 - Total Score | |
| Média da turma Smartphone (2800 - 126661, n=142, últimos 2 anos) | |
| OnePlus 6 (Chrome 66) | |
| HTC U12 Plus (Chrome 66) | |
| Samsung Galaxy S9 (Samsung Browser 7.0) | |
| Média Qualcomm Snapdragon 845 (3991 - 18275, n=28) | |
| Xiaomi Mi 8 Explorer Edition (Chrome 69) | |
| Xiaomi Mi Mix 2S (Chrome 66.0.3359.158) | |
| Xiaomi Black Shark (Firefox 61) | |
| Xiaomi Mi 6 (Chrome Version 58) | |
| Huawei P20 (Chrome 66.0.3359.126) | |
| Mozilla Kraken 1.1 - Total | |
| Huawei P20 (Chrome 66.0.3359.126) | |
| Média Qualcomm Snapdragon 845 (2154 - 11204, n=28) | |
| Xiaomi Mi Mix 2S (Chrome 66.0.3359.158) | |
| Xiaomi Mi 6 (Chrome Version 58) | |
| OnePlus 6 (Chrome 66) | |
| HTC U12 Plus (Chrome 66) | |
| Xiaomi Mi 8 Explorer Edition (Chrome 69) | |
| Xiaomi Black Shark (Firefox 61) | |
| Samsung Galaxy S9 (Samsung Browser 7.0) | |
| Média da turma Smartphone (257 - 28190, n=121, últimos 2 anos) | |
| WebXPRT 2015 - Overall | |
| HTC U12 Plus (Chrome 66) | |
| OnePlus 6 (Chrome 66) | |
| Xiaomi Mi 8 Explorer Edition (Chrome 69) | |
| Xiaomi Black Shark (Firefox 61) | |
| Média Qualcomm Snapdragon 845 (96 - 291, n=23) | |
| Xiaomi Mi Mix 2S (Chrome 66.0.3359.158) | |
| Huawei P20 (Chrome 66.0.3359.126) | |
| Samsung Galaxy S9 (Samsung Browser 7.0) | |
* ... menor é melhor
| Xiaomi Mi 8 Explorer Edition | Xiaomi Mi 6 | Xiaomi Black Shark | Xiaomi Mi Mix 2S | Huawei P20 | OnePlus 6 | HTC U12 Plus | Samsung Galaxy S9 | Média 128 GB UFS 2.1 Flash | Média da turma Smartphone | |
|---|---|---|---|---|---|---|---|---|---|---|
| AndroBench 3-5 | 5% | 101% | 119% | 159% | 0% | 86% | 5% | 137% | 665% | |
| Sequential Read 256KB (MB/s) | 692 | 728 5% | 742 7% | 756 9% | 827 20% | 726 5% | 709 2% | 815 18% | 762 ? 10% | 2225 ? 222% |
| Sequential Write 256KB (MB/s) | 205.2 | 196.7 -4% | 199.6 -3% | 208.1 1% | 193.6 -6% | 201.4 -2% | 195.8 -5% | 206.9 1% | 300 ? 46% | 1903 ? 827% |
| Random Read 4KB (MB/s) | 135.2 | 143.5 6% | 127.2 -6% | 135.1 0% | 147 9% | 137 1% | 118.1 -13% | 131 -3% | 154.7 ? 14% | 311 ? 130% |
| Random Write 4KB (MB/s) | 22.65 | 25.19 11% | 114.1 404% | 128.4 467% | 161.5 613% | 21.8 -4% | 104.2 360% | 23.07 2% | 131.1 ? 479% | 358 ? 1481% |
| Sequential Read 256KB SDCard (MB/s) | 84.3 ? | 79.2 ? | 76 ? | |||||||
| Sequential Write 256KB SDCard (MB/s) | 63.6 ? | 67.2 ? | 59.6 ? |
| Asphalt 9: Legends | |||
| Configurações | Valor | ||
| High Quality | 30 fps | ||
| PUBG Mobile | |||
| Configurações | Valor | ||
| HD | 30 fps | ||
(±) A temperatura máxima no lado superior é 44.1 °C / 111 F, em comparação com a média de 35.3 °C / 96 F , variando de 21.9 a 247 °C para a classe Smartphone.
(±) A parte inferior aquece até um máximo de 42.8 °C / 109 F, em comparação com a média de 34 °C / 93 F
(+) Em uso inativo, a temperatura média para o lado superior é 31.3 °C / 88 F, em comparação com a média do dispositivo de 33 °C / ### class_avg_f### F.
Xiaomi Mi 8 Explorer Edition análise de áudio
(±) | o volume do alto-falante é médio, mas bom (###valor### dB)
Graves 100 - 315Hz
(-) | quase nenhum baixo - em média 21.2% menor que a mediana
(±) | a linearidade dos graves é média (9% delta para a frequência anterior)
Médios 400 - 2.000 Hz
(+) | médios equilibrados - apenas 3.6% longe da mediana
(+) | médios são lineares (5.1% delta para frequência anterior)
Altos 2 - 16 kHz
(+) | agudos equilibrados - apenas 3% longe da mediana
(+) | os máximos são lineares (4% delta da frequência anterior)
Geral 100 - 16.000 Hz
(±) | a linearidade do som geral é média (20.4% diferença em relação à mediana)
Comparado com a mesma classe
» 35% de todos os dispositivos testados nesta classe foram melhores, 9% semelhantes, 56% piores
» O melhor teve um delta de 11%, a média foi 34%, o pior foi 134%
Comparado com todos os dispositivos testados
» 54% de todos os dispositivos testados foram melhores, 8% semelhantes, 38% piores
» O melhor teve um delta de 4%, a média foi 23%, o pior foi 134%
OnePlus 6 análise de áudio
(±) | o volume do alto-falante é médio, mas bom (###valor### dB)
Graves 100 - 315Hz
(-) | quase nenhum baixo - em média 62.6% menor que a mediana
(+) | o baixo é linear (0% delta para a frequência anterior)
Médios 400 - 2.000 Hz
(-) | quase nenhum médio - em média 62.6% menor que a mediana
(+) | médios são lineares (0% delta para frequência anterior)
Altos 2 - 16 kHz
(-) | quase nenhum máximo - em média 62.6% menor que a mediana
(+) | os máximos são lineares (0% delta da frequência anterior)
Geral 100 - 16.000 Hz
(-) | o som geral não é linear (108.7% diferença em relação à mediana)
Comparado com a mesma classe
» 88% de todos os dispositivos testados nesta classe foram melhores, 0% semelhantes, 12% piores
» O melhor teve um delta de 11%, a média foi 34%, o pior foi 134%
Comparado com todos os dispositivos testados
» 96% de todos os dispositivos testados foram melhores, 0% semelhantes, 4% piores
» O melhor teve um delta de 4%, a média foi 23%, o pior foi 134%
| desligado | |
| Ocioso | |
| Carga |
|
Key:
min: | |
| Xiaomi Mi 8 Explorer Edition 3000 mAh | Xiaomi Mi 6 3350 mAh | Xiaomi Black Shark 4000 mAh | Xiaomi Mi Mix 2S 3400 mAh | Huawei P20 3400 mAh | OnePlus 6 3300 mAh | HTC U12 Plus 3500 mAh | Samsung Galaxy S9 3000 mAh | Média Qualcomm Snapdragon 845 | Média da turma Smartphone | |
|---|---|---|---|---|---|---|---|---|---|---|
| Power Consumption | 42% | 30% | 25% | 26% | 44% | 20% | 53% | 30% | 22% | |
| Idle Minimum * (Watt) | 1.8 | 0.45 75% | 0.8 56% | 0.75 58% | 0.67 63% | 0.6 67% | 0.77 57% | 0.65 64% | 0.862 ? 52% | 0.887 ? 51% |
| Idle Average * (Watt) | 2.9 | 1.67 42% | 1.5 48% | 2.25 22% | 2.05 29% | 1 66% | 2.18 25% | 0.81 72% | 1.728 ? 40% | 1.485 ? 49% |
| Idle Maximum * (Watt) | 3.5 | 1.69 52% | 2.3 34% | 2.26 35% | 2.11 40% | 1.6 54% | 2.21 37% | 0.92 74% | 2.07 ? 41% | 1.672 ? 52% |
| Load Average * (Watt) | 4.8 | 4.07 15% | 4.8 -0% | 4.89 -2% | 6.15 -28% | 4.3 10% | 6.25 -30% | 4.76 1% | 4.87 ? -1% | 6.76 ? -41% |
| Load Maximum * (Watt) | 11.2 | 8.54 24% | 10.1 10% | 9.6 14% | 8.09 28% | 8.6 23% | 10.16 9% | 5.16 54% | 9.27 ? 17% | 11.2 ? -0% |
* ... menor é melhor
| Xiaomi Mi 8 Explorer Edition 3000 mAh | Xiaomi Mi 6 3350 mAh | Xiaomi Black Shark 4000 mAh | Xiaomi Mi Mix 2S 3400 mAh | Huawei P20 3400 mAh | OnePlus 6 3300 mAh | HTC U12 Plus 3500 mAh | Samsung Galaxy S9 3000 mAh | |
|---|---|---|---|---|---|---|---|---|
| Duração da bateria | 6% | 10% | 7% | 23% | 13% | -14% | -25% | |
| Reader / Idle (h) | 23.4 | 29.2 25% | 28 20% | 31.5 35% | 30.1 29% | 24.2 3% | 19.7 -16% | |
| H.264 (h) | 15.4 | 12.5 -19% | 12 -22% | 13.5 -12% | 13.2 -14% | 7.7 -50% | 10.2 -34% | |
| WiFi v1.3 (h) | 11.6 | 12.3 6% | 11.9 3% | 11.9 3% | 13.6 17% | 12.7 9% | 8.5 -27% | 7.9 -32% |
| Load (h) | 3.2 | 4.2 31% | 4 25% | 4.9 53% | 4.1 28% | 3.8 19% | 2.7 -16% |
Pro
Contra
A Xiaomi criou um dos smartphones com melhor relação custo-benefício deste ano, algo que não esperávamos, dados os dispositivos Mi anteriores. Inclusive recomendamos a atualização do Mi 6 para o Mi 8 pelas ótimas melhorias e refinamentos
Se você se deparar com a pergunta sobre qual versão do Mi 8 deve escolher, então nossa resposta é clara: Escolha o Mi 8 regular, particularmente agora que está 200 Euros (~$231) mais barato. Ignorando a diferença de preço, o Mi 8 regular é o melhor smartphone com sua duração de bateria superior e seu sensor de digitais mais confiável. O Xiaomi Mi 8 Explorer Edition vai atrair olhares com sua parte traseira marcante, seus 2 GB adicionais de RAM e tecnologias biométricas inovadoras. Este último não é mais rápido do que os mais convencionais que o Mi8 regular usa.
Você não irá errar com o Xiaomi Mi 8, mas não é o melhor smartphone do ano.
Independentemente do Explorer Edition, o Mi 8 é um impressionante smartphone premium. No entanto, o dispositivo está longe de ser um smartphone top do 2018. As câmeras, o alto-falante, o software, o GPS e a falta de certificação IP e carregamento sem fio distinguem o Mi 8 Explorer Edition dos carros-chefe mais caros. Isso é aceitável, dado o preço da Explorer Edition, especialmente considerando que a Xiaomi fez muitas coisas bem com o dispositivo.
Xiaomi Mi 8 Explorer Edition
- 09/24/2018 v6 (old)
Marcus Herbrich
Price comparison
