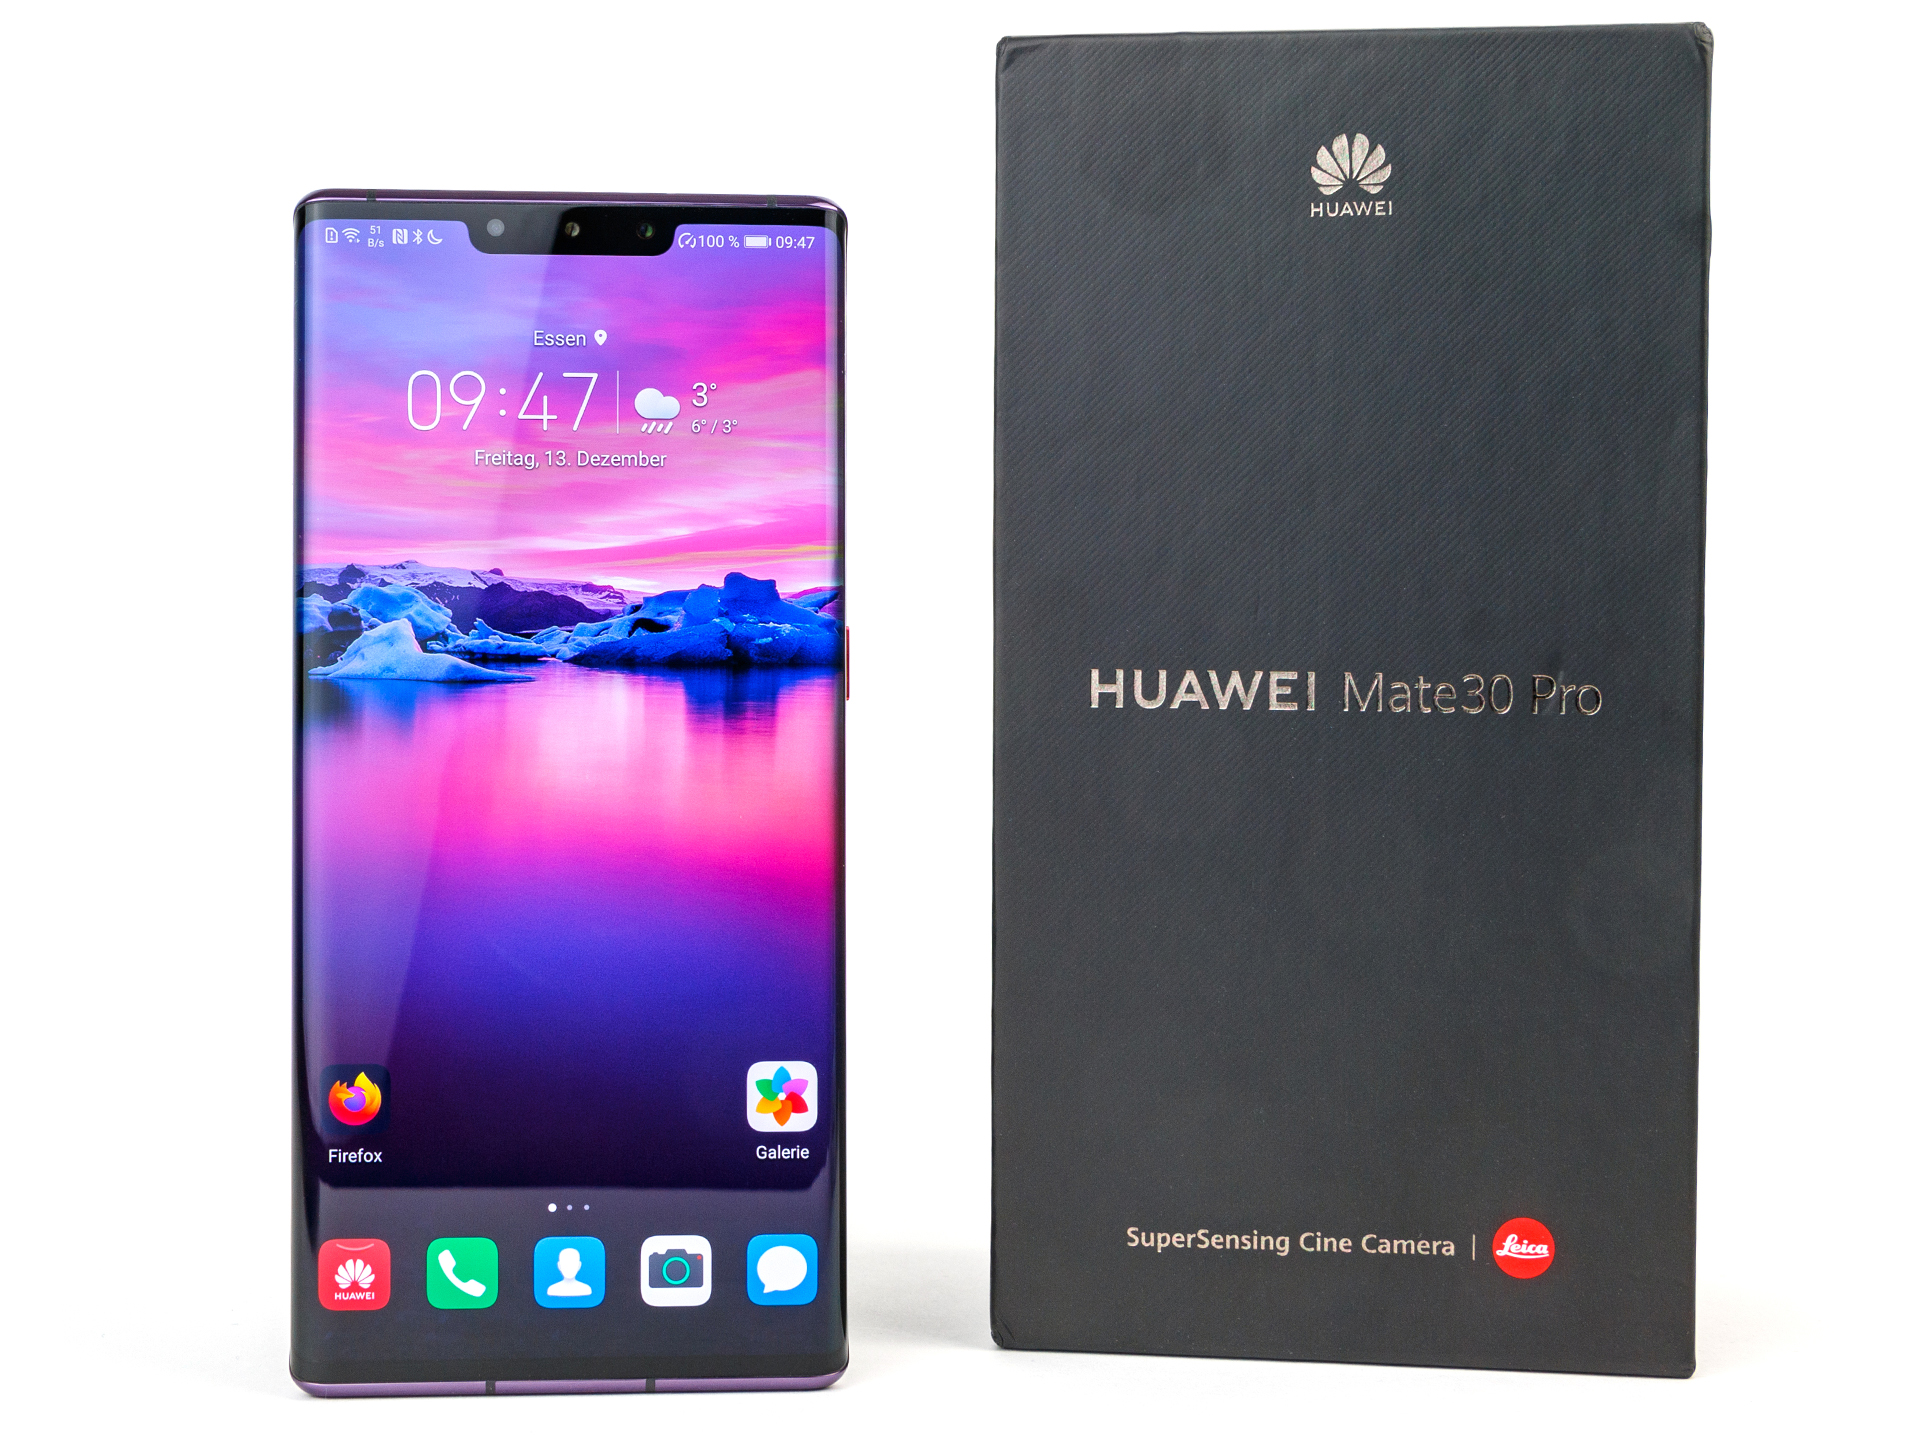
Breve Análise do Smartphone Huawei Mate 30 Pro: Um smartphone potente, mesmo sem Google
Device Comparison
Avaliação | Data | Modelo | Peso | Unidade | Size | Resolução | Preço |
|---|---|---|---|---|---|---|---|
| 89 % v7 (old) | 12/2019 | Huawei Mate 30 Pro Kirin 990, Mali-G76 MP16 | 198 g | 256 GB UFS 3.0 Flash | 6.53" | 2400x1176 | |
| 86.9 % v7 (old) | 10/2018 | Huawei Mate 20 Pro Kirin 980, Mali-G76 MP10 | 189 g | 128 GB UFS 2.1 Flash | 6.30" | 3120x1440 | |
| 87.1 % v7 (old) | 09/2019 | Apple iPhone 11 Pro Max A13 Bionic, A13 Bionic GPU | 226 g | 64 GB SSD | 6.50" | 2688x1242 | |
| 87.5 % v7 (old) | 09/2019 | Samsung Galaxy Note10+ Exynos 9825, Mali-G76 MP12 | 196 g | 256 GB UFS 3.0 Flash | 6.80" | 3040x1440 | |
| 84.6 % v7 (old) | 10/2019 | LG G8X ThinQ SD 855, Adreno 640 | 192 g | 128 GB UFS 2.1 Flash | 6.40" | 2340x1080 | |
| 86.9 % v7 (old) | 11/2019 | OnePlus 7T Pro SD 855+, Adreno 640 | 206 g | 256 GB UFS 3.0 Flash | 6.67" | 3120x1440 |


| |||||||||||||||||||||||||
iluminação: 96 %
iluminação com acumulador: 592 cd/m²
Contraste: ∞:1 (Preto: 0 cd/m²)
ΔE ColorChecker Calman: 2.5 | ∀{0.5-29.43 Ø4.72}
ΔE Greyscale Calman: 2.6 | ∀{0.09-98 Ø4.97}
98.1% sRGB (Calman 2D)
Gamma: 2.16
CCT: 6173 K
| Huawei Mate 30 Pro OLED, 2400x1176, 6.5" | Huawei Mate 20 Pro OLED, 3120x1440, 6.3" | Apple iPhone 11 Pro Max OLED, 2688x1242, 6.5" | Samsung Galaxy Note10+ Dynamic AMOLED, 3040x1440, 6.8" | LG G8X ThinQ OLED, 2340x1080, 6.4" | OnePlus 7T Pro AMOLED, 3120x1440, 6.7" | |
|---|---|---|---|---|---|---|
| Screen | 18% | 29% | 7% | -60% | -3% | |
| Brightness middle (cd/m²) | 592 | 576 -3% | 790 33% | 683 15% | 570 -4% | 606 2% |
| Brightness (cd/m²) | 605 | 582 -4% | 790 31% | 694 15% | 581 -4% | 611 1% |
| Brightness Distribution (%) | 96 | 90 -6% | 97 1% | 96 0% | 90 -6% | 95 -1% |
| Black Level * (cd/m²) | ||||||
| Colorchecker dE 2000 * | 2.5 | 1.3 48% | 1.4 44% | 2.9 -16% | 6.27 -151% | 3.46 -38% |
| Colorchecker dE 2000 max. * | 5.5 | 3.5 36% | 3.4 38% | 4.8 13% | 9.75 -77% | 5.64 -3% |
| Greyscale dE 2000 * | 2.6 | 1.6 38% | 1.9 27% | 2.2 15% | 5.7 -119% | 2 23% |
| Gamma | 2.16 102% | 2.18 101% | 2.23 99% | 2.11 104% | 2.37 93% | 2.258 97% |
| CCT | 6173 105% | 6561 99% | 6466 101% | 6247 104% | 7309 89% | 6779 96% |
* ... menor é melhor
Cintilação da tela / PWM (modulação por largura de pulso)
| Tela tremeluzindo/PWM detectado | 245.1 Hz | ≤ 99 % configuração de brilho | 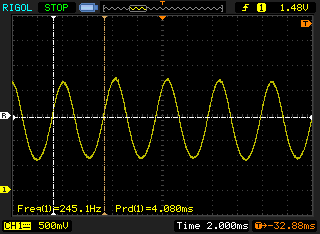 |
A luz de fundo da tela pisca em 245.1 Hz (pior caso, por exemplo, utilizando PWM) Cintilação detectada em uma configuração de brilho de 99 % e abaixo. Não deve haver cintilação ou PWM acima desta configuração de brilho. A frequência de 245.1 Hz é relativamente baixa, portanto, usuários sensíveis provavelmente notarão cintilação e sentirão fadiga ocular na configuração de brilho indicada e abaixo. [pwm_comparison] Em comparação: 52 % de todos os dispositivos testados não usam PWM para escurecer a tela. Se PWM foi detectado, uma média de 7747 (mínimo: 5 - máximo: 343500) Hz foi medida. | |||
Exibir tempos de resposta
| ↔ Tempo de resposta preto para branco | ||
|---|---|---|
| 3.2 ms ... ascensão ↗ e queda ↘ combinadas | ↗ 1.6 ms ascensão | 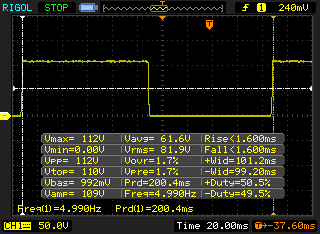 |
| ↘ 1.6 ms queda | ||
| A tela mostra taxas de resposta muito rápidas em nossos testes e deve ser muito adequada para jogos em ritmo acelerado. Em comparação, todos os dispositivos testados variam de 0.1 (mínimo) a 240 (máximo) ms. » 15 % de todos os dispositivos são melhores. Isso significa que o tempo de resposta medido é melhor que a média de todos os dispositivos testados (19.8 ms). | ||
| ↔ Tempo de resposta 50% cinza a 80% cinza | ||
| 3.6 ms ... ascensão ↗ e queda ↘ combinadas | ↗ 2 ms ascensão | 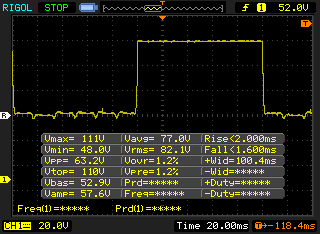 |
| ↘ 1.6 ms queda | ||
| A tela mostra taxas de resposta muito rápidas em nossos testes e deve ser muito adequada para jogos em ritmo acelerado. Em comparação, todos os dispositivos testados variam de 0.165 (mínimo) a 636 (máximo) ms. » 14 % de todos os dispositivos são melhores. Isso significa que o tempo de resposta medido é melhor que a média de todos os dispositivos testados (31 ms). | ||
| PCMark for Android | |
| Work performance score (classificar por valor) | |
| Huawei Mate 30 Pro | |
| Huawei Mate 20 Pro | |
| Samsung Galaxy Note10+ | |
| LG G8X ThinQ | |
| OnePlus 7T Pro | |
| Média HiSilicon Kirin 990 (10918 - 13947, n=2) | |
| Work 2.0 performance score (classificar por valor) | |
| Huawei Mate 30 Pro | |
| Huawei Mate 20 Pro | |
| Samsung Galaxy Note10+ | |
| LG G8X ThinQ | |
| OnePlus 7T Pro | |
| Média HiSilicon Kirin 990 (8636 - 10322, n=2) | |
| Basemark GPU 1.1 | |
| 1920x1080 Vulkan Medium Offscreen (classificar por valor) | |
| Huawei Mate 30 Pro | |
| Huawei Mate 20 Pro | |
| Samsung Galaxy Note10+ | |
| OnePlus 7T Pro | |
| Média HiSilicon Kirin 990 (n=1) | |
| Vulkan Medium Native (classificar por valor) | |
| Huawei Mate 30 Pro | |
| Huawei Mate 20 Pro | |
| Samsung Galaxy Note10+ | |
| OnePlus 7T Pro | |
| Média HiSilicon Kirin 990 (n=1) | |
| 1920x1080 OpenGL Medium Offscreen (classificar por valor) | |
| Huawei Mate 30 Pro | |
| Huawei Mate 20 Pro | |
| Samsung Galaxy Note10+ | |
| OnePlus 7T Pro | |
| Média HiSilicon Kirin 990 (n=1) | |
| AnTuTu v7 - Total Score (classificar por valor) | |
| Huawei Mate 20 Pro | |
| Apple iPhone 11 Pro Max | |
| Samsung Galaxy Note10+ | |
| AnTuTu v6 - Total Score (classificar por valor) | |
| Huawei Mate 20 Pro | |
| Samsung Galaxy Note10+ | |
| VRMark - Amber Room (classificar por valor) | |
| Huawei Mate 30 Pro | |
| Huawei Mate 20 Pro | |
| Samsung Galaxy Note10+ | |
| OnePlus 7T Pro | |
| Média HiSilicon Kirin 990 (n=1) | |
| Jetstream 2 - 2.0 Total | |
| Média da turma Smartphone (63.9 - 423, n=125, últimos 2 anos) | |
| Apple iPhone 11 Pro Max (Safari Mobile 13.1) | |
| Huawei Mate 30 Pro (Chrome 78) | |
| LG G8X ThinQ (Chrome 78) | |
| OnePlus 7T Pro (Chrome 78) | |
| Média HiSilicon Kirin 990 (55.1 - 65.9, n=2) | |
| Huawei Mate 20 Pro (Chrome 74) | |
| Samsung Galaxy Note10+ (Samung Browser 9.2) | |
| JetStream 1.1 - 1.1 Total | |
| Apple iPhone 11 Pro Max (Safari Mobile 13.1) | |
| Huawei Mate 30 Pro (Chrome 78) | |
| OnePlus 7T Pro (Chrome 78) | |
| Huawei Mate 20 Pro (Chrome 69) | |
| Média HiSilicon Kirin 990 (101.2 - 115.5, n=2) | |
| LG G8X ThinQ (Chrome 78) | |
| Samsung Galaxy Note10+ (Samsung Browser 9.2) | |
| Speedometer 2.0 - Result 2.0 | |
| Média da turma Smartphone (49.3 - 733, n=85, últimos 2 anos) | |
| Apple iPhone 11 Pro Max (Safari Mobile 13.1) | |
| Huawei Mate 30 Pro (Chrome 78) | |
| Média HiSilicon Kirin 990 (63.9 - 74.1, n=2) | |
| LG G8X ThinQ (Chome 78) | |
| OnePlus 7T Pro (Chome 78) | |
| Huawei Mate 20 Pro (Chrome 71) | |
| Samsung Galaxy Note10+ (Samsung Browser 9.2) | |
| WebXPRT 3 - Overall | |
| Apple iPhone 11 Pro Max (Safari Mobile 13.1) | |
| Média da turma Smartphone (104 - 380, n=12, últimos 2 anos) | |
| Huawei Mate 20 Pro (Chrome 69) | |
| Huawei Mate 30 Pro (Chrome 78) | |
| Samsung Galaxy Note10+ (Samsung Browser 9.2) | |
| Média HiSilicon Kirin 990 (97 - 119, n=2) | |
| OnePlus 7T Pro (Chrome 78) | |
| LG G8X ThinQ (Chrome 78) | |
| Octane V2 - Total Score | |
| Média da turma Smartphone (2800 - 126661, n=151, últimos 2 anos) | |
| Apple iPhone 11 Pro Max (Safari Mobile 13.1) | |
| OnePlus 7T Pro (Chrome 78) | |
| Huawei Mate 30 Pro (Chrome 78) | |
| LG G8X ThinQ (Chrome 78) | |
| Huawei Mate 20 Pro (Chrome 69) | |
| Média HiSilicon Kirin 990 (19885 - 23568, n=2) | |
| Samsung Galaxy Note10+ (Samsung Browser 9.2) | |
| Mozilla Kraken 1.1 - Total | |
| Samsung Galaxy Note10+ (Samsung Browser 9.2) | |
| LG G8X ThinQ (Chrome 78) | |
| Média HiSilicon Kirin 990 (1963 - 2345, n=2) | |
| OnePlus 7T Pro (Chrome 78) | |
| Huawei Mate 30 Pro (Chrome 78) | |
| Huawei Mate 20 Pro (Chrome 69) | |
| Média da turma Smartphone (257 - 28190, n=129, últimos 2 anos) | |
| Apple iPhone 11 Pro Max (Safari Mobile 13.1) | |
* ... menor é melhor
| Huawei Mate 30 Pro | Huawei Mate 20 Pro | Samsung Galaxy Note10+ | LG G8X ThinQ | OnePlus 7T Pro | Média 256 GB UFS 3.0 Flash | Média da turma Smartphone | |
|---|---|---|---|---|---|---|---|
| AndroBench 3-5 | -28% | -7% | -33% | -33% | -5% | 121% | |
| Sequential Read 256KB (MB/s) | 1781 | 853 -52% | 1504 -16% | 705 -60% | 1489 -16% | 1547 ? -13% | 2244 ? 26% |
| Sequential Write 256KB (MB/s) | 401.8 | 196.4 -51% | 588 46% | 497.1 24% | 405 1% | 575 ? 43% | 1928 ? 380% |
| Random Read 4KB (MB/s) | 226.4 | 157.4 -30% | 196.2 -13% | 160.5 -29% | 169 -25% | 210 ? -7% | 312 ? 38% |
| Random Write 4KB (MB/s) | 259.2 | 157.8 -39% | 183.6 -29% | 30.2 -88% | 26 -90% | 188.5 ? -27% | 358 ? 38% |
| Sequential Read 256KB SDCard (MB/s) | 82.5 ? | 83.2 ? 1% | 71 ? -14% | 68.9 ? -16% | 70.6 ? -14% | ||
| Sequential Write 256KB SDCard (MB/s) | 69.2 ? | 72.4 ? 5% | 59.5 ? -14% | 47.7 ? -31% | 59.8 ? -14% |
(+) A temperatura máxima no lado superior é 39.8 °C / 104 F, em comparação com a média de 35.3 °C / 96 F , variando de 21.9 a 247 °C para a classe Smartphone.
(±) A parte inferior aquece até um máximo de 41 °C / 106 F, em comparação com a média de 34 °C / 93 F
(+) Em uso inativo, a temperatura média para o lado superior é 26.5 °C / 80 F, em comparação com a média do dispositivo de 33 °C / ### class_avg_f### F.
Huawei Mate 30 Pro análise de áudio
(+) | os alto-falantes podem tocar relativamente alto (###valor### dB)
Graves 100 - 315Hz
(-) | quase nenhum baixo - em média 17.6% menor que a mediana
(±) | a linearidade dos graves é média (12.8% delta para a frequência anterior)
Médios 400 - 2.000 Hz
(±) | médios mais altos - em média 9.7% maior que a mediana
(±) | a linearidade dos médios é média (7.6% delta para frequência anterior)
Altos 2 - 16 kHz
(±) | máximos mais altos - em média 10.1% maior que a mediana
(±) | a linearidade dos máximos é média (8.2% delta para frequência anterior)
Geral 100 - 16.000 Hz
(±) | a linearidade do som geral é média (28.2% diferença em relação à mediana)
Comparado com a mesma classe
» 74% de todos os dispositivos testados nesta classe foram melhores, 5% semelhantes, 21% piores
» O melhor teve um delta de 11%, a média foi 34%, o pior foi 134%
Comparado com todos os dispositivos testados
» 85% de todos os dispositivos testados foram melhores, 3% semelhantes, 12% piores
» O melhor teve um delta de 4%, a média foi 23%, o pior foi 134%
Apple iPhone 11 Pro Max análise de áudio
(+) | os alto-falantes podem tocar relativamente alto (###valor### dB)
Graves 100 - 315Hz
(-) | quase nenhum baixo - em média 15.4% menor que a mediana
(±) | a linearidade dos graves é média (10.3% delta para a frequência anterior)
Médios 400 - 2.000 Hz
(±) | médios mais altos - em média 5.7% maior que a mediana
(+) | médios são lineares (5.9% delta para frequência anterior)
Altos 2 - 16 kHz
(±) | máximos mais altos - em média 8.8% maior que a mediana
(+) | os máximos são lineares (3.5% delta da frequência anterior)
Geral 100 - 16.000 Hz
(±) | a linearidade do som geral é média (19.4% diferença em relação à mediana)
Comparado com a mesma classe
» 28% de todos os dispositivos testados nesta classe foram melhores, 9% semelhantes, 64% piores
» O melhor teve um delta de 11%, a média foi 34%, o pior foi 134%
Comparado com todos os dispositivos testados
» 48% de todos os dispositivos testados foram melhores, 7% semelhantes, 45% piores
» O melhor teve um delta de 4%, a média foi 23%, o pior foi 134%
| desligado | |
| Ocioso | |
| Carga |
|
Key:
min: | |
| Huawei Mate 30 Pro 4500 mAh | Huawei Mate 20 Pro 4200 mAh | Apple iPhone 11 Pro Max 3969 mAh | Samsung Galaxy Note10+ 4300 mAh | LG G8X ThinQ 4000 mAh | OnePlus 7T Pro 4085 mAh | Média HiSilicon Kirin 990 | Média da turma Smartphone | |
|---|---|---|---|---|---|---|---|---|
| Power Consumption | -13% | -24% | -25% | -11% | -73% | -65% | -24% | |
| Idle Minimum * (Watt) | 0.87 | 0.95 -9% | 0.92 -6% | 0.7 20% | 1.1 -26% | 2.1 -141% | 1.425 ? -64% | 0.883 ? -1% |
| Idle Average * (Watt) | 1.75 | 2.17 -24% | 2.9 -66% | 1.81 -3% | 1.49 15% | 3 -71% | 3.71 ? -112% | 1.469 ? 16% |
| Idle Maximum * (Watt) | 1.83 | 2.25 -23% | 2.94 -61% | 1.92 -5% | 1.76 4% | 3.5 -91% | 3.76 ? -105% | 1.658 ? 9% |
| Load Average * (Watt) | 3.85 | 4.47 -16% | 3.65 5% | 7.57 -97% | 4.2 -9% | 5.3 -38% | 5.41 ? -41% | 6.72 ? -75% |
| Load Maximum * (Watt) | 6.64 | 6.15 7% | 6.18 7% | 9.34 -41% | 9.2 -39% | 8.3 -25% | 6.81 ? -3% | 11.3 ? -70% |
* ... menor é melhor
| Huawei Mate 30 Pro 4500 mAh | Huawei Mate 20 Pro 4200 mAh | Apple iPhone 11 Pro Max 3969 mAh | Samsung Galaxy Note10+ 4300 mAh | LG G8X ThinQ 4000 mAh | OnePlus 7T Pro 4085 mAh | |
|---|---|---|---|---|---|---|
| Duração da bateria | -6% | 34% | -10% | 13% | 5% | |
| Reader / Idle (h) | 36.2 | 29.1 -20% | 43.6 20% | 26.4 -27% | 33.6 -7% | |
| H.264 (h) | 18.3 | 14.2 -22% | 22.4 22% | 15.6 -15% | 16 -13% | |
| WiFi v1.3 (h) | 13.7 | 12.8 -7% | 15.2 11% | 8.9 -35% | 15.5 13% | 15.2 11% |
| Load (h) | 3.7 | 4.7 27% | 6.8 84% | 5.1 38% | 4.7 27% |
Pro
Contra
Veredicto - A Huawei flexiona seus músculos
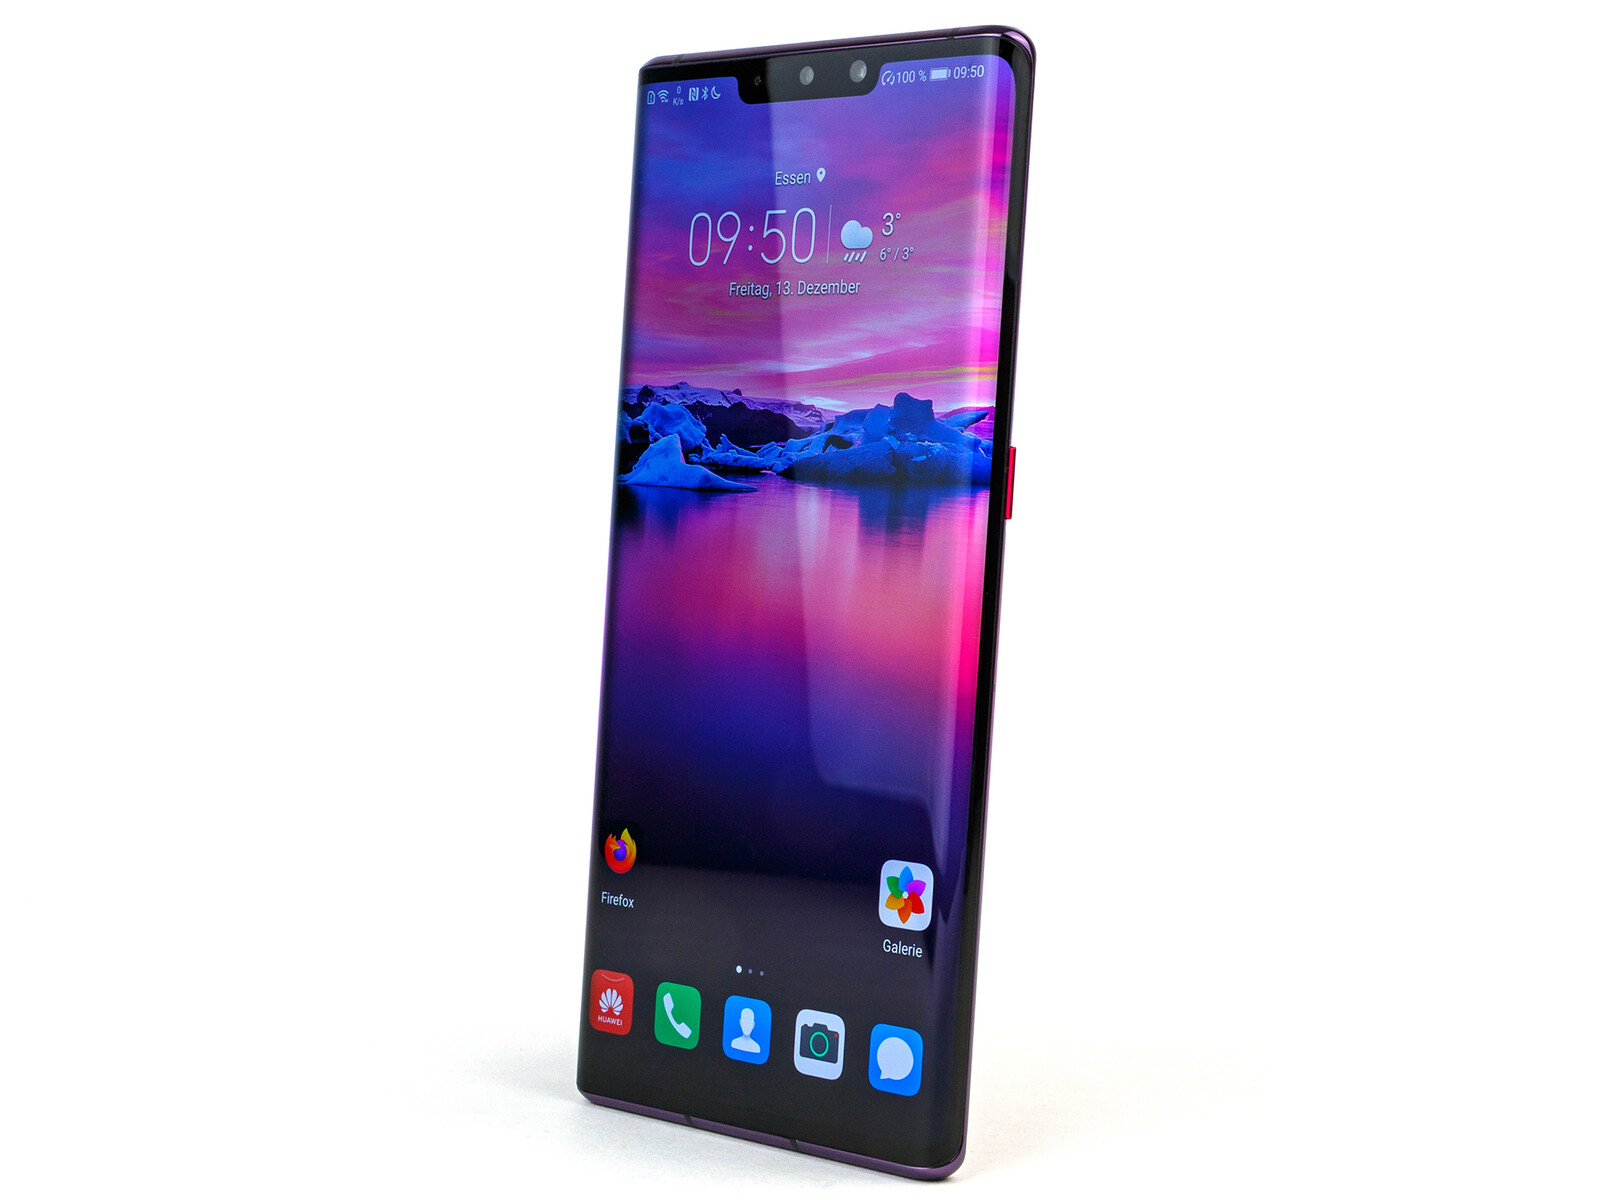
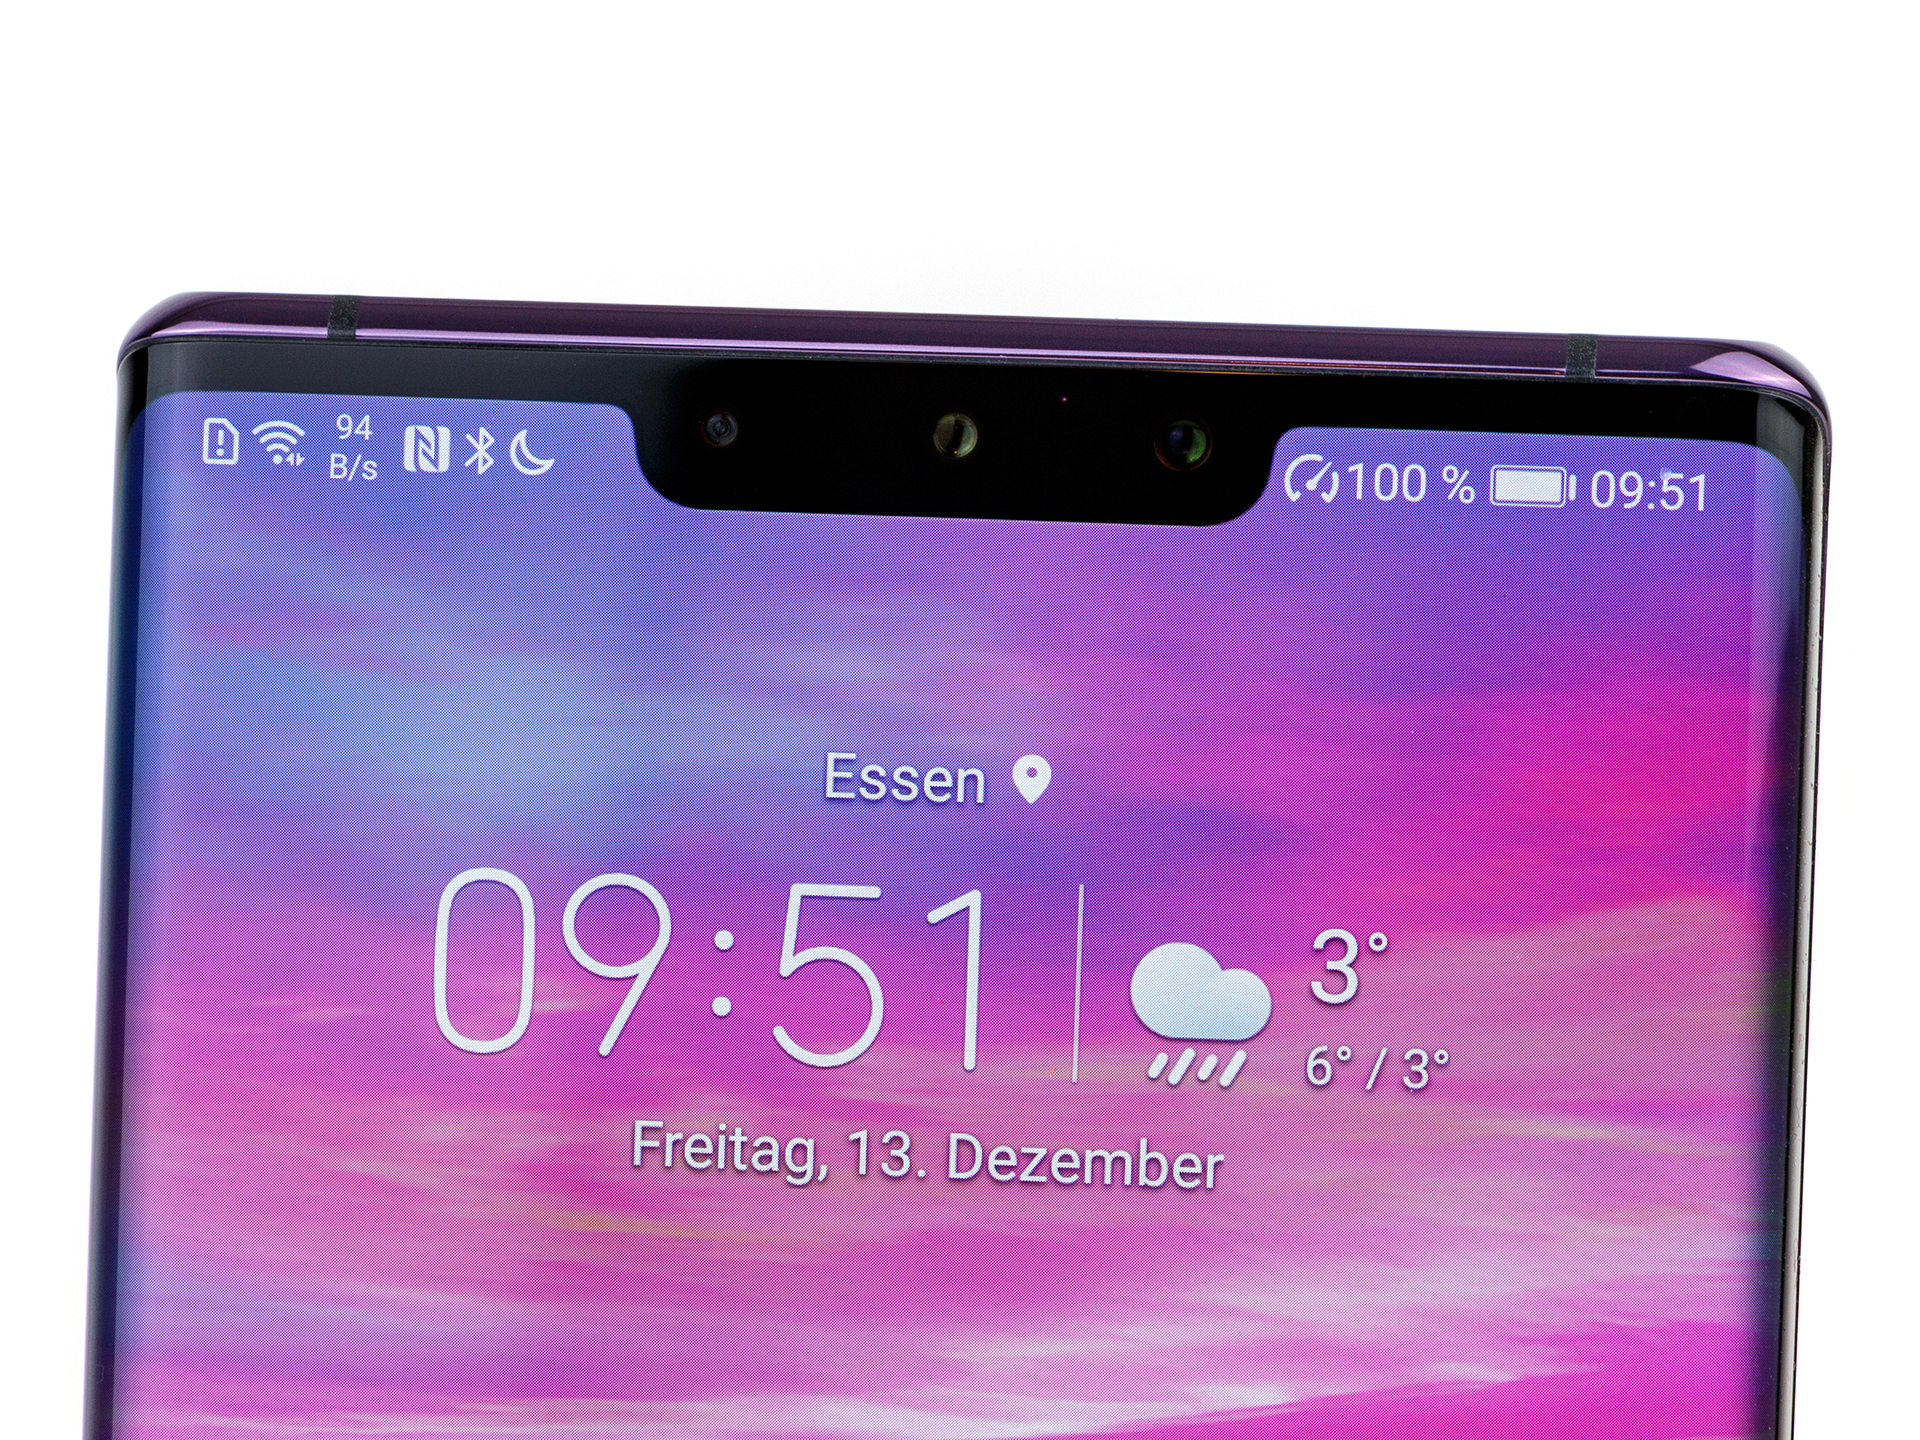
Com o Mate 30 Pro, a Huawei conseguiu mais uma vez entregar um smartphone muito poderoso e de alta qualidade. Infelizmente, a empresa chinesa fez cortes em várias áreas. A curvatura da tela é certamente única no momento e oferece algumas alternativas interessantes de entrada, que também funcionam bem na vida cotidiana. No entanto, isso ocorre às custas da resolução e da precisão das cores. O último não é digno de um smartphone a esse preço. Também gostaríamos de ver uma tela de 90 ou 120 Hz no Mate 30 Pro e, pelo menos, usar a opção de escurecimento DC. Infelizmente, nenhuma delas é possível.
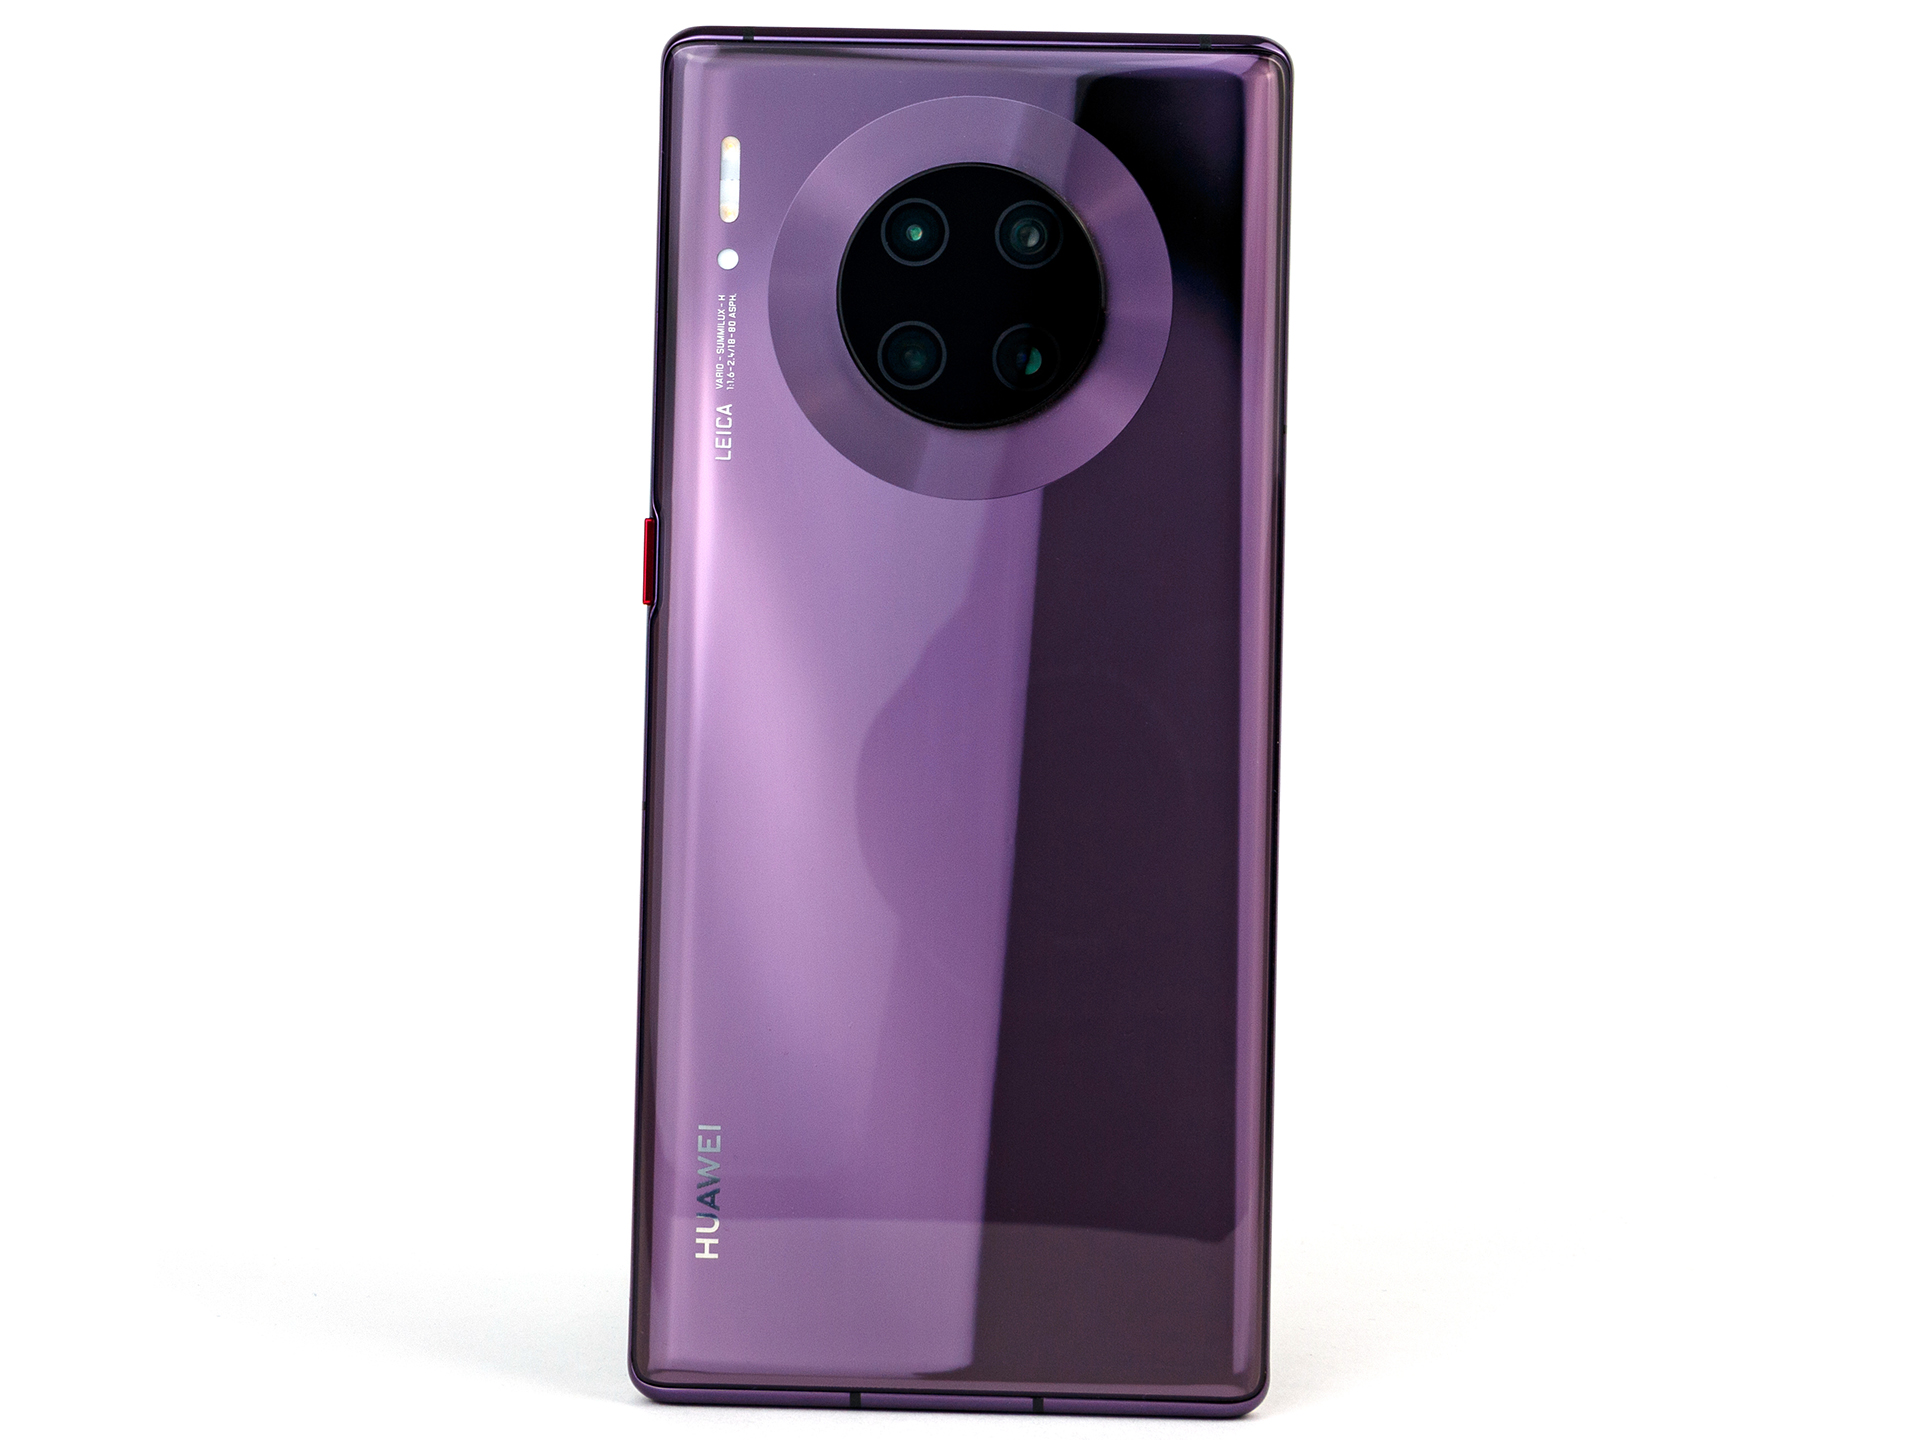
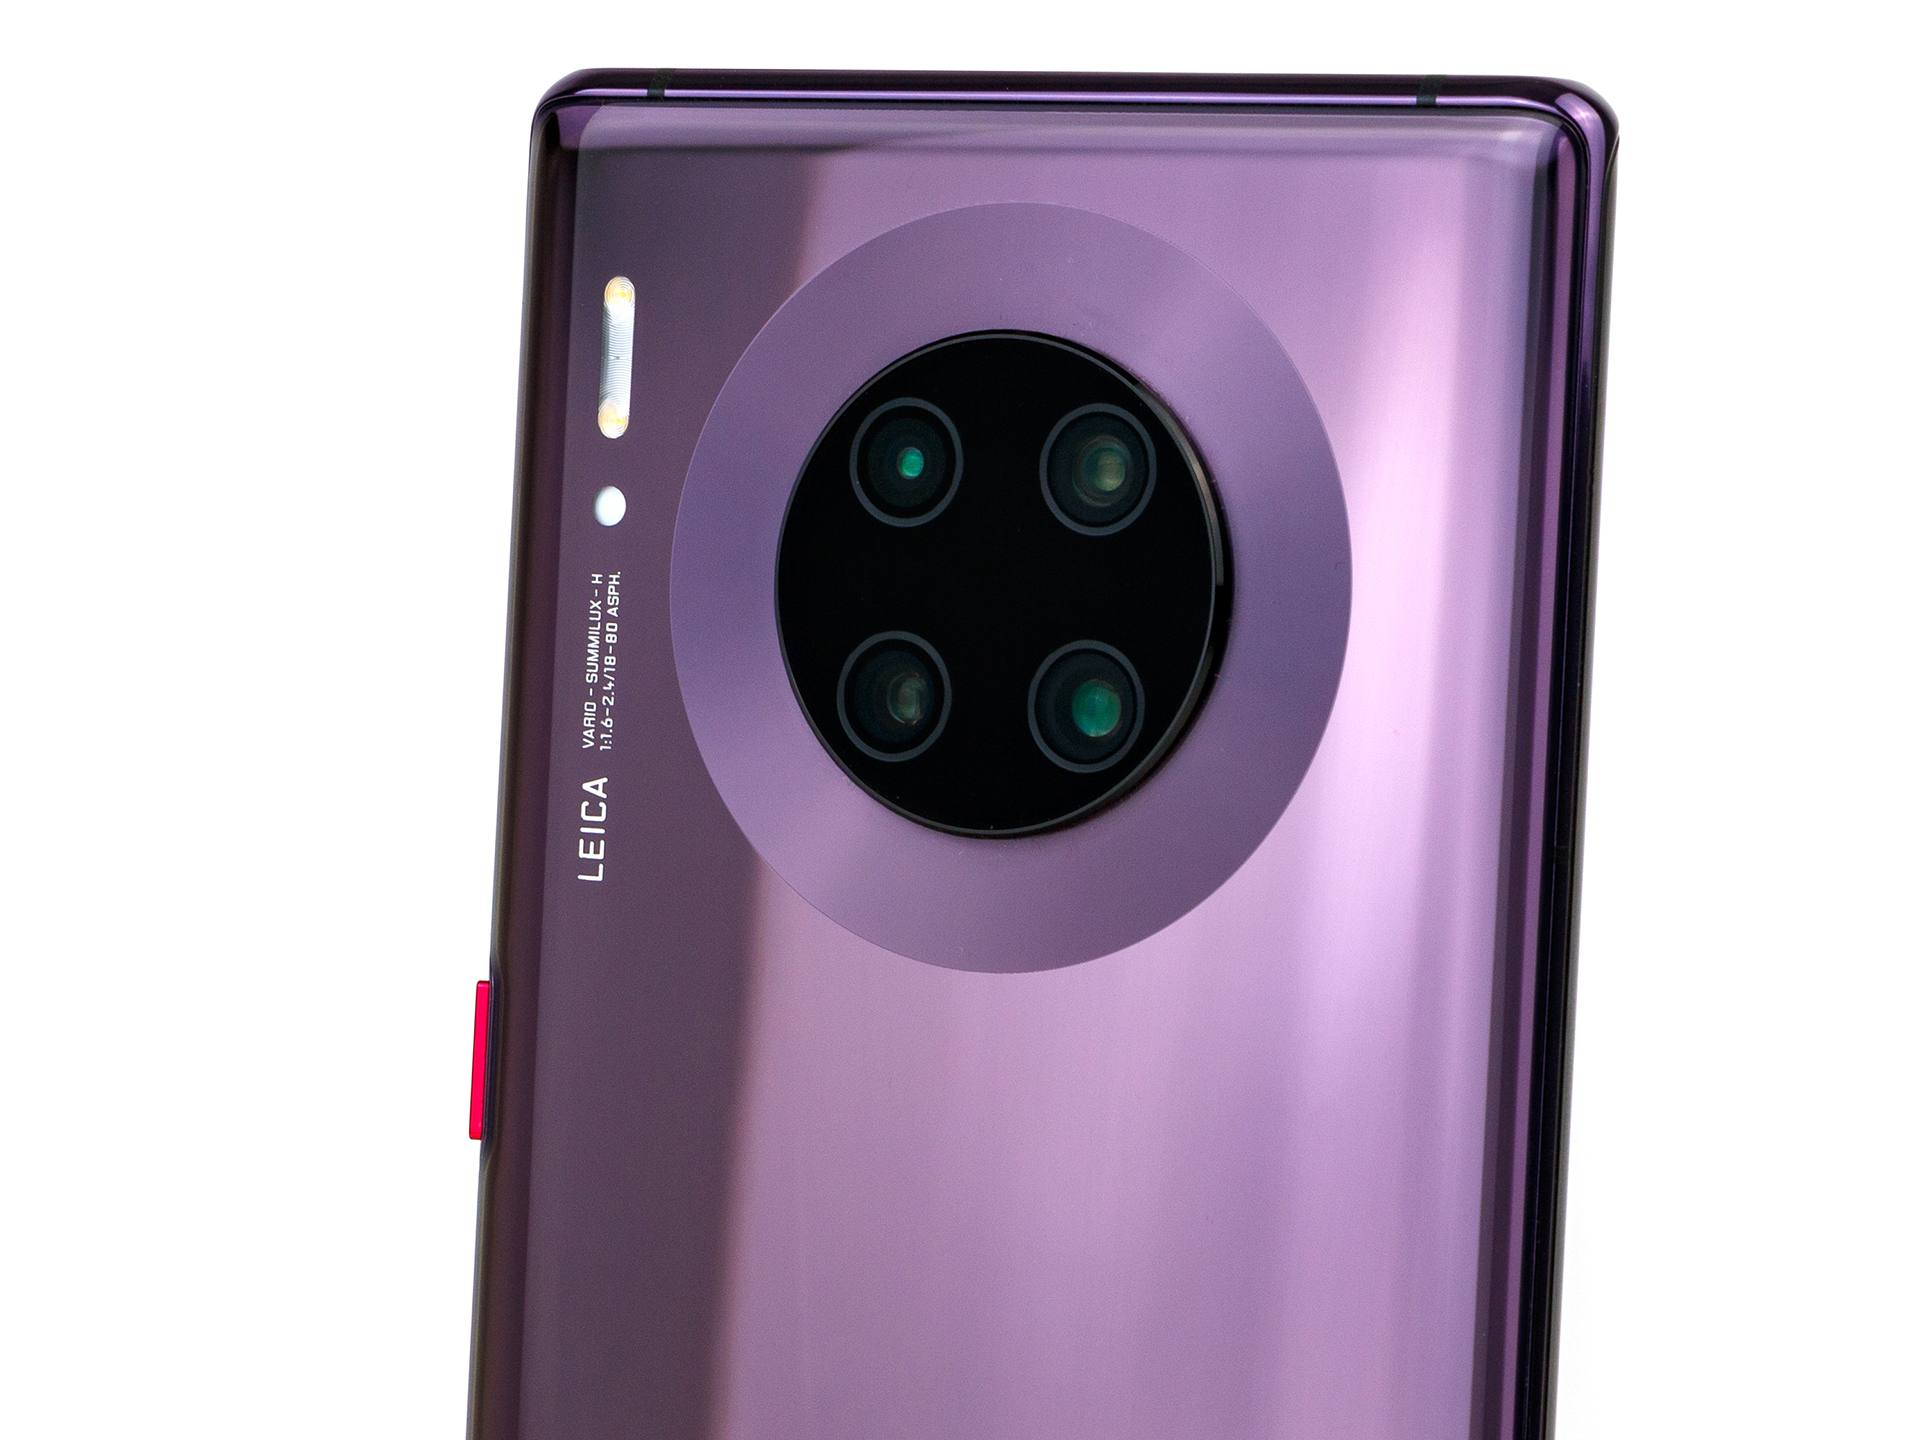
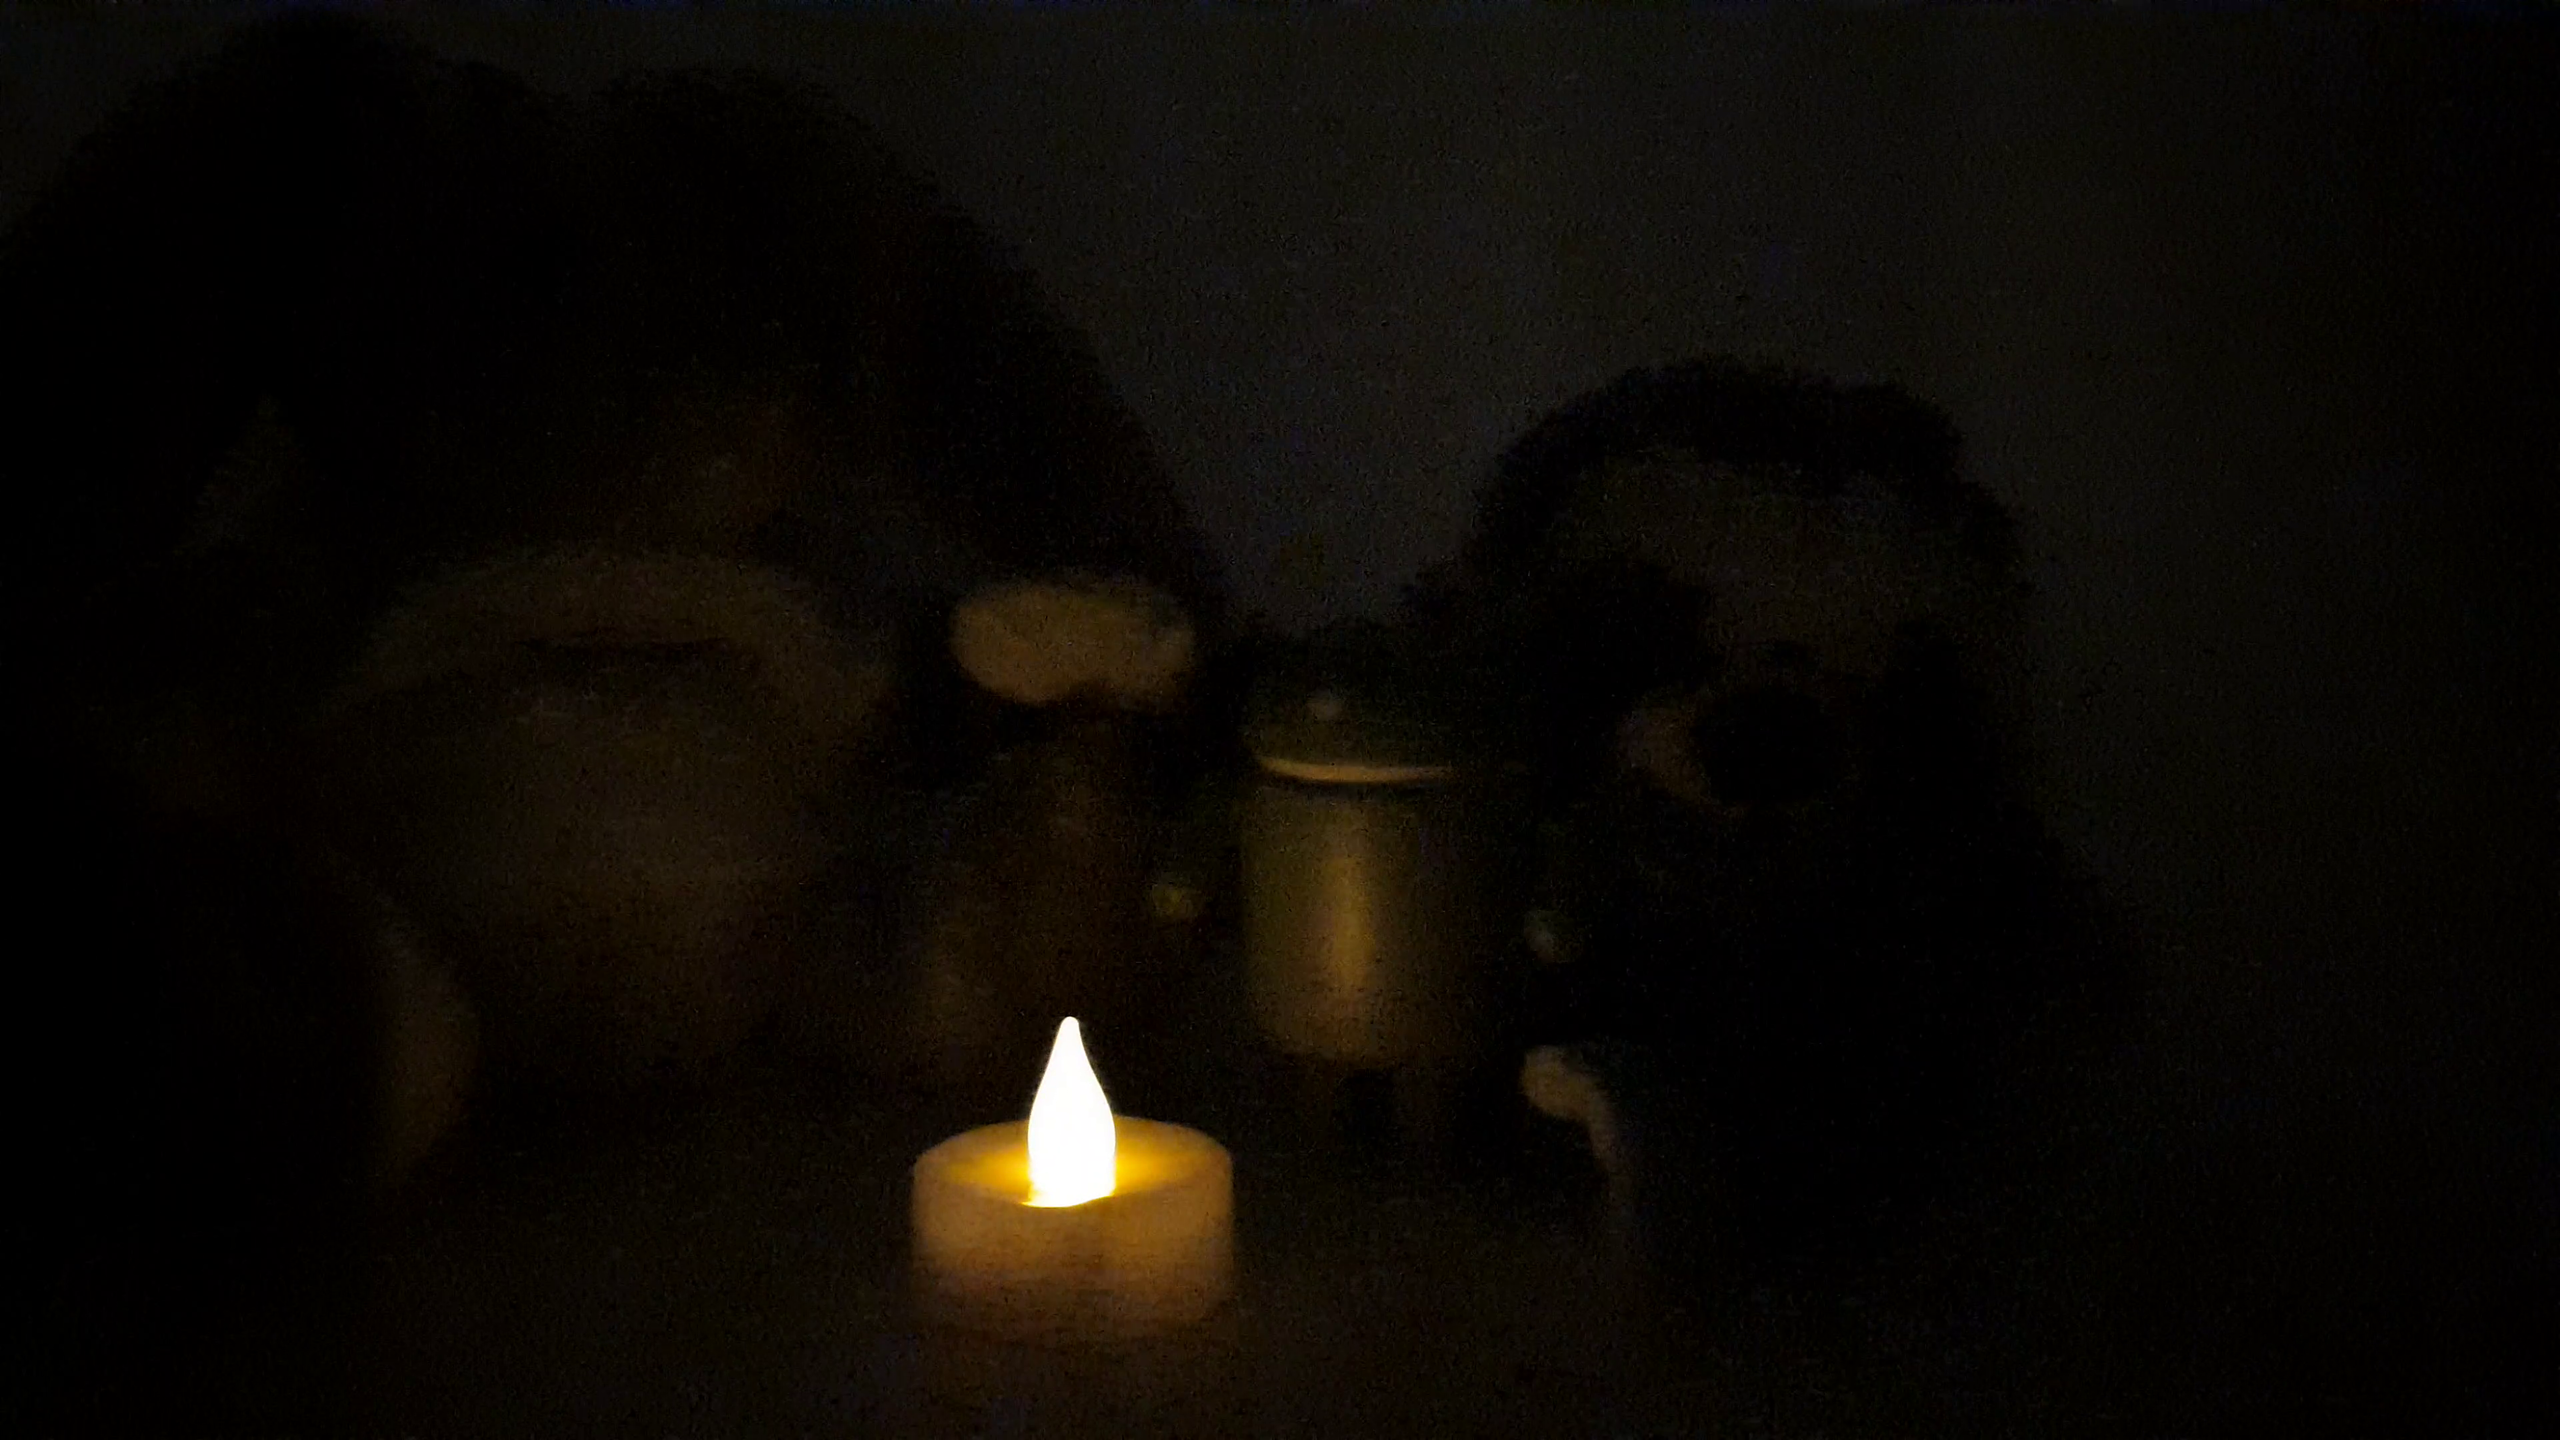
Um destaque do smartphone da Huawei são suas câmeras quádruplas. Em particular, o sensor adicional de 40 MP faz com que gravações de vídeo e fotos com grande angular sejam realmente atraentes em condições de pouca luz. Durante o dia, recomendamos que a Huawei ajuste a qualidade de seu aplicativo de câmera padrão, pois preferimos a reprodução de cores de muitos de seus concorrentes.
O Huawei Mate 30 Pro é um smartphone poderoso, mas também revela alguns pontos fracos.
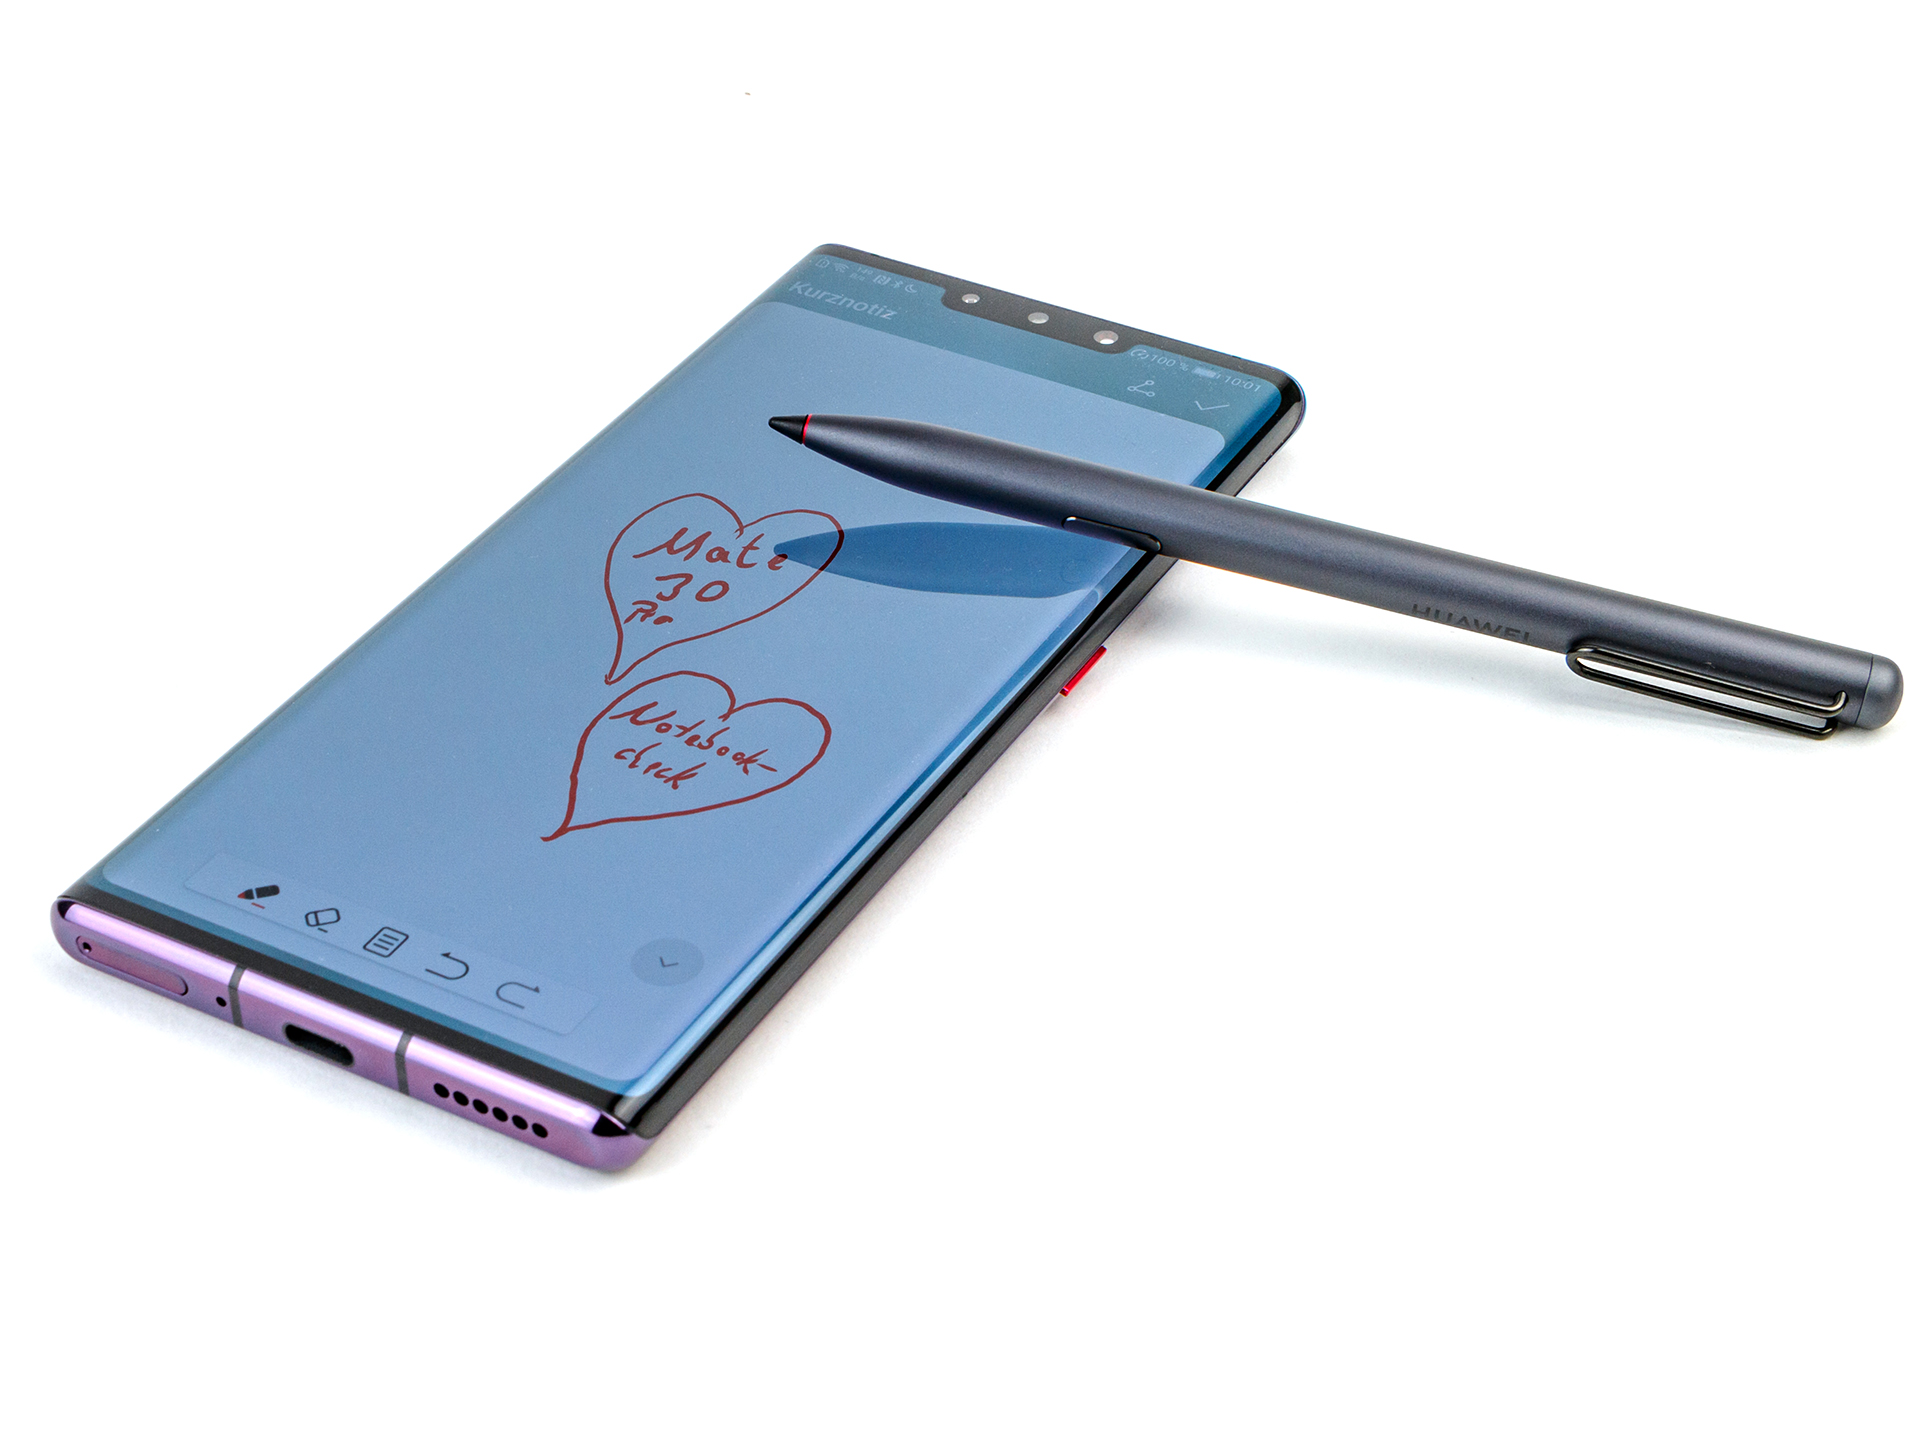
O alto-falante abaixo da tela é, em qualquer caso, uma solução melhor do que a porta USB Tipo C, embora a qualidade do som no volume máximo deixe muito a desejar. A integração do suporte para a M-Pen também é excelente, embora a Huawei queira melhorar a facilidade de uso de sua caneta ativa. Em resumo, escrever com a caneta não se sente natural e a rejeição da palma não é ótima.
Em suma, a Huawei conseguiu criar um smartphone muito bom que certamente não decepcionará os fãs. Quem escolher a versão chinesa deve ter em mente que ela não possui certificação DRM, nem Google Play Services. Este último deve ser instalado manualmente e, mesmo assim, alguns serviços como o Google Pay provavelmente não funcionarão até o final da disputa comercial entre a China e os EUA.
Huawei Mate 30 Pro
- 08/31/2022 v7 (old)
Daniel Schmidt
Price comparison
