Breve Análise do Smartphone Huawei P20

| Networking | |
| iperf3 transmit AX12 | |
| LG V30 | |
| Samsung Galaxy S9 | |
| Huawei P20 Pro | |
| Huawei P20 | |
| Apple iPhone 8 | |
| Huawei P10 | |
| Google Pixel 2 | |
| Huawei P20 Lite | |
| iperf3 receive AX12 | |
| Apple iPhone 8 | |
| LG V30 | |
| Samsung Galaxy S9 | |
| Huawei P20 | |
| Huawei P20 Pro | |
| Huawei P10 | |
| Google Pixel 2 | |
| Huawei P20 Lite | |


| |||||||||||||||||||||||||
iluminação: 96 %
iluminação com acumulador: 753 cd/m²
Contraste: 2035:1 (Preto: 0.37 cd/m²)
ΔE ColorChecker Calman: 1.3 | ∀{0.5-29.43 Ø4.71}
ΔE Greyscale Calman: 1.7 | ∀{0.09-98 Ø4.96}
99.7% sRGB (Calman 2D)
Gamma: 2.18
CCT: 66.76 K
| Huawei P20 LTPS, 2240x1080, 5.8" | Apple iPhone 8 IPS True Tone, 1334x750, 4.7" | Google Pixel 2 AMOLED, 1920x1080, 5" | Huawei P10 LTPS, 1920x1080, 5.1" | Huawei P20 Lite IPS, 2280x1080, 5.8" | Huawei P20 Pro OLED, 2240x1080, 6.1" | LG V30 OLED, 2880x1440, 6" | Samsung Galaxy S9 Super AMOLED, 2960x1440, 5.8" | |
|---|---|---|---|---|---|---|---|---|
| Screen | -11% | -30% | -104% | -122% | -6% | -133% | -23% | |
| Brightness middle (cd/m²) | 753 | 604 -20% | 396 -47% | 547 -27% | 528 -30% | 569 -24% | 432 -43% | 529 -30% |
| Brightness (cd/m²) | 748 | 580 -22% | 404 -46% | 556 -26% | 525 -30% | 578 -23% | 428 -43% | 527 -30% |
| Brightness Distribution (%) | 96 | 91 -5% | 91 -5% | 86 -10% | 89 -7% | 95 -1% | 87 -9% | 96 0% |
| Black Level * (cd/m²) | 0.37 | 0.44 -19% | 0.43 -16% | 0.51 -38% | ||||
| Contrast (:1) | 2035 | 1373 -33% | 1272 -37% | 1035 -49% | ||||
| Colorchecker dE 2000 * | 1.3 | 1.2 8% | 1.7 -31% | 4.8 -269% | 4.7 -262% | 1.3 -0% | 4.18 -222% | 1.4 -8% |
| Colorchecker dE 2000 max. * | 2.3 | 2.3 -0% | 4 -74% | 8.8 -283% | 8.9 -287% | 2.1 9% | 8.53 -271% | 4 -74% |
| Greyscale dE 2000 * | 1.7 | 1.6 6% | 1.3 24% | 4.5 -165% | 6.4 -276% | 1.6 6% | 5.3 -212% | 1.6 6% |
| Gamma | 2.18 101% | 2.25 98% | 2.3 96% | 2.39 92% | 2.22 99% | 2.31 95% | 2.33 94% | 2.16 102% |
| CCT | 66.76 9736% | 6688 97% | 6483 100% | 7194 90% | 7987 81% | 6401 102% | 7487 87% | 6358 102% |
* ... menor é melhor
Exibir tempos de resposta
| ↔ Tempo de resposta preto para branco | ||
|---|---|---|
| 21.6 ms ... ascensão ↗ e queda ↘ combinadas | ↗ 8.4 ms ascensão | 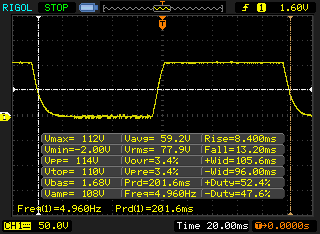 |
| ↘ 13.2 ms queda | ||
| A tela mostra boas taxas de resposta em nossos testes, mas pode ser muito lenta para jogadores competitivos. Em comparação, todos os dispositivos testados variam de 0.1 (mínimo) a 240 (máximo) ms. » 48 % de todos os dispositivos são melhores. Isso significa que o tempo de resposta medido é semelhante à média de todos os dispositivos testados (19.8 ms). | ||
| ↔ Tempo de resposta 50% cinza a 80% cinza | ||
| 43.2 ms ... ascensão ↗ e queda ↘ combinadas | ↗ 21.2 ms ascensão | 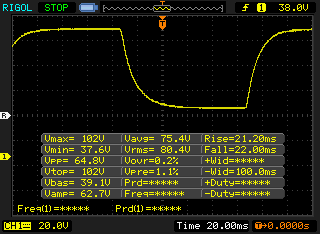 |
| ↘ 22 ms queda | ||
| A tela mostra taxas de resposta lentas em nossos testes e será insatisfatória para os jogadores. Em comparação, todos os dispositivos testados variam de 0.165 (mínimo) a 636 (máximo) ms. » 72 % de todos os dispositivos são melhores. Isso significa que o tempo de resposta medido é pior que a média de todos os dispositivos testados (30.9 ms). | ||
Cintilação da tela / PWM (modulação por largura de pulso)
| Tela tremeluzindo / PWM não detectado | 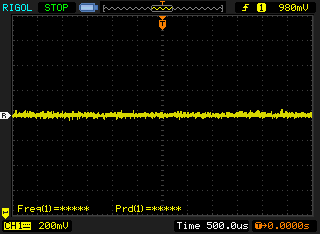 | ||
[pwm_comparison] Em comparação: 52 % de todos os dispositivos testados não usam PWM para escurecer a tela. Se PWM foi detectado, uma média de 7748 (mínimo: 5 - máximo: 343500) Hz foi medida. | |||
| AnTuTu v6 - Total Score (classificar por valor) | |
| Huawei P20 | |
| Apple iPhone 8 | |
| Google Pixel 2 | |
| Huawei P10 | |
| Huawei P20 Lite | |
| Huawei P20 Pro | |
| LG V30 | |
| Samsung Galaxy S9 | |
| Média HiSilicon Kirin 970 (173653 - 181973, n=8) | |
| AnTuTu v7 - Total Score (classificar por valor) | |
| Huawei P20 | |
| Google Pixel 2 | |
| Huawei P10 | |
| Huawei P20 Lite | |
| Huawei P20 Pro | |
| Samsung Galaxy S9 | |
| Média HiSilicon Kirin 970 (152773 - 212278, n=6) | |
| PCMark for Android | |
| Work performance score (classificar por valor) | |
| Huawei P20 | |
| Google Pixel 2 | |
| Huawei P10 | |
| Huawei P20 Lite | |
| Huawei P20 Pro | |
| LG V30 | |
| Samsung Galaxy S9 | |
| Média HiSilicon Kirin 970 (8115 - 9326, n=8) | |
| Work 2.0 performance score (classificar por valor) | |
| Huawei P20 | |
| Google Pixel 2 | |
| Huawei P10 | |
| Huawei P20 Lite | |
| Huawei P20 Pro | |
| LG V30 | |
| Samsung Galaxy S9 | |
| Média HiSilicon Kirin 970 (6293 - 7046, n=8) | |
| JetStream 1.1 - 1.1 Total | |
| Apple iPhone 8 | |
| Samsung Galaxy S9 (Samsung Browser 7.0) | |
| Google Pixel 2 (Chrome 62) | |
| Huawei P20 Pro (Chrome 65) | |
| Huawei P10 (Chrome 56) | |
| Huawei P20 (Chrome 66.0.3359.126) | |
| LG V30 (Chrome 62) | |
| Média HiSilicon Kirin 970 (33.1 - 58.6, n=8) | |
| Huawei P20 Lite (Chrome 63) | |
| Octane V2 - Total Score | |
| Média da turma Smartphone (2800 - 126661, n=141, últimos 2 anos) | |
| Apple iPhone 8 | |
| Samsung Galaxy S9 (Samsung Browser 7.0) | |
| Huawei P20 Pro (Chrome 65) | |
| Huawei P20 (Chrome 66.0.3359.126) | |
| Google Pixel 2 (Chrome 62) | |
| LG V30 (Chrome 62) | |
| Huawei P10 (Chrome 56) | |
| Média HiSilicon Kirin 970 (6692 - 11838, n=8) | |
| Huawei P20 Lite | |
| Mozilla Kraken 1.1 - Total | |
| Huawei P20 Lite (Chrome 63) | |
| Média HiSilicon Kirin 970 (3591 - 6221, n=8) | |
| Huawei P20 (Chrome 66.0.3359.126) | |
| Huawei P20 Pro (Chrome 65) | |
| LG V30 (Chrome 62) | |
| Google Pixel 2 (Chrome 62) | |
| Huawei P10 (Chrome 56) | |
| Samsung Galaxy S9 (Samsung Browser 7.0) | |
| Média da turma Smartphone (257 - 28190, n=120, últimos 2 anos) | |
| Apple iPhone 8 | |
| WebXPRT 2015 - Overall | |
| Apple iPhone 8 | |
| Google Pixel 2 (Chrome 62) | |
| Huawei P20 Pro (Chrome 65) | |
| Huawei P20 (Chrome 66.0.3359.126) | |
| Média HiSilicon Kirin 970 (119 - 187, n=8) | |
| Samsung Galaxy S9 (Samsung Browser 7.0) | |
| LG V30 (Chrome 62) | |
| Huawei P10 (Chrome 56) | |
| Huawei P20 Lite (Chrome 63) | |
* ... menor é melhor
| Huawei P20 | Google Pixel 2 | Huawei P10 | Huawei P20 Lite | Huawei P20 Pro | LG V30 | Samsung Galaxy S9 | Média 128 GB UFS 2.1 Flash | Média da turma Smartphone | |
|---|---|---|---|---|---|---|---|---|---|
| AndroBench 3-5 | -20% | -1% | -46% | 0% | -40% | -23% | 8% | 324% | |
| Sequential Read 256KB (MB/s) | 827 | 758 -8% | 738 -11% | 293.9 -64% | 832 1% | 669 -19% | 815 -1% | 762 ? -8% | 2236 ? 170% |
| Sequential Write 256KB (MB/s) | 193.6 | 196.2 1% | 189.8 -2% | 198.3 2% | 196.7 2% | 193.2 0% | 206.9 7% | 300 ? 55% | 1918 ? 891% |
| Random Read 4KB (MB/s) | 147 | 173.1 18% | 168.4 15% | 48.19 -67% | 144.3 -2% | 78.2 -47% | 131 -11% | 154.7 ? 5% | 312 ? 112% |
| Random Write 4KB (MB/s) | 161.5 | 18.03 -89% | 152.3 -6% | 71.1 -56% | 160.5 -1% | 10.21 -94% | 23.07 -86% | 131.1 ? -19% | 359 ? 122% |
| Sequential Read 256KB SDCard (MB/s) | 54.2 ? | 83.5 ? | 62.8 | 79.2 ? | 76 ? | ||||
| Sequential Write 256KB SDCard (MB/s) | 32.19 ? | 69 ? | 47.2 | 67.2 ? | 59.6 ? |
| Dead Trigger 2 | |||
| Configurações | Valor | ||
| high | 59 fps | ||
| Asphalt 8: Airborne | |||
| Configurações | Valor | ||
| high | 30 fps | ||
(+) A temperatura máxima no lado superior é 36.7 °C / 98 F, em comparação com a média de 35.3 °C / 96 F , variando de 21.9 a 247 °C para a classe Smartphone.
(+) A parte inferior aquece até um máximo de 35.9 °C / 97 F, em comparação com a média de 34 °C / 93 F
(+) Em uso inativo, a temperatura média para o lado superior é 26.7 °C / 80 F, em comparação com a média do dispositivo de 33 °C / ### class_avg_f### F.
Huawei P20 análise de áudio
(±) | o volume do alto-falante é médio, mas bom (###valor### dB)
Graves 100 - 315Hz
(±) | graves reduzidos - em média 14% menor que a mediana
(±) | a linearidade dos graves é média (11.8% delta para a frequência anterior)
Médios 400 - 2.000 Hz
(+) | médios equilibrados - apenas 3% longe da mediana
(±) | a linearidade dos médios é média (10.4% delta para frequência anterior)
Altos 2 - 16 kHz
(±) | máximos mais altos - em média 8.5% maior que a mediana
(±) | a linearidade dos máximos é média (8.5% delta para frequência anterior)
Geral 100 - 16.000 Hz
(±) | a linearidade do som geral é média (21.7% diferença em relação à mediana)
Comparado com a mesma classe
» 44% de todos os dispositivos testados nesta classe foram melhores, 8% semelhantes, 48% piores
» O melhor teve um delta de 11%, a média foi 34%, o pior foi 134%
Comparado com todos os dispositivos testados
» 62% de todos os dispositivos testados foram melhores, 7% semelhantes, 31% piores
» O melhor teve um delta de 4%, a média foi 23%, o pior foi 134%
Huawei P20 Lite análise de áudio
(+) | os alto-falantes podem tocar relativamente alto (###valor### dB)
Graves 100 - 315Hz
(-) | quase nenhum baixo - em média 25% menor que a mediana
(±) | a linearidade dos graves é média (9.4% delta para a frequência anterior)
Médios 400 - 2.000 Hz
(+) | médios equilibrados - apenas 4.4% longe da mediana
(±) | a linearidade dos médios é média (8.7% delta para frequência anterior)
Altos 2 - 16 kHz
(±) | máximos mais altos - em média 10.5% maior que a mediana
(+) | os máximos são lineares (3.4% delta da frequência anterior)
Geral 100 - 16.000 Hz
(±) | a linearidade do som geral é média (25.5% diferença em relação à mediana)
Comparado com a mesma classe
» 64% de todos os dispositivos testados nesta classe foram melhores, 6% semelhantes, 30% piores
» O melhor teve um delta de 11%, a média foi 34%, o pior foi 134%
Comparado com todos os dispositivos testados
» 78% de todos os dispositivos testados foram melhores, 4% semelhantes, 17% piores
» O melhor teve um delta de 4%, a média foi 23%, o pior foi 134%
Huawei P20 Pro análise de áudio
(+) | os alto-falantes podem tocar relativamente alto (###valor### dB)
Graves 100 - 315Hz
(-) | quase nenhum baixo - em média 21% menor que a mediana
(±) | a linearidade dos graves é média (9.5% delta para a frequência anterior)
Médios 400 - 2.000 Hz
(±) | médios mais altos - em média 5% maior que a mediana
(±) | a linearidade dos médios é média (7.2% delta para frequência anterior)
Altos 2 - 16 kHz
(±) | máximos mais altos - em média 5.6% maior que a mediana
(+) | os máximos são lineares (4.5% delta da frequência anterior)
Geral 100 - 16.000 Hz
(±) | a linearidade do som geral é média (20.1% diferença em relação à mediana)
Comparado com a mesma classe
» 33% de todos os dispositivos testados nesta classe foram melhores, 9% semelhantes, 58% piores
» O melhor teve um delta de 11%, a média foi 34%, o pior foi 134%
Comparado com todos os dispositivos testados
» 52% de todos os dispositivos testados foram melhores, 8% semelhantes, 40% piores
» O melhor teve um delta de 4%, a média foi 23%, o pior foi 134%
| desligado | |
| Ocioso | |
| Carga |
|
Key:
min: | |
| Huawei P20 3400 mAh | Apple iPhone 8 1821 mAh | Google Pixel 2 2700 mAh | Huawei P10 3200 mAh | Huawei P20 Lite 3000 mAh | Huawei P20 Pro 4000 mAh | LG V30 3300 mAh | Samsung Galaxy S9 3000 mAh | Média HiSilicon Kirin 970 | Média da turma Smartphone | |
|---|---|---|---|---|---|---|---|---|---|---|
| Power Consumption | 24% | 12% | -10% | 5% | 31% | 21% | 36% | -10% | -6% | |
| Idle Minimum * (Watt) | 0.67 | 0.54 19% | 0.99 -48% | 0.83 -24% | 0.98 -46% | 0.84 -25% | 0.72 -7% | 0.65 3% | 0.978 ? -46% | 0.885 ? -32% |
| Idle Average * (Watt) | 2.05 | 1.63 20% | 1.35 34% | 2.1 -2% | 2 2% | 1.54 25% | 1.37 33% | 0.81 60% | 2.12 ? -3% | 1.483 ? 28% |
| Idle Maximum * (Watt) | 2.11 | 1.67 21% | 1.37 35% | 2.18 -3% | 2.11 -0% | 1.57 26% | 1.41 33% | 0.92 56% | 2.51 ? -19% | 1.671 ? 21% |
| Load Average * (Watt) | 6.15 | 2.74 55% | 3.25 47% | 6.57 -7% | 3.9 37% | 2.47 60% | 3.46 44% | 4.76 23% | 5.01 ? 19% | 6.73 ? -9% |
| Load Maximum * (Watt) | 8.09 | 7.78 4% | 8.56 -6% | 9.32 -15% | 5.62 31% | 2.49 69% | 7.83 3% | 5.16 36% | 8.1 ? -0% | 11.2 ? -38% |
* ... menor é melhor
| Huawei P20 3400 mAh | Apple iPhone 8 1821 mAh | Google Pixel 2 2700 mAh | Huawei P10 3200 mAh | Huawei P20 Lite 3000 mAh | Huawei P20 Pro 4000 mAh | LG V30 3300 mAh | Samsung Galaxy S9 3000 mAh | |
|---|---|---|---|---|---|---|---|---|
| Duração da bateria | -22% | -32% | -17% | -37% | -1% | -3% | -37% | |
| Reader / Idle (h) | 31.5 | 27.2 -14% | 24.3 -23% | 25.7 -18% | 12.5 -60% | 28.8 -9% | 31.9 1% | 19.7 -37% |
| H.264 (h) | 13.5 | 11.6 -14% | 9.4 -30% | 9.7 -28% | 7.8 -42% | 13.1 -3% | 13.7 1% | 10.2 -24% |
| WiFi v1.3 (h) | 13.6 | 9.8 -28% | 9.6 -29% | 16.1 18% | 9.7 -29% | 12.4 -9% | 12.9 -5% | 7.9 -42% |
| Load (h) | 4.9 | 3.4 -31% | 2.7 -45% | 2.9 -41% | 4.1 -16% | 5.8 18% | 4.5 -8% | 2.7 -45% |
Pro
Contra
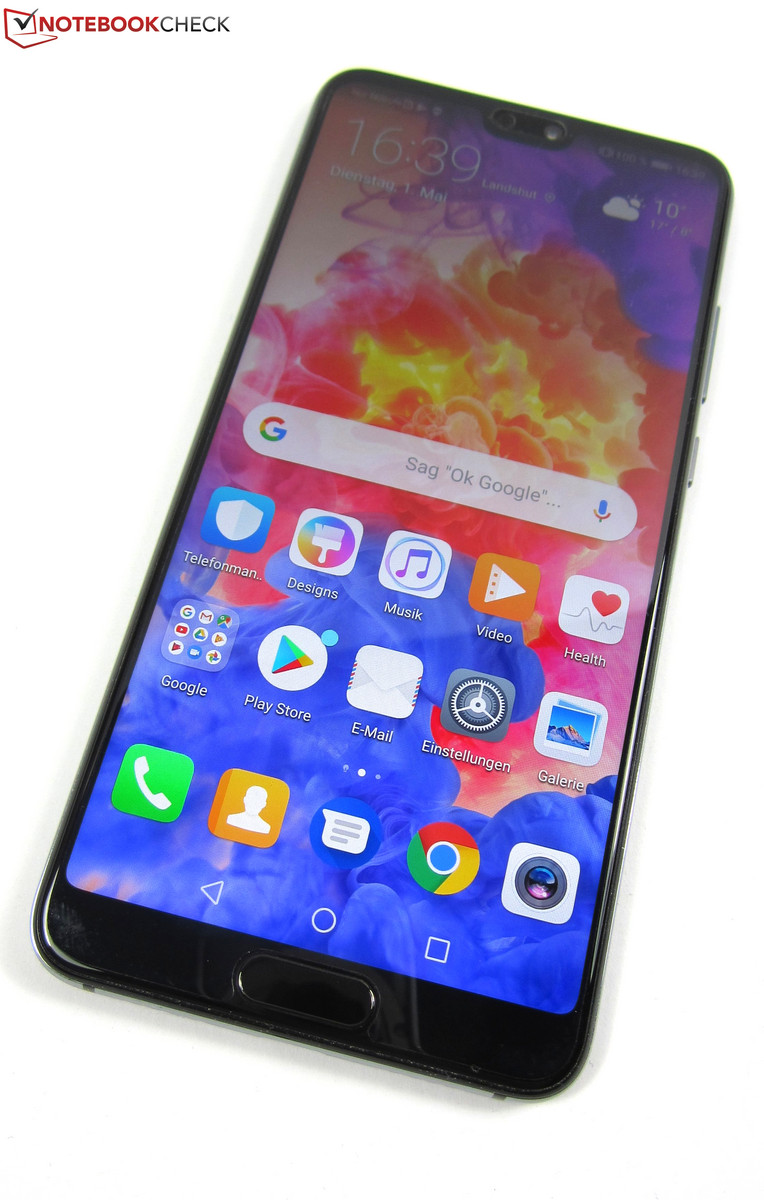
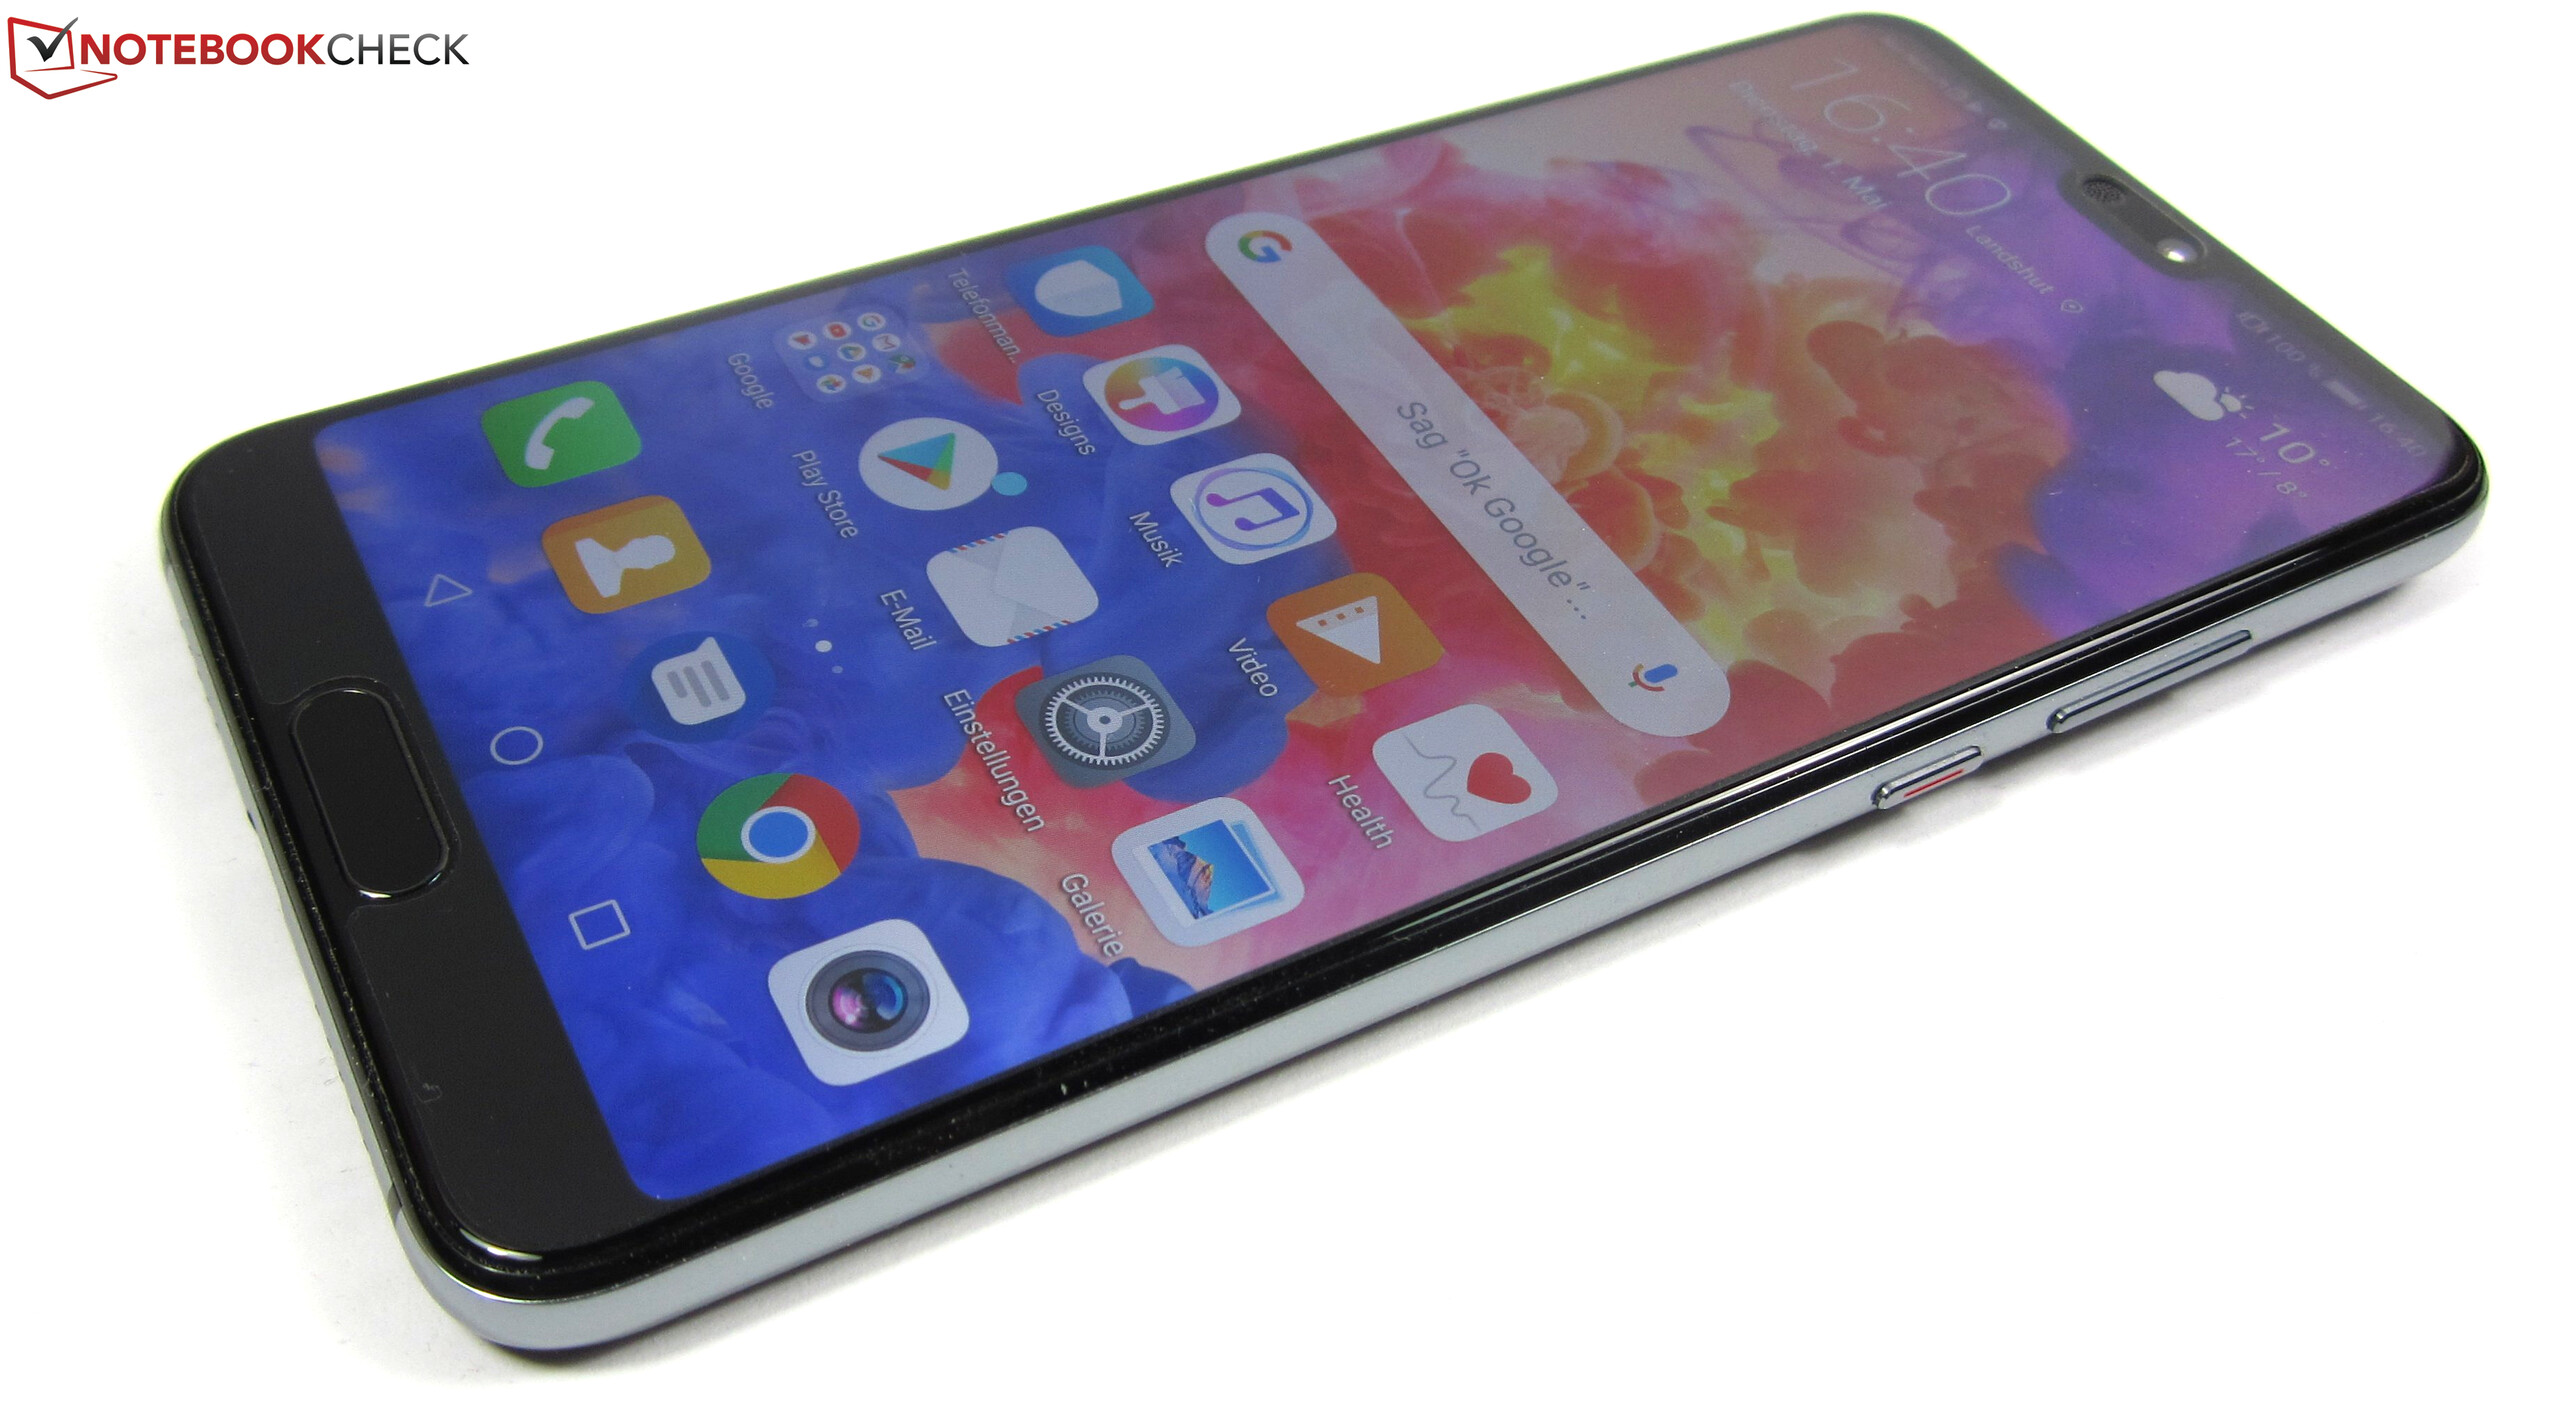
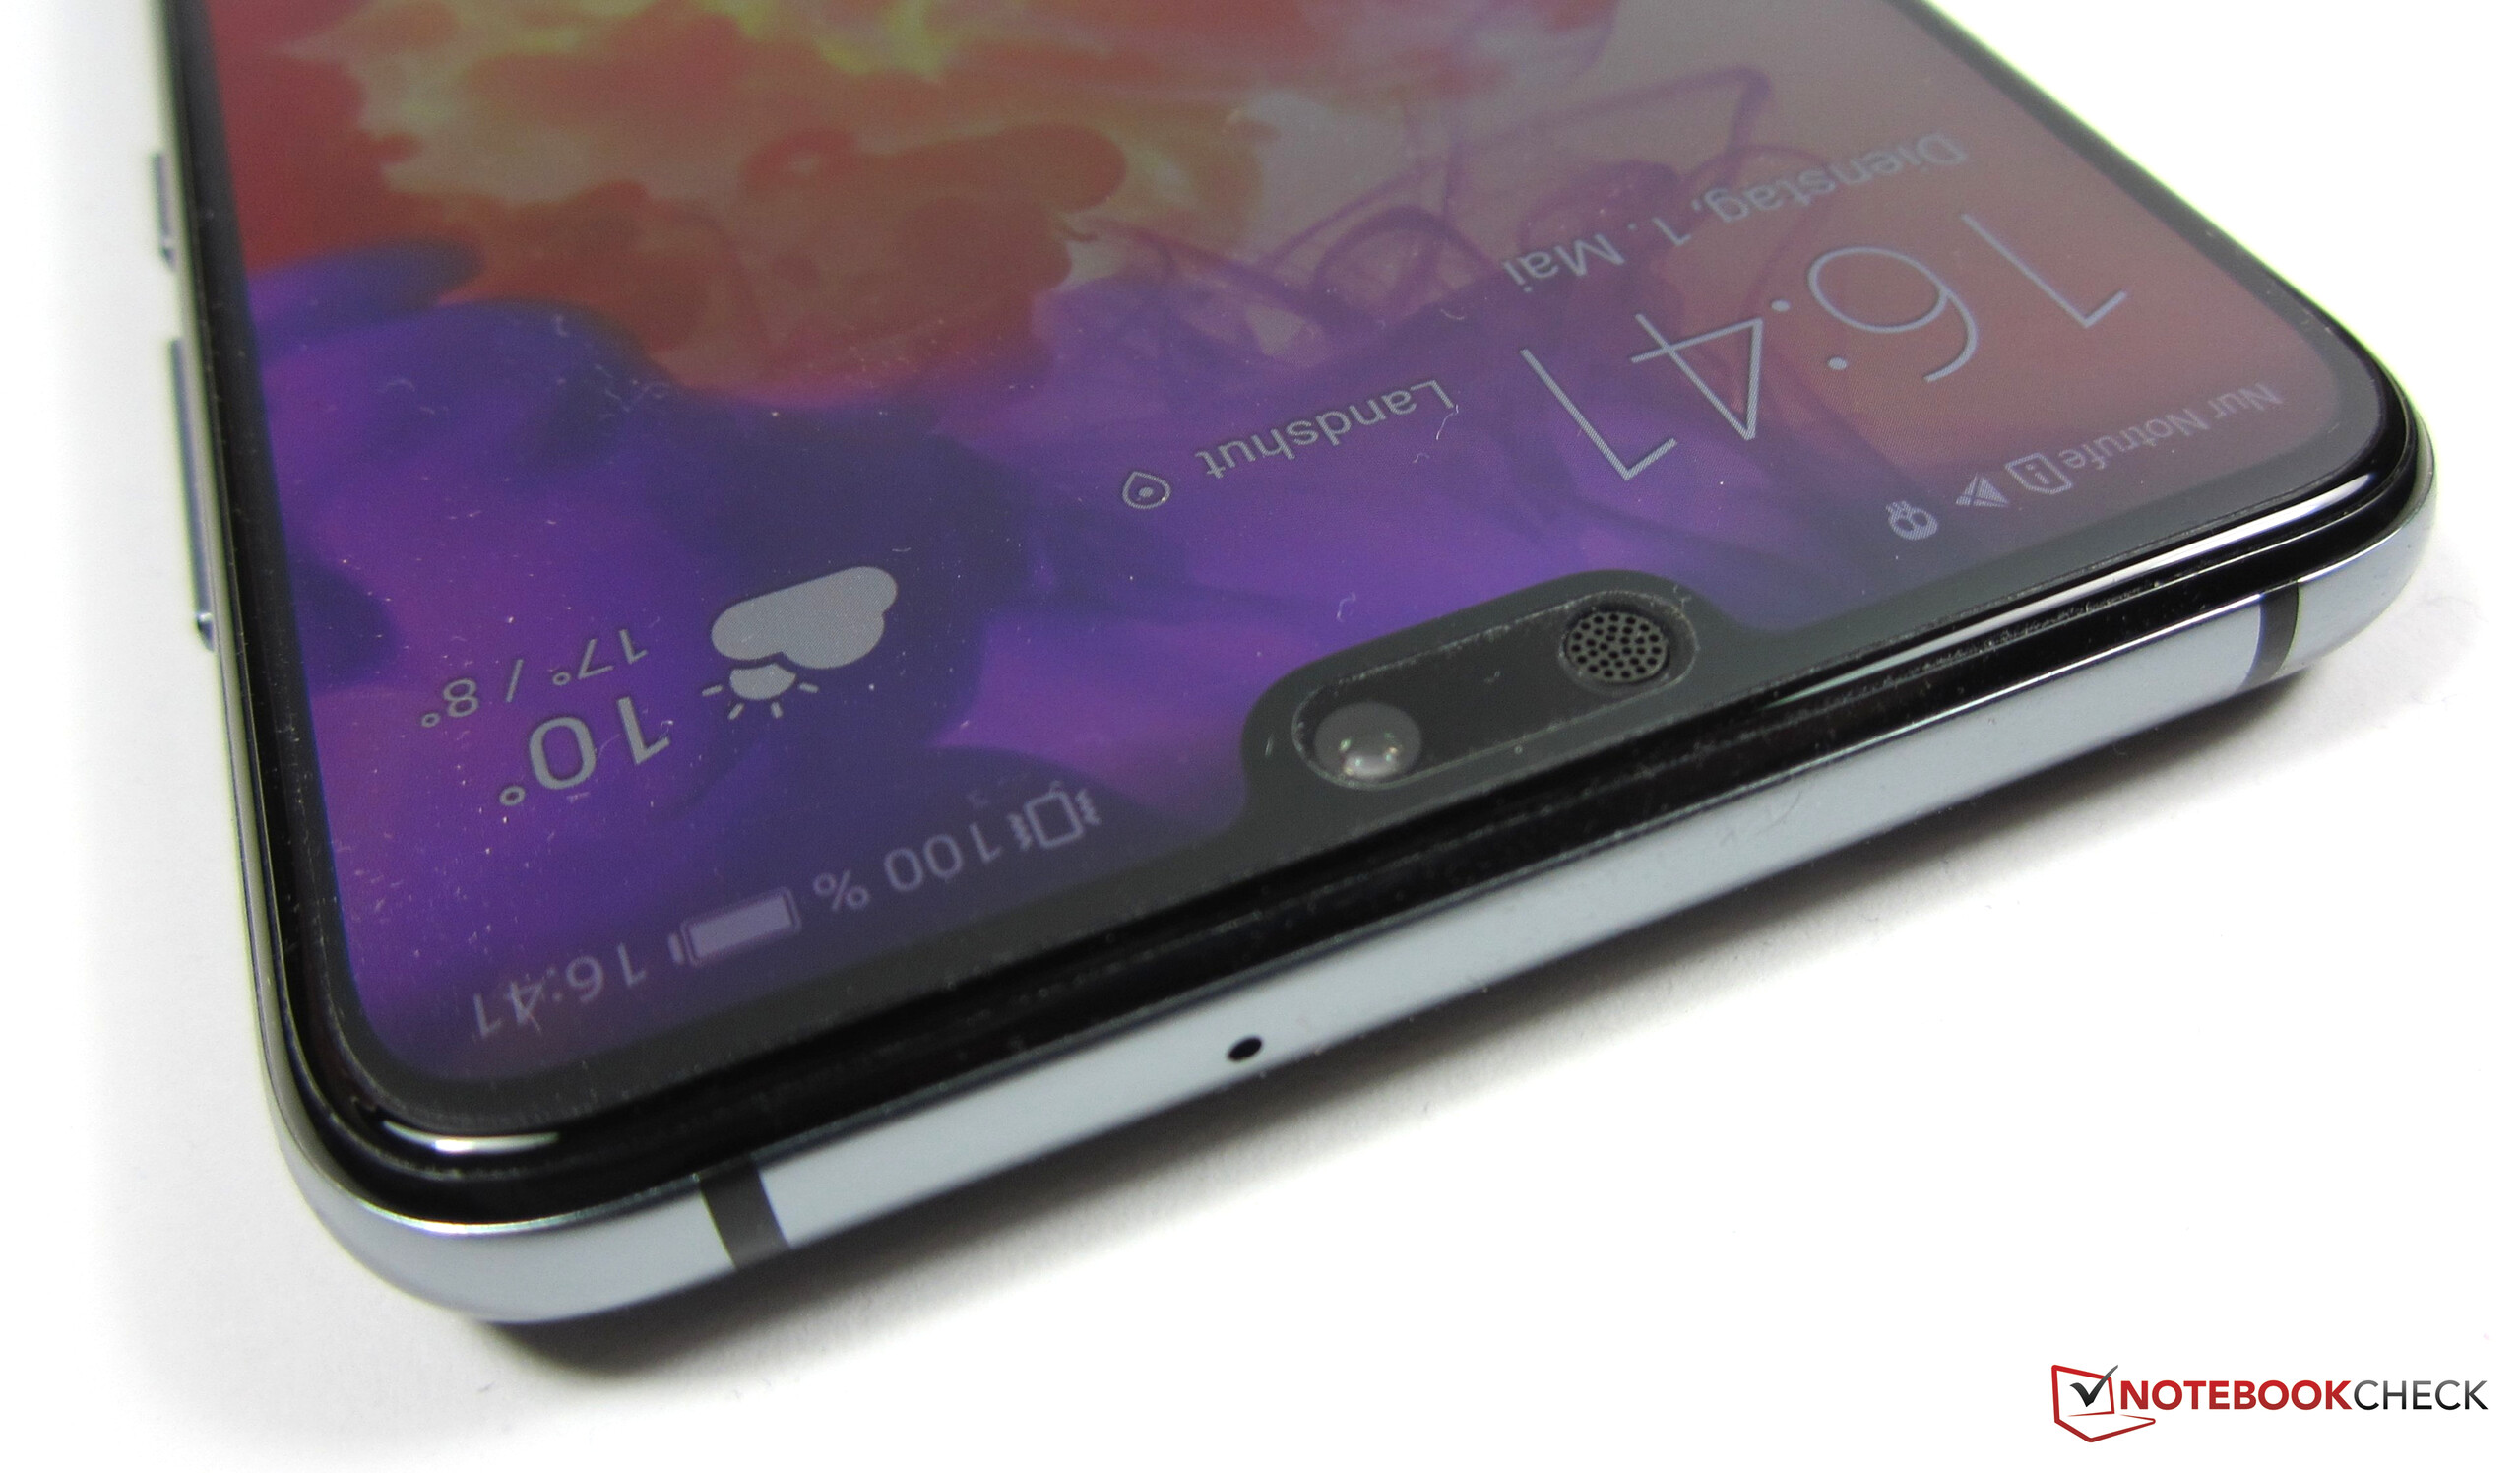
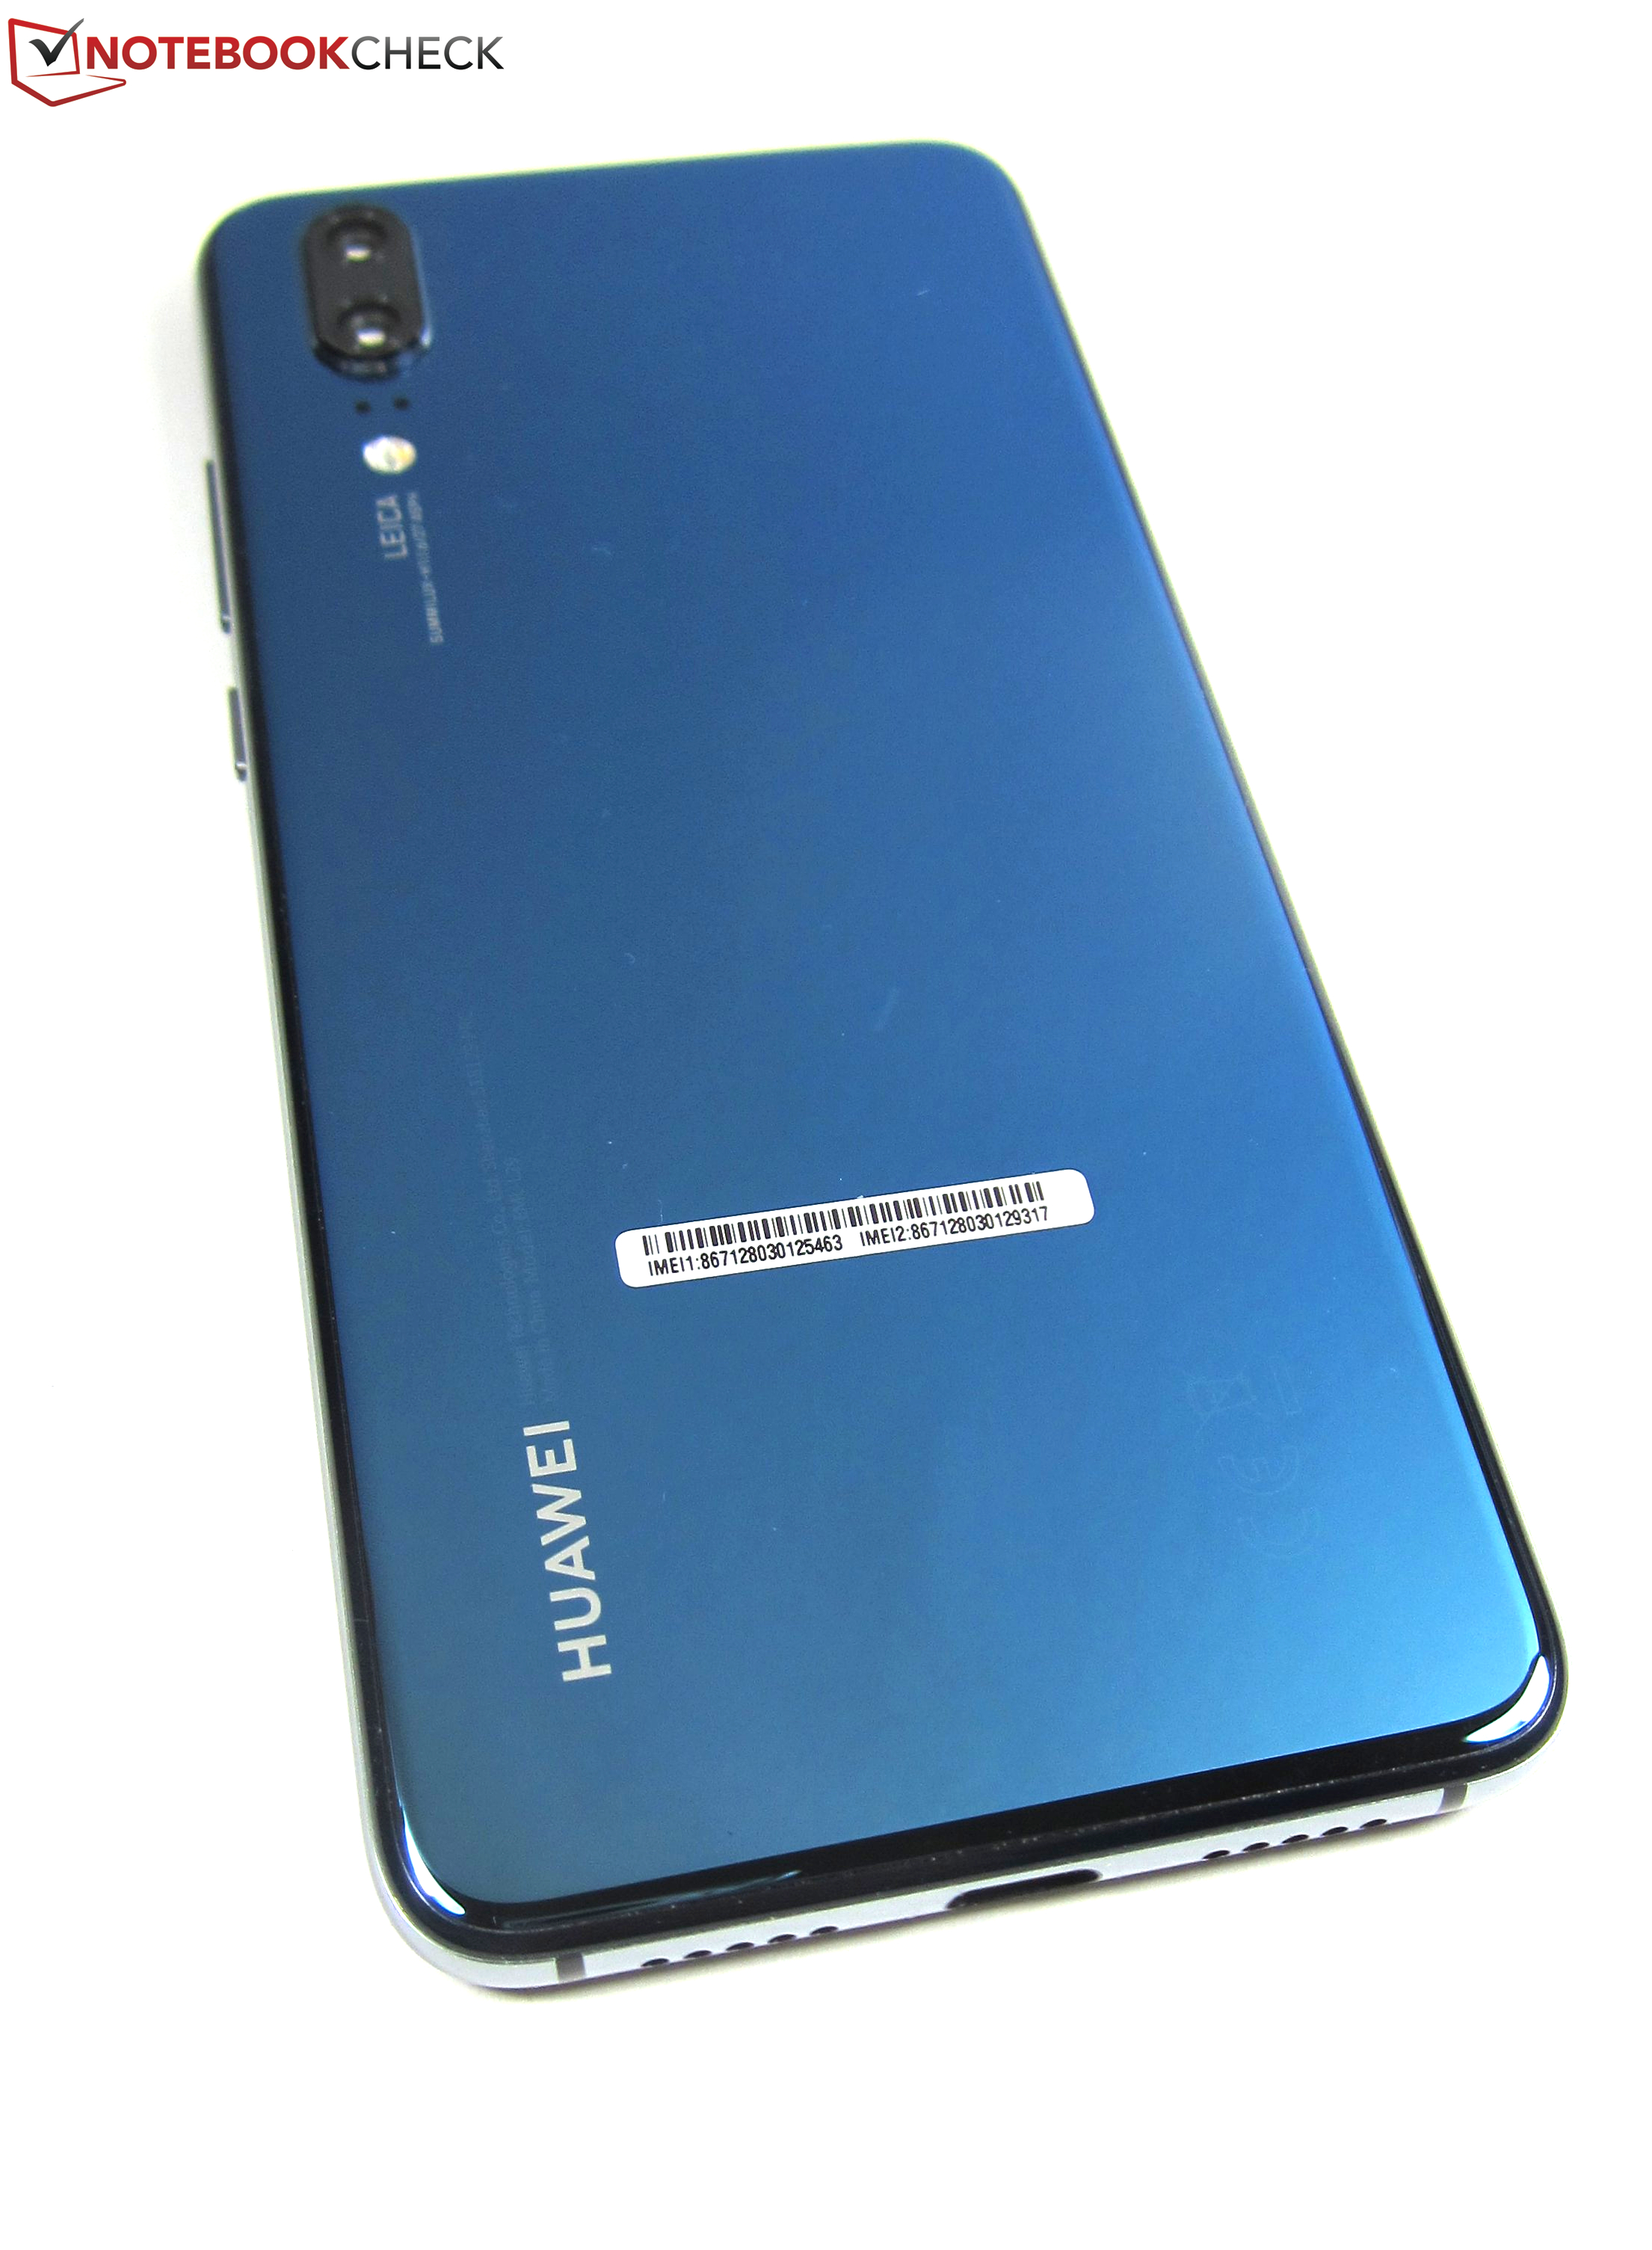
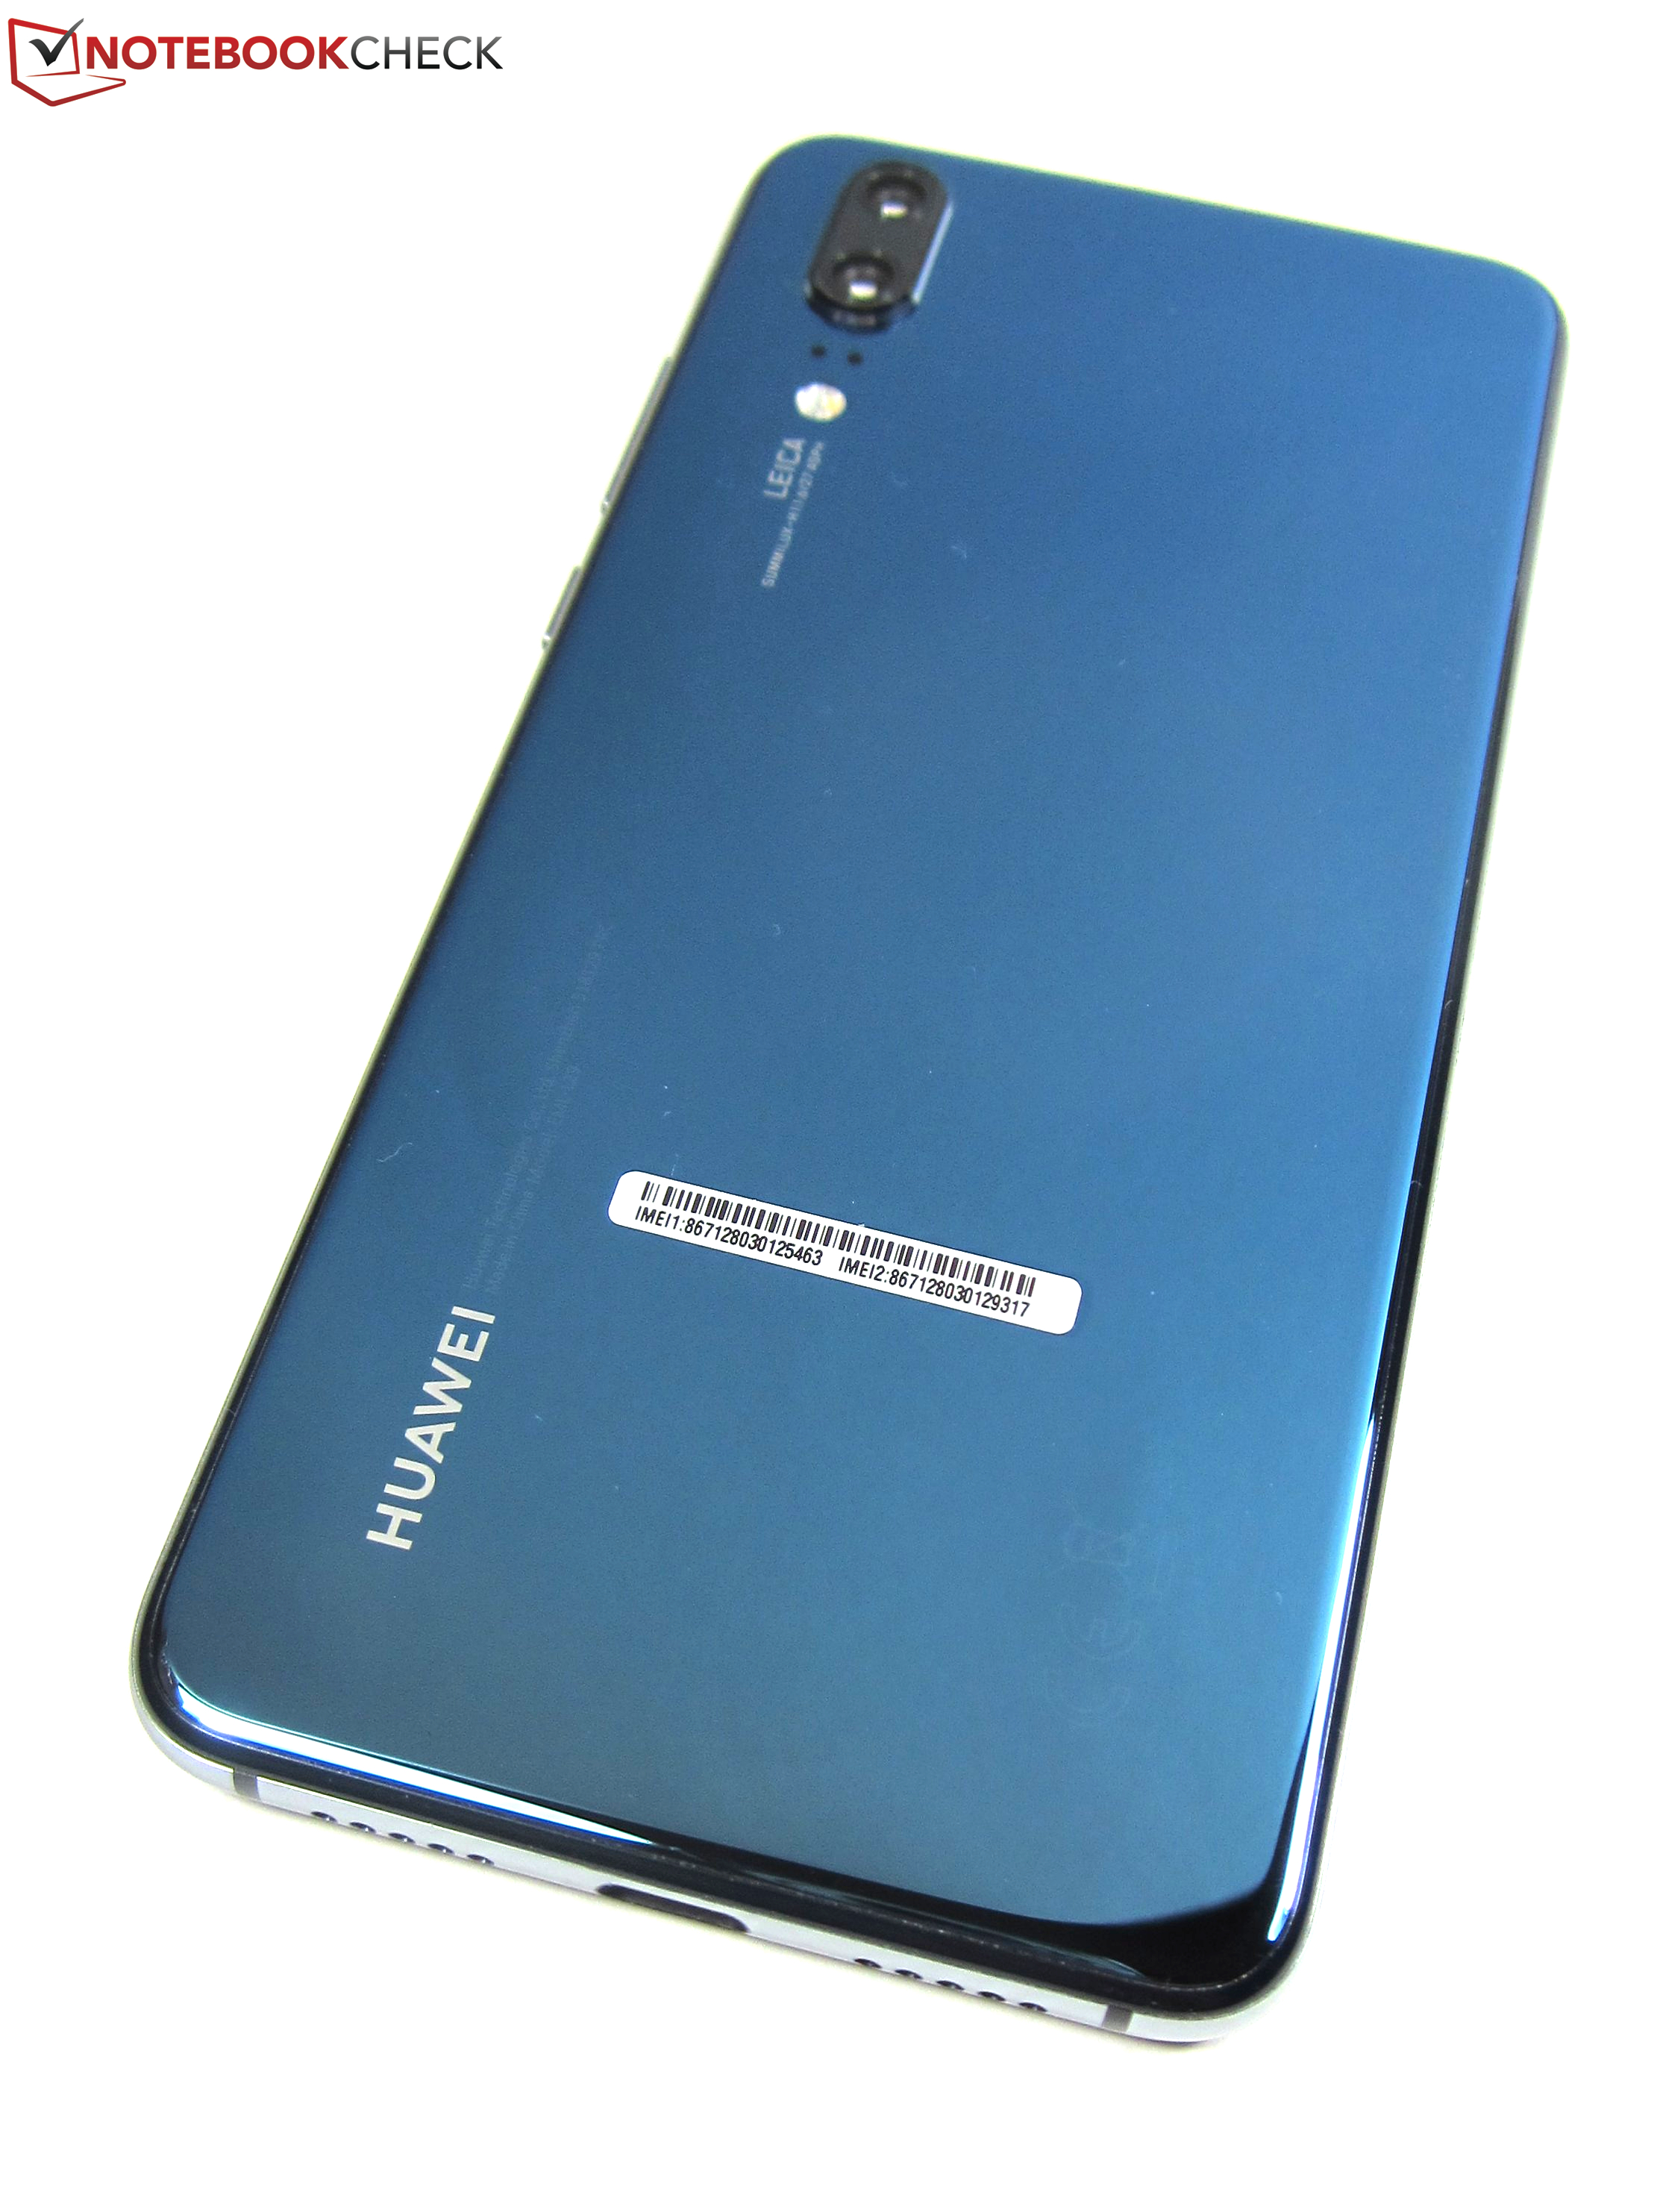
O Huawei P20 é um excelente smartphone de gama alta e marca muitas caixas certas. Além do excelente desempenho do sistema, o smartphone de 5,8 polegadas convence com boa qualidade de construção, o mais recente sistema operacional Android e uma tela brilhante. Esta última apresenta cores precisas e é especial graças ao seu formato incomum de 18,7: 9 (2240 x 1080 pixels). LTE Cat. 18, a porta USB-C com USB 31. Gen. 1 funcionalidade, longos tempos de duração da bateria, a PSU de carga rápida fornecida e, no nosso caso, um módulo de duplo SIM com dupla VoLTE/VoWiFi, são outras vantagens.
O Huawei P20 tem uma das melhores câmeras de smartphone que você pode obter agora. O Huawei P20 Pro é ainda (ligeiramente) melhor, mas é 250 euros mais caro.
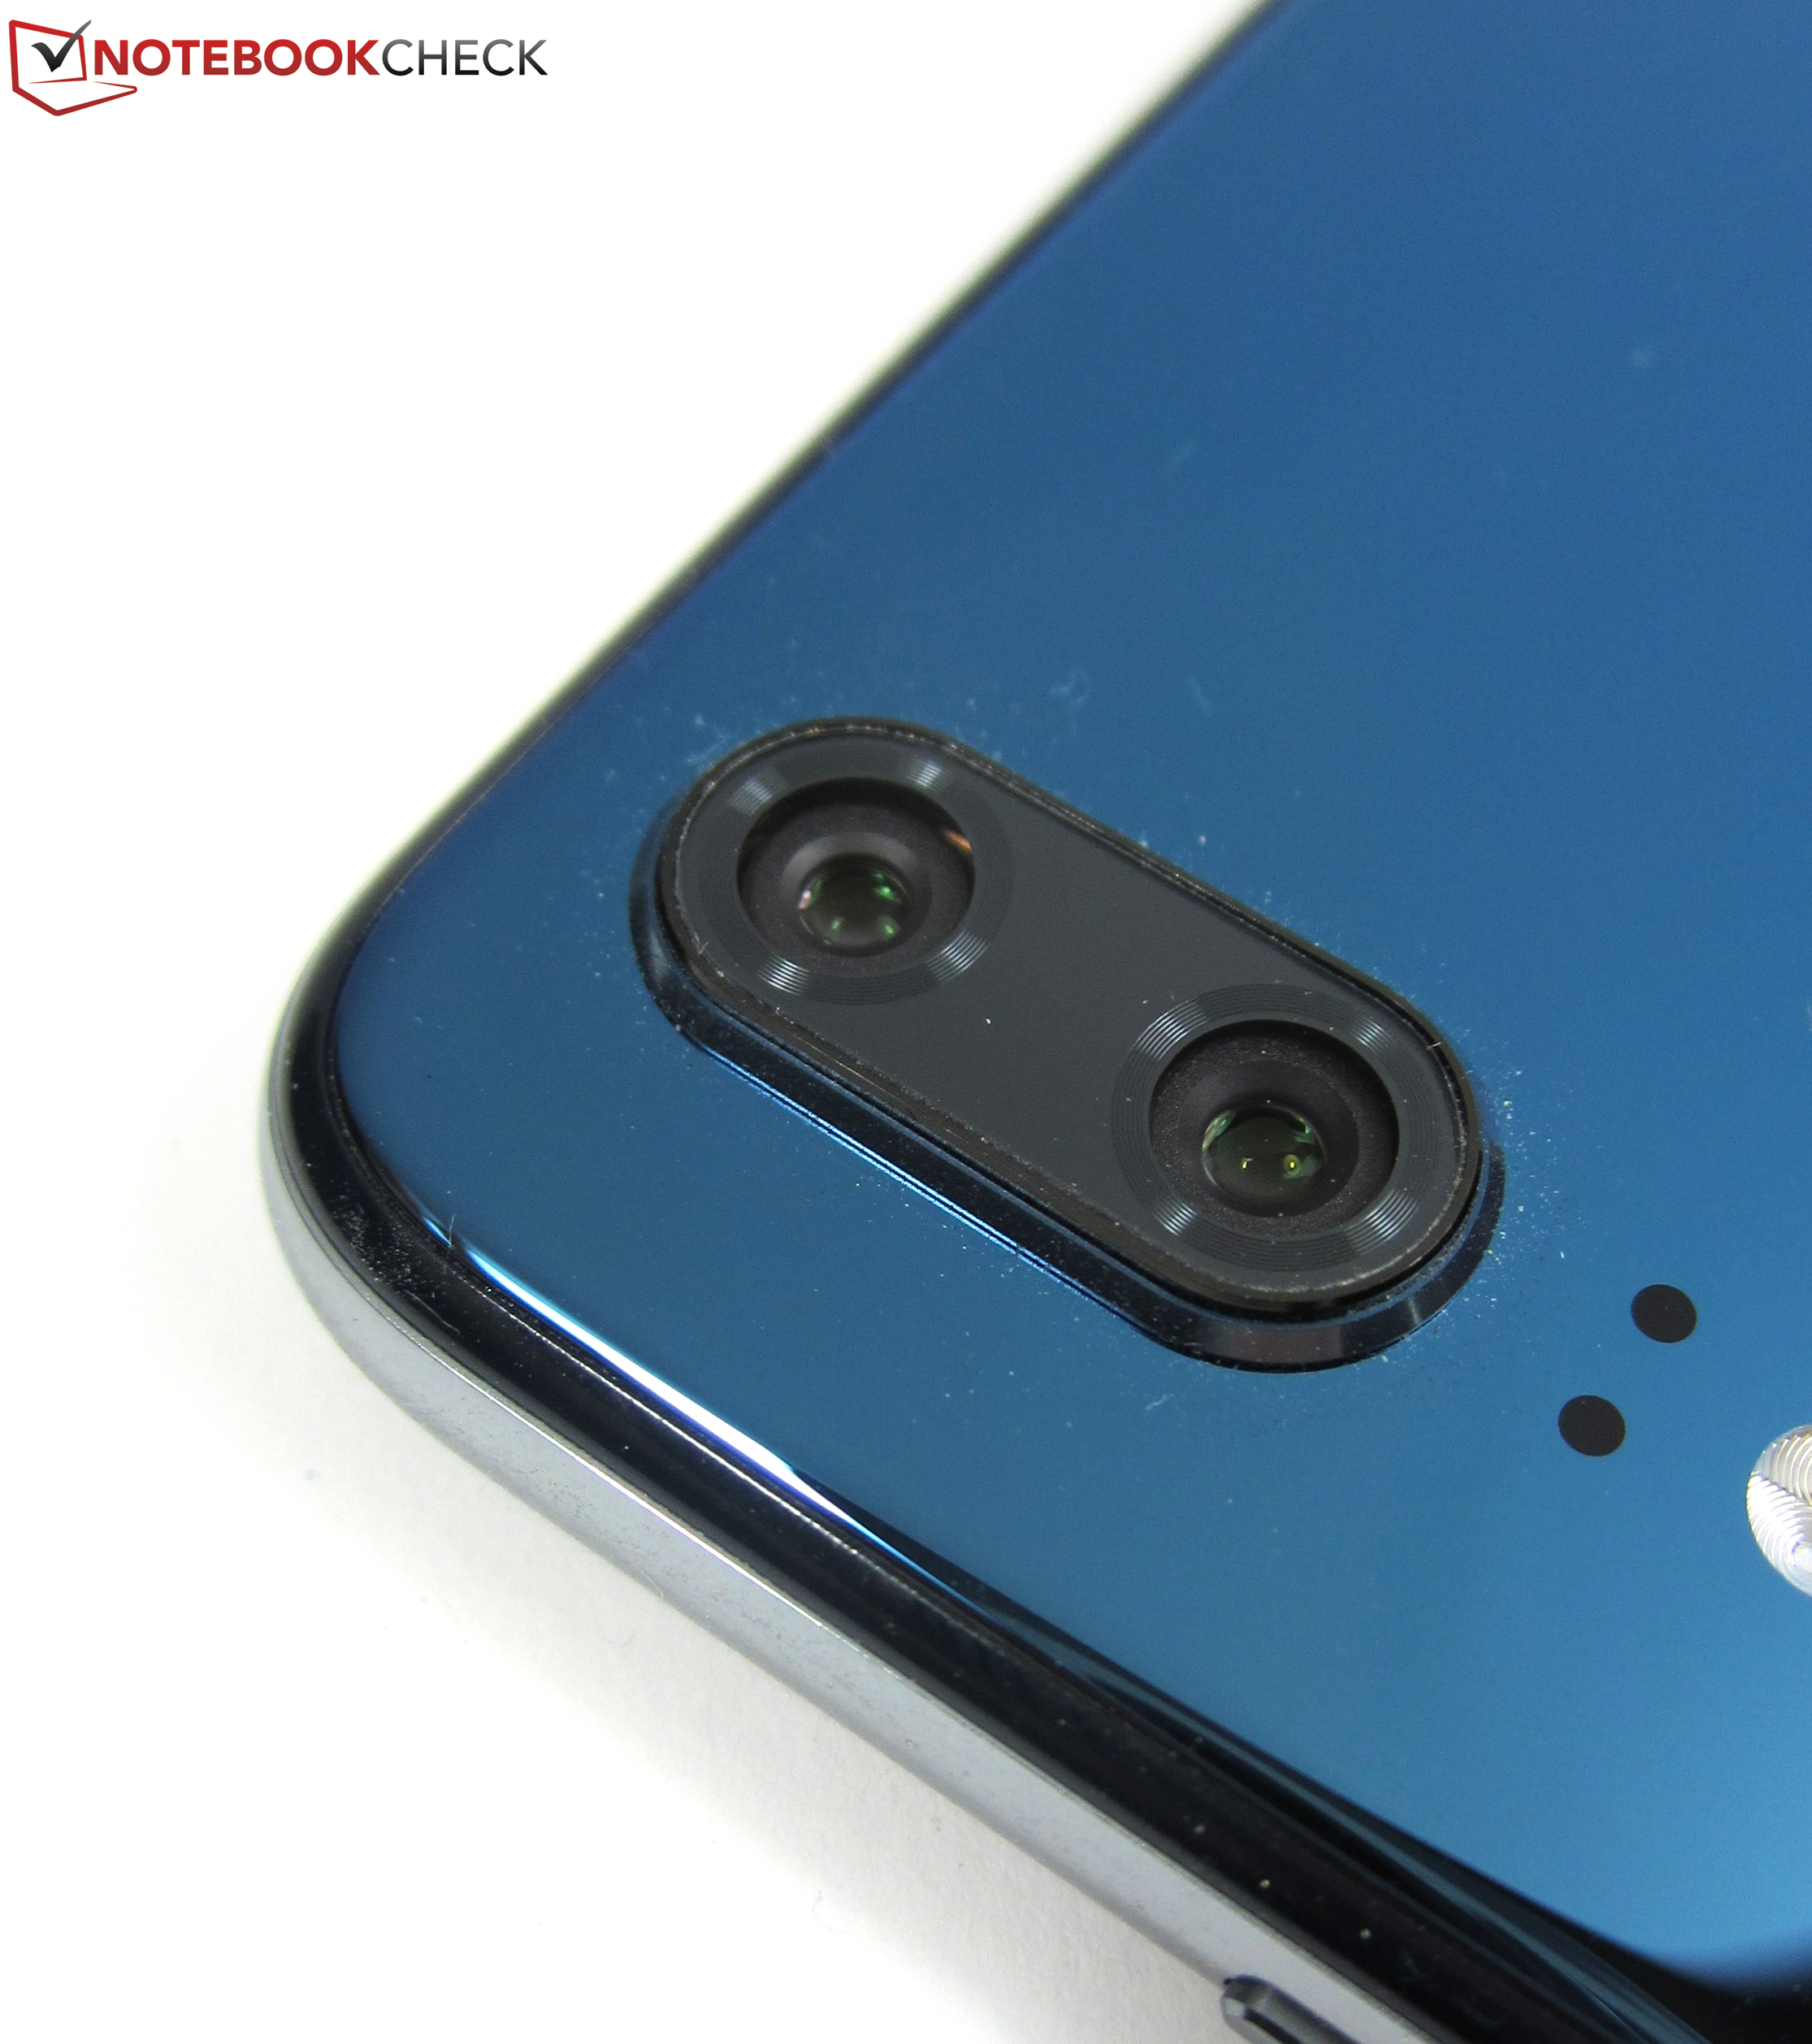
Queremos mencionar uma vantagem específica: Graças à sua câmera dupla Leica, o Huawei P20 tira fotos excelentes sem muito esforço do usuário - basta apontar e disparar, a IA da câmera cuida do resto. O “pequeno” Huawei é definitivamente uma recomendação para os entusiastas da câmera, embora o Huawei P20 Pro ofereça ainda mais recursos com sua câmera tripla Leica. No entanto, o modelo top é cerca de 250 Euros mais caro que o P20 e não é mais rápido, já que ambos os smartphones são equipados com o mesmo SoC Kirin SoC.
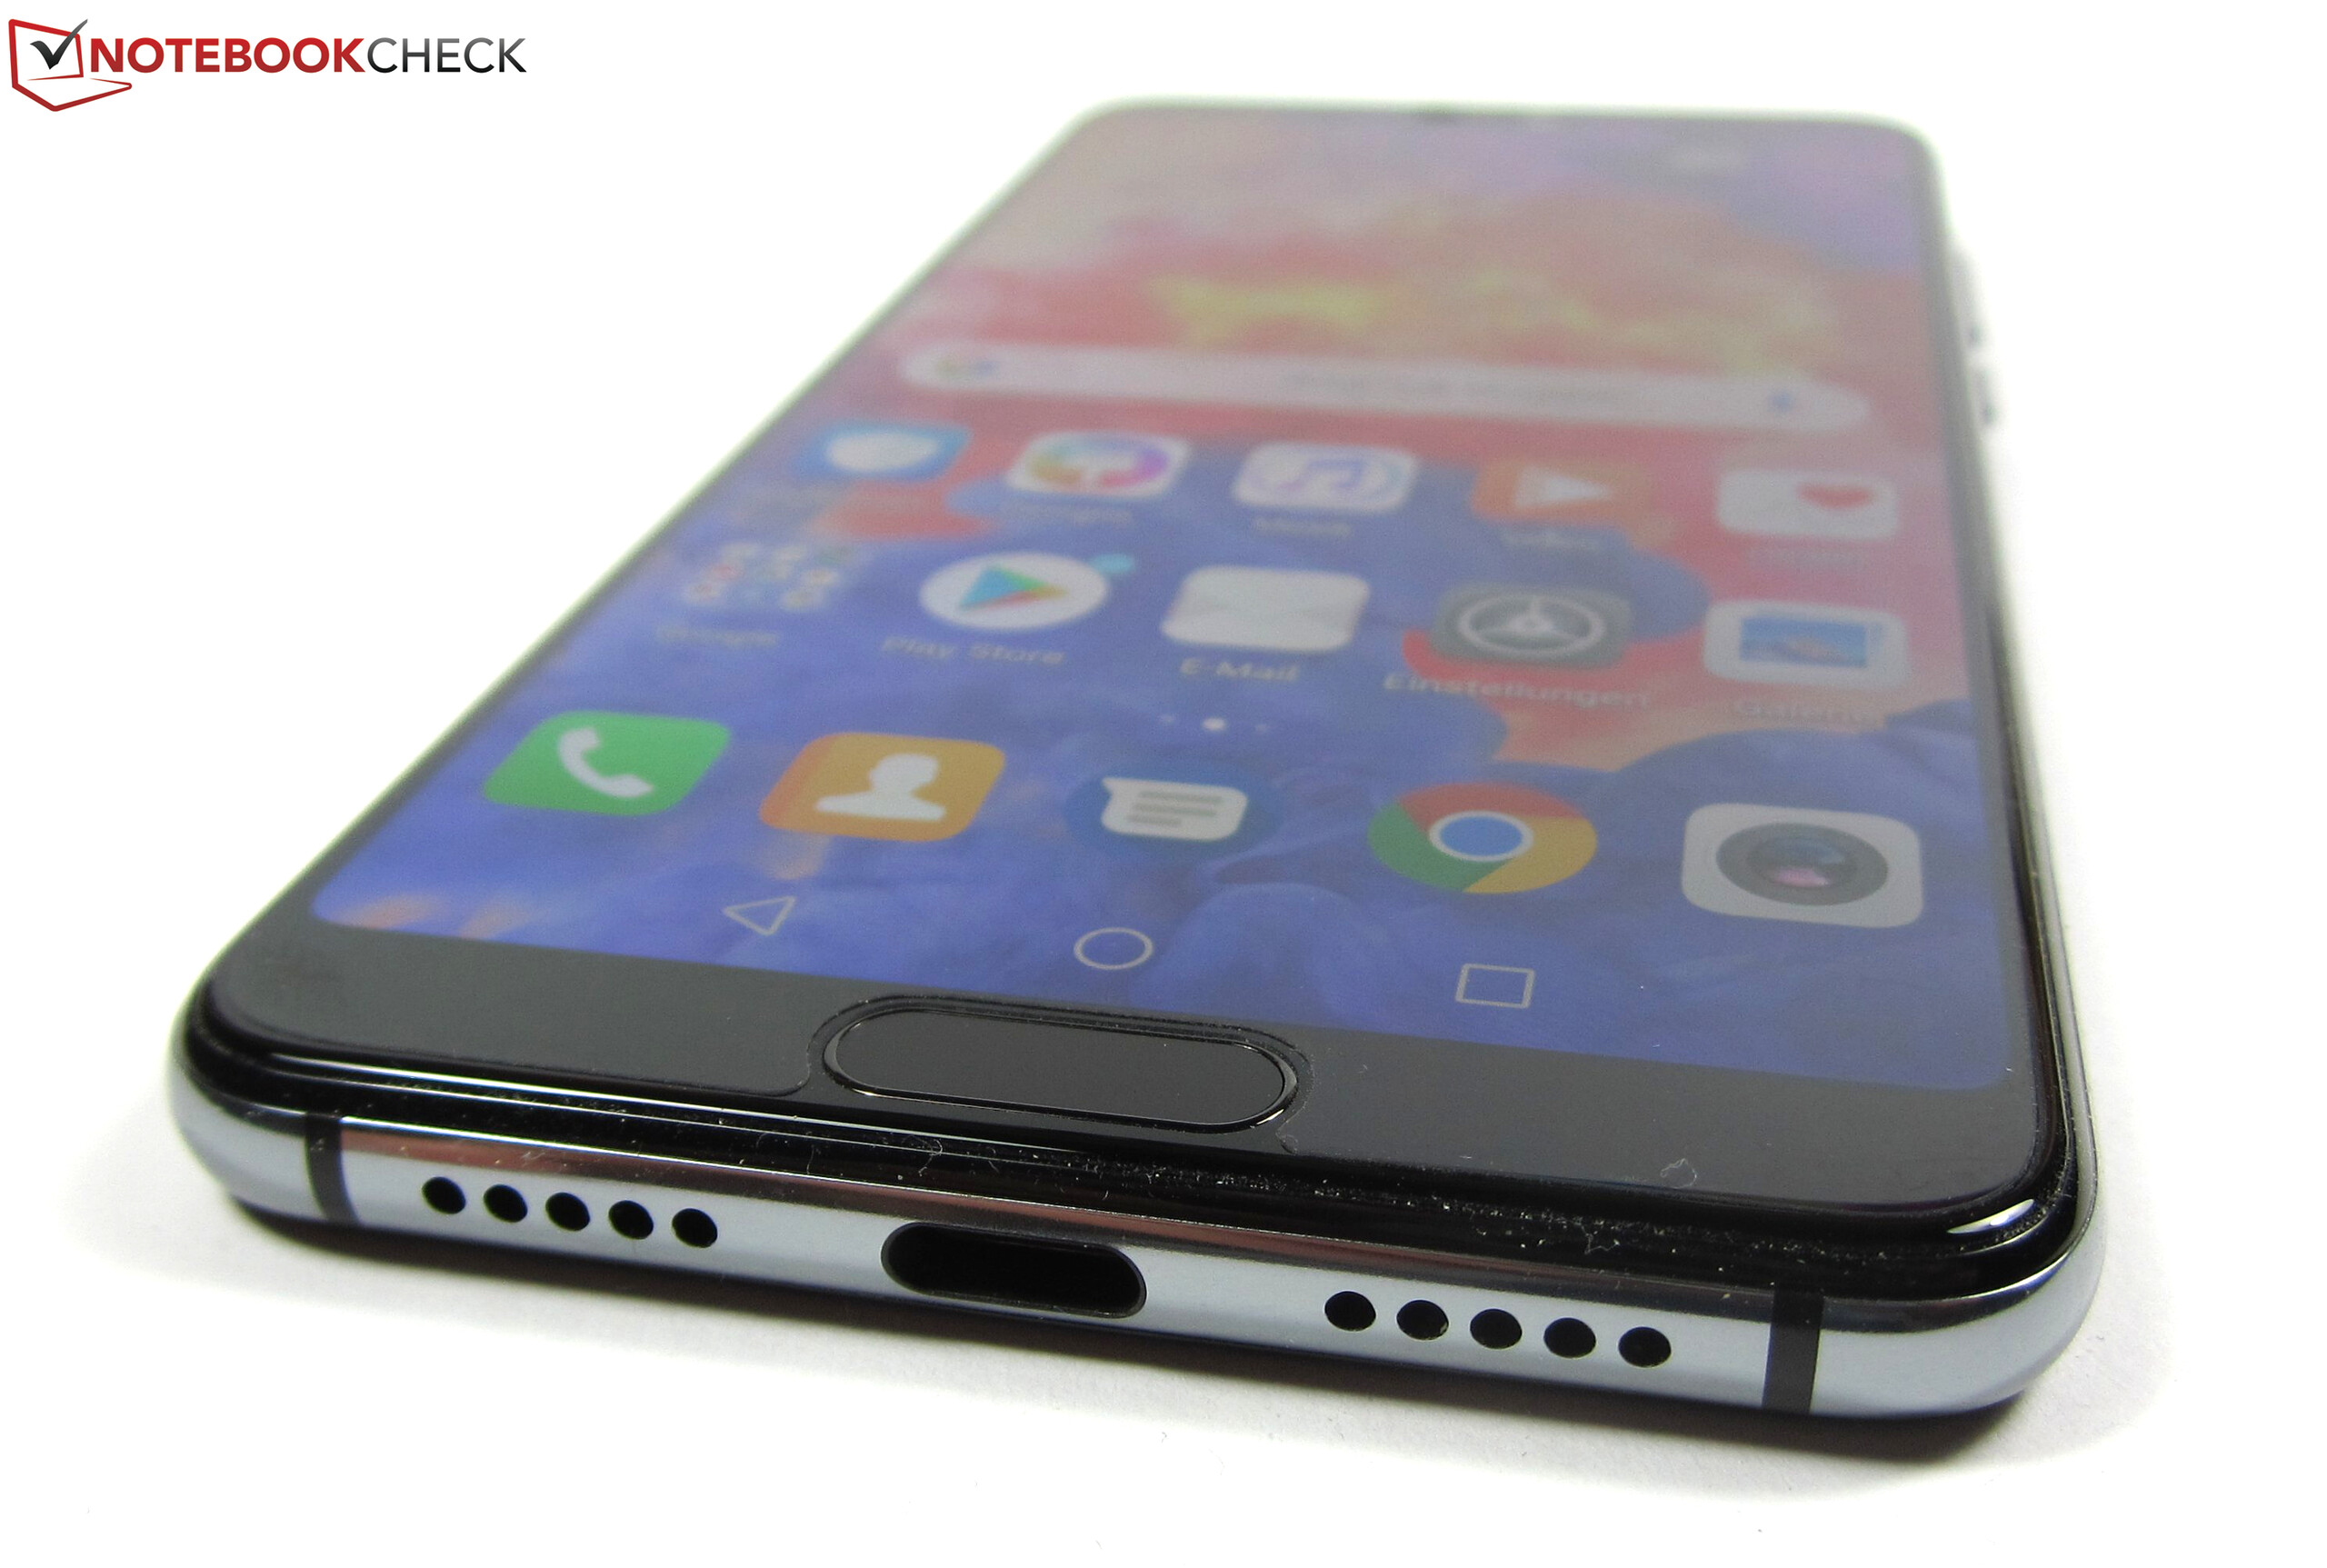
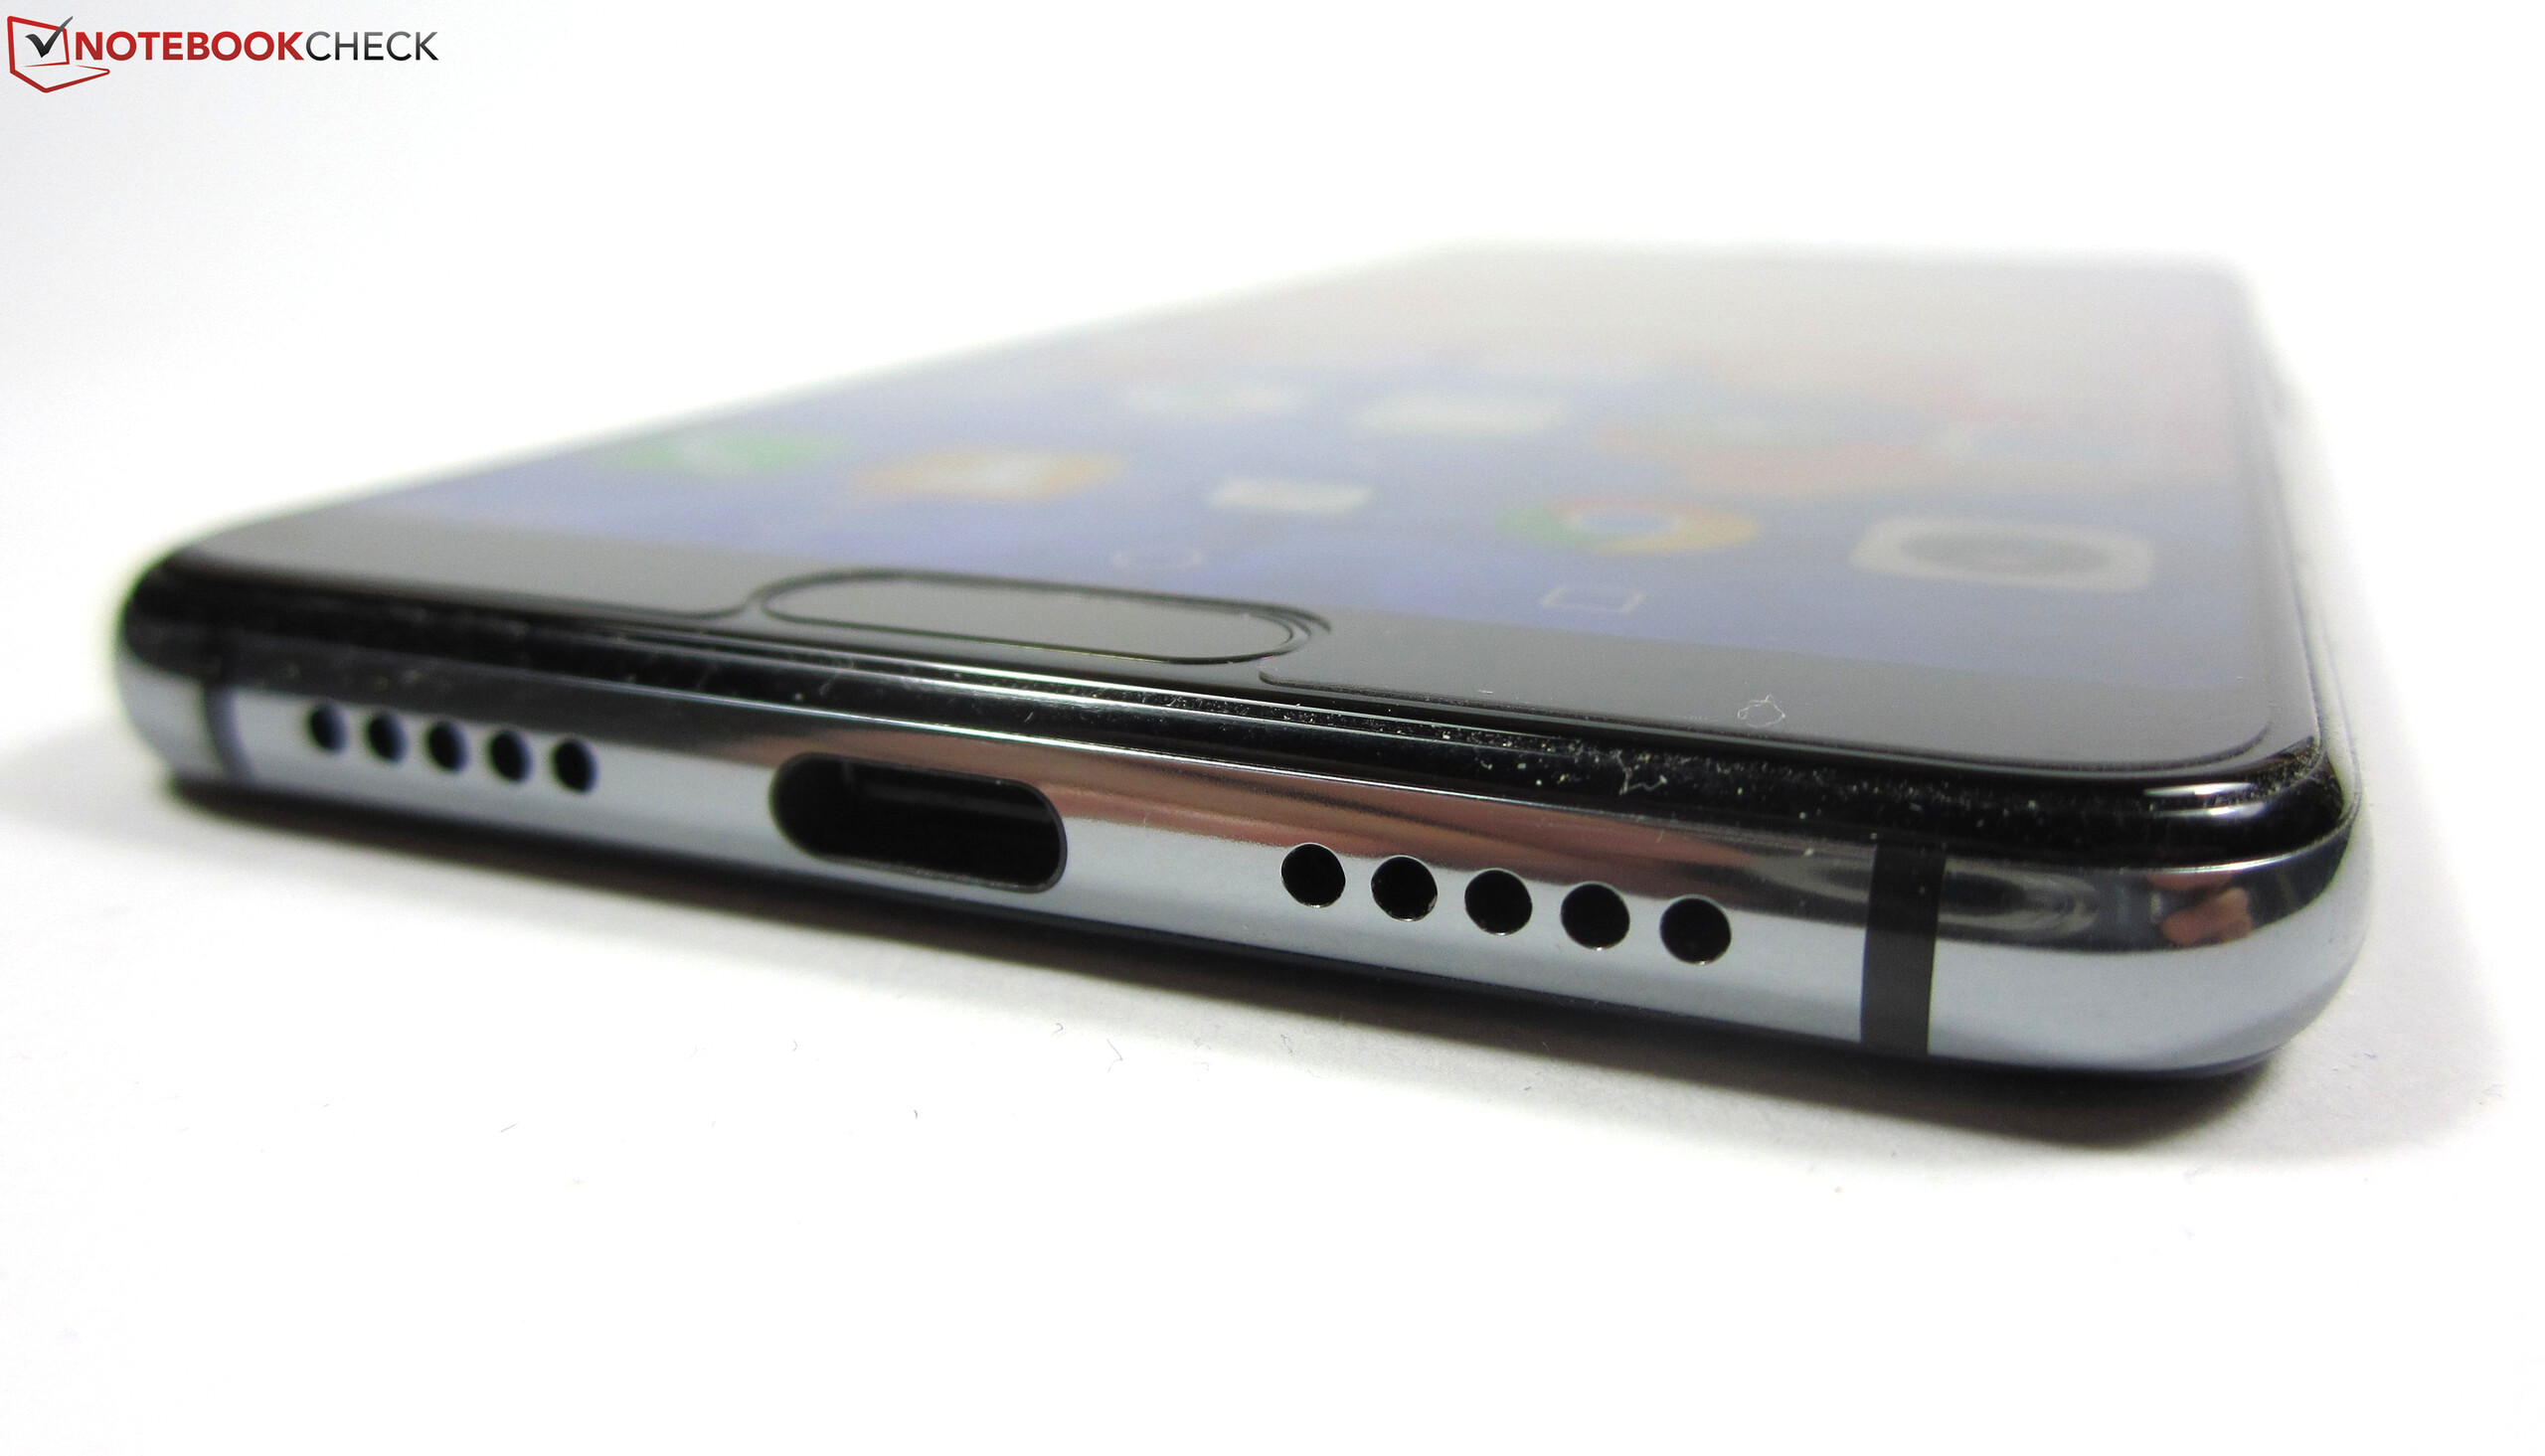
Ainda existem algumas falhas. Perdemos uma certificação IP para o Huawei P20, que está disponível no Huawei P20 Pro (IP67) à prova de água e poeira. Nem todo usuário vai gostar da decisão de remover o slot microSD e o conector de 3,5 mm para fones de ouvido.
Huawei P20
- 05/04/2018 v6 (old)
Manuel Masiero
Price comparison
