Breve Análise do Smartphone Huawei P10
| Networking | |
| iperf3 transmit AX12 | |
| Apple iPhone 7 (Klaus I211) | |
| Huawei P10 | |
| Samsung Galaxy S7 | |
| Huawei P9 | |
| iperf3 receive AX12 | |
| Apple iPhone 7 (Klaus I211) | |
| Huawei P10 | |
| Samsung Galaxy S7 | |
| Huawei P9 | |


| |||||||||||||||||||||||||
iluminação: 86 %
iluminação com acumulador: 547 cd/m²
Contraste: 1272:1 (Preto: 0.43 cd/m²)
ΔE ColorChecker Calman: 4.8 | ∀{0.5-29.43 Ø4.71}
ΔE Greyscale Calman: 4.5 | ∀{0.09-98 Ø4.96}
Gamma: 2.39
CCT: 7194 K
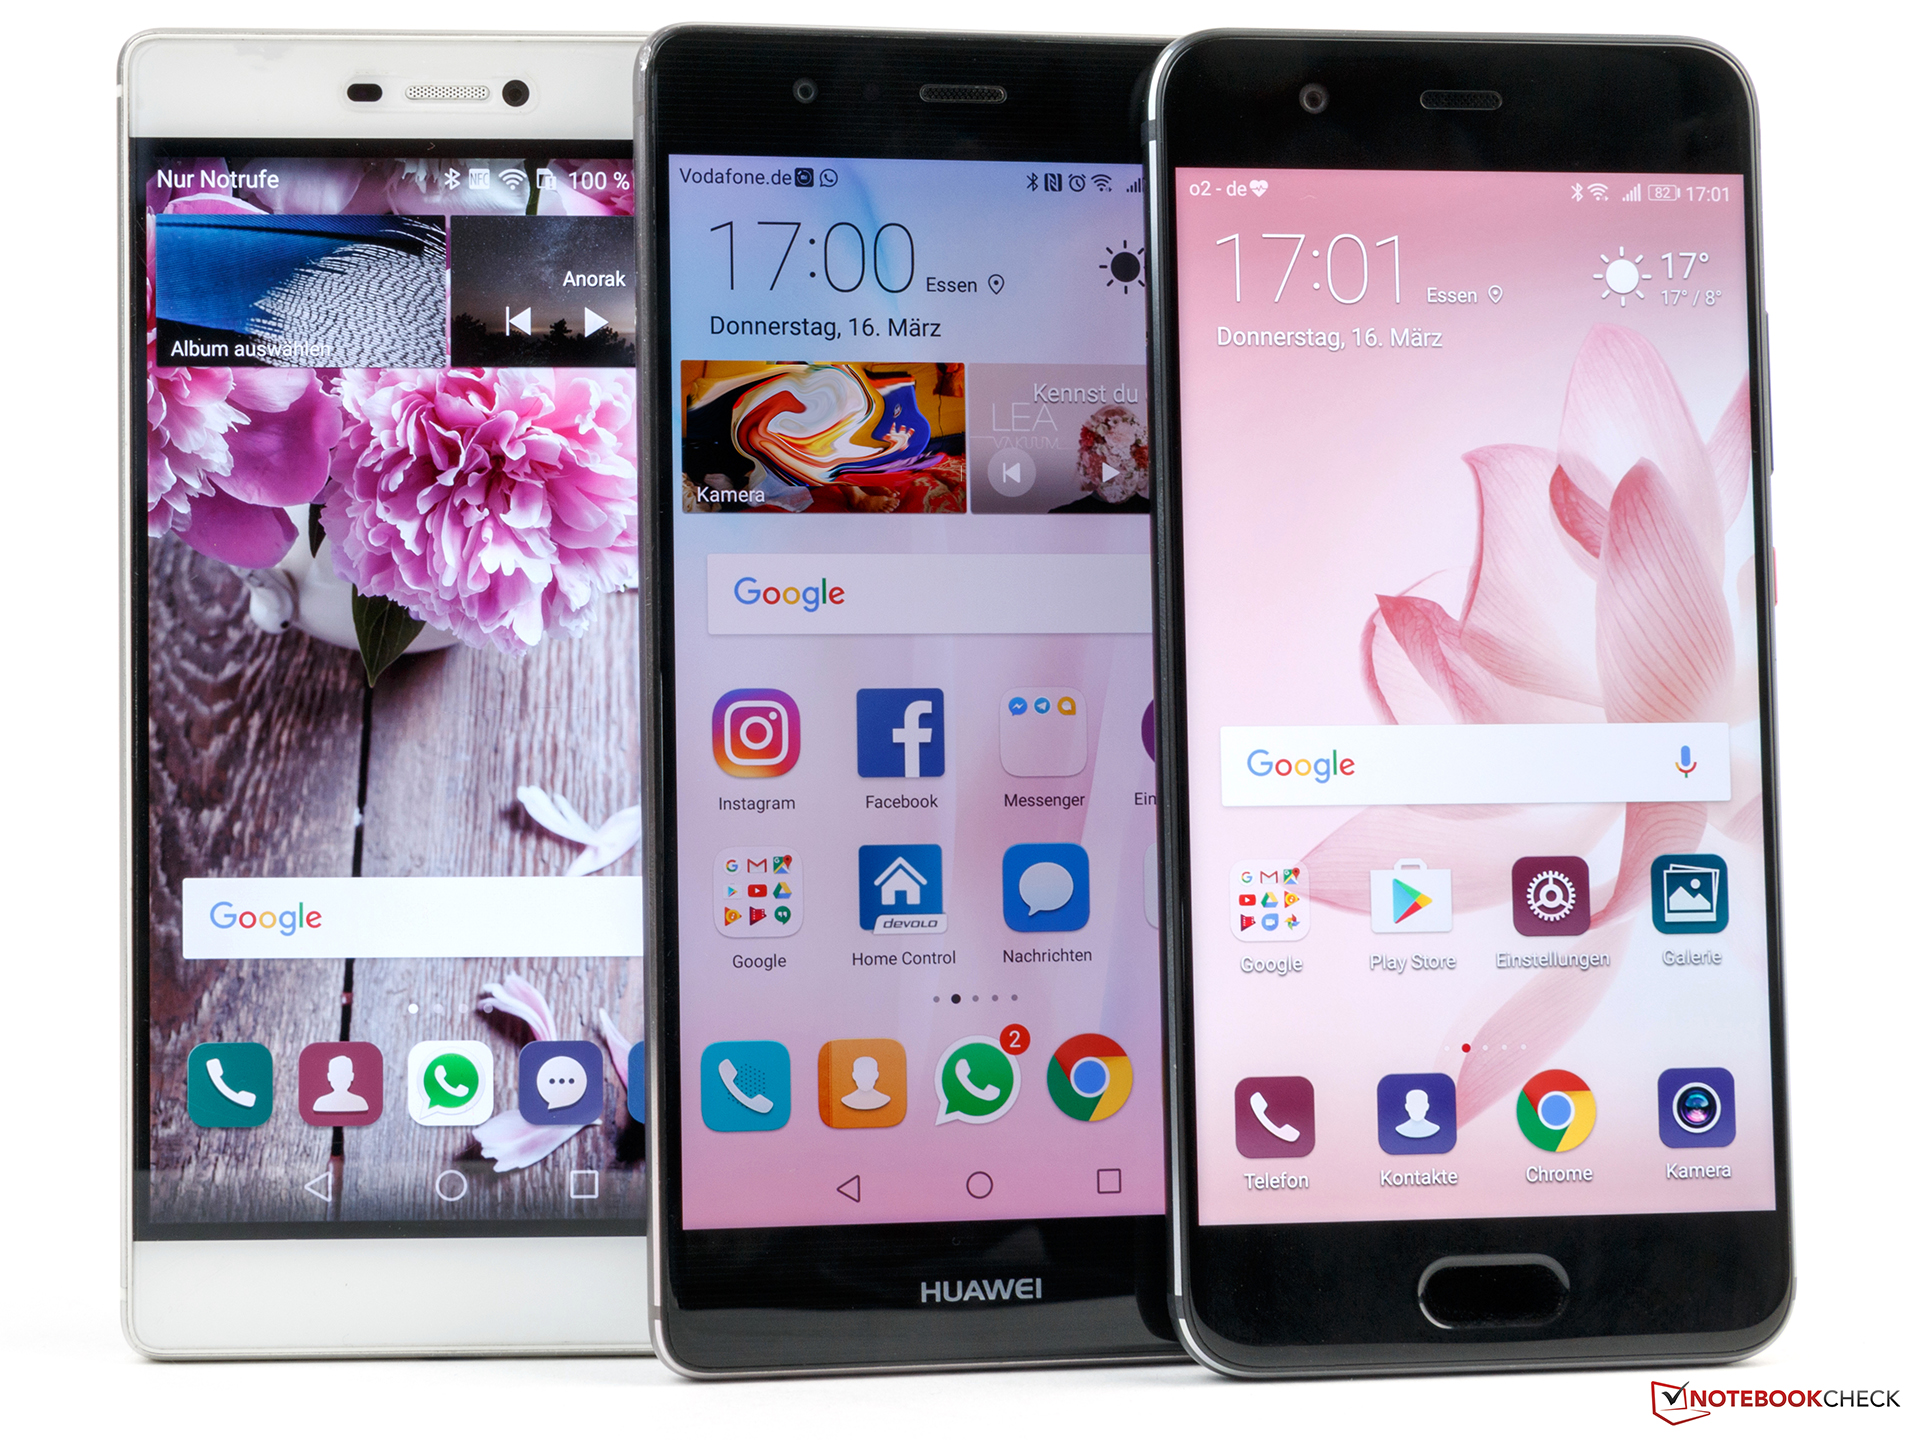
| Huawei P10 LTPS, 1920x1080, 5.1" | Huawei P9 IPS-NEO, JDI, 1920x1080, 5.2" | Huawei P8 IPS-NEO, 1920x1080, 5.2" | Samsung Galaxy S7 SAMOLED, 2560x1440, 5.1" | Apple iPhone 7 IPS, 1334x750, 4.7" | Sony Xperia XZ IPS, 1920x1080, 5.2" | HTC 10 Super LCD 5, 2560x1440, 5.2" | |
|---|---|---|---|---|---|---|---|
| Screen | 8% | 3% | 21% | 31% | -8% | 9% | |
| Brightness middle (cd/m²) | 547 | 582 6% | 453 -17% | 350 -36% | 556 2% | 544 -1% | 445 -19% |
| Brightness (cd/m²) | 556 | 563 1% | 439 -21% | 351 -37% | 519 -7% | 521 -6% | 434 -22% |
| Brightness Distribution (%) | 86 | 91 6% | 91 6% | 98 14% | 90 5% | 93 8% | 93 8% |
| Black Level * (cd/m²) | 0.43 | 0.38 12% | 0.28 35% | 0.34 21% | 0.37 14% | 0.36 16% | |
| Contrast (:1) | 1272 | 1532 20% | 1618 27% | 1635 29% | 1470 16% | 1236 -3% | |
| Colorchecker dE 2000 * | 4.8 | 4.4 8% | 4.7 2% | 2.04 57% | 1.3 73% | 5.8 -21% | 2.8 42% |
| Colorchecker dE 2000 max. * | 8.8 | 7.4 16% | 3.25 63% | 2.6 70% | 9.8 -11% | 5.8 34% | |
| Greyscale dE 2000 * | 4.5 | 4.8 -7% | 5.03 -12% | 1.63 64% | 1.9 58% | 7.2 -60% | 3.7 18% |
| Gamma | 2.39 92% | 2.2 100% | 2.27 97% | 2.07 106% | 2.26 97% | 2.18 101% | 2.31 95% |
| CCT | 7194 90% | 6175 105% | 7439 87% | 6391 102% | 6818 95% | 8619 75% | 7164 91% |
| Color Space (Percent of AdobeRGB 1998) (%) | 77.78 | 72.04 | 86.86 | 63.15 | |||
| Color Space (Percent of sRGB) (%) | 99.44 | 99.35 | 99.71 |
* ... menor é melhor
Cintilação da tela / PWM (modulação por largura de pulso)
| Tela tremeluzindo / PWM não detectado | 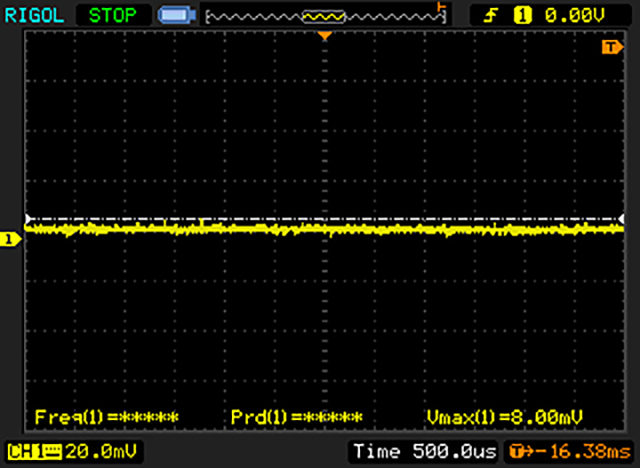 | ||
[pwm_comparison] Em comparação: 52 % de todos os dispositivos testados não usam PWM para escurecer a tela. Se PWM foi detectado, uma média de 7754 (mínimo: 5 - máximo: 343500) Hz foi medida. | |||
Exibir tempos de resposta
| ↔ Tempo de resposta preto para branco | ||
|---|---|---|
| 16 ms ... ascensão ↗ e queda ↘ combinadas | ↗ 5.2 ms ascensão | 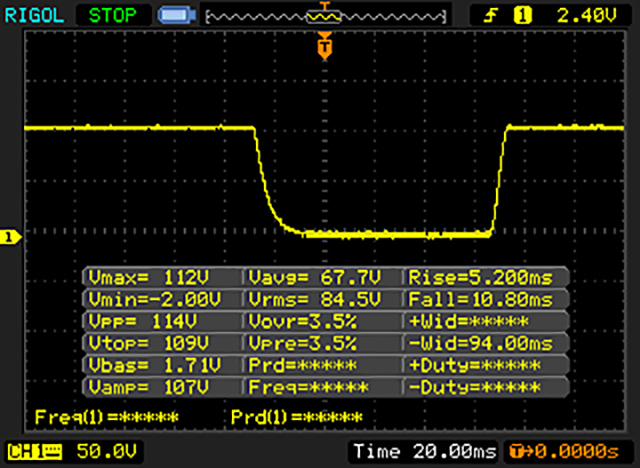 |
| ↘ 10.8 ms queda | ||
| A tela mostra boas taxas de resposta em nossos testes, mas pode ser muito lenta para jogadores competitivos. Em comparação, todos os dispositivos testados variam de 0.1 (mínimo) a 240 (máximo) ms. » 37 % de todos os dispositivos são melhores. Isso significa que o tempo de resposta medido é melhor que a média de todos os dispositivos testados (19.8 ms). | ||
| ↔ Tempo de resposta 50% cinza a 80% cinza | ||
| 39.6 ms ... ascensão ↗ e queda ↘ combinadas | ↗ 19.6 ms ascensão | 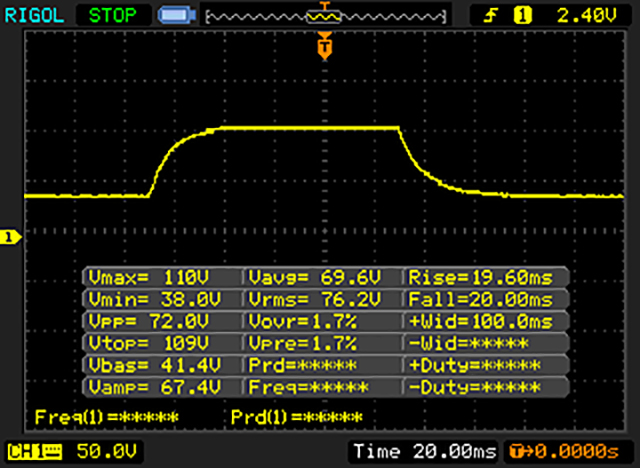 |
| ↘ 20 ms queda | ||
| A tela mostra taxas de resposta lentas em nossos testes e será insatisfatória para os jogadores. Em comparação, todos os dispositivos testados variam de 0.165 (mínimo) a 636 (máximo) ms. » 61 % de todos os dispositivos são melhores. Isso significa que o tempo de resposta medido é pior que a média de todos os dispositivos testados (31 ms). | ||
| AnTuTu v6 - Total Score (classificar por valor) | |
| Huawei P10 | |
| Huawei P9 | |
| Samsung Galaxy S7 Edge | |
| Apple iPhone 7 | |
| Lenovo Moto Z | |
| Sony Xperia XZ | |
| HTC 10 | |
| Huawei Mate 9 | |
| OnePlus 3T | |
| Geekbench 4.0 | |
| 64 Bit Single-Core Score (classificar por valor) | |
| Huawei P10 | |
| Huawei P9 | |
| Samsung Galaxy S7 Edge | |
| Apple iPhone 7 | |
| Lenovo Moto Z | |
| Sony Xperia XZ | |
| Huawei Mate 9 | |
| OnePlus 3T | |
| 64 Bit Multi-Core Score (classificar por valor) | |
| Huawei P10 | |
| Huawei P9 | |
| Samsung Galaxy S7 Edge | |
| Apple iPhone 7 | |
| Lenovo Moto Z | |
| Sony Xperia XZ | |
| Huawei Mate 9 | |
| OnePlus 3T | |
| GFXBench (DX / GLBenchmark) 2.7 | |
| T-Rex Onscreen (classificar por valor) | |
| Huawei P10 | |
| Huawei P9 | |
| Samsung Galaxy S7 Edge | |
| Apple iPhone 7 | |
| Lenovo Moto Z | |
| Sony Xperia XZ | |
| HTC 10 | |
| Huawei Mate 9 | |
| OnePlus 3T | |
| 1920x1080 T-Rex Offscreen (classificar por valor) | |
| Huawei P10 | |
| Huawei P9 | |
| Samsung Galaxy S7 Edge | |
| Apple iPhone 7 | |
| Lenovo Moto Z | |
| Sony Xperia XZ | |
| HTC 10 | |
| Huawei Mate 9 | |
| OnePlus 3T | |
| GFXBench 3.0 | |
| on screen Manhattan Onscreen OGL (classificar por valor) | |
| Huawei P10 | |
| Huawei P9 | |
| Samsung Galaxy S7 Edge | |
| Apple iPhone 7 | |
| Lenovo Moto Z | |
| Sony Xperia XZ | |
| HTC 10 | |
| Huawei Mate 9 | |
| OnePlus 3T | |
| 1920x1080 1080p Manhattan Offscreen (classificar por valor) | |
| Huawei P10 | |
| Huawei P9 | |
| Samsung Galaxy S7 Edge | |
| Apple iPhone 7 | |
| Lenovo Moto Z | |
| Sony Xperia XZ | |
| HTC 10 | |
| Huawei Mate 9 | |
| OnePlus 3T | |
| GFXBench 3.1 | |
| on screen Manhattan ES 3.1 Onscreen (classificar por valor) | |
| Huawei P10 | |
| Huawei P9 | |
| Samsung Galaxy S7 Edge | |
| Apple iPhone 7 | |
| Lenovo Moto Z | |
| Sony Xperia XZ | |
| HTC 10 | |
| Huawei Mate 9 | |
| OnePlus 3T | |
| 1920x1080 Manhattan ES 3.1 Offscreen (classificar por valor) | |
| Huawei P10 | |
| Huawei P9 | |
| Samsung Galaxy S7 Edge | |
| Apple iPhone 7 | |
| Lenovo Moto Z | |
| Sony Xperia XZ | |
| HTC 10 | |
| Huawei Mate 9 | |
| OnePlus 3T | |
| PCMark for Android | |
| Work performance score (classificar por valor) | |
| Huawei P10 | |
| Huawei P9 | |
| Samsung Galaxy S7 Edge | |
| Lenovo Moto Z | |
| Sony Xperia XZ | |
| HTC 10 | |
| Huawei Mate 9 | |
| OnePlus 3T | |
| Work 2.0 performance score (classificar por valor) | |
| Huawei P10 | |
| Huawei P9 | |
| Sony Xperia XZ | |
| HTC 10 | |
| Huawei Mate 9 | |
| Lightmark - 1920x1080 1080p (classificar por valor) | |
| Huawei P10 | |
| Huawei P9 | |
| Samsung Galaxy S7 Edge | |
| Lenovo Moto Z | |
| Huawei Mate 9 | |
| Basemark ES 3.1 / Metal - offscreen Overall Score (classificar por valor) | |
| Huawei P10 | |
| Huawei P9 | |
| Samsung Galaxy S7 Edge | |
| Apple iPhone 7 | |
| Apple iPhone 7 | |
| Lenovo Moto Z | |
| HTC 10 | |
| Huawei Mate 9 | |
| Epic Citadel - Ultra High Quality (classificar por valor) | |
| Huawei P10 | |
| Huawei P9 | |
| Samsung Galaxy S7 Edge | |
| Lenovo Moto Z | |
| Huawei Mate 9 | |
| WebXPRT 2015 - Overall (classificar por valor) | |
| Huawei P10 | |
| Huawei P9 | |
| Samsung Galaxy S7 Edge | |
| Apple iPhone 7 | |
| Lenovo Moto Z | |
| Sony Xperia XZ | |
| HTC 10 | |
| Huawei Mate 9 | |
| OnePlus 3T | |
| BaseMark OS II - Web (classificar por valor) | |
| Huawei P10 | |
| Huawei P9 | |
| Samsung Galaxy S7 Edge | |
| Apple iPhone 7 | |
| Lenovo Moto Z | |
| Sony Xperia XZ | |
| HTC 10 | |
| Huawei Mate 9 | |
| OnePlus 3T | |
| Octane V2 - Total Score (classificar por valor) | |
| Huawei P10 | |
| Huawei P9 | |
| Samsung Galaxy S7 Edge | |
| Apple iPhone 7 | |
| Lenovo Moto Z | |
| Sony Xperia XZ | |
| HTC 10 | |
| Huawei Mate 9 | |
| OnePlus 3T | |
| Mozilla Kraken 1.1 - Total (classificar por valor) | |
| Huawei P10 | |
| Huawei P9 | |
| Samsung Galaxy S7 Edge | |
| Apple iPhone 7 | |
| Lenovo Moto Z | |
| Sony Xperia XZ | |
| HTC 10 | |
| Huawei Mate 9 | |
| OnePlus 3T | |
| JetStream 1.1 - 1.1 Total (classificar por valor) | |
| Huawei P10 | |
| Huawei P9 | |
| Samsung Galaxy S7 Edge | |
| Apple iPhone 7 | |
| Lenovo Moto Z | |
| Sony Xperia XZ | |
| HTC 10 | |
| Huawei Mate 9 | |
| OnePlus 3T | |
| Vellamo 3.x - Browser (classificar por valor) | |
| Huawei P10 | |
| Huawei P9 | |
| Samsung Galaxy S7 Edge | |
| Lenovo Moto Z | |
| Huawei Mate 9 | |
* ... menor é melhor
| Huawei P10 | Huawei P9 | Lenovo Moto Z | Sony Xperia XZ | HTC 10 | Samsung Galaxy S7 | LG G5 | ZTE Axon 7 | |
|---|---|---|---|---|---|---|---|---|
| AndroBench 3-5 | -49% | -8% | -48% | -20% | -16% | -20% | -13% | |
| Sequential Read 256KB (MB/s) | 738 | 281.3 -62% | 439.7 -40% | 281 -62% | 275.1 -63% | 483.8 -34% | 427.6 -42% | 406.5 -45% |
| Sequential Write 256KB (MB/s) | 189.8 | 72.2 -62% | 168.3 -11% | 138 -27% | 115.6 -39% | 145.7 -23% | 141.3 -26% | 150.9 -20% |
| Random Read 4KB (MB/s) | 168.4 | 39 -77% | 117.2 -30% | 71.5 -58% | 29.92 -82% | 85.9 -49% | 89.3 -47% | 121.1 -28% |
| Random Write 4KB (MB/s) | 152.3 | 47.45 -69% | 74.9 -51% | 10.5 -93% | 15.89 -90% | 16.01 -89% | 16.22 -89% | 16.22 -89% |
| Sequential Read 256KB SDCard (MB/s) | 54.2 | 55 1% | 78.5 45% | 33.5 -38% | 83.3 54% | 72.3 33% | 78.5 45% | 78.4 45% |
| Sequential Write 256KB SDCard (MB/s) | 32.19 | 24.83 -23% | 45.64 42% | 29.8 -7% | 65.4 103% | 53.6 67% | 45.53 41% | 51.3 59% |
(±) A temperatura máxima no lado superior é 44.6 °C / 112 F, em comparação com a média de 35.3 °C / 96 F , variando de 21.9 a 247 °C para a classe Smartphone.
(±) A parte inferior aquece até um máximo de 40.9 °C / 106 F, em comparação com a média de 34 °C / 93 F
(±) Em uso inativo, a temperatura média para o lado superior é 32.1 °C / 90 F, em comparação com a média do dispositivo de 33 °C / ### class_avg_f### F.
Huawei P10 análise de áudio
(+) | os alto-falantes podem tocar relativamente alto (###valor### dB)
Graves 100 - 315Hz
(-) | quase nenhum baixo - em média 20.9% menor que a mediana
(±) | a linearidade dos graves é média (12.6% delta para a frequência anterior)
Médios 400 - 2.000 Hz
(+) | médios equilibrados - apenas 4.2% longe da mediana
(+) | médios são lineares (6% delta para frequência anterior)
Altos 2 - 16 kHz
(±) | máximos mais altos - em média 5.4% maior que a mediana
(+) | os máximos são lineares (4.9% delta da frequência anterior)
Geral 100 - 16.000 Hz
(±) | a linearidade do som geral é média (23.6% diferença em relação à mediana)
Comparado com a mesma classe
» 54% de todos os dispositivos testados nesta classe foram melhores, 8% semelhantes, 38% piores
» O melhor teve um delta de 11%, a média foi 34%, o pior foi 134%
Comparado com todos os dispositivos testados
» 71% de todos os dispositivos testados foram melhores, 6% semelhantes, 23% piores
» O melhor teve um delta de 4%, a média foi 23%, o pior foi 134%
Apple iPhone 7 análise de áudio
(+) | os alto-falantes podem tocar relativamente alto (###valor### dB)
Graves 100 - 315Hz
(-) | quase nenhum baixo - em média 21.8% menor que a mediana
(±) | a linearidade dos graves é média (9.5% delta para a frequência anterior)
Médios 400 - 2.000 Hz
(+) | médios equilibrados - apenas 4.3% longe da mediana
(+) | médios são lineares (6% delta para frequência anterior)
Altos 2 - 16 kHz
(±) | máximos mais altos - em média 5.9% maior que a mediana
(±) | a linearidade dos máximos é média (8.2% delta para frequência anterior)
Geral 100 - 16.000 Hz
(±) | a linearidade do som geral é média (20.9% diferença em relação à mediana)
Comparado com a mesma classe
» 39% de todos os dispositivos testados nesta classe foram melhores, 8% semelhantes, 53% piores
» O melhor teve um delta de 11%, a média foi 34%, o pior foi 134%
Comparado com todos os dispositivos testados
» 57% de todos os dispositivos testados foram melhores, 8% semelhantes, 35% piores
» O melhor teve um delta de 4%, a média foi 23%, o pior foi 134%
Samsung Galaxy S7 Edge análise de áudio
(+) | os alto-falantes podem tocar relativamente alto (###valor### dB)
Graves 100 - 315Hz
(-) | quase nenhum baixo - em média 27.4% menor que a mediana
(±) | a linearidade dos graves é média (8.7% delta para a frequência anterior)
Médios 400 - 2.000 Hz
(+) | médios equilibrados - apenas 4.4% longe da mediana
(+) | médios são lineares (4.7% delta para frequência anterior)
Altos 2 - 16 kHz
(±) | máximos mais altos - em média 5.8% maior que a mediana
(+) | os máximos são lineares (6.2% delta da frequência anterior)
Geral 100 - 16.000 Hz
(±) | a linearidade do som geral é média (20.6% diferença em relação à mediana)
Comparado com a mesma classe
» 36% de todos os dispositivos testados nesta classe foram melhores, 9% semelhantes, 55% piores
» O melhor teve um delta de 11%, a média foi 34%, o pior foi 134%
Comparado com todos os dispositivos testados
» 55% de todos os dispositivos testados foram melhores, 8% semelhantes, 37% piores
» O melhor teve um delta de 4%, a média foi 23%, o pior foi 134%
| desligado | |
| Ocioso | |
| Carga |
|
Key:
min: | |
| Huawei P10 3200 mAh | Huawei P9 3000 mAh | HTC 10 3000 mAh | Samsung Galaxy S7 3000 mAh | Apple iPhone 7 1960 mAh | Lenovo ZUK Z2 3500 mAh | Xiaomi Mi 5s 3200 mAh | |
|---|---|---|---|---|---|---|---|
| Power Consumption | 16% | 8% | 34% | 36% | -1% | 20% | |
| Idle Minimum * (Watt) | 0.83 | 0.77 7% | 0.68 18% | 0.68 18% | 0.54 35% | 1.31 -58% | 0.4 52% |
| Idle Average * (Watt) | 2.1 | 2.36 -12% | 1.49 29% | 1.02 51% | 1.51 28% | 2.03 3% | 1.7 19% |
| Idle Maximum * (Watt) | 2.18 | 2.37 -9% | 1.91 12% | 1.14 48% | 1.54 29% | 2.08 5% | 1.81 17% |
| Load Average * (Watt) | 6.57 | 3.09 53% | 7.4 -13% | 4.73 28% | 3.75 43% | 5.45 17% | 5.84 11% |
| Load Maximum * (Watt) | 9.32 | 5.35 43% | 9.71 -4% | 7.16 23% | 5.01 46% | 6.75 28% | 9.12 2% |
* ... menor é melhor
| Huawei P10 3200 mAh | Huawei P9 3000 mAh | Samsung Galaxy S7 3000 mAh | Apple iPhone 7 1960 mAh | HTC 10 3000 mAh | Lenovo ZUK Z2 3500 mAh | Lenovo Moto Z 2600 mAh | |
|---|---|---|---|---|---|---|---|
| Duração da bateria | -7% | 14% | -9% | -12% | -43% | 10% | |
| Reader / Idle (h) | 25.7 | 25.2 -2% | 30.2 18% | 29.5 15% | 21.2 -18% | 22.9 -11% | |
| H.264 (h) | 9.7 | 9.5 -2% | 14.9 54% | 12 24% | 10.8 11% | 12.1 25% | |
| WiFi v1.3 (h) | 16.1 | 9.5 -41% | 7.6 -53% | 8.6 -47% | 6.9 -57% | 9.1 -43% | 6.8 -58% |
| Load (h) | 2.9 | 3.4 17% | 4 38% | 2.1 -28% | 3.4 17% | 5.3 83% |
Pro
Contra
A Huawei mais uma vez apresenta um excelente produto que não recebe muitas críticas com o seu smartphone P10 lifestyle. O atual produto de gama alta na linha é a edição P10 Plus . No entanto, o modelo menor também oferece alguns recursos de primeira categoria, como o armazenamento UFS 2.1, LTE Cat.12, e o incrivelmente veloz SoC Kirin 960 que a concorrência somente oferece em produtos consideravelmente mais caros.
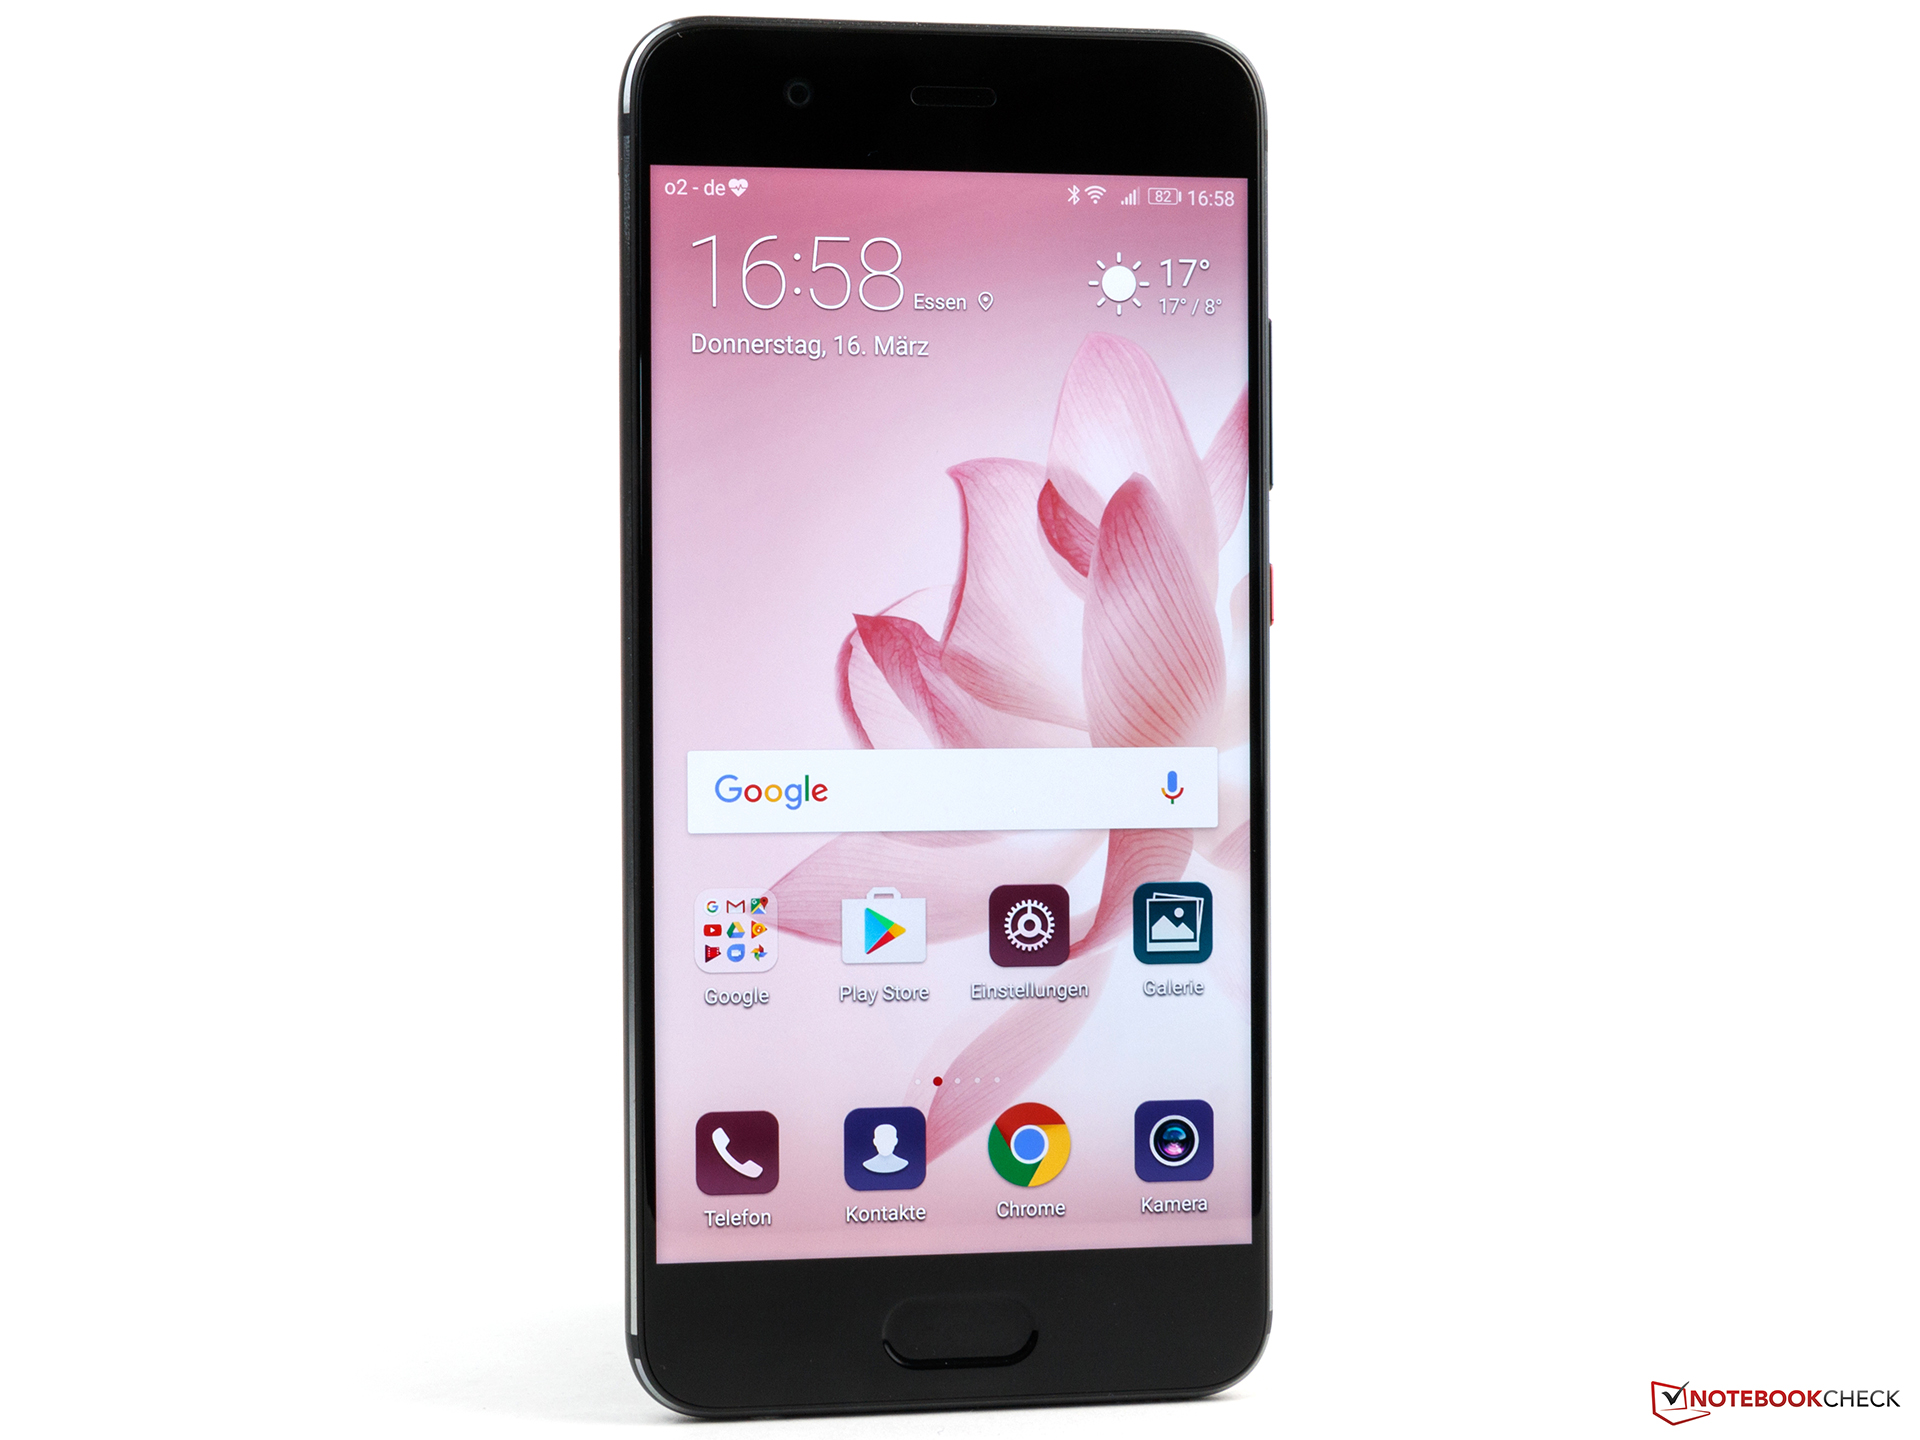
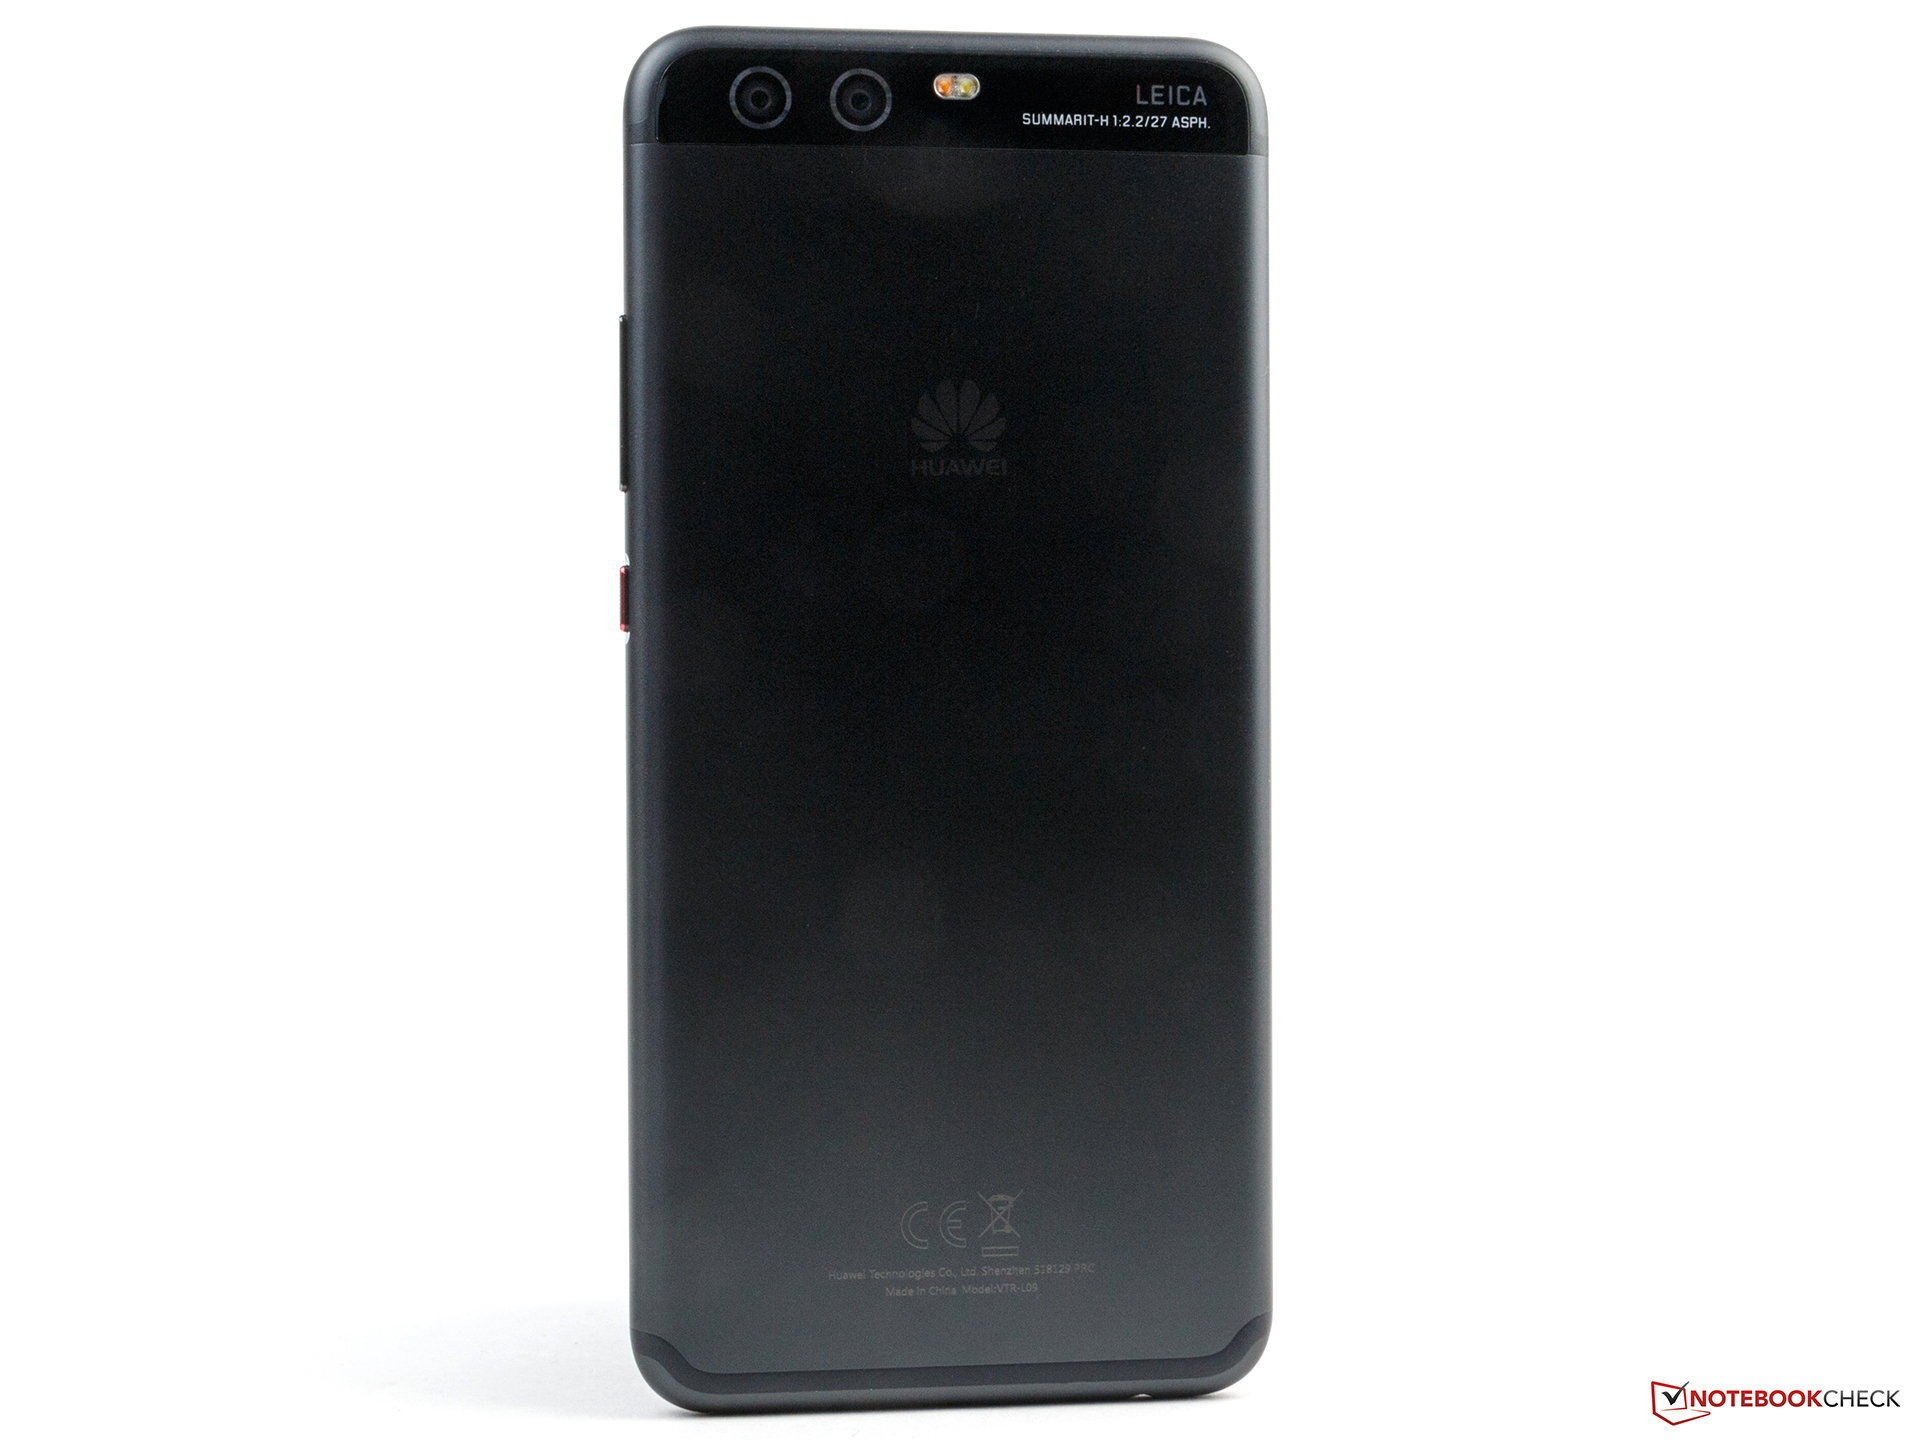
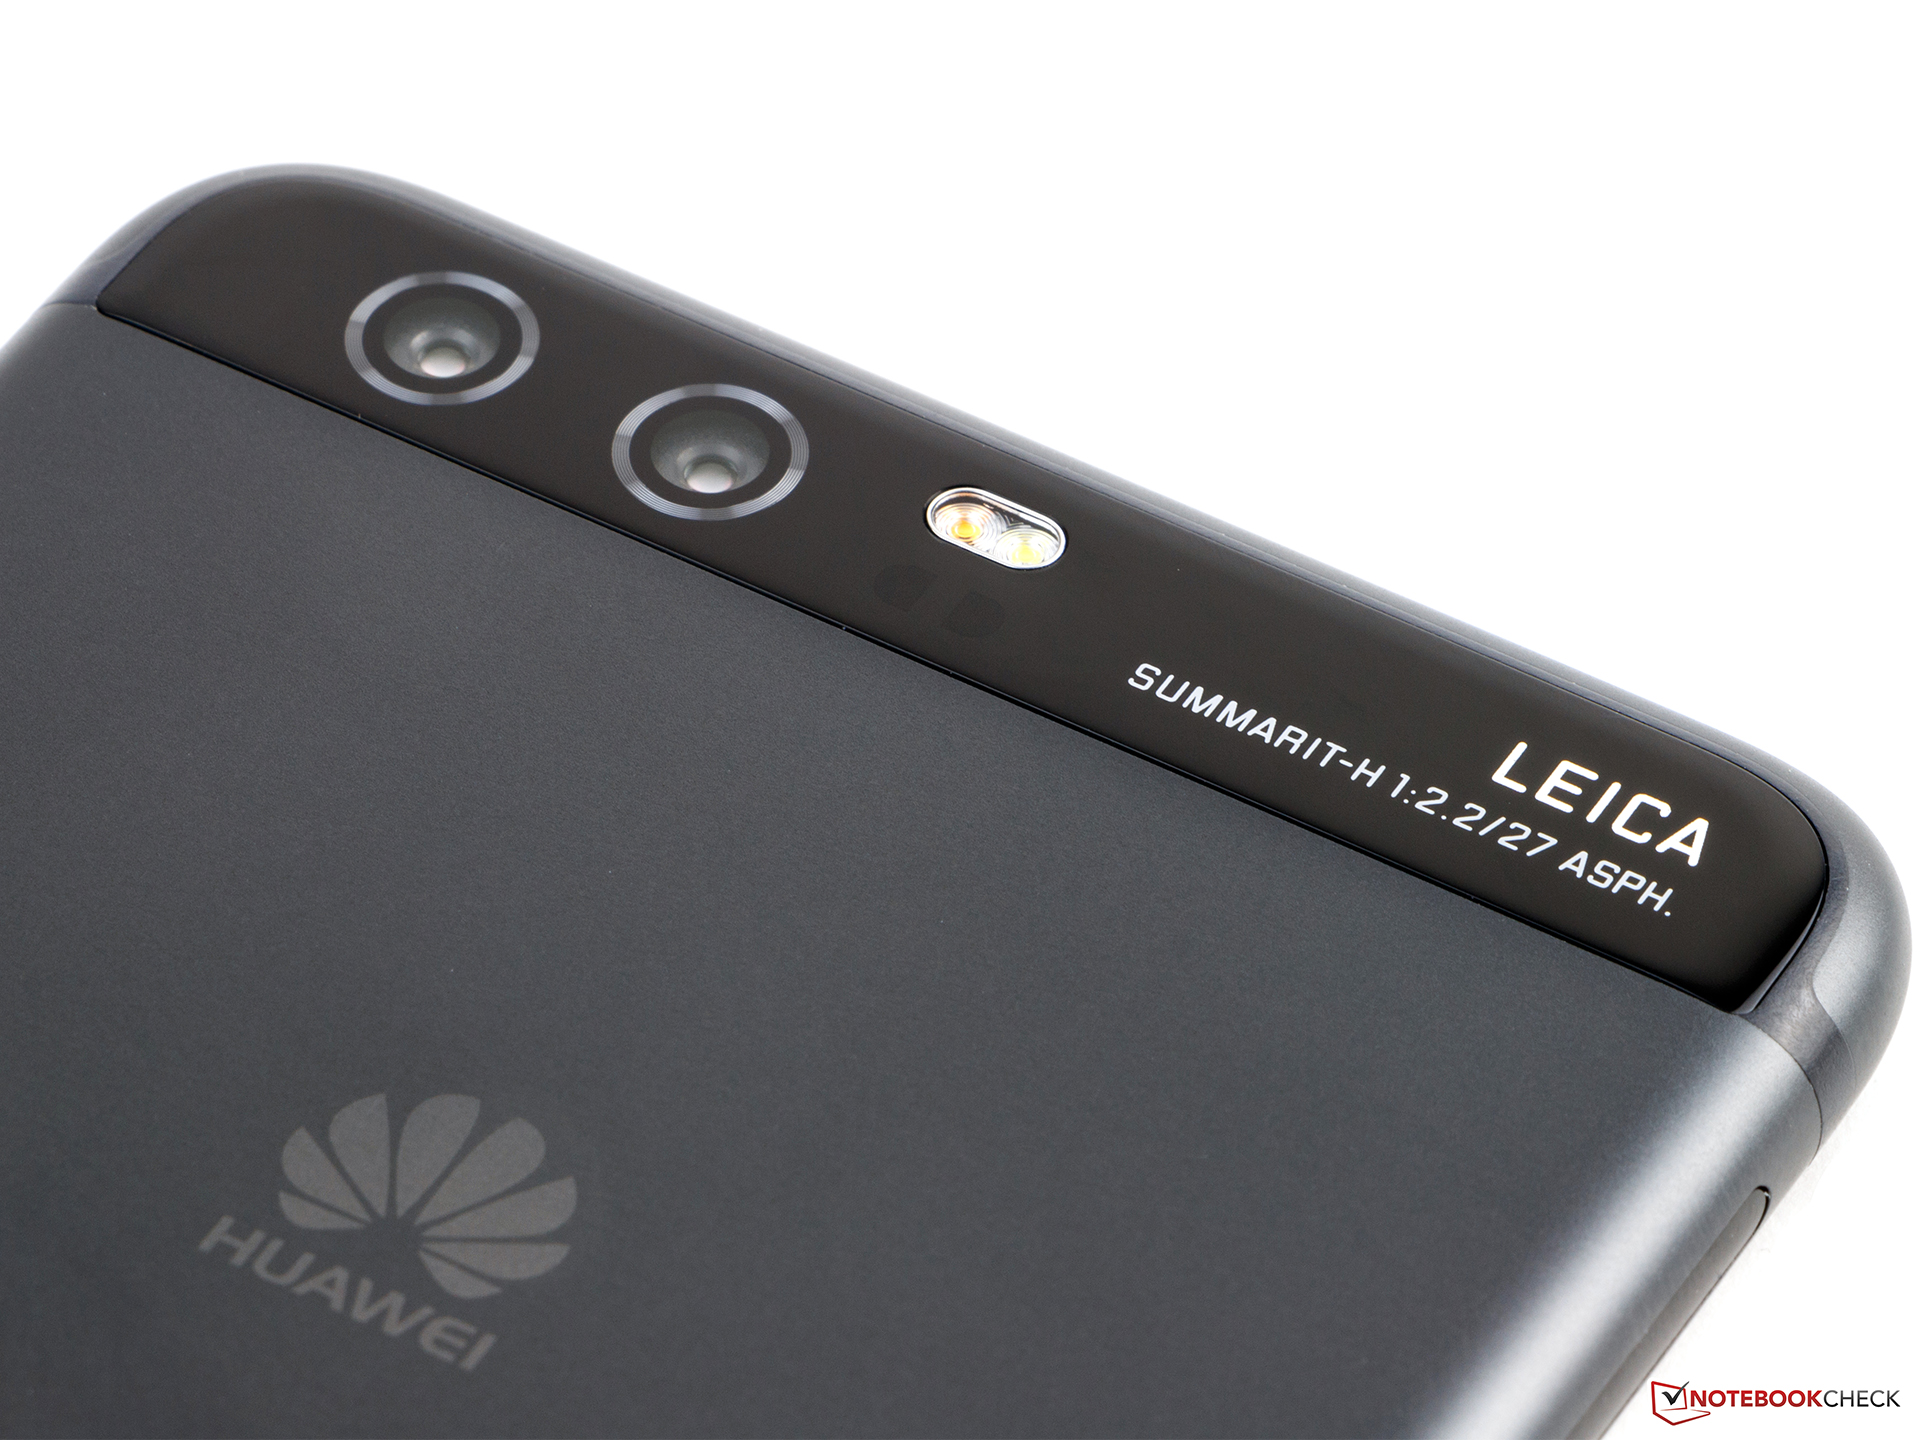
Mais uma vez, gostamos da dual-camera Leica. Embora tenha mais espaço para melhorar tecnicamente, tira fotos incríveis com um toque muito original. O modo vertical integrado também é muito bom e permite um jogo atraente com a profundidade de campo. A duração da bateria também foi melhorada.
O Huawei P10 é um desenvolvimento muito bem sucedido que convence com uma boa câmera e duração de bateria melhorada.
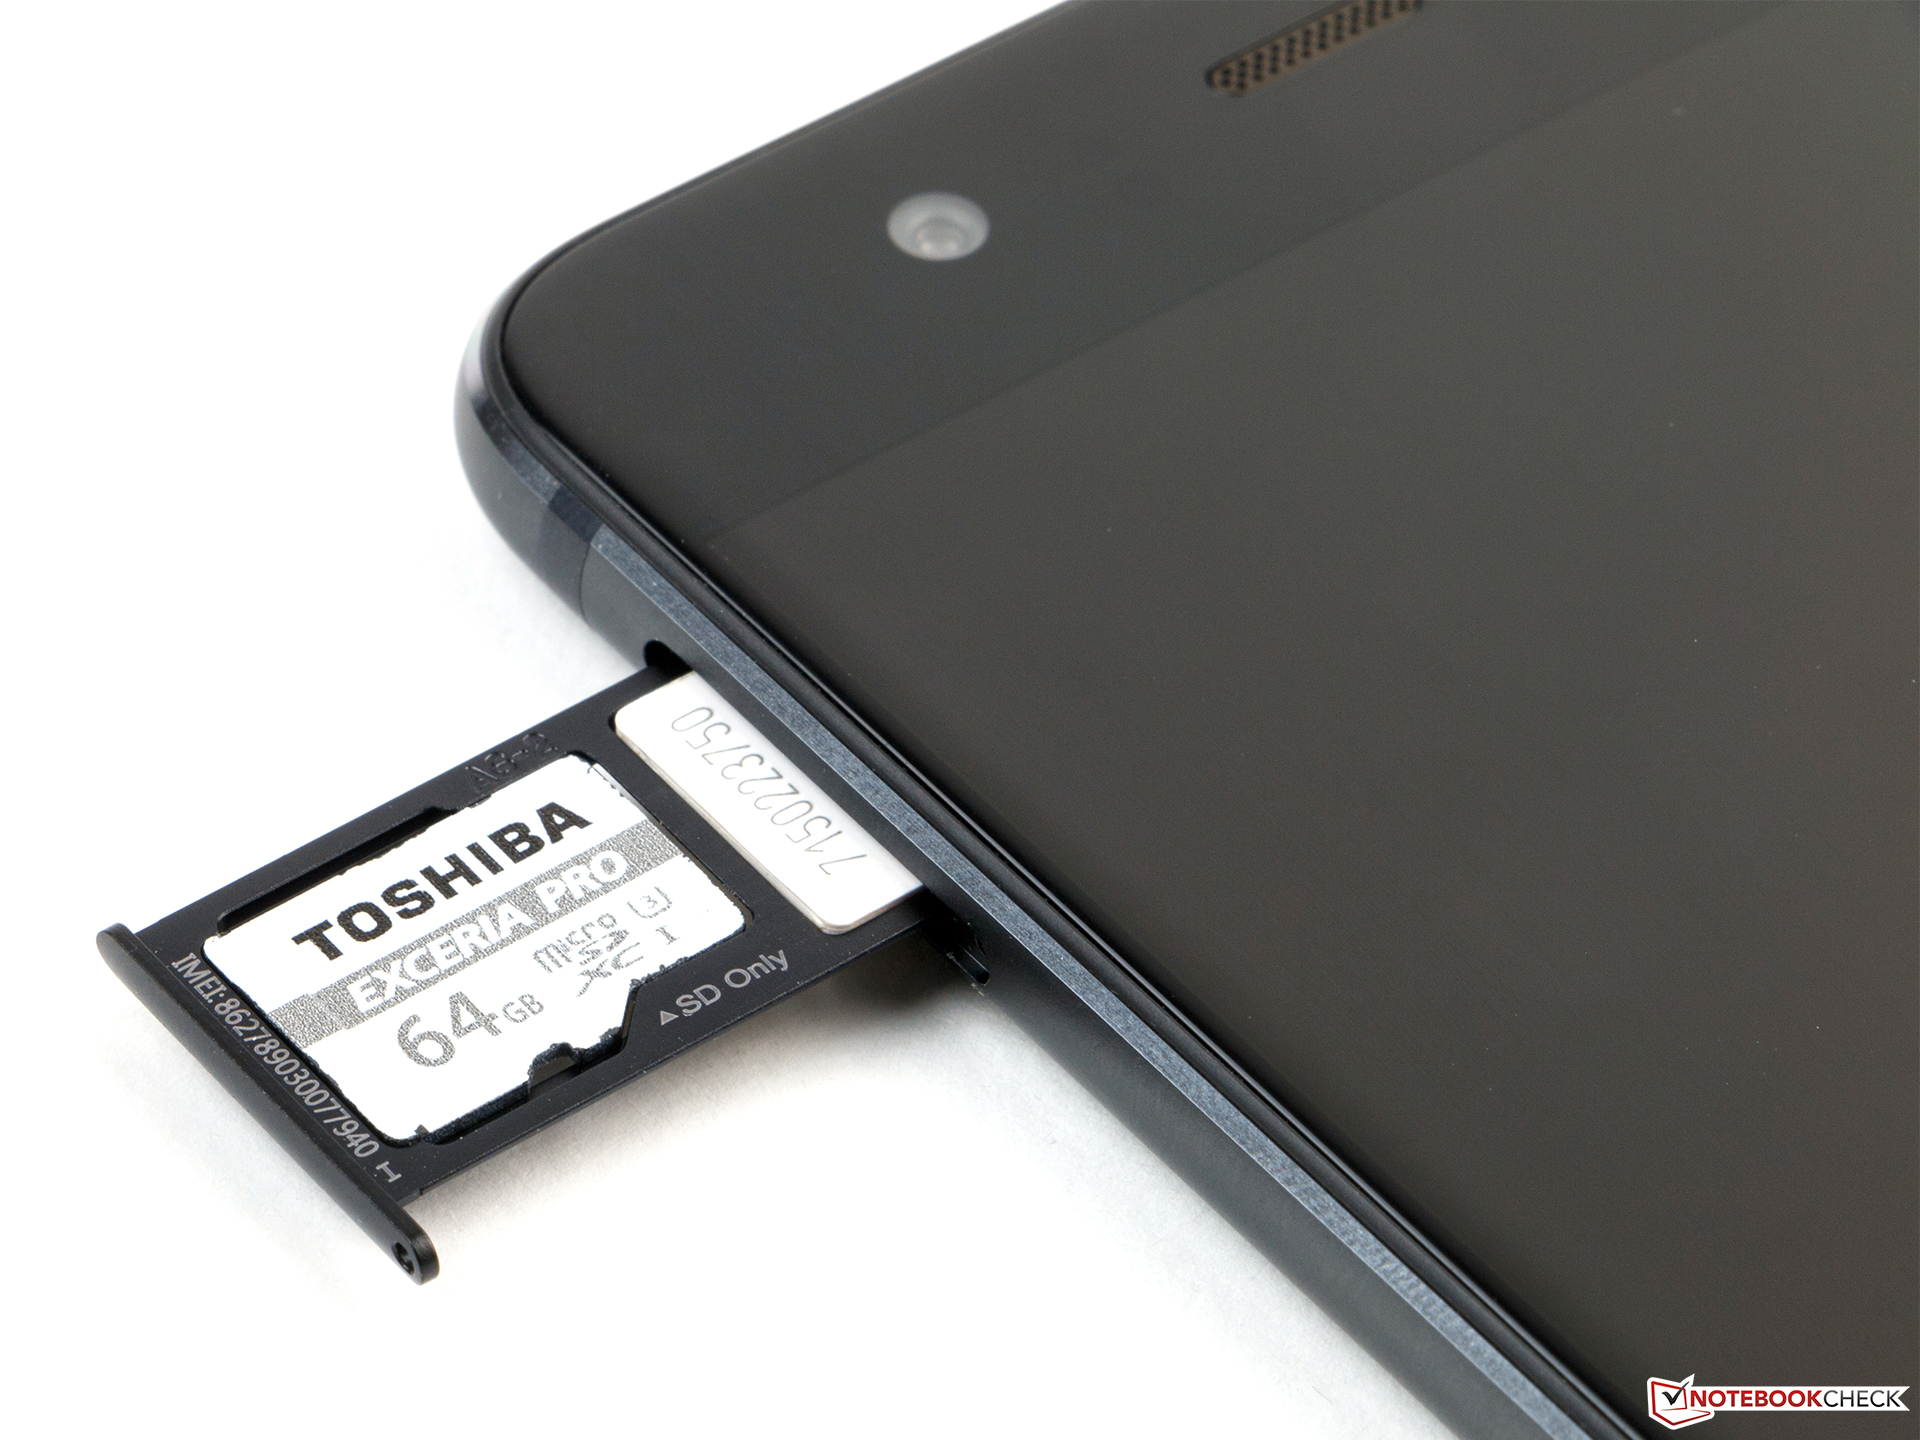
No entanto, considerando que o Huawei P10 é um produto de gama premium, encontramos algumas desvantagens. O módulo Wi-Fi comparativamente fraco, o lento slot micro-SD, e a única tela Full HD disponível não são apropriadas para a faixa de preços em que o P10 entra. A Sony pode ostentar com uma tela Ultra HD e HDR este ano, e o LG G6 também receberá um painel HDR. A Huawei terá que fazer uma atualização aqui, em produtos futuros.
A Huawei também ganha pontos com o serviço. O serviço VIP que estende a garantia para três anos, entre outras coisas, não é apenas amigável para o cliente, mas também demonstra que a empresa confia em seu produto. A Huawei novamente criou um excelente smartphone que possui muitas fortalezas, e que é um desenvolvimento mais consistente do em relação ao seu antecessor.
Huawei P10
- 07/11/2017 v6 (old)
Daniel Schmidt