Breve Análise do Smartphone Huawei P20 Lite
| Networking | |
| iperf3 transmit AX12 | |
| Sony Xperia XA2 | |
| HTC U11 Life | |
| Huawei P20 Lite | |
| Huawei P10 Lite | |
| Samsung Galaxy A5 2017 | |
| iperf3 receive AX12 | |
| Sony Xperia XA2 | |
| Huawei P10 Lite | |
| HTC U11 Life | |
| Samsung Galaxy A5 2017 | |
| Huawei P20 Lite | |


| |||||||||||||||||||||||||
iluminação: 89 %
iluminação com acumulador: 528 cd/m²
Contraste: 1035:1 (Preto: 0.51 cd/m²)
ΔE ColorChecker Calman: 4.7 | ∀{0.5-29.43 Ø4.71}
ΔE Greyscale Calman: 6.4 | ∀{0.09-98 Ø4.96}
97.8% sRGB (Calman 2D)
Gamma: 2.22
CCT: 7987 K
| Huawei P20 Lite IPS, 2280x1080, 5.8" | HTC U11 Life SLCD, 1920x1080, 5.2" | Huawei P10 Lite IPS, 1920x1080, 5.2" | Samsung Galaxy A5 2017 Super AMOLED, 1920x1080, 5.2" | Sony Xperia XA2 IPS, 1920x1080, 5.2" | |
|---|---|---|---|---|---|
| Screen | 8% | 8% | 37% | -3% | |
| Brightness middle (cd/m²) | 528 | 545 3% | 507 -4% | 539 2% | 513 -3% |
| Brightness (cd/m²) | 525 | 526 0% | 509 -3% | 542 3% | 506 -4% |
| Brightness Distribution (%) | 89 | 87 -2% | 95 7% | 93 4% | 93 4% |
| Black Level * (cd/m²) | 0.51 | 0.42 18% | 0.36 29% | 0.42 18% | |
| Contrast (:1) | 1035 | 1298 25% | 1408 36% | 1221 18% | |
| Colorchecker dE 2000 * | 4.7 | 4.9 -4% | 5.1 -9% | 1.6 66% | 5 -6% |
| Colorchecker dE 2000 max. * | 8.9 | 8.5 4% | 9 -1% | 2.6 71% | 11.4 -28% |
| Greyscale dE 2000 * | 6.4 | 5.4 16% | 6.1 5% | 1.5 77% | 7.8 -22% |
| Gamma | 2.22 99% | 2.31 95% | 2.28 96% | 2.28 96% | 2.2 100% |
| CCT | 7987 81% | 7610 85% | 8143 80% | 6422 101% | 7964 82% |
* ... menor é melhor
Cintilação da tela / PWM (modulação por largura de pulso)
| Tela tremeluzindo / PWM não detectado | 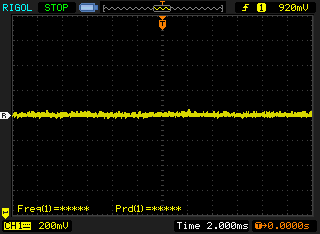 | ||
[pwm_comparison] Em comparação: 52 % de todos os dispositivos testados não usam PWM para escurecer a tela. Se PWM foi detectado, uma média de 7754 (mínimo: 5 - máximo: 343500) Hz foi medida. | |||
Exibir tempos de resposta
| ↔ Tempo de resposta preto para branco | ||
|---|---|---|
| ms ... ascensão ↗ e queda ↘ combinadas | ↗ 9.2 ms ascensão | 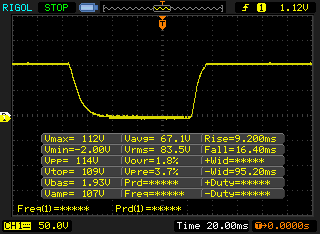 |
| ↘ 16.4 ms queda | ||
| A tela mostra taxas de resposta muito rápidas em nossos testes e deve ser muito adequada para jogos em ritmo acelerado. Em comparação, todos os dispositivos testados variam de 0.1 (mínimo) a 240 (máximo) ms. » 0 % de todos os dispositivos são melhores. Isso significa que o tempo de resposta medido é melhor que a média de todos os dispositivos testados (19.8 ms). | ||
| ↔ Tempo de resposta 50% cinza a 80% cinza | ||
| ms ... ascensão ↗ e queda ↘ combinadas | ↗ 22 ms ascensão | 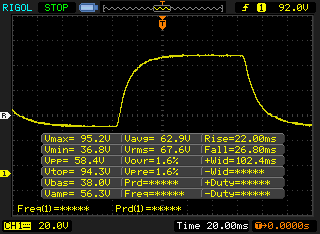 |
| ↘ 26.8 ms queda | ||
| A tela mostra taxas de resposta muito rápidas em nossos testes e deve ser muito adequada para jogos em ritmo acelerado. Em comparação, todos os dispositivos testados variam de 0.165 (mínimo) a 636 (máximo) ms. » 0 % de todos os dispositivos são melhores. Isso significa que o tempo de resposta medido é melhor que a média de todos os dispositivos testados (31 ms). | ||
| AnTuTu v6 - Total Score (classificar por valor) | |
| Huawei P20 Lite | |
| HTC U11 Life | |
| Huawei P10 Lite | |
| Samsung Galaxy A5 2017 | |
| Sony Xperia XA2 | |
| Média HiSilicon Kirin 659 (62810 - 68232, n=8) | |
| AnTuTu v7 - Total Score (classificar por valor) | |
| Huawei P20 Lite | |
| Sony Xperia XA2 | |
| Média HiSilicon Kirin 659 (81992 - 89639, n=6) | |
| PCMark for Android | |
| Work performance score (classificar por valor) | |
| Huawei P20 Lite | |
| HTC U11 Life | |
| Huawei P10 Lite | |
| Samsung Galaxy A5 2017 | |
| Sony Xperia XA2 | |
| Média HiSilicon Kirin 659 (5704 - 6252, n=7) | |
| Work 2.0 performance score (classificar por valor) | |
| Huawei P20 Lite | |
| HTC U11 Life | |
| Huawei P10 Lite | |
| Samsung Galaxy A5 2017 | |
| Sony Xperia XA2 | |
| Média HiSilicon Kirin 659 (4615 - 4911, n=8) | |
| Basemark ES 3.1 / Metal - offscreen Overall Score (classificar por valor) | |
| Samsung Galaxy A5 2017 | |
| Média HiSilicon Kirin 659 (n=1) | |
| Média da turma Smartphone (544 - 7731, n=18, últimos 2 anos) | |
| JetStream 1.1 - 1.1 Total | |
| Samsung Galaxy A5 2017 (Samsung Browser (Chrome 44)) | |
| Huawei P10 Lite (Chrome 55.0.2883.91) | |
| HTC U11 Life (Chrome 63) | |
| Média HiSilicon Kirin 659 (23.4 - 31.3, n=8) | |
| Sony Xperia XA2 (Chrome 65.0.3325.109) | |
| Huawei P20 Lite (Chrome 63) | |
| Octane V2 - Total Score | |
| Média da turma Smartphone (2800 - 126661, n=142, últimos 2 anos) | |
| Samsung Galaxy A5 2017 (Samsung Browser (Chrome 44)) | |
| Média HiSilicon Kirin 659 (4191 - 5471, n=8) | |
| HTC U11 Life (Chrome 63) | |
| Sony Xperia XA2 (Chrome 65.0.3325.109) | |
| Huawei P10 Lite (Chrome 55.0.2883.91) | |
| Huawei P20 Lite | |
| Mozilla Kraken 1.1 - Total | |
| Huawei P20 Lite (Chrome 63) | |
| Sony Xperia XA2 (Chrome 65.0.3325.109) | |
| HTC U11 Life (Chrome 63) | |
| Média HiSilicon Kirin 659 (8684 - 10788, n=8) | |
| Huawei P10 Lite (Chrome 55.0.2883.91) | |
| Samsung Galaxy A5 2017 (Samsung Browser (Chrome 44)) | |
| Média da turma Smartphone (257 - 28190, n=121, últimos 2 anos) | |
| WebXPRT 2015 - Overall | |
| Sony Xperia XA2 (Chrome 65.0.3325.109) | |
| Média HiSilicon Kirin 659 (86 - 120, n=8) | |
| HTC U11 Life (Chrome 63) | |
| Samsung Galaxy A5 2017 (Samsung Browser (Chrome 44)) | |
| Huawei P20 Lite (Chrome 63) | |
| Huawei P10 Lite (Chrome 55.0.2883.91) | |
* ... menor é melhor
| Huawei P20 Lite | HTC U11 Life | Huawei P10 Lite | Samsung Galaxy A5 2017 | Sony Xperia XA2 | Média 64 GB eMMC Flash | Média da turma Smartphone | |
|---|---|---|---|---|---|---|---|
| AndroBench 3-5 | -18% | -26% | -44% | -23% | -11% | 617% | |
| Sequential Read 256KB (MB/s) | 293.9 | 268 -9% | 264.3 -10% | 182 -38% | 271.5 -8% | 278 ? -5% | 2225 ? 657% |
| Sequential Write 256KB (MB/s) | 198.3 | 120 -39% | 129.2 -35% | 77.1 -61% | 127.4 -36% | 178.6 ? -10% | 1903 ? 860% |
| Random Read 4KB (MB/s) | 48.19 | 39.3 -18% | 72.5 50% | 22.41 -53% | 43.07 -11% | 60.9 ? 26% | 311 ? 545% |
| Random Write 4KB (MB/s) | 71.1 | 50.2 -29% | 19.36 -73% | 12.13 -83% | 13.82 -81% | 34.2 ? -52% | 358 ? 404% |
| Sequential Read 256KB SDCard (MB/s) | 83.5 ? | 82.8 ? -1% | 53.4 ? -36% | 73.7 ? -12% | 86 ? 3% | 77.4 ? -7% | |
| Sequential Write 256KB SDCard (MB/s) | 69 ? | 59.8 ? -13% | 32.7 ? -53% | 56 ? -19% | 64.8 ? -6% | 58.3 ? -16% |
| Dead Trigger 2 | |||
| Configurações | Valor | ||
| high | 30 fps | ||
| Asphalt 8: Airborne | |||
| Configurações | Valor | ||
| high | 29 fps | ||
| very low | 29 fps | ||
(+) A temperatura máxima no lado superior é 36.2 °C / 97 F, em comparação com a média de 35.3 °C / 96 F , variando de 21.9 a 247 °C para a classe Smartphone.
(+) A parte inferior aquece até um máximo de 36.8 °C / 98 F, em comparação com a média de 34 °C / 93 F
(+) Em uso inativo, a temperatura média para o lado superior é 27 °C / 81 F, em comparação com a média do dispositivo de 33 °C / ### class_avg_f### F.
Huawei P20 Lite análise de áudio
(+) | os alto-falantes podem tocar relativamente alto (###valor### dB)
Graves 100 - 315Hz
(-) | quase nenhum baixo - em média 25% menor que a mediana
(±) | a linearidade dos graves é média (9.4% delta para a frequência anterior)
Médios 400 - 2.000 Hz
(+) | médios equilibrados - apenas 4.4% longe da mediana
(±) | a linearidade dos médios é média (8.7% delta para frequência anterior)
Altos 2 - 16 kHz
(±) | máximos mais altos - em média 10.5% maior que a mediana
(+) | os máximos são lineares (3.4% delta da frequência anterior)
Geral 100 - 16.000 Hz
(±) | a linearidade do som geral é média (25.5% diferença em relação à mediana)
Comparado com a mesma classe
» 64% de todos os dispositivos testados nesta classe foram melhores, 6% semelhantes, 30% piores
» O melhor teve um delta de 11%, a média foi 34%, o pior foi 134%
Comparado com todos os dispositivos testados
» 78% de todos os dispositivos testados foram melhores, 4% semelhantes, 17% piores
» O melhor teve um delta de 4%, a média foi 23%, o pior foi 134%
Sony Xperia XA2 análise de áudio
(+) | os alto-falantes podem tocar relativamente alto (###valor### dB)
Graves 100 - 315Hz
(-) | quase nenhum baixo - em média 28% menor que a mediana
(±) | a linearidade dos graves é média (11% delta para a frequência anterior)
Médios 400 - 2.000 Hz
(±) | médios reduzidos - em média 5.5% menor que a mediana
(+) | médios são lineares (5.6% delta para frequência anterior)
Altos 2 - 16 kHz
(±) | máximos mais altos - em média 7.6% maior que a mediana
(+) | os máximos são lineares (2.2% delta da frequência anterior)
Geral 100 - 16.000 Hz
(±) | a linearidade do som geral é média (23.6% diferença em relação à mediana)
Comparado com a mesma classe
» 54% de todos os dispositivos testados nesta classe foram melhores, 8% semelhantes, 38% piores
» O melhor teve um delta de 11%, a média foi 34%, o pior foi 134%
Comparado com todos os dispositivos testados
» 71% de todos os dispositivos testados foram melhores, 6% semelhantes, 23% piores
» O melhor teve um delta de 4%, a média foi 23%, o pior foi 134%
HTC U11 Life análise de áudio
(+) | os alto-falantes podem tocar relativamente alto (###valor### dB)
Graves 100 - 315Hz
(-) | quase nenhum baixo - em média 27.5% menor que a mediana
(+) | o baixo é linear (6.7% delta para a frequência anterior)
Médios 400 - 2.000 Hz
(±) | médios reduzidos - em média 9% menor que a mediana
(+) | médios são lineares (6.9% delta para frequência anterior)
Altos 2 - 16 kHz
(±) | máximos mais altos - em média 9% maior que a mediana
(+) | os máximos são lineares (4.7% delta da frequência anterior)
Geral 100 - 16.000 Hz
(±) | a linearidade do som geral é média (25.4% diferença em relação à mediana)
Comparado com a mesma classe
» 63% de todos os dispositivos testados nesta classe foram melhores, 7% semelhantes, 30% piores
» O melhor teve um delta de 11%, a média foi 34%, o pior foi 134%
Comparado com todos os dispositivos testados
» 78% de todos os dispositivos testados foram melhores, 5% semelhantes, 17% piores
» O melhor teve um delta de 4%, a média foi 23%, o pior foi 134%
| desligado | |
| Ocioso | |
| Carga |
|
Key:
min: | |
| Huawei P20 Lite 3000 mAh | HTC U11 Life 2600 mAh | Huawei P10 Lite 3000 mAh | Samsung Galaxy A5 2017 3000 mAh | Sony Xperia XA2 3300 mAh | Média HiSilicon Kirin 659 | Média da turma Smartphone | |
|---|---|---|---|---|---|---|---|
| Power Consumption | 11% | 18% | 34% | 27% | -34% | -23% | |
| Idle Minimum * (Watt) | 0.98 | 0.63 36% | 0.38 61% | 0.64 35% | 0.39 60% | 1.265 ? -29% | 0.887 ? 9% |
| Idle Average * (Watt) | 2 | 2.1 -5% | 1.87 6% | 1.36 32% | 1.61 19% | 2.96 ? -48% | 1.485 ? 26% |
| Idle Maximum * (Watt) | 2.11 | 2.15 -2% | 1.92 9% | 1.4 34% | 1.62 23% | 3.1 ? -47% | 1.672 ? 21% |
| Load Average * (Watt) | 3.9 | 3.34 14% | 3.82 2% | 2.53 35% | 3.12 20% | 5.05 ? -29% | 6.76 ? -73% |
| Load Maximum * (Watt) | 5.62 | 4.83 14% | 4.9 13% | 3.63 35% | 4.92 12% | 6.7 ? -19% | 11.2 ? -99% |
* ... menor é melhor
| Huawei P20 Lite 3000 mAh | HTC U11 Life 2600 mAh | Huawei P10 Lite 3000 mAh | Samsung Galaxy A5 2017 3000 mAh | Sony Xperia XA2 3300 mAh | |
|---|---|---|---|---|---|
| Duração da bateria | 66% | 36% | 117% | 93% | |
| Reader / Idle (h) | 12.5 | 30.3 142% | 23.5 88% | 40.3 222% | 41.7 234% |
| H.264 (h) | 7.8 | 13.3 71% | 9.8 26% | 16.4 110% | 12.8 64% |
| WiFi v1.3 (h) | 9.7 | 12.1 25% | 11.1 14% | 14.1 45% | 14.8 53% |
| Load (h) | 4.1 | 5.1 24% | 4.8 17% | 7.8 90% | 5 22% |
Pro
Contra
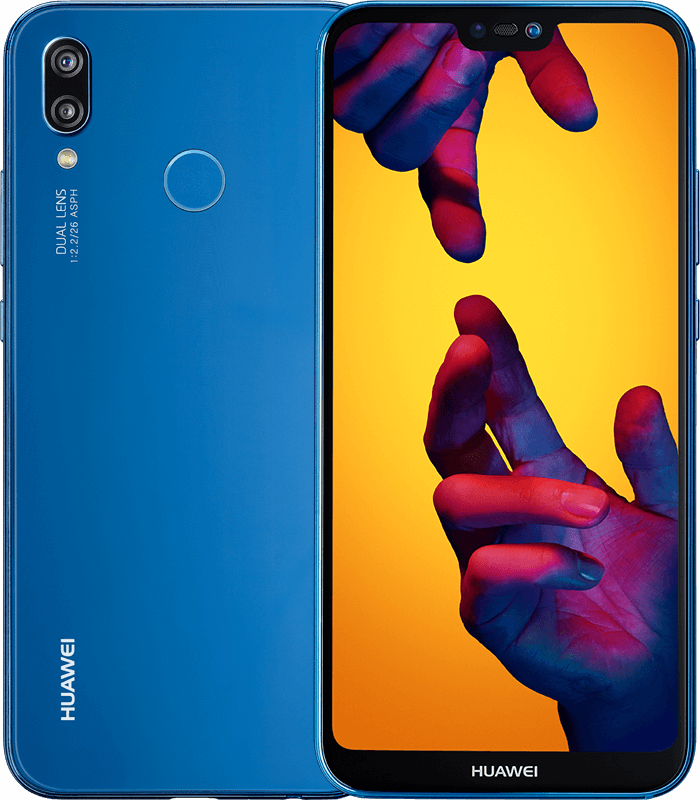
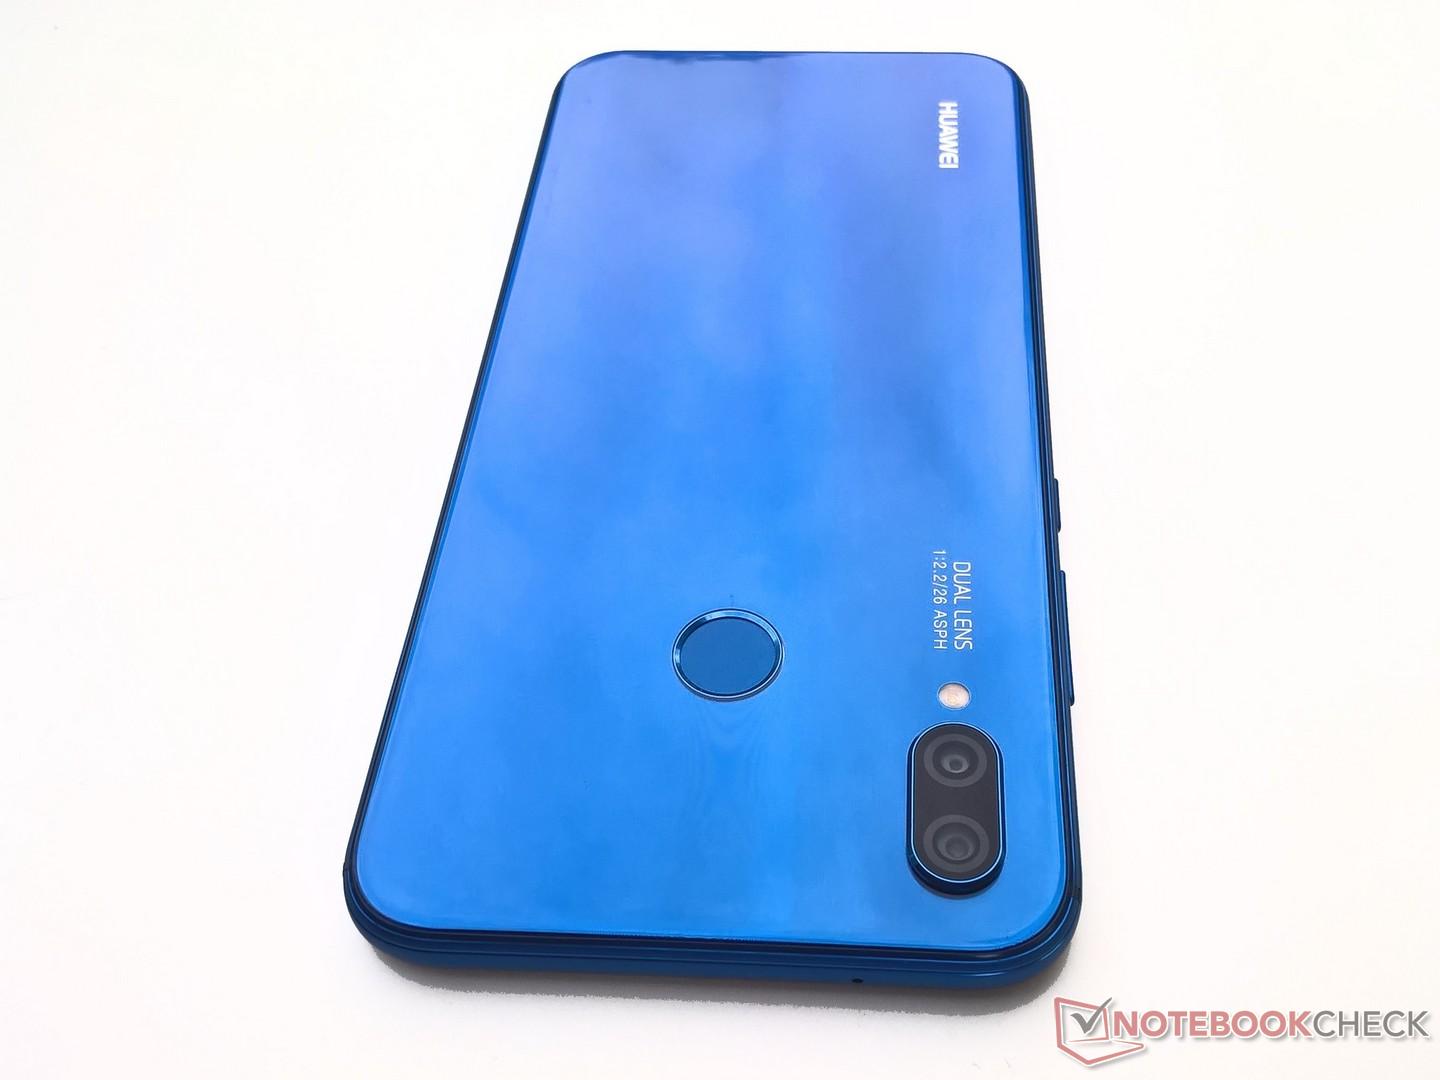
O Huawei P20 Lite apresenta-se como um sólido smartphone de gama média na nossa análise, mas não consegue diferenciar-se da concorrência em termos de desempenho. A câmera dupla de 16 MP tira boas fotos e o sistema como um todo funciona sem problemas, embora isso já seja algo ao qual já estamos acostumados com smartphones de outros fabricantes. O design pode ser o único fator decisivo para uma compra e, embora sua tela quase sem bordas e o entalhe não sejam exclusivos, eles não são encontrados com frequência nessa faixa de preços.
O Huawei P20 Lite é um smartphone para aqueles sem a necessidade de aplicativos 3D complexos que estão procurando um dispositivo do dia-a-dia que tenha bom desempenho e um design atraente.
Os compradores em potencial podem esperar por um smartphone com Android atualizado e desempenho fluente do sistema. O rápido armazenamento interno e o moderno SoC oferecem uma experiência fluente. O desempenho gráfico pode ser insuficiente para jogadores de smartphones ou usuários de aplicativos 3D complexos. No entanto, esta é uma fraqueza que o P20 Lite compartilha com seu predecessor. Considerando a capacidade de 3000 mAh, a duração da bateria é um pouco curta, mas ainda é suficiente para quase 10 horas de uso intensivo do dispositivo.
Huawei P20 Lite
- 05/08/2018 v6 (old)
Mike Wobker