Breve Análise do Smartphone Huawei Y6 2018
| Networking | |
| iperf3 transmit AX12 | |
| BQ Aquaris VS | |
| Motorola Moto G5s | |
| Nokia 2 | |
| Huawei Y6 2018 | |
| Huawei Y6 2017 | |
| iperf3 receive AX12 | |
| BQ Aquaris VS | |
| Motorola Moto G5s | |
| Nokia 2 | |
| Huawei Y6 2018 | |
| Huawei Y6 2017 | |


| |||||||||||||||||||||||||
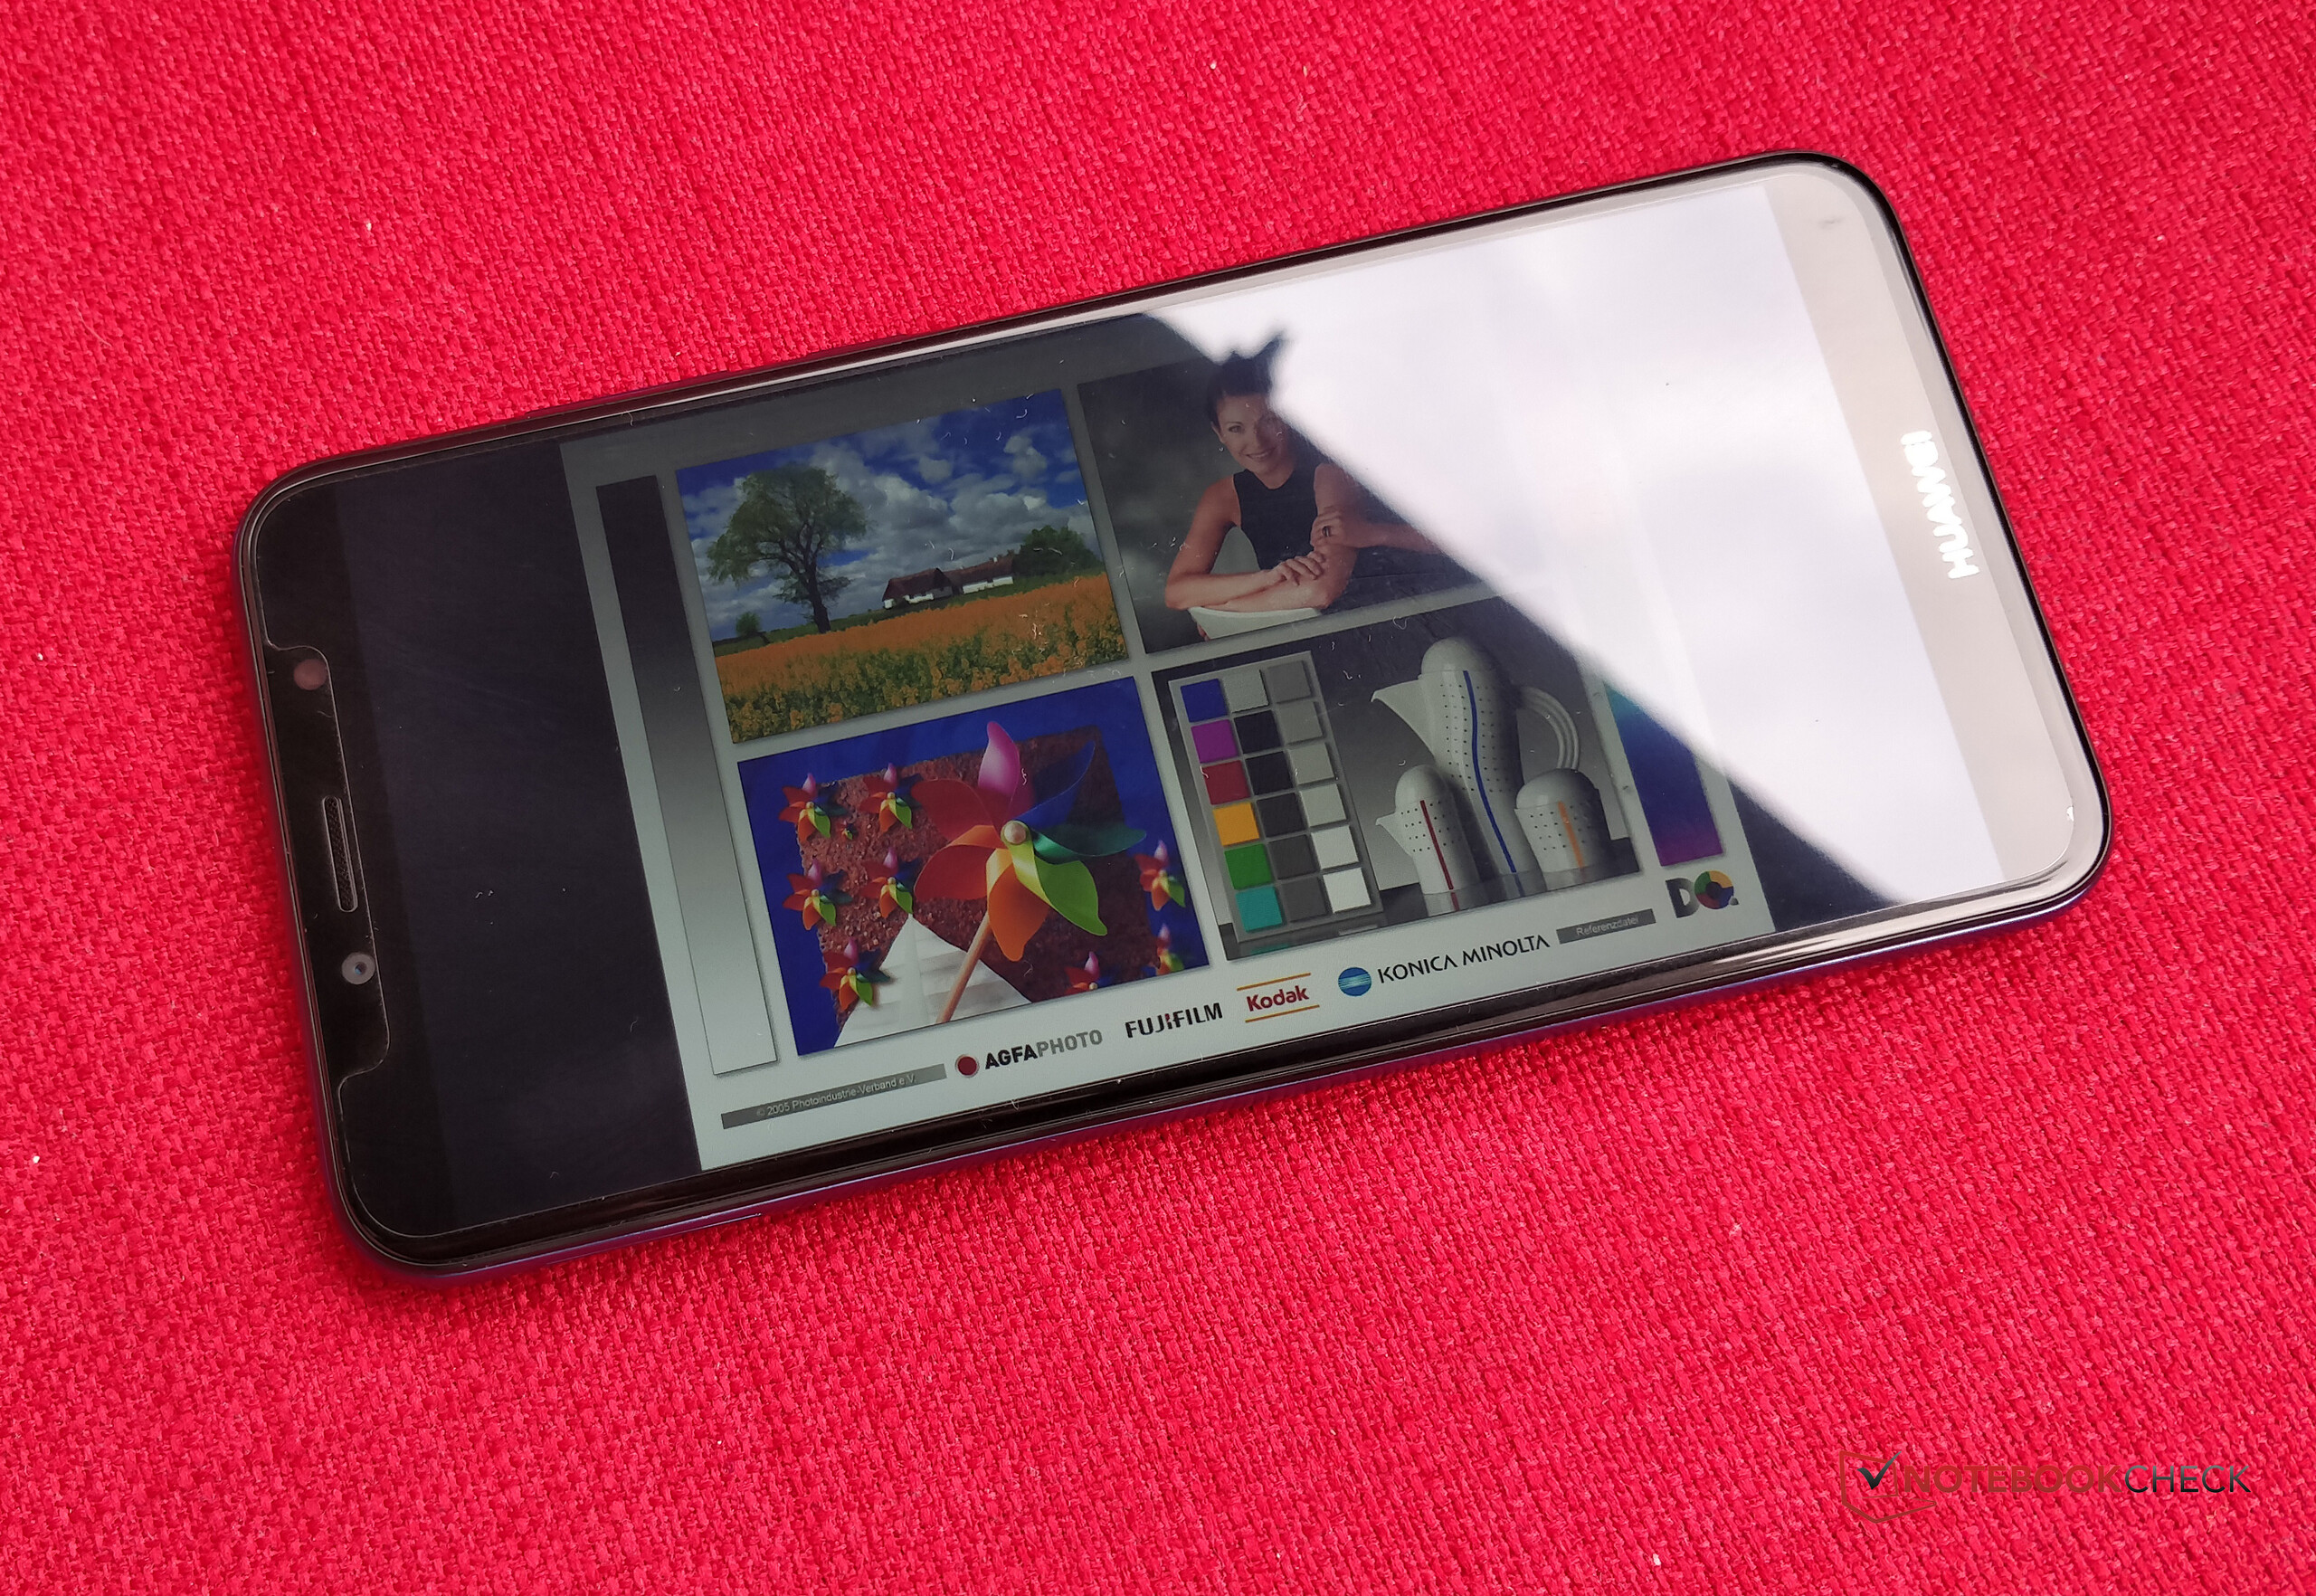
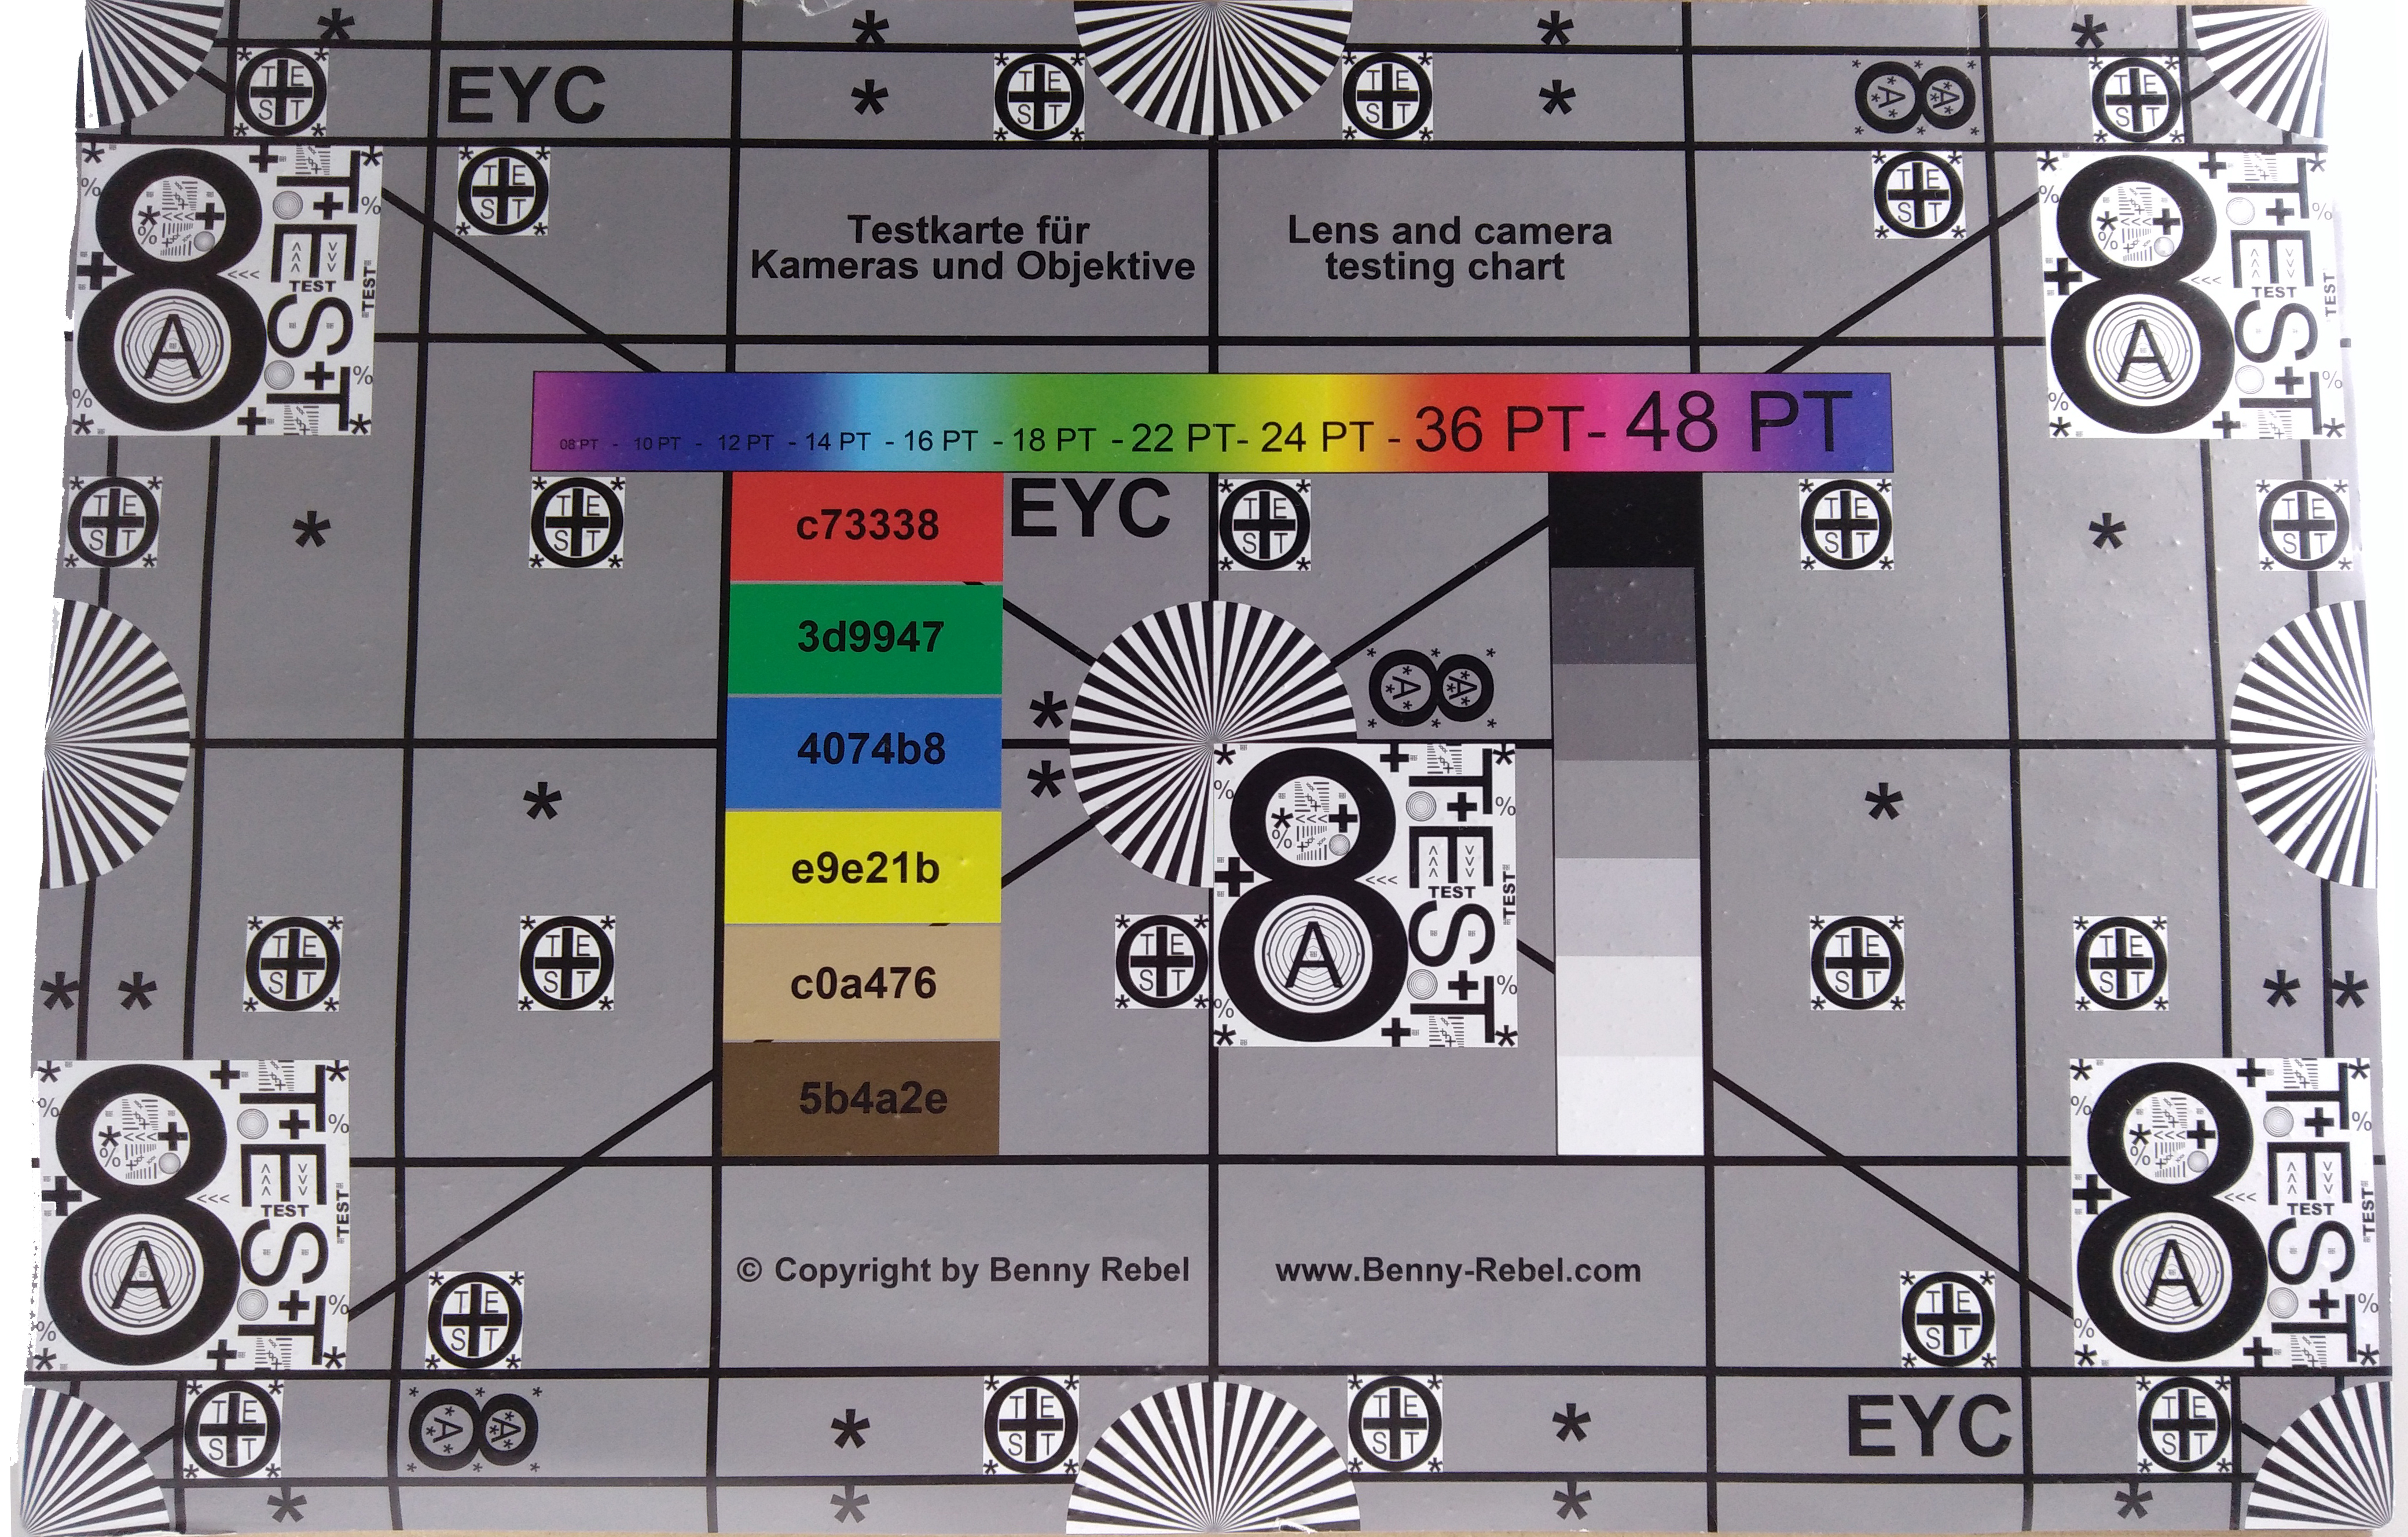
iluminação: 88 %
iluminação com acumulador: 444 cd/m²
Contraste: 1208:1 (Preto: 0.4 cd/m²)
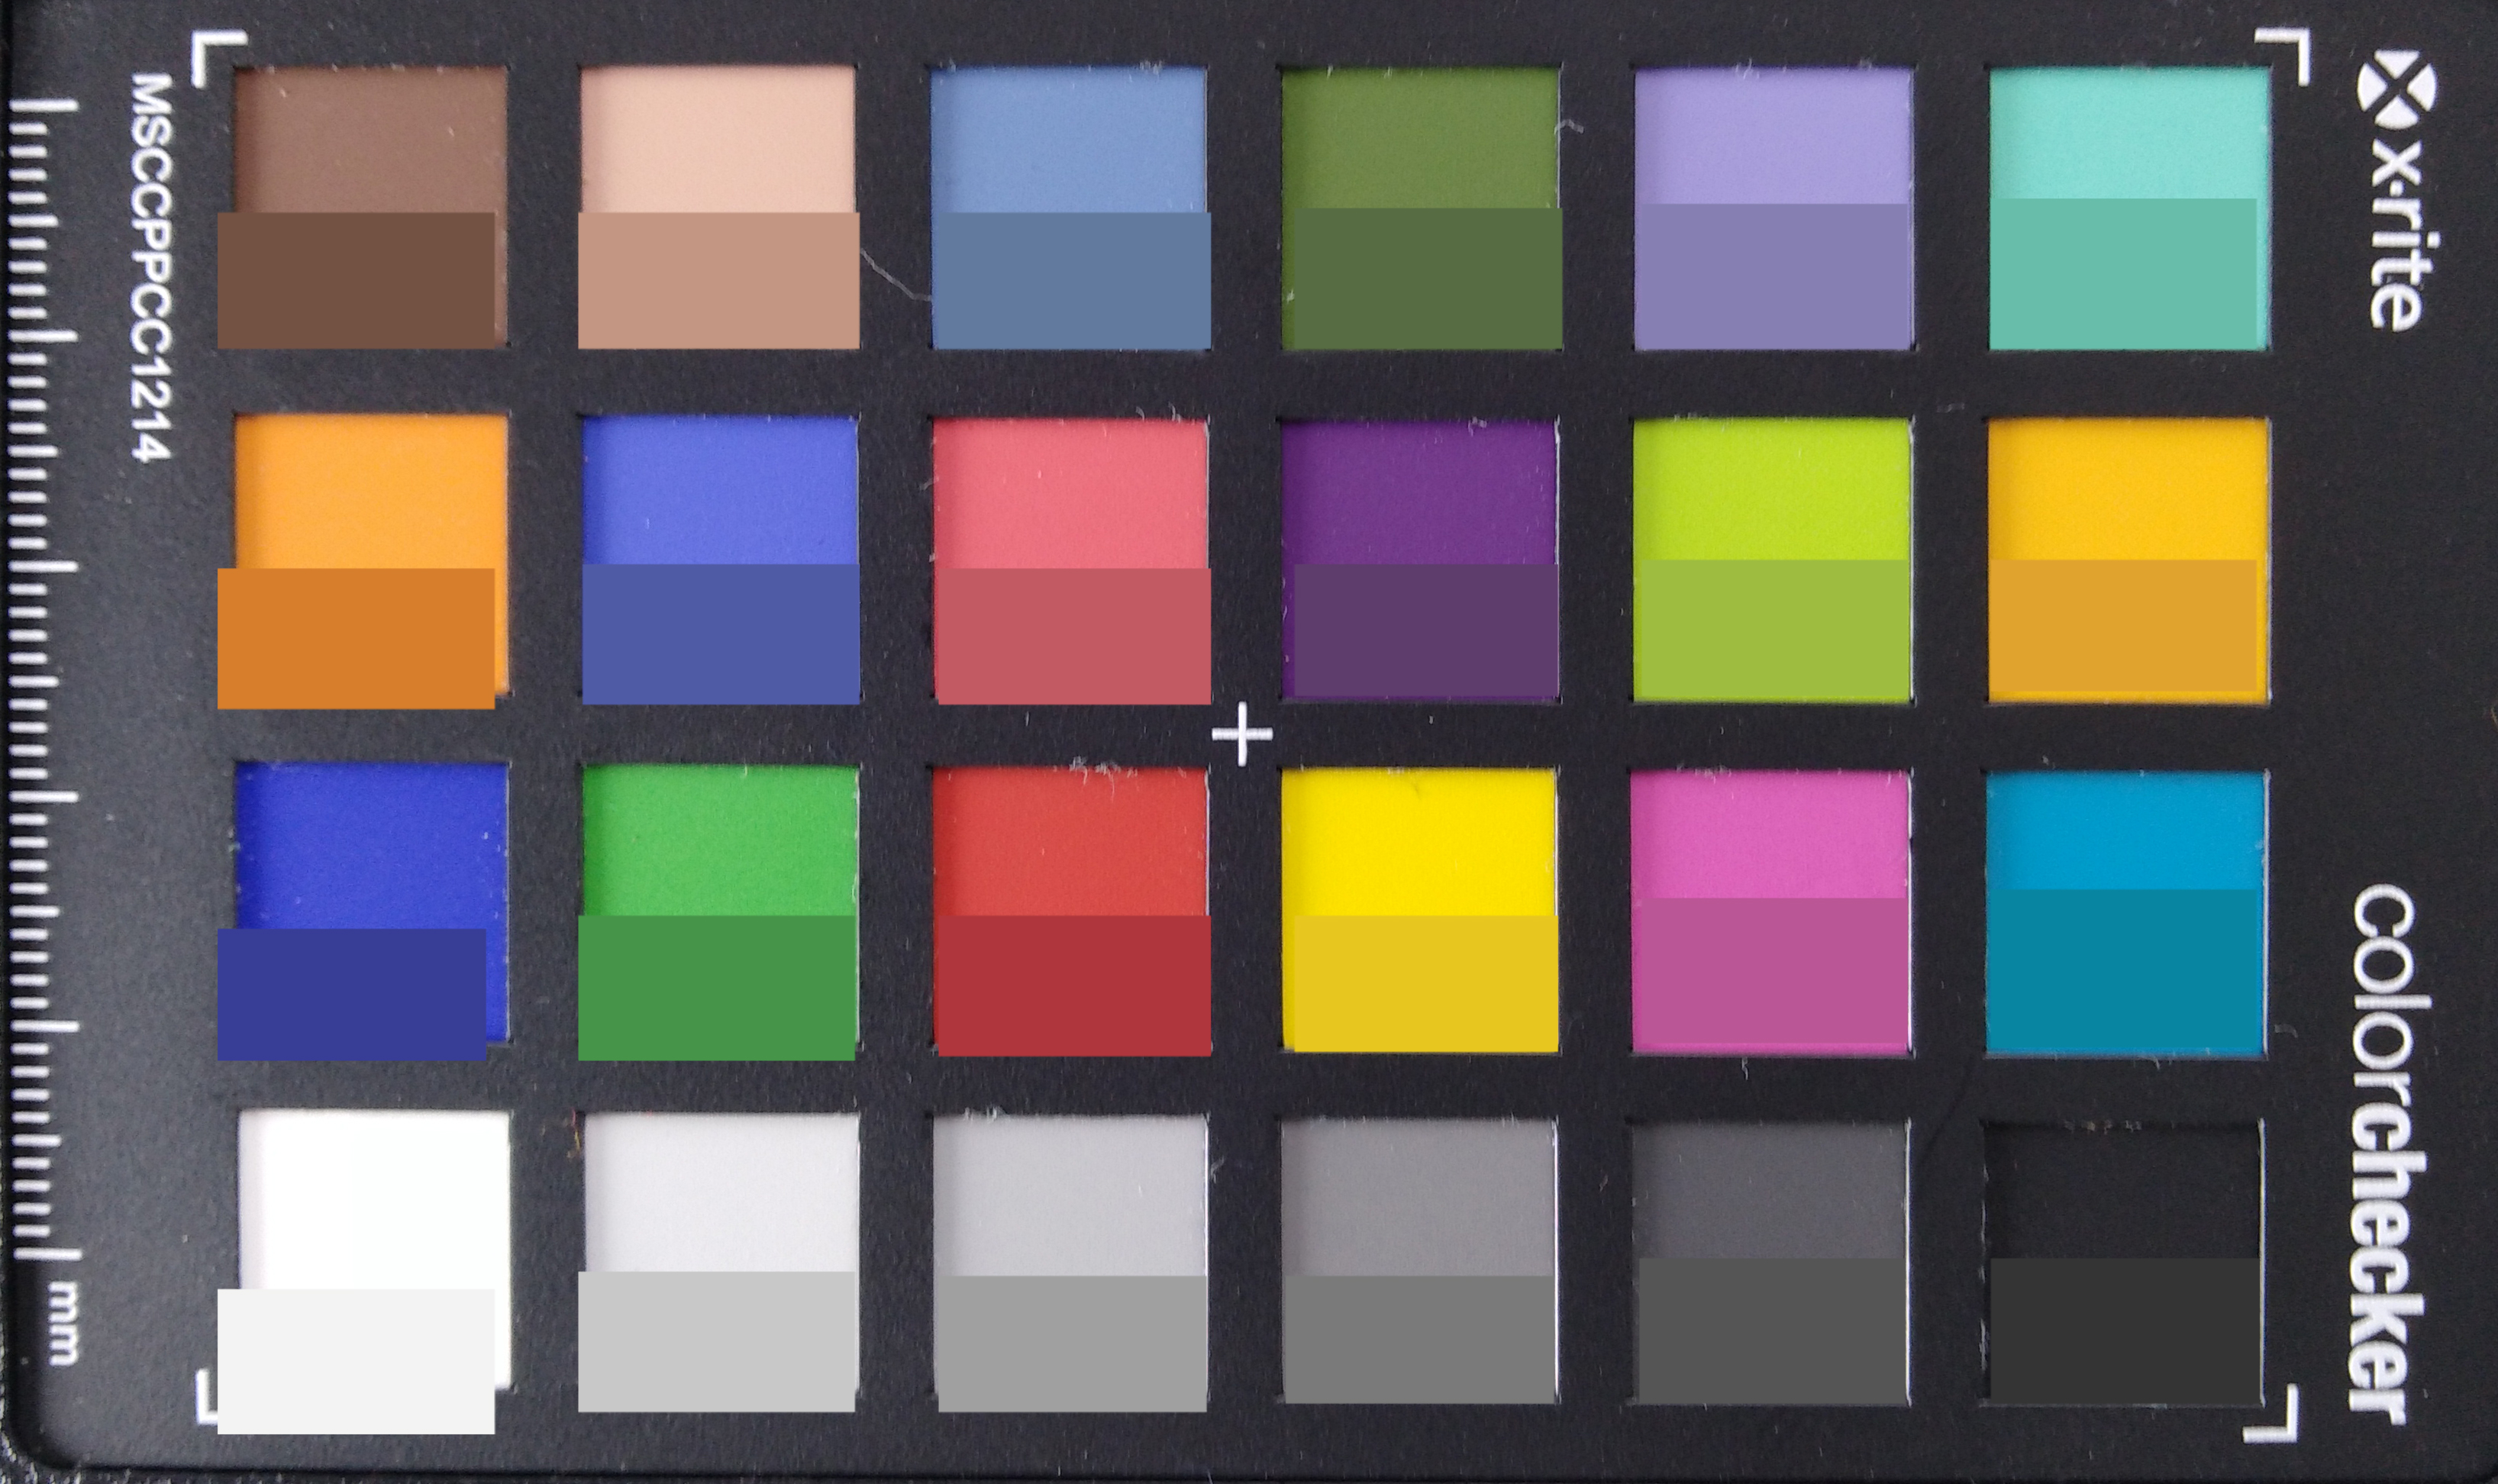
ΔE ColorChecker Calman: 5.8 | ∀{0.5-29.43 Ø4.71}
calibrated: 4.42
ΔE Greyscale Calman: 5 | ∀{0.09-98 Ø4.96}
93.9% sRGB (Calman 2D)
Gamma: 2.6
CCT: 7709 K
| Huawei Y6 2018 IPS, 1440x720, 5.7" | Nokia 2 IPS, 1280x720, 5" | Motorola Moto G5s IPS, 1920x1080, 5.2" | BQ Aquaris VS IPS, 1280x720, 5.2" | Huawei Y6 2017 IPS, 1280x720, 5" | |
|---|---|---|---|---|---|
| Screen | -8% | 6% | -1% | 37% | |
| Brightness middle (cd/m²) | 483 | 527 9% | 490 1% | 535 11% | 438 -9% |
| Brightness (cd/m²) | 460 | 503 9% | 502 9% | 544 18% | 432 -6% |
| Brightness Distribution (%) | 88 | 91 3% | 92 5% | 88 0% | 90 2% |
| Black Level * (cd/m²) | 0.4 | 0.68 -70% | 0.43 -8% | 0.61 -53% | 0.13 67% |
| Contrast (:1) | 1208 | 775 -36% | 1140 -6% | 877 -27% | 3369 179% |
| Colorchecker dE 2000 * | 5.8 | 5.3 9% | 5.7 2% | 5.3 9% | 4.8 17% |
| Colorchecker dE 2000 max. * | 12.6 | 9.2 27% | 7.8 38% | 11.1 12% | 11.4 10% |
| Colorchecker dE 2000 calibrated * | 4.42 | ||||
| Greyscale dE 2000 * | 5 | 5.8 -16% | 4.7 6% | 4 20% | 3.2 36% |
| Gamma | 2.6 85% | 2.12 104% | 2.4 92% | 1.95 113% | 2.23 99% |
| CCT | 7709 84% | 7894 82% | 7526 86% | 6800 96% | 7090 92% |
* ... menor é melhor
Cintilação da tela / PWM (modulação por largura de pulso)
| Tela tremeluzindo / PWM não detectado | 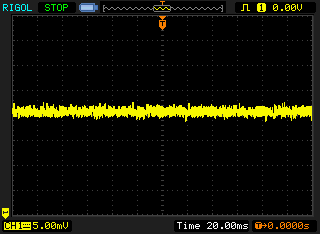 | ||
[pwm_comparison] Em comparação: 52 % de todos os dispositivos testados não usam PWM para escurecer a tela. Se PWM foi detectado, uma média de 7754 (mínimo: 5 - máximo: 343500) Hz foi medida. | |||
Exibir tempos de resposta
| ↔ Tempo de resposta preto para branco | ||
|---|---|---|
| 22 ms ... ascensão ↗ e queda ↘ combinadas | ↗ 12.8 ms ascensão | 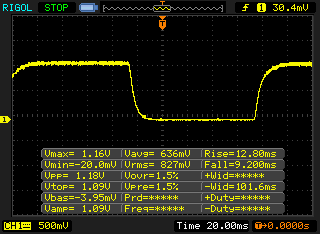 |
| ↘ 9.2 ms queda | ||
| A tela mostra boas taxas de resposta em nossos testes, mas pode ser muito lenta para jogadores competitivos. Em comparação, todos os dispositivos testados variam de 0.1 (mínimo) a 240 (máximo) ms. » 49 % de todos os dispositivos são melhores. Isso significa que o tempo de resposta medido é pior que a média de todos os dispositivos testados (19.8 ms). | ||
| ↔ Tempo de resposta 50% cinza a 80% cinza | ||
| 23.6 ms ... ascensão ↗ e queda ↘ combinadas | ↗ 14 ms ascensão | 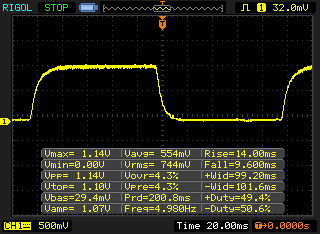 |
| ↘ 9.6 ms queda | ||
| A tela mostra boas taxas de resposta em nossos testes, mas pode ser muito lenta para jogadores competitivos. Em comparação, todos os dispositivos testados variam de 0.165 (mínimo) a 636 (máximo) ms. » 34 % de todos os dispositivos são melhores. Isso significa que o tempo de resposta medido é melhor que a média de todos os dispositivos testados (31 ms). | ||
| AnTuTu v6 - Total Score (classificar por valor) | |
| Huawei Y6 2018 | |
| Nokia 2 | |
| Motorola Moto G5s | |
| BQ Aquaris VS | |
| Huawei Y6 2017 | |
| Média Qualcomm Snapdragon 425 (MSM8917) (29054 - 39106, n=17) | |
| AnTuTu v7 - Total Score (classificar por valor) | |
| Huawei Y6 2018 | |
| BQ Aquaris VS | |
| Média Qualcomm Snapdragon 425 (MSM8917) (32557 - 46710, n=10) | |
| PCMark for Android | |
| Work performance score (classificar por valor) | |
| Huawei Y6 2018 | |
| Nokia 2 | |
| Motorola Moto G5s | |
| BQ Aquaris VS | |
| Huawei Y6 2017 | |
| Média Qualcomm Snapdragon 425 (MSM8917) (3681 - 5253, n=17) | |
| Work 2.0 performance score (classificar por valor) | |
| Huawei Y6 2018 | |
| Nokia 2 | |
| Motorola Moto G5s | |
| BQ Aquaris VS | |
| Huawei Y6 2017 | |
| Média Qualcomm Snapdragon 425 (MSM8917) (2829 - 3831, n=18) | |
| Geekbench 4.4 | |
| 64 Bit Single-Core Score (classificar por valor) | |
| Huawei Y6 2018 | |
| Nokia 2 | |
| Motorola Moto G5s | |
| BQ Aquaris VS | |
| Huawei Y6 2017 | |
| Média Qualcomm Snapdragon 425 (MSM8917) (541 - 692, n=18) | |
| Média da turma Smartphone (2497 - 11023, n=30, últimos 2 anos) | |
| 64 Bit Multi-Core Score (classificar por valor) | |
| Huawei Y6 2018 | |
| Nokia 2 | |
| Motorola Moto G5s | |
| BQ Aquaris VS | |
| Huawei Y6 2017 | |
| Média Qualcomm Snapdragon 425 (MSM8917) (883 - 1939, n=18) | |
| Média da turma Smartphone (6920 - 39147, n=30, últimos 2 anos) | |
| Compute RenderScript Score (classificar por valor) | |
| Huawei Y6 2018 | |
| Motorola Moto G5s | |
| BQ Aquaris VS | |
| Huawei Y6 2017 | |
| Média Qualcomm Snapdragon 425 (MSM8917) (1113 - 1460, n=16) | |
| Média da turma Smartphone (5227 - 30002, n=27, últimos 2 anos) | |
| GFXBench (DX / GLBenchmark) 2.7 | |
| T-Rex Onscreen (classificar por valor) | |
| Huawei Y6 2018 | |
| Nokia 2 | |
| Motorola Moto G5s | |
| BQ Aquaris VS | |
| Huawei Y6 2017 | |
| Média Qualcomm Snapdragon 425 (MSM8917) (6.4 - 20, n=18) | |
| Média da turma Smartphone (12 - 166, n=112, últimos 2 anos) | |
| 1920x1080 T-Rex Offscreen (classificar por valor) | |
| Huawei Y6 2018 | |
| Nokia 2 | |
| Motorola Moto G5s | |
| BQ Aquaris VS | |
| Huawei Y6 2017 | |
| Média Qualcomm Snapdragon 425 (MSM8917) (3.4 - 7.8, n=18) | |
| Média da turma Smartphone (22 - 954, n=112, últimos 2 anos) | |
| GFXBench 3.0 | |
| on screen Manhattan Onscreen OGL (classificar por valor) | |
| Huawei Y6 2018 | |
| Nokia 2 | |
| Motorola Moto G5s | |
| BQ Aquaris VS | |
| Huawei Y6 2017 | |
| Média Qualcomm Snapdragon 425 (MSM8917) (3.7 - 11, n=18) | |
| Média da turma Smartphone (18 - 166, n=113, últimos 2 anos) | |
| 1920x1080 1080p Manhattan Offscreen (classificar por valor) | |
| Huawei Y6 2018 | |
| Nokia 2 | |
| Motorola Moto G5s | |
| BQ Aquaris VS | |
| Huawei Y6 2017 | |
| Média Qualcomm Snapdragon 425 (MSM8917) (1.3 - 3, n=17) | |
| Média da turma Smartphone (14 - 606, n=112, últimos 2 anos) | |
| JetStream 1.1 - 1.1 Total | |
| Motorola Moto G5s (Chrome 62) | |
| Huawei Y6 2018 (Chrome 66) | |
| BQ Aquaris VS (Chrome 65) | |
| Huawei Y6 2017 (Chrome 60) | |
| Média Qualcomm Snapdragon 425 (MSM8917) (15.5 - 18.7, n=16) | |
| Nokia 2 (Chrome 65) | |
| Octane V2 - Total Score | |
| Média da turma Smartphone (2800 - 126661, n=142, últimos 2 anos) | |
| BQ Aquaris VS (Chrome 65) | |
| Huawei Y6 2017 (Chrome 60) | |
| Motorola Moto G5s (Chrome 62) | |
| Média Qualcomm Snapdragon 425 (MSM8917) (2411 - 3374, n=17) | |
| Huawei Y6 2018 (Chrome 66) | |
| Nokia 2 (Chrome 65) | |
| Mozilla Kraken 1.1 - Total | |
| Nokia 2 (Chrome 65) | |
| Huawei Y6 2018 (Chrome 66) | |
| BQ Aquaris VS (Chrome 65) | |
| Média Qualcomm Snapdragon 425 (MSM8917) (10742 - 16192, n=17) | |
| Motorola Moto G5s (Chrome 62) | |
| Huawei Y6 2017 (Chrome 60) | |
| Média da turma Smartphone (257 - 28190, n=121, últimos 2 anos) | |
| WebXPRT 2015 - Overall | |
| Média Qualcomm Snapdragon 425 (MSM8917) (62 - 79, n=8) | |
| Huawei Y6 2018 (Chrome 66) | |
| Huawei Y6 2017 (Chrome 60) | |
| Motorola Moto G5s (Chrome 62) | |
* ... menor é melhor
| Huawei Y6 2018 | Nokia 2 | Motorola Moto G5s | BQ Aquaris VS | Huawei Y6 2017 | Média 16 GB eMMC Flash | Média da turma Smartphone | |
|---|---|---|---|---|---|---|---|
| AndroBench 3-5 | -24% | 72% | 28% | -4% | -32% | 2039% | |
| Sequential Read 256KB (MB/s) | 254.3 | 131.1 -48% | 259 2% | 254.4 0% | 202.6 -20% | 164.5 ? -35% | 2225 ? 775% |
| Sequential Write 256KB (MB/s) | 65.6 | 50.8 -23% | 77.5 18% | 185.9 183% | 66.9 2% | 43 ? -34% | 1903 ? 2801% |
| Random Read 4KB (MB/s) | 38.8 | 17.44 -55% | 40.6 5% | 47.2 22% | 25.93 -33% | 21.7 ? -44% | 311 ? 702% |
| Random Write 4KB (MB/s) | 9 | 8.1 -10% | 46.2 413% | 6.4 -29% | 20.54 128% | 8.08 ? -10% | 358 ? 3878% |
| Sequential Read 256KB SDCard (MB/s) | 84.9 ? | 81.9 ? -4% | 84.1 ? -1% | 83.3 ? -2% | 48.4 -43% | 59.1 ? -30% | |
| Sequential Write 256KB SDCard (MB/s) | 64 ? | 61.2 ? -4% | 62.3 ? -3% | 59.4 ? -7% | 26.4 -59% | 39.8 ? -38% |
| Shadow Fight 3 | |||
| Configurações | Valor | ||
| high | 39 fps | ||
| minimal | 41.5 fps | ||
| Arena of Valor | |||
| Configurações | Valor | ||
| min | 31 fps | ||
| high HD | 30 fps | ||
(+) A temperatura máxima no lado superior é 35.8 °C / 96 F, em comparação com a média de 35.3 °C / 96 F , variando de 21.9 a 247 °C para a classe Smartphone.
(+) A parte inferior aquece até um máximo de 33 °C / 91 F, em comparação com a média de 34 °C / 93 F
(+) Em uso inativo, a temperatura média para o lado superior é 28.4 °C / 83 F, em comparação com a média do dispositivo de 33 °C / ### class_avg_f### F.
Huawei Y6 2018 análise de áudio
(+) | os alto-falantes podem tocar relativamente alto (###valor### dB)
Graves 100 - 315Hz
(-) | quase nenhum baixo - em média 25.3% menor que a mediana
(±) | a linearidade dos graves é média (11% delta para a frequência anterior)
Médios 400 - 2.000 Hz
(±) | médios mais altos - em média 5.3% maior que a mediana
(+) | médios são lineares (5.5% delta para frequência anterior)
Altos 2 - 16 kHz
(±) | máximos mais altos - em média 10.8% maior que a mediana
(+) | os máximos são lineares (2.1% delta da frequência anterior)
Geral 100 - 16.000 Hz
(±) | a linearidade do som geral é média (27.4% diferença em relação à mediana)
Comparado com a mesma classe
» 71% de todos os dispositivos testados nesta classe foram melhores, 5% semelhantes, 23% piores
» O melhor teve um delta de 11%, a média foi 34%, o pior foi 134%
Comparado com todos os dispositivos testados
» 84% de todos os dispositivos testados foram melhores, 4% semelhantes, 13% piores
» O melhor teve um delta de 4%, a média foi 23%, o pior foi 134%
Huawei Y6 2017 análise de áudio
(+) | os alto-falantes podem tocar relativamente alto (###valor### dB)
Graves 100 - 315Hz
(-) | quase nenhum baixo - em média 29.6% menor que a mediana
(±) | a linearidade dos graves é média (12.3% delta para a frequência anterior)
Médios 400 - 2.000 Hz
(±) | médios reduzidos - em média 5.8% menor que a mediana
(+) | médios são lineares (6.8% delta para frequência anterior)
Altos 2 - 16 kHz
(±) | máximos mais altos - em média 7.2% maior que a mediana
(+) | os máximos são lineares (4.4% delta da frequência anterior)
Geral 100 - 16.000 Hz
(±) | a linearidade do som geral é média (26.6% diferença em relação à mediana)
Comparado com a mesma classe
» 69% de todos os dispositivos testados nesta classe foram melhores, 5% semelhantes, 26% piores
» O melhor teve um delta de 11%, a média foi 34%, o pior foi 134%
Comparado com todos os dispositivos testados
» 82% de todos os dispositivos testados foram melhores, 3% semelhantes, 15% piores
» O melhor teve um delta de 4%, a média foi 23%, o pior foi 134%
| desligado | |
| Ocioso | |
| Carga |
|
Key:
min: | |
| Huawei Y6 2018 3000 mAh | Nokia 2 4100 mAh | Motorola Moto G5s 3000 mAh | BQ Aquaris VS 3100 mAh | Média Qualcomm Snapdragon 425 (MSM8917) | Média da turma Smartphone | |
|---|---|---|---|---|---|---|
| Power Consumption | 46% | 33% | 41% | 21% | 8% | |
| Idle Minimum * (Watt) | 1.7 | 0.55 68% | 0.67 61% | 0.61 64% | 1.113 ? 35% | 0.887 ? 48% |
| Idle Average * (Watt) | 2.5 | 1.02 59% | 1.4 44% | 1.7 32% | 2.19 ? 12% | 1.485 ? 41% |
| Idle Maximum * (Watt) | 3.2 | 1.09 66% | 1.52 52% | 1.71 47% | 2.55 ? 20% | 1.672 ? 48% |
| Load Average * (Watt) | 5.2 | 4.48 14% | 4.56 12% | 3.02 42% | 4.32 ? 17% | 6.76 ? -30% |
| Load Maximum * (Watt) | 6.8 | 5.32 22% | 7.05 -4% | 5.31 22% | 5.5 ? 19% | 11.2 ? -65% |
* ... menor é melhor
| Huawei Y6 2018 3000 mAh | Nokia 2 4100 mAh | Motorola Moto G5s 3000 mAh | BQ Aquaris VS 3100 mAh | Huawei Y6 2017 3000 mAh | |
|---|---|---|---|---|---|
| Duração da bateria | 31% | -14% | 7% | 5% | |
| Reader / Idle (h) | 22.2 | 20.6 -7% | 25.4 14% | ||
| H.264 (h) | 11.7 | 10.8 -8% | 11.6 -1% | ||
| WiFi v1.3 (h) | 10.7 | 14 31% | 8.6 -20% | 11.4 7% | 10.9 2% |
| Load (h) | 4.7 | 3.8 -19% | 5 6% |
Pro
Contra
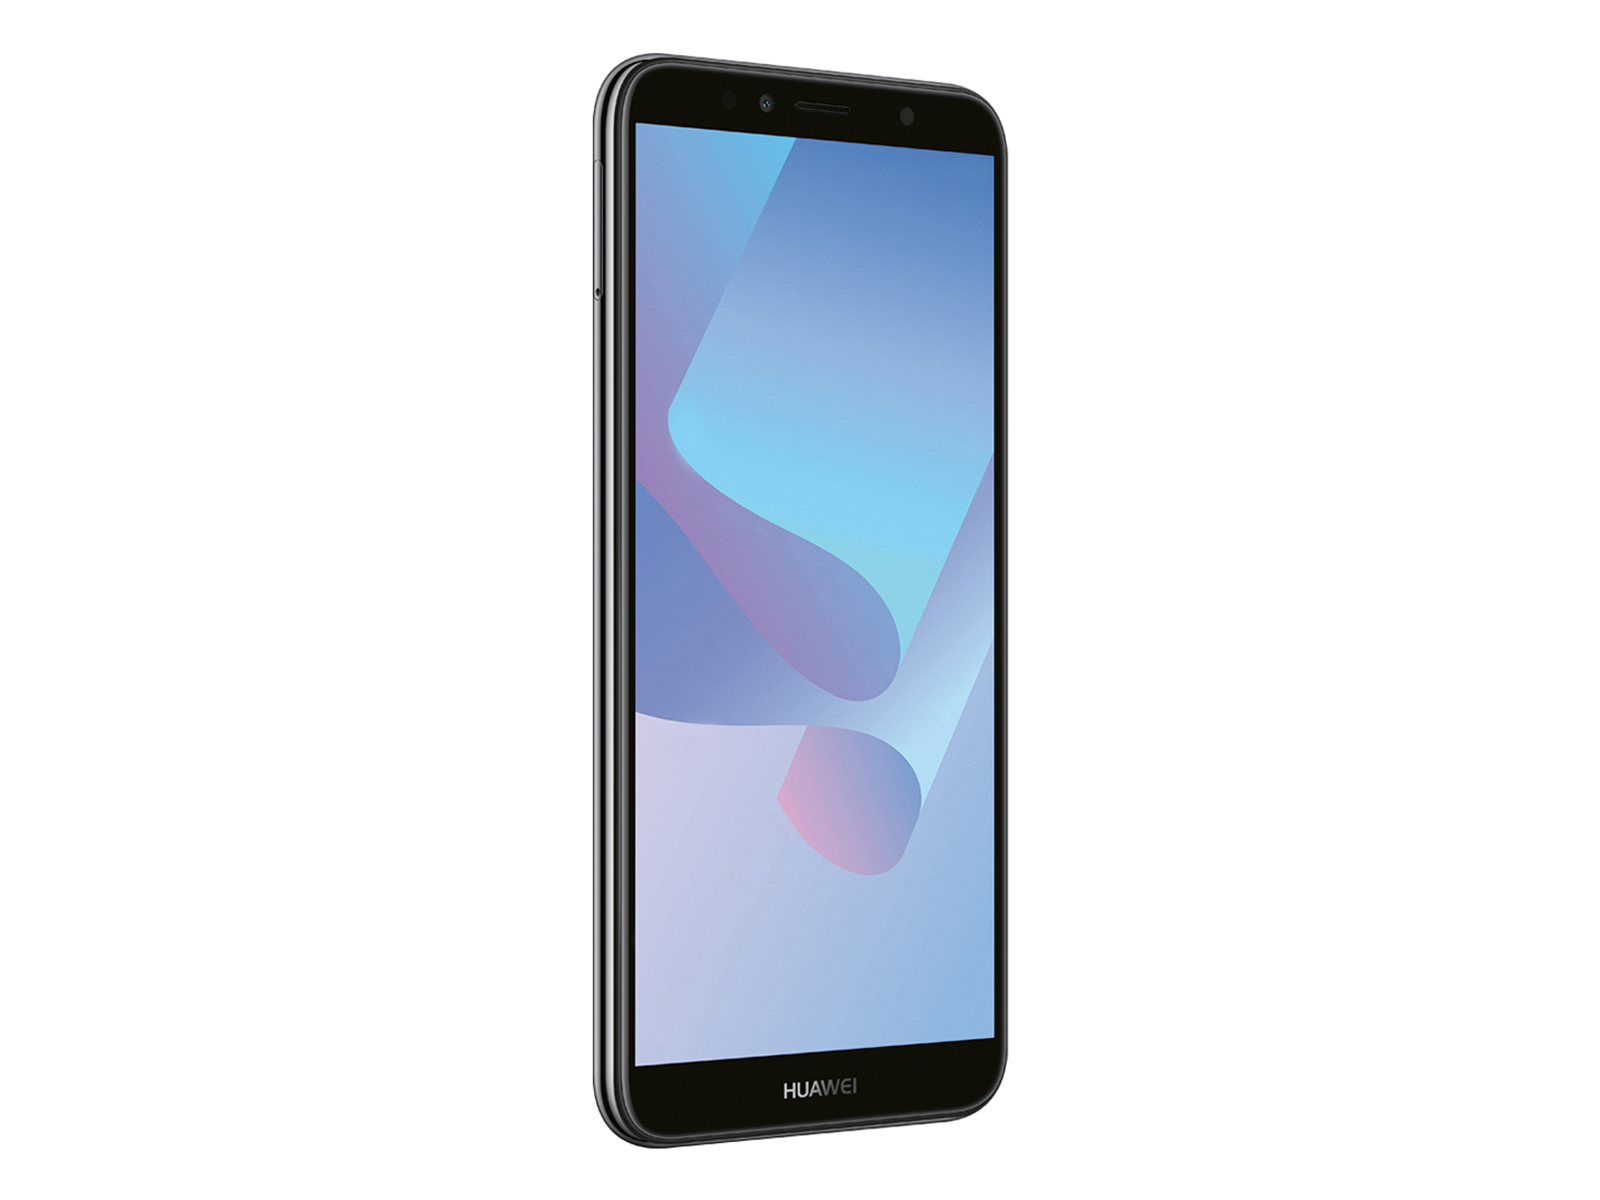
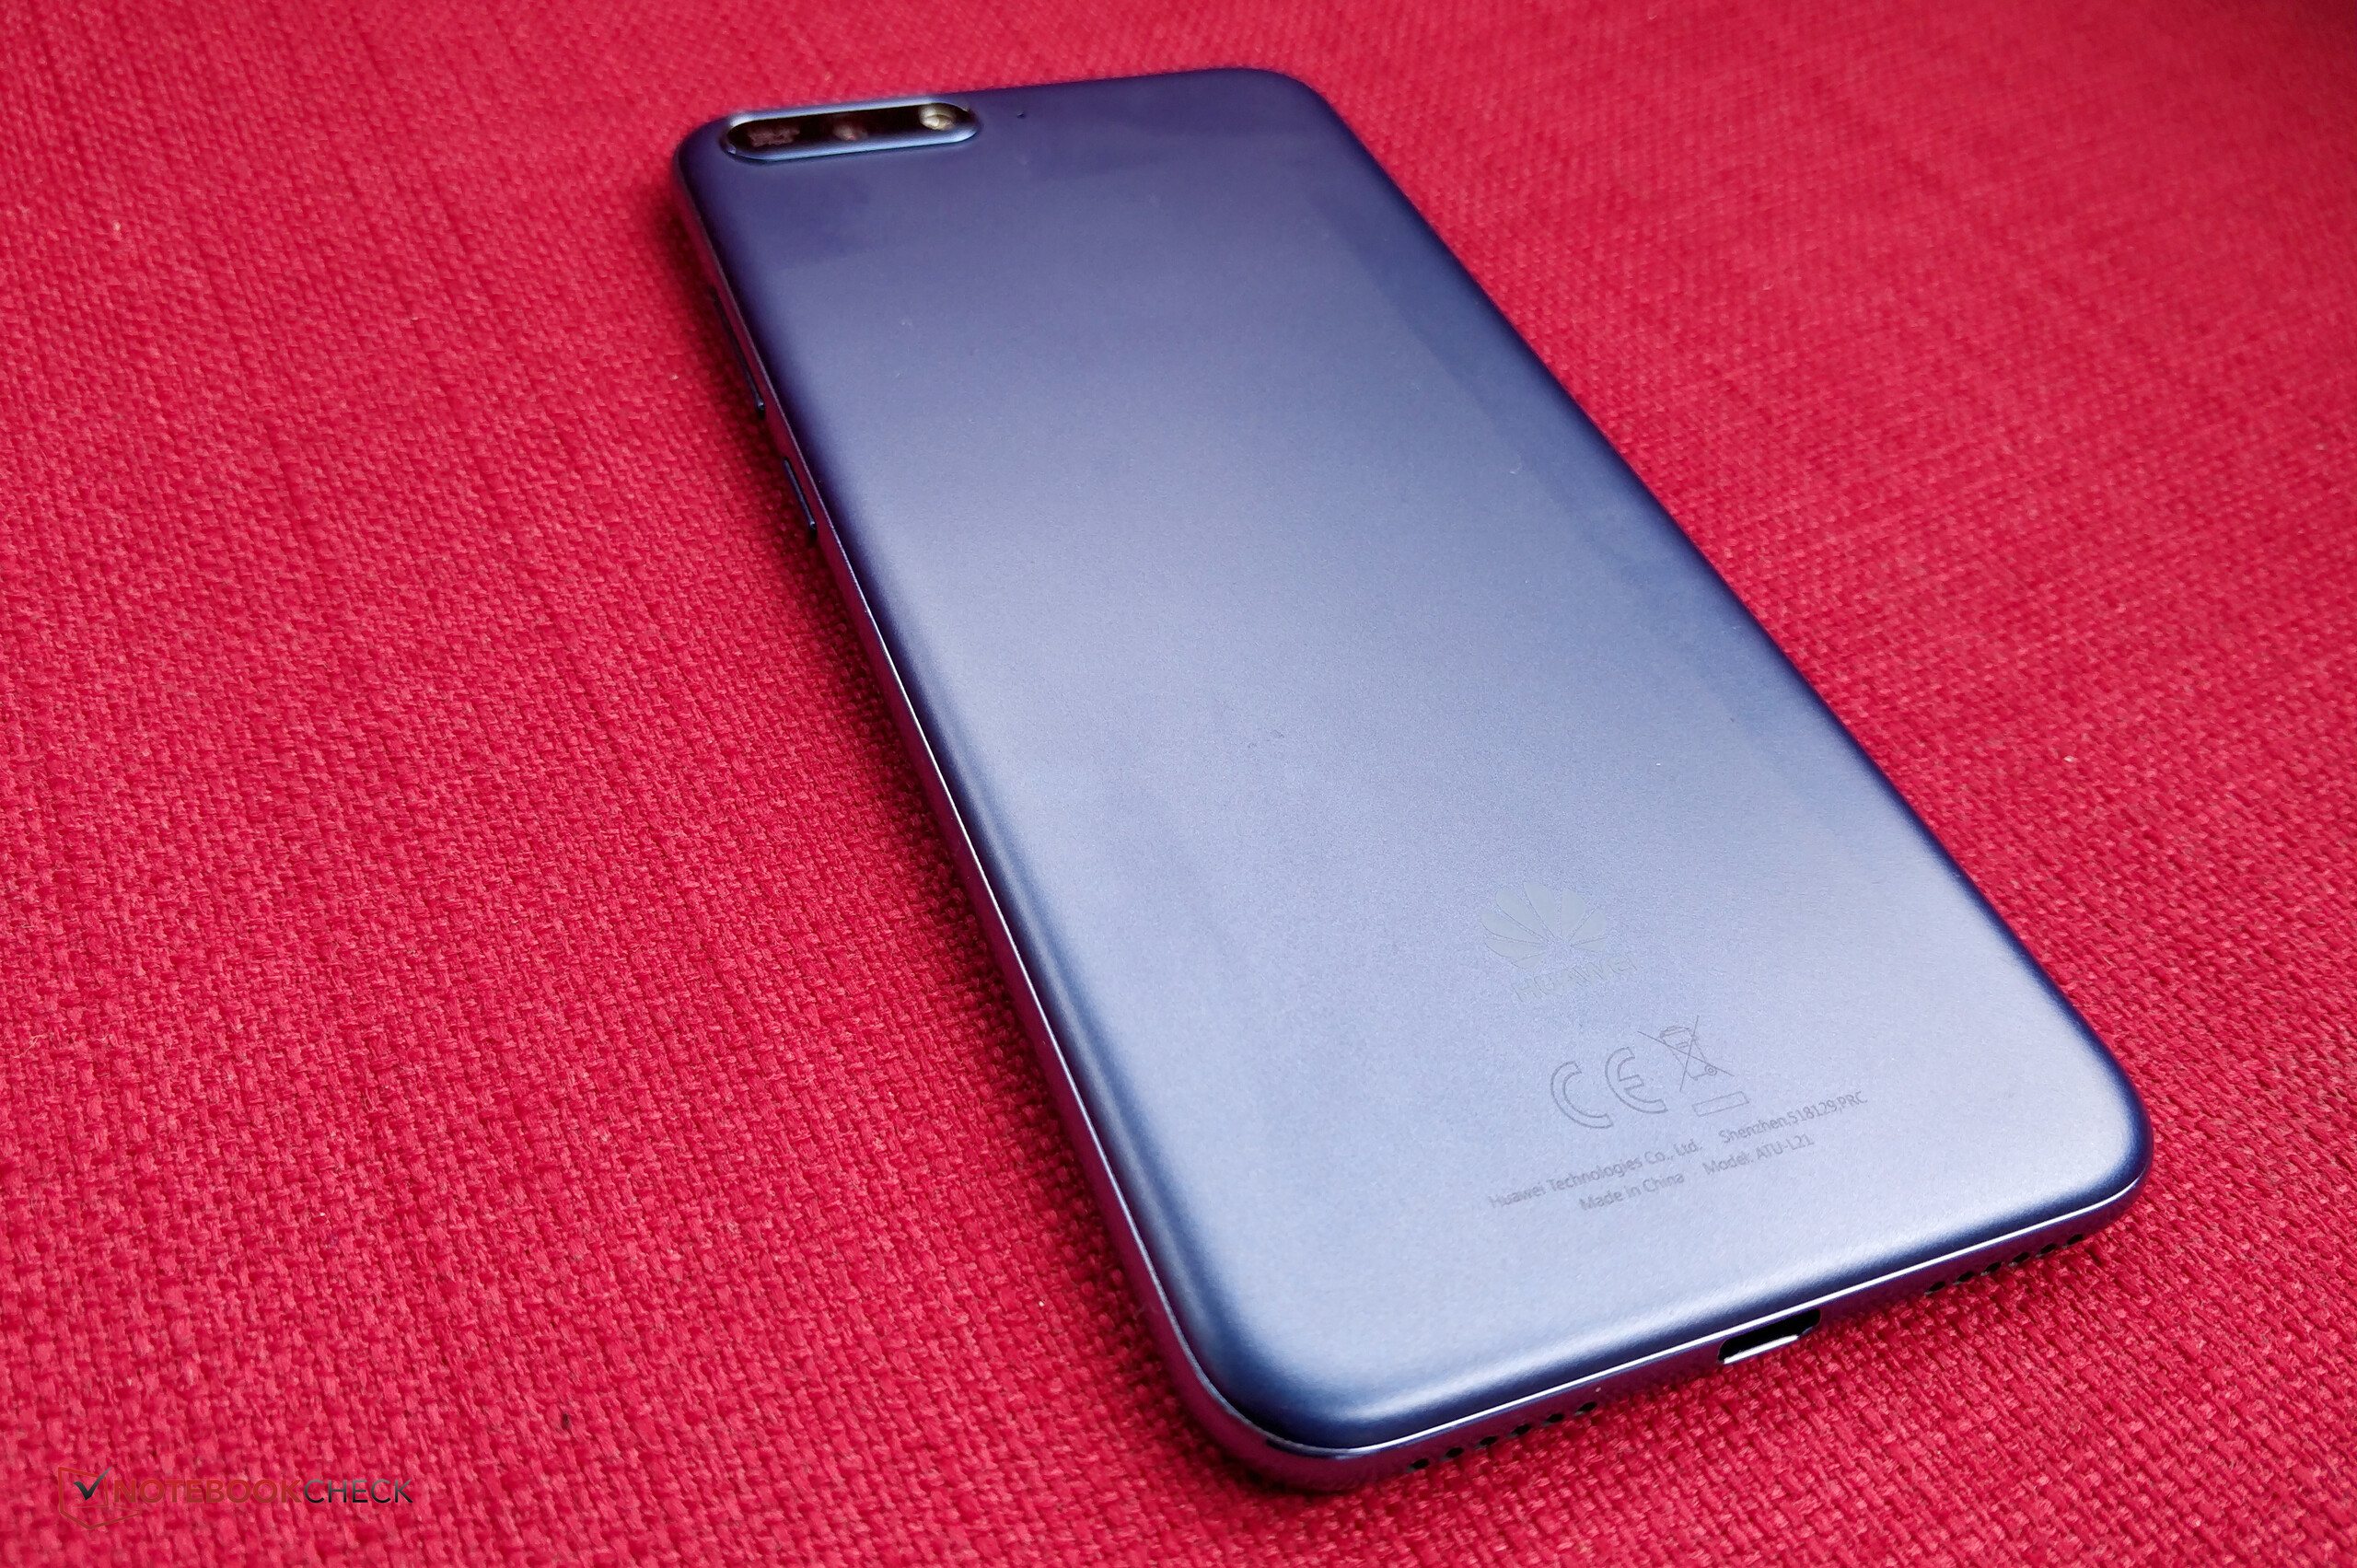
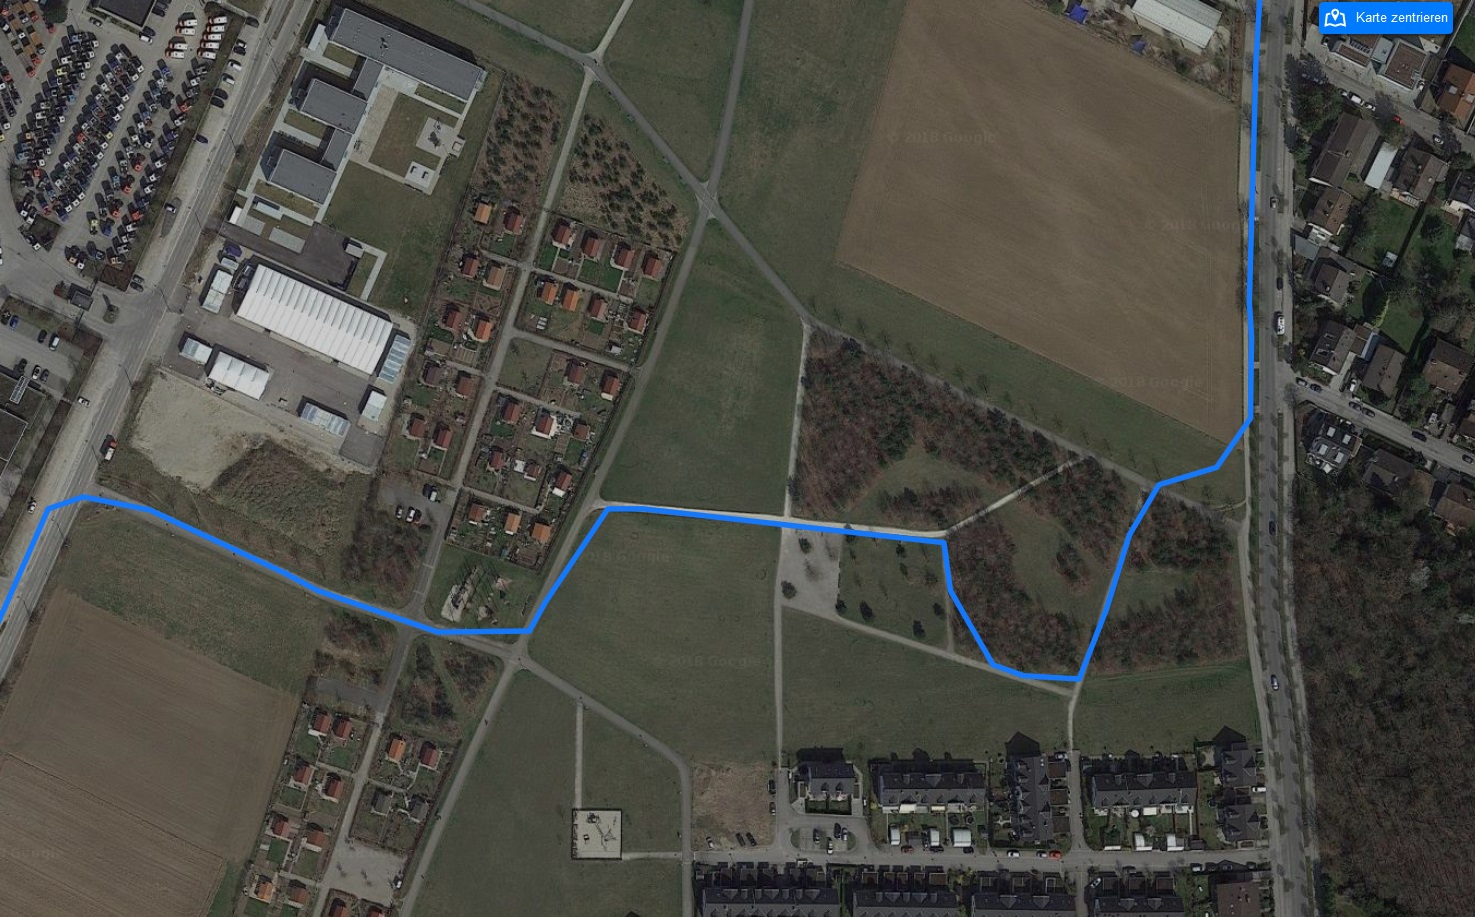
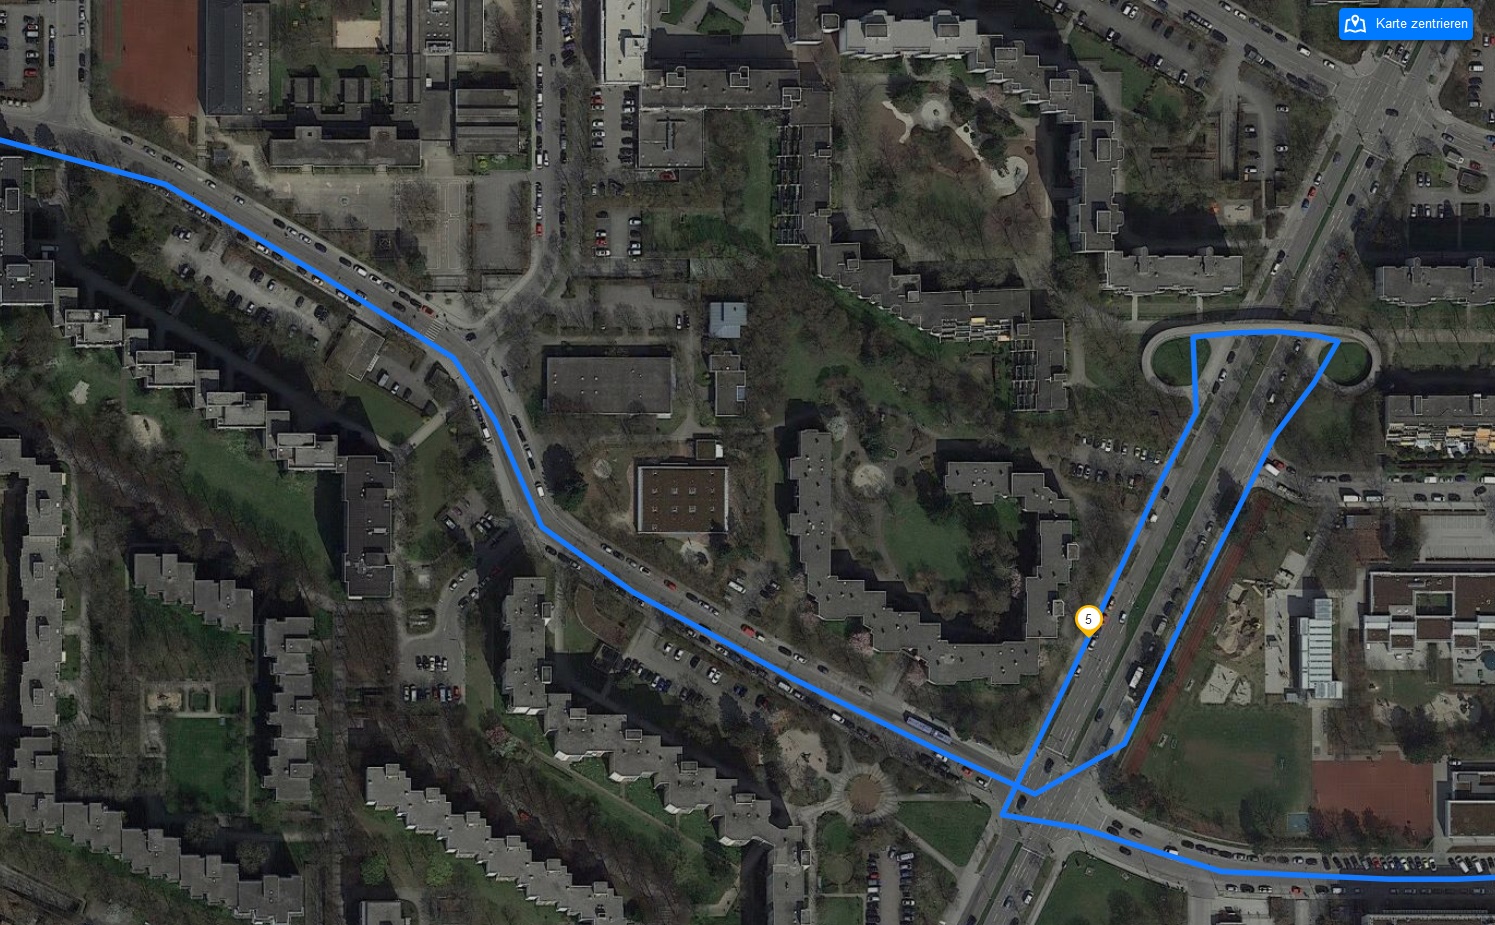
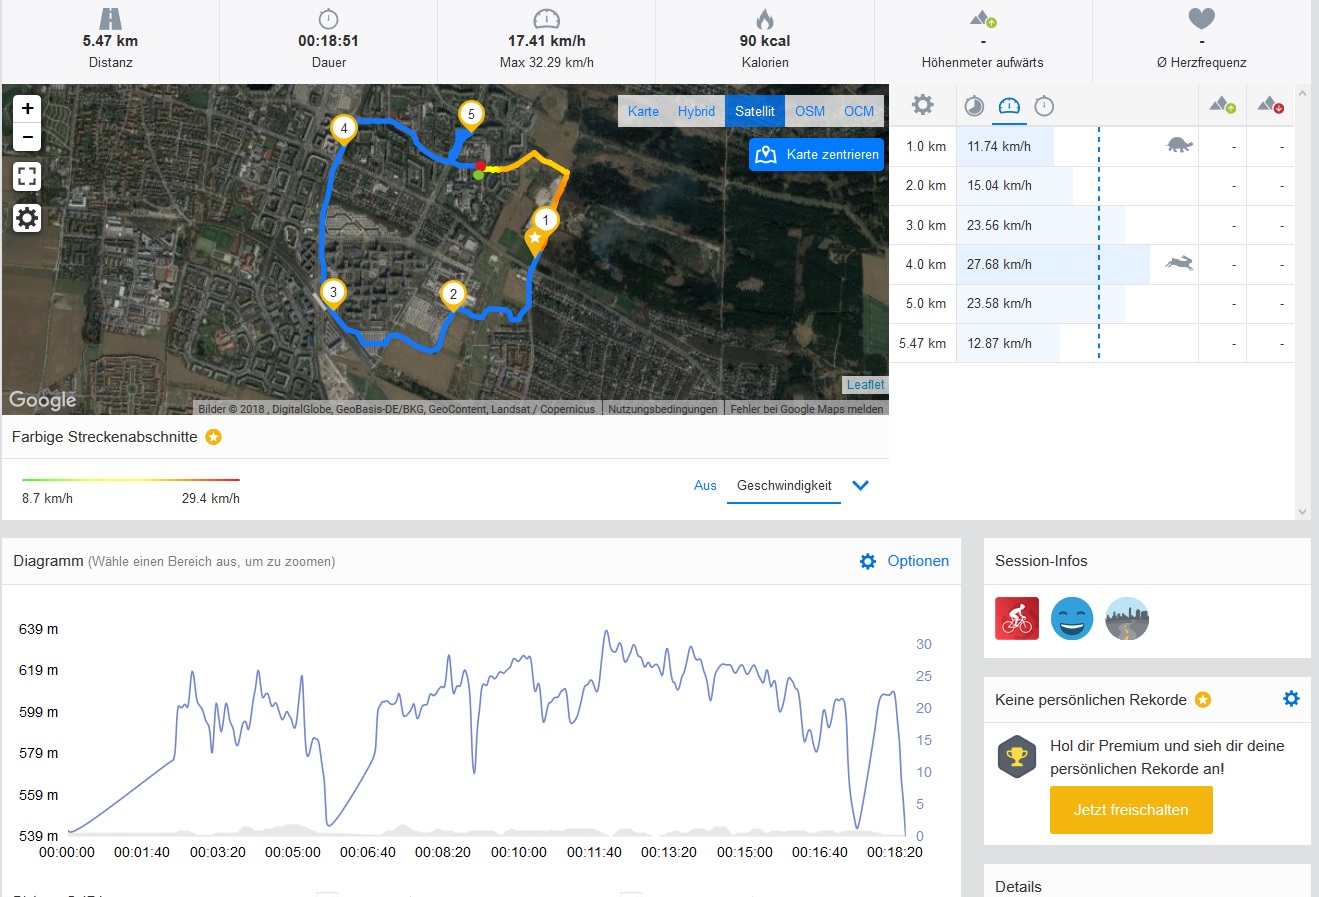
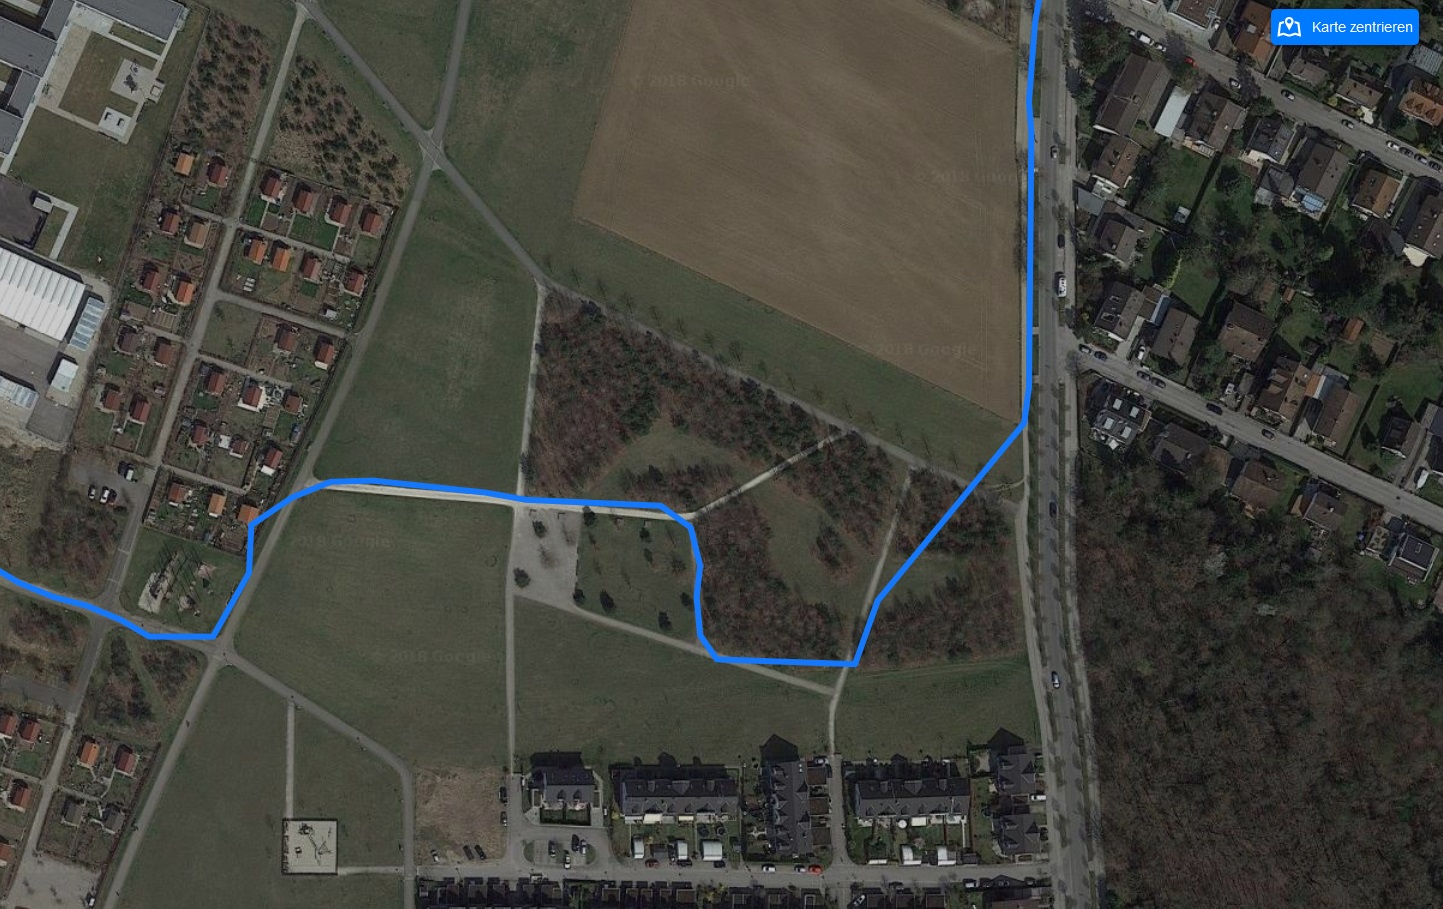
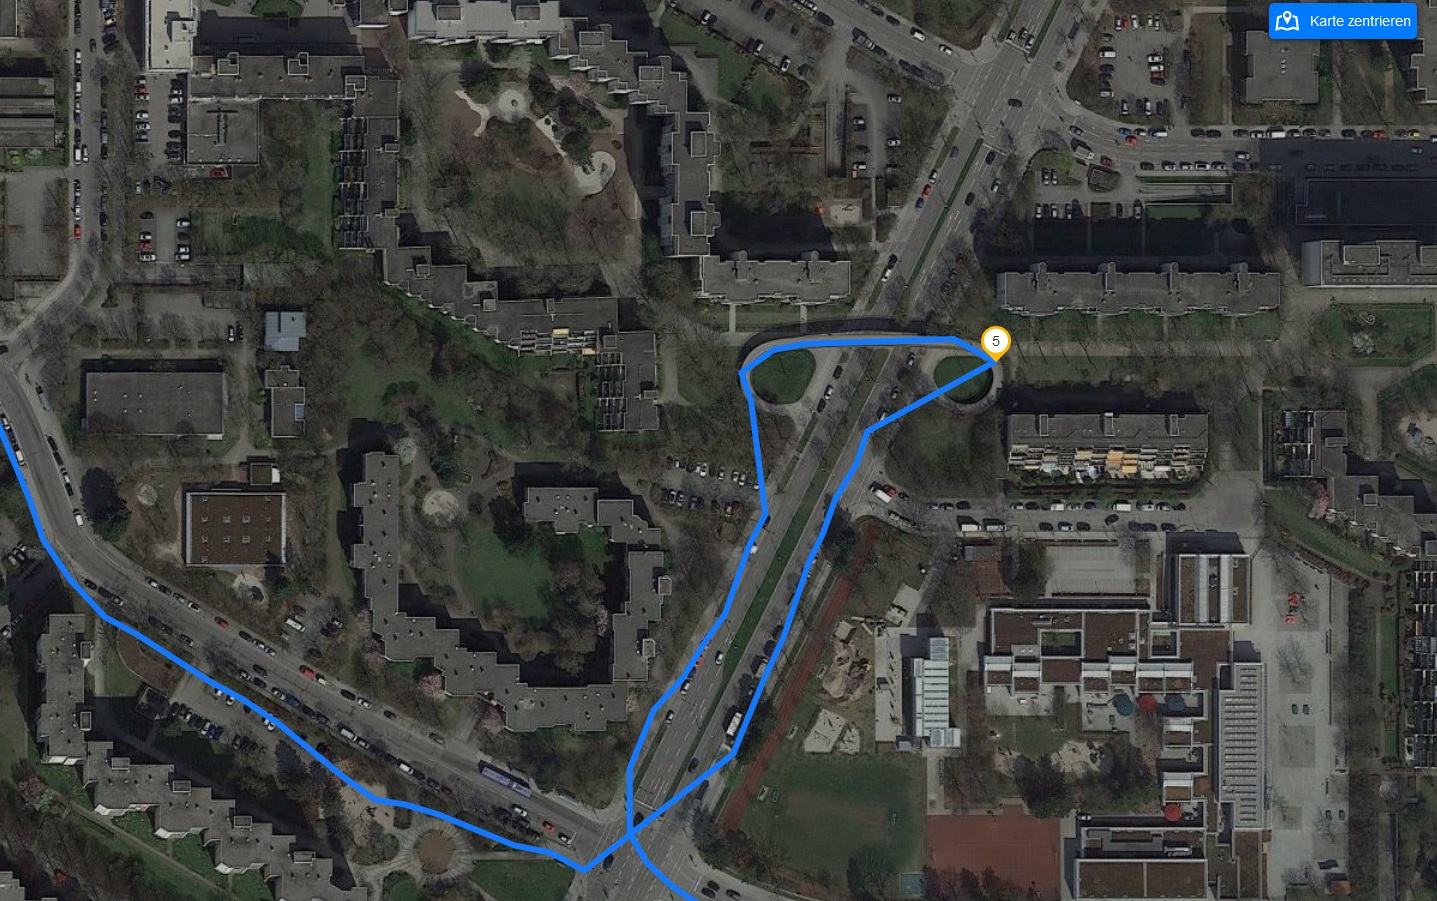
O Huawei Y6 2018 é um bom pacote a um preço acessível. Embora você poderia gastar mais dinheiro em outros dispositivos, eles não terão necessariamente mais recursos do que o Y6 2018 oferece. O Y6 2018 oferece bom desempenho pelo dinheiro. A tela é relativamente brilhante e tem uma boa taxa de contraste, enquanto o GPS é preciso o suficiente para usar o Google Maps. As câmeras também tiram fotos aceitáveis. Da mesma forma, os alto-falantes soam bem e o dispositivo permanece mais frio sob uso intenso.
Naturalmente, existem algumas desvantagens com um dispositivo de menos de €150: não há scanner de digitais ou bússola, o consumo de energia é alto e ocorrem engasgos ocasionais que prejudicam a experiência do usuário.
O Huawei Y6 2018 é uma boa opção para quem quer poupar algum dinheiro. No entanto, não espere milagres.
Embora o preço limite o elogio que podemos dar, o Y6 2018 ainda recebe uma recomendação nossa. Simplesmente, o Huawei Y6 2018 oferece bom desempenho e valor pelo dinheiro.
Huawei Y6 2018
- 05/17/2018 v6 (old)
Florian Wimmer
Price comparison
