Breve Análise do Subportátil ASUS ZenBook UX3430UN (i5-8250U, MX150, 256 GB SSD)

| SD Card Reader | |
| average JPG Copy Test (av. of 3 runs) | |
| Dell XPS 13 9370 FHD i5 (Toshiba Exceria Pro M501 64 GB UHS-II) | |
| Média da turma Subnotebook (23.7 - 188, n=9, últimos 2 anos) | |
| Asus Zenbook UX3430UN-GV174T (Toshiba Exceria Pro SDXC 64 GB UHS-II) | |
| Asus Zenbook UX3430UQ-GV012T (Toshiba Exceria Pro SDXC 64 GB UHS-II) | |
| maximum AS SSD Seq Read Test (1GB) | |
| Dell XPS 13 9370 FHD i5 (Toshiba Exceria Pro M501 64 GB UHS-II) | |
| Média da turma Subnotebook (24.9 - 195, n=8, últimos 2 anos) | |
| Asus Zenbook UX3430UQ-GV012T | |
| Asus Zenbook UX3430UN-GV174T (Toshiba Exceria Pro SDXC 64 GB UHS-II) | |
| Networking | |
| iperf3 transmit AX12 | |
| Asus Zenbook UX3430UQ-GV012T | |
| Asus Zenbook UX3430UN-GV174T | |
| Huawei MateBook X | |
| Dell XPS 13 9370 FHD i5 | |
| iperf3 receive AX12 | |
| Dell XPS 13 9370 FHD i5 | |
| Asus Zenbook UX3430UN-GV174T | |
| Huawei MateBook X | |
| Asus Zenbook UX3430UQ-GV012T | |
| |||||||||||||||||||||||||
iluminação: 76 %
iluminação com acumulador: 377 cd/m²
Contraste: 943:1 (Preto: 0.4 cd/m²)
ΔE ColorChecker Calman: 3.33 | ∀{0.5-29.43 Ø4.71}
calibrated: 3.5
ΔE Greyscale Calman: 4.89 | ∀{0.09-98 Ø4.96}
98% sRGB (Argyll 1.6.3 3D)
62% AdobeRGB 1998 (Argyll 1.6.3 3D)
67.8% AdobeRGB 1998 (Argyll 3D)
97.4% sRGB (Argyll 3D)
65.6% Display P3 (Argyll 3D)
Gamma: 2.37
CCT: 7620 K
| Asus Zenbook UX3430UN-GV174T Chi Mei CMN14D2 / N140HCE-EN1, , 1920x1080, 14" | Dell XPS 13 9370 FHD i5 SHP1484, , 1920x1080, 13.3" | Huawei MateBook X Chi Mei CMN8201 / P130ZDZ-EF1, , 2160x1440, 13.3" | Asus Zenbook UX3430UQ-GV012T Chi Mei CMN14D2 / N140HCE-EN1, , 1920x1080, 14" | |
|---|---|---|---|---|
| Display | 2% | -1% | 2% | |
| Display P3 Coverage (%) | 65.6 | 68.9 5% | 65.8 0% | 67.1 2% |
| sRGB Coverage (%) | 97.4 | 96.6 -1% | 96.2 -1% | 98.7 1% |
| AdobeRGB 1998 Coverage (%) | 67.8 | 69.6 3% | 66.8 -1% | 69.3 2% |
| Response Times | -95% | -3% | -23% | |
| Response Time Grey 50% / Grey 80% * (ms) | 30 ? | 62.4 ? -108% | 33 ? -10% | 40 ? -33% |
| Response Time Black / White * (ms) | 25 ? | 45.6 ? -82% | 24 ? 4% | 28 ? -12% |
| PWM Frequency (Hz) | 1008 ? | |||
| Screen | 16% | 21% | 9% | |
| Brightness middle (cd/m²) | 377 | 428 14% | 408 8% | 353 -6% |
| Brightness (cd/m²) | 339 | 405 19% | 395 17% | 366 8% |
| Brightness Distribution (%) | 76 | 87 14% | 88 16% | 88 16% |
| Black Level * (cd/m²) | 0.4 | 0.26 35% | 0.45 -13% | 0.34 15% |
| Contrast (:1) | 943 | 1646 75% | 907 -4% | 1038 10% |
| Colorchecker dE 2000 * | 3.33 | 3.8 -14% | 1.55 53% | 2.88 14% |
| Colorchecker dE 2000 max. * | 8.02 | 7.2 10% | 2.19 73% | 6.61 18% |
| Colorchecker dE 2000 calibrated * | 3.5 | |||
| Greyscale dE 2000 * | 4.89 | 4.4 10% | 1.91 61% | 4.24 13% |
| Gamma | 2.37 93% | 2.21 100% | 2.34 94% | 2.38 92% |
| CCT | 7620 85% | 7067 92% | 6491 100% | 7380 88% |
| Color Space (Percent of AdobeRGB 1998) (%) | 62 | 62.8 1% | 61 -2% | 64 3% |
| Color Space (Percent of sRGB) (%) | 98 | 96.4 -2% | 96 -2% | 99 1% |
| Média Total (Programa/Configurações) | -26% /
-1% | 6% /
13% | -4% /
3% |
* ... menor é melhor
Exibir tempos de resposta
| ↔ Tempo de resposta preto para branco | ||
|---|---|---|
| 25 ms ... ascensão ↗ e queda ↘ combinadas | ↗ 14 ms ascensão | 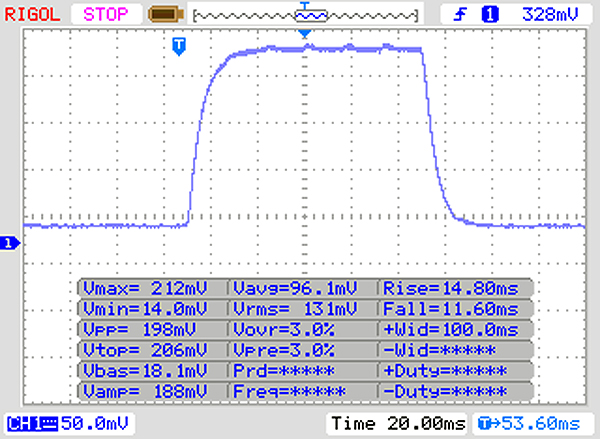 |
| ↘ 11 ms queda | ||
| A tela mostra taxas de resposta relativamente lentas em nossos testes e pode ser muito lenta para os jogadores. Em comparação, todos os dispositivos testados variam de 0.1 (mínimo) a 240 (máximo) ms. » 59 % de todos os dispositivos são melhores. Isso significa que o tempo de resposta medido é pior que a média de todos os dispositivos testados (19.8 ms). | ||
| ↔ Tempo de resposta 50% cinza a 80% cinza | ||
| 30 ms ... ascensão ↗ e queda ↘ combinadas | ↗ 14 ms ascensão | 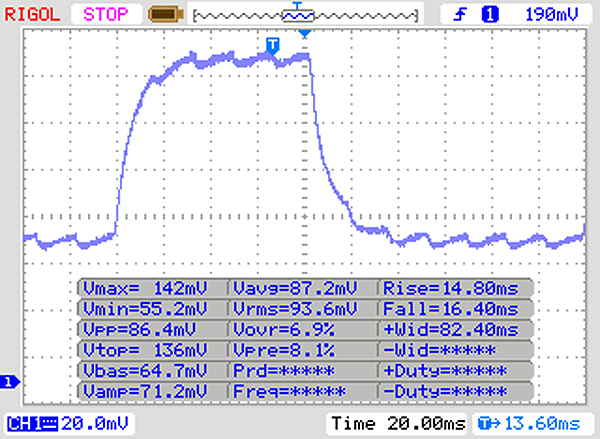 |
| ↘ 16 ms queda | ||
| A tela mostra taxas de resposta lentas em nossos testes e será insatisfatória para os jogadores. Em comparação, todos os dispositivos testados variam de 0.165 (mínimo) a 636 (máximo) ms. » 40 % de todos os dispositivos são melhores. Isso significa que o tempo de resposta medido é semelhante à média de todos os dispositivos testados (31 ms). | ||
Cintilação da tela / PWM (modulação por largura de pulso)
| Tela tremeluzindo / PWM não detectado |  | ||
[pwm_comparison] Em comparação: 52 % de todos os dispositivos testados não usam PWM para escurecer a tela. Se PWM foi detectado, uma média de 7754 (mínimo: 5 - máximo: 343500) Hz foi medida. | |||
| PCMark 8 Home Score Accelerated v2 | 3672 pontos | |
| PCMark 8 Work Score Accelerated v2 | 4613 pontos | |
| PCMark 10 Score | 3569 pontos | |
Ajuda | ||
| Asus Zenbook UX3430UN-GV174T SK Hynix HFS256G39TND-N210A | Dell XPS 13 9370 FHD i5 Toshiba XG5 KXG50ZNV256G | Huawei MateBook X LITEON CB1-SD256 | Asus Zenbook UX3430UQ-GV012T SanDisk SD8SN8U512G1002 | Média SK Hynix HFS256G39TND-N210A | |
|---|---|---|---|---|---|
| CrystalDiskMark 3.0 | 92% | 37% | 18% | 0% | |
| Read Seq (MB/s) | 480.3 | 1875 290% | 741 54% | 500 4% | 482 ? 0% |
| Write Seq (MB/s) | 263.9 | 352.7 34% | 461.2 75% | 457.4 73% | 246 ? -7% |
| Read 512 (MB/s) | 266.9 | 840 215% | 504 89% | 345.6 29% | 328 ? 23% |
| Write 512 (MB/s) | 263.2 | 353.9 34% | 310.3 18% | 415 58% | 243 ? -8% |
| Read 4k (MB/s) | 29.58 | 34.18 16% | 29.48 0% | 28.34 -4% | 28 ? -5% |
| Write 4k (MB/s) | 68.4 | 127.5 86% | 68.1 0% | 56.8 -17% | 74.8 ? 9% |
| Read 4k QD32 (MB/s) | 322.2 | 381.8 18% | 498.9 55% | 311.3 -3% | 323 ? 0% |
| Write 4k QD32 (MB/s) | 243.3 | 339.9 40% | 257.5 6% | 251.1 3% | 220 ? -10% |

| 3DMark 11 Performance | 4459 pontos | |
| 3DMark Cloud Gate Standard Score | 13630 pontos | |
| 3DMark Fire Strike Score | 3081 pontos | |
Ajuda | ||
| baixo | média | alto | ultra | |
|---|---|---|---|---|
| Rainbow Six Siege (2015) | 69.7 | 37.9 | 18.3 | |
| For Honor (2017) | 73.3 | 28.6 | ||
| Far Cry 5 (2018) | 37 | 15 |
Barulho
| Ocioso |
| 30 / 30 / 33.1 dB |
| Carga |
| 37.6 / 37.6 dB |
 | ||
30 dB silencioso 40 dB(A) audível 50 dB(A) ruidosamente alto |
||
min: | ||
(±) A temperatura máxima no lado superior é 44.6 °C / 112 F, em comparação com a média de 35.9 °C / 97 F , variando de 21.4 a 59 °C para a classe Subnotebook.
(-) A parte inferior aquece até um máximo de 46.8 °C / 116 F, em comparação com a média de 39.2 °C / 103 F
(+) Em uso inativo, a temperatura média para o lado superior é 28.7 °C / 84 F, em comparação com a média do dispositivo de 30.8 °C / ### class_avg_f### F.
(+) Os apoios para as mãos e o touchpad estão atingindo a temperatura máxima da pele (32.3 °C / 90.1 F) e, portanto, não estão quentes.
(-) A temperatura média da área do apoio para as mãos de dispositivos semelhantes foi 28.2 °C / 82.8 F (-4.1 °C / -7.3 F).
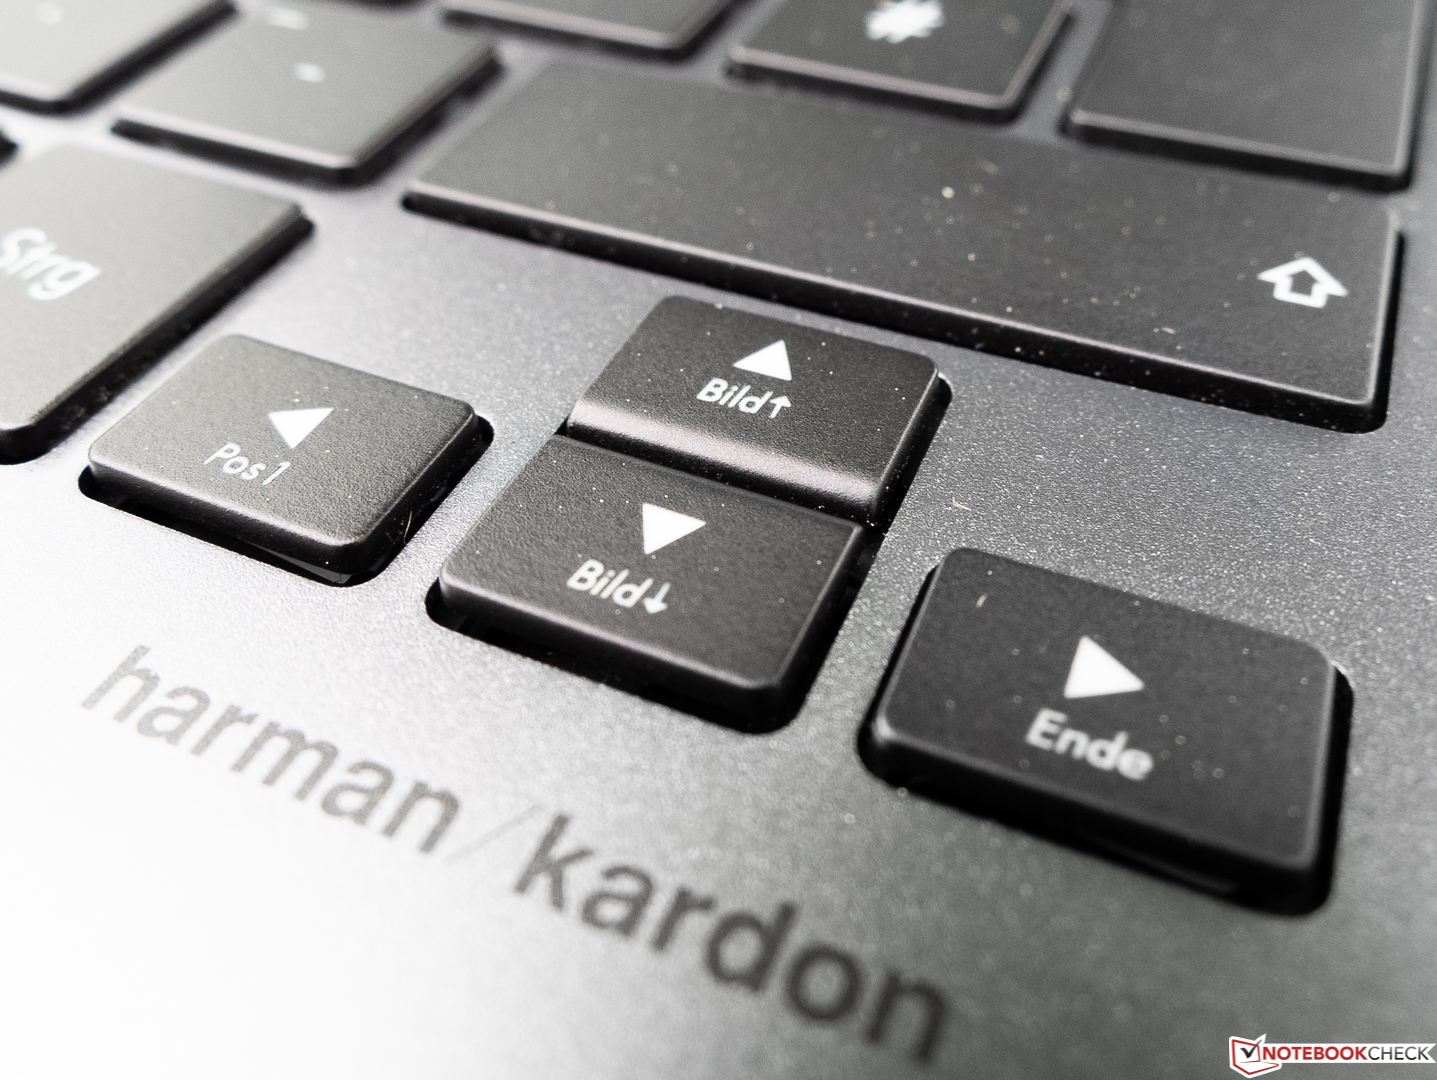
Asus Zenbook UX3430UN-GV174T análise de áudio
(-) | alto-falantes não muito altos (###valor### dB)
Graves 100 - 315Hz
(±) | graves reduzidos - em média 12.8% menor que a mediana
(-) | graves não são lineares (15.3% delta para frequência anterior)
Médios 400 - 2.000 Hz
(+) | médios equilibrados - apenas 1.7% longe da mediana
(+) | médios são lineares (5.1% delta para frequência anterior)
Altos 2 - 16 kHz
(±) | máximos mais altos - em média 5.5% maior que a mediana
(+) | os máximos são lineares (6.7% delta da frequência anterior)
Geral 100 - 16.000 Hz
(±) | a linearidade do som geral é média (16.2% diferença em relação à mediana)
Comparado com a mesma classe
» 40% de todos os dispositivos testados nesta classe foram melhores, 4% semelhantes, 56% piores
» O melhor teve um delta de 5%, a média foi 18%, o pior foi 53%
Comparado com todos os dispositivos testados
» 26% de todos os dispositivos testados foram melhores, 6% semelhantes, 68% piores
» O melhor teve um delta de 4%, a média foi 23%, o pior foi 134%
Dell XPS 13 9370 FHD i5 análise de áudio
(+) | os alto-falantes podem tocar relativamente alto (###valor### dB)
Graves 100 - 315Hz
(-) | quase nenhum baixo - em média 18.6% menor que a mediana
(±) | a linearidade dos graves é média (11.1% delta para a frequência anterior)
Médios 400 - 2.000 Hz
(±) | médios mais altos - em média 5.3% maior que a mediana
(+) | médios são lineares (3.8% delta para frequência anterior)
Altos 2 - 16 kHz
(+) | agudos equilibrados - apenas 3.9% longe da mediana
(+) | os máximos são lineares (6.4% delta da frequência anterior)
Geral 100 - 16.000 Hz
(±) | a linearidade do som geral é média (18.2% diferença em relação à mediana)
Comparado com a mesma classe
» 52% de todos os dispositivos testados nesta classe foram melhores, 7% semelhantes, 40% piores
» O melhor teve um delta de 5%, a média foi 18%, o pior foi 53%
Comparado com todos os dispositivos testados
» 39% de todos os dispositivos testados foram melhores, 8% semelhantes, 53% piores
» O melhor teve um delta de 4%, a média foi 23%, o pior foi 134%
Huawei MateBook X análise de áudio
(-) | alto-falantes não muito altos (###valor### dB)
Graves 100 - 315Hz
(±) | graves reduzidos - em média 8.3% menor que a mediana
(±) | a linearidade dos graves é média (7.6% delta para a frequência anterior)
Médios 400 - 2.000 Hz
(+) | médios equilibrados - apenas 3.3% longe da mediana
(+) | médios são lineares (6.2% delta para frequência anterior)
Altos 2 - 16 kHz
(+) | agudos equilibrados - apenas 2.6% longe da mediana
(+) | os máximos são lineares (6.6% delta da frequência anterior)
Geral 100 - 16.000 Hz
(+) | o som geral é linear (14.7% diferença em relação à mediana)
Comparado com a mesma classe
» 31% de todos os dispositivos testados nesta classe foram melhores, 5% semelhantes, 64% piores
» O melhor teve um delta de 5%, a média foi 18%, o pior foi 53%
Comparado com todos os dispositivos testados
» 19% de todos os dispositivos testados foram melhores, 4% semelhantes, 77% piores
» O melhor teve um delta de 4%, a média foi 23%, o pior foi 134%
Asus Zenbook UX3430UQ-GV012T análise de áudio
(±) | o volume do alto-falante é médio, mas bom (###valor### dB)
Graves 100 - 315Hz
(-) | quase nenhum baixo - em média 18.9% menor que a mediana
(±) | a linearidade dos graves é média (12.2% delta para a frequência anterior)
Médios 400 - 2.000 Hz
(+) | médios equilibrados - apenas 3.4% longe da mediana
(+) | médios são lineares (6.9% delta para frequência anterior)
Altos 2 - 16 kHz
(+) | agudos equilibrados - apenas 2.7% longe da mediana
(+) | os máximos são lineares (5% delta da frequência anterior)
Geral 100 - 16.000 Hz
(±) | a linearidade do som geral é média (20.4% diferença em relação à mediana)
Comparado com a mesma classe
» 65% de todos os dispositivos testados nesta classe foram melhores, 8% semelhantes, 26% piores
» O melhor teve um delta de 5%, a média foi 18%, o pior foi 53%
Comparado com todos os dispositivos testados
» 54% de todos os dispositivos testados foram melhores, 8% semelhantes, 38% piores
» O melhor teve um delta de 4%, a média foi 23%, o pior foi 134%
| desligado | |
| Ocioso | |
| Carga |
|
Key:
min: | |
| Asus Zenbook UX3430UN-GV174T i5-8250U, GeForce MX150, SK Hynix HFS256G39TND-N210A, IPS, 1920x1080, 14" | Dell XPS 13 9370 FHD i5 i5-8250U, UHD Graphics 620, Toshiba XG5 KXG50ZNV256G, IPS, 1920x1080, 13.3" | Huawei MateBook X i5-7200U, HD Graphics 620, LITEON CB1-SD256, , 2160x1440, 13.3" | Asus Zenbook UX3430UQ-GV012T i7-7500U, GeForce 940MX, SanDisk SD8SN8U512G1002, IPS, 1920x1080, 14" | Média NVIDIA GeForce MX150 | Média da turma Subnotebook | |
|---|---|---|---|---|---|---|
| Power Consumption | 26% | -5% | 26% | -7% | 9% | |
| Idle Minimum * (Watt) | 4.5 | 3.14 30% | 4.6 -2% | 2.6 42% | 4.48 ? -0% | 3.71 ? 18% |
| Idle Average * (Watt) | 7.8 | 5.22 33% | 11 -41% | 5.9 24% | 7.88 ? -1% | 6.54 ? 16% |
| Idle Maximum * (Watt) | 8.1 | 6 26% | 12 -48% | 6.25 23% | 9.76 ? -20% | 7.89 ? 3% |
| Load Average * (Watt) | 52 | 38.5 26% | 39.5 24% | 42 19% | 54.7 ? -5% | 42.1 ? 19% |
| Load Maximum * (Watt) | 59 | 50.4 15% | 34.6 41% | 46 22% | 63.5 ? -8% | 65.1 ? -10% |
* ... menor é melhor
| Asus Zenbook UX3430UN-GV174T i5-8250U, GeForce MX150, 48 Wh | Dell XPS 13 9370 FHD i5 i5-8250U, UHD Graphics 620, 52 Wh | Huawei MateBook X i5-7200U, HD Graphics 620, 40 Wh | Asus Zenbook UX3430UQ-GV012T i7-7500U, GeForce 940MX, 50 Wh | Média da turma Subnotebook | |
|---|---|---|---|---|---|
| Duração da bateria | 28% | -15% | -3% | 48% | |
| Reader / Idle (h) | 22.8 | 23.6 4% | 8.5 -63% | 21.5 -6% | 28.6 ? 25% |
| H.264 (h) | 8.4 | 13.9 65% | 15.3 ? 82% | ||
| WiFi v1.3 (h) | 8.1 | 10.7 32% | 5.6 -31% | 8.8 9% | 14.1 ? 74% |
| Load (h) | 1.8 | 2 11% | 2.7 50% | 1.6 -11% | 1.998 ? 11% |
Pro
Contra
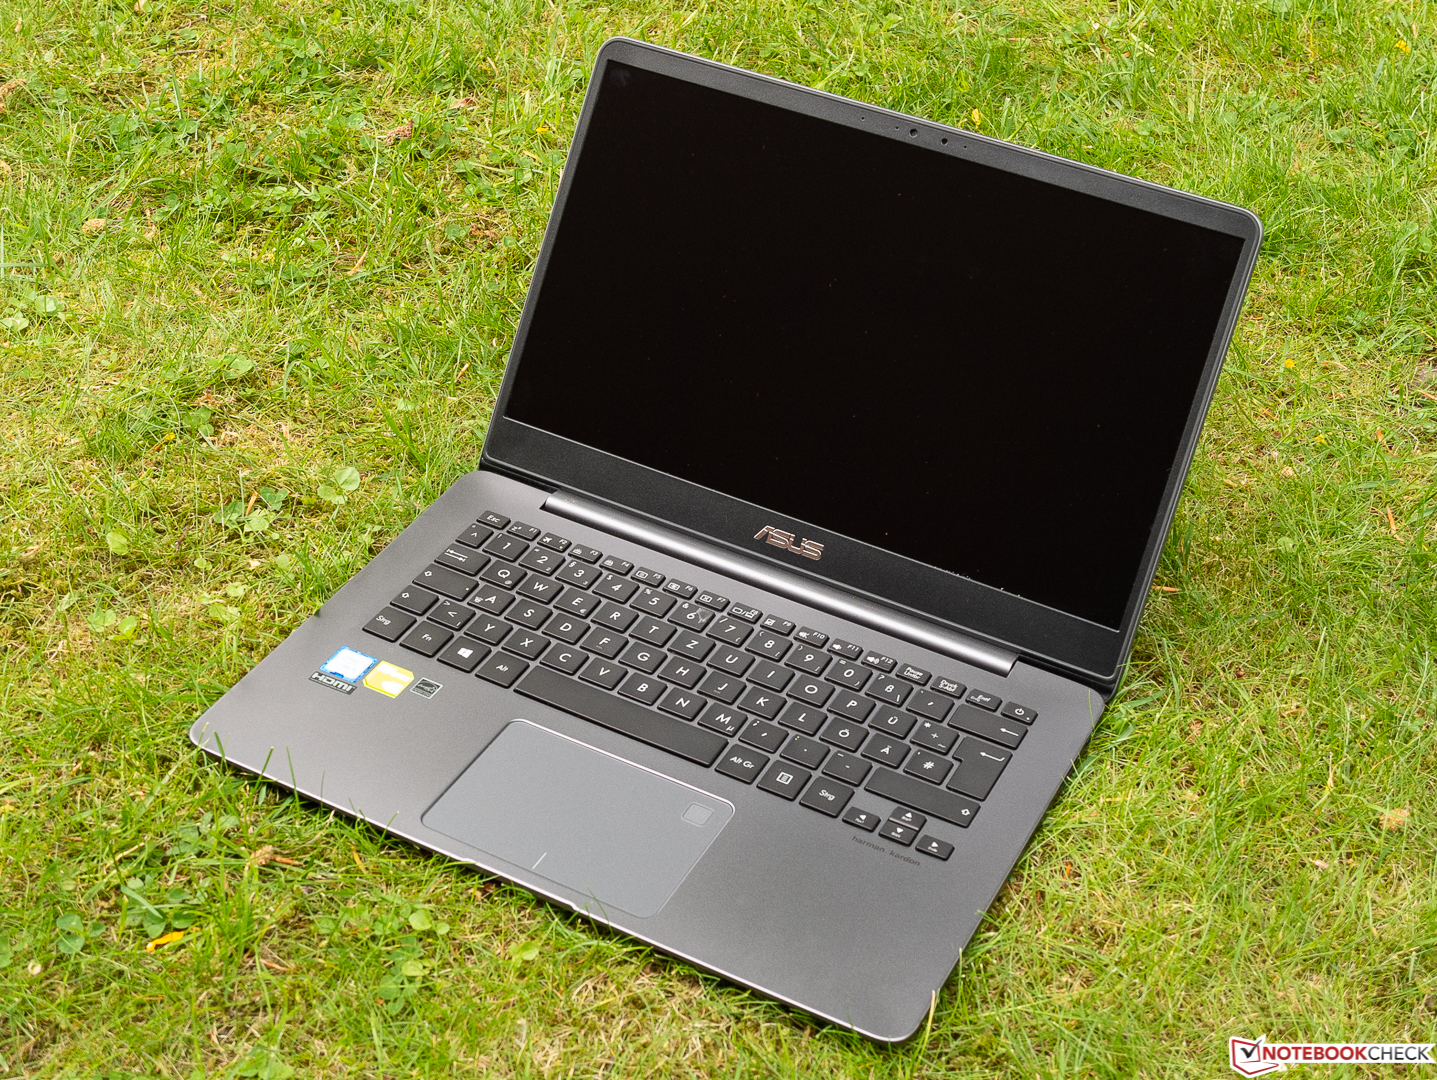
O ASUS ZenBook UX3430UN consegue atingir o equilíbrio entre ser um subportátil de escritório móvel e uma máquina de jogos ocasional com apenas uma pequena redução no desempenho.
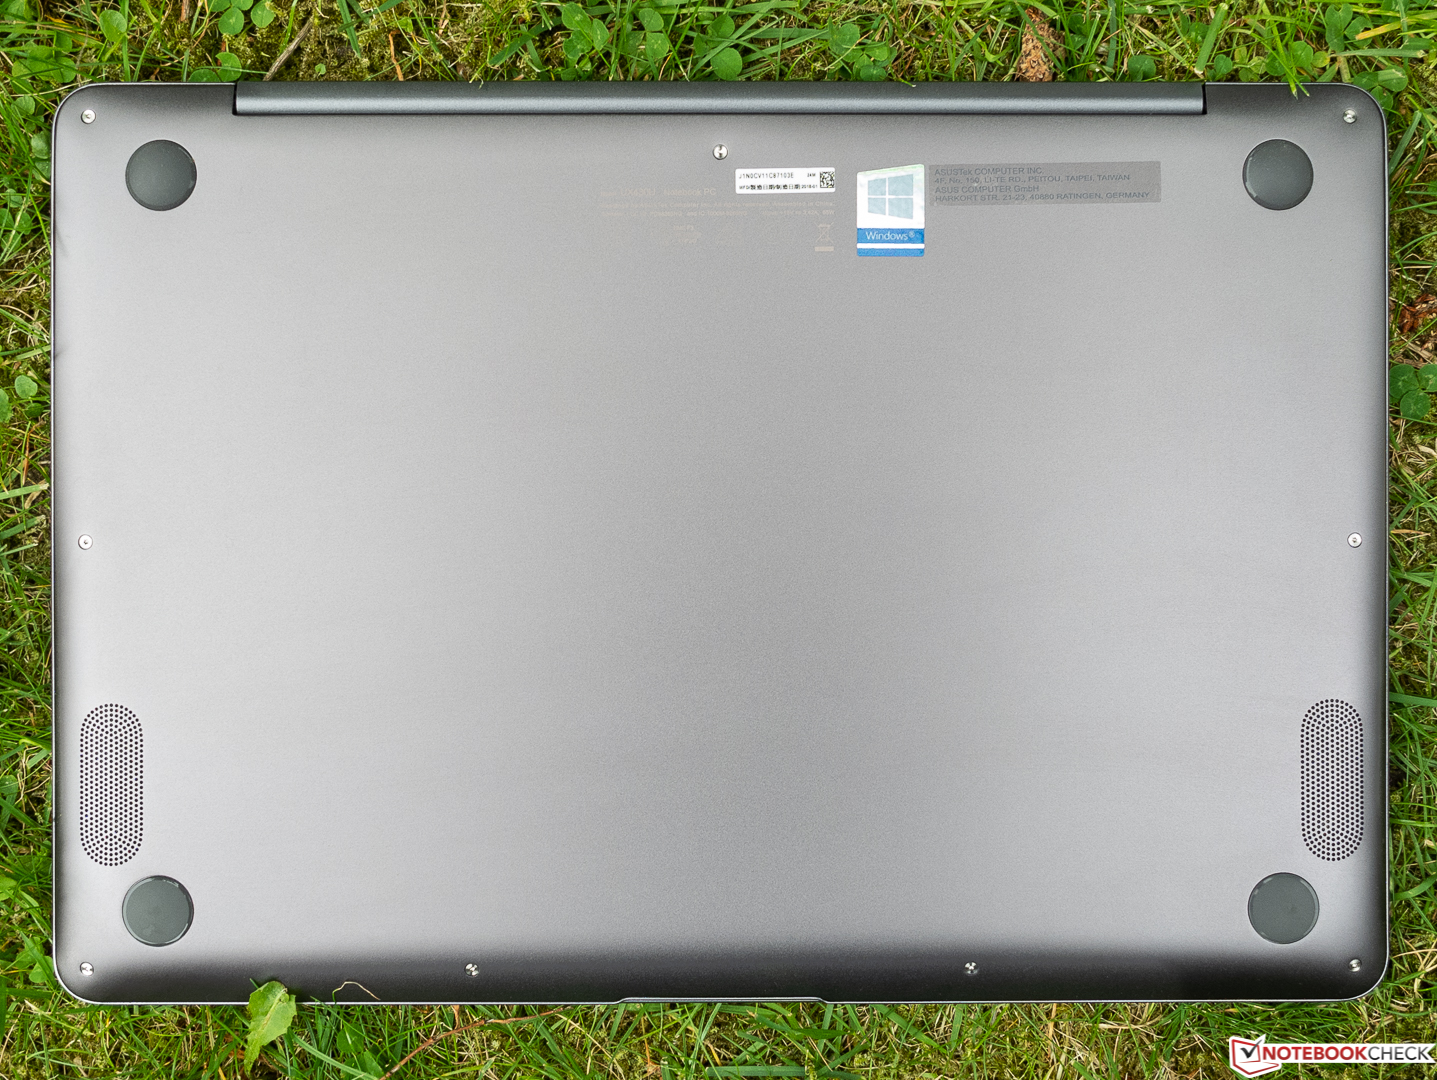
Embora o novo ZenBook UX3430UN não pertença necessariamente à mesma categoria que outros dispositivos finos e leves de 14 polegadas, você não precisa se preocupar com ventoinhas barulhentos ou superaquecimento. O ZenBook UX3430UN é um dispositivo silencioso e frio para o qual também apreciamos sua carcaça simples e solidamente construída.
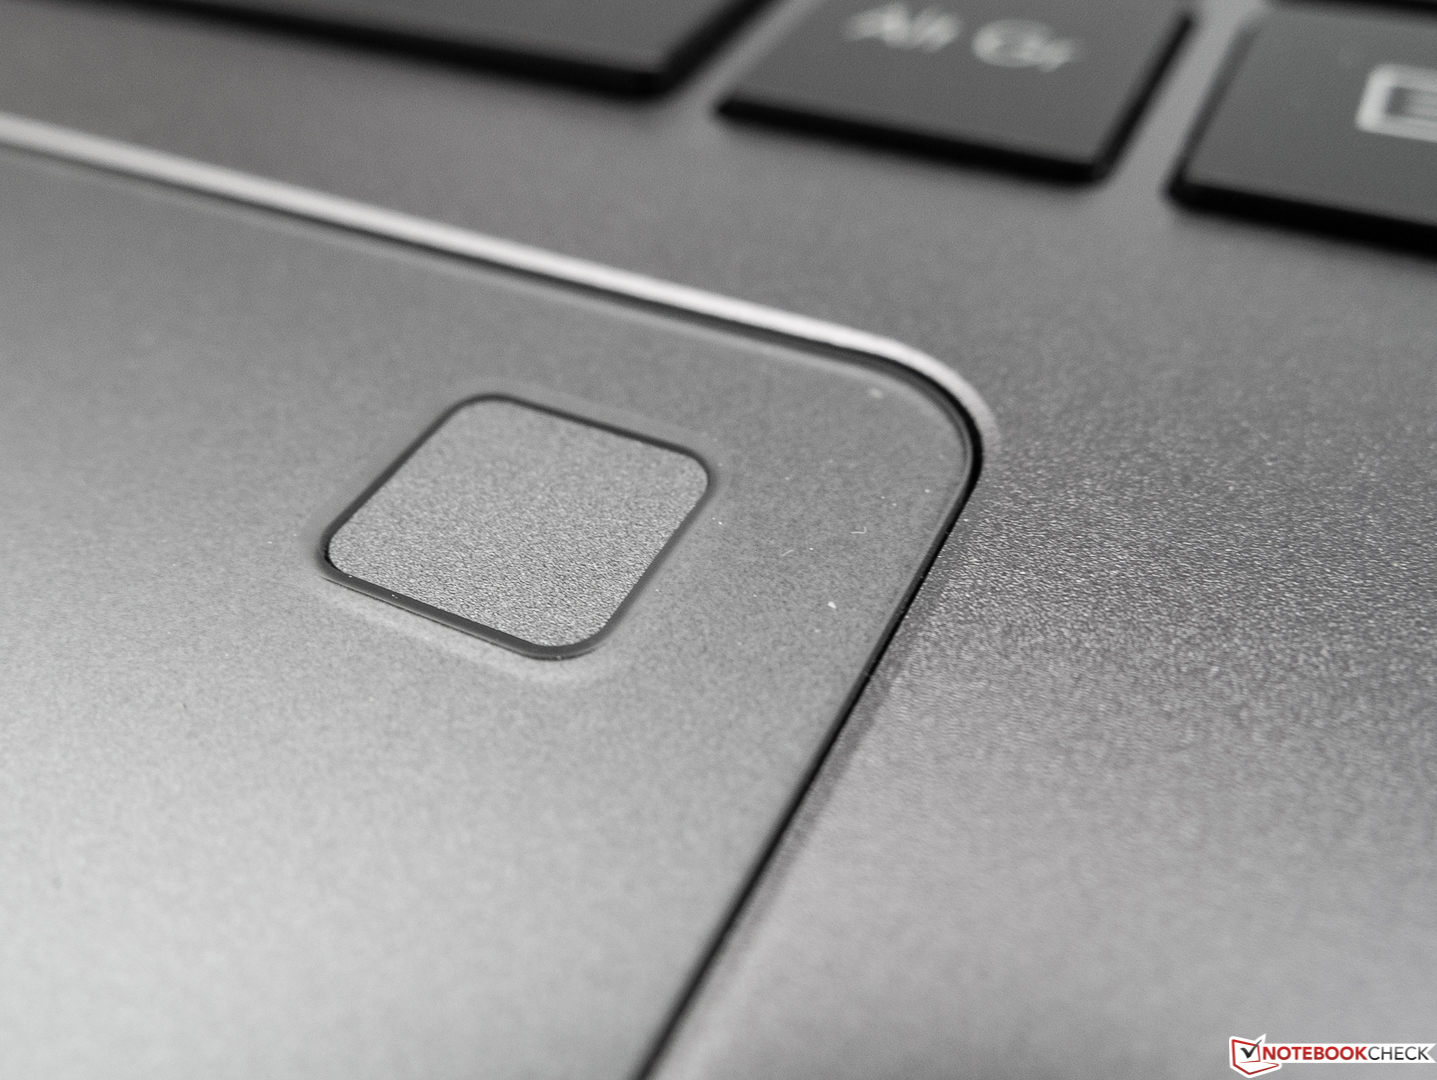
Além da operação silenciosa, a ASUS equipou um dispositivo com bons dispositivos de entrada e recursos sólidos de segurança, todos importantes para os usuários do escritório. Em termos de duração da bateria e nosso teste prático de Wi-Fi, teríamos preferido dez horas em vez de oito. Além disso, embora a tela seja boa, algumas coisas impedem que ela seja adequada para o processamento profissional de imagens. Os outros pontos negativos são insignificantes, o que se reflete na ótima classificação geral de 88/100.
O ASUS ZenBook UX3430UN é um dispositivo que nós recomendamos totalmente, e especialmente sobre o mais antigo ZenBook UX3430UQ. O novo ZenBook UX3430UN traz um hardware consideravelmente mais potente com quase nenhum inconveniente.
Asus Zenbook UX3430UN-GV174T
- 05/15/2018 v6 (old)
Sven Kloevekorn
Price comparison
