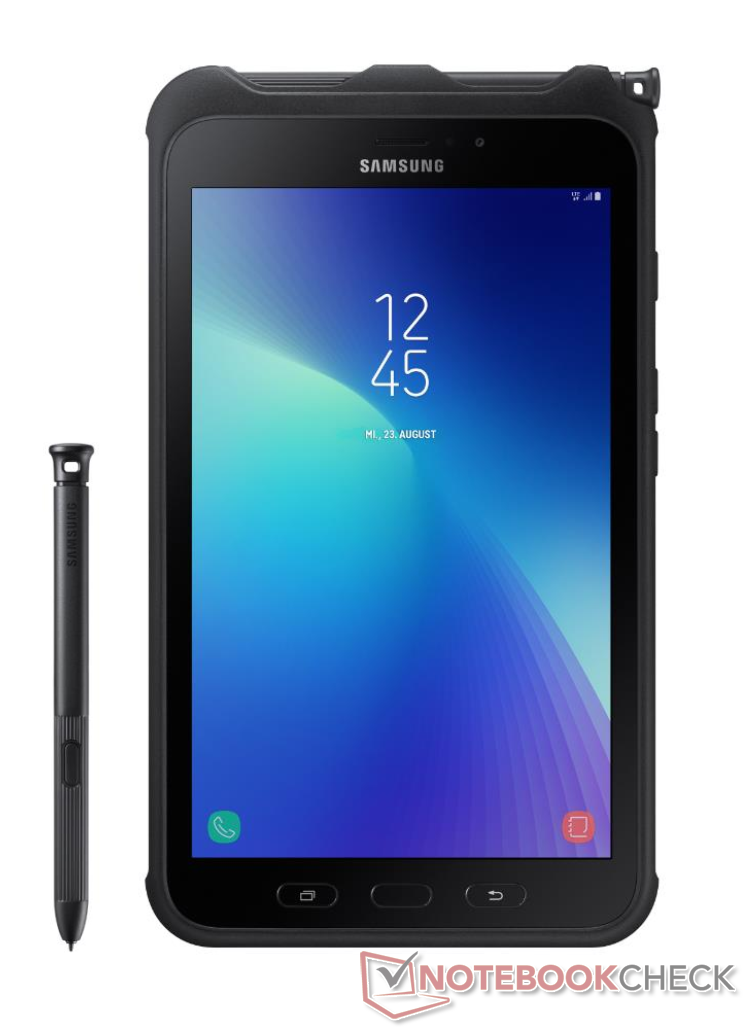
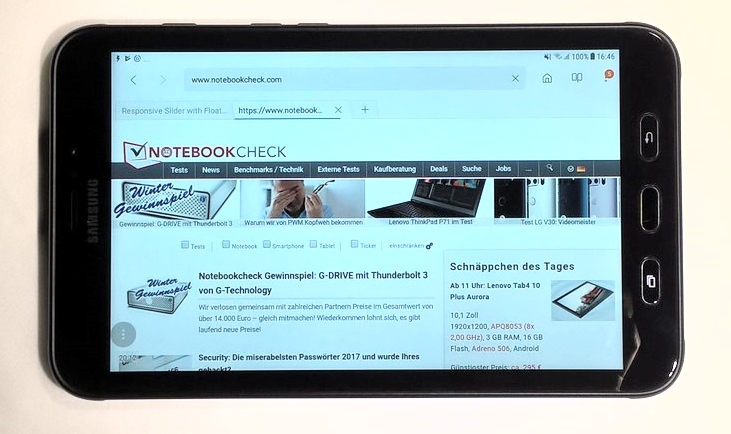
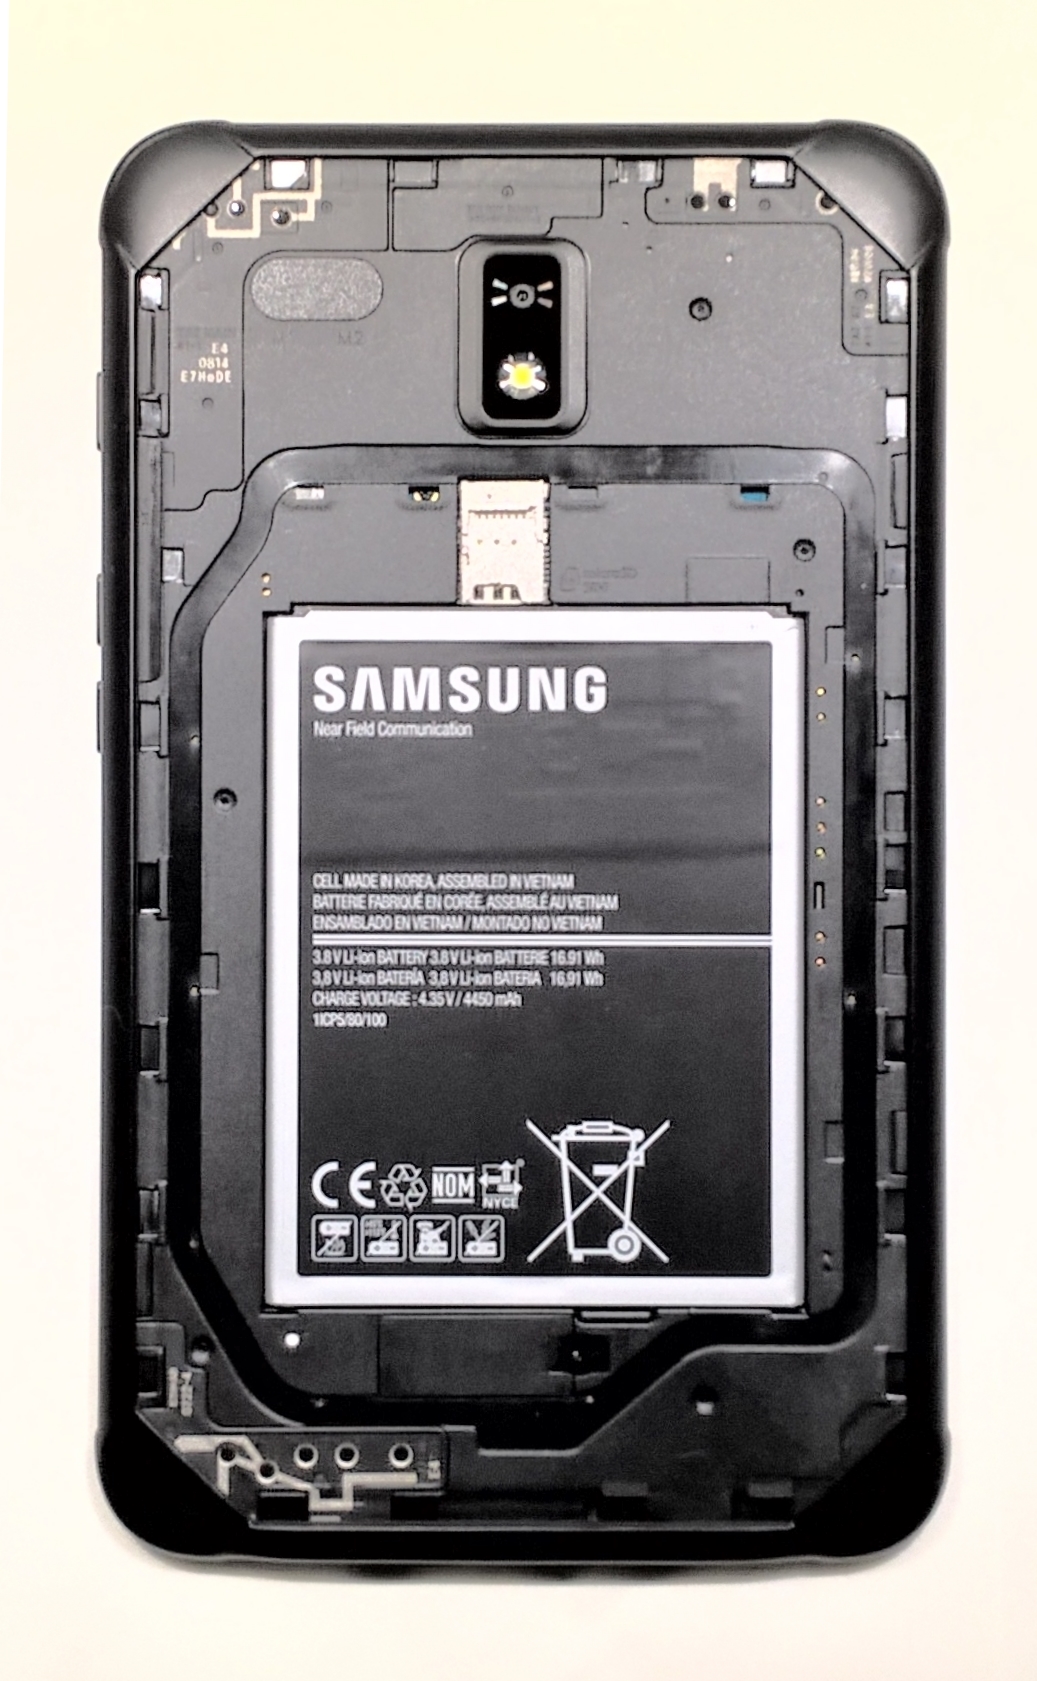
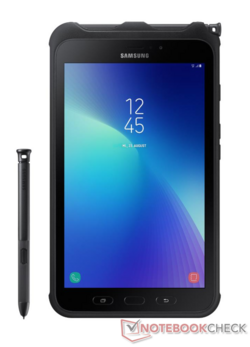
Breve Análise do Tablet Samsung Galaxy Tab Active 2


| |||||||||||||||||||||||||
iluminação: 91 %
iluminação com acumulador: 509 cd/m²
Contraste: 1060:1 (Preto: 0.48 cd/m²)
ΔE ColorChecker Calman: 3.45 | ∀{0.5-29.43 Ø4.72}
ΔE Greyscale Calman: 4.5 | ∀{0.09-98 Ø4.97}
99.9% sRGB (Calman 2D)
Gamma: 2.11
CCT: 7171 K
| Samsung Galaxy Tab Active 2 TFT LCD, 1280x800, 8" | Samsung Galaxy Tab Active TFT, 1280x800, 8" | Lenovo Tab 4 8 IPS, 1280x800, 8" | Huawei Mediapad M3 Lite 8 IPS, 1920x1200, 8" | Amazon Fire HD 8 2017 IPS, 1280x800, 8" | Apple iPad (2017) IPS, 2048x1536, 9.7" | |
|---|---|---|---|---|---|---|
| Screen | -31% | -38% | -26% | -57% | 21% | |
| Brightness middle (cd/m²) | 509 | 424 -17% | 455 -11% | 409.1 -20% | 419 -18% | 514 1% |
| Brightness (cd/m²) | 477 | 426 -11% | 446 -6% | 402 -16% | 412 -14% | 485 2% |
| Brightness Distribution (%) | 91 | 85 -7% | 91 0% | 92 1% | 91 0% | 88 -3% |
| Black Level * (cd/m²) | 0.48 | 0.7 -46% | 0.51 -6% | 0.56 -17% | 0.39 19% | 0.46 4% |
| Contrast (:1) | 1060 | 606 -43% | 892 -16% | 731 -31% | 1074 1% | 1117 5% |
| Colorchecker dE 2000 * | 3.45 | 5.7 -65% | 5.5 -59% | 4.1 -19% | 8.5 -146% | 1.4 59% |
| Colorchecker dE 2000 max. * | 5.17 | 14.8 -186% | 9.6 -86% | 13.8 -167% | 2.9 44% | |
| Greyscale dE 2000 * | 4.5 | 5.76 -28% | 5.5 -22% | 5.3 -18% | 10.3 -129% | 2.1 53% |
| Gamma | 2.11 104% | 2.36 93% | 2.23 99% | 2.2 100% | 2.6 85% | 2.22 99% |
| CCT | 7171 91% | 7236 90% | 7852 83% | 7603 85% | 6216 105% | 6647 98% |
* ... menor é melhor
Cintilação da tela / PWM (modulação por largura de pulso)
| Tela tremeluzindo / PWM não detectado | 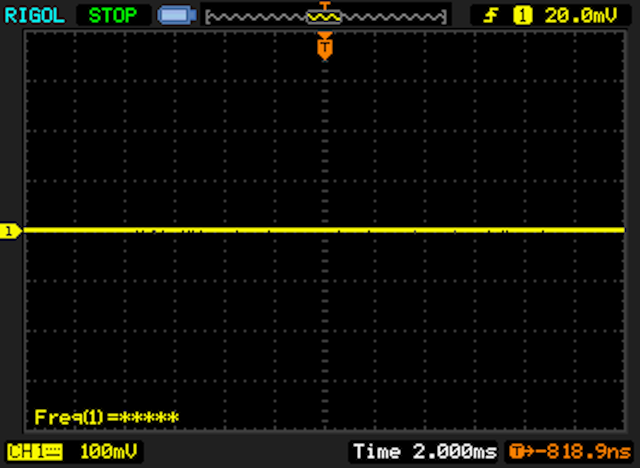 | ||
[pwm_comparison] Em comparação: 52 % de todos os dispositivos testados não usam PWM para escurecer a tela. Se PWM foi detectado, uma média de 7765 (mínimo: 5 - máximo: 343500) Hz foi medida. | |||
Exibir tempos de resposta
| ↔ Tempo de resposta preto para branco | ||
|---|---|---|
| 28 ms ... ascensão ↗ e queda ↘ combinadas | ↗ 17 ms ascensão | 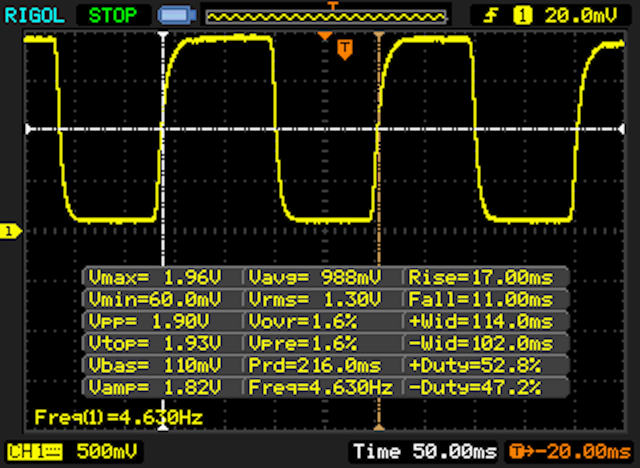 |
| ↘ 11 ms queda | ||
| A tela mostra taxas de resposta relativamente lentas em nossos testes e pode ser muito lenta para os jogadores. Em comparação, todos os dispositivos testados variam de 0.1 (mínimo) a 240 (máximo) ms. » 71 % de todos os dispositivos são melhores. Isso significa que o tempo de resposta medido é pior que a média de todos os dispositivos testados (19.8 ms). | ||
| ↔ Tempo de resposta 50% cinza a 80% cinza | ||
| 42 ms ... ascensão ↗ e queda ↘ combinadas | ↗ 23 ms ascensão | 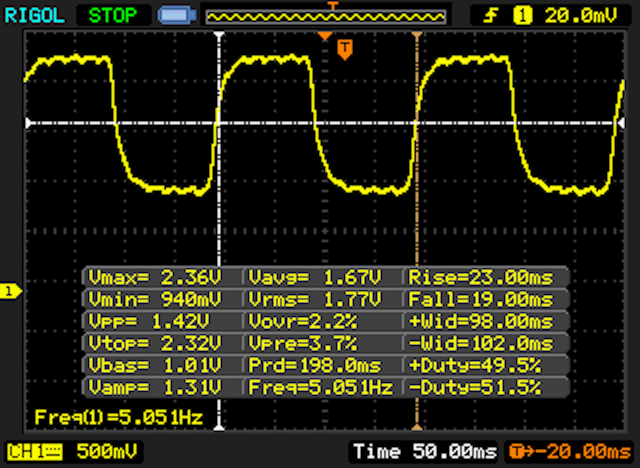 |
| ↘ 19 ms queda | ||
| A tela mostra taxas de resposta lentas em nossos testes e será insatisfatória para os jogadores. Em comparação, todos os dispositivos testados variam de 0.165 (mínimo) a 636 (máximo) ms. » 67 % de todos os dispositivos são melhores. Isso significa que o tempo de resposta medido é pior que a média de todos os dispositivos testados (31 ms). | ||
| AnTuTu v6 - Total Score | |
| Apple iPad (2017) | |
| Huawei Mediapad M3 Lite 8 | |
| Samsung Galaxy Tab Active 2 | |
| Lenovo Tab 4 8 | |
| Amazon Fire HD 8 2017 | |
| PCMark for Android | |
| Work performance score | |
| Samsung Galaxy Tab Active 2 | |
| Huawei Mediapad M3 Lite 8 | |
| Lenovo Tab 4 8 | |
| Amazon Fire HD 8 2017 | |
| Samsung Galaxy Tab Active | |
| Work 2.0 performance score | |
| Samsung Galaxy Tab Active 2 | |
| Huawei Mediapad M3 Lite 8 | |
| Lenovo Tab 4 8 | |
| Amazon Fire HD 8 2017 | |
| Geekbench 4.4 | |
| 64 Bit Single-Core Score | |
| Samsung Galaxy Tab Active 2 | |
| Lenovo Tab 4 8 | |
| Huawei Mediapad M3 Lite 8 | |
| Amazon Fire HD 8 2017 | |
| 64 Bit Multi-Core Score | |
| Samsung Galaxy Tab Active 2 | |
| Huawei Mediapad M3 Lite 8 | |
| Lenovo Tab 4 8 | |
| Amazon Fire HD 8 2017 | |
| Compute RenderScript Score | |
| Samsung Galaxy Tab Active 2 | |
| Lenovo Tab 4 8 | |
| GFXBench (DX / GLBenchmark) 2.7 | |
| T-Rex Onscreen | |
| Apple iPad (2017) | |
| Samsung Galaxy Tab Active 2 | |
| Amazon Fire HD 8 2017 | |
| Huawei Mediapad M3 Lite 8 | |
| Lenovo Tab 4 8 | |
| Samsung Galaxy Tab Active | |
| 1920x1080 T-Rex Offscreen | |
| Apple iPad (2017) | |
| Huawei Mediapad M3 Lite 8 | |
| Samsung Galaxy Tab Active 2 | |
| Amazon Fire HD 8 2017 | |
| Lenovo Tab 4 8 | |
| Samsung Galaxy Tab Active | |
| GFXBench 3.0 | |
| on screen Manhattan Onscreen OGL | |
| Apple iPad (2017) | |
| Samsung Galaxy Tab Active 2 | |
| Huawei Mediapad M3 Lite 8 | |
| Amazon Fire HD 8 2017 | |
| Lenovo Tab 4 8 | |
| Samsung Galaxy Tab Active | |
| 1920x1080 1080p Manhattan Offscreen | |
| Apple iPad (2017) | |
| Huawei Mediapad M3 Lite 8 | |
| Samsung Galaxy Tab Active 2 | |
| Amazon Fire HD 8 2017 | |
| Lenovo Tab 4 8 | |
| Samsung Galaxy Tab Active | |
| GFXBench 3.1 | |
| on screen Manhattan ES 3.1 Onscreen | |
| Apple iPad (2017) | |
| Samsung Galaxy Tab Active 2 | |
| Amazon Fire HD 8 2017 | |
| Huawei Mediapad M3 Lite 8 | |
| 1920x1080 Manhattan ES 3.1 Offscreen | |
| Apple iPad (2017) | |
| Huawei Mediapad M3 Lite 8 | |
| Samsung Galaxy Tab Active 2 | |
| Amazon Fire HD 8 2017 | |
| GFXBench | |
| on screen Car Chase Onscreen | |
| Samsung Galaxy Tab Active 2 | |
| Huawei Mediapad M3 Lite 8 | |
| 1920x1080 Car Chase Offscreen | |
| Huawei Mediapad M3 Lite 8 | |
| Samsung Galaxy Tab Active 2 | |
| Octane V2 - Total Score | |
| Apple iPad (2017) | |
| Samsung Galaxy Tab Active 2 | |
| Huawei Mediapad M3 Lite 8 (Google Chrome 61.0.3163.98) | |
| Lenovo Tab 4 8 (Chrome 61) | |
| Amazon Fire HD 8 2017 (Amazon Silk 58.2.3029.83.10) | |
| Samsung Galaxy Tab Active (Chrome 40) | |
| WebXPRT 2015 - Overall | |
| Apple iPad (2017) | |
| Lenovo Tab 4 8 (Chrome 61) | |
| Huawei Mediapad M3 Lite 8 (Google Chrome 61.0.3163.98) | |
| Samsung Galaxy Tab Active 2 | |
| Amazon Fire HD 8 2017 (Amazon Silk 58.2.3029.83.10) | |
| JetStream 1.1 - 1.1 Total | |
| Apple iPad (2017) | |
| Samsung Galaxy Tab Active 2 | |
| Amazon Fire HD 8 2017 (Amazon Silk 58.2.3029.83.10) | |
| Lenovo Tab 4 8 (Chrome 61) | |
| Huawei Mediapad M3 Lite 8 (Google Chrome 61.0.3163.98) | |
| Mozilla Kraken 1.1 - Total | |
| Samsung Galaxy Tab Active (Chrome 40) | |
| Huawei Mediapad M3 Lite 8 (Google Chrome 61.0.3163.98) | |
| Lenovo Tab 4 8 (Chrome 61) | |
| Amazon Fire HD 8 2017 (Amazon Silk 58.2.3029.83.10) | |
| Samsung Galaxy Tab Active 2 | |
| Apple iPad (2017) | |
* ... menor é melhor
| Samsung Galaxy Tab Active 2 | Samsung Galaxy Tab Active | Lenovo Tab 4 8 | Huawei Mediapad M3 Lite 8 | Amazon Fire HD 8 2017 | |
|---|---|---|---|---|---|
| AndroBench 3-5 | -21% | 16% | -21% | -22% | |
| Sequential Read 256KB (MB/s) | 218.1 | 151.8 -30% | 265.1 22% | 135.1 -38% | 159.1 -27% |
| Sequential Write 256KB (MB/s) | 54 | 42.81 -21% | 72.3 34% | 38.01 -30% | 47.23 -13% |
| Random Read 4KB (MB/s) | 25.96 | 20.24 -22% | 44 69% | 35 35% | 21.55 -17% |
| Random Write 4KB (MB/s) | 10.98 | 9.76 -11% | 7.1 -35% | 7.64 -30% | 11.51 5% |
| Sequential Read 256KB SDCard (MB/s) | 78.6 | 84.8 8% | 87.7 12% | 51.1 -35% | |
| Sequential Write 256KB SDCard (MB/s) | 64.3 | 61.1 -5% | 14.6 -77% | 34.15 -47% |
(+) A temperatura máxima no lado superior é 35.5 °C / 96 F, em comparação com a média de 33.6 °C / 92 F , variando de 20.7 a 53.2 °C para a classe Tablet.
(+) A parte inferior aquece até um máximo de 34.4 °C / 94 F, em comparação com a média de 33.2 °C / 92 F
(+) Em uso inativo, a temperatura média para o lado superior é 29.9 °C / 86 F, em comparação com a média do dispositivo de 30 °C / ### class_avg_f### F.
Apple iPad (2017) análise de áudio
(+) | os alto-falantes podem tocar relativamente alto (###valor### dB)
Graves 100 - 315Hz
(-) | quase nenhum baixo - em média 17.5% menor que a mediana
(±) | a linearidade dos graves é média (10.8% delta para a frequência anterior)
Médios 400 - 2.000 Hz
(+) | médios equilibrados - apenas 2.8% longe da mediana
(+) | médios são lineares (5.3% delta para frequência anterior)
Altos 2 - 16 kHz
(±) | máximos mais altos - em média 8.5% maior que a mediana
(+) | os máximos são lineares (3.9% delta da frequência anterior)
Geral 100 - 16.000 Hz
(±) | a linearidade do som geral é média (19% diferença em relação à mediana)
Comparado com a mesma classe
» 51% de todos os dispositivos testados nesta classe foram melhores, 5% semelhantes, 43% piores
» O melhor teve um delta de 7%, a média foi 20%, o pior foi 129%
Comparado com todos os dispositivos testados
» 45% de todos os dispositivos testados foram melhores, 7% semelhantes, 48% piores
» O melhor teve um delta de 4%, a média foi 24%, o pior foi 134%
| desligado | |
| Ocioso | |
| Carga |
|
Key:
min: | |
| Samsung Galaxy Tab Active 2 4450 mAh | Samsung Galaxy Tab Active mAh | Lenovo Tab 4 8 4850 mAh | Huawei Mediapad M3 Lite 8 4800 mAh | Amazon Fire HD 8 2017 mAh | Apple iPad (2017) 8.827 mAh | |
|---|---|---|---|---|---|---|
| Power Consumption | 23% | -19% | -141% | -0% | -131% | |
| Idle Minimum * (Watt) | 0.89 | 0.6 33% | 1.1 -24% | 4.02 -352% | 0.99 -11% | 2.06 -131% |
| Idle Average * (Watt) | 3.13 | 2.2 30% | 3.51 -12% | 6 -92% | 2.74 12% | 7.42 -137% |
| Idle Maximum * (Watt) | 3.36 | 2.5 26% | 4.14 -23% | 6.64 -98% | 2.83 16% | 7.47 -122% |
| Load Average * (Watt) | 3.93 | 3.7 6% | 4.86 -24% | 7.34 -87% | 4.51 -15% | 9.45 -140% |
| Load Maximum * (Watt) | 5.45 | 4.3 21% | 6.13 -12% | 9.6 -76% | 5.69 -4% | 12.31 -126% |
* ... menor é melhor
| Samsung Galaxy Tab Active 2 4450 mAh | Samsung Galaxy Tab Active mAh | Lenovo Tab 4 8 4850 mAh | Huawei Mediapad M3 Lite 8 4800 mAh | Amazon Fire HD 8 2017 mAh | Apple iPad (2017) 8.827 mAh | |
|---|---|---|---|---|---|---|
| Duração da bateria | 18% | -17% | 7% | 22% | 6% | |
| Reader / Idle (h) | 22.6 | 27.3 21% | 20.1 -11% | 23 2% | 33.9 50% | 24.9 10% |
| H.264 (h) | 8.2 | 12.9 57% | 10.1 23% | 12.4 51% | 14.1 72% | |
| WiFi v1.3 (h) | 14.9 | 7.5 -50% | 14.6 -2% | 12.8 -14% | 12.7 -15% | |
| Load (h) | 6.6 | 5.1 -23% | 4.6 -30% | 8 21% | 6.6 0% | 3.8 -42% |
| WiFi (h) | 14.4 |
Pro
Contra
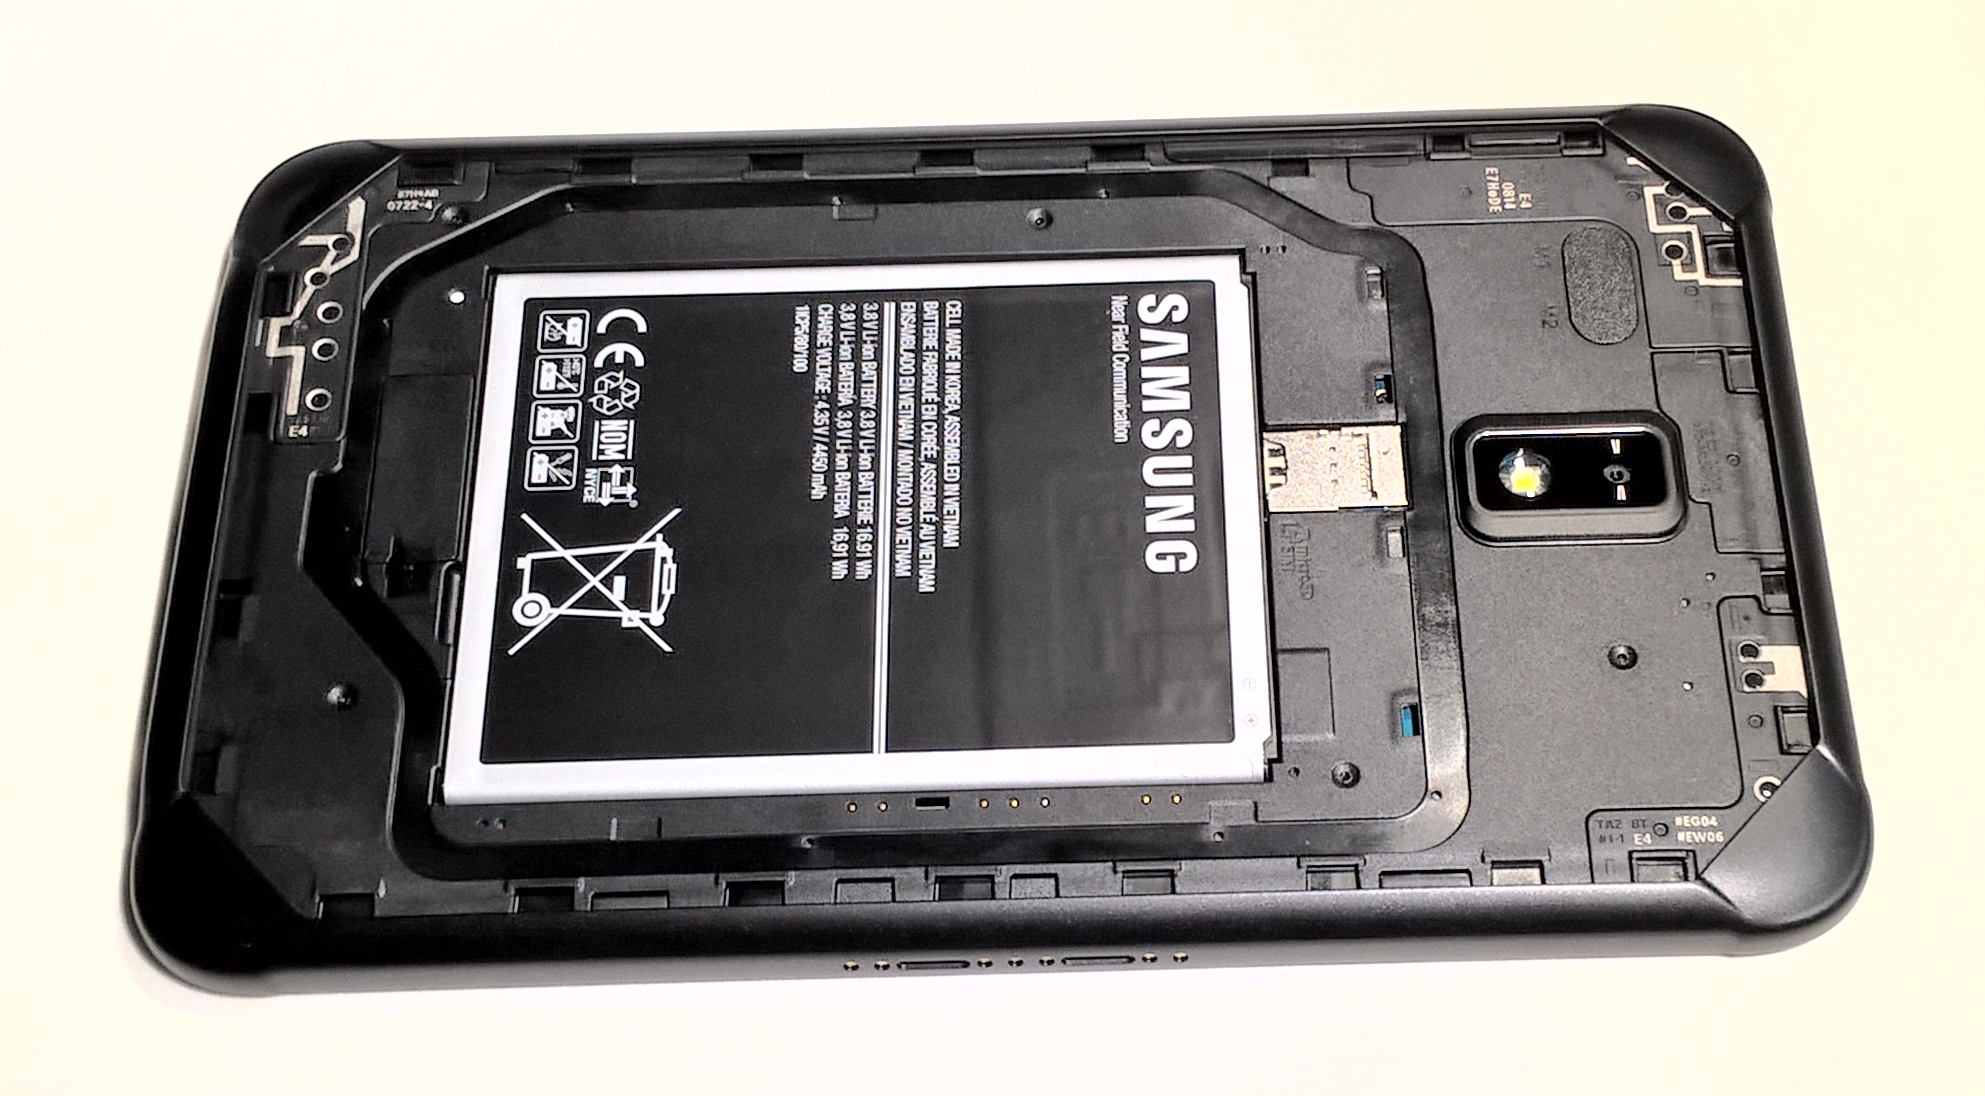
Sem dúvida: O Galaxy Tab Active 2 é um poli funcional muito sólido. O sistema operacional é fluente e o dispositivo deve ser capaz de lidar com as tarefas diárias com facilidade. O armazenamento interno é bastante limitado e, embora, em teoria, o sistema não exija mais espaço de armazenamento, um cartão MicroSD adicional se tornará uma necessidade mais cedo e não mais tarde. Pelo menos suporta cartões MicroSD de até 256 GB de capacidade.
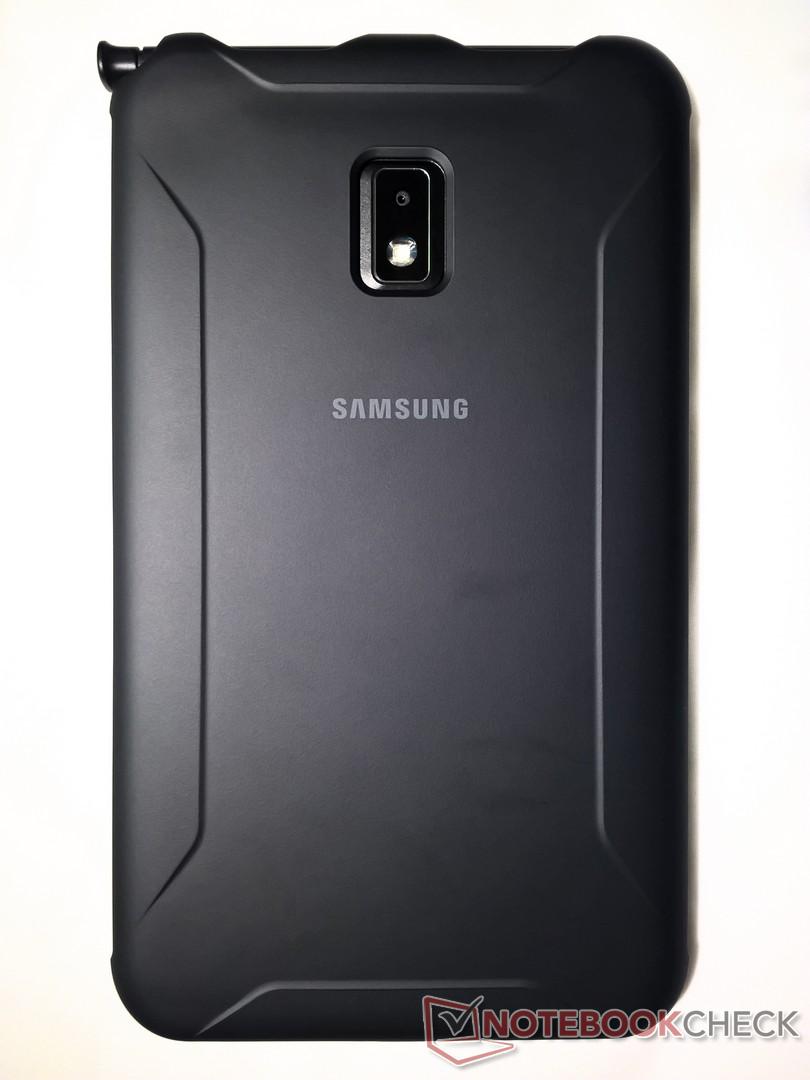
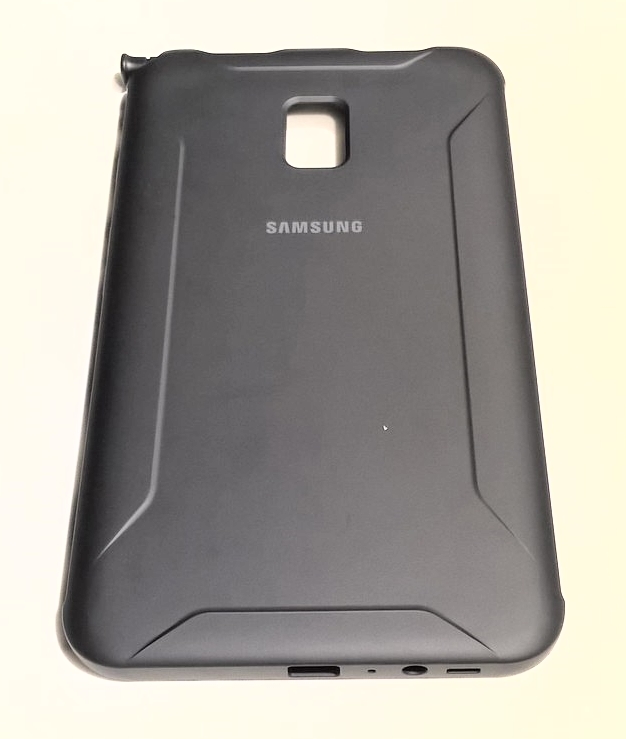
Debaixo da sua pele endurecida e grossa está um tablet de gama média. Está adequadamente equipado, e os potenciais clientes provavelmente irão comprá-lo de qualquer forma devido à falta de concorrentes reforçados para exteriores.
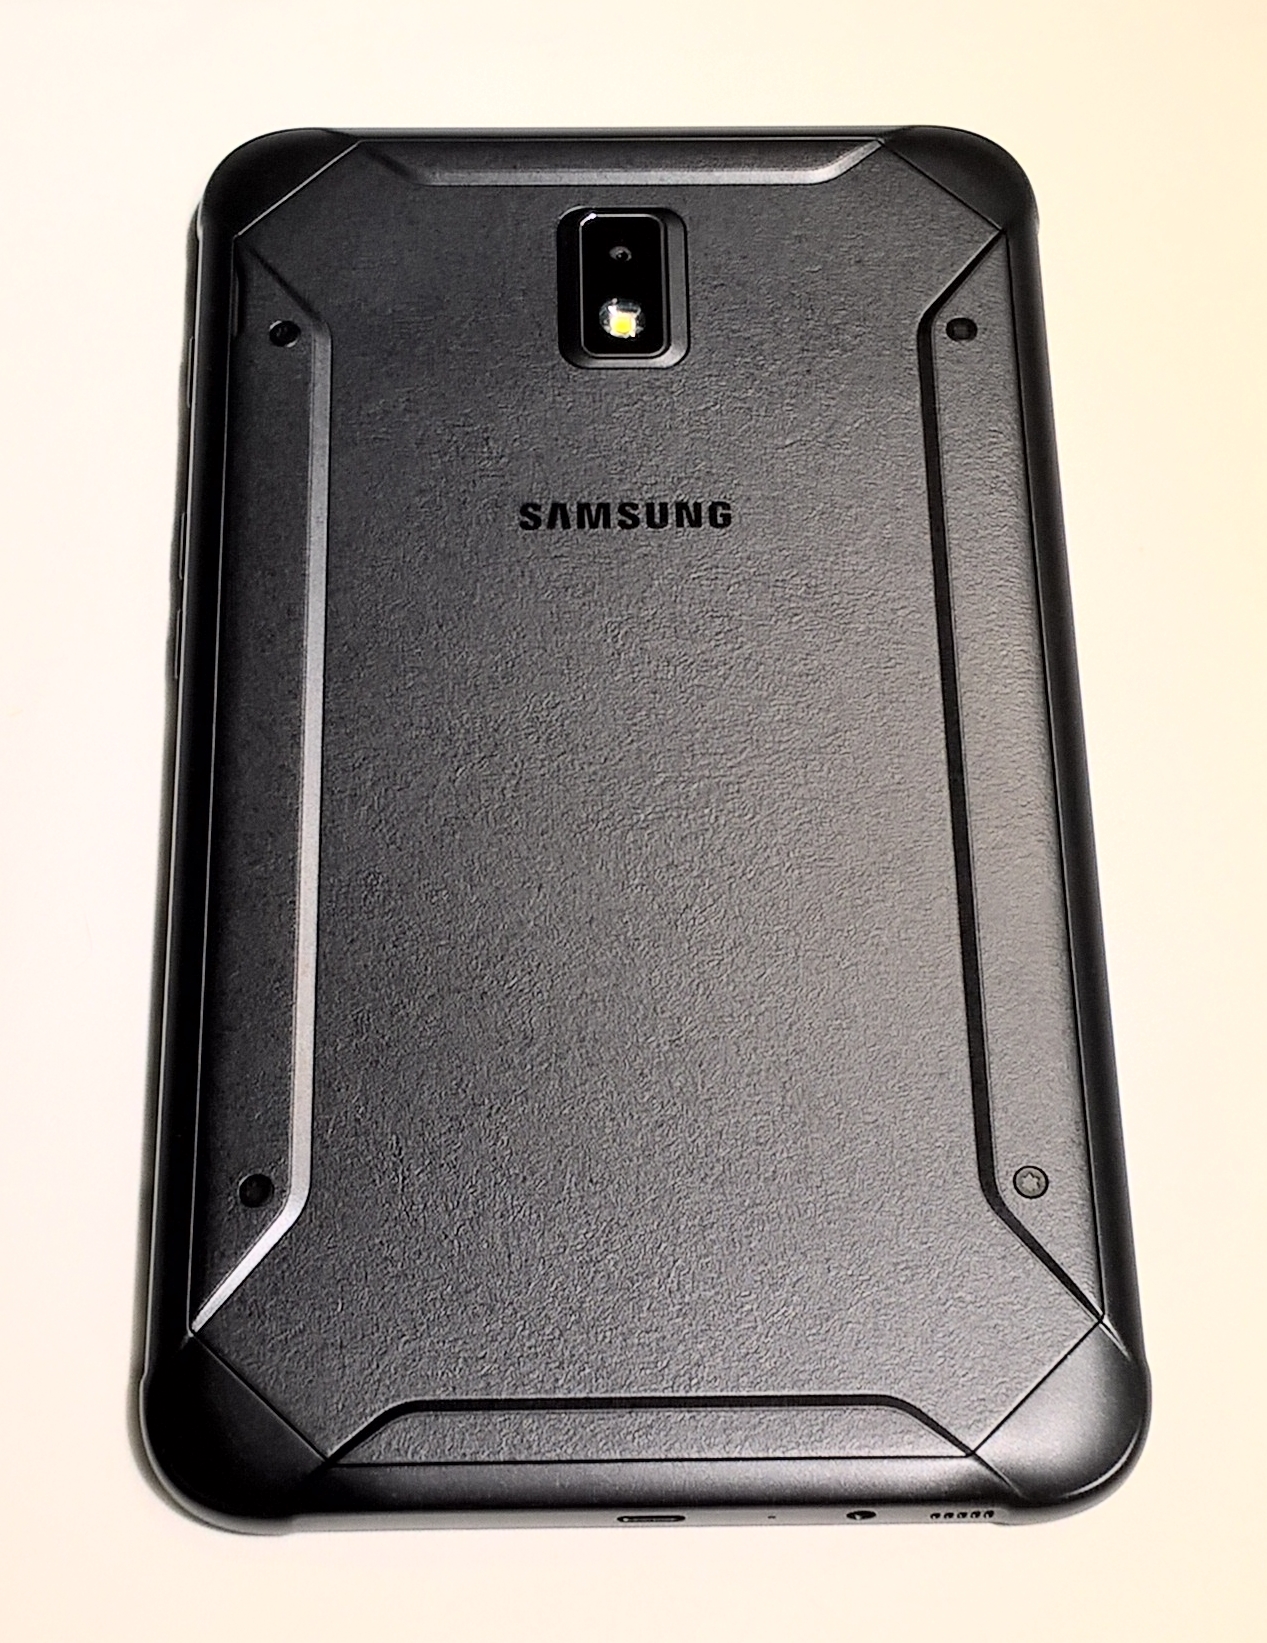
Resta ver se o Galaxy Tab Active 2 que acabará por ser útil em uma oficina, garagem ou um site de construção, ou não. É certamente mais sólido e mais robusto que a maioria dos seus concorrentes, e pode se tornar um companheiro muito seguro em caminhadas e no campo. A tela permanece utilizável com luvas e a S pen incluída permite uma entrada de toque muito precisa.
Samsung Galaxy Tab Active 2
- 12/22/2017 v6 (old)
Mike Wobker
Price comparison
