Breve Análise do Workstation Dell Precision 3510
| SD Card Reader | |
| average JPG Copy Test (av. of 3 runs) | |
| Dell Precision 3510 | |
| HP ZBook 15 G3 | |
| Lenovo ThinkPad P50 | |
| maximum AS SSD Seq Read Test (1GB) | |
| HP ZBook 15 G3 | |
| Dell Precision 3510 | |
| Lenovo ThinkPad P50 | |
| Networking | |
| Wi-Fi Client 1m | |
| Wi-Fi Server 1m |
| |||||||||||||||||||||||||
iluminação: 83 %
iluminação com acumulador: 199 cd/m²
Contraste: 498:1 (Preto: 0.4 cd/m²)
ΔE ColorChecker Calman: 9 | ∀{0.5-29.43 Ø4.73}
ΔE Greyscale Calman: 9.6 | ∀{0.09-98 Ø4.97}
73.7% sRGB (Calman 2D)
62.4% sRGB (Argyll 1.6.3 3D)
39.6% AdobeRGB 1998 (Argyll 1.6.3 3D)
42.86% AdobeRGB 1998 (Argyll 3D)
62.4% sRGB (Argyll 3D)
41.48% Display P3 (Argyll 3D)
Gamma: 2.41
CCT: 10695 K
| Dell Precision 3510 LGD04AF, K96D2_156WHU, , 1366x768, 15.6" | Dell Precision 3510 52452051.2 LG Display LGD049B / 156WF6, Dell P/N: F7HH2, , 1920x1080, 15.6" | Dell Precision 7510 (4K IGZO) Sharp LQ156D1, , 3840x2160, 15.6" | Dell Precision 5510 SHP143E, 7PHPT_LQ156D1, , 3840x2160, 15.6" | Lenovo ThinkPad P50 LQ156D1JW05, , 3840x2160, 15.6" | HP ZBook 15 G3 Samsung SDC5344, , 1920x1080, 15.6" | |
|---|---|---|---|---|---|---|
| Display | 54% | 100% | 102% | 98% | 58% | |
| Display P3 Coverage (%) | 41.48 | 68.9 66% | 86.2 108% | 88.4 113% | 85.8 107% | 66.8 61% |
| sRGB Coverage (%) | 62.4 | 88.9 42% | 99.7 60% | 100 60% | 98.6 58% | 95.5 53% |
| AdobeRGB 1998 Coverage (%) | 42.86 | 65.4 53% | 99 131% | 99.5 132% | 98.2 129% | 69 61% |
| Response Times | 15% | -11% | 26% | -12% | ||
| Response Time Grey 50% / Grey 80% * (ms) | 56 ? | 40.4 ? 28% | 56.4 ? -1% | 39.2 ? 30% | 54 ? 4% | |
| Response Time Black / White * (ms) | 28 ? | 27.6 ? 1% | 34 ? -21% | 22 ? 21% | 35.6 ? -27% | |
| PWM Frequency (Hz) | 198.4 ? | 217 | 198 ? | |||
| Screen | 47% | 57% | 65% | 42% | 40% | |
| Brightness middle (cd/m²) | 199 | 364.6 83% | 279.2 40% | 391 96% | 250 26% | 306 54% |
| Brightness (cd/m²) | 201 | 335 67% | 271 35% | 361 80% | 250 24% | 289 44% |
| Brightness Distribution (%) | 83 | 83 0% | 83 0% | 87 5% | 86 4% | 85 2% |
| Black Level * (cd/m²) | 0.4 | 0.4 -0% | 0.266 33% | 0.4 -0% | 0.31 23% | 0.34 15% |
| Contrast (:1) | 498 | 912 83% | 1050 111% | 978 96% | 806 62% | 900 81% |
| Colorchecker dE 2000 * | 9 | 4.14 54% | 4.85 46% | 4.5 50% | 5.1 43% | |
| Colorchecker dE 2000 max. * | 13.3 | 6.56 51% | 9.3 30% | 9.9 26% | ||
| Greyscale dE 2000 * | 9.6 | 3.26 66% | 4.01 58% | 7.2 25% | 7.4 23% | |
| Gamma | 2.41 91% | 2.19 100% | 2.18 101% | 2.31 95% | 2.37 93% | |
| CCT | 10695 61% | 6375 102% | 7340 89% | 6399 102% | 7263 89% | |
| Color Space (Percent of AdobeRGB 1998) (%) | 39.6 | 85.68 116% | 96 142% | 85 115% | 63 59% | |
| Color Space (Percent of sRGB) (%) | 62.4 | 99.72 60% | 100 60% | 98.6 58% | 95 52% | |
| Média Total (Programa/Configurações) | 51% /
49% | 57% /
60% | 52% /
62% | 55% /
51% | 29% /
37% |
* ... menor é melhor
Exibir tempos de resposta
| ↔ Tempo de resposta preto para branco | ||
|---|---|---|
| 28 ms ... ascensão ↗ e queda ↘ combinadas | ↗ 11 ms ascensão | |
| ↘ 17 ms queda | ||
| A tela mostra taxas de resposta relativamente lentas em nossos testes e pode ser muito lenta para os jogadores. Em comparação, todos os dispositivos testados variam de 0.1 (mínimo) a 240 (máximo) ms. » 71 % de todos os dispositivos são melhores. Isso significa que o tempo de resposta medido é pior que a média de todos os dispositivos testados (19.9 ms). | ||
| ↔ Tempo de resposta 50% cinza a 80% cinza | ||
| 56 ms ... ascensão ↗ e queda ↘ combinadas | ↗ 27 ms ascensão | |
| ↘ 29 ms queda | ||
| A tela mostra taxas de resposta lentas em nossos testes e será insatisfatória para os jogadores. Em comparação, todos os dispositivos testados variam de 0.165 (mínimo) a 636 (máximo) ms. » 93 % de todos os dispositivos são melhores. Isso significa que o tempo de resposta medido é pior que a média de todos os dispositivos testados (31.1 ms). | ||
Cintilação da tela / PWM (modulação por largura de pulso)
| Tela tremeluzindo / PWM não detectado | ||
[pwm_comparison] Em comparação: 52 % de todos os dispositivos testados não usam PWM para escurecer a tela. Se PWM foi detectado, uma média de 7791 (mínimo: 5 - máximo: 343500) Hz foi medida. | ||
| PCMark 8 | |
| Home Score Accelerated v2 | |
| Dell Precision 3510 | |
| Lenovo ThinkPad P50 | |
| Dell Precision 7510 (4K IGZO) | |
| HP ZBook 15u G3 | |
| HP ZBook 15 G3 | |
| Dell Precision 5510 | |
| Work Score Accelerated v2 | |
| Dell Precision 3510 | |
| HP ZBook 15 G3 | |
| Dell Precision 5510 | |
| HP ZBook 15u G3 | |
| Lenovo ThinkPad P50 | |
| Dell Precision 7510 (4K IGZO) | |
| PCMark 8 Home Score Accelerated v2 | 4405 pontos | |
| PCMark 8 Creative Score Accelerated v2 | 5244 pontos | |
| PCMark 8 Work Score Accelerated v2 | 5258 pontos | |
Ajuda | ||
| Dell Precision 3510 Samsung SM951 MZVPV256HDGL m.2 PCI-e | Dell Precision 5510 SK hynix SC920 512 GB | Dell Precision 7510 (4K IGZO) Samsung SSD SM951a 512GB M.2 PCIe 3.0 x4 NVMe (MZVKV512) | Lenovo ThinkPad P50 Samsung SM951 MZVPV256HDGL m.2 PCI-e | HP ZBook 15u G3 Samsung SM951 MZVPV256HDGL m.2 PCI-e | HP ZBook 15 G3 Samsung SM951 MZVPV512HDGL m.2 PCI-e | |
|---|---|---|---|---|---|---|
| AS SSD | -58% | 18% | 16% | 13% | 13% | |
| Seq Write (MB/s) | 1093 | 389 -64% | 1484 36% | 1252 15% | 1106 1% | 1181 8% |
| Seq Read (MB/s) | 1897 | 474 -75% | 1953 3% | 1930 2% | 1859 -2% | 1841 -3% |
| 4K-64 Write (MB/s) | 294.1 | 257 -13% | 375.7 28% | 340.7 16% | 335.6 14% | 257 -13% |
| 4K-64 Read (MB/s) | 1114 | 327 -71% | 1067 -4% | 1077 -3% | 1781 60% | 1066 -4% |
| 4K Write (MB/s) | 121.7 | 82.2 -32% | 145.1 19% | 212.2 74% | 126.2 4% | 173.1 42% |
| 4K Read (MB/s) | 46.76 | 17.95 -62% | 49.22 5% | 54.2 16% | 48.7 4% | 52.5 12% |
| Access Time Read * (ms) | 0.059 | 0.111 -88% | 0.036 39% | 0.062 -5% | 0.053 10% | 0.031 47% |
* ... menor é melhor

| SPECviewperf 11 | |
| 1920x1080 Siemens NX | |
| Lenovo ThinkPad P50 | |
| HP ZBook 15 G3 | |
| Dell Precision 5510 | |
| Dell Precision 3510 | |
| Asus GL552VW-DK725T | |
| 1920x1080 Tcvis | |
| HP ZBook 15 G3 | |
| Lenovo ThinkPad P50 | |
| Dell Precision 5510 | |
| Dell Precision 3510 | |
| Asus GL552VW-DK725T | |
| 1920x1080 SolidWorks | |
| Lenovo ThinkPad P50 | |
| Dell Precision 5510 | |
| HP ZBook 15 G3 | |
| Dell Precision 3510 | |
| Asus GL552VW-DK725T | |
| 1920x1080 Pro/ENGINEER | |
| HP ZBook 15 G3 | |
| Lenovo ThinkPad P50 | |
| Dell Precision 5510 | |
| Dell Precision 3510 | |
| Asus GL552VW-DK725T | |
| 1920x1080 Maya | |
| HP ZBook 15 G3 | |
| Lenovo ThinkPad P50 | |
| Dell Precision 5510 | |
| Dell Precision 3510 | |
| Asus GL552VW-DK725T | |
| 1920x1080 Lightwave | |
| Lenovo ThinkPad P50 | |
| Dell Precision 5510 | |
| HP ZBook 15 G3 | |
| Dell Precision 3510 | |
| Asus GL552VW-DK725T | |
| 1920x1080 Ensight | |
| HP ZBook 15 G3 | |
| Lenovo ThinkPad P50 | |
| Dell Precision 5510 | |
| Asus GL552VW-DK725T | |
| Dell Precision 3510 | |
| 1920x1080 Catia | |
| Lenovo ThinkPad P50 | |
| Dell Precision 5510 | |
| HP ZBook 15 G3 | |
| Asus GL552VW-DK725T | |
| Dell Precision 3510 | |
| 3DMark 11 - 1280x720 Performance GPU | |
| Lenovo ThinkPad P50 | |
| Dell Precision 7510 (4K IGZO) | |
| HP ZBook 15 G3 | |
| Dell Precision 5510 | |
| HP ZBook 15u G3 | |
| 3DMark | |
| 1280x720 Cloud Gate Standard Graphics | |
| HP ZBook 15 G3 | |
| Dell Precision 7510 (4K IGZO) | |
| Lenovo ThinkPad P50 | |
| Dell Precision 5510 | |
| Dell Precision 3510 | |
| HP ZBook 15u G3 | |
| 1920x1080 Fire Strike Graphics | |
| Dell Precision 7510 (4K IGZO) | |
| HP ZBook 15 G3 | |
| Lenovo ThinkPad P50 | |
| Dell Precision 5510 | |
| Dell Precision 3510 | |
| HP ZBook 15u G3 | |
| 3DMark 06 Standard Score | 15680 pontos | |
| 3DMark Cloud Gate Standard Score | 11740 pontos | |
| 3DMark Fire Strike Score | 2001 pontos | |
Ajuda | ||
| baixo | média | alto | ultra | |
|---|---|---|---|---|
| Tomb Raider (2013) | 158 | 75 | 58 | 25 |
| BioShock Infinite (2013) | 137 | 66 | 57 | 22 |
| Total War: Rome II (2013) | 106 | 80 | 66 | 23 |
| Middle-earth: Shadow of Mordor (2014) | 66 | 41 | 23 | 21 |
| Dirt Rally (2015) | 216 | 71 | 47 | 19 |
| The Witcher 3 (2015) | 31 | 21 | 10 |
Barulho
| Ocioso |
| 30 / 30 / 30 dB |
| Carga |
| 38.1 / 44.4 dB |
 | ||
30 dB silencioso 40 dB(A) audível 50 dB(A) ruidosamente alto |
||
min: | ||
(-) A temperatura máxima no lado superior é 54.6 °C / 130 F, em comparação com a média de 38.2 °C / 101 F , variando de 22.2 a 69.8 °C para a classe Workstation.
(-) A parte inferior aquece até um máximo de 59.4 °C / 139 F, em comparação com a média de 41.1 °C / 106 F
(+) Em uso inativo, a temperatura média para o lado superior é 28 °C / 82 F, em comparação com a média do dispositivo de 32 °C / ### class_avg_f### F.
(+) Os apoios para as mãos e o touchpad são mais frios que a temperatura da pele, com um máximo de 31.5 °C / 88.7 F e, portanto, são frios ao toque.
(-) A temperatura média da área do apoio para as mãos de dispositivos semelhantes foi 27.8 °C / 82 F (-3.7 °C / -6.7 F).
| desligado | |
| Ocioso | |
| Carga |
|
Key:
min: | |
| Dell Precision 3510 6700HQ, FirePro W5130M, Samsung SM951 MZVPV256HDGL m.2 PCI-e, TN LED, 1366x768, 15.6" | Dell Precision 5510 E3-1505M v5, Quadro M1000M, SK hynix SC920 512 GB, IGZO LED, 3840x2160, 15.6" | Dell Precision 7510 (4K IGZO) E3-1535M v5, Quadro M2000M, Samsung SSD SM951a 512GB M.2 PCIe 3.0 x4 NVMe (MZVKV512), IGZO IPS, 3840x2160, 15.6" | Lenovo ThinkPad P50 E3-1505M v5, Quadro M2000M, Samsung SM951 MZVPV256HDGL m.2 PCI-e, IPS, 3840x2160, 15.6" | HP ZBook 15 G3 E3-1505M v5, Quadro M2000M, Samsung SM951 MZVPV512HDGL m.2 PCI-e, UWVA-IPS, 1920x1080, 15.6" | |
|---|---|---|---|---|---|
| Power Consumption | -89% | -247% | -102% | -52% | |
| Idle Minimum * (Watt) | 4.2 | 8.6 -105% | 23.9 -469% | 10.2 -143% | 5.7 -36% |
| Idle Average * (Watt) | 6.5 | 16.2 -149% | 28.9 -345% | 17.8 -174% | 12.2 -88% |
| Idle Maximum * (Watt) | 7.1 | 16.7 -135% | 30 -323% | 18.3 -158% | 12.6 -77% |
| Load Average * (Watt) | 74.6 | 82.6 -11% | 95.2 -28% | 76.9 -3% | 83.1 -11% |
| Load Maximum * (Watt) | 92.2 | 131.8 -43% | 157.1 -70% | 123.5 -34% | 138.2 -50% |
* ... menor é melhor
| Dell Precision 3510 6700HQ, FirePro W5130M, 84 Wh | Dell Precision 5510 E3-1505M v5, Quadro M1000M, 56 Wh | Dell Precision 7510 (4K IGZO) E3-1535M v5, Quadro M2000M, 91 Wh | Lenovo ThinkPad P50 E3-1505M v5, Quadro M2000M, 90 Wh | HP ZBook 15 G3 E3-1505M v5, Quadro M2000M, 90 Wh | HP ZBook 15u G3 6600U, FirePro W4190M, 90 Wh | |
|---|---|---|---|---|---|---|
| Duração da bateria | -47% | -58% | -42% | -24% | -19% | |
| Reader / Idle (h) | 19.5 | 7.1 -64% | 4.5 -77% | 9 -54% | 13.7 -30% | 12.6 -35% |
| H.264 (h) | 10.1 | 3.3 -67% | 5.5 -46% | 7.5 -26% | ||
| WiFi v1.3 (h) | 9.9 | 4.8 -52% | 4 -60% | 4.8 -52% | 6.4 -35% | 5.2 -47% |
| Load (h) | 1.9 | 1.8 -5% | 1.2 -37% | 1.6 -16% | 1.8 -5% | 2.4 26% |
| WiFi (h) | 5 |
Pro
Contra
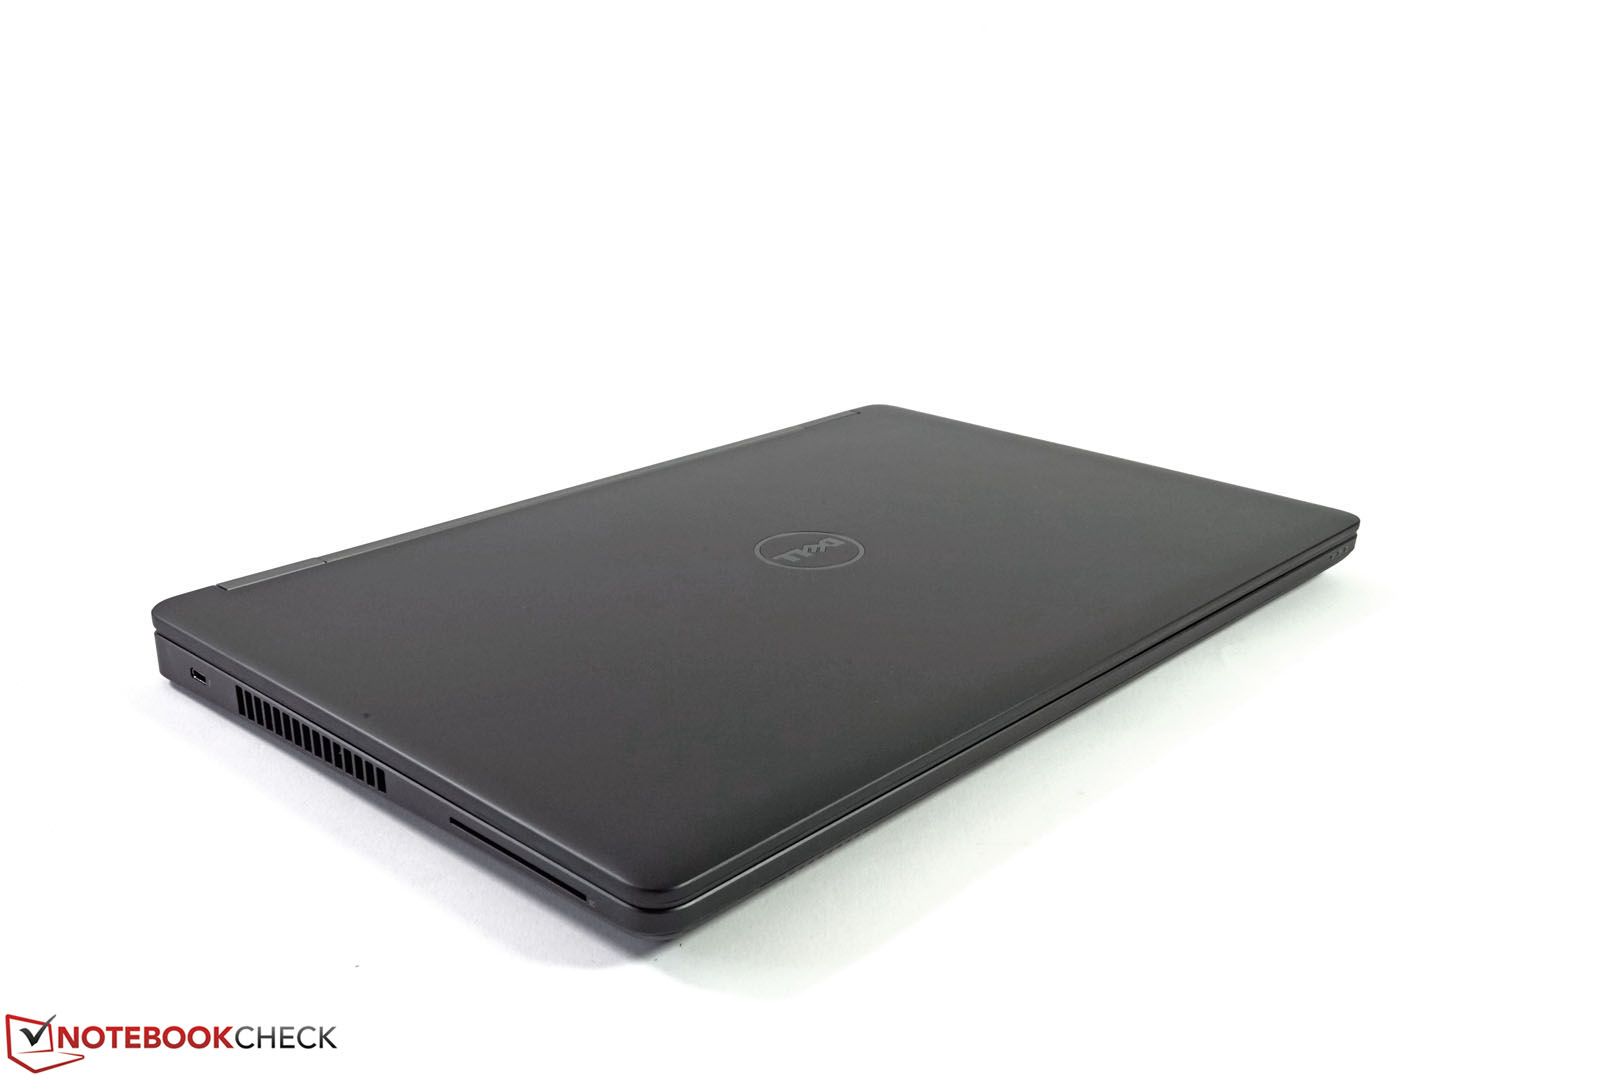
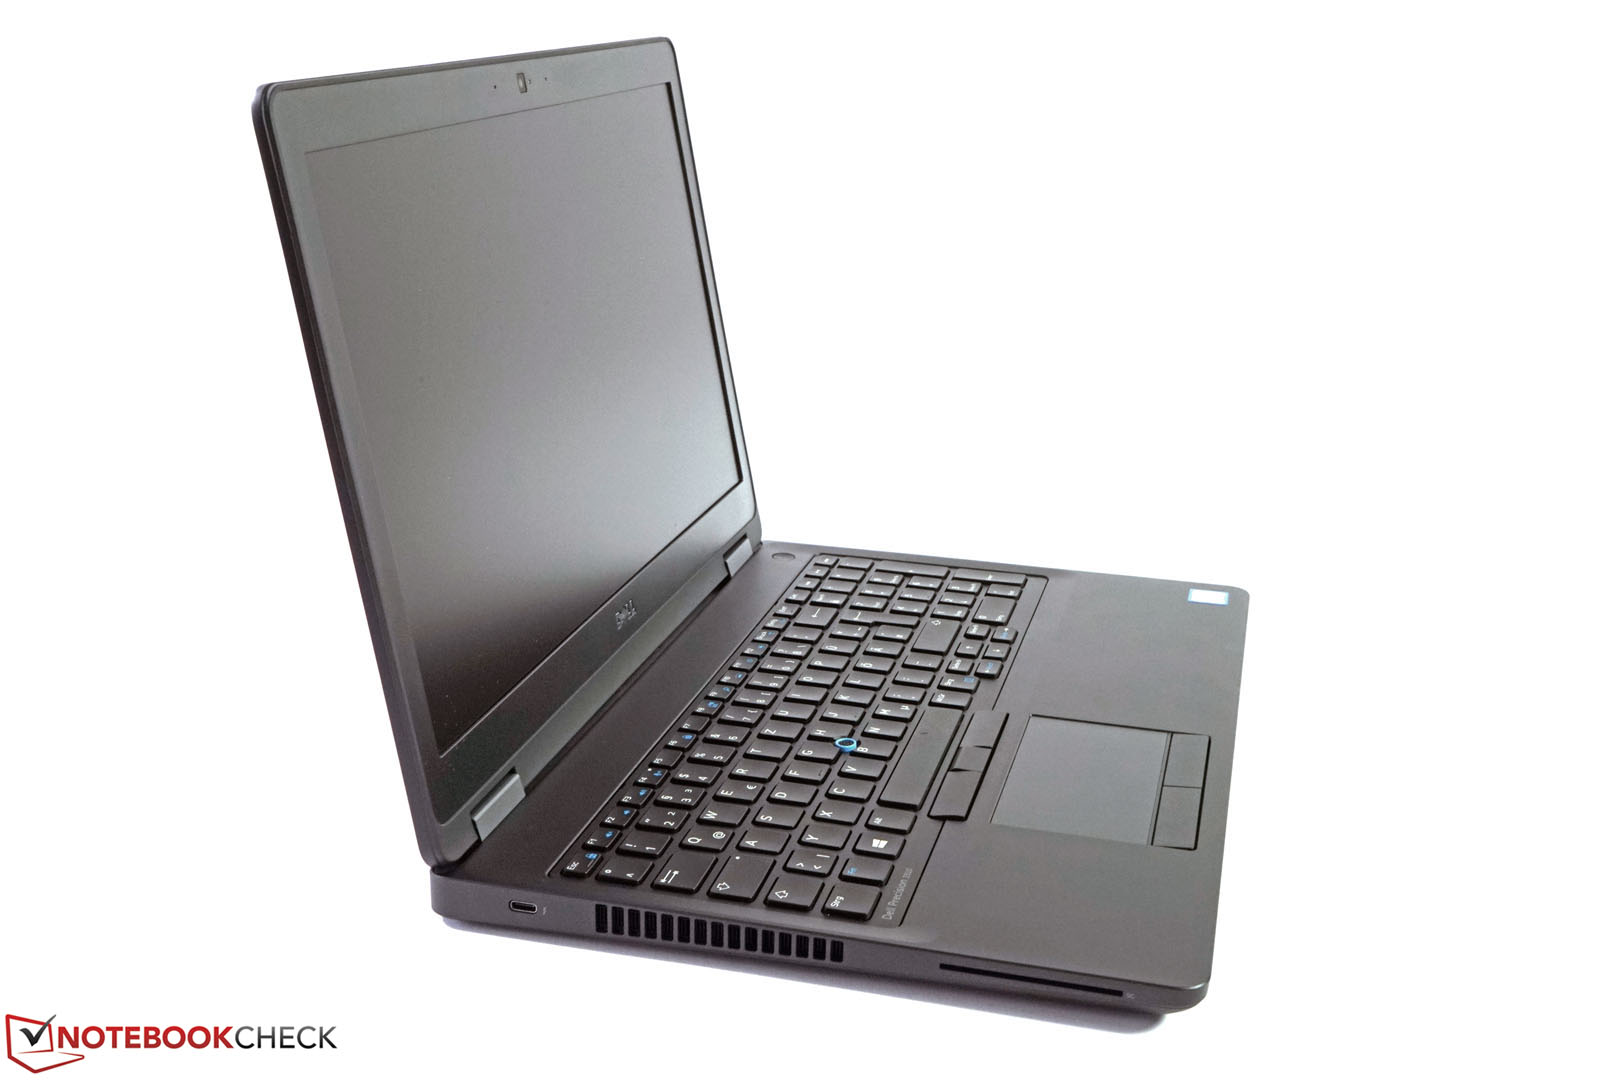
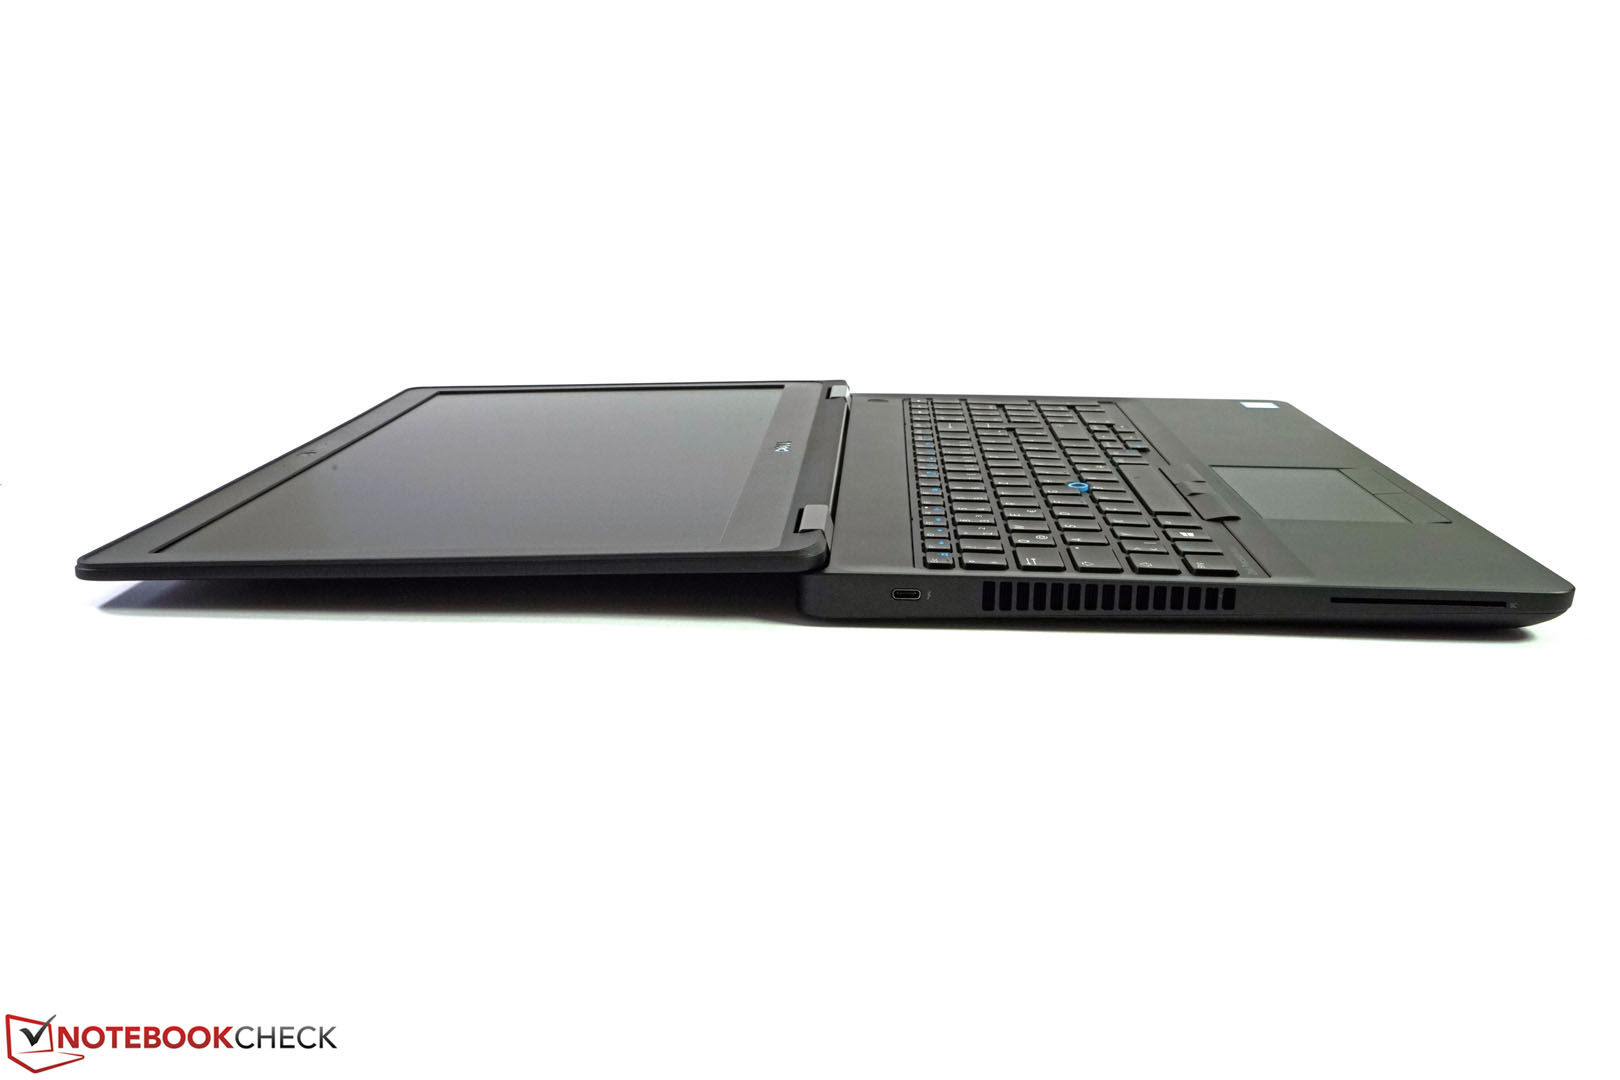
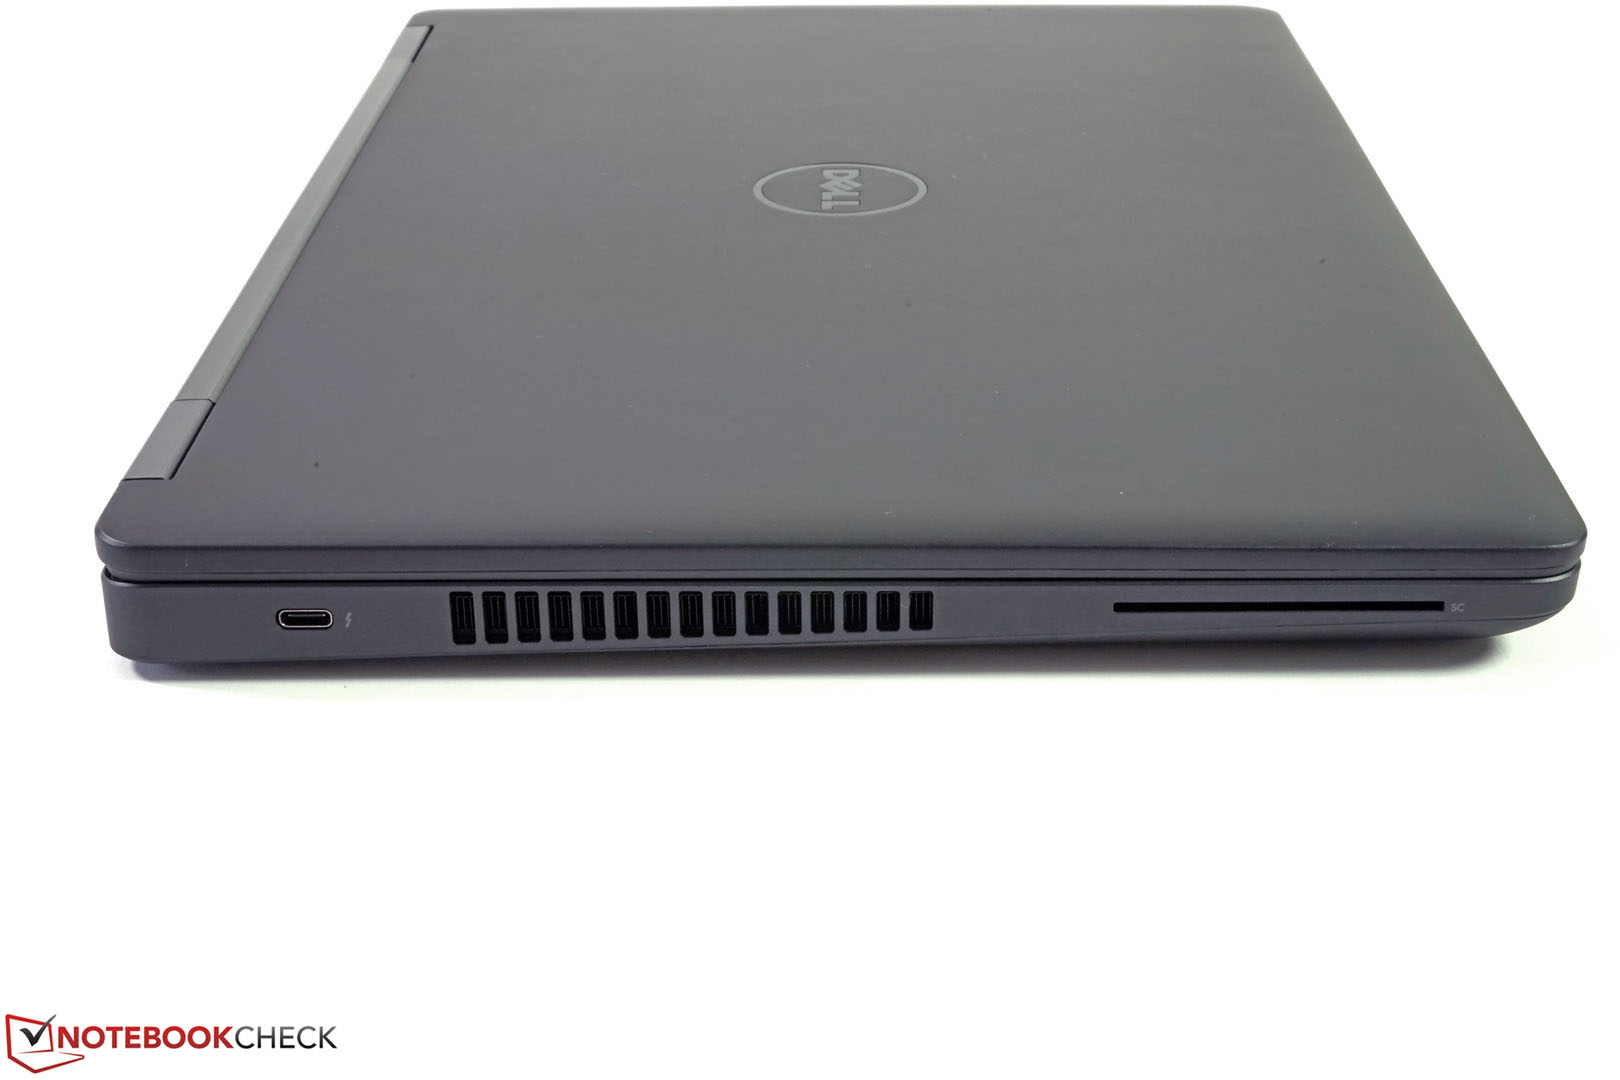
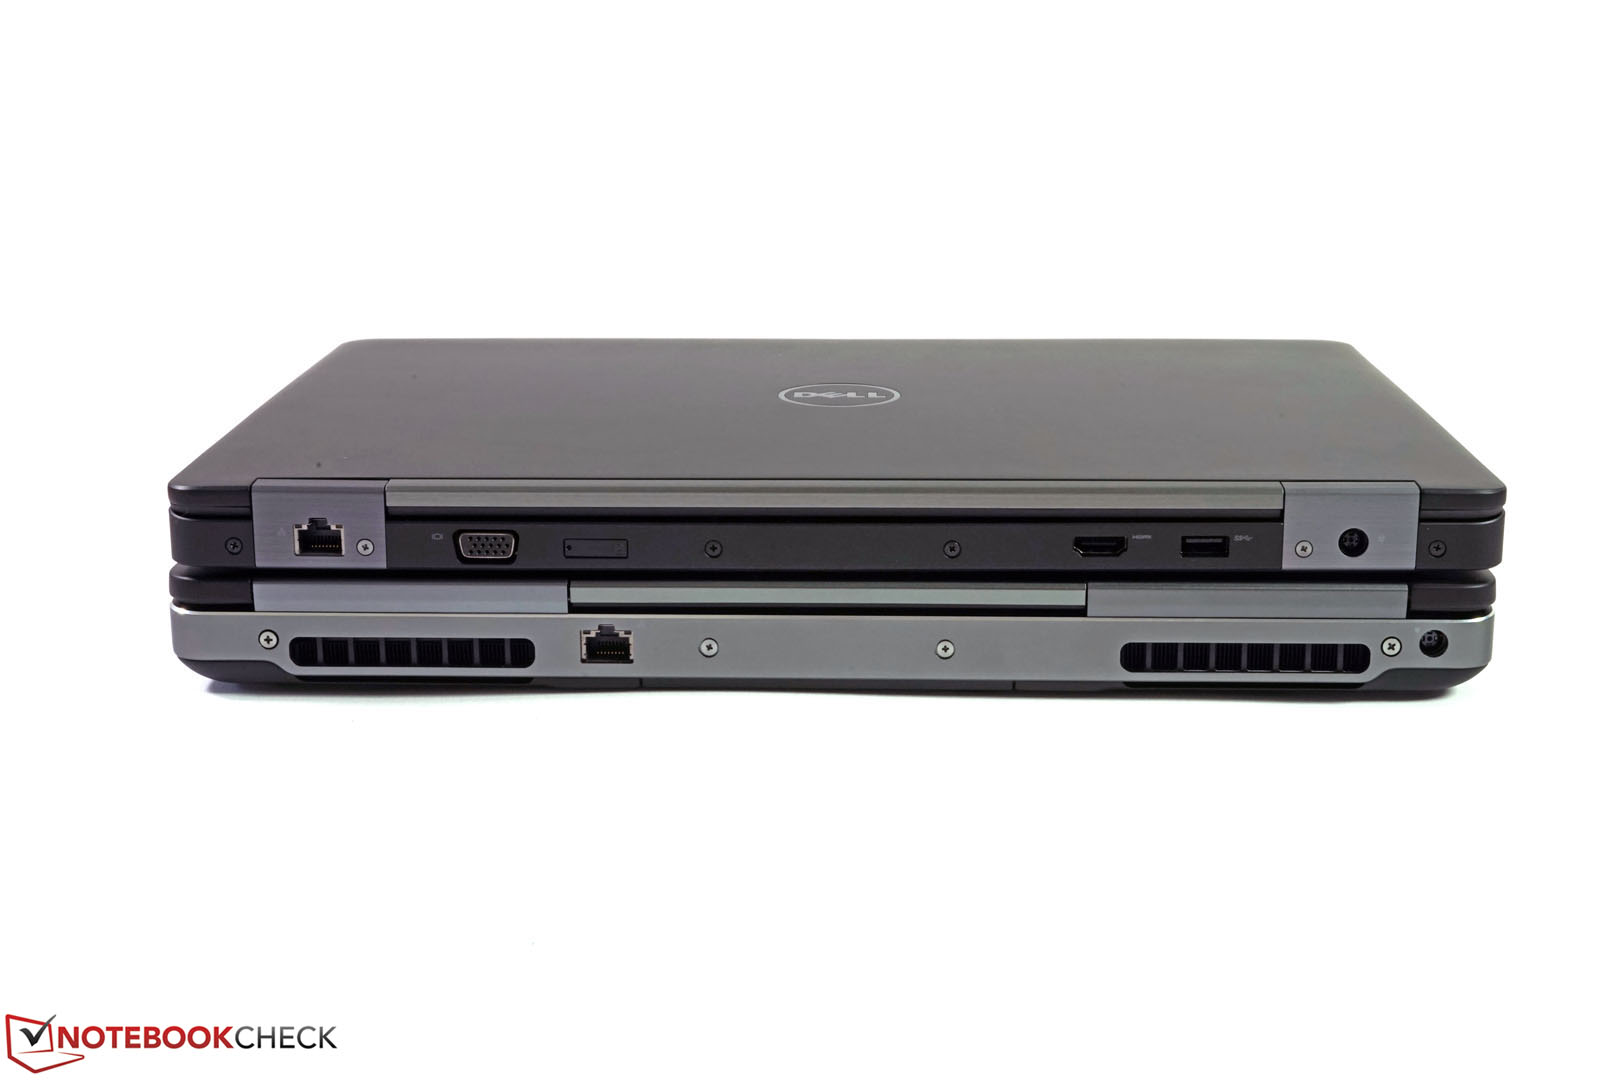
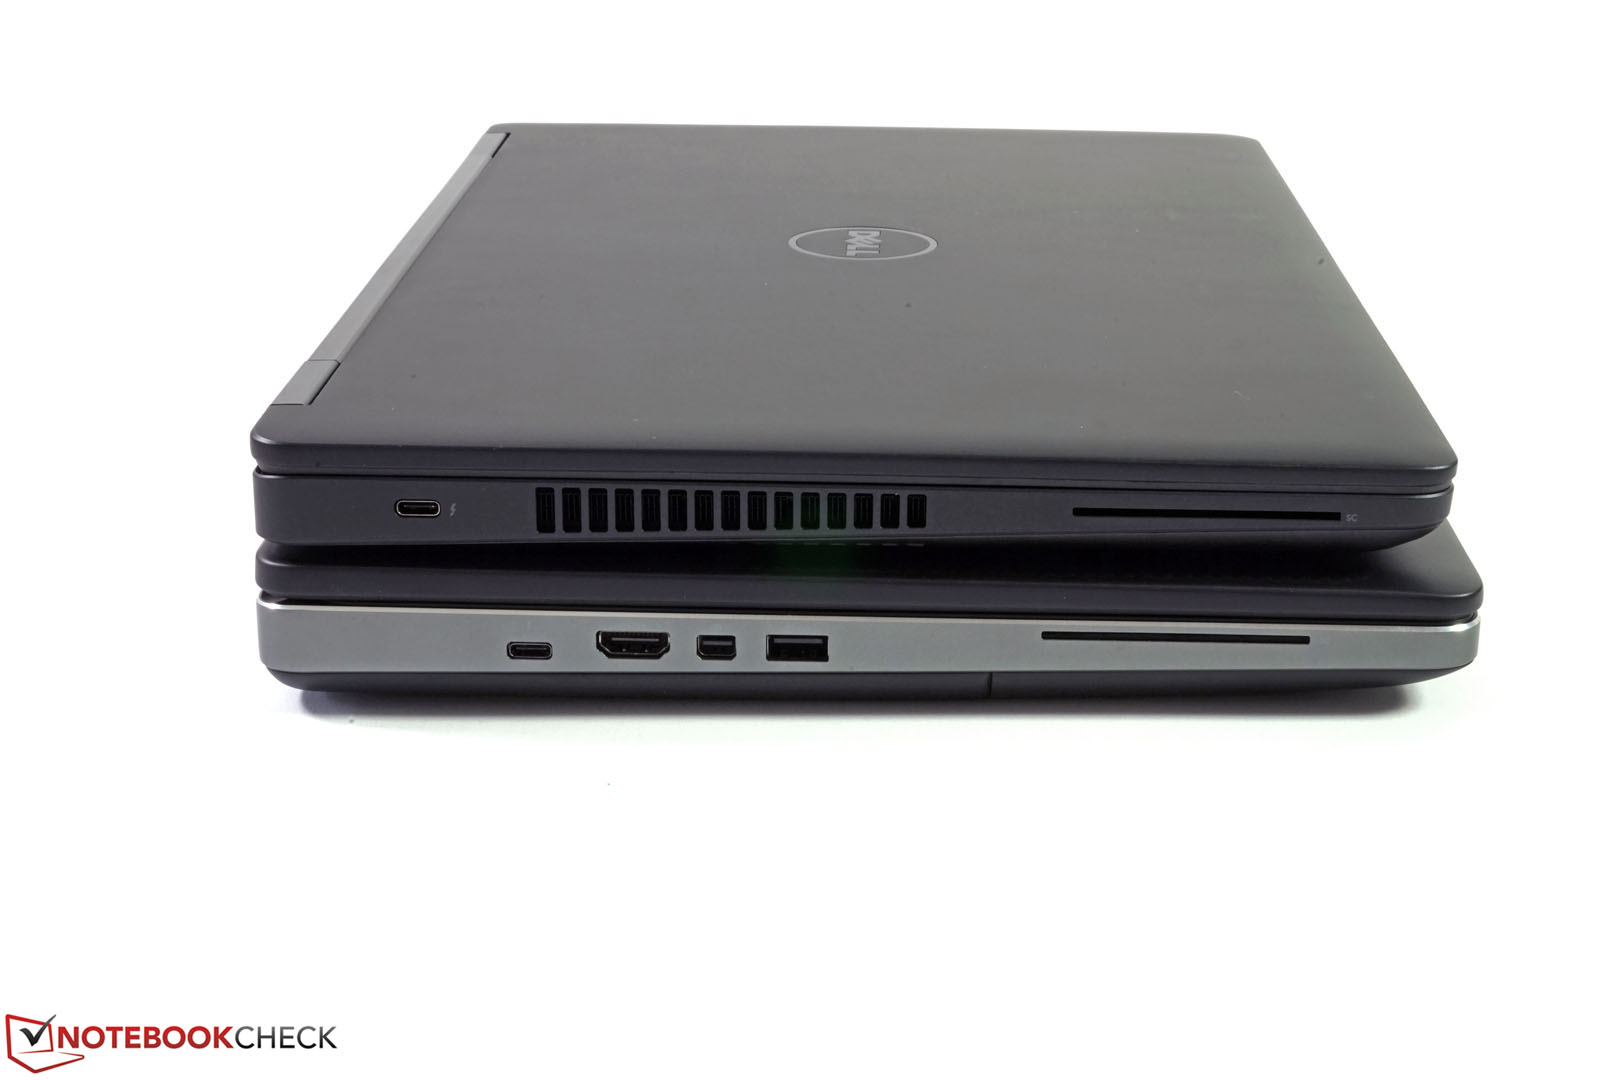
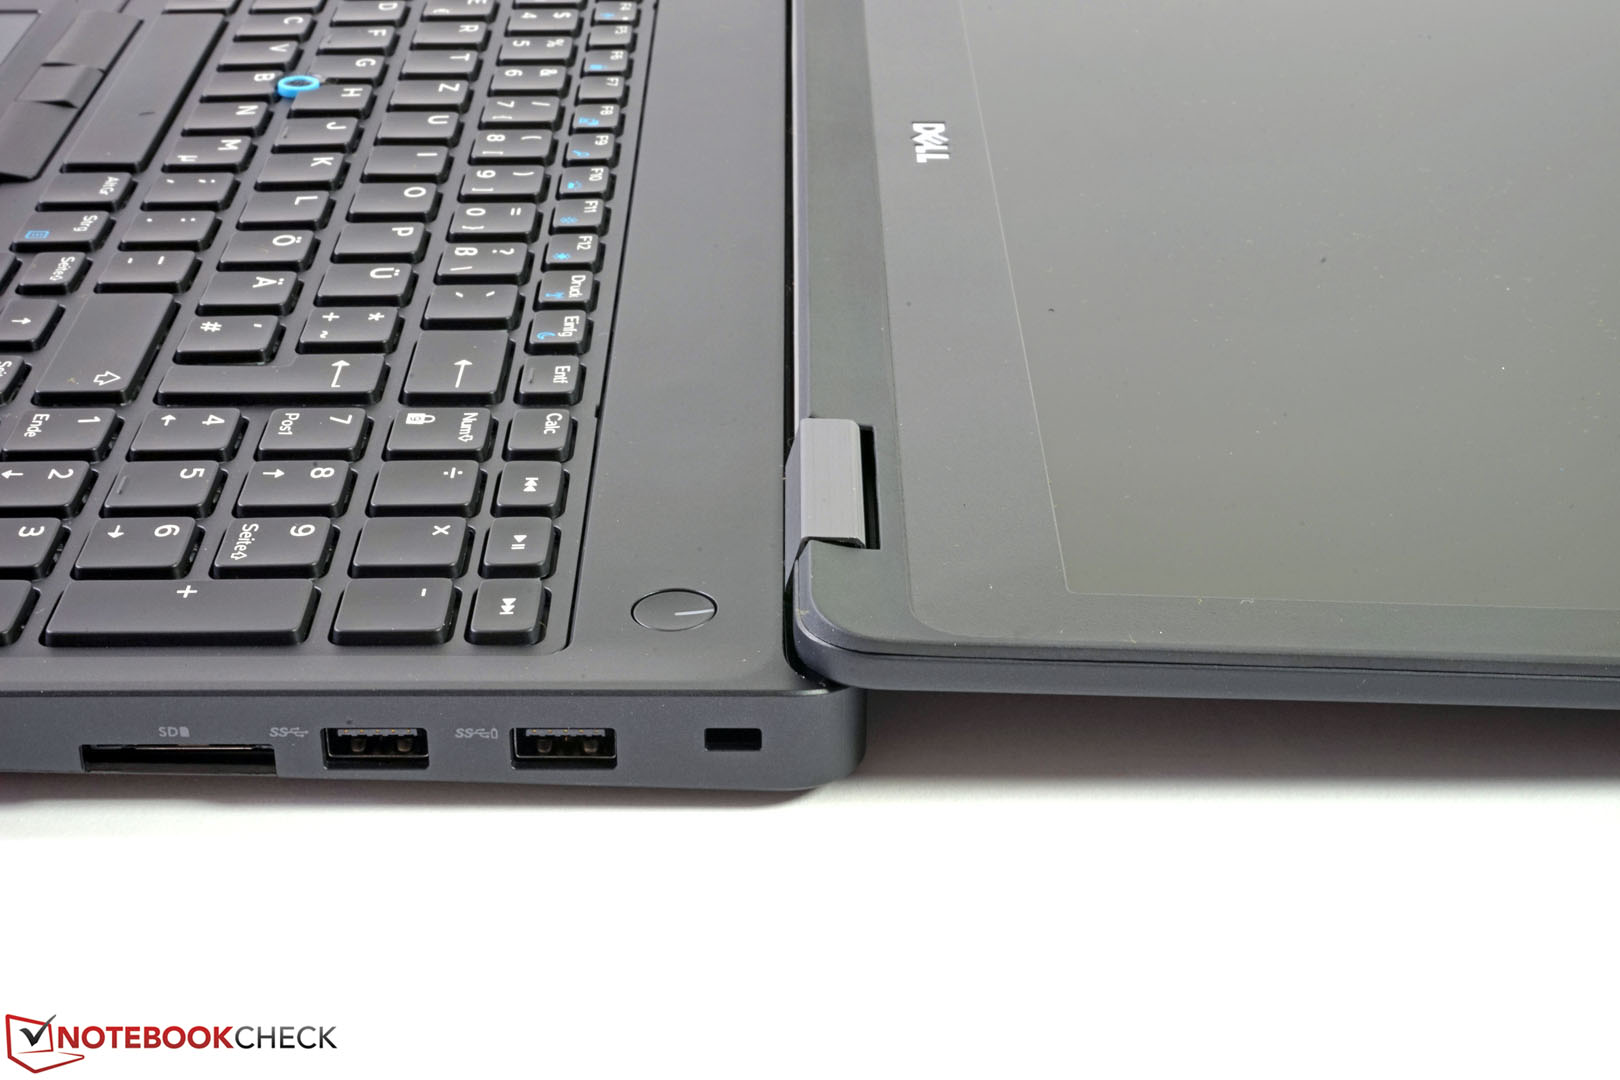
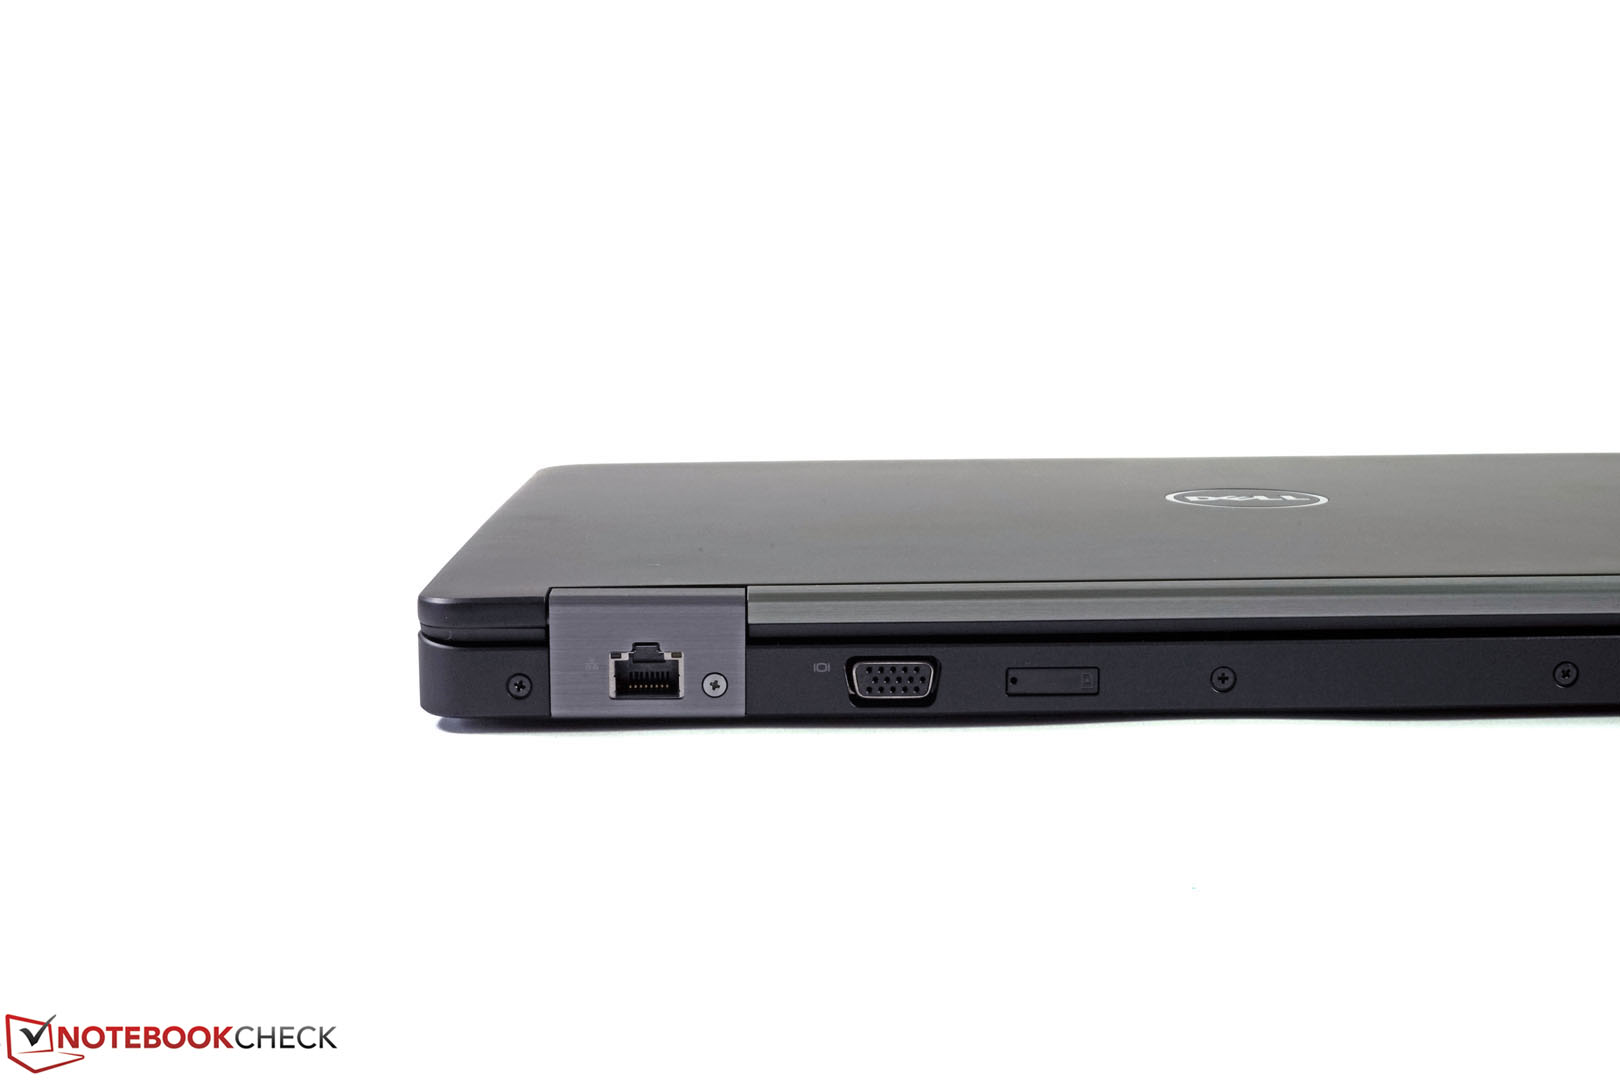
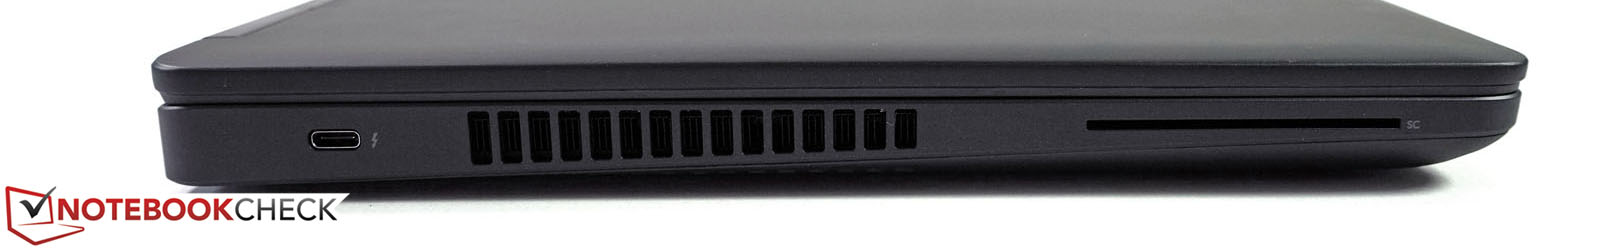
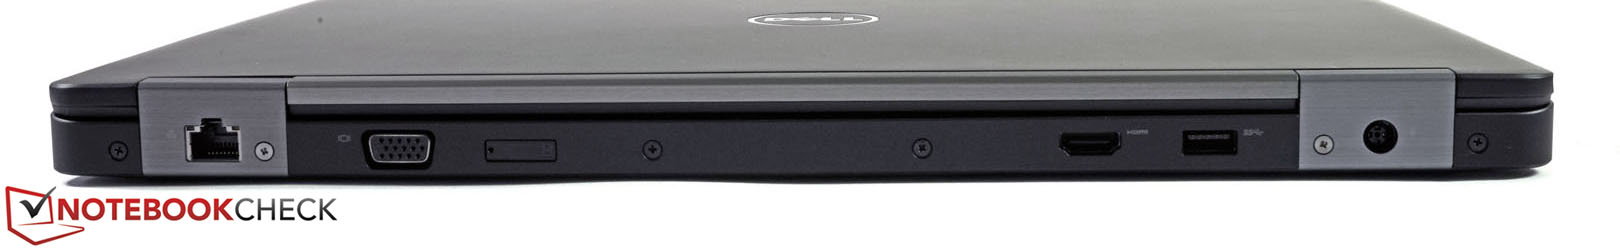
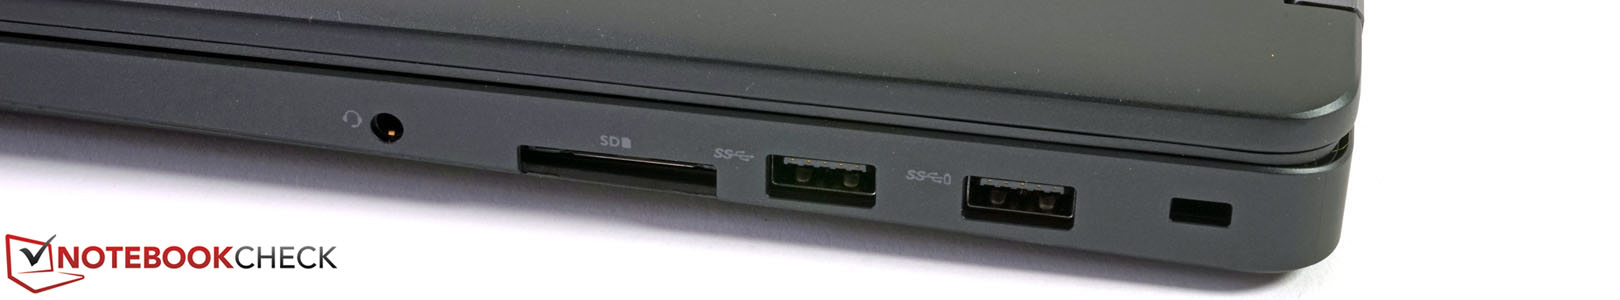
O Dell Precision 3510 é um aparelho profissional com evidente foco na mobilidade. Graças à sua fina construção, longas durações da bateria e um chassi sólido, é uma opção realmente interessante para o pessoal de campo. Outras vantagens deste workstation móvel são a conveniente seleção de portas, bem como a garantia disponível e opções de suporte.
O preço da série também é atraente e permite entrar de forma econômica para o mundo de workstations móveis.
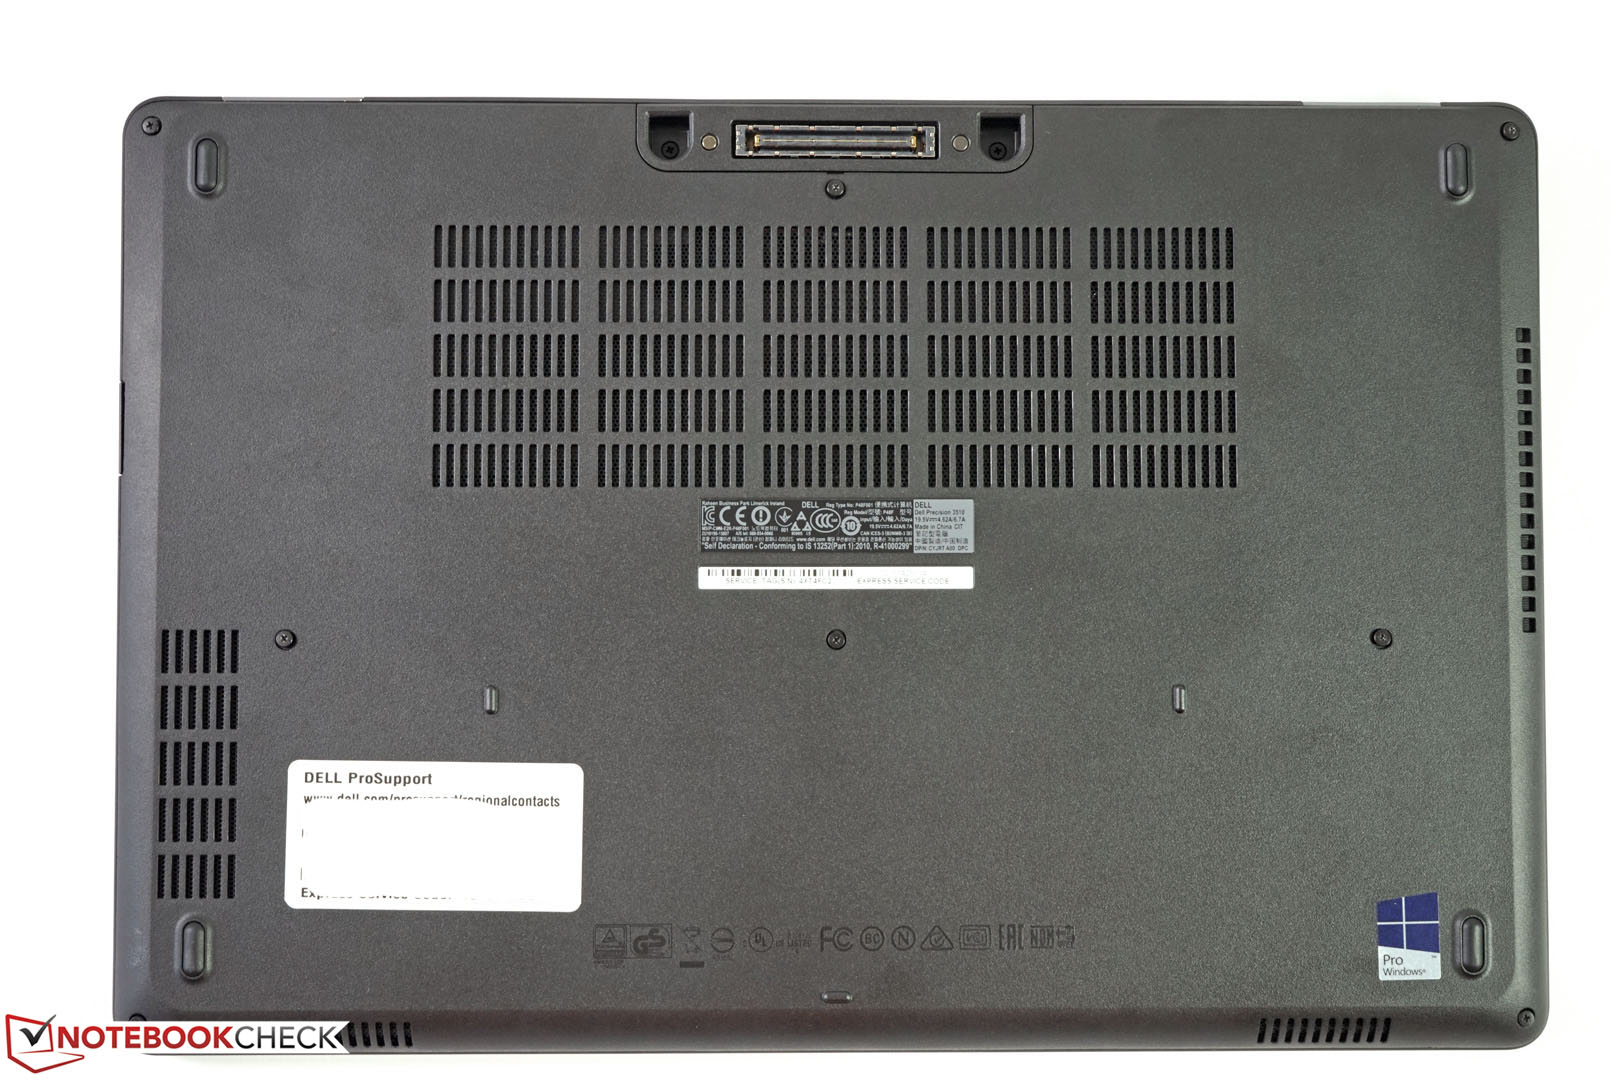
No entanto, você terá que fazer alguns compromissos na área principal, o desempenho cai de forma notável sob uso intenso contínuo e as emissões alcançarão nível inconvenientes nestes cenários. Outro ponto negativo é a limitada capacidade de upgrades e o desempenho CAD em geral. Alguns rivais simplesmente oferecem mais.
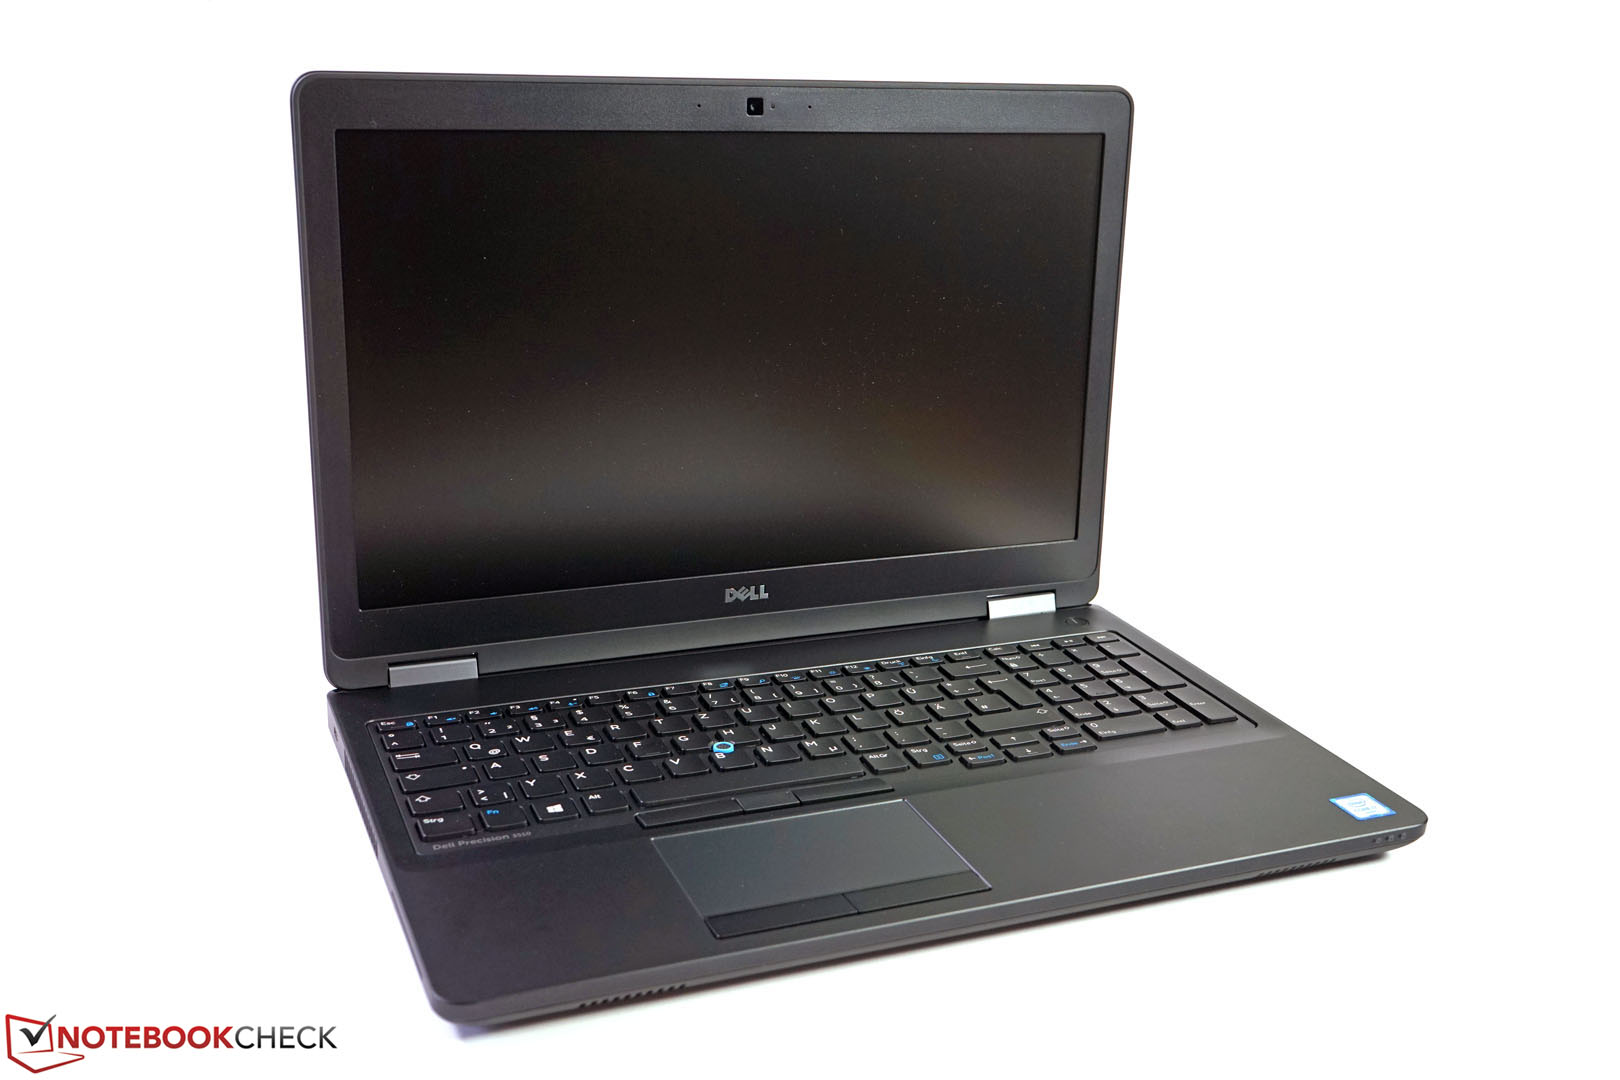
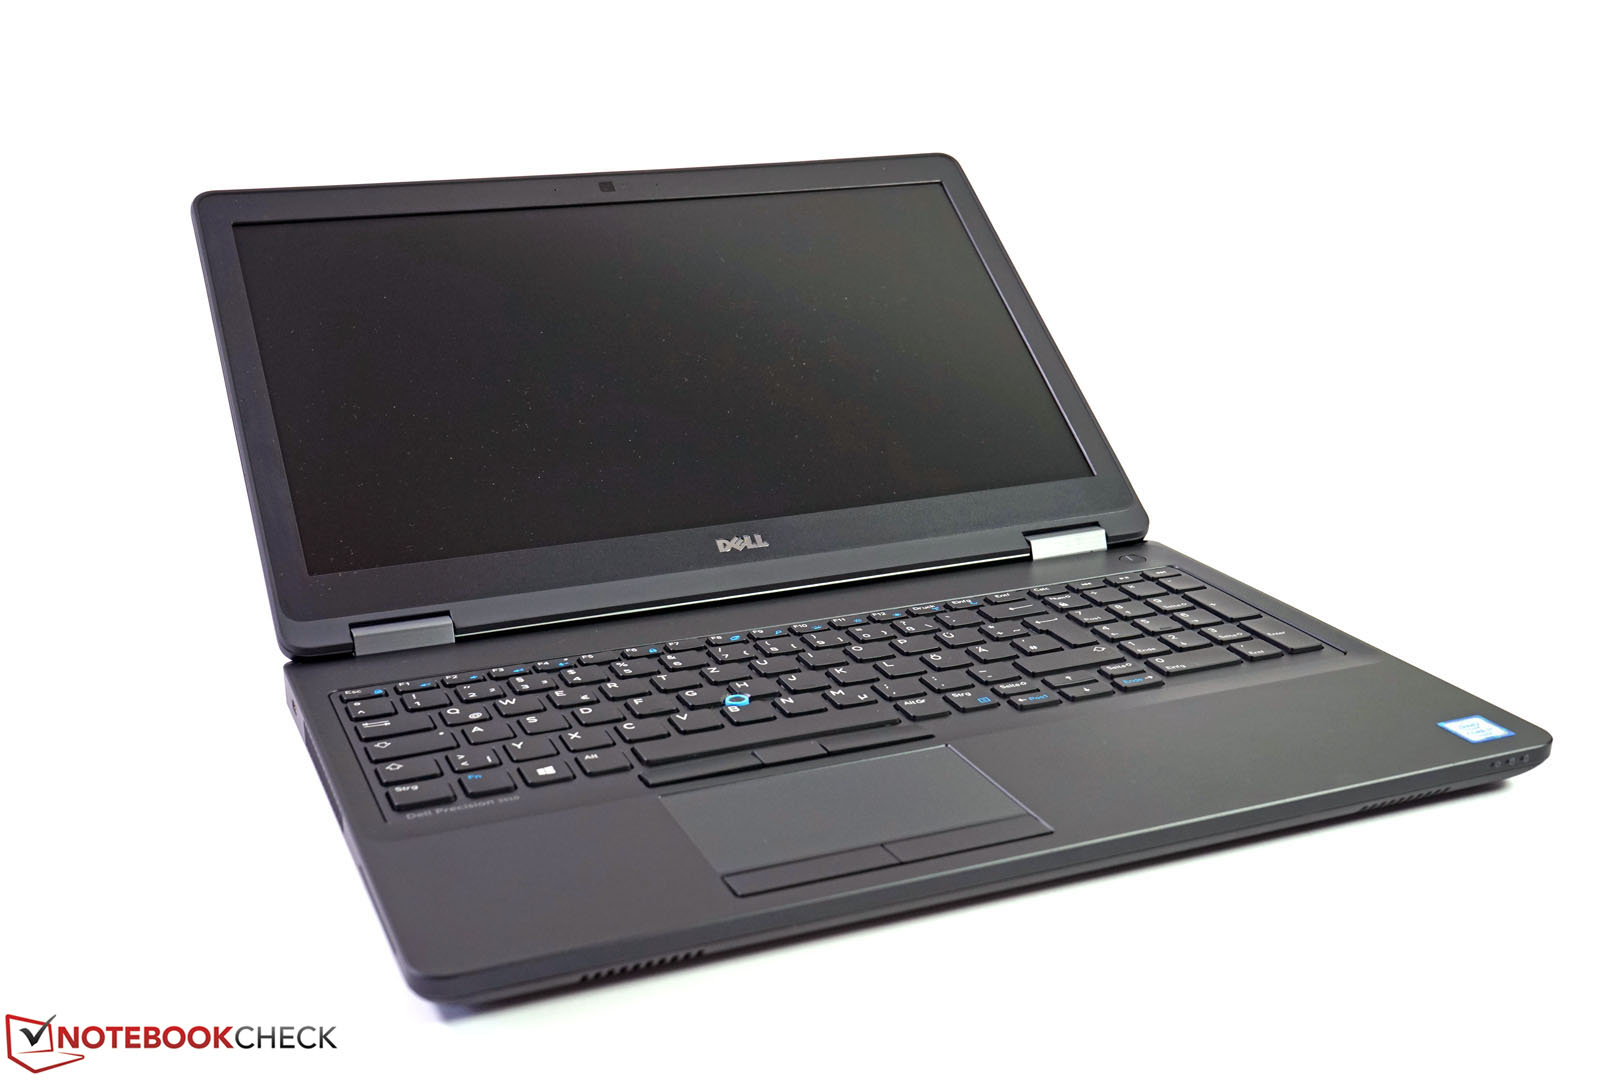
Embora você ainda poderia viver com esses aspectos, dependendo do cenário de uso, a tela do nosso modelo de teste não será uma escolha popular entre os usuários. Considerando a orientação profissional do aparelho, nenhuma das características da tela (resolução, luminescência, contraste, gama de cores, distribuição do brilho, estabilidade dos ângulos de visão) cumpre com os requisitos do grupo de usuários alvo.
Afortunadamente, a Dell oferece outras versões de tela em sua loja online, portanto, este problema pode ser evitado completamente e o aparelho deixaria uma impressão muito melhor.
Esta é uma versão reduzida da análise original. Você pode ler a análise completa em inglês aqui.
Dell Precision 3510
- 07/17/2016 v5.1 (old)
Tobias Winkler
Price comparison
