Breve Análise do Workstation Dell Precision 3530 (Xeon E-2176M, Quadro P600)
| SD Card Reader | |
| average JPG Copy Test (av. of 3 runs) | |
| Dell Precision 3520 (Toshiba Exceria Pro SDXC 64 GB UHS-II) | |
| HP ZBook 15 G4-Y4E80AV (Toshiba Exceria Pro SDXC 64 GB UHS-II) | |
| Dell Precision 3530 (Toshiba Exceria Pro SDXC 64 GB UHS-II) | |
| Lenovo ThinkPad P52 20MAS03N00 (Toshiba Exceria Pro SDXC 64 GB UHS-II) | |
| Dell Precision 5520 UHD (Toshiba Exceria Pro SDXC 64 GB UHS-II) | |
| Média da turma Workstation (49.6 - 681, n=14, últimos 2 anos) | |
| Lenovo ThinkPad P52S-20LB001FUS (Toshiba Exceria Pro SDXC 64 GB UHS-II) | |
| maximum AS SSD Seq Read Test (1GB) | |
| Dell Precision 5520 UHD (Toshiba Exceria Pro SDXC 64 GB UHS-II) | |
| Média da turma Workstation (87.6 - 1455, n=14, últimos 2 anos) | |
| HP ZBook 15 G4-Y4E80AV (Toshiba Exceria Pro SDXC 64 GB UHS-II) | |
| Dell Precision 3530 (Toshiba Exceria Pro SDXC 64 GB UHS-II) | |
| Lenovo ThinkPad P52 20MAS03N00 (Toshiba Exceria Pro SDXC 64 GB UHS-II) | |
| Dell Precision 3520 (Toshiba Exceria Pro SDXC 64 GB UHS-II) | |
| Lenovo ThinkPad P52S-20LB001FUS (Toshiba Exceria Pro SDXC 64 GB UHS-II) | |
| |||||||||||||||||||||||||
iluminação: 85 %
iluminação com acumulador: 285.7 cd/m²
Contraste: 922:1 (Preto: 0.31 cd/m²)
ΔE ColorChecker Calman: 5.84 | ∀{0.5-29.43 Ø4.71}
calibrated: 3.14
ΔE Greyscale Calman: 6.5 | ∀{0.09-98 Ø4.96}
94% sRGB (Argyll 1.6.3 3D)
62% AdobeRGB 1998 (Argyll 1.6.3 3D)
69.3% AdobeRGB 1998 (Argyll 3D)
94.6% sRGB (Argyll 3D)
72.8% Display P3 (Argyll 3D)
Gamma: 2.383
CCT: 7176 K
| Dell Precision 3530 BOE BOE06F1, IPS, 15.6", 1920x1080 | Dell Precision 3520 IPS LED, 15.6", 1920x1080 | Dell Precision 5520 UHD SHP1476, IPS, 15.6", 3840x2160 | Lenovo ThinkPad P52 20MAS03N00 N156HCE-EN1, IPS LED, 15.6", 1920x1080 | Lenovo ThinkPad P52S-20LB001FUS Lenovo LEN40BD, IPS, 15.6", 3840x2160 | HP ZBook 15 G4-Y4E80AV LG Philips LGD057E, IPS, 15.6", 1920x1080 | |
|---|---|---|---|---|---|---|
| Display | 0% | -1% | -7% | -6% | -13% | |
| Display P3 Coverage (%) | 72.8 | 72.7 0% | 67.4 -7% | 65.6 -10% | 67.3 -8% | 64 -12% |
| sRGB Coverage (%) | 94.6 | 94.8 0% | 98.5 4% | 90.3 -5% | 89.4 -5% | 82.7 -13% |
| AdobeRGB 1998 Coverage (%) | 69.3 | 69.3 0% | 68.9 -1% | 65.9 -5% | 65.4 -6% | 60.4 -13% |
| Response Times | -9% | -34% | 14% | 21% | 15% | |
| Response Time Grey 50% / Grey 80% * (ms) | 40.4 ? | 48 ? -19% | 59.2 ? -47% | 39.2 ? 3% | 43.2 ? -7% | 39.2 ? 3% |
| Response Time Black / White * (ms) | 34.8 ? | 34.4 ? 1% | 41.6 ? -20% | 26 ? 25% | 18 ? 48% | 25.6 ? 26% |
| PWM Frequency (Hz) | 1053 ? | 1064 ? | 25250 ? | 980 | 20830 ? | |
| Screen | 6% | 14% | 11% | 13% | 10% | |
| Brightness middle (cd/m²) | 285.7 | 345 21% | 372.4 30% | 304 6% | 305.5 7% | 321 12% |
| Brightness (cd/m²) | 275 | 329 20% | 368 34% | 293 7% | 282 3% | 320 16% |
| Brightness Distribution (%) | 85 | 88 4% | 90 6% | 88 4% | 78 -8% | 89 5% |
| Black Level * (cd/m²) | 0.31 | 0.37 -19% | 0.48 -55% | 0.26 16% | 0.24 23% | 0.29 6% |
| Contrast (:1) | 922 | 932 1% | 776 -16% | 1169 27% | 1273 38% | 1107 20% |
| Colorchecker dE 2000 * | 5.84 | 5 14% | 2.6 55% | 4.5 23% | 3.51 40% | 4.5 23% |
| Colorchecker dE 2000 max. * | 8.76 | 8 9% | 5.6 36% | 7.7 12% | 7.28 17% | 9.5 -8% |
| Colorchecker dE 2000 calibrated * | 3.14 | 2.4 24% | 3.15 -0% | |||
| Greyscale dE 2000 * | 6.5 | 6.2 5% | 3.7 43% | 5.2 20% | 4 38% | 2.9 55% |
| Gamma | 2.383 92% | 2.35 94% | 2.14 103% | 2.26 97% | 2.18 101% | 2.27 97% |
| CCT | 7176 91% | 6702 97% | 7096 92% | 6789 96% | 7291 89% | 6519 100% |
| Color Space (Percent of AdobeRGB 1998) (%) | 62 | 61.8 0% | 63 2% | 53.8 -13% | 58 -6% | 54.2 -13% |
| Color Space (Percent of sRGB) (%) | 94 | 94.7 1% | 99 5% | 90.1 -4% | 89 -5% | 82.6 -12% |
| Média Total (Programa/Configurações) | -1% /
3% | -7% /
5% | 6% /
8% | 9% /
11% | 4% /
6% |
* ... menor é melhor
Exibir tempos de resposta
| ↔ Tempo de resposta preto para branco | ||
|---|---|---|
| 34.8 ms ... ascensão ↗ e queda ↘ combinadas | ↗ 20.8 ms ascensão | 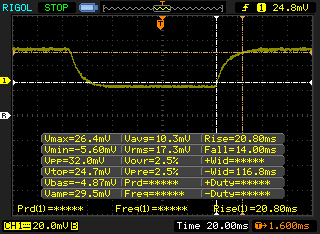 |
| ↘ 14 ms queda | ||
| A tela mostra taxas de resposta lentas em nossos testes e será insatisfatória para os jogadores. Em comparação, todos os dispositivos testados variam de 0.1 (mínimo) a 240 (máximo) ms. » 92 % de todos os dispositivos são melhores. Isso significa que o tempo de resposta medido é pior que a média de todos os dispositivos testados (19.8 ms). | ||
| ↔ Tempo de resposta 50% cinza a 80% cinza | ||
| 40.4 ms ... ascensão ↗ e queda ↘ combinadas | ↗ 22 ms ascensão | 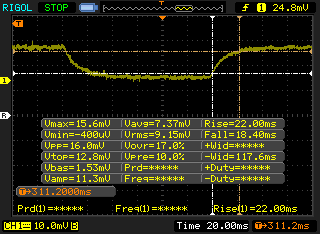 |
| ↘ 18.4 ms queda | ||
| A tela mostra taxas de resposta lentas em nossos testes e será insatisfatória para os jogadores. Em comparação, todos os dispositivos testados variam de 0.165 (mínimo) a 636 (máximo) ms. » 64 % de todos os dispositivos são melhores. Isso significa que o tempo de resposta medido é pior que a média de todos os dispositivos testados (30.9 ms). | ||
Cintilação da tela / PWM (modulação por largura de pulso)
| Tela tremeluzindo/PWM detectado | 1053 Hz | ≤ 98 % configuração de brilho | 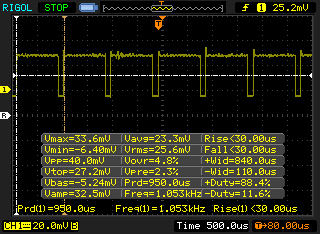 |
A luz de fundo da tela pisca em 1053 Hz (pior caso, por exemplo, utilizando PWM) Cintilação detectada em uma configuração de brilho de 98 % e abaixo. Não deve haver cintilação ou PWM acima desta configuração de brilho. A frequência de 1053 Hz é bastante alta, então a maioria dos usuários sensíveis ao PWM não deve notar nenhuma oscilação. [pwm_comparison] Em comparação: 52 % de todos os dispositivos testados não usam PWM para escurecer a tela. Se PWM foi detectado, uma média de 7744 (mínimo: 5 - máximo: 343500) Hz foi medida. | |||
| Cinebench R10 | |
| Rendering Multiple CPUs 32Bit | |
| Média da turma Workstation (n=1últimos 2 anos) | |
| Média Intel Xeon E-2176M (31923 - 43681, n=3) | |
| Dell Precision 3530 | |
| Lenovo ThinkPad P52S-20LB001FUS | |
| Rendering Single 32Bit | |
| Média da turma Workstation (n=1últimos 2 anos) | |
| Média Intel Xeon E-2176M (6928 - 9142, n=3) | |
| Dell Precision 3530 | |
| Lenovo ThinkPad P52S-20LB001FUS | |
| wPrime 2.10 - 1024m | |
| Dell Precision 5520 UHD | |
| Eurocom Tornado F5W | |
| Média da turma Workstation (n=1últimos 2 anos) | |
| Dell Precision 3530 | |
| Média Intel Xeon E-2176M (147 - 179.6, n=2) | |
* ... menor é melhor
| PCMark 8 Home Score Accelerated v2 | 4233 pontos | |
| PCMark 8 Creative Score Accelerated v2 | 5126 pontos | |
| PCMark 8 Work Score Accelerated v2 | 5295 pontos | |
| PCMark 10 Score | 4817 pontos | |
Ajuda | ||
| Dell Precision 3530 SK hynix PC400 512 GB | Dell Precision 3520 Toshiba XG4 NVMe (THNSN5512GPUK) | Dell Precision 5520 UHD Samsung SM961 MZVKW512HMJP m.2 PCI-e | Lenovo ThinkPad P52 20MAS03N00 Samsung SSD PM981 MZVLB512HAJQ | Lenovo ThinkPad P52S-20LB001FUS Samsung SSD PM981 MZVLB1T0HALR | HP ZBook 15 G4-Y4E80AV Samsung SSD SM961 1TB M.2 MZVKW1T0HMLH | |
|---|---|---|---|---|---|---|
| AS SSD | -31% | 29% | 33% | 26% | 35% | |
| Copy Game MB/s (MB/s) | 1050 | 747 -29% | 921 -12% | 1016 -3% | 982 -6% | |
| Copy Program MB/s (MB/s) | 346.1 | 340.4 -2% | 372.8 8% | 476.9 38% | 325.4 -6% | |
| Copy ISO MB/s (MB/s) | 1701 | 1053 -38% | 1659 -2% | 1016 -40% | 1486 -13% | |
| Score Total (Points) | 3013 | 1646 -45% | 3681 22% | 4307 43% | 4038 34% | 4303 43% |
| Score Write (Points) | 1138 | 248 -78% | 1379 21% | 2079 83% | 1468 29% | 1472 29% |
| Score Read (Points) | 1288 | 961 -25% | 1554 21% | 1485 15% | 1703 32% | 1902 48% |
| Access Time Write * (ms) | 0.053 | 0.034 36% | 0.023 57% | 0.031 42% | 0.04 25% | 0.023 57% |
| Access Time Read * (ms) | 0.099 | 0.123 -24% | 0.038 62% | 0.072 27% | 0.04 60% | 0.034 66% |
| 4K-64 Write (MB/s) | 908 | 134.5 -85% | 1055 16% | 1780 96% | 1245 37% | 1136 25% |
| 4K-64 Read (MB/s) | 994 | 788 -21% | 1223 23% | 1203 21% | 1524 53% | 1578 59% |
| 4K Write (MB/s) | 102.8 | 93.8 -9% | 155.3 51% | 121 18% | 100.5 -2% | 158 54% |
| 4K Read (MB/s) | 25.98 | 32.58 25% | 51.5 98% | 52.6 102% | 44.33 71% | 51.7 99% |
| Seq Write (MB/s) | 1272 | 201.9 -84% | 1694 33% | 1781 40% | 1220 -4% | 1777 40% |
| Seq Read (MB/s) | 2682 | 1406 -48% | 2799 4% | 2294 -14% | 1351 -50% | 2719 1% |
* ... menor é melhor

| 3DMark 06 Standard Score | 18112 pontos | |
| 3DMark 11 Performance | 5193 pontos | |
| 3DMark Cloud Gate Standard Score | 19813 pontos | |
| 3DMark Fire Strike Score | 3858 pontos | |
Ajuda | ||
| BioShock Infinite - 1920x1080 Ultra Preset, DX11 (DDOF) (classificar por valor) | |
| Dell Precision 3520 | |
| Dell Precision 5520 UHD | |
| MSI WS63VR 7RL-023US | |
| Média NVIDIA Quadro P600 (n=1) | |
| Rise of the Tomb Raider | |
| 1920x1080 Very High Preset AA:FX AF:16x (classificar por valor) | |
| Dell Precision 3530 | |
| Lenovo ThinkPad P52S-20LB001FUS | |
| MSI WS63VR 7RL-023US | |
| Média NVIDIA Quadro P600 (20 - 21, n=2) | |
| 1366x768 Medium Preset AF:2x (classificar por valor) | |
| Dell Precision 3530 | |
| Dell Precision 3520 | |
| Lenovo ThinkPad P52S-20LB001FUS | |
| MSI WS63VR 7RL-023US | |
| Média NVIDIA Quadro P600 (45 - 46.5, n=2) | |
| baixo | média | alto | ultra | |
|---|---|---|---|---|
| The Witcher 3 (2015) | 60 | 45 | 25 | 14 |
| Rise of the Tomb Raider (2016) | 70 | 45 | 23 | 20 |
| Rocket League (2017) | 220 | 118 | 72 | |
| Middle-earth: Shadow of War (2017) | 81 | 32 | 23 | 17 |
Barulho
| Ocioso |
| 28.3 / 28.3 / 28.4 dB |
| Carga |
| 46.2 / 48.6 dB |
 | ||
30 dB silencioso 40 dB(A) audível 50 dB(A) ruidosamente alto |
||
min: | ||
| Dell Precision 3530 Quadro P600, E-2176M, SK hynix PC400 512 GB | Dell Precision 3520 Quadro M620, i7-7820HQ, Toshiba XG4 NVMe (THNSN5512GPUK) | Dell Precision 5520 UHD Quadro M1200, E3-1505M v6, Samsung SM961 MZVKW512HMJP m.2 PCI-e | Lenovo ThinkPad P52 20MAS03N00 Quadro P1000, i7-8750H, Samsung SSD PM981 MZVLB512HAJQ | Lenovo ThinkPad P52S-20LB001FUS Quadro P500, i7-8650U, Samsung SSD PM981 MZVLB1T0HALR | HP ZBook 15 G4-Y4E80AV Quadro M2200, E3-1535M v6, Samsung SSD SM961 1TB M.2 MZVKW1T0HMLH | |
|---|---|---|---|---|---|---|
| Noise | -3% | -2% | 5% | 4% | 4% | |
| desligado / ambiente * (dB) | 28.1 | 29.6 -5% | 28.7 -2% | 29.5 -5% | 28.3 -1% | 29.5 -5% |
| Idle Minimum * (dB) | 28.3 | 29.6 -5% | 28.7 -1% | 29.5 -4% | 28.3 -0% | 29.5 -4% |
| Idle Average * (dB) | 28.3 | 29.6 -5% | 32.1 -13% | 29.5 -4% | 28.3 -0% | 29.5 -4% |
| Idle Maximum * (dB) | 28.4 | 31.2 -10% | 32.1 -13% | 29.5 -4% | 29.8 -5% | 30 -6% |
| Load Average * (dB) | 46.2 | 43 7% | 41.3 11% | 34.7 25% | 40.6 12% | 39.5 15% |
| Load Maximum * (dB) | 48.6 | 46.9 3% | 45.5 6% | 39.4 19% | 40.6 16% | 36 26% |
| Witcher 3 ultra * (dB) | 45.5 | 33.1 | 40.6 | 39.5 |
* ... menor é melhor
(±) A temperatura máxima no lado superior é 44.8 °C / 113 F, em comparação com a média de 38.2 °C / 101 F , variando de 22.2 a 69.8 °C para a classe Workstation.
(-) A parte inferior aquece até um máximo de 56.4 °C / 134 F, em comparação com a média de 41.1 °C / 106 F
(+) Em uso inativo, a temperatura média para o lado superior é 25.9 °C / 79 F, em comparação com a média do dispositivo de 32 °C / ### class_avg_f### F.
(+) Os apoios para as mãos e o touchpad são mais frios que a temperatura da pele, com um máximo de 23.4 °C / 74.1 F e, portanto, são frios ao toque.
(+) A temperatura média da área do apoio para as mãos de dispositivos semelhantes foi 27.8 °C / 82 F (+4.4 °C / 7.9 F).
Dell Precision 3530 análise de áudio
(±) | o volume do alto-falante é médio, mas bom (###valor### dB)
Graves 100 - 315Hz
(±) | graves reduzidos - em média 13.4% menor que a mediana
(±) | a linearidade dos graves é média (14.9% delta para a frequência anterior)
Médios 400 - 2.000 Hz
(±) | médios mais altos - em média 5.5% maior que a mediana
(±) | a linearidade dos médios é média (7.5% delta para frequência anterior)
Altos 2 - 16 kHz
(+) | agudos equilibrados - apenas 1.3% longe da mediana
(+) | os máximos são lineares (5.2% delta da frequência anterior)
Geral 100 - 16.000 Hz
(±) | a linearidade do som geral é média (17.9% diferença em relação à mediana)
Comparado com a mesma classe
» 56% de todos os dispositivos testados nesta classe foram melhores, 11% semelhantes, 33% piores
» O melhor teve um delta de 7%, a média foi 17%, o pior foi 35%
Comparado com todos os dispositivos testados
» 37% de todos os dispositivos testados foram melhores, 8% semelhantes, 55% piores
» O melhor teve um delta de 4%, a média foi 23%, o pior foi 134%
Dell Precision 5520 UHD análise de áudio
(±) | o volume do alto-falante é médio, mas bom (###valor### dB)
Graves 100 - 315Hz
(±) | graves reduzidos - em média 12.8% menor que a mediana
(±) | a linearidade dos graves é média (14.2% delta para a frequência anterior)
Médios 400 - 2.000 Hz
(+) | médios equilibrados - apenas 4% longe da mediana
(±) | a linearidade dos médios é média (9.9% delta para frequência anterior)
Altos 2 - 16 kHz
(+) | agudos equilibrados - apenas 3.3% longe da mediana
(±) | a linearidade dos máximos é média (12% delta para frequência anterior)
Geral 100 - 16.000 Hz
(±) | a linearidade do som geral é média (16.7% diferença em relação à mediana)
Comparado com a mesma classe
» 46% de todos os dispositivos testados nesta classe foram melhores, 9% semelhantes, 45% piores
» O melhor teve um delta de 7%, a média foi 17%, o pior foi 35%
Comparado com todos os dispositivos testados
» 29% de todos os dispositivos testados foram melhores, 7% semelhantes, 64% piores
» O melhor teve um delta de 4%, a média foi 23%, o pior foi 134%
| desligado | |
| Ocioso | |
| Carga |
|
Key:
min: | |
| Dell Precision 3530 E-2176M, Quadro P600, SK hynix PC400 512 GB, IPS, 1920x1080, 15.6" | Dell Precision 3520 i7-7820HQ, Quadro M620, Toshiba XG4 NVMe (THNSN5512GPUK), IPS LED, 1920x1080, 15.6" | Dell Precision 5520 UHD E3-1505M v6, Quadro M1200, Samsung SM961 MZVKW512HMJP m.2 PCI-e, IPS, 3840x2160, 15.6" | Lenovo ThinkPad P52 20MAS03N00 i7-8750H, Quadro P1000, Samsung SSD PM981 MZVLB512HAJQ, IPS LED, 1920x1080, 15.6" | Lenovo ThinkPad P52S-20LB001FUS i7-8650U, Quadro P500, Samsung SSD PM981 MZVLB1T0HALR, IPS, 3840x2160, 15.6" | HP ZBook 15 G4-Y4E80AV E3-1535M v6, Quadro M2200, Samsung SSD SM961 1TB M.2 MZVKW1T0HMLH, IPS, 1920x1080, 15.6" | |
|---|---|---|---|---|---|---|
| Power Consumption | 0% | -30% | 4% | 10% | -13% | |
| Idle Minimum * (Watt) | 5.3 | 5.8 -9% | 8.9 -68% | 4.02 24% | 5.9 -11% | 5.9 -11% |
| Idle Average * (Watt) | 10.7 | 10.7 -0% | 13.6 -27% | 7.2 33% | 11.7 -9% | 8.9 17% |
| Idle Maximum * (Watt) | 14.1 | 13.3 6% | 14.1 -0% | 11.46 19% | 15.6 -11% | 12.7 10% |
| Load Average * (Watt) | 85.4 | 78.2 8% | 100.3 -17% | 76.3 11% | 63 26% | 95.2 -11% |
| Witcher 3 ultra * (Watt) | 75.5 | 58.8 22% | 100.2 -33% | 74 2% | 48.4 36% | 87.7 -16% |
| Load Maximum * (Watt) | 91.9 | 116 -26% | 126.3 -37% | 154 -68% | 63.1 31% | 154 -68% |
* ... menor é melhor
| Dell Precision 3530 E-2176M, Quadro P600, 92 Wh | Dell Precision 3520 i7-7820HQ, Quadro M620, 68 Wh | Dell Precision 5520 UHD E3-1505M v6, Quadro M1200, 97 Wh | Lenovo ThinkPad P52 20MAS03N00 i7-8750H, Quadro P1000, 96 Wh | Lenovo ThinkPad P52S-20LB001FUS i7-8650U, Quadro P500, 80 Wh | HP ZBook 15 G4-Y4E80AV E3-1535M v6, Quadro M2200, 90 Wh | |
|---|---|---|---|---|---|---|
| Duração da bateria | -16% | -43% | 10% | 20% | 5% | |
| Reader / Idle (h) | 18.8 | 16.6 -12% | 12.1 -36% | 25.3 35% | 17.2 -9% | 18.3 -3% |
| WiFi v1.3 (h) | 9.3 | 7.6 -18% | 4.2 -55% | 10.6 14% | 11.1 19% | 9.1 -2% |
| Load (h) | 1.6 | 1.3 -19% | 1 -37% | 1.3 -19% | 2.4 50% | 1.9 19% |
Pro
Contra
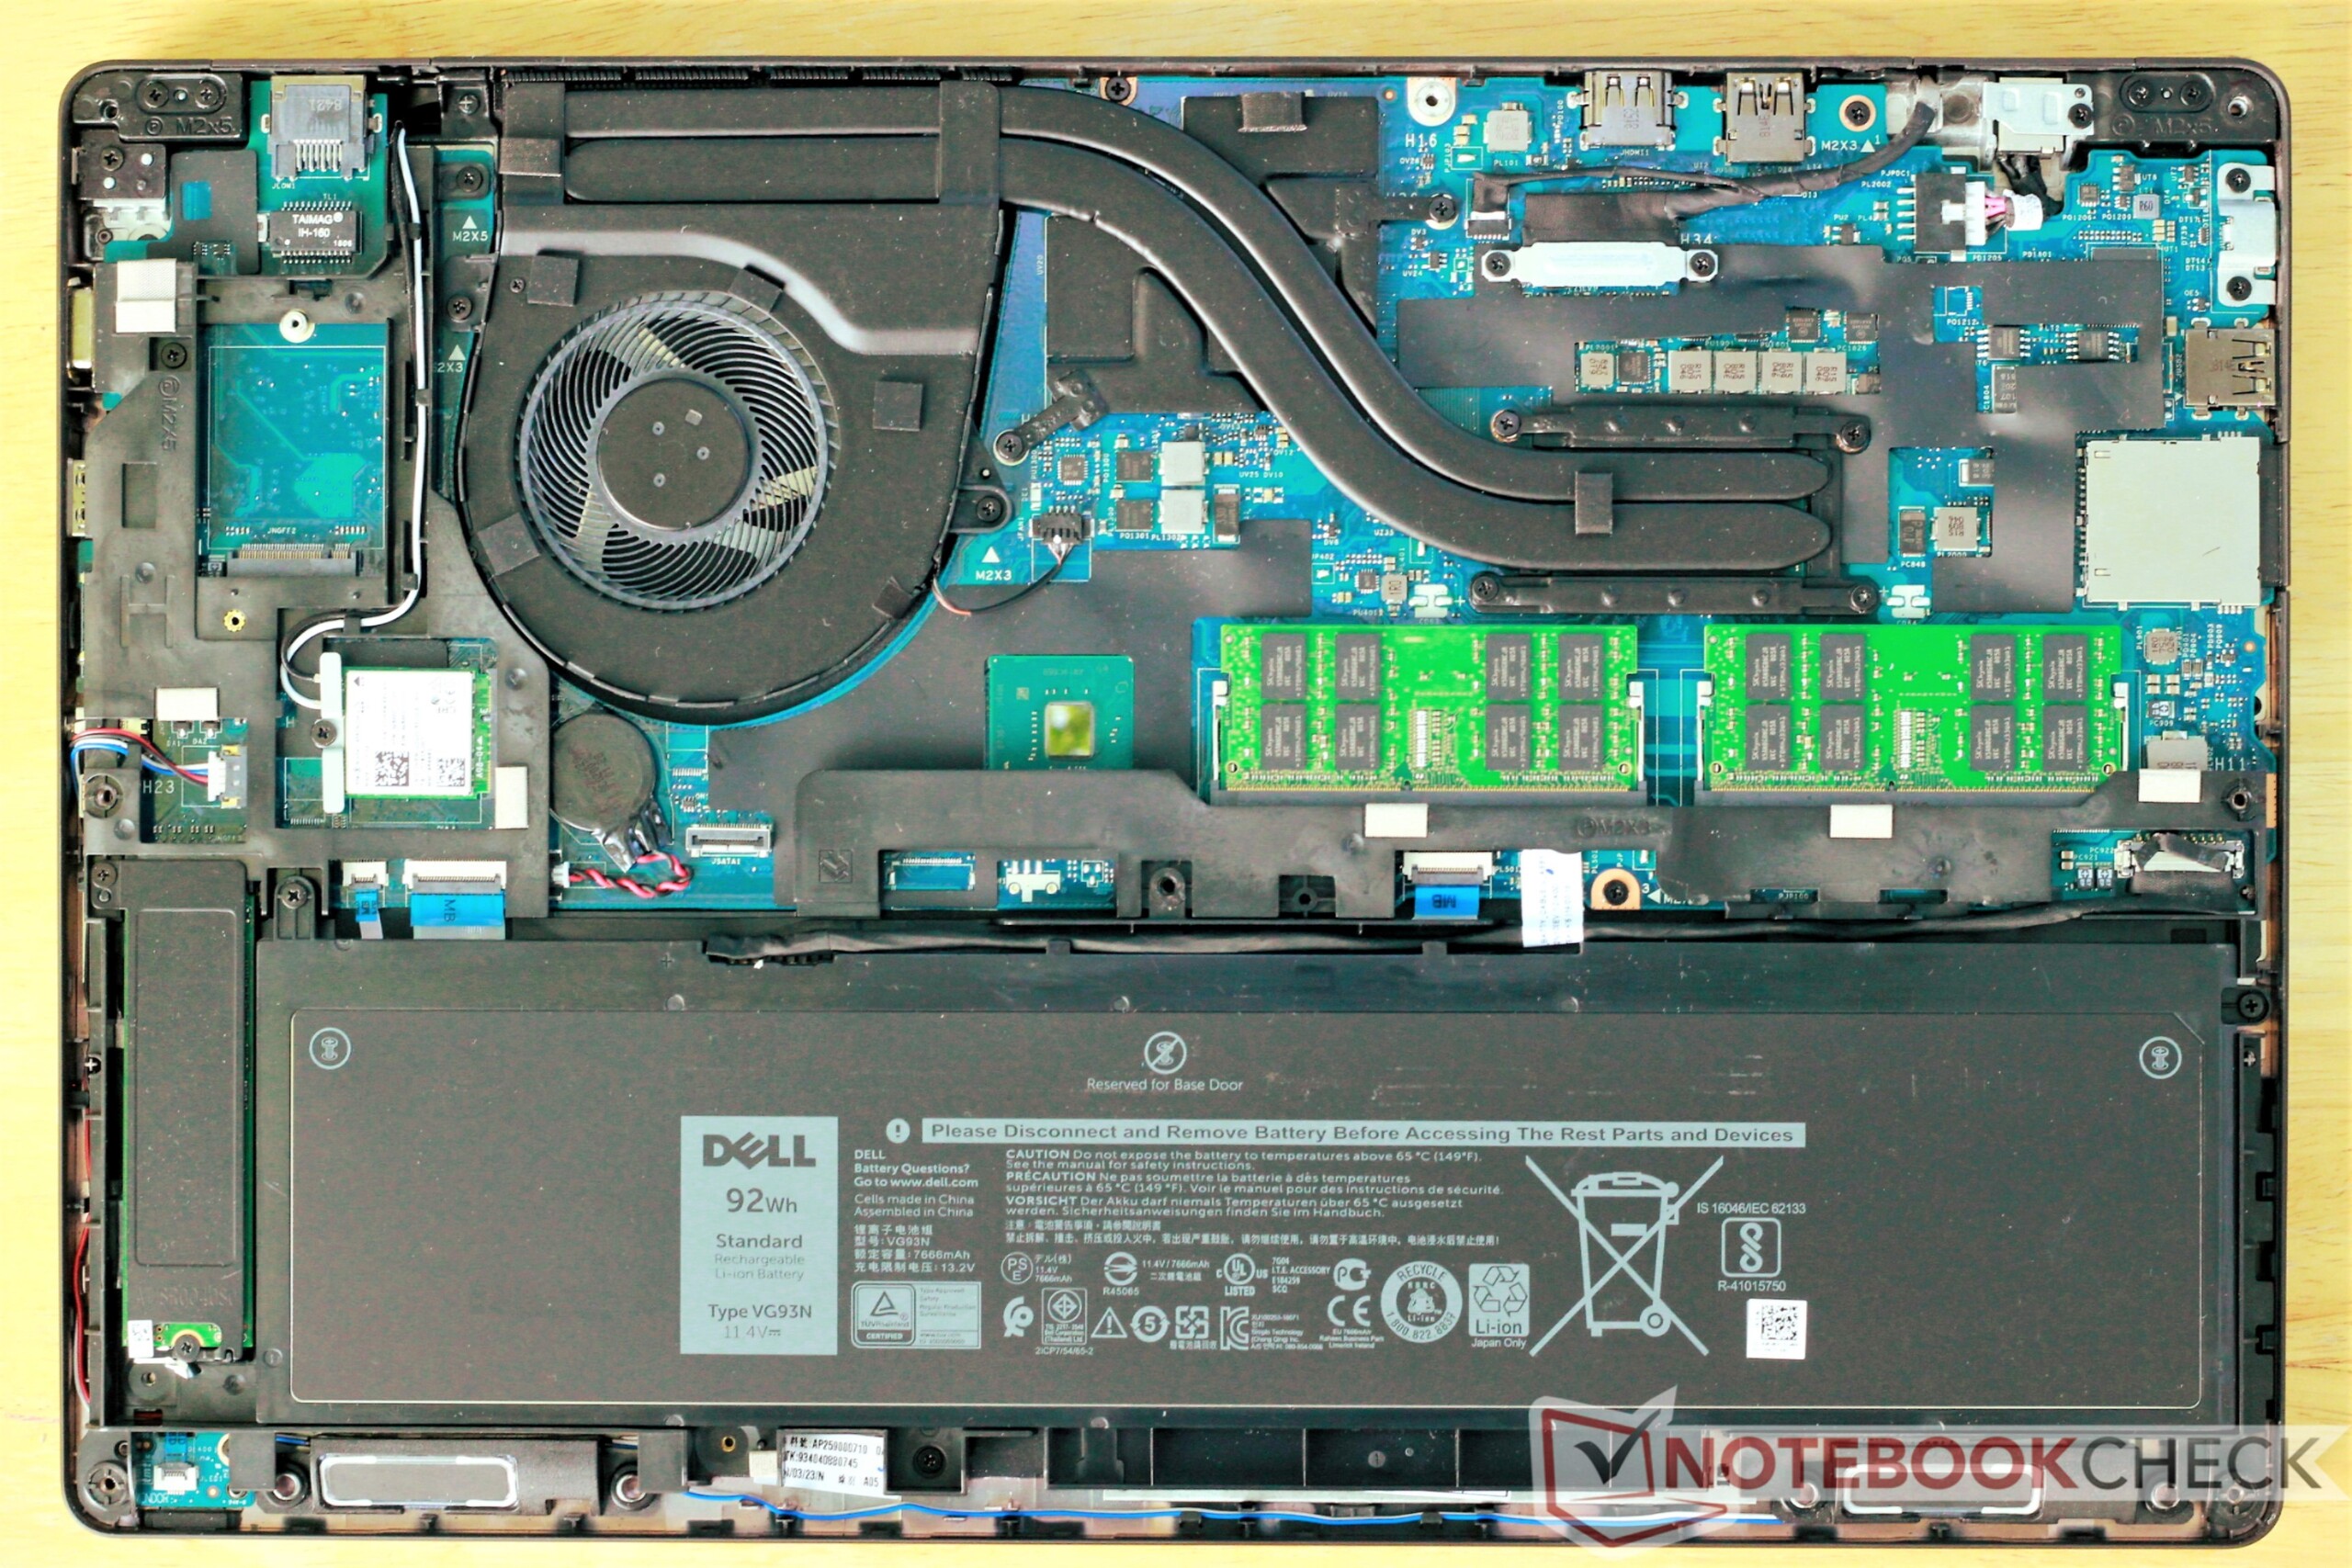
A história do Dell Precision 3530 é uma de compromisso. A Dell recicla o chassi do antigo 3520, mas vem com um hardware mais potente. Esta escolha deixa o 3530 cheio de problemas semelhantes, notavelmente o gerenciamento de calor e ruído. Assim como o 3520, o 3530 tem pontos desconfortavelmente quentes. O ventilador também acelera rapidamente e de forma barulhenta. Pior ainda, o gerenciamento deficiente de calor resulta em uma limitação térmica severa, limitando o desempenho da CPU em relação a cargas pesadas em até 20%.
Esses compromissos estragam o que de outra forma seria um ótimo dispositivo. O 3530 é bem construído, tem um teclado excelente e tem um ótimo complemento de portas (incluindo uma porta Thunderbolt 3). A tela é média e deve ser adequada para o trabalho profissional não dependente de cor. As durações da bateria são excelentes.
Apesar de todos esses aspectos positivos, o Precision 3530 acaba caindo devido ao seu desempenho inconsistente. A CPU Xeon e a GPU Quadro são demais para o sistema de aquecimento medíocre. O resultado é um afogamento pesado, especialmente no desempenho da CPU, e um ventilador barulhento e agressivo. Há opções muito melhores que oferecem desempenho semelhante (se não melhor) que é muito mais consistente. As da HP Zbook 15 G4 ou o Lenovo ThinkPad P52 seriam melhores opções.
Dell Precision 3530
- 08/13/2018 v6 (old)
Sam Medley
Price comparison
