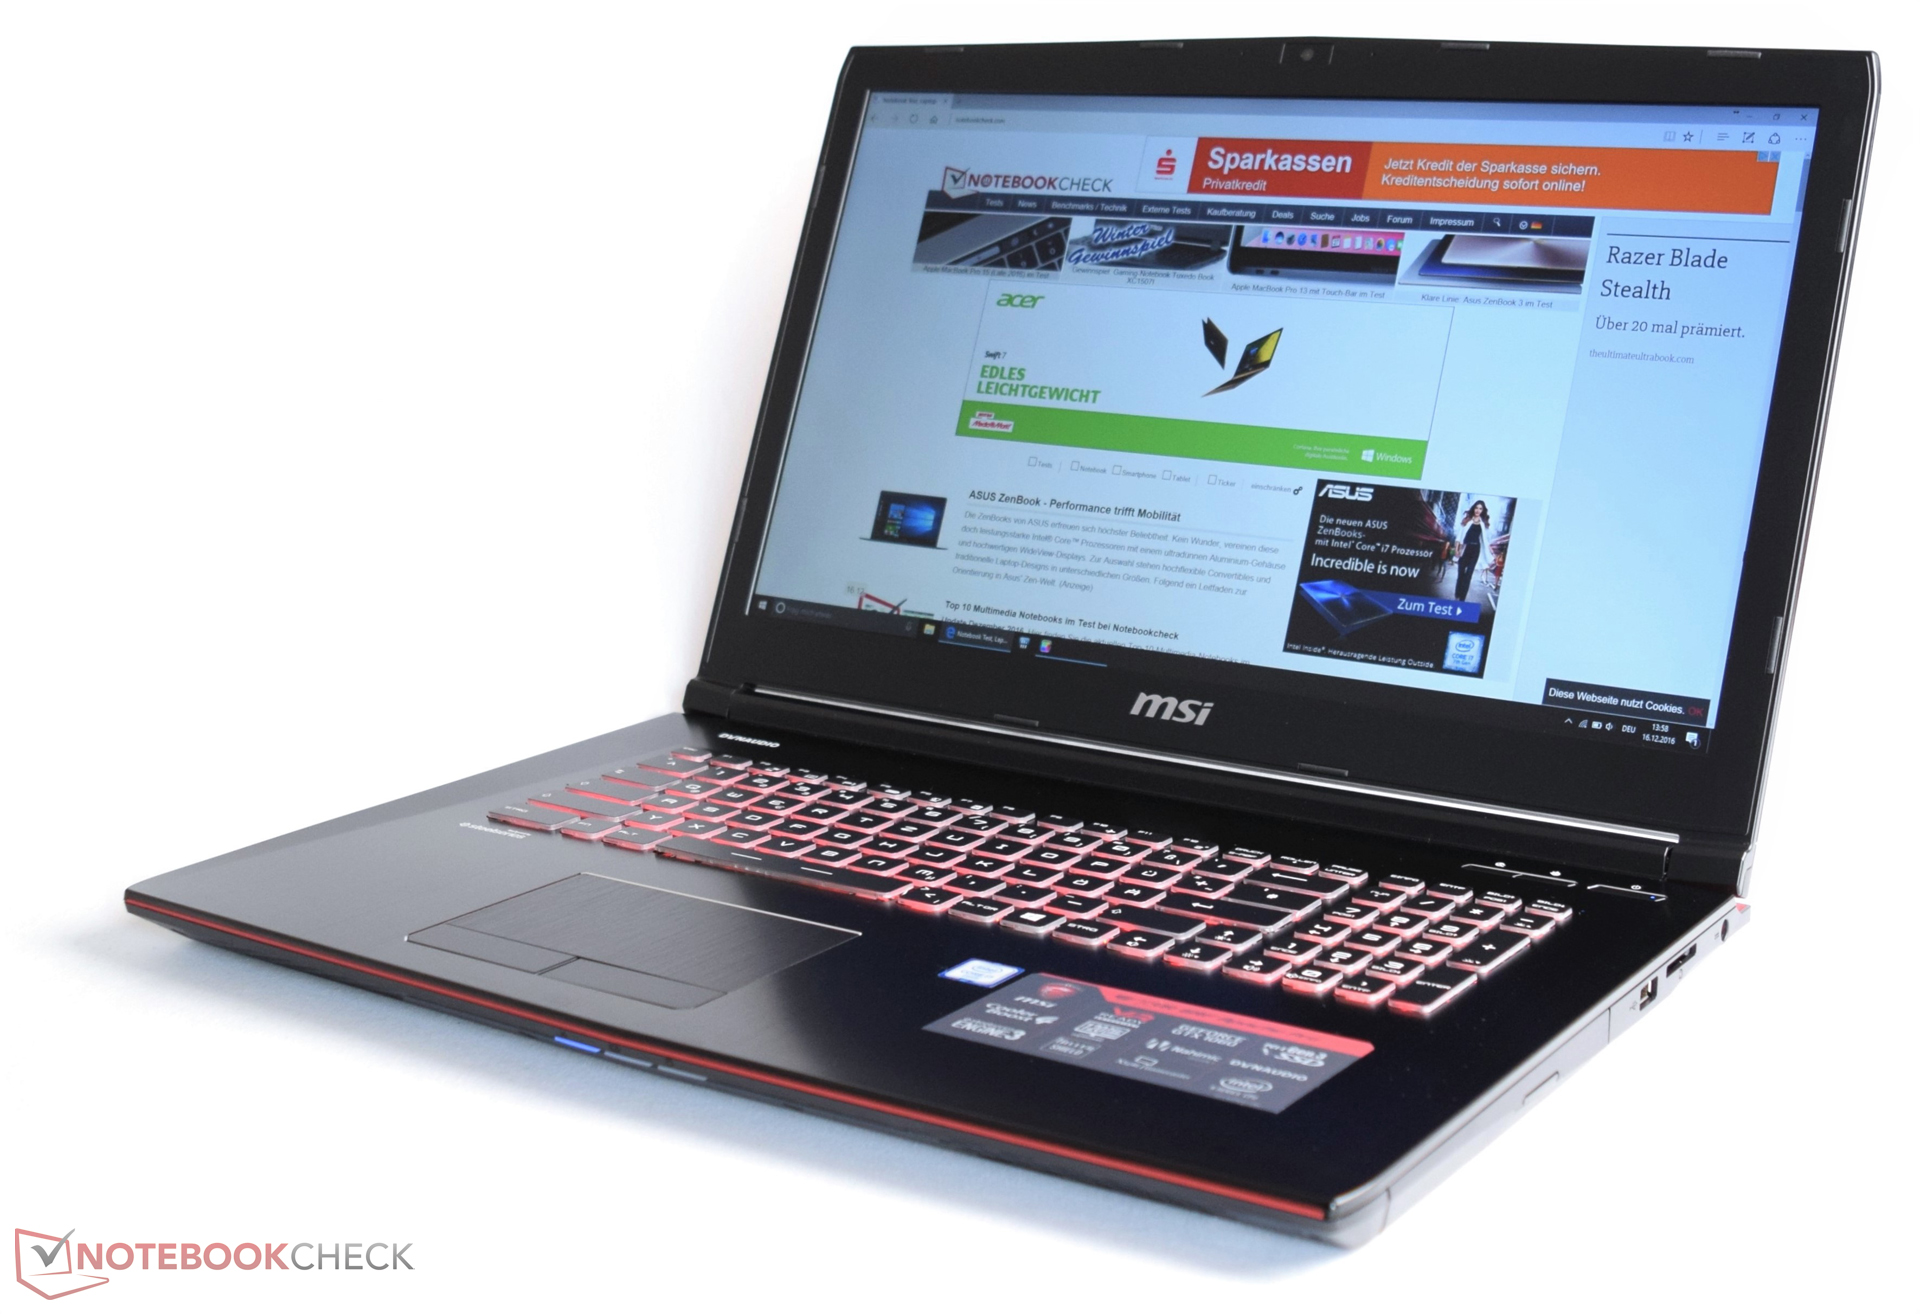
Breve análise do Portátil MSI GE72 7RE Apache Pro

| SD Card Reader | |
| average JPG Copy Test (av. of 3 runs) | |
| Aorus X7 v6 | |
| HP Omen 17-w110ng | |
| Asus GL702VM-GC102D | |
| MSI GE72 7RE-046 | |
| MSI GS73VR 6RF | |
| maximum AS SSD Seq Read Test (1GB) | |
| HP Omen 17-w110ng | |
| Aorus X7 v6 | |
| Asus GL702VM-GC102D | |
| MSI GE72 7RE-046 | |
| MSI GS73VR 6RF | |
| Networking | |
| iperf3 transmit AX12 | |
| Aorus X7 v6 | |
| HP Omen 17-w110ng | |
| MSI GE72 7RE-046 | |
| iperf3 receive AX12 | |
| HP Omen 17-w110ng | |
| Aorus X7 v6 | |
| MSI GE72 7RE-046 | |
| |||||||||||||||||||||||||
iluminação: 86 %
iluminação com acumulador: 253 cd/m²
Contraste: 1054:1 (Preto: 0.24 cd/m²)
ΔE ColorChecker Calman: 5.01 | ∀{0.5-29.43 Ø4.71}
ΔE Greyscale Calman: 7.26 | ∀{0.09-98 Ø4.96}
100% sRGB (Argyll 1.6.3 3D)
76% AdobeRGB 1998 (Argyll 1.6.3 3D)
85.2% AdobeRGB 1998 (Argyll 3D)
99.9% sRGB (Argyll 3D)
90.7% Display P3 (Argyll 3D)
Gamma: 2.09
CCT: 6329 K
| MSI GE72 7RE-046 N173HHE-G32 (CMN1747), 1920x1080 | Aorus X7 v6 B173QTN01.0 (AUO1096), 2560x1440 | HP Omen 17-w110ng LG Philips LGD046E, 1920x1080 | MSI GS73VR 6RF 1920x1080 | Asus GL702VM-GC102D LG Philips LP173WF4-SPF3, 1920x1080 | |
|---|---|---|---|---|---|
| Display | -26% | -24% | -1% | -24% | |
| Display P3 Coverage (%) | 90.7 | 60.9 -33% | 66.6 -27% | 90 -1% | 65.1 -28% |
| sRGB Coverage (%) | 99.9 | 84.2 -16% | 84.1 -16% | 99.9 0% | 83.5 -16% |
| AdobeRGB 1998 Coverage (%) | 85.2 | 61.2 -28% | 61.5 -28% | 83.6 -2% | 61.1 -28% |
| Response Times | -13% | -102% | -6% | -99% | |
| Response Time Grey 50% / Grey 80% * (ms) | 27 ? | 31 ? -15% | 37 ? -37% | 28 ? -4% | 38 ? -41% |
| Response Time Black / White * (ms) | 9 ? | 10 ? -11% | 24 ? -167% | 9.6 ? -7% | 23 ? -156% |
| PWM Frequency (Hz) | |||||
| Screen | -18% | 10% | 20% | -16% | |
| Brightness middle (cd/m²) | 253 | 343 36% | 362 43% | 337.2 33% | 326 29% |
| Brightness (cd/m²) | 230 | 312 36% | 342 49% | 315 37% | 312 36% |
| Brightness Distribution (%) | 86 | 80 -7% | 87 1% | 86 0% | 91 6% |
| Black Level * (cd/m²) | 0.24 | 0.5 -108% | 0.31 -29% | 0.308 -28% | 0.5 -108% |
| Contrast (:1) | 1054 | 686 -35% | 1168 11% | 1095 4% | 652 -38% |
| Colorchecker dE 2000 * | 5.01 | 7.33 -46% | 4.5 10% | 2.96 41% | 6.3 -26% |
| Colorchecker dE 2000 max. * | 10.4 | 10.79 -4% | 9.31 10% | 5.45 48% | 11.69 -12% |
| Greyscale dE 2000 * | 7.26 | 7.6 -5% | 3.48 52% | 2.57 65% | 7.37 -2% |
| Gamma | 2.09 105% | 2.19 100% | 2.23 99% | 2.25 98% | 2.37 93% |
| CCT | 6329 103% | 9024 72% | 6144 106% | 7114 91% | 7116 91% |
| Color Space (Percent of AdobeRGB 1998) (%) | 76 | 55 -28% | 55 -28% | 74.3 -2% | 55 -28% |
| Color Space (Percent of sRGB) (%) | 100 | 84 -16% | 84 -16% | 100 0% | 83 -17% |
| Média Total (Programa/Configurações) | -19% /
-19% | -39% /
-11% | 4% /
12% | -46% /
-29% |
* ... menor é melhor
Exibir tempos de resposta
| ↔ Tempo de resposta preto para branco | ||
|---|---|---|
| 9 ms ... ascensão ↗ e queda ↘ combinadas | ↗ 6 ms ascensão | 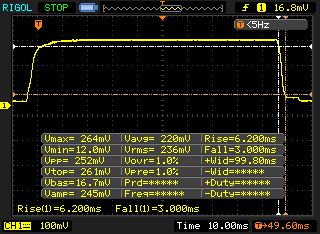 |
| ↘ 3 ms queda | ||
| A tela mostra taxas de resposta rápidas em nossos testes e deve ser adequada para jogos. Em comparação, todos os dispositivos testados variam de 0.1 (mínimo) a 240 (máximo) ms. » 25 % de todos os dispositivos são melhores. Isso significa que o tempo de resposta medido é melhor que a média de todos os dispositivos testados (19.8 ms). | ||
| ↔ Tempo de resposta 50% cinza a 80% cinza | ||
| 27 ms ... ascensão ↗ e queda ↘ combinadas | ↗ 13 ms ascensão | 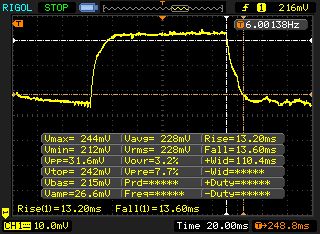 |
| ↘ 14 ms queda | ||
| A tela mostra taxas de resposta relativamente lentas em nossos testes e pode ser muito lenta para os jogadores. Em comparação, todos os dispositivos testados variam de 0.165 (mínimo) a 636 (máximo) ms. » 37 % de todos os dispositivos são melhores. Isso significa que o tempo de resposta medido é melhor que a média de todos os dispositivos testados (31 ms). | ||
Cintilação da tela / PWM (modulação por largura de pulso)
| Tela tremeluzindo / PWM não detectado | 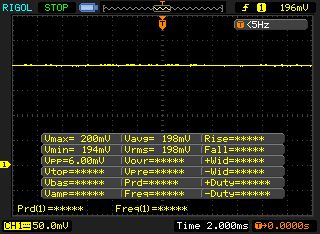 | ||
[pwm_comparison] Em comparação: 52 % de todos os dispositivos testados não usam PWM para escurecer a tela. Se PWM foi detectado, uma média de 7751 (mínimo: 5 - máximo: 343500) Hz foi medida. | |||
| Cinebench R15 | |
| CPU Single 64Bit | |
| Aorus X7 v6 | |
| HP Omen 17-w110ng | |
| MSI GE72 7RE-046 | |
| MSI GS73VR 6RF | |
| Asus GL702VM-GC102D | |
| CPU Multi 64Bit | |
| Aorus X7 v6 | |
| MSI GE72 7RE-046 | |
| HP Omen 17-w110ng | |
| Asus GL702VM-GC102D | |
| MSI GS73VR 6RF | |
| Cinebench R11.5 | |
| CPU Single 64Bit | |
| Aorus X7 v6 | |
| HP Omen 17-w110ng | |
| MSI GE72 7RE-046 | |
| MSI GS73VR 6RF | |
| Asus GL702VM-GC102D | |
| CPU Multi 64Bit | |
| Aorus X7 v6 | |
| MSI GE72 7RE-046 | |
| HP Omen 17-w110ng | |
| Asus GL702VM-GC102D | |
| MSI GS73VR 6RF | |
| PCMark 7 Score | 5810 pontos | |
Ajuda | ||
| PCMark 7 - Score | |
| Aorus X7 v6 | |
| MSI GE72 7RE-046 | |
| HP Omen 17-w110ng | |
| Asus GL702VM-GC102D | |
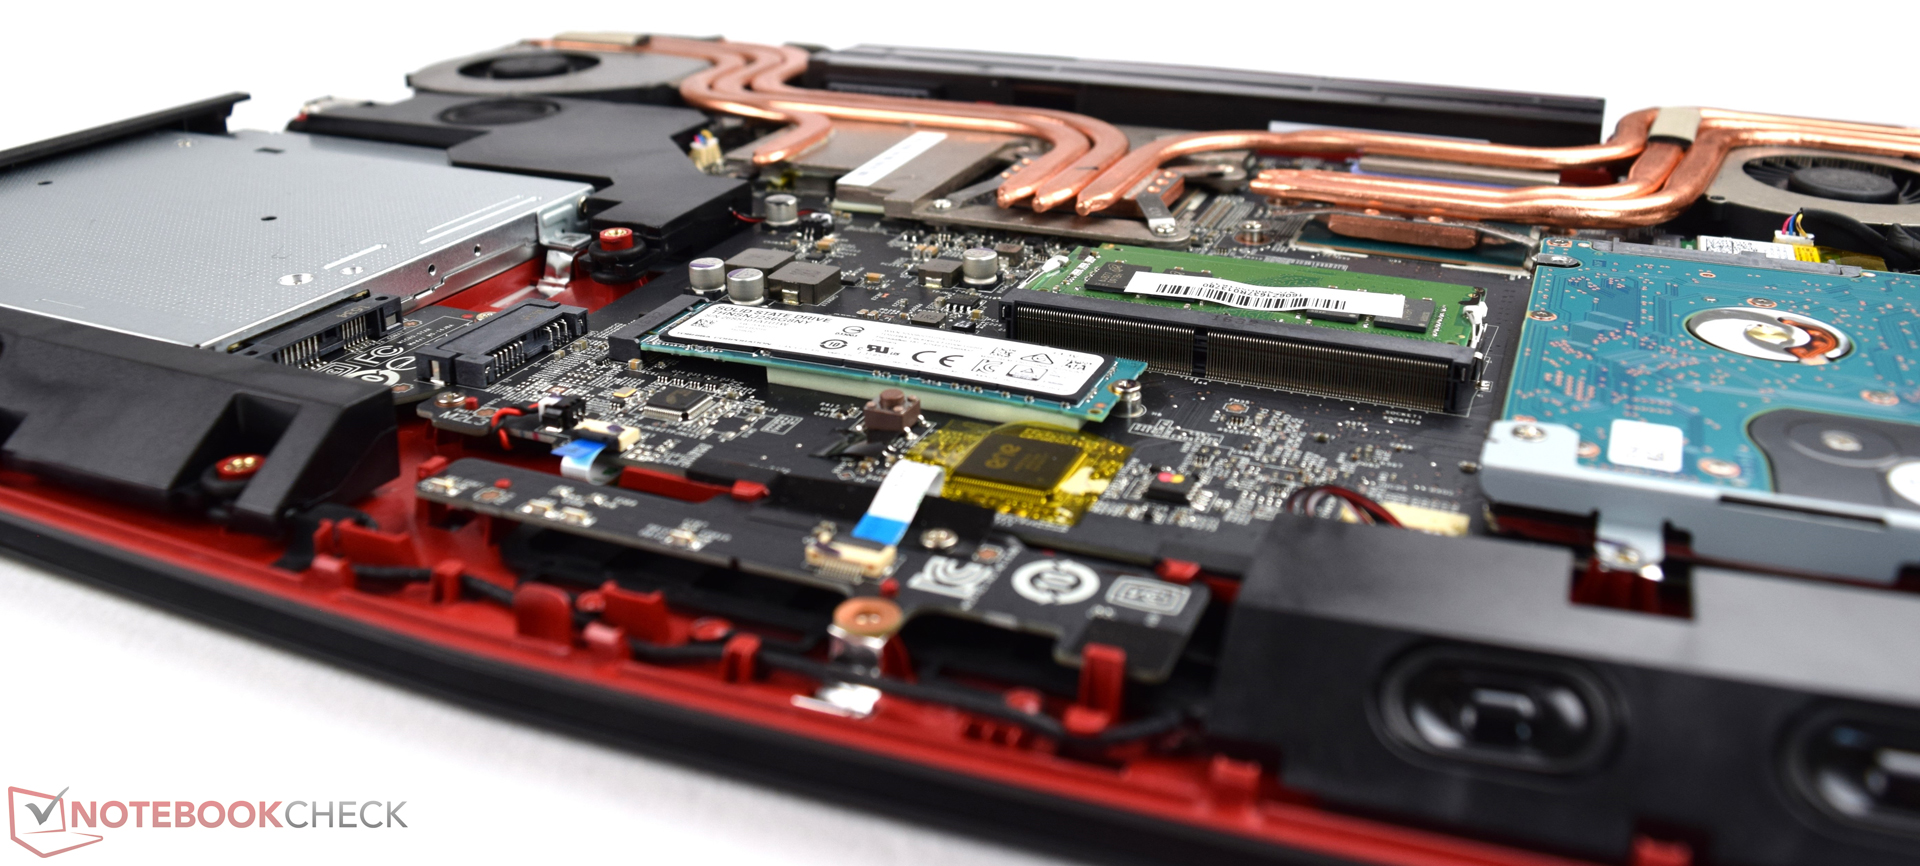
| MSI GE72 7RE-046 Toshiba HG6 THNSNJ256G8NY | Aorus X7 v6 Toshiba NVMe THNSN5512GPU7 | HP Omen 17-w110ng Samsung PM951 NVMe MZVLV256 | MSI GS73VR 6RF SanDisk SD8SN8U1T001122 | Asus GL702VM-GC102D HGST Travelstar 7K1000 HTS721010A9E630 | |
|---|---|---|---|---|---|
| CrystalDiskMark 3.0 | 124% | 49% | -37% | -86% | |
| Read Seq (MB/s) | 540 | 1499 178% | 1156 114% | 334.3 -38% | 134.6 -75% |
| Write Seq (MB/s) | 495.7 | 1411 185% | 294.9 -41% | 319 -36% | 130.6 -74% |
| Read 4k (MB/s) | 22.7 | 44.33 95% | 42.7 88% | 20.3 -11% | 0.602 -97% |
| Write 4k (MB/s) | 112.9 | 155.5 38% | 153.3 36% | 42.51 -62% | 1.146 -99% |

| 3DMark Vantage P Result | 30690 pontos | |
| 3DMark 11 Performance | 9269 pontos | |
| 3DMark Ice Storm Standard Score | 69304 pontos | |
| 3DMark Cloud Gate Standard Score | 20933 pontos | |
| 3DMark Fire Strike Score | 6959 pontos | |
Ajuda | ||
| 3DMark | |
| 1920x1080 Fire Strike Graphics | |
| Aorus X7 v6 | |
| HP Omen 17-w110ng | |
| MSI GS73VR 6RF | |
| Asus GL702VM-GC102D | |
| MSI GE72 7RE-046 | |
| 1280x720 Sky Diver Graphics | |
| Aorus X7 v6 | |
| HP Omen 17-w110ng | |
| Asus GL702VM-GC102D | |
| MSI GE72 7RE-046 | |
| 3DMark 11 - 1280x720 Performance GPU | |
| Aorus X7 v6 | |
| HP Omen 17-w110ng | |
| MSI GS73VR 6RF | |
| Asus GL702VM-GC102D | |
| MSI GE72 7RE-046 | |
| Unigine Heaven 4.0 - Extreme Preset DX11 | |
| Aorus X7 v6 | |
| HP Omen 17-w110ng | |
| MSI GE72 7RE-046 | |
| Battlefield 1 | |
| 1920x1080 Ultra Preset AA:T | |
| Aorus X7 v6 | |
| HP Omen 17-w110ng | |
| Asus GL702VM-GC102D | |
| MSI GE72 7RE-046 | |
| 1920x1080 High Preset AA:T | |
| Aorus X7 v6 | |
| HP Omen 17-w110ng | |
| Asus GL702VM-GC102D | |
| MSI GE72 7RE-046 | |
| baixo | média | alto | ultra | QHD | 4K | |
|---|---|---|---|---|---|---|
| Dirt Rally (2015) | 93.4 | 65.7 | 57.8 | |||
| The Witcher 3 (2015) | 48.7 | 26.9 | 17.6 | |||
| Batman: Arkham Knight (2015) | 60 | 41 | 19 | |||
| Mad Max (2015) | 89.7 | 82.7 | 28.6 | |||
| Anno 2205 (2015) | 63.7 | 20.6 | 24 | |||
| Fallout 4 (2015) | 56 | 46.2 | 18.5 | |||
| Star Wars Battlefront (2015) | 72.4 | 62.7 | 22.4 | |||
| Assassin's Creed Syndicate (2015) | 47.8 | 23.5 | 17.1 | |||
| Rainbow Six Siege (2015) | 92.2 | 74.4 | 28.4 | |||
| Just Cause 3 (2015) | 58.9 | 52.7 | 22.1 | |||
| Rise of the Tomb Raider (2016) | 47.4 | 39.7 | 17.6 | |||
| XCOM 2 (2016) | 37.7 | 19 | 10.3 | |||
| Far Cry Primal (2016) | 53 | 40 | 17 | |||
| The Division (2016) | 45 | 34.9 | 16.6 | |||
| Hitman 2016 (2016) | 38.4 | 36.6 | 16.3 | |||
| Need for Speed 2016 (2016) | 60.4 | 46.4 | 21.3 | |||
| Doom (2016) | 68.3 | 63.8 | 21.2 | |||
| Overwatch (2016) | 118 | 71 | 38.3 | |||
| Mirror's Edge Catalyst (2016) | 50.3 | 45.1 | 16.2 | |||
| No Man's Sky (2016) | 44.6 | 22 | 18.1 | |||
| Deus Ex Mankind Divided (2016) | 38.3 | 19.7 | 12.3 | |||
| FIFA 17 (2016) | 130 | 128 | 66.1 | |||
| Mafia 3 (2016) | 28.7 | 9.8 | ||||
| Battlefield 1 (2016) | 56.7 | 50.8 | 19.8 | |||
| Farming Simulator 17 (2016) | 130 | 117 | 59.7 | |||
| Titanfall 2 (2016) | 62 | 56.2 | 18.7 | |||
| Call of Duty Infinite Warfare (2016) | 67.4 | 58.8 | 27.4 | |||
| Dishonored 2 (2016) | 48.7 | 39.6 | 18.2 | |||
| Watch Dogs 2 (2016) | 42.4 | 26.6 | 14.4 | |||
| Resident Evil 7 (2017) | 64.5 | 24.3 | ||||
| For Honor (2017) | 66 () | 62 () | 45 () | |||
| Ghost Recon Wildlands (2017) | 106 | 46.1 | 40.3 | 9.8 | ||
| Mass Effect Andromeda (2017) | 105 | 50.2 | 27.9 | 23 | ||
| Warhammer 40.000: Dawn of War III (2017) | 112 | 46.6 | 29.8 | 25.8 | 0 | |
| Rocket League (2017) | 158 | 61 | ||||
| Dirt 4 (2017) | 74.2 | 39.2 | ||||
| Team Fortress 2 (2017) | 105 | 74.4 | ||||
| Playerunknown's Battlegrounds (PUBG) (2017) | 54.1 | 45.2 | ||||
| F1 2017 (2017) | 66 | 40 | 16 | |||
| Ark Survival Evolved (2017) | 89 | 31.6 | 21.8 | |||
| FIFA 18 (2017) | 149 | 62.3 | ||||
| Middle-earth: Shadow of War (2017) | 121 | 62 | 43 | 29 | 12 | |
| The Evil Within 2 (2017) | 61.8 | 36.1 | 32.9 | 31 | 2 | |
| ELEX (2017) | 102 | 52.2 | 41.9 | 31 | 19.6 | 6.6 |
| Destiny 2 (2017) | 116 | 65.5 | 62.1 | 51.1 | 26.1 | 17.8 |
| Assassin´s Creed Origins (2017) | 77 | 45 | 38 | 28 | 20 | 4 |
| Call of Duty WWII (2017) | 191 | 129 | 67.8 | 42.4 | 30.8 | 18.9 |
| Need for Speed Payback (2017) | 115 | 66 | 54.7 | 50.9 | 30.3 | 9.7 |
| Star Wars Battlefront 2 (2017) | 135 | 75 | 65 | 43 | 19.5 | 5.7 |
| Fortnite (2018) | 61 | 45.1 | 28.8 | 8.8 | ||
| Final Fantasy XV Benchmark (2018) | 74 | 37.1 | 23.4 | |||
| Kingdom Come: Deliverance (2018) | 107 | 49.5 | 40.5 | 28 | 16.9 | 6 |
| X-Plane 11.11 (2018) | 77.3 | 69.9 | 61.2 | 45.3 | ||
| Far Cry 5 (2018) | 95 | 47 | 43 | 39 | 25 | 12 |
| The Crew 2 (2018) | 51 | 44.1 | ||||
| Monster Hunter World (2018) | 93 | 41.2 | 35.5 | 27.9 | ||
| F1 2018 (2018) | 146 | 81 | 62 | 37 | 28 | 15 |
| Shadow of the Tomb Raider (2018) | 97 | 38 | 31 | 25 | 17 | 8 |
| FIFA 19 (2018) | 192 | 169 | 157 | 150 | 51.3 | |
| Forza Horizon 4 (2018) | 122 | 62 | 55 | 40 | ||
| Assassin´s Creed Odyssey (2018) | 77 | 41 | 31 | 17 | ||
| Call of Duty Black Ops 4 (2018) | 35.5 | 10.2 | ||||
| Hitman 2 (2018) | 55.6 | 39 | 29.7 | 23.6 | ||
| Fallout 76 (2018) | 48.4 | 45.3 |
Barulho
| Ocioso |
| 34 / 35 / 36 dB |
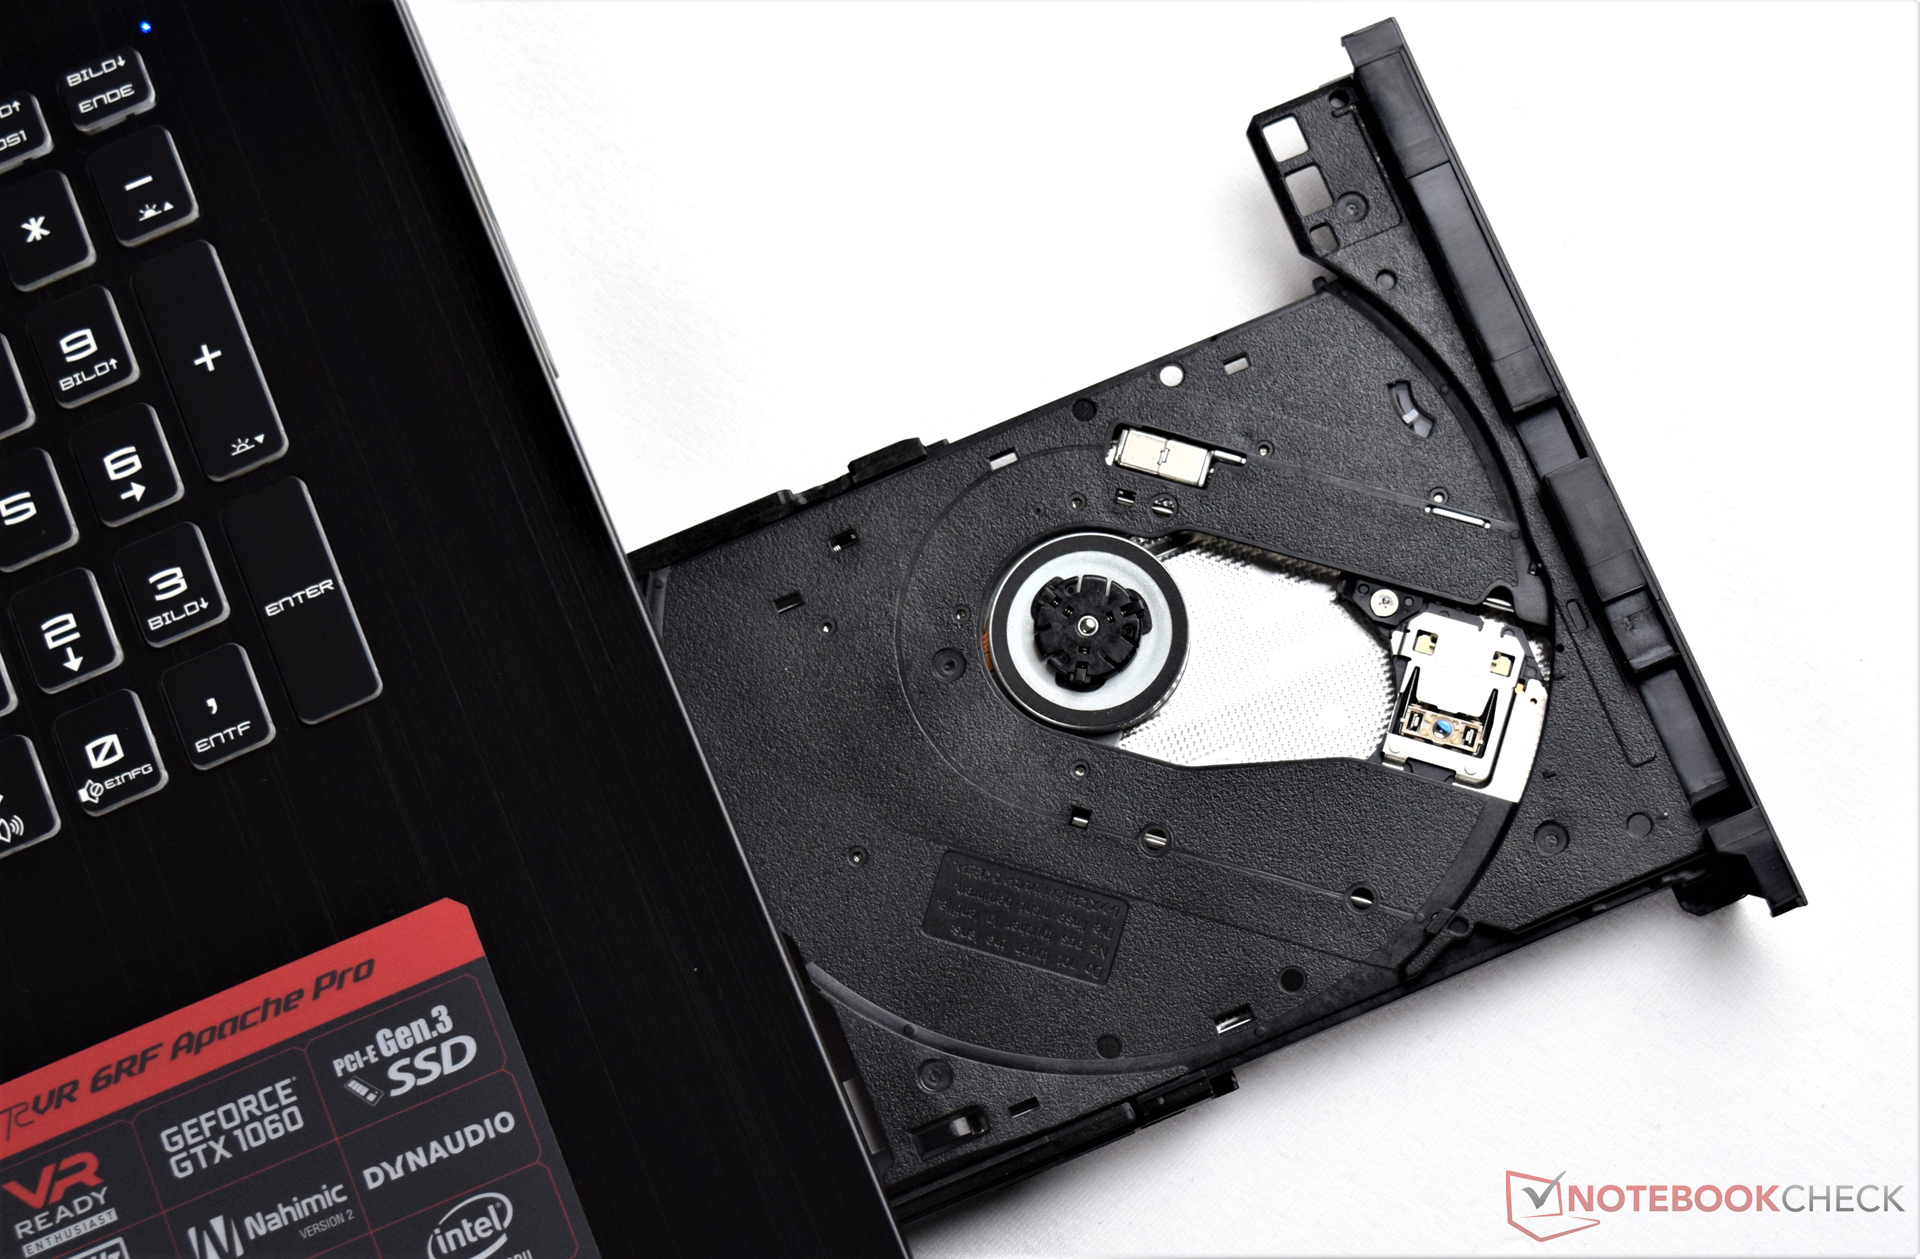
| DVD |
| 40 / dB |
| Carga |
| 41 / 49 dB |
 | ||
30 dB silencioso 40 dB(A) audível 50 dB(A) ruidosamente alto |
||
min: | ||
| MSI GE72 7RE-046 GeForce GTX 1050 Ti Mobile, i7-7700HQ | Aorus X7 v6 GeForce GTX 1070 Mobile, 6820HK | HP Omen 17-w110ng GeForce GTX 1070 Mobile, 6700HQ | MSI GS73VR 6RF GeForce GTX 1060 Mobile, 6700HQ | Asus GL702VM-GC102D GeForce GTX 1060 Mobile, 6700HQ | |
|---|---|---|---|---|---|
| Noise | -4% | -1% | 2% | 6% | |
| desligado / ambiente * (dB) | 30 | 30 -0% | 30 -0% | 28.4 5% | 30.5 -2% |
| Idle Minimum * (dB) | 34 | 33 3% | 33 3% | 31.9 6% | 31.4 8% |
| Idle Average * (dB) | 35 | 35 -0% | 34 3% | 32 9% | 31.4 10% |
| Idle Maximum * (dB) | 36 | 40 -11% | 35 3% | 34 6% | 31.5 12% |
| Load Average * (dB) | 41 | 43 -5% | 45 -10% | 47 -15% | 40.9 -0% |
| Load Maximum * (dB) | 49 | 54 -10% | 52 -6% | 49.4 -1% | 46.2 6% |
* ... menor é melhor
(-) A temperatura máxima no lado superior é 45.8 °C / 114 F, em comparação com a média de 40.4 °C / 105 F , variando de 21.2 a 68.8 °C para a classe Gaming.
(-) A parte inferior aquece até um máximo de 45.2 °C / 113 F, em comparação com a média de 43.2 °C / 110 F
(+) Em uso inativo, a temperatura média para o lado superior é 26.7 °C / 80 F, em comparação com a média do dispositivo de 33.9 °C / ### class_avg_f### F.
(-) Os apoios para as mãos e o touchpad podem ficar muito quentes ao toque, com um máximo de 40.3 °C / 104.5 F.
(-) A temperatura média da área do apoio para as mãos de dispositivos semelhantes foi 28.8 °C / 83.8 F (-11.5 °C / -20.7 F).
| MSI GE72 7RE-046 GeForce GTX 1050 Ti Mobile, i7-7700HQ | Aorus X7 v6 GeForce GTX 1070 Mobile, 6820HK | HP Omen 17-w110ng GeForce GTX 1070 Mobile, 6700HQ | MSI GS73VR 6RF GeForce GTX 1060 Mobile, 6700HQ | Asus GL702VM-GC102D GeForce GTX 1060 Mobile, 6700HQ | |
|---|---|---|---|---|---|
| Heat | -3% | -2% | -7% | -8% | |
| Maximum Upper Side * (°C) | 45.8 | 47.5 -4% | 45 2% | 50.8 -11% | 53.1 -16% |
| Maximum Bottom * (°C) | 45.2 | 54.5 -21% | 54.3 -20% | 60 -33% | 44.9 1% |
| Idle Upper Side * (°C) | 31.7 | 28.6 10% | 29.6 7% | 27.4 14% | 32.9 -4% |
| Idle Bottom * (°C) | 29.9 | 28.8 4% | 28.6 4% | 28.8 4% | 33.4 -12% |
* ... menor é melhor
MSI GE72 7RE-046 análise de áudio
(+) | os alto-falantes podem tocar relativamente alto (###valor### dB)
Graves 100 - 315Hz
(-) | quase nenhum baixo - em média 17.2% menor que a mediana
(±) | a linearidade dos graves é média (9.2% delta para a frequência anterior)
Médios 400 - 2.000 Hz
(+) | médios equilibrados - apenas 3.3% longe da mediana
(+) | médios são lineares (4.7% delta para frequência anterior)
Altos 2 - 16 kHz
(+) | agudos equilibrados - apenas 3.3% longe da mediana
(+) | os máximos são lineares (4% delta da frequência anterior)
Geral 100 - 16.000 Hz
(+) | o som geral é linear (13.7% diferença em relação à mediana)
Comparado com a mesma classe
» 21% de todos os dispositivos testados nesta classe foram melhores, 7% semelhantes, 72% piores
» O melhor teve um delta de 6%, a média foi 18%, o pior foi 132%
Comparado com todos os dispositivos testados
» 15% de todos os dispositivos testados foram melhores, 4% semelhantes, 81% piores
» O melhor teve um delta de 4%, a média foi 23%, o pior foi 134%
Asus GL702VM-GC102D análise de áudio
(-) | alto-falantes não muito altos (###valor### dB)
Graves 100 - 315Hz
(±) | graves reduzidos - em média 7.7% menor que a mediana
(±) | a linearidade dos graves é média (14% delta para a frequência anterior)
Médios 400 - 2.000 Hz
(+) | médios equilibrados - apenas 1.5% longe da mediana
(+) | médios são lineares (6.3% delta para frequência anterior)
Altos 2 - 16 kHz
(±) | máximos reduzidos - em média 5.3% menor que a mediana
(±) | a linearidade dos máximos é média (9.8% delta para frequência anterior)
Geral 100 - 16.000 Hz
(±) | a linearidade do som geral é média (16.7% diferença em relação à mediana)
Comparado com a mesma classe
» 43% de todos os dispositivos testados nesta classe foram melhores, 10% semelhantes, 47% piores
» O melhor teve um delta de 6%, a média foi 18%, o pior foi 132%
Comparado com todos os dispositivos testados
» 29% de todos os dispositivos testados foram melhores, 7% semelhantes, 64% piores
» O melhor teve um delta de 4%, a média foi 23%, o pior foi 134%
| desligado | |
| Ocioso | |
| Carga |
|
Key:
min: | |
| MSI GE72 7RE-046 GeForce GTX 1050 Ti Mobile, i7-7700HQ | Aorus X7 v6 GeForce GTX 1070 Mobile, 6820HK | HP Omen 17-w110ng GeForce GTX 1070 Mobile, 6700HQ | MSI GS73VR 6RF GeForce GTX 1060 Mobile, 6700HQ | Asus GL702VM-GC102D GeForce GTX 1060 Mobile, 6700HQ | |
|---|---|---|---|---|---|
| Power Consumption | -67% | -28% | -44% | -3% | |
| Idle Minimum * (Watt) | 14 | 29 -107% | 19 -36% | 22.6 -61% | 15.6 -11% |
| Idle Average * (Watt) | 20 | 31 -55% | 25 -25% | 32.7 -64% | 20.2 -1% |
| Idle Maximum * (Watt) | 25 | 38 -52% | 31 -24% | 32.8 -31% | 21.4 14% |
| Load Average * (Watt) | 82 | 111 -35% | 90 -10% | 114.7 -40% | 90 -10% |
| Load Maximum * (Watt) | 135 | 253 -87% | 193 -43% | 167.9 -24% | 147 -9% |
* ... menor é melhor
| MSI GE72 7RE-046 51.4 Wh | Aorus X7 v6 94 Wh | HP Omen 17-w110ng 95 Wh | MSI GS73VR 6RF 65 Wh | Asus GL702VM-GC102D 76 Wh | |
|---|---|---|---|---|---|
| Duração da bateria | -3% | 25% | 16% | 34% | |
| H.264 (h) | 3.3 | 3.9 18% | 4.4 33% | ||
| WiFi v1.3 (h) | 3.1 | 3 -3% | 4.1 32% | 3.6 16% | 4.2 35% |
Pro
Contra
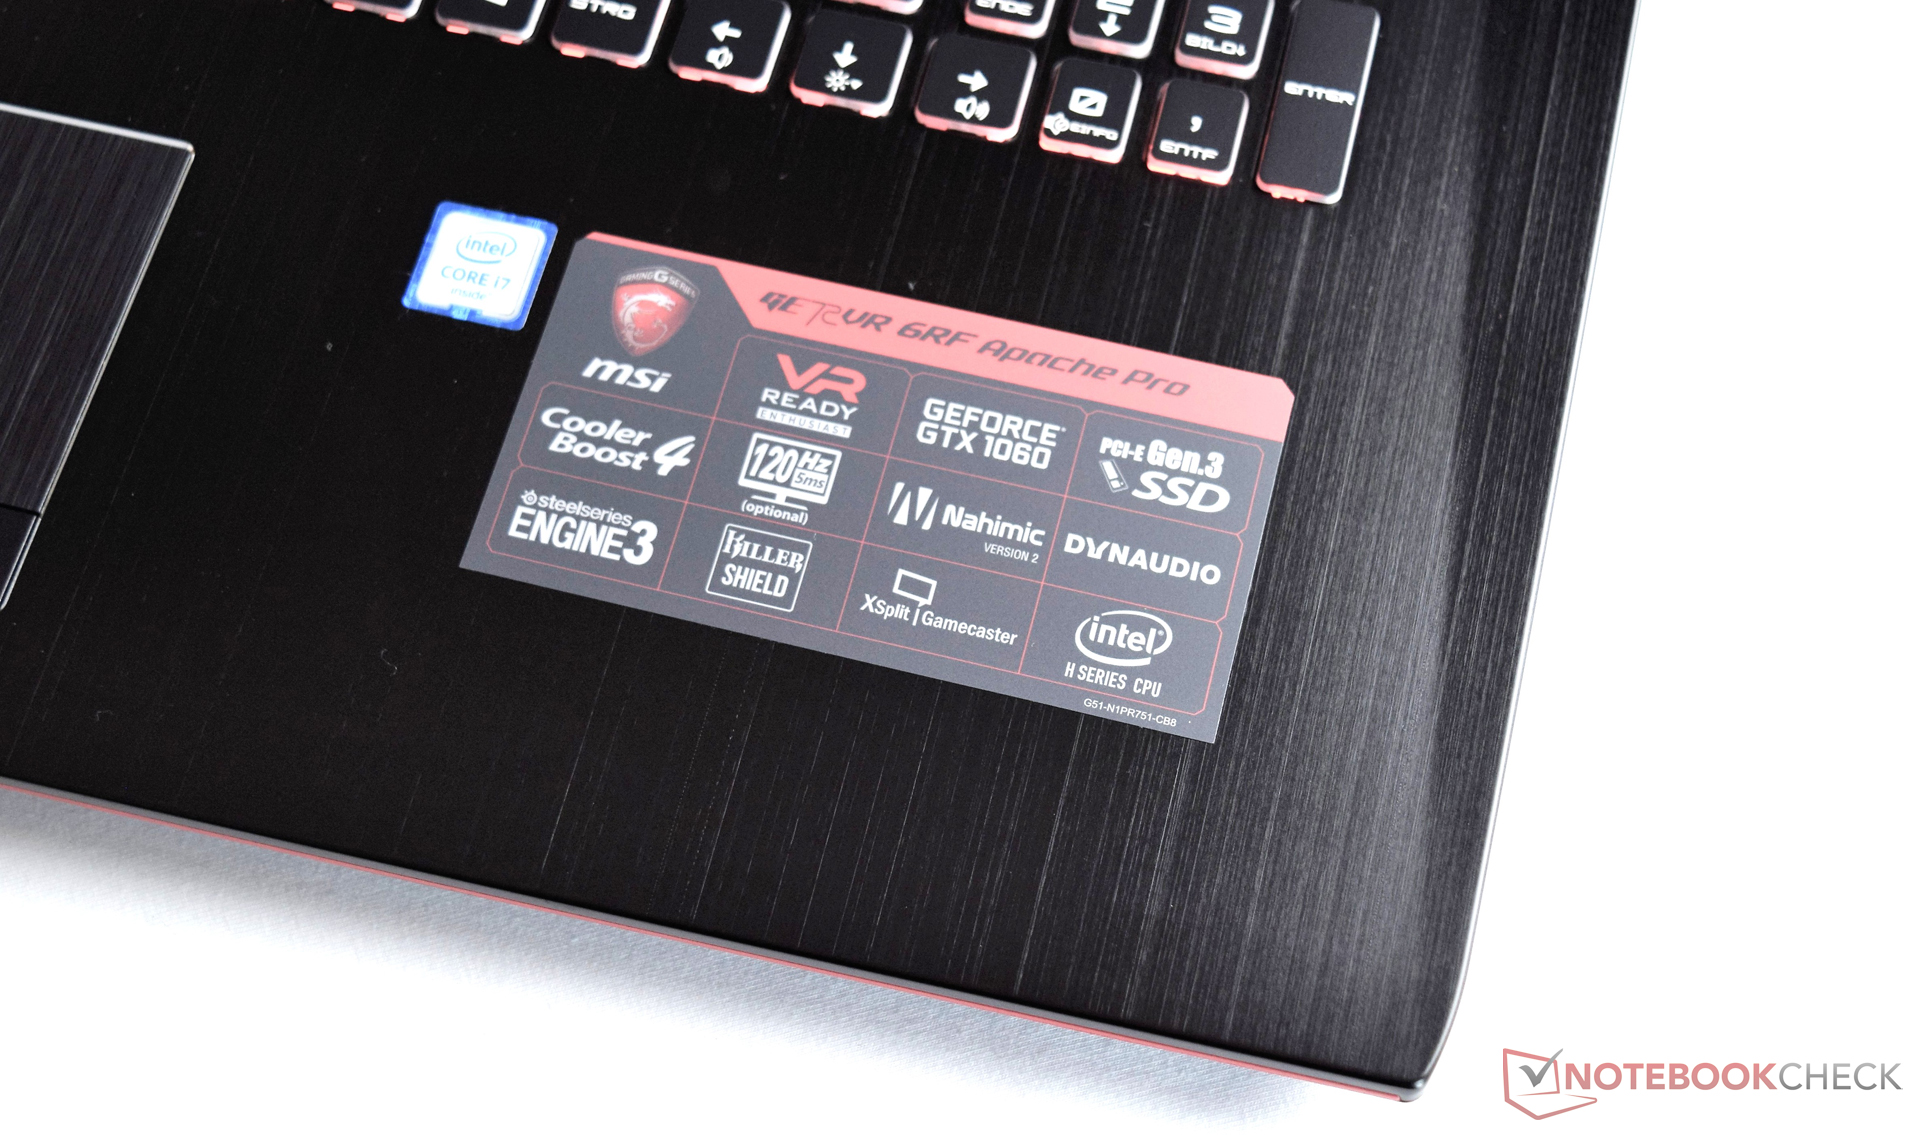
Embora o GE72 7RE não possua uma certificação para a realidade virtual, ainda pode considerá-lo um portátil para jogos. A mais recente GeForce GTX 1050 Ti da Nvidia mais que nada oferece suficiente desempenho para atingir boas taxas de fotogramas com uma resolução de 1.920 x 1.080 pixels e detalhes altos.
O desempenho cairá rapidamente na gama 3K e 4K e fará com que os títulos muito exigentes sejam difíceis de jogar. No entanto, os gamers deveriam considerar gastar um dinheiro extra em uma GTX 1060. Afinal, 6 GB de VRAM são melhores que 4 GB e tais aparelhos custam quase igual.
Em nossa opinião, a arquitetura Intel Kaby Lake é pouco espetacular e aumente apenas um pouco o desempenho da CPU.
Aqueles que estejam indecisos entre um portátil multimídia econômico e um genuíno portátil de gama alta podem ficar felizes com o GE72 7RE.
MSI GE72 7RE-046
- 12/28/2016 v6 (old)
Florian Glaser