Breve Análise do HP Omen 17 (i7-6700HQ, GTX 1070)
| SD Card Reader | |
| average JPG Copy Test (av. of 3 runs) | |
| Nexoc G734III | |
| Gigabyte P57X v6 | |
| Asus G752VS-XB78K | |
| HP Omen 17-w110ng | |
| HP Omen 17-w010ng | |
| MSI GS73VR 6RF | |
| maximum AS SSD Seq Read Test (1GB) | |
| Gigabyte P57X v6 | |
| HP Omen 17-w110ng | |
| HP Omen 17-w010ng | |
| Asus G752VS-XB78K | |
| Nexoc G734III | |
| MSI GS73VR 6RF | |
| Networking | |
| iperf Server (receive) TCP 1 m | |
| HP Omen 17-w110ng | |
| Nexoc G734III | |
| Asus G752VS-XB78K | |
| MSI GS73VR 6RF | |
| HP Omen 17-w010ng | |
| iperf Client (transmit) TCP 1 m | |
| MSI GS73VR 6RF | |
| HP Omen 17-w110ng | |
| Asus G752VS-XB78K | |
| Nexoc G734III | |
| HP Omen 17-w010ng | |
| |||||||||||||||||||||||||
iluminação: 87 %
iluminação com acumulador: 362 cd/m²
Contraste: 1168:1 (Preto: 0.31 cd/m²)
ΔE ColorChecker Calman: 4.5 | ∀{0.5-29.43 Ø4.71}
ΔE Greyscale Calman: 3.48 | ∀{0.09-98 Ø4.96}
84% sRGB (Argyll 1.6.3 3D)
55% AdobeRGB 1998 (Argyll 1.6.3 3D)
61.5% AdobeRGB 1998 (Argyll 3D)
84.1% sRGB (Argyll 3D)
66.6% Display P3 (Argyll 3D)
Gamma: 2.23
CCT: 6144 K
| HP Omen 17-w110ng LG Philips LGD046E, 1920x1080 | HP Omen 17-w010ng AUO119B, 3840x2160 | Nexoc G734III LG Philips LP173WF4-SPD1 (LGD046C), 1920x1080 | MSI GS73VR 6RF 1920x1080 | Gigabyte P57X v6 LGD0469, 1920x1080 | Asus G752VS-XB78K LG Philips LP173WF4-SPF3 (LGD04E8), 1920x1080 | |
|---|---|---|---|---|---|---|
| Display | 38% | 2% | 30% | 3% | 1% | |
| Display P3 Coverage (%) | 66.6 | 88.5 33% | 67.4 1% | 90 35% | 68 2% | 66.9 0% |
| sRGB Coverage (%) | 84.1 | 100 19% | 85.8 2% | 99.9 19% | 87.5 4% | 85.2 1% |
| AdobeRGB 1998 Coverage (%) | 61.5 | 100 63% | 62.8 2% | 83.6 36% | 64 4% | 62.3 1% |
| Response Times | -25% | 4% | 42% | 1% | 3% | |
| Response Time Grey 50% / Grey 80% * (ms) | 37 ? | 49 ? -32% | 36 ? 3% | 28 ? 24% | 33.6 ? 9% | 38 ? -3% |
| Response Time Black / White * (ms) | 24 ? | 28 ? -17% | 23 ? 4% | 9.6 ? 60% | 25.6 ? -7% | 22 ? 8% |
| PWM Frequency (Hz) | 50 ? | |||||
| Screen | -3% | -1% | 13% | -12% | 3% | |
| Brightness middle (cd/m²) | 362 | 316 -13% | 314 -13% | 337.2 -7% | 329.2 -9% | 328 -9% |
| Brightness (cd/m²) | 342 | 312 -9% | 308 -10% | 315 -8% | 321 -6% | 317 -7% |
| Brightness Distribution (%) | 87 | 90 3% | 92 6% | 86 -1% | 93 7% | 88 1% |
| Black Level * (cd/m²) | 0.31 | 0.29 6% | 0.28 10% | 0.308 1% | 0.267 14% | 0.3 3% |
| Contrast (:1) | 1168 | 1090 -7% | 1121 -4% | 1095 -6% | 1233 6% | 1093 -6% |
| Colorchecker dE 2000 * | 4.5 | 5.69 -26% | 4.17 7% | 2.96 34% | 5.93 -32% | 3.74 17% |
| Colorchecker dE 2000 max. * | 9.31 | 7.94 15% | 8.94 4% | 5.45 41% | 11.07 -19% | 8.97 4% |
| Greyscale dE 2000 * | 3.48 | 6.12 -76% | 3.84 -10% | 2.57 26% | 6.72 -93% | 2.67 23% |
| Gamma | 2.23 99% | 2.56 86% | 2.41 91% | 2.25 98% | 2.12 104% | 2.41 91% |
| CCT | 6144 106% | 5875 111% | 6950 94% | 7114 91% | 7611 85% | 6861 95% |
| Color Space (Percent of AdobeRGB 1998) (%) | 55 | 87 58% | 56 2% | 74.3 35% | 57 4% | 56 2% |
| Color Space (Percent of sRGB) (%) | 84 | 100 19% | 86 2% | 100 19% | 87 4% | 85 1% |
| Média Total (Programa/Configurações) | 3% /
2% | 2% /
0% | 28% /
21% | -3% /
-7% | 2% /
2% |
* ... menor é melhor
Exibir tempos de resposta
| ↔ Tempo de resposta preto para branco | ||
|---|---|---|
| 24 ms ... ascensão ↗ e queda ↘ combinadas | ↗ 4 ms ascensão | 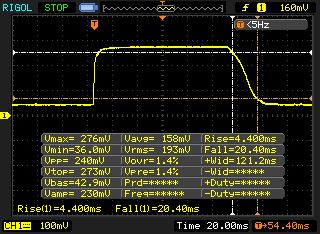 |
| ↘ 20 ms queda | ||
| A tela mostra boas taxas de resposta em nossos testes, mas pode ser muito lenta para jogadores competitivos. Em comparação, todos os dispositivos testados variam de 0.1 (mínimo) a 240 (máximo) ms. » 54 % de todos os dispositivos são melhores. Isso significa que o tempo de resposta medido é pior que a média de todos os dispositivos testados (19.8 ms). | ||
| ↔ Tempo de resposta 50% cinza a 80% cinza | ||
| 37 ms ... ascensão ↗ e queda ↘ combinadas | ↗ 13 ms ascensão | 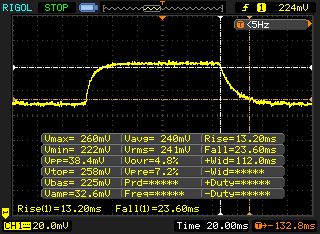 |
| ↘ 24 ms queda | ||
| A tela mostra taxas de resposta lentas em nossos testes e será insatisfatória para os jogadores. Em comparação, todos os dispositivos testados variam de 0.165 (mínimo) a 636 (máximo) ms. » 53 % de todos os dispositivos são melhores. Isso significa que o tempo de resposta medido é pior que a média de todos os dispositivos testados (31 ms). | ||
Cintilação da tela / PWM (modulação por largura de pulso)
| Tela tremeluzindo / PWM não detectado |  | ||
[pwm_comparison] Em comparação: 52 % de todos os dispositivos testados não usam PWM para escurecer a tela. Se PWM foi detectado, uma média de 7757 (mínimo: 5 - máximo: 343500) Hz foi medida. | |||

| Cinebench R11.5 | |
| CPU Single 64Bit | |
| Asus G752VS-XB78K | |
| HP Omen 17-w110ng | |
| HP Omen 17-w010ng | |
| Nexoc G734III | |
| MSI GS73VR 6RF | |
| Gigabyte P57X v6 | |
| CPU Multi 64Bit | |
| Asus G752VS-XB78K | |
| HP Omen 17-w110ng | |
| HP Omen 17-w010ng | |
| Gigabyte P57X v6 | |
| MSI GS73VR 6RF | |
| Nexoc G734III | |
| Cinebench R10 | |
| Rendering Single CPUs 64Bit | |
| Asus G752VS-XB78K | |
| HP Omen 17-w110ng | |
| Rendering Multiple CPUs 64Bit | |
| Asus G752VS-XB78K | |
| HP Omen 17-w110ng | |
| JetStream 1.1 - 1.1 Total | |
| HP Omen 17-w110ng | |
| Gigabyte P57X v6 | |
| Asus G752VS-XB78K | |
| MSI GS73VR 6RF | |
| Nexoc G734III | |
| Octane V2 - Total Score | |
| Asus G752VS-XB78K | |
| HP Omen 17-w110ng | |
| MSI GS73VR 6RF | |
| Nexoc G734III | |
| Mozilla Kraken 1.1 - Total | |
| Nexoc G734III | |
| Gigabyte P57X v6 | |
| HP Omen 17-w110ng | |
| Asus G752VS-XB78K | |
* ... menor é melhor
| PCMark 7 - Score | |
| Asus G752VS-XB78K | |
| HP Omen 17-w010ng | |
| HP Omen 17-w110ng | |
| Nexoc G734III | |
| PCMark 8 | |
| Home Score Accelerated v2 | |
| Asus G752VS-XB78K | |
| HP Omen 17-w110ng | |
| Gigabyte P57X v6 | |
| Nexoc G734III | |
| MSI GS73VR 6RF | |
| HP Omen 17-w010ng | |
| Work Score Accelerated v2 | |
| Asus G752VS-XB78K | |
| HP Omen 17-w110ng | |
| Gigabyte P57X v6 | |
| Nexoc G734III | |
| MSI GS73VR 6RF | |
| HP Omen 17-w010ng | |
| Creative Score Accelerated v2 | |
| Asus G752VS-XB78K | |
| HP Omen 17-w110ng | |
| Nexoc G734III | |
| Gigabyte P57X v6 | |
| MSI GS73VR 6RF | |
| HP Omen 17-w010ng | |
| PCMark 7 Score | 5556 pontos | |
| PCMark 8 Home Score Accelerated v2 | 4833 pontos | |
| PCMark 8 Creative Score Accelerated v2 | 7128 pontos | |
| PCMark 8 Work Score Accelerated v2 | 5394 pontos | |
Ajuda | ||
| HP Omen 17-w110ng Samsung PM951 NVMe MZVLV256 | HP Omen 17-w010ng Samsung PM951 NVMe MZVLV512 | Nexoc G734III Samsung SM951 MZVPV256HDGL m.2 PCI-e | MSI GS73VR 6RF SanDisk SD8SN8U1T001122 | Gigabyte P57X v6 Transcend MTS800 256GB M.2 (TS256GMTS800) | Asus G752VS-XB78K Toshiba NVMe THNSN5512GPU7 | |
|---|---|---|---|---|---|---|
| CrystalDiskMark 3.0 | 20% | 99% | -45% | -30% | 126% | |
| Read Seq (MB/s) | 1156 | 1234 7% | 1917 66% | 334.3 -71% | 481.7 -58% | 1718 49% |
| Write Seq (MB/s) | 294.9 | 583 98% | 1283 335% | 319 8% | 315.4 7% | 1305 343% |
| Read 512 (MB/s) | 616 | 606 -2% | 871 41% | 242.3 -61% | 303.1 -51% | 1250 103% |
| Write 512 (MB/s) | 294.7 | 428.3 45% | 1199 307% | 254.4 -14% | 314.4 7% | 1438 388% |
| Read 4k (MB/s) | 42.7 | 41.42 -3% | 51 19% | 20.3 -52% | 25.93 -39% | 44.42 4% |
| Write 4k (MB/s) | 153.3 | 137.2 -11% | 142.1 -7% | 42.51 -72% | 84.6 -45% | 154.4 1% |
| Read 4k QD32 (MB/s) | 600 | 622 4% | 603 0% | 251.6 -58% | 273.9 -54% | 744 24% |
| Write 4k QD32 (MB/s) | 295.3 | 348.3 18% | 382.4 29% | 167.1 -43% | 274.9 -7% | 578 96% |

| 3DMark | |
| 1280x720 Cloud Gate Standard Graphics | |
| Asus G752VS-XB78K | |
| HP Omen 17-w110ng | |
| Gigabyte P57X v6 | |
| Nexoc G734III | |
| MSI GS73VR 6RF | |
| HP Omen 17-w010ng | |
| 1920x1080 Fire Strike Graphics | |
| Asus G752VS-XB78K | |
| Nexoc G734III | |
| HP Omen 17-w110ng | |
| MSI GS73VR 6RF | |
| HP Omen 17-w010ng | |
| 3DMark 11 - 1280x720 Performance GPU | |
| Gigabyte P57X v6 | |
| Asus G752VS-XB78K | |
| Nexoc G734III | |
| HP Omen 17-w110ng | |
| MSI GS73VR 6RF | |
| HP Omen 17-w010ng | |
| 3DMark 11 Performance | 14116 pontos | |
| 3DMark Ice Storm Standard Score | 107777 pontos | |
| 3DMark Cloud Gate Standard Score | 22908 pontos | |
| 3DMark Fire Strike Score | 11779 pontos | |
| 3DMark Fire Strike Extreme Score | 6894 pontos | |
| 3DMark Time Spy Score | 4729 pontos | |
Ajuda | ||
| The Witcher 3 | |
| 1920x1080 Ultra Graphics & Postprocessing (HBAO+) | |
| Asus G752VS-XB78K | |
| Nexoc G734III | |
| HP Omen 17-w110ng | |
| 3840x2160 High Graphics & Postprocessing (Nvidia HairWorks Off) | |
| Asus G752VS-XB78K | |
| HP Omen 17-w110ng | |
| Rise of the Tomb Raider | |
| 1920x1080 Very High Preset AA:FX AF:16x | |
| Asus G752VS-XB78K | |
| Gigabyte P57X v6 | |
| HP Omen 17-w110ng | |
| MSI GS73VR 6RF | |
| 3840x2160 High Preset AA:FX AF:4x | |
| Asus G752VS-XB78K | |
| HP Omen 17-w110ng | |
| baixo | média | alto | ultra | 4K | |
|---|---|---|---|---|---|
| BioShock Infinite (2013) | 197.1 | 171 | 161 | 103.8 | |
| The Witcher 3 (2015) | 196.3 | 150 | 94.8 | 50.8 | 34 |
| Rise of the Tomb Raider (2016) | 173 | 151.7 | 105.6 | 89.7 | 36.1 |
| XCOM 2 (2016) | 86.4 | 74.9 | 66.1 | 39.2 | 22.8 |
| Far Cry Primal (2016) | 107 | 93 | 83 | 79 | 37 |
| Doom (2016) | 147.5 | 140.1 | 125.7 | 116.6 | 49.8 |
| No Man's Sky (2016) | 118.6 | 114.5 | 104 | 48.7 | 43.3 |
| Mafia 3 (2016) | 72.3 | 70.2 | 43.2 | 19 | |
| Battlefield 1 (2016) | 176.3 | 159.5 | 118.9 | 110.1 | 45.7 |
Barulho
| Ocioso |
| 33 / 34 / 35 dB |
| HDD |
| 34 dB |
| Carga |
| 45 / 52 dB |
 | ||
30 dB silencioso 40 dB(A) audível 50 dB(A) ruidosamente alto |
||
min: | ||
| HP Omen 17-w110ng 6700HQ, GeForce GTX 1070 Mobile | HP Omen 17-w010ng 6700HQ, GeForce GTX 965M | Nexoc G734III 6700HQ, GeForce GTX 1070 Mobile | MSI GS73VR 6RF 6700HQ, GeForce GTX 1060 Mobile | Gigabyte P57X v6 6700HQ, GeForce GTX 1070 Mobile | Asus G752VS-XB78K 6820HK, GeForce GTX 1070 Mobile | |
|---|---|---|---|---|---|---|
| Noise | 3% | 2% | 3% | 0% | 7% | |
| desligado / ambiente * (dB) | 30 | 30 -0% | 30 -0% | 28.4 5% | 29.7 1% | 30 -0% |
| Idle Minimum * (dB) | 33 | 32 3% | 31 6% | 31.9 3% | 33.2 -1% | 31 6% |
| Idle Average * (dB) | 34 | 33 3% | 32 6% | 32 6% | 33.2 2% | 32 6% |
| Idle Maximum * (dB) | 35 | 34 3% | 33 6% | 34 3% | 33.2 5% | 33 6% |
| Load Average * (dB) | 45 | 41 9% | 49 -9% | 47 -4% | 47.5 -6% | 40 11% |
| Load Maximum * (dB) | 52 | 51 2% | 50 4% | 49.4 5% | 52.5 -1% | 47 10% |
* ... menor é melhor
(±) A temperatura máxima no lado superior é 45 °C / 113 F, em comparação com a média de 40.4 °C / 105 F , variando de 21.2 a 68.8 °C para a classe Gaming.
(-) A parte inferior aquece até um máximo de 54.3 °C / 130 F, em comparação com a média de 43.2 °C / 110 F
(+) Em uso inativo, a temperatura média para o lado superior é 26.5 °C / 80 F, em comparação com a média do dispositivo de 33.9 °C / ### class_avg_f### F.
(+) Os apoios para as mãos e o touchpad são mais frios que a temperatura da pele, com um máximo de 29.8 °C / 85.6 F e, portanto, são frios ao toque.
(±) A temperatura média da área do apoio para as mãos de dispositivos semelhantes foi 28.8 °C / 83.8 F (-1 °C / -1.8 F).
| HP Omen 17-w110ng 6700HQ, GeForce GTX 1070 Mobile | HP Omen 17-w010ng 6700HQ, GeForce GTX 965M | Nexoc G734III 6700HQ, GeForce GTX 1070 Mobile | MSI GS73VR 6RF 6700HQ, GeForce GTX 1060 Mobile | Gigabyte P57X v6 6700HQ, GeForce GTX 1070 Mobile | Asus G752VS-XB78K 6820HK, GeForce GTX 1070 Mobile | |
|---|---|---|---|---|---|---|
| Heat | 1% | -4% | -4% | -18% | 5% | |
| Maximum Upper Side * (°C) | 45 | 50.2 -12% | 50 -11% | 50.8 -13% | 59 -31% | 42.9 5% |
| Maximum Bottom * (°C) | 54.3 | 54.1 -0% | 60.5 -11% | 60 -10% | 66 -22% | 41.5 24% |
| Idle Upper Side * (°C) | 29.6 | 28.9 2% | 29.1 2% | 27.4 7% | 33.2 -12% | 31.6 -7% |
| Idle Bottom * (°C) | 28.6 | 24.3 15% | 26.9 6% | 28.8 -1% | 30.6 -7% | 29.5 -3% |
* ... menor é melhor
HP Omen 17-w110ng análise de áudio
(+) | os alto-falantes podem tocar relativamente alto (###valor### dB)
Graves 100 - 315Hz
(-) | quase nenhum baixo - em média 22.3% menor que a mediana
(±) | a linearidade dos graves é média (13.2% delta para a frequência anterior)
Médios 400 - 2.000 Hz
(+) | médios equilibrados - apenas 2.7% longe da mediana
(+) | médios são lineares (4.9% delta para frequência anterior)
Altos 2 - 16 kHz
(±) | máximos mais altos - em média 5.9% maior que a mediana
(+) | os máximos são lineares (5.3% delta da frequência anterior)
Geral 100 - 16.000 Hz
(±) | a linearidade do som geral é média (18.5% diferença em relação à mediana)
Comparado com a mesma classe
» 60% de todos os dispositivos testados nesta classe foram melhores, 8% semelhantes, 32% piores
» O melhor teve um delta de 6%, a média foi 18%, o pior foi 132%
Comparado com todos os dispositivos testados
» 42% de todos os dispositivos testados foram melhores, 8% semelhantes, 51% piores
» O melhor teve um delta de 4%, a média foi 23%, o pior foi 134%
Acer Predator 17 G9-793-77LG análise de áudio
(+) | os alto-falantes podem tocar relativamente alto (###valor### dB)
Graves 100 - 315Hz
(±) | graves reduzidos - em média 7.8% menor que a mediana
(±) | a linearidade dos graves é média (8.2% delta para a frequência anterior)
Médios 400 - 2.000 Hz
(+) | médios equilibrados - apenas 4% longe da mediana
(+) | médios são lineares (4.6% delta para frequência anterior)
Altos 2 - 16 kHz
(+) | agudos equilibrados - apenas 3.7% longe da mediana
(±) | a linearidade dos máximos é média (7.1% delta para frequência anterior)
Geral 100 - 16.000 Hz
(+) | o som geral é linear (12% diferença em relação à mediana)
Comparado com a mesma classe
» 12% de todos os dispositivos testados nesta classe foram melhores, 4% semelhantes, 84% piores
» O melhor teve um delta de 6%, a média foi 18%, o pior foi 132%
Comparado com todos os dispositivos testados
» 9% de todos os dispositivos testados foram melhores, 2% semelhantes, 88% piores
» O melhor teve um delta de 4%, a média foi 23%, o pior foi 134%
| desligado | |
| Ocioso | |
| Carga |
|
Key:
min: | |
| HP Omen 17-w110ng 6700HQ, GeForce GTX 1070 Mobile | HP Omen 17-w010ng 6700HQ, GeForce GTX 965M | Nexoc G734III 6700HQ, GeForce GTX 1070 Mobile | MSI GS73VR 6RF 6700HQ, GeForce GTX 1060 Mobile | Gigabyte P57X v6 6700HQ, GeForce GTX 1070 Mobile | Asus G752VS-XB78K 6820HK, GeForce GTX 1070 Mobile | |
|---|---|---|---|---|---|---|
| Power Consumption | 27% | 11% | -14% | -16% | -15% | |
| Idle Minimum * (Watt) | 19 | 10 47% | 13 32% | 22.6 -19% | 18.4 3% | 24 -26% |
| Idle Average * (Watt) | 25 | 19 24% | 20 20% | 32.7 -31% | 22.8 9% | 31 -24% |
| Idle Maximum * (Watt) | 31 | 25 19% | 27 13% | 32.8 -6% | 24 23% | 36 -16% |
| Load Average * (Watt) | 90 | 83 8% | 90 -0% | 114.7 -27% | 175.5 -95% | 94 -4% |
| Load Maximum * (Watt) | 193 | 118 39% | 210 -9% | 167.9 13% | 229.5 -19% | 204 -6% |
* ... menor é melhor
| HP Omen 17-w110ng 95 Wh | HP Omen 17-w010ng 62 Wh | Nexoc G734III 60 Wh | MSI GS73VR 6RF 65 Wh | Gigabyte P57X v6 75.81 Wh | Asus G752VS-XB78K 90 Wh | |
|---|---|---|---|---|---|---|
| Duração da bateria | -10% | -15% | -24% | -10% | -23% | |
| Reader / Idle (h) | 7.2 | 7.3 1% | 6.7 -7% | 5.9 -18% | 7 -3% | 5.2 -28% |
| H.264 (h) | 3.9 | 3.6 -8% | 3.5 -10% | 3.1 -21% | ||
| WiFi v1.3 (h) | 4.1 | 4 -2% | 3 -27% | 3.6 -12% | 3.4 -17% | 3.5 -15% |
| Load (h) | 1.9 | 1.3 -32% | 1.6 -16% | 1.1 -42% | 1.7 -11% | 1.4 -26% |
Pro
Contra

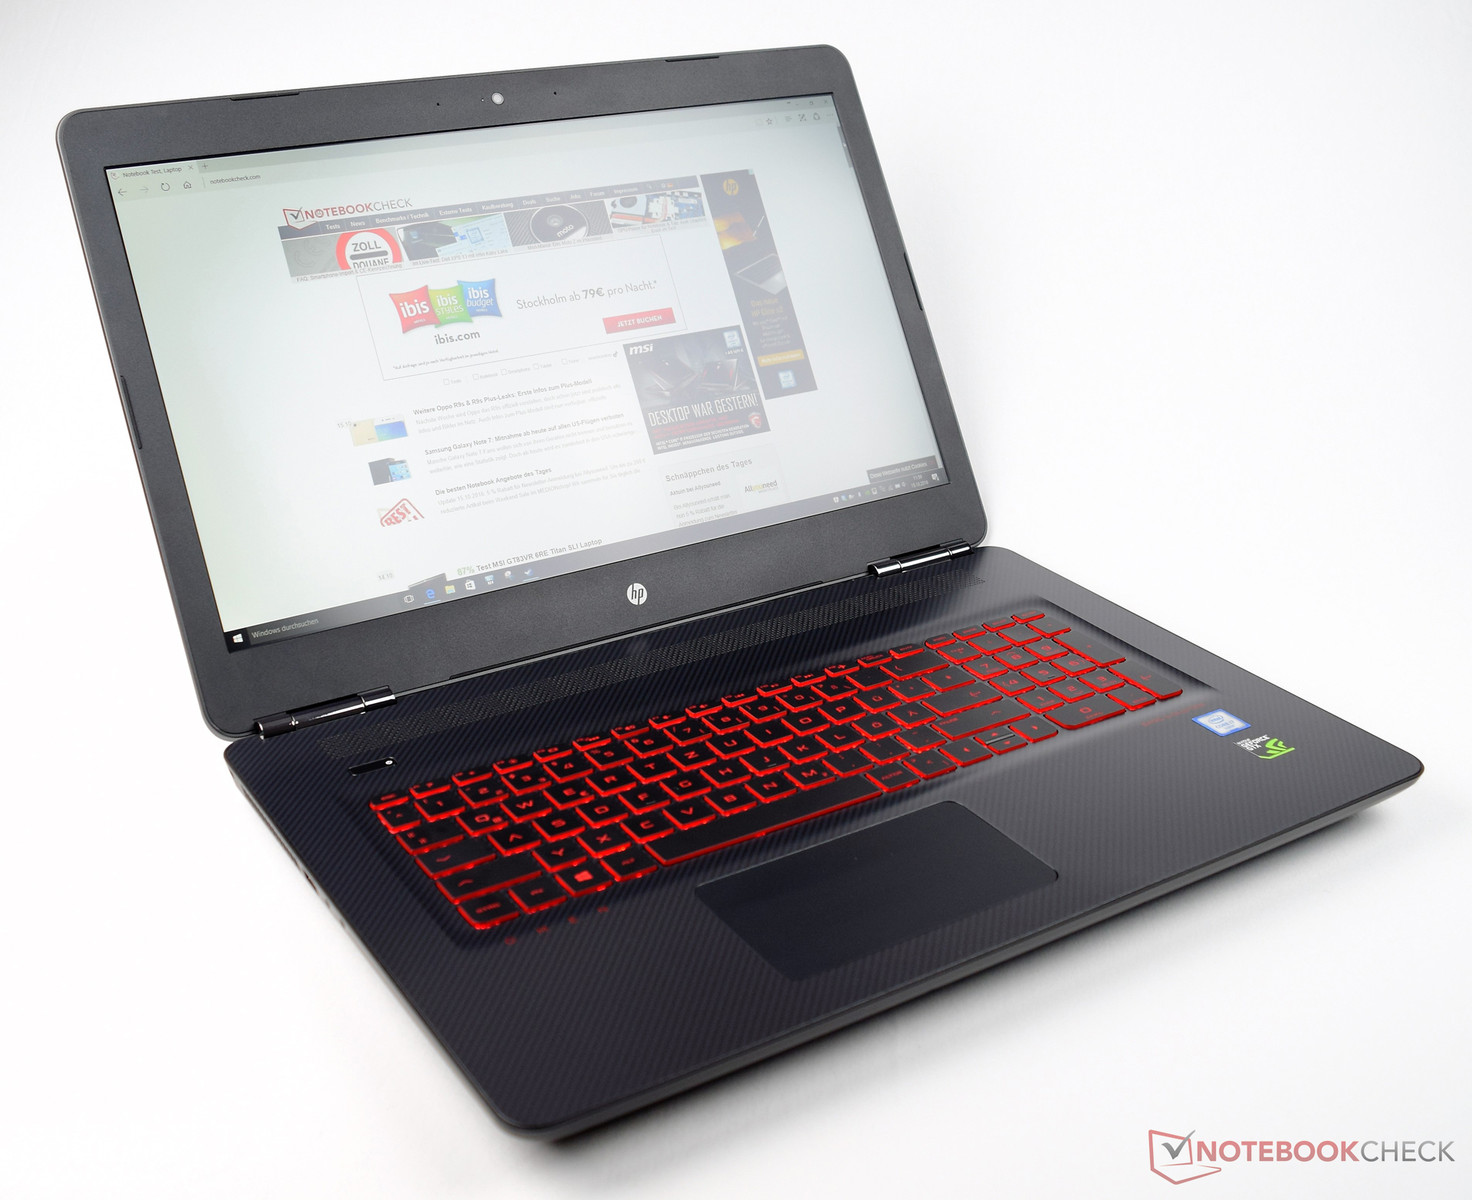
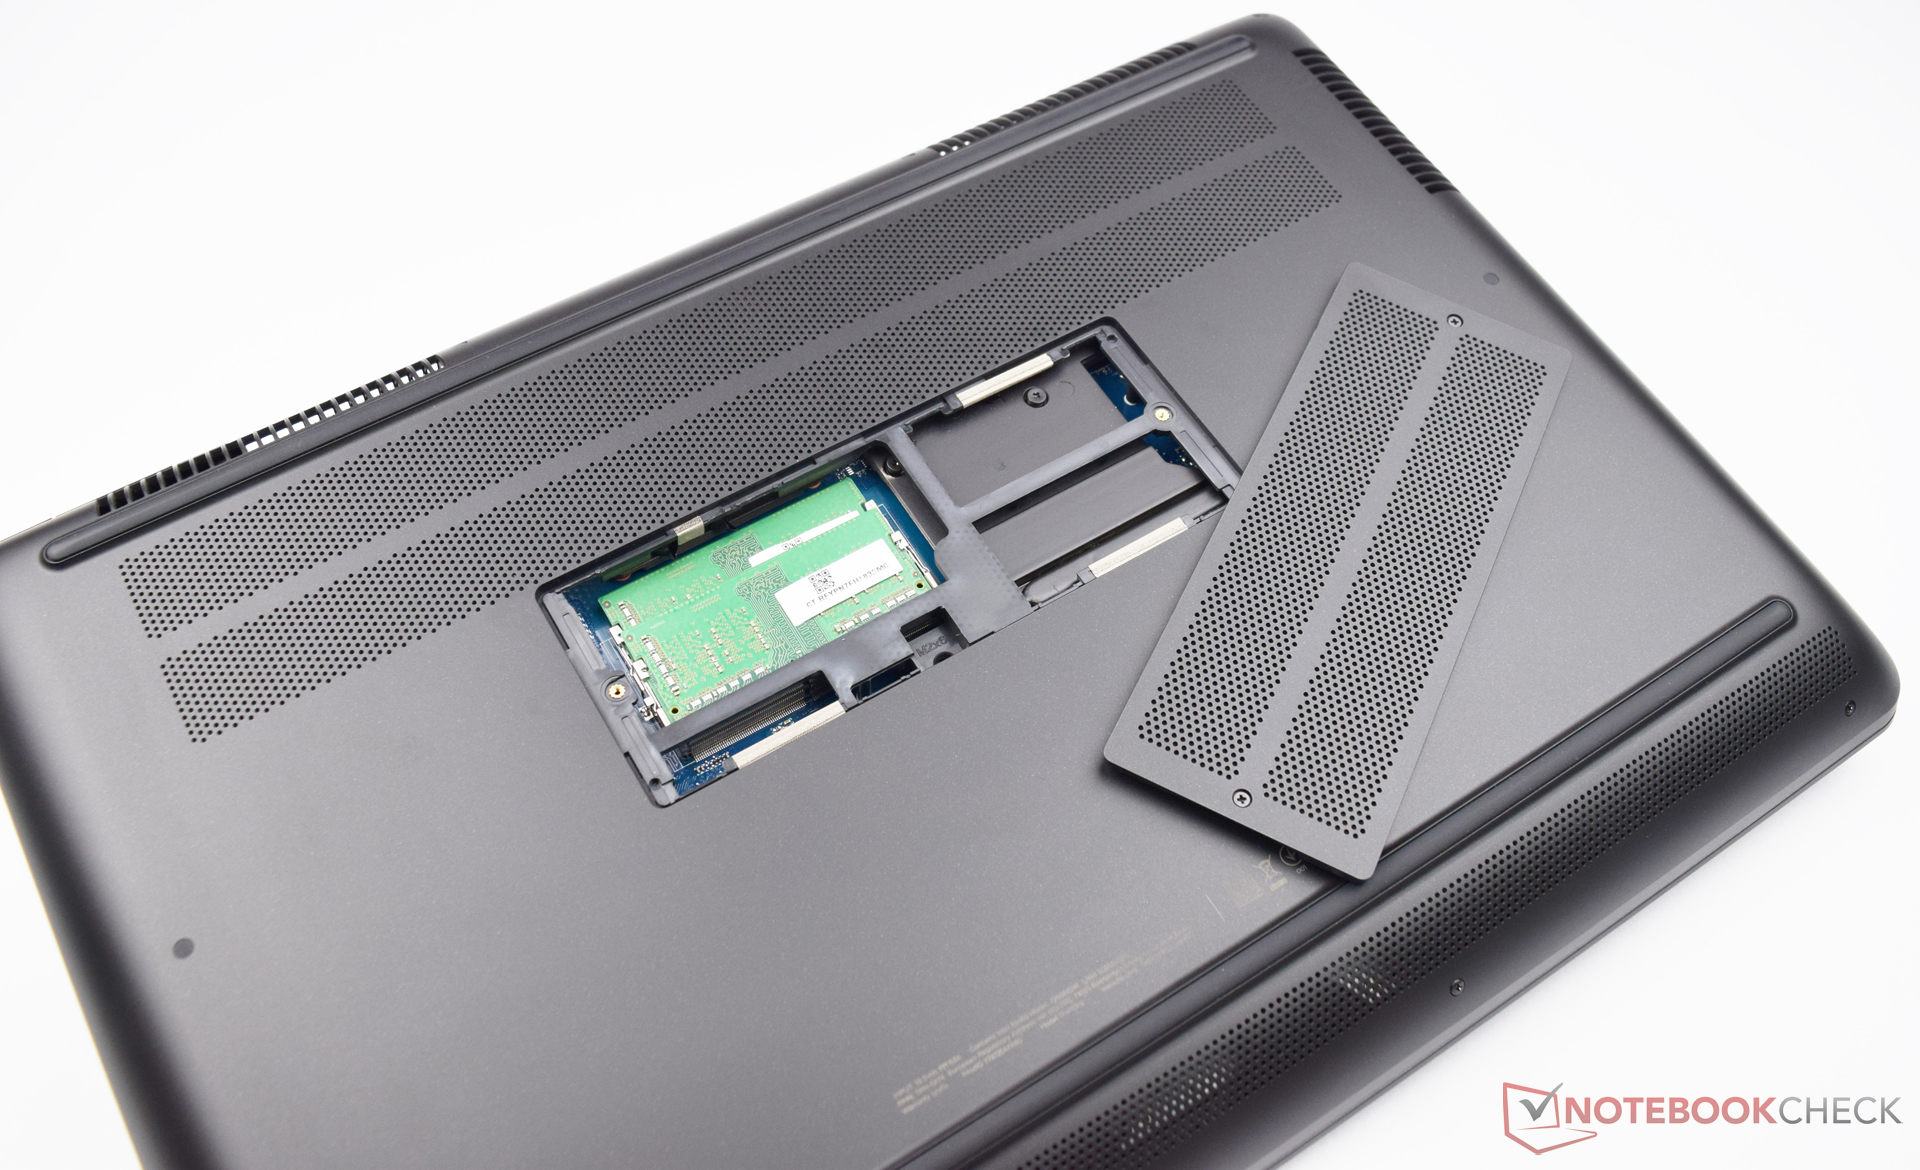
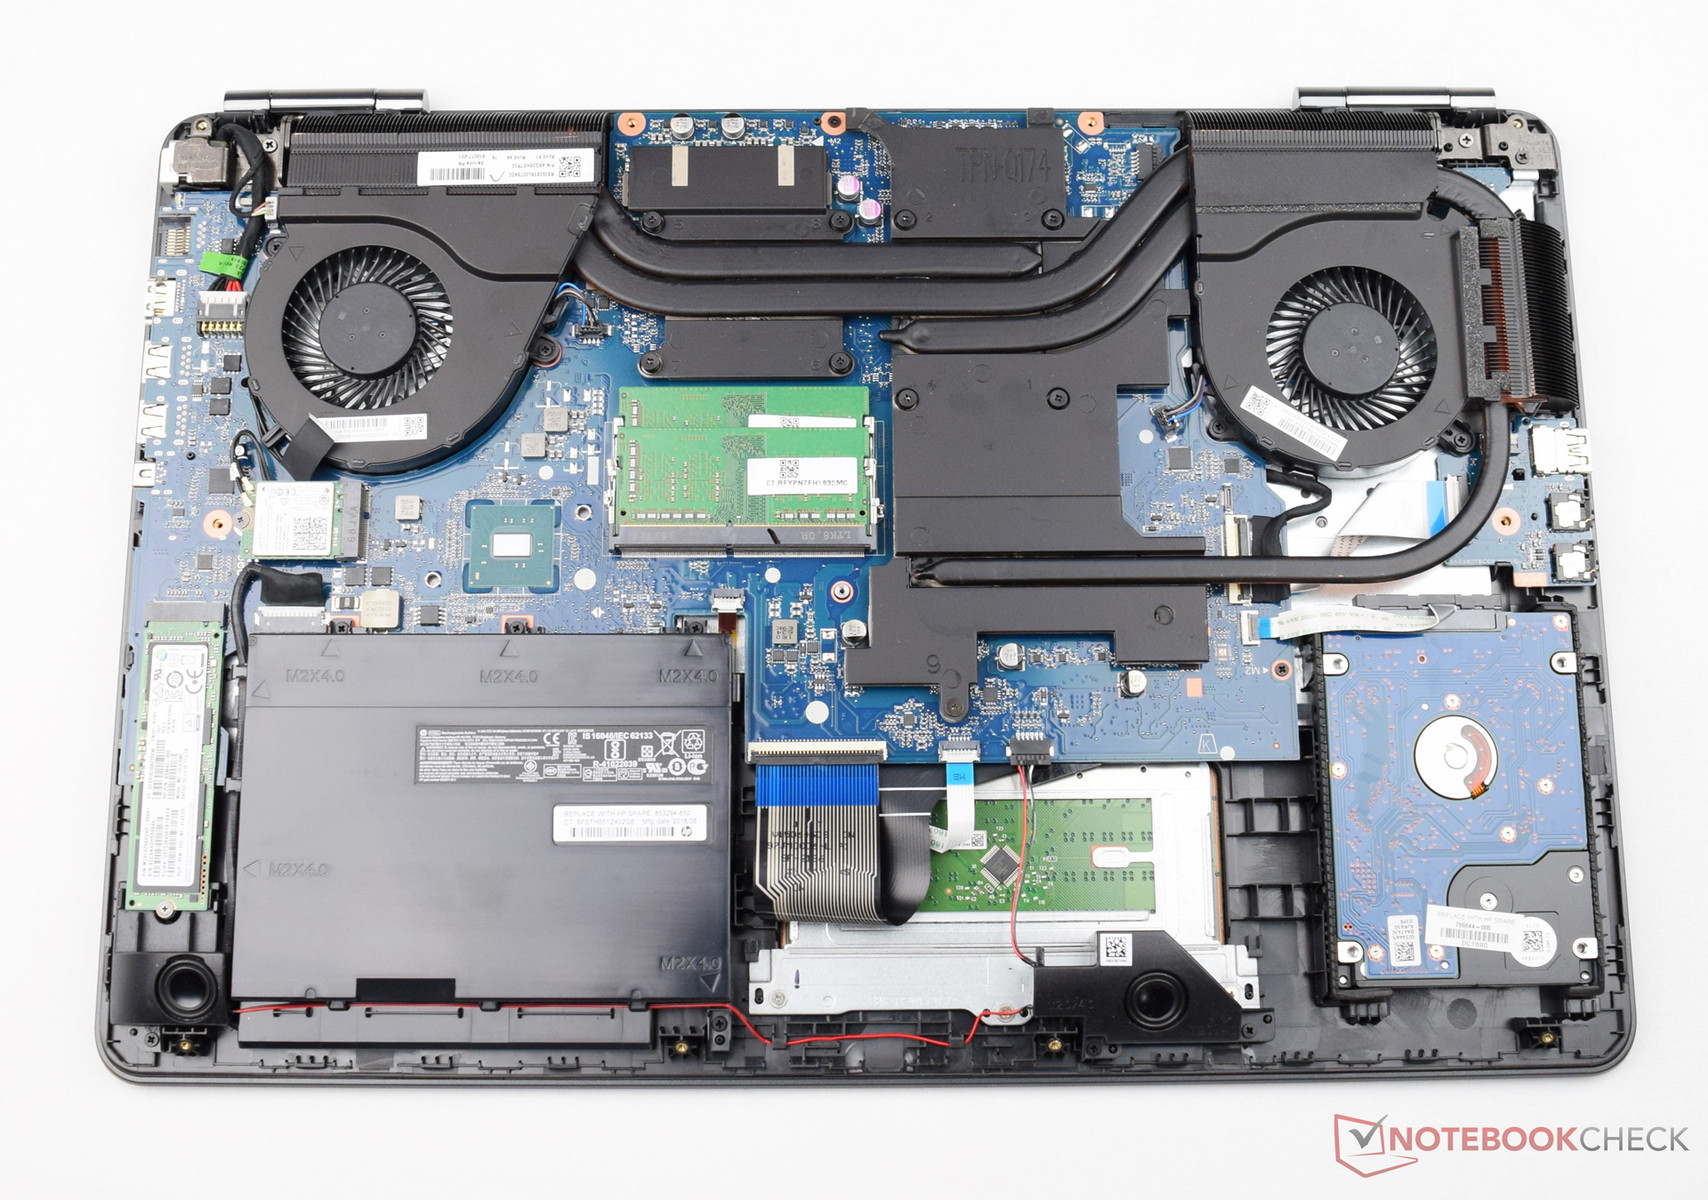
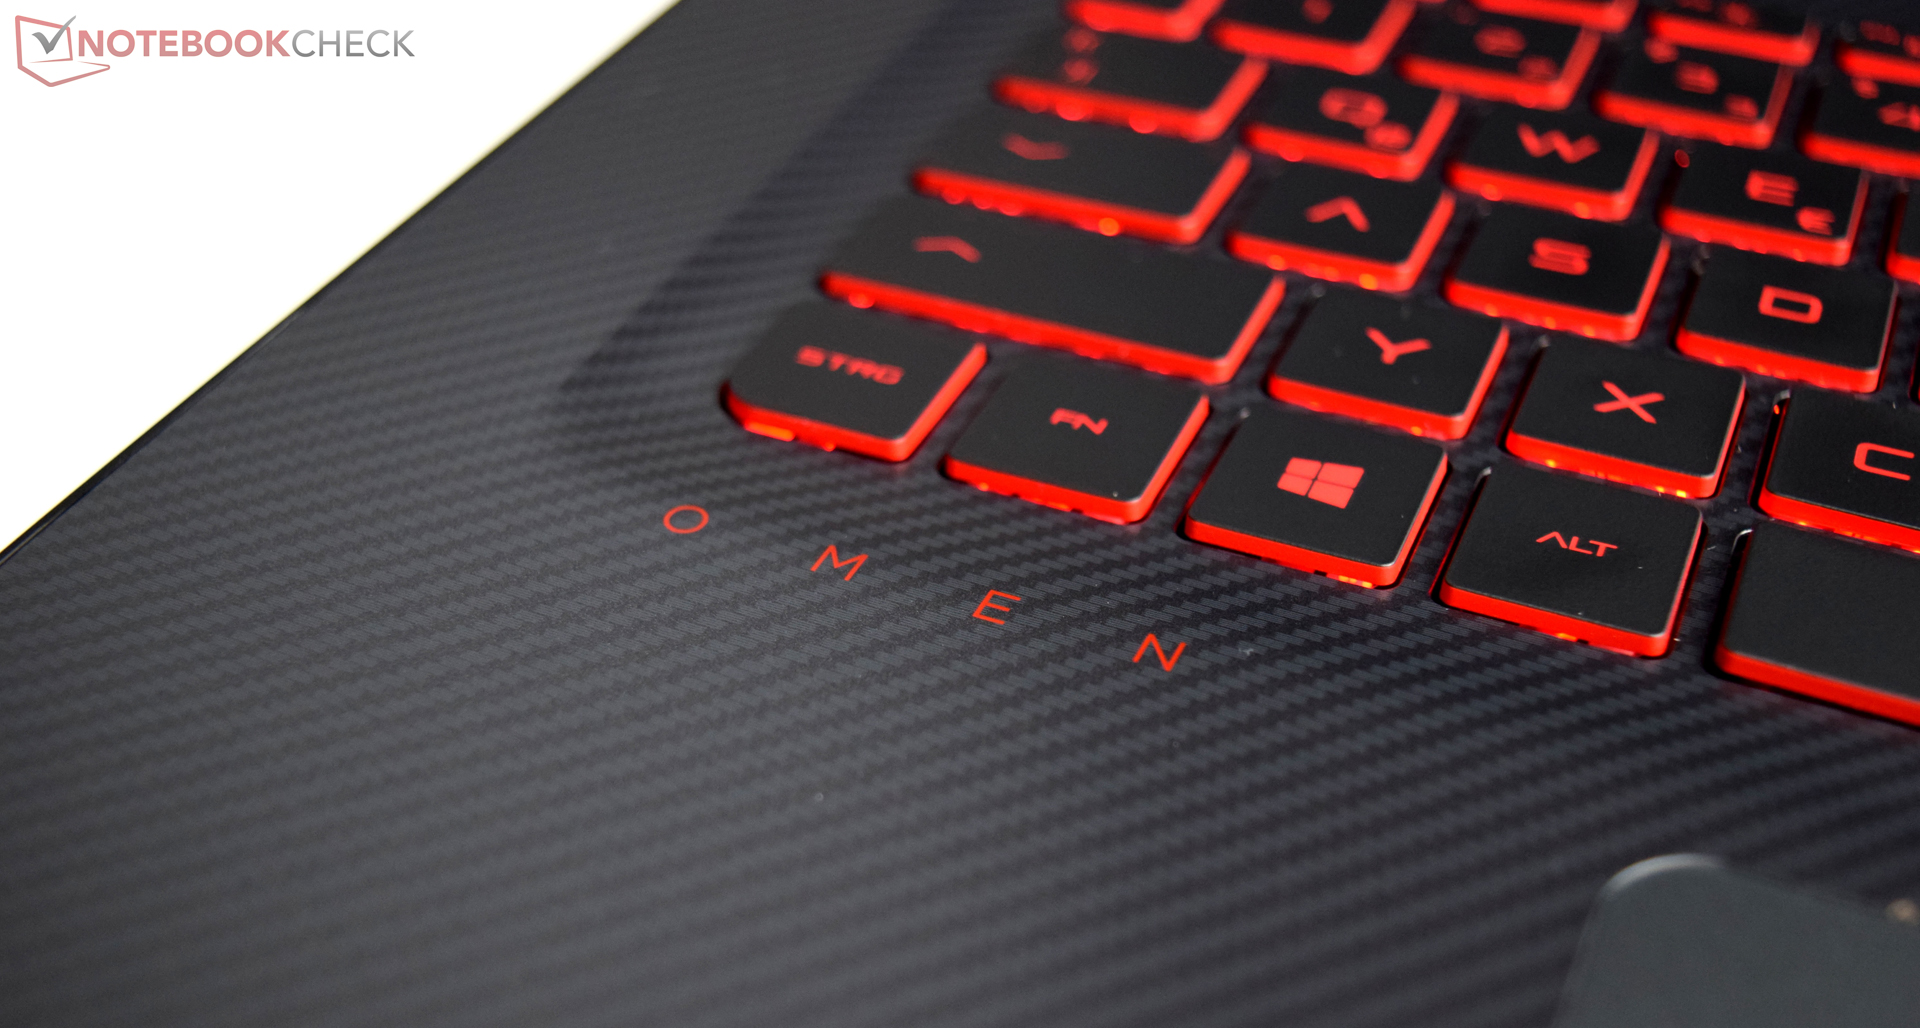
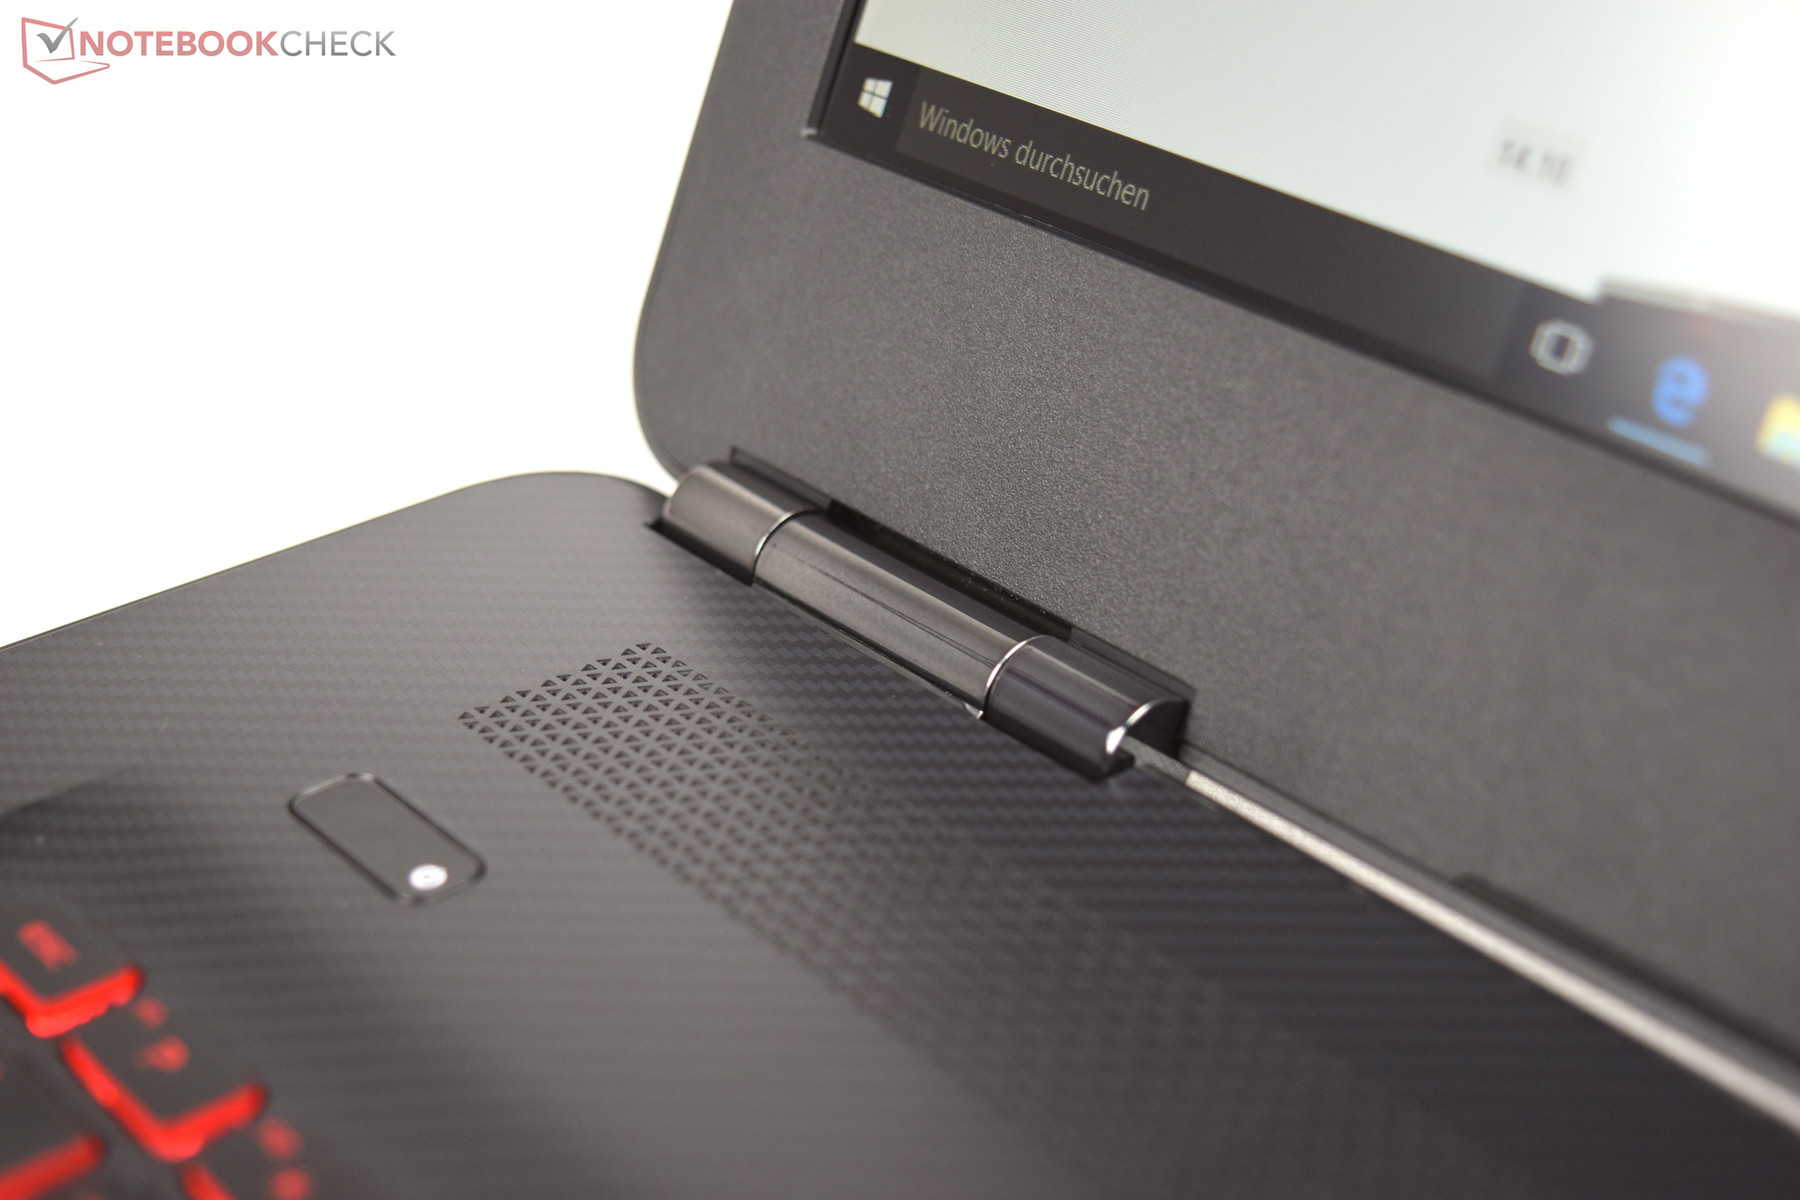
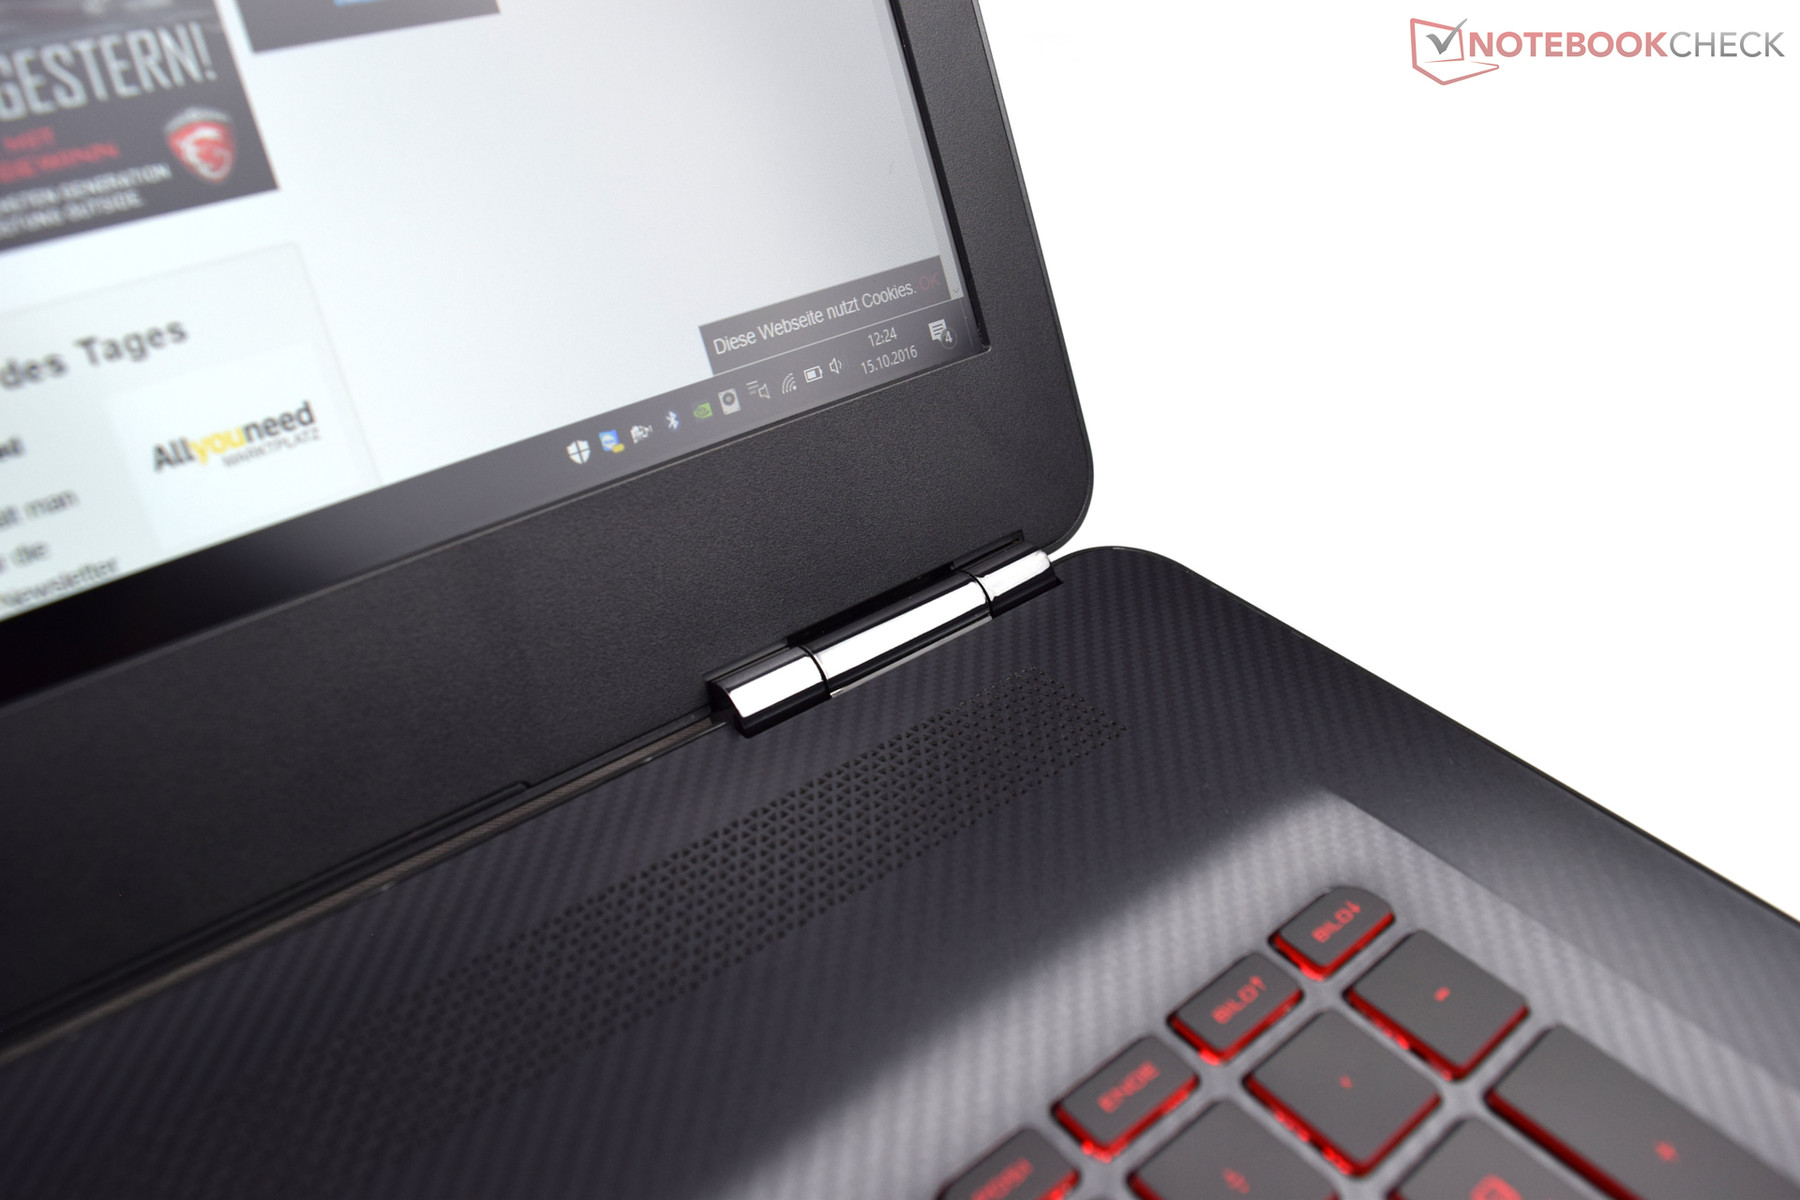
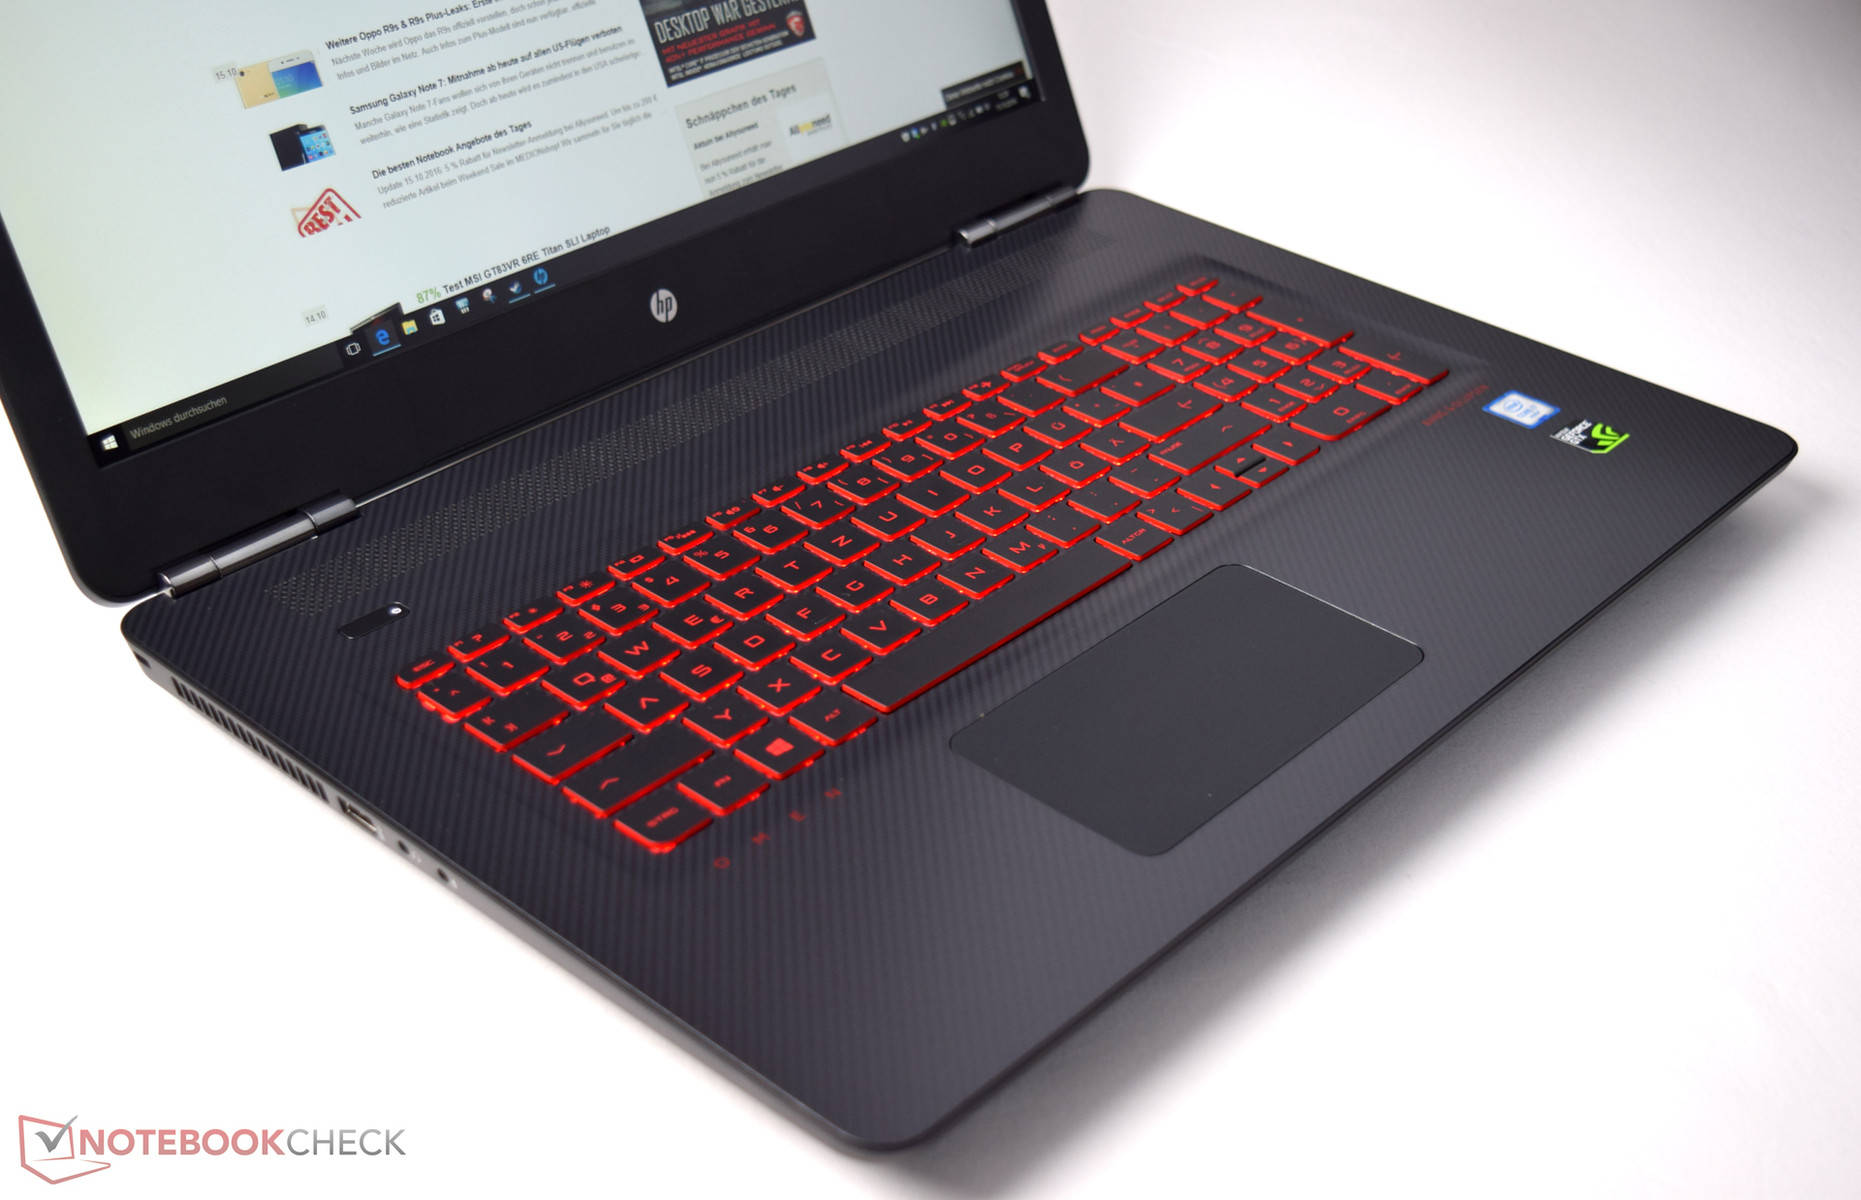
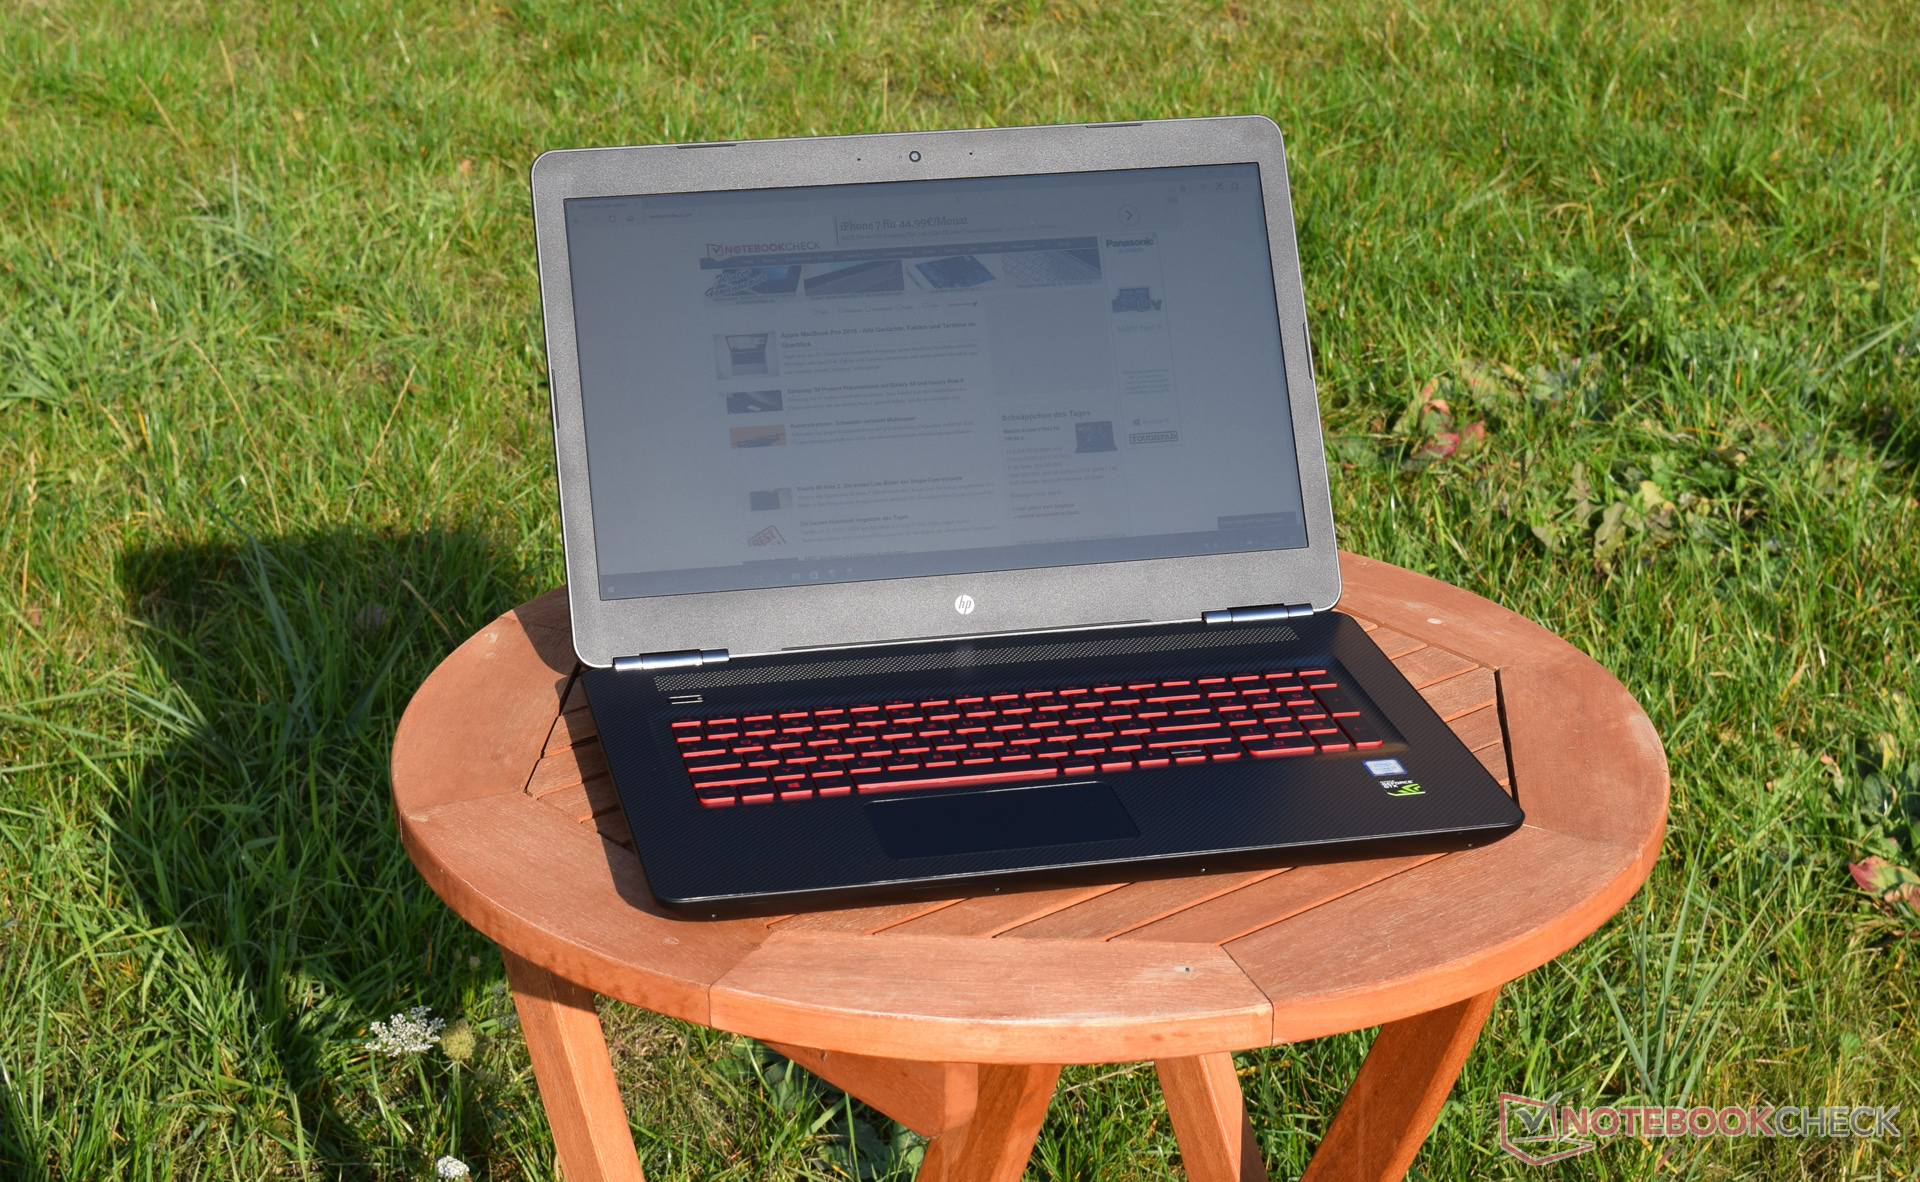
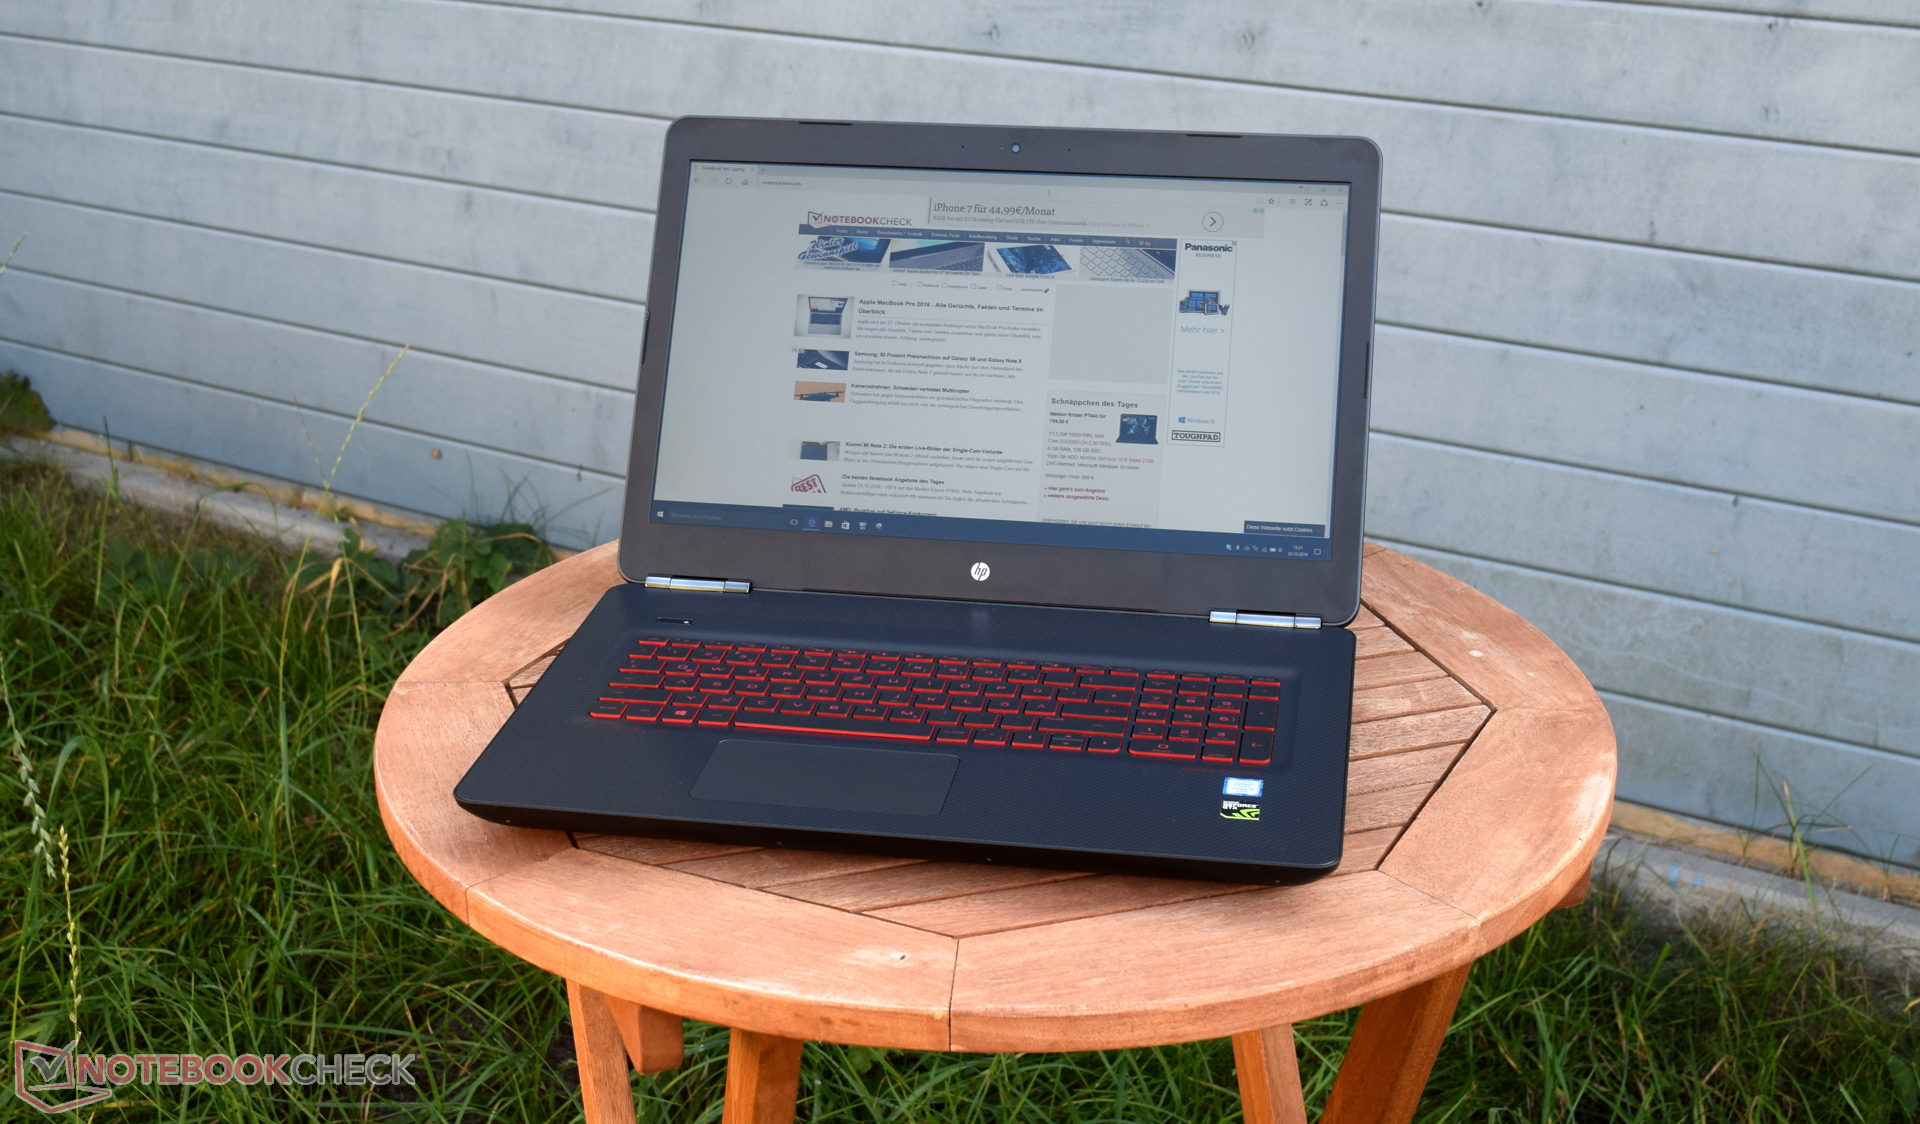
Muitas pessoas pensam sobre portáteis empresariais ou de escritório quando escutam HP, mas o nome Omen representa a série de jogos da HP. O nosso modelo de teste, o Omen 17-w110ng, consegue atender as expectativas de um portátil para jogos. Os usuários recebem uma poderosa combinação de CPU/GPU dentro de um elegante chassi, mas ele é feito apenas de plástico e não conta com uma unidade ótica. A falta de dita unidade não é um fator decisivo quando considera as plataformas de jogos como Steam, onde você pode descarregar seus jogos.
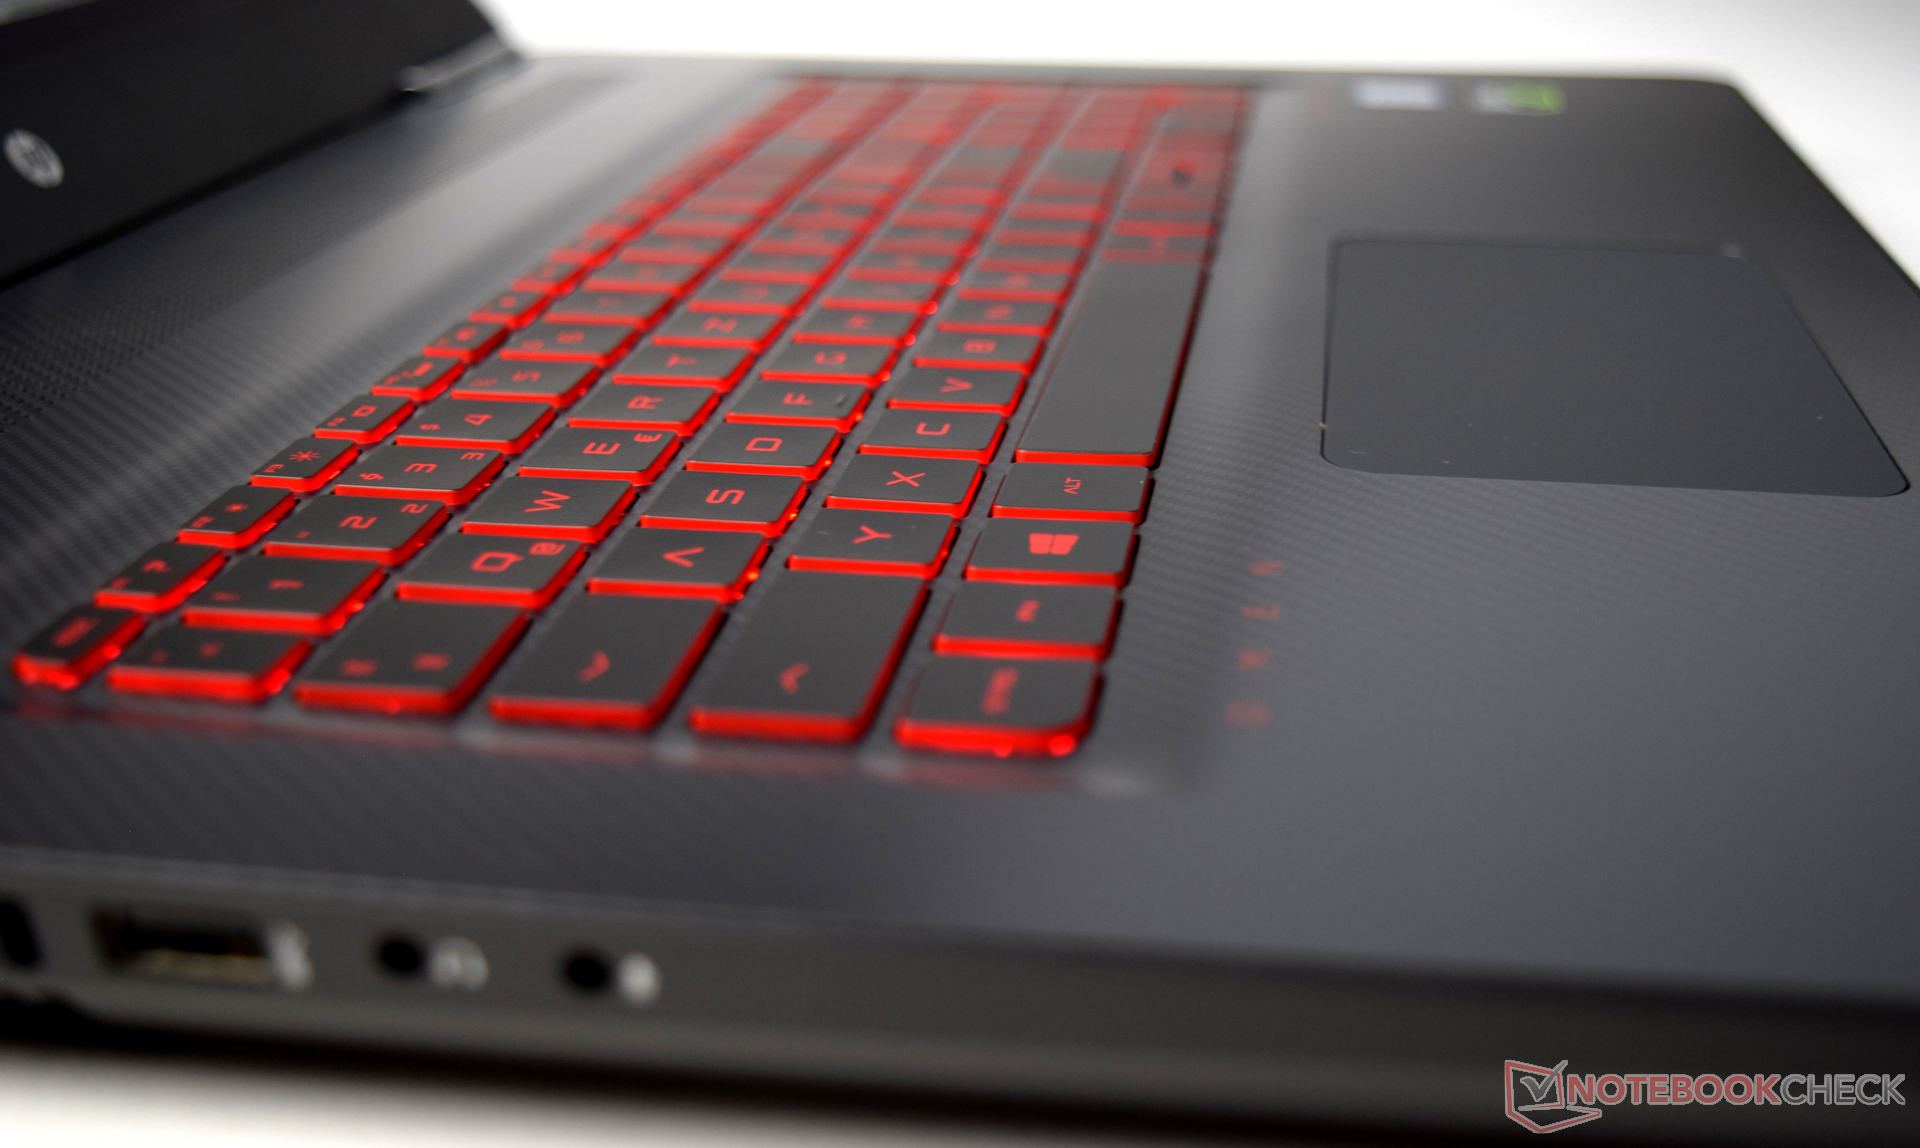
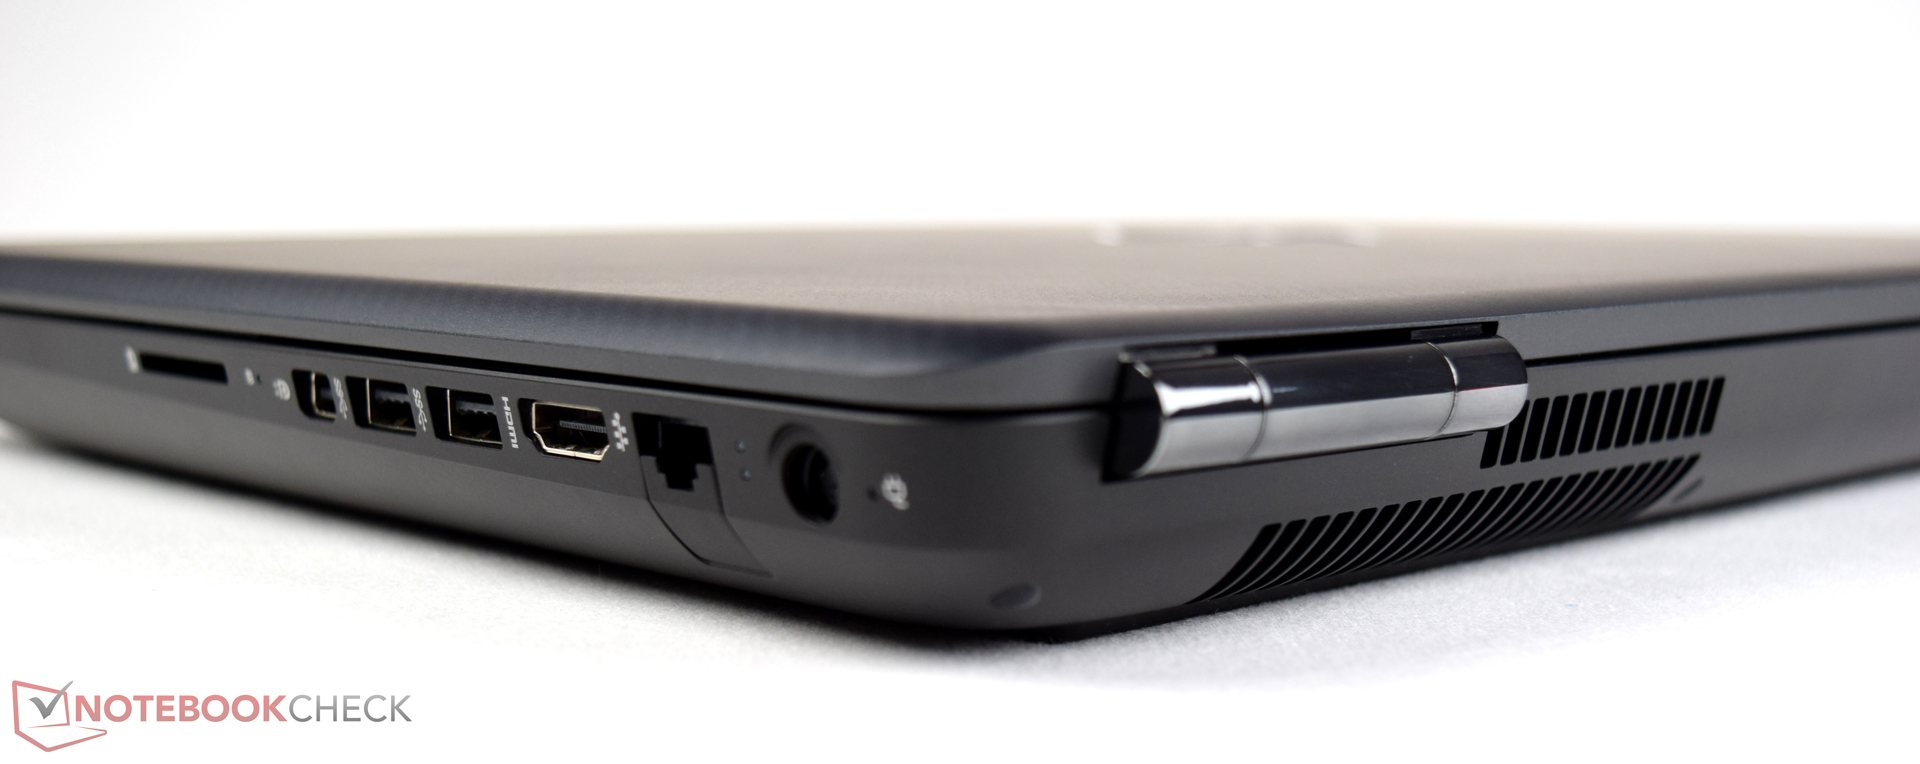
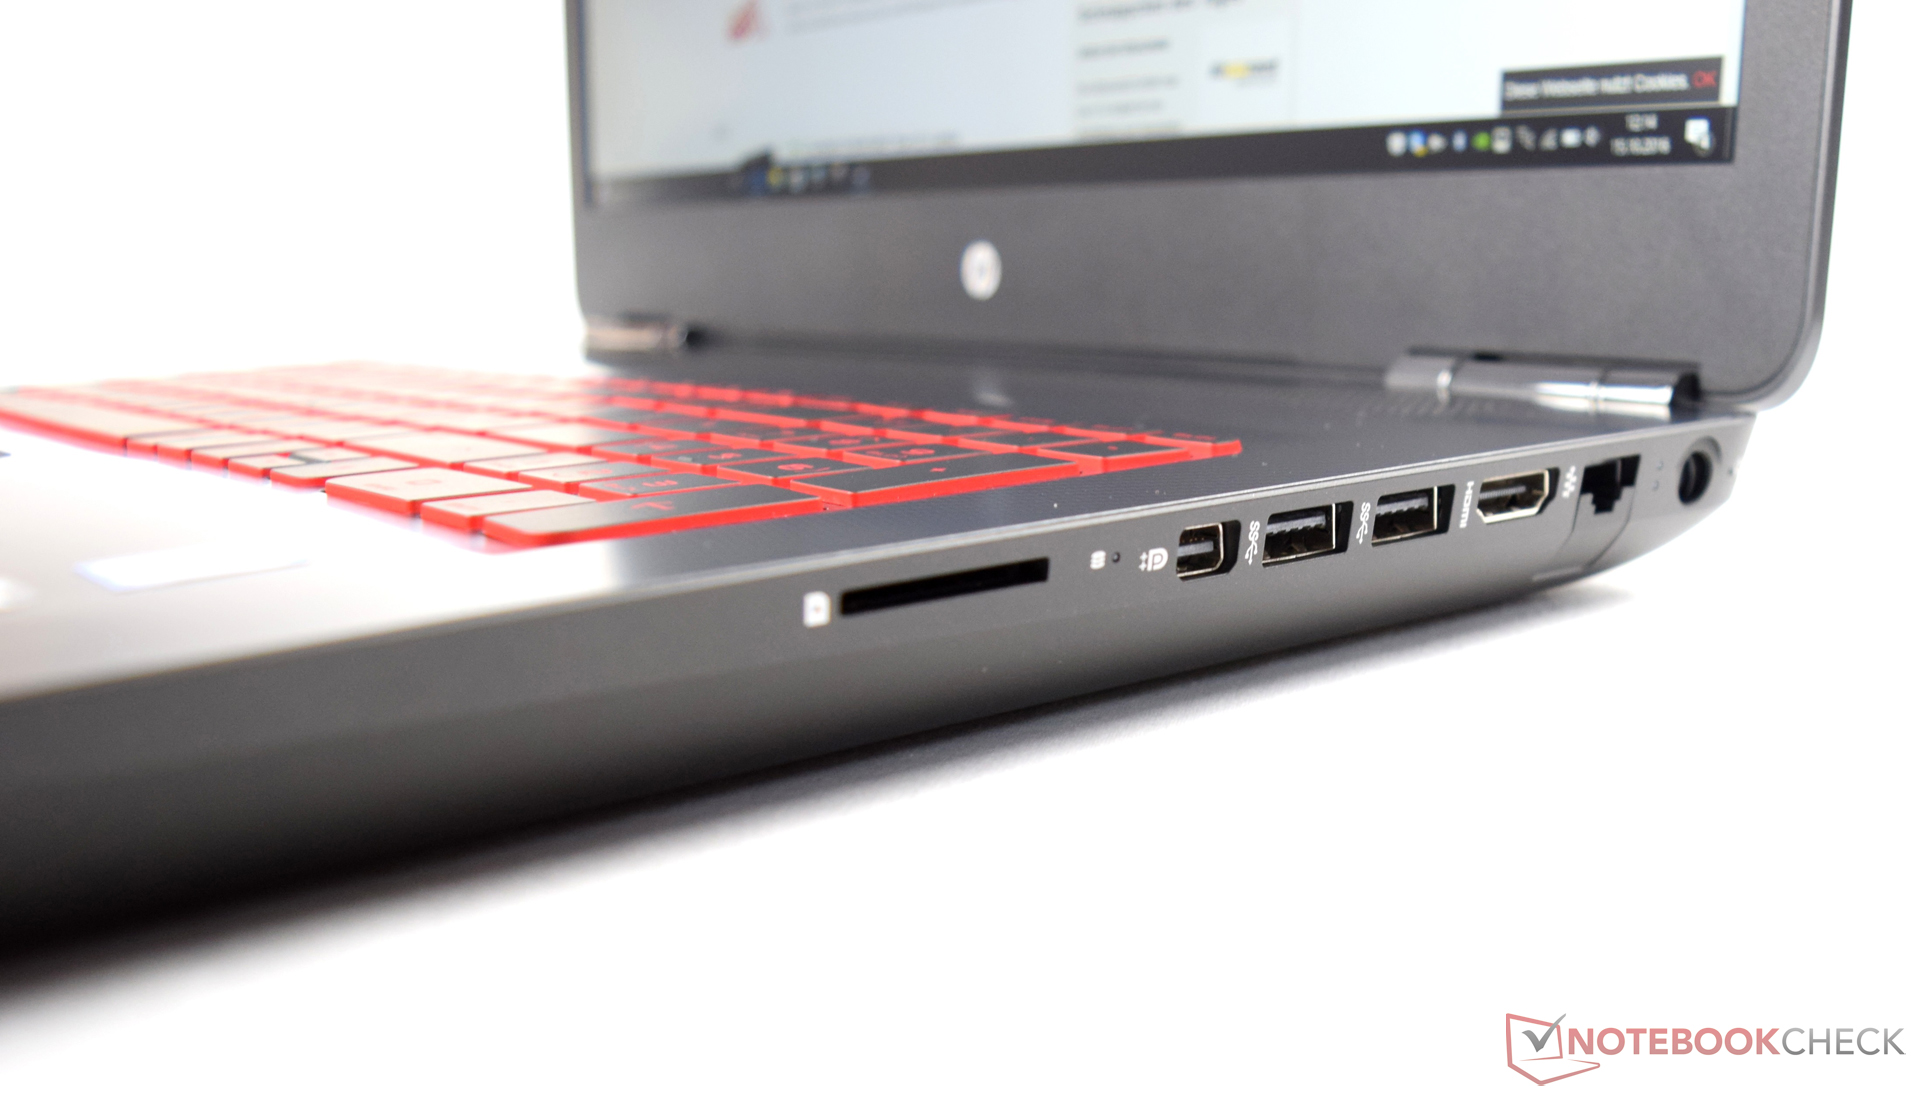
Um pouco questionável é a seleção de portas com apenas três portas USB 3.0. Teríamos esperado, pelo menos, uma porta USB 3.1 Gen.2 com um conector Type-C. A HP deveria dar uma olhada nos dispositivos de entrada. Estamos falando sobre o touchpad em particular, que deixa uma impressão barata para esta faixa de preços. As dimensões também não são perfeitas, porque uma altura de apenas 6,5 centímetros (~2,6 pol.) não é muito generosa.
Em resumo, o HP Omen 17-w110ng é um bom pacote por um preço justo. O desempenho do sistema de jogos não causa críticas. O portátil roda muito bem, e você pode desfrutar de jogos sem restrição alguma.
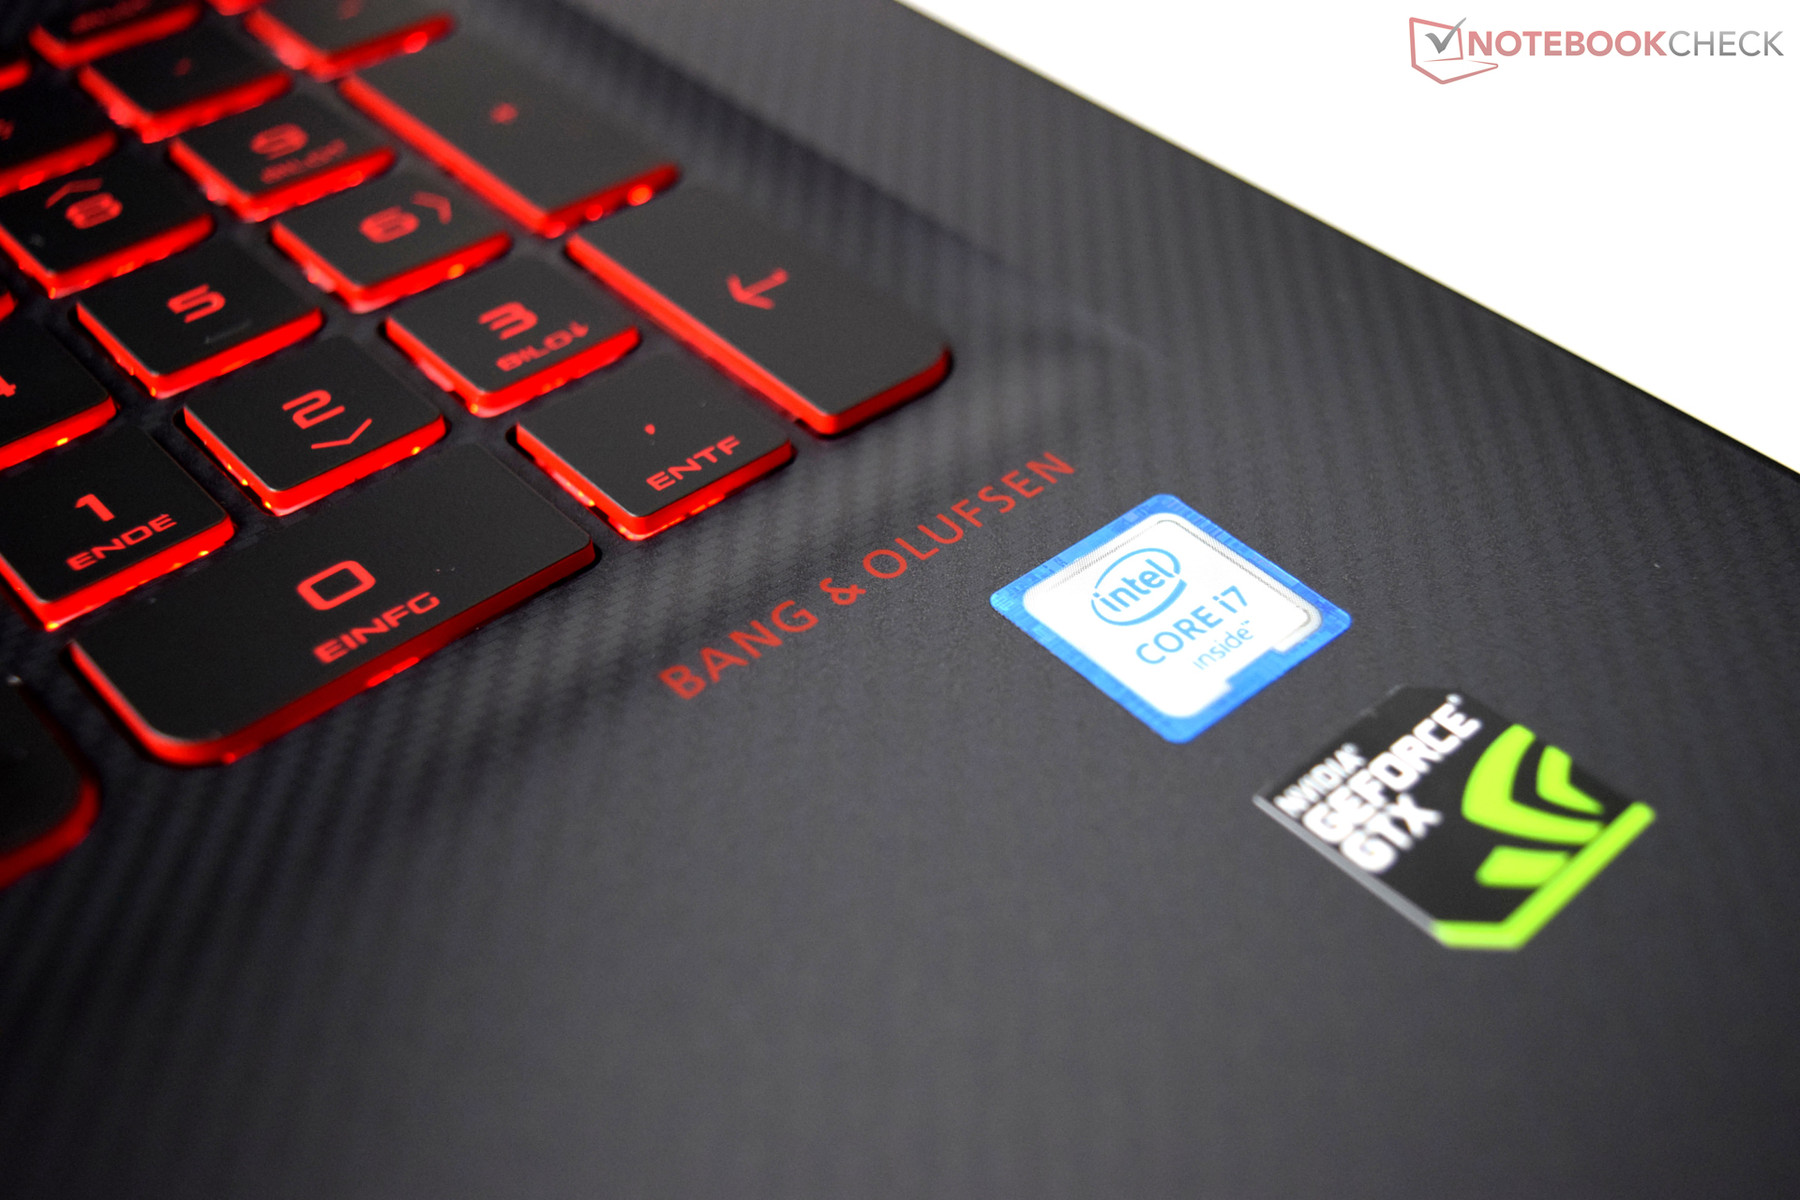
O pacote geral é bastante convincente, apesar das desvantagens mencionadas. O desempenho é muito bom, e o aparelho foi feito para gamers, o qual é demonstrado pelos resultados de nossos testes. O veloz Core i7-6700HQ da Intel fornece suficiente desempenho para todos os aplicativos, e inclusive jogos exigentes podem ser jogados em FHD (algumas vezes em 4K) graças à Nvidia GeForce GTX 1070. O preço também é atraente, em 1800 Euros (~$ 2007). Aparelhos similares da concorrência normalmente têm um preço entre 2000-2500 Euros (~$2230-$2787), portanto, a série Omen da HP definitivamente deveria estar em sua lista de desejos.
HP Omen 17-w110ng
- 10/26/2016 v5.1 (old)
Sebastian Bade
Price comparison
