Breve Análise do Portátil Lenovo ThinkBook 13s: Um portátil empresarial, mas sem TrackPoint

| |||||||||||||||||||||||||
iluminação: 92 %
iluminação com acumulador: 317 cd/m²
Contraste: 1139:1 (Preto: 0.28 cd/m²)
ΔE ColorChecker Calman: 2.4 | ∀{0.5-29.43 Ø4.73}
calibrated: 0.6
ΔE Greyscale Calman: 3.8 | ∀{0.09-98 Ø4.97}
99.1% sRGB (Argyll 1.6.3 3D)
63.5% AdobeRGB 1998 (Argyll 1.6.3 3D)
69.2% AdobeRGB 1998 (Argyll 3D)
99.1% sRGB (Argyll 3D)
67% Display P3 (Argyll 3D)
Gamma: 2.16
CCT: 7335 K
| Lenovo ThinkBook 13s-20R90071GE N133HCE-EN2, , 1920x1080, 13.3" | Lenovo ThinkPad L390-20NR0013GE LP133WF2-SPL8, , 1920x1080, 13.3" | Lenovo ThinkPad X390-20Q1S02M00 LP133WF7-SPB1, , 1920x1080, 13.3" | HP ProBook 430 G6-5TJ89EA CMN1375, , 1920x1080, 13.3" | Lenovo Yoga S730-13IWL B133HAN05.1, , 1920x1080, 13.3" | |
|---|---|---|---|---|---|
| Display | -40% | -3% | -37% | -1% | |
| Display P3 Coverage (%) | 67 | 40.42 -40% | 65.3 -3% | 41.87 -38% | 66.3 -1% |
| sRGB Coverage (%) | 99.1 | 60.4 -39% | 95.9 -3% | 62.6 -37% | 98.2 -1% |
| AdobeRGB 1998 Coverage (%) | 69.2 | 41.8 -40% | 66.6 -4% | 43.3 -37% | 67.8 -2% |
| Response Times | -5% | -31% | -4% | -20% | |
| Response Time Grey 50% / Grey 80% * (ms) | 40.4 ? | 42.8 ? -6% | 57.6 ? -43% | 40.8 ? -1% | 53 ? -31% |
| Response Time Black / White * (ms) | 28.8 ? | 30 ? -4% | 34 ? -18% | 30.4 ? -6% | 31 ? -8% |
| PWM Frequency (Hz) | 25000 ? | 30490 ? | 26040 ? | ||
| Screen | -124% | 0% | -89% | 4% | |
| Brightness middle (cd/m²) | 319 | 298 -7% | 356 12% | 255 -20% | 343 8% |
| Brightness (cd/m²) | 309 | 278 -10% | 336 9% | 238 -23% | 323 5% |
| Brightness Distribution (%) | 92 | 81 -12% | 88 -4% | 88 -4% | 85 -8% |
| Black Level * (cd/m²) | 0.28 | 0.33 -18% | 0.16 43% | 0.18 36% | 0.33 -18% |
| Contrast (:1) | 1139 | 903 -21% | 2225 95% | 1417 24% | 1039 -9% |
| Colorchecker dE 2000 * | 2.4 | 6.5 -171% | 3.6 -50% | 5.4 -125% | 2.38 1% |
| Colorchecker dE 2000 max. * | 6.3 | 23.9 -279% | 5.5 13% | 19.5 -210% | 3.55 44% |
| Colorchecker dE 2000 calibrated * | 0.6 | 4.9 -717% | 1.1 -83% | 4.1 -583% | |
| Greyscale dE 2000 * | 3.8 | 5.6 -47% | 4.7 -24% | 3.8 -0% | 3.01 21% |
| Gamma | 2.16 102% | 2.08 106% | 2.48 89% | 2.41 91% | 2.44 90% |
| CCT | 7335 89% | 6669 97% | 6374 102% | 7100 92% | 7198 90% |
| Color Space (Percent of AdobeRGB 1998) (%) | 63.5 | 38.4 -40% | 61.3 -3% | 39.4 -38% | 62 -2% |
| Color Space (Percent of sRGB) (%) | 99.1 | 60.1 -39% | 95.7 -3% | 62.5 -37% | 98 -1% |
| Média Total (Programa/Configurações) | -56% /
-93% | -11% /
-4% | -43% /
-69% | -6% /
-0% |
* ... menor é melhor
Exibir tempos de resposta
| ↔ Tempo de resposta preto para branco | ||
|---|---|---|
| 28.8 ms ... ascensão ↗ e queda ↘ combinadas | ↗ 15.6 ms ascensão | 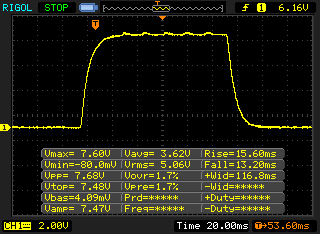 |
| ↘ 13.2 ms queda | ||
| A tela mostra taxas de resposta relativamente lentas em nossos testes e pode ser muito lenta para os jogadores. Em comparação, todos os dispositivos testados variam de 0.1 (mínimo) a 240 (máximo) ms. » 76 % de todos os dispositivos são melhores. Isso significa que o tempo de resposta medido é pior que a média de todos os dispositivos testados (19.9 ms). | ||
| ↔ Tempo de resposta 50% cinza a 80% cinza | ||
| 40.4 ms ... ascensão ↗ e queda ↘ combinadas | ↗ 22 ms ascensão | 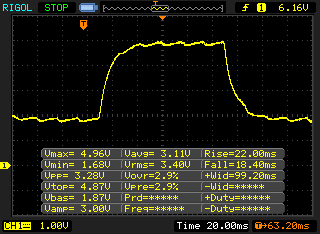 |
| ↘ 18.4 ms queda | ||
| A tela mostra taxas de resposta lentas em nossos testes e será insatisfatória para os jogadores. Em comparação, todos os dispositivos testados variam de 0.165 (mínimo) a 636 (máximo) ms. » 63 % de todos os dispositivos são melhores. Isso significa que o tempo de resposta medido é pior que a média de todos os dispositivos testados (31.1 ms). | ||
Cintilação da tela / PWM (modulação por largura de pulso)
| Tela tremeluzindo/PWM detectado | 25000 Hz | ≤ 20 % configuração de brilho | 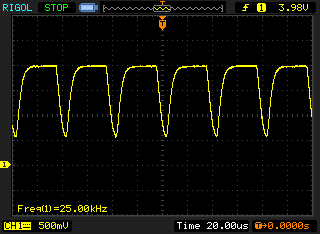 |
A luz de fundo da tela pisca em 25000 Hz (pior caso, por exemplo, utilizando PWM) Cintilação detectada em uma configuração de brilho de 20 % e abaixo. Não deve haver cintilação ou PWM acima desta configuração de brilho. A frequência de 25000 Hz é bastante alta, então a maioria dos usuários sensíveis ao PWM não deve notar nenhuma oscilação. [pwm_comparison] Em comparação: 52 % de todos os dispositivos testados não usam PWM para escurecer a tela. Se PWM foi detectado, uma média de 7798 (mínimo: 5 - máximo: 343500) Hz foi medida. | |||
| PCMark 8 Home Score Accelerated v2 | 3467 pontos | |
| PCMark 8 Work Score Accelerated v2 | 4841 pontos | |
| PCMark 10 Score | 3630 pontos | |
Ajuda | ||
| Lenovo ThinkBook 13s-20R90071GE SK hynix BC501 HFM512GDHTNG-8310A | Lenovo ThinkPad L390-20NR0013GE Samsung SSD PM981 MZVLB256HAHQ | Lenovo ThinkPad X390-20Q1S02M00 Intel SSD Pro 7600p SSDPEKKF512G8L | HP ProBook 430 G6-5TJ89EA WDC PC SN520 SDAPNUW-256G | Lenovo Yoga S730-13IWL Samsung SSD PM981 MZVLB1T0HALR | Média SK hynix BC501 HFM512GDHTNG-8310A | |
|---|---|---|---|---|---|---|
| CrystalDiskMark 5.2 / 6 | 52% | 68% | 20% | 62% | 9% | |
| Write 4K (MB/s) | 89.3 | 99.6 12% | 120.7 35% | 101.8 14% | 139.6 56% | 110 ? 23% |
| Read 4K (MB/s) | 37.4 | 37.22 0% | 58.5 56% | 41.35 11% | 36.97 -1% | 40.6 ? 9% |
| Write Seq (MB/s) | 608 | 1432 136% | 1491 145% | 929 53% | 1490 145% | 677 ? 11% |
| Read Seq (MB/s) | 1019 | 2072 103% | 2760 171% | 1388 36% | 1321 30% | 1104 ? 8% |
| Write 4K Q32T1 (MB/s) | 487.9 | 439.7 -10% | 237.5 -51% | 453.5 -7% | 302.4 -38% | 438 ? -10% |
| Read 4K Q32T1 (MB/s) | 284.8 | 264.8 -7% | 336.1 18% | 286.2 0% | 375.4 32% | 338 ? 19% |
| Write Seq Q32T1 (MB/s) | 872 | 1549 78% | 1512 73% | 1302 49% | 2391 174% | 860 ? -1% |
| Read Seq Q32T1 (MB/s) | 1635 | 3318 103% | 3154 93% | 1751 7% | 3272 100% | 1786 ? 9% |

| 3DMark 11 Performance | 1937 pontos | |
| 3DMark Cloud Gate Standard Score | 8233 pontos | |
| 3DMark Fire Strike Score | 1018 pontos | |
Ajuda | ||
| baixo | média | alto | ultra | |
|---|---|---|---|---|
| BioShock Infinite (2013) | 59.1 | 30.9 | 25.2 | 8 |
| The Witcher 3 (2015) | 15.9 | |||
| Dota 2 Reborn (2015) | 72 | 42.9 | 19.2 | 16.9 |
| Rise of the Tomb Raider (2016) | 23.1 | |||
| X-Plane 11.11 (2018) | 25.4 | 17.6 |
Barulho
| Ocioso |
| 28.8 / 28.8 / 29.7 dB |
| Carga |
| 30.7 / 38.3 dB |
 | ||
30 dB silencioso 40 dB(A) audível 50 dB(A) ruidosamente alto |
||
min: | ||
(±) A temperatura máxima no lado superior é 40.3 °C / 105 F, em comparação com a média de 35.9 °C / 97 F , variando de 21.4 a 59 °C para a classe Subnotebook.
(±) A parte inferior aquece até um máximo de 44.6 °C / 112 F, em comparação com a média de 39.2 °C / 103 F
(+) Em uso inativo, a temperatura média para o lado superior é 23.4 °C / 74 F, em comparação com a média do dispositivo de 30.8 °C / ### class_avg_f### F.
(+) Os apoios para as mãos e o touchpad são mais frios que a temperatura da pele, com um máximo de 30.2 °C / 86.4 F e, portanto, são frios ao toque.
(±) A temperatura média da área do apoio para as mãos de dispositivos semelhantes foi 28.2 °C / 82.8 F (-2 °C / -3.6 F).
Lenovo ThinkBook 13s-20R90071GE análise de áudio
(-) | alto-falantes não muito altos (###valor### dB)
Graves 100 - 315Hz
(-) | quase nenhum baixo - em média 15.9% menor que a mediana
(±) | a linearidade dos graves é média (14.8% delta para a frequência anterior)
Médios 400 - 2.000 Hz
(+) | médios equilibrados - apenas 4.5% longe da mediana
(±) | a linearidade dos médios é média (7.1% delta para frequência anterior)
Altos 2 - 16 kHz
(+) | agudos equilibrados - apenas 2.7% longe da mediana
(±) | a linearidade dos máximos é média (11.2% delta para frequência anterior)
Geral 100 - 16.000 Hz
(±) | a linearidade do som geral é média (21.3% diferença em relação à mediana)
Comparado com a mesma classe
» 72% de todos os dispositivos testados nesta classe foram melhores, 5% semelhantes, 23% piores
» O melhor teve um delta de 5%, a média foi 18%, o pior foi 53%
Comparado com todos os dispositivos testados
» 59% de todos os dispositivos testados foram melhores, 7% semelhantes, 33% piores
» O melhor teve um delta de 4%, a média foi 24%, o pior foi 134%
Lenovo ThinkPad X390-20Q1S02M00 análise de áudio
(±) | o volume do alto-falante é médio, mas bom (###valor### dB)
Graves 100 - 315Hz
(-) | quase nenhum baixo - em média 20.8% menor que a mediana
(±) | a linearidade dos graves é média (13.6% delta para a frequência anterior)
Médios 400 - 2.000 Hz
(+) | médios equilibrados - apenas 2.3% longe da mediana
(+) | médios são lineares (5.5% delta para frequência anterior)
Altos 2 - 16 kHz
(+) | agudos equilibrados - apenas 2.4% longe da mediana
(+) | os máximos são lineares (6.1% delta da frequência anterior)
Geral 100 - 16.000 Hz
(±) | a linearidade do som geral é média (20.5% diferença em relação à mediana)
Comparado com a mesma classe
» 66% de todos os dispositivos testados nesta classe foram melhores, 7% semelhantes, 27% piores
» O melhor teve um delta de 5%, a média foi 18%, o pior foi 53%
Comparado com todos os dispositivos testados
» 54% de todos os dispositivos testados foram melhores, 8% semelhantes, 38% piores
» O melhor teve um delta de 4%, a média foi 24%, o pior foi 134%
| desligado | |
| Ocioso | |
| Carga |
|
Key:
min: | |
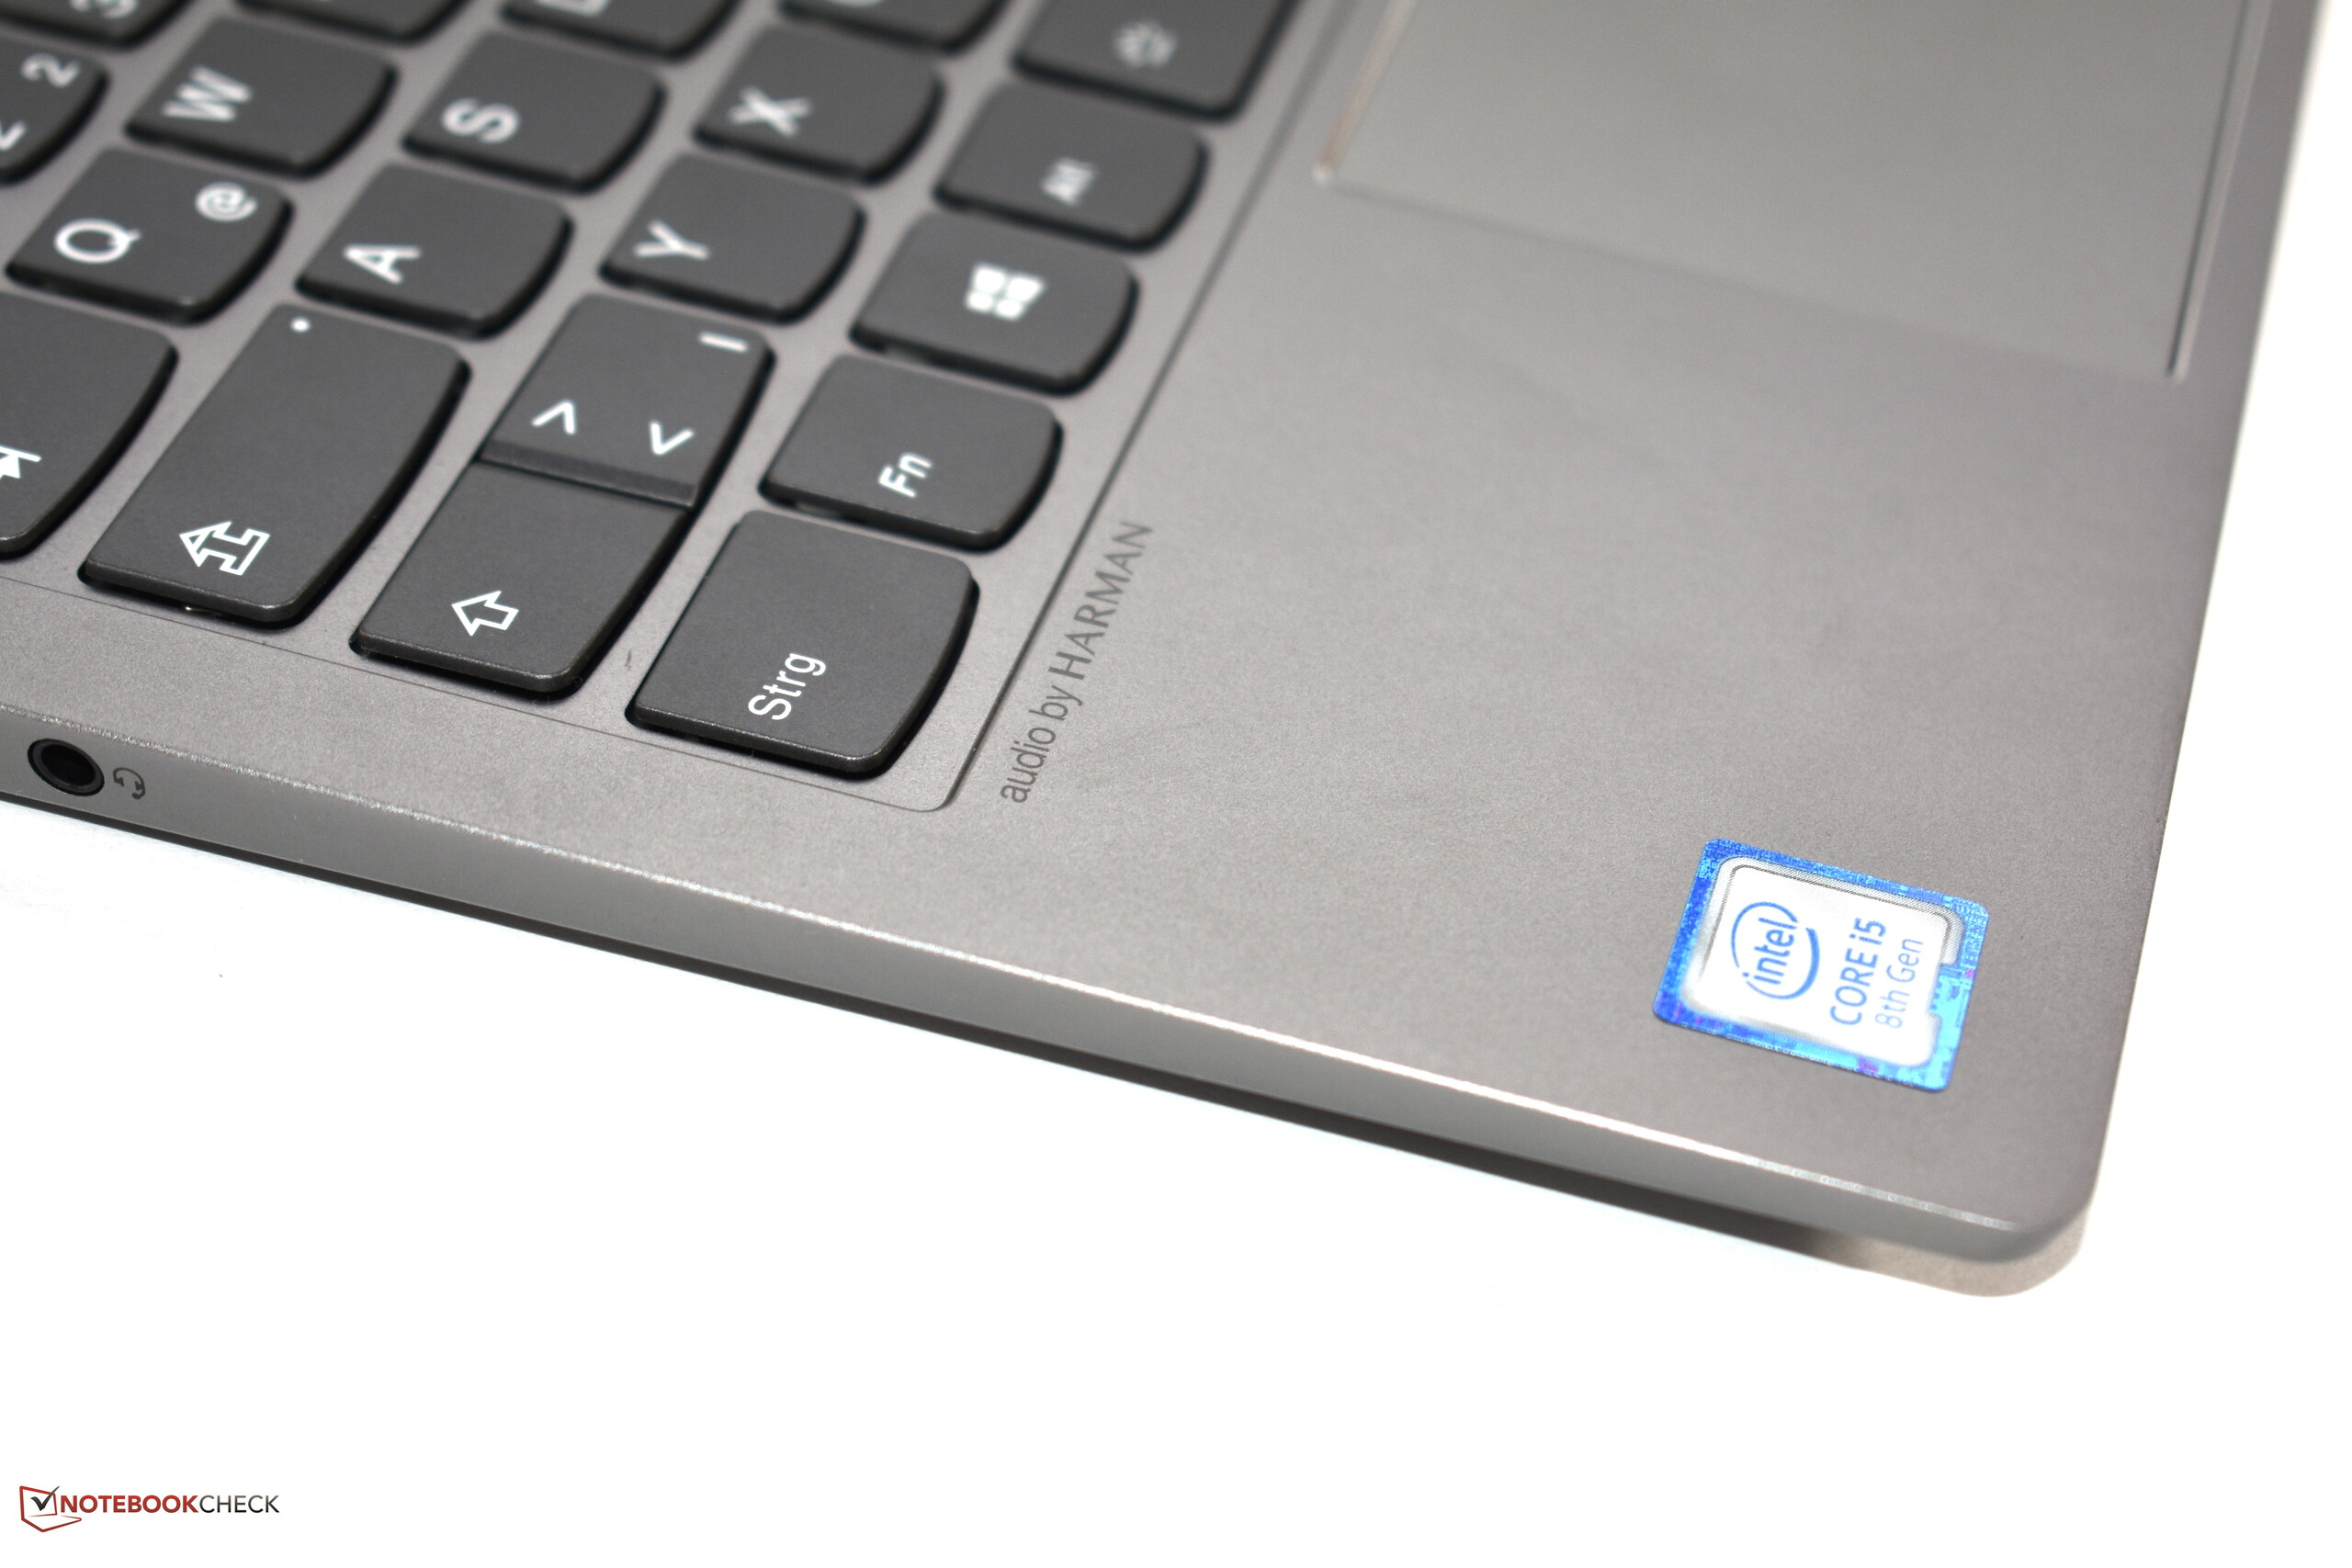
| Lenovo ThinkBook 13s-20R90071GE i5-8265U, UHD Graphics 620, SK hynix BC501 HFM512GDHTNG-8310A, a-Si IPS LED, 1920x1080, 13.3" | Lenovo ThinkPad L390-20NR0013GE i5-8265U, UHD Graphics 620, Samsung SSD PM981 MZVLB256HAHQ, IPS LED, 1920x1080, 13.3" | Lenovo ThinkPad X390-20Q1S02M00 i5-8265U, UHD Graphics 620, Intel SSD Pro 7600p SSDPEKKF512G8L, IPS LED, 1920x1080, 13.3" | HP ProBook 430 G6-5TJ89EA i5-8265U, UHD Graphics 620, WDC PC SN520 SDAPNUW-256G, IPS LED, 1920x1080, 13.3" | Lenovo Yoga S730-13IWL i7-8565U, UHD Graphics 620, Samsung SSD PM981 MZVLB1T0HALR, IPS LED, 1920x1080, 13.3" | Média Intel UHD Graphics 620 | Média da turma Subnotebook | |
|---|---|---|---|---|---|---|---|
| Power Consumption | -18% | -20% | -7% | -16% | -15% | -22% | |
| Idle Minimum * (Watt) | 3.1 | 3.8 -23% | 3.4 -10% | 3.5 -13% | 3 3% | 3.81 ? -23% | 3.79 ? -22% |
| Idle Average * (Watt) | 5.87 | 6.8 -16% | 5.6 5% | 5.76 2% | 5.6 5% | 6.94 ? -18% | 6.57 ? -12% |
| Idle Maximum * (Watt) | 6.6 | 9.8 -48% | 8.7 -32% | 8.3 -26% | 11 -67% | 8.75 ? -33% | 7.94 ? -20% |
| Load Average * (Watt) | 35.3 | 32.4 8% | 43.6 -24% | 34.8 1% | 38 -8% | 35 ? 1% | 41.8 ? -18% |
| Load Maximum * (Watt) | 46.5 | 52 -12% | 65 -40% | 45.7 2% | 53 -14% | 47.5 ? -2% | 64.1 ? -38% |
* ... menor é melhor
| Lenovo ThinkBook 13s-20R90071GE i5-8265U, UHD Graphics 620, 45 Wh | Lenovo ThinkPad L390-20NR0013GE i5-8265U, UHD Graphics 620, 45 Wh | Lenovo ThinkPad X390-20Q1S02M00 i5-8265U, UHD Graphics 620, 48 Wh | HP ProBook 430 G6-5TJ89EA i5-8265U, UHD Graphics 620, 45 Wh | Lenovo Yoga S730-13IWL i7-8565U, UHD Graphics 620, 42 Wh | Média da turma Subnotebook | |
|---|---|---|---|---|---|---|
| Duração da bateria | -12% | 8% | 20% | -7% | 46% | |
| H.264 (h) | 10.8 | 9.4 -13% | 12.7 18% | 9.1 -16% | 8.9 -18% | 15.6 ? 44% |
| WiFi v1.3 (h) | 9.1 | 7 -23% | 8.3 -9% | 9.5 4% | 6.9 -24% | 14 ? 54% |
| Load (h) | 1.4 | 1.4 0% | 1.6 14% | 2.4 71% | 1.7 21% | 1.946 ? 39% |
| Reader / Idle (h) | 16.2 | 16.2 | 15.9 | 28.6 ? |
Pro
Contra
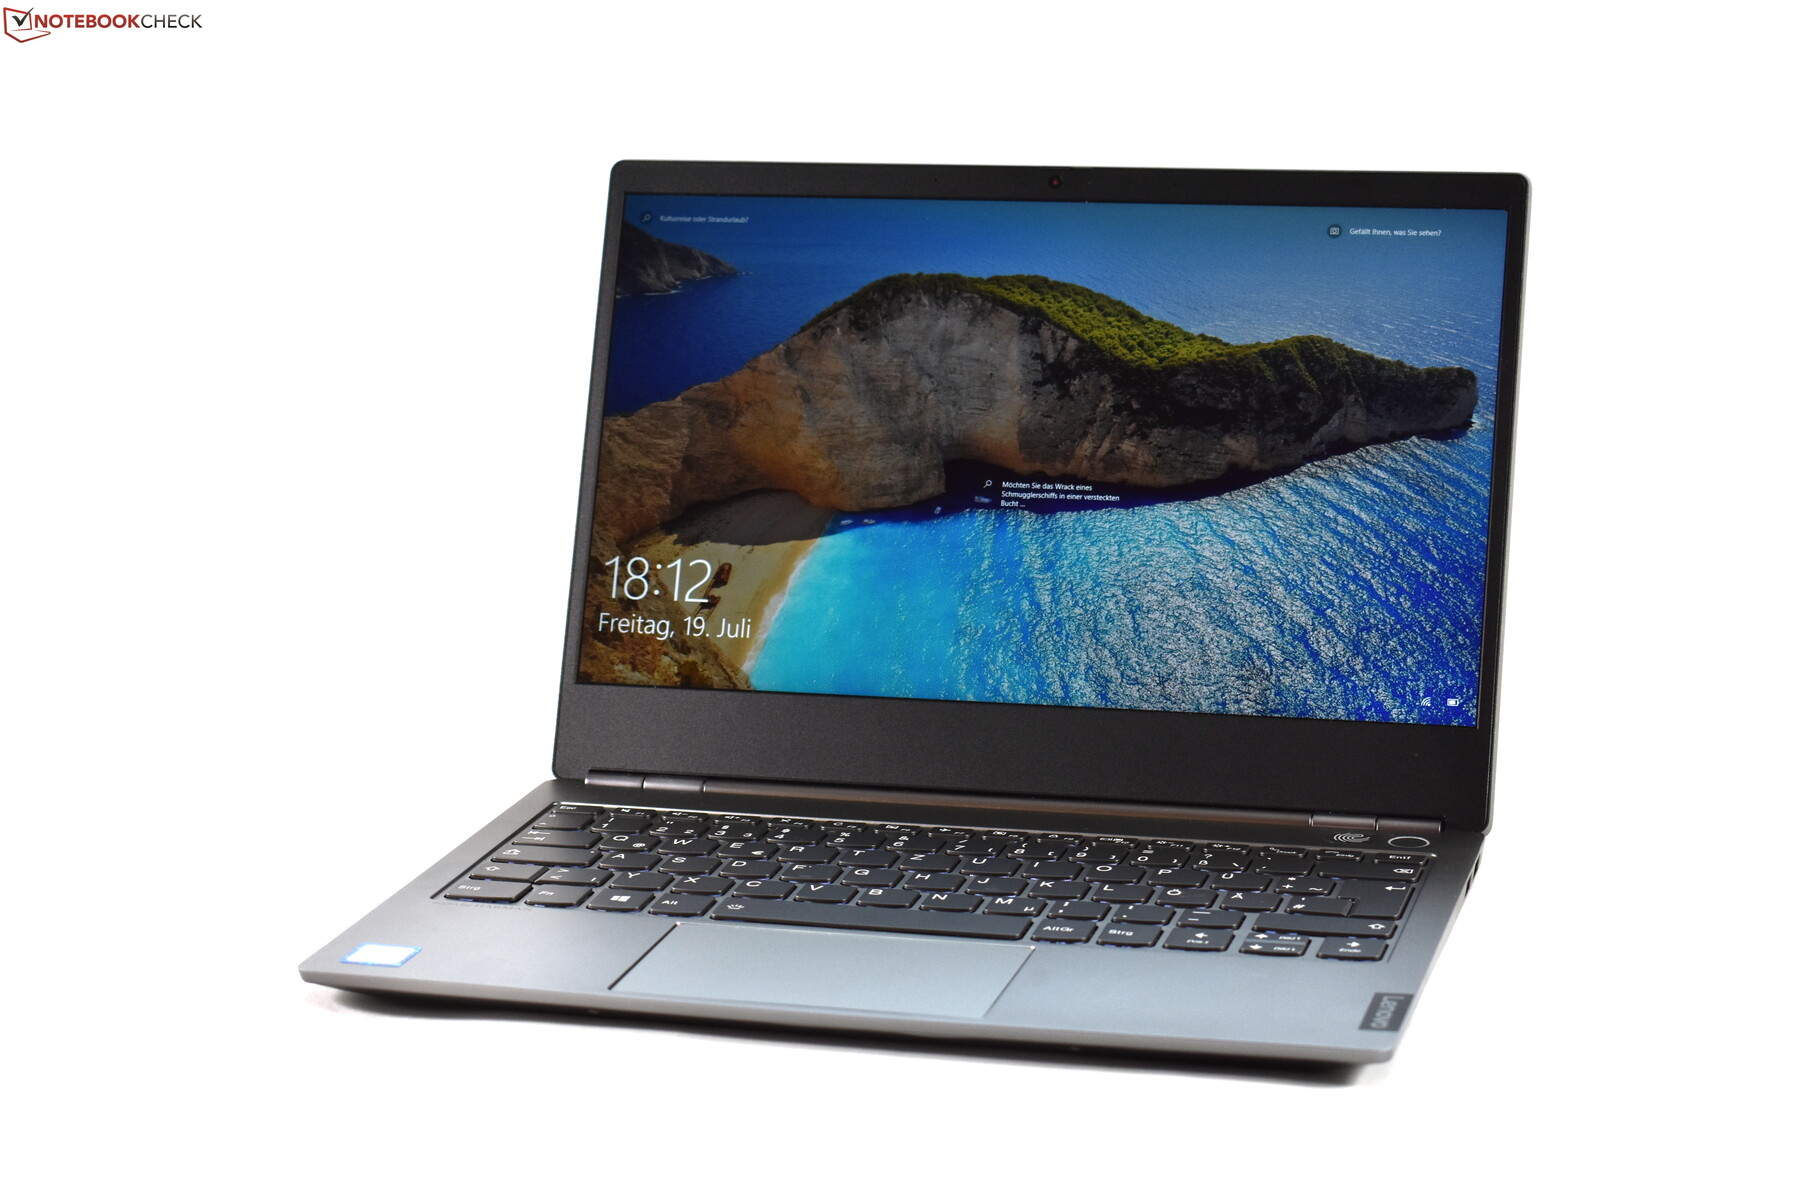
A série ThinkBook não substituirá a linha estabelecida do ThinkPad, isto ficou claro depois de testar o ThinkBook 13s. Em vez disso, a série ThinkBook é uma adição à oferta de portáteis da Lenovo, que deve agradar àqueles que não são dos ThinkPads. Especificamente, os ThinkBook 13s podem ser de maior interesse para aqueles que gostam do design do MacBook Pro do que de um ThinkPad convencional.
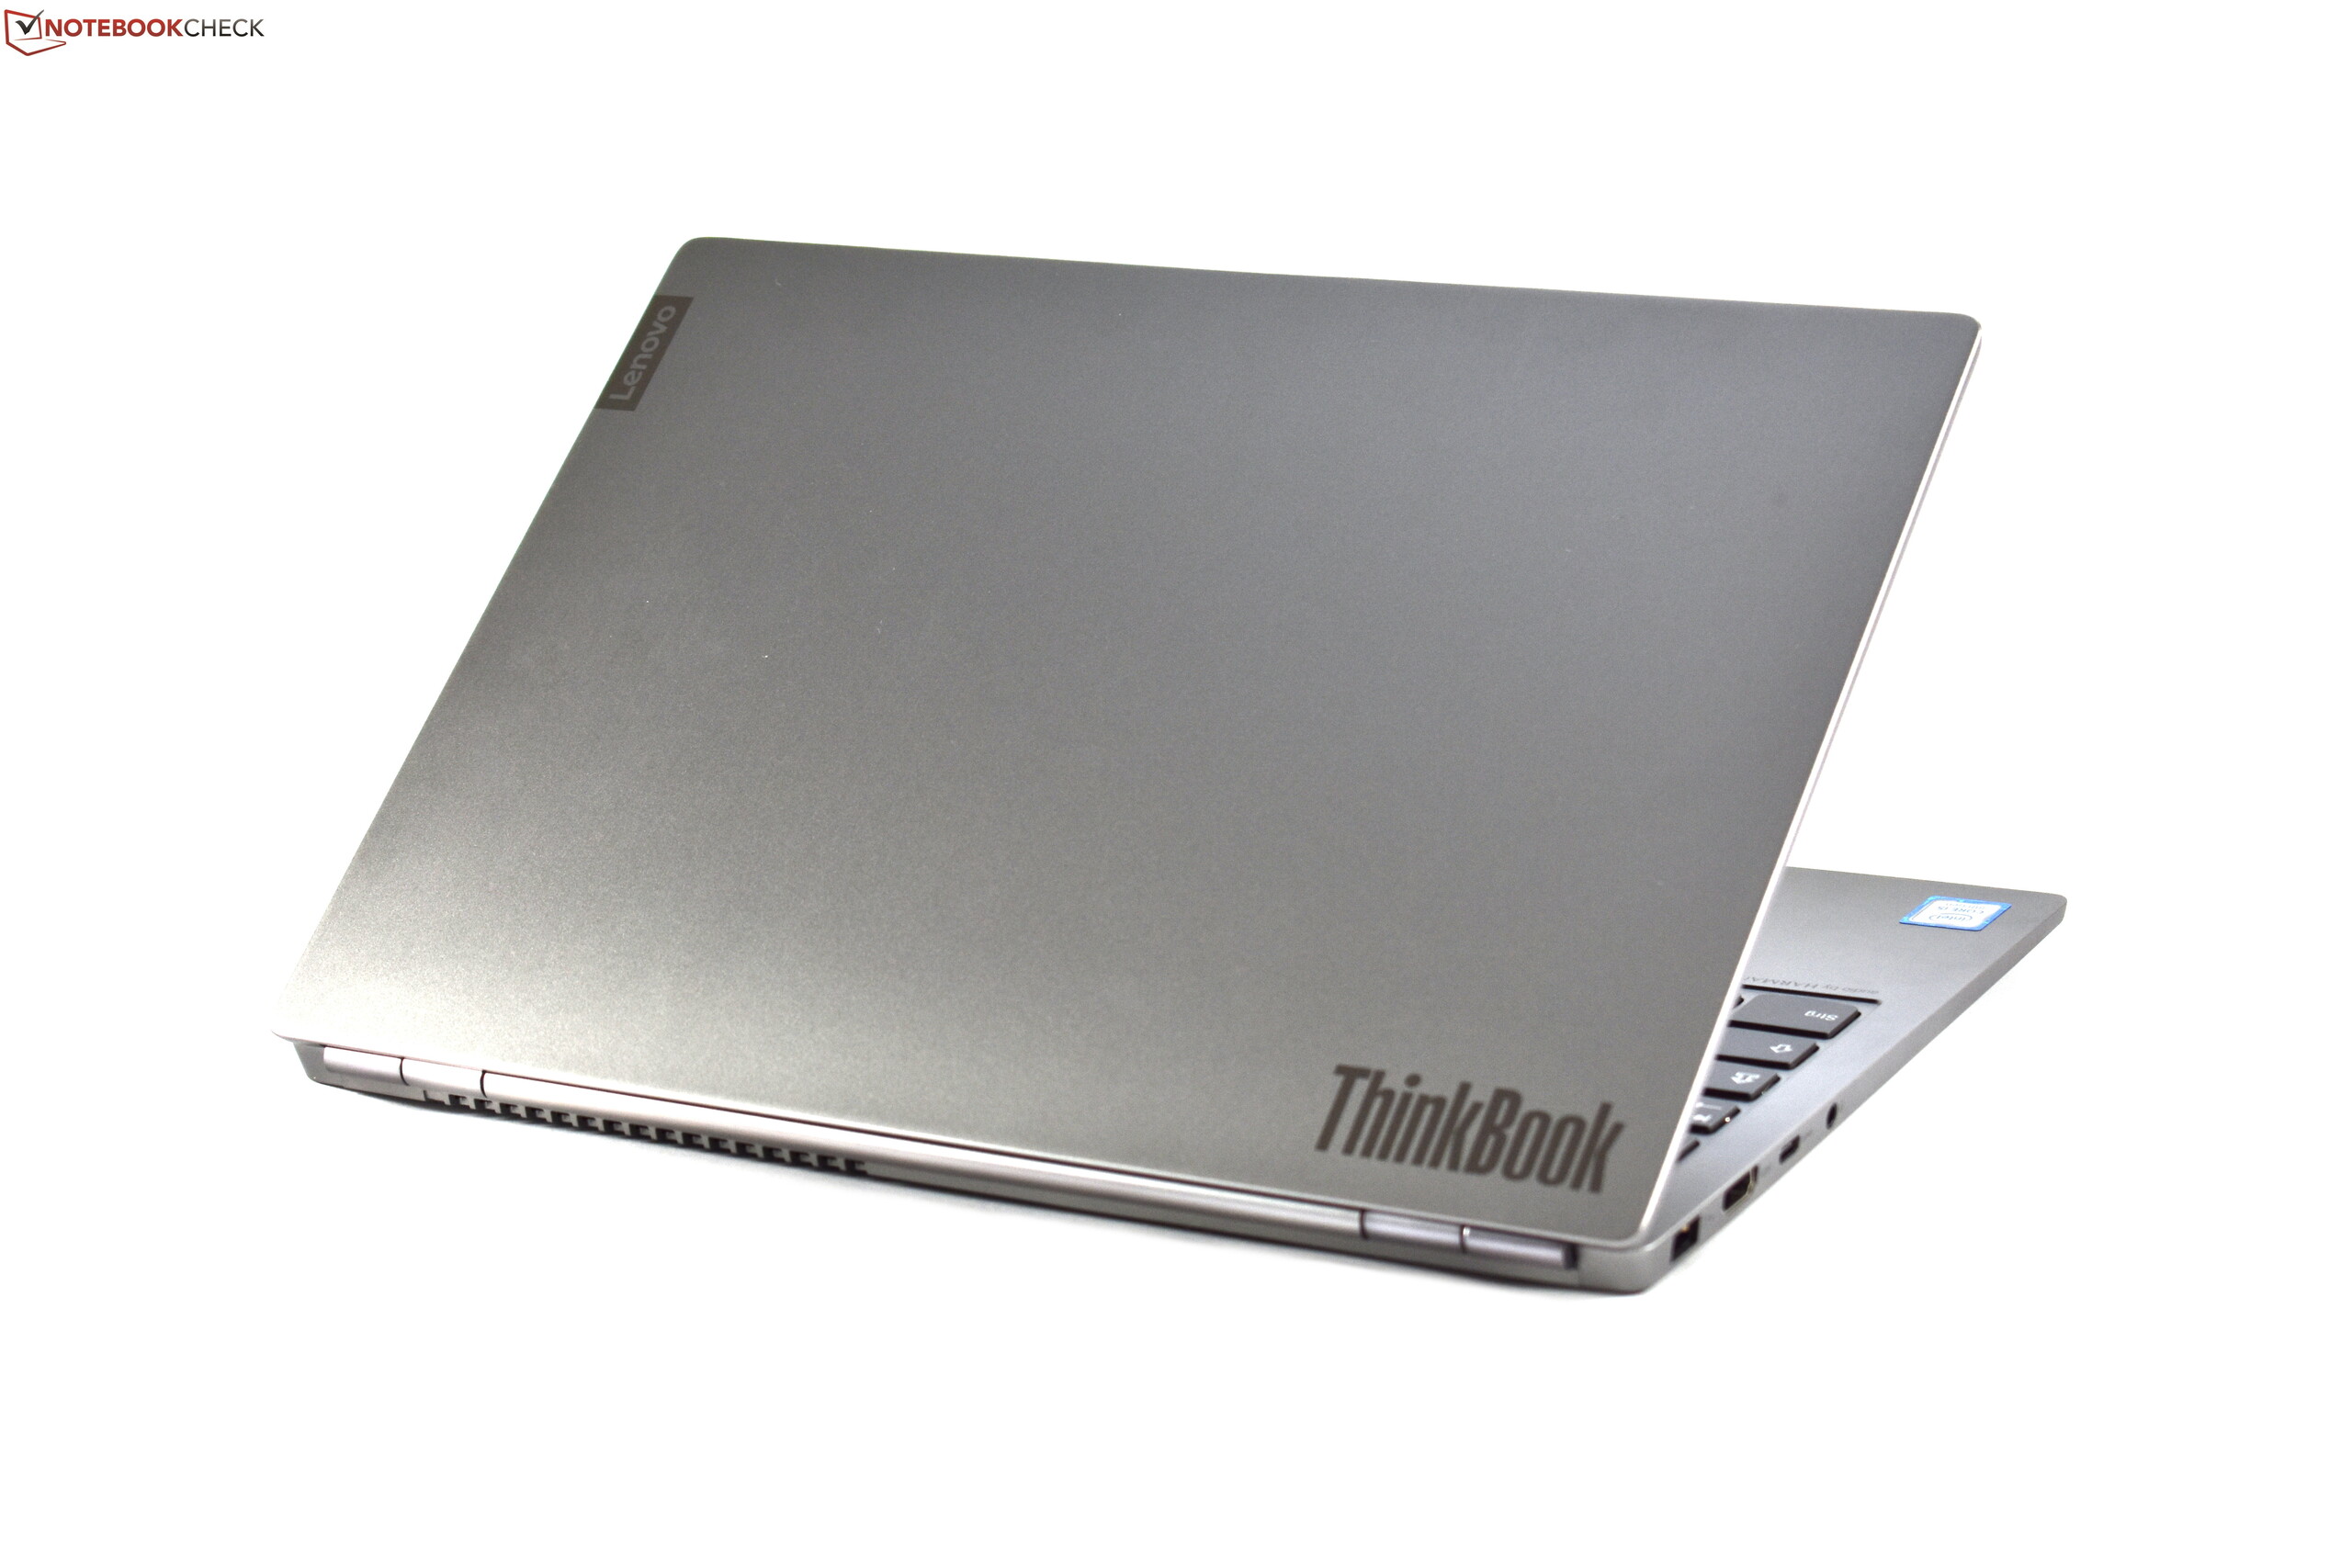
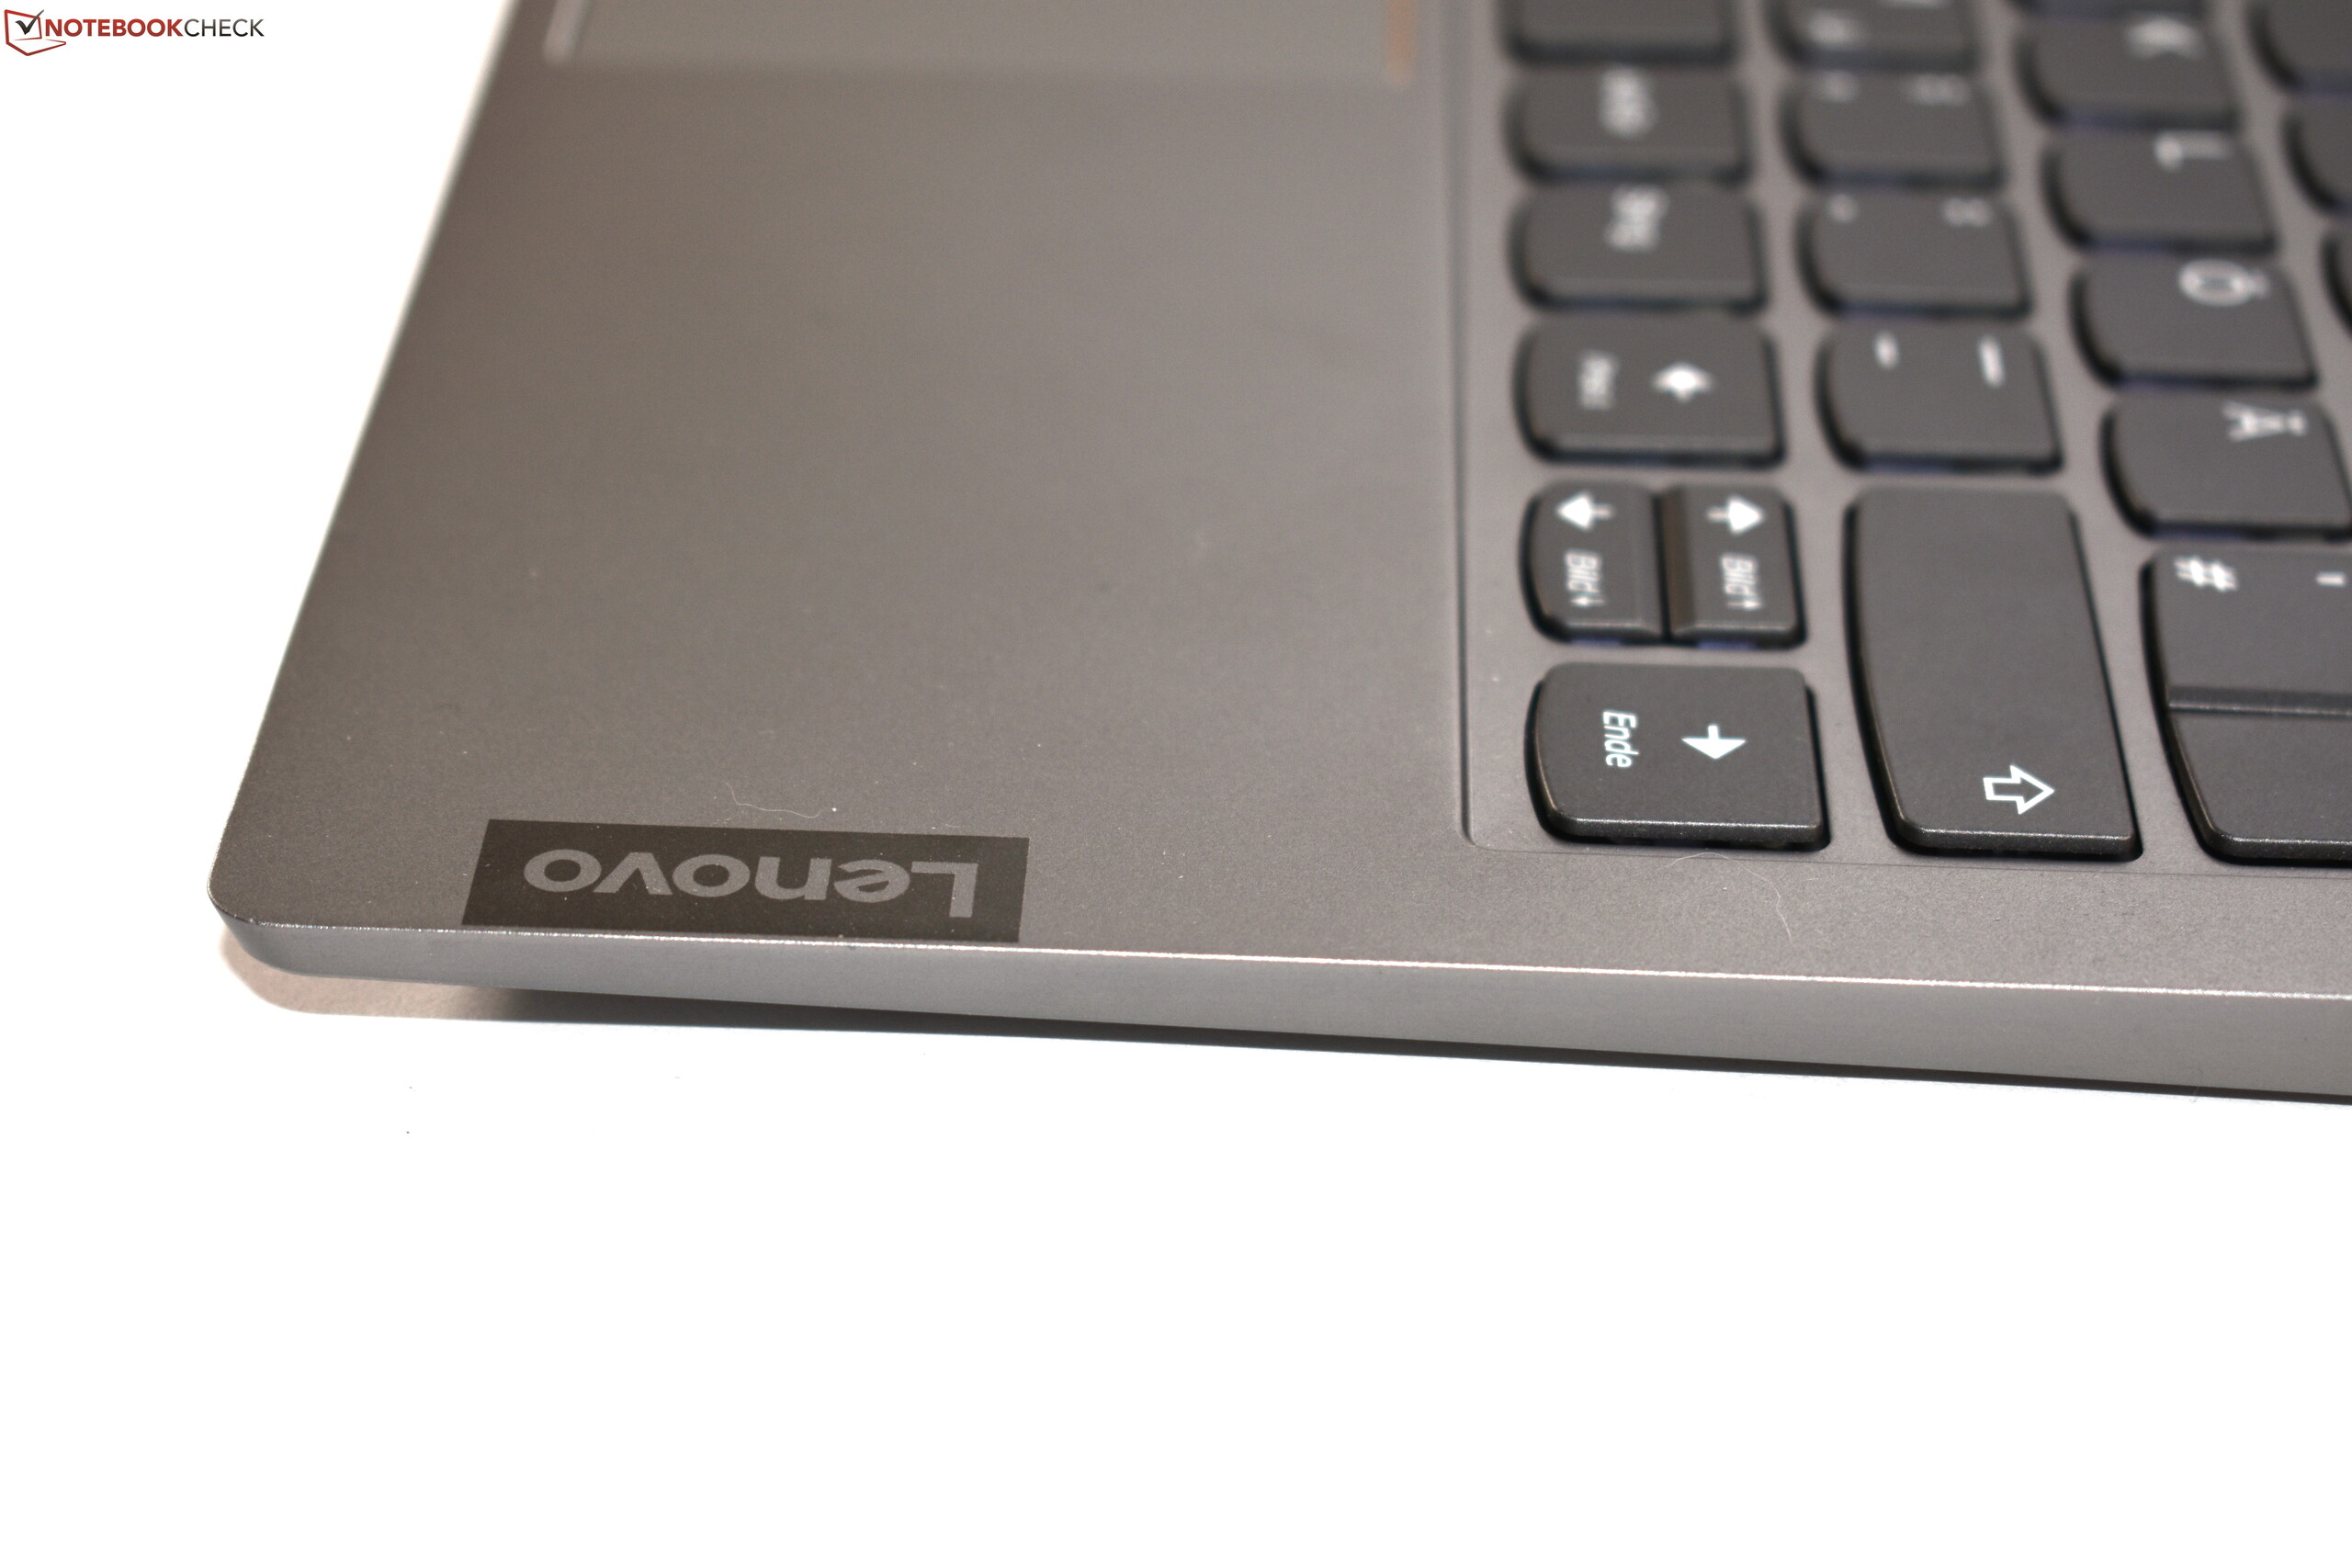
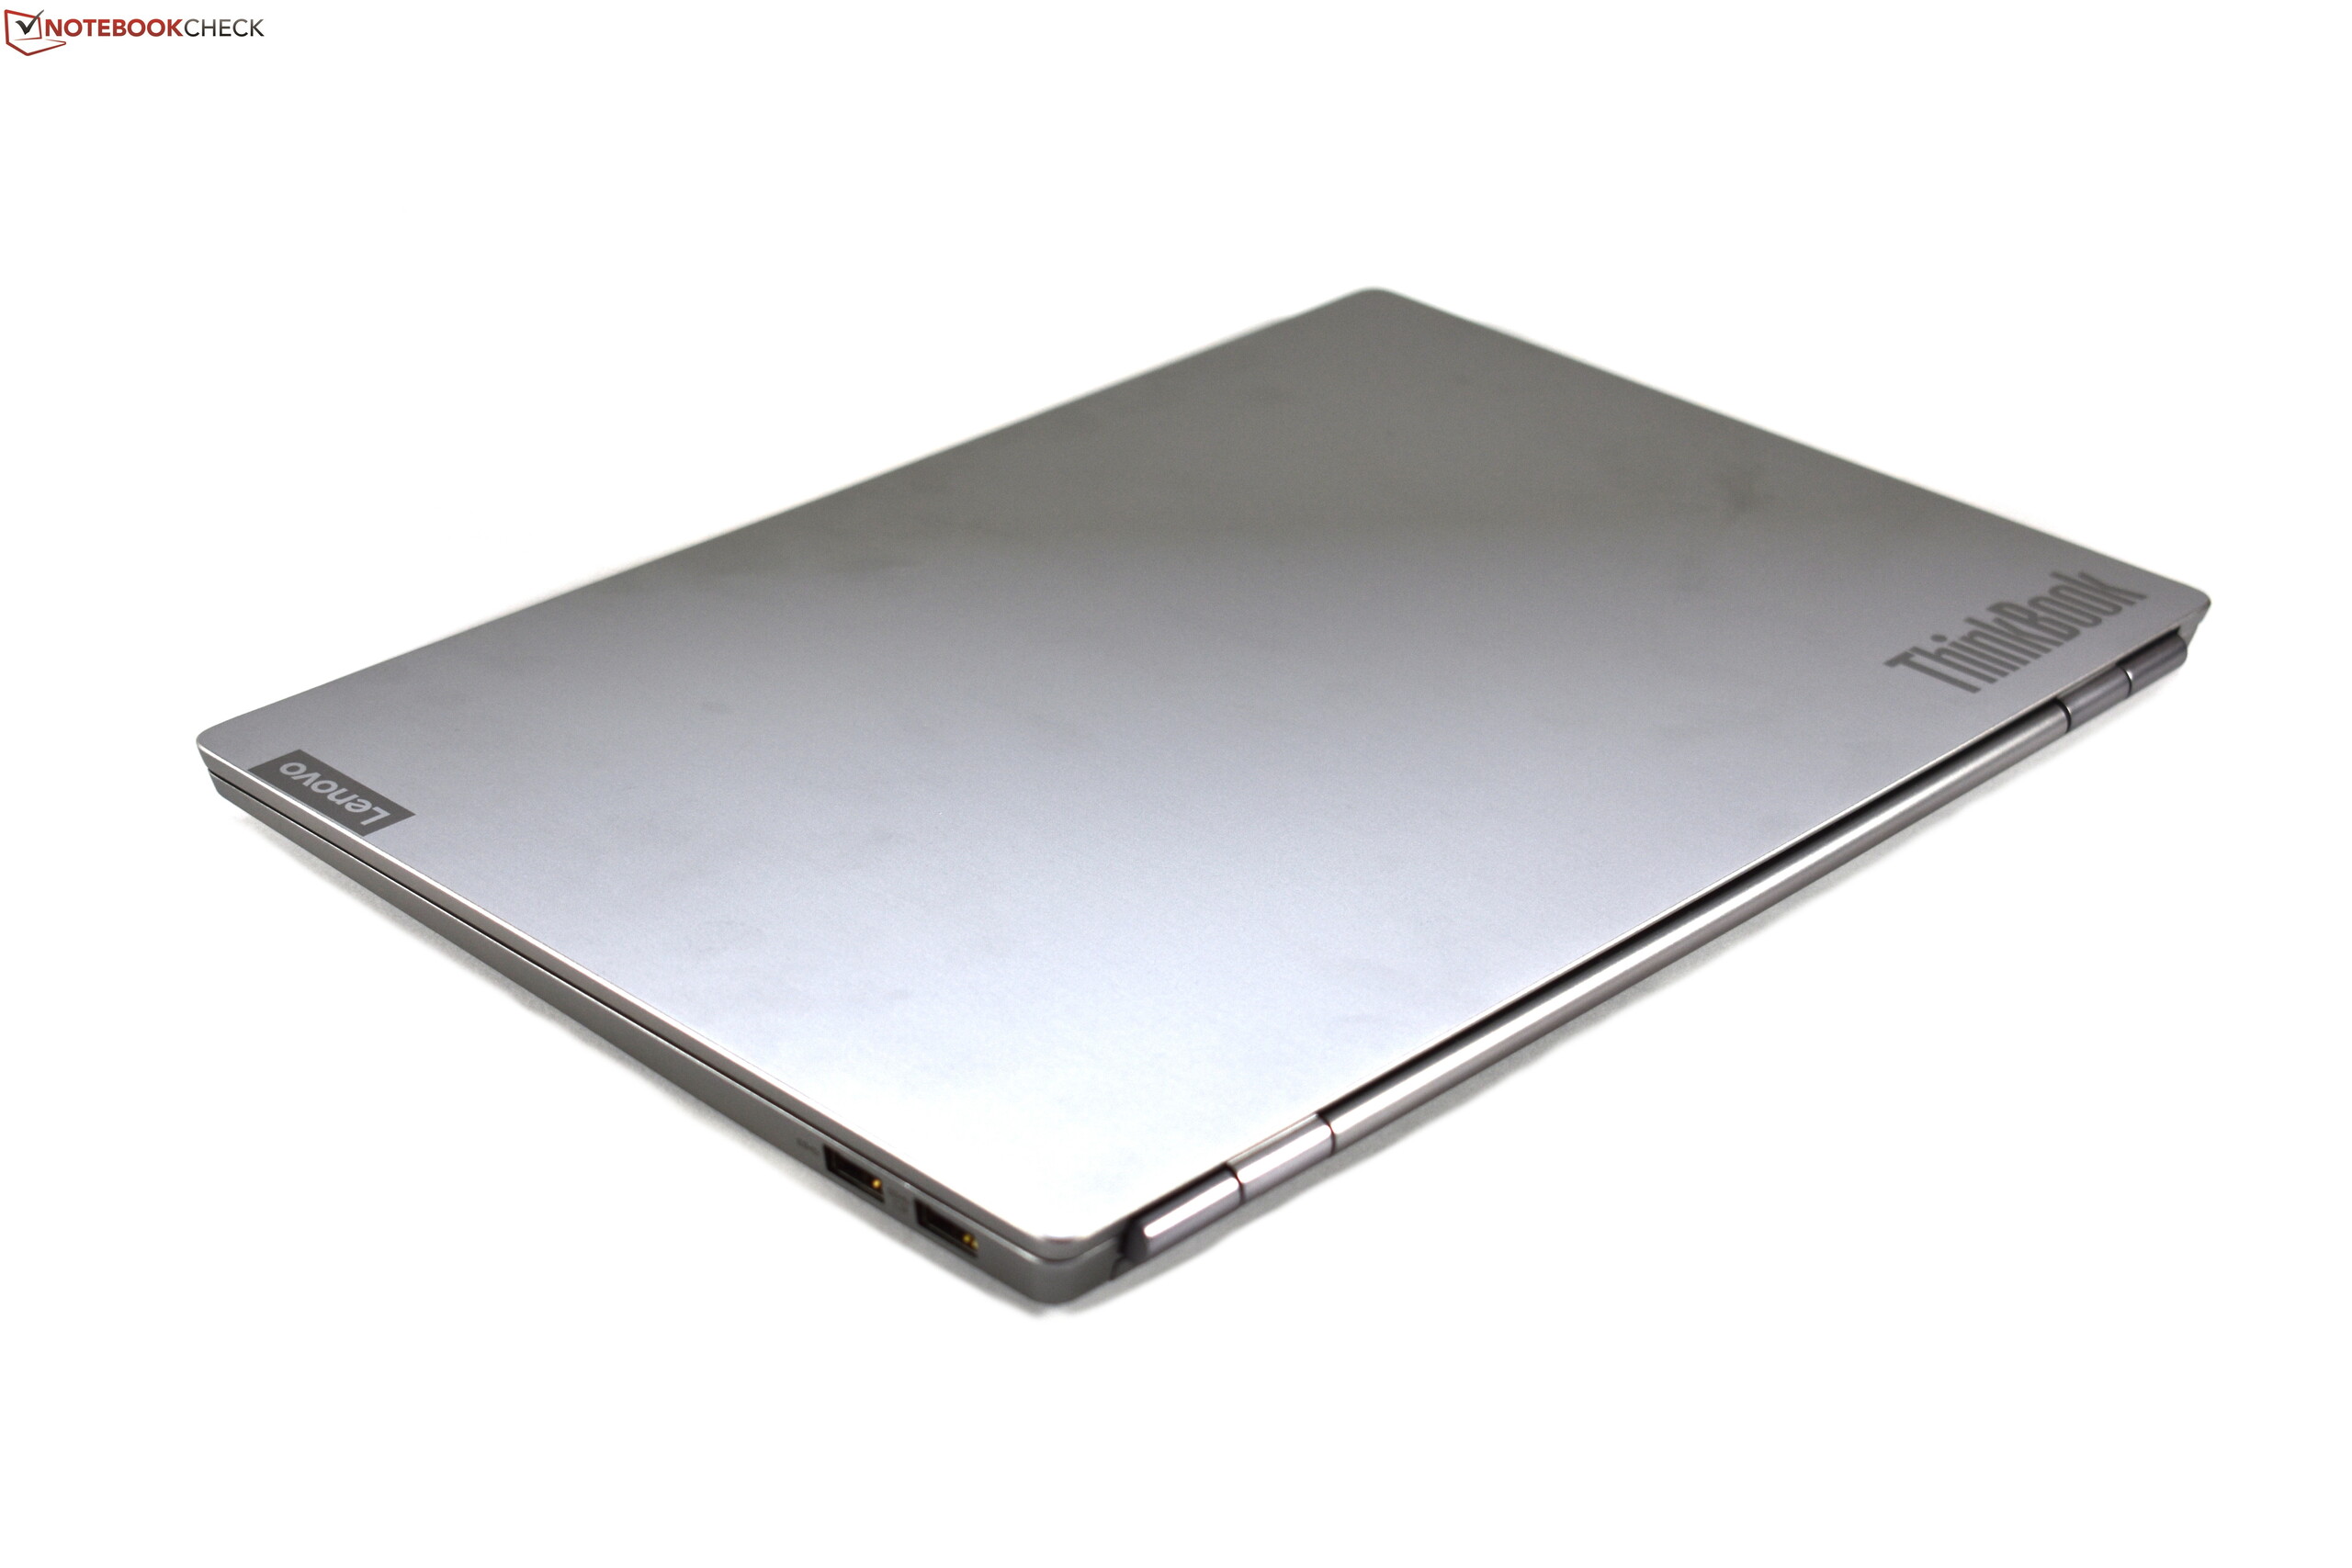
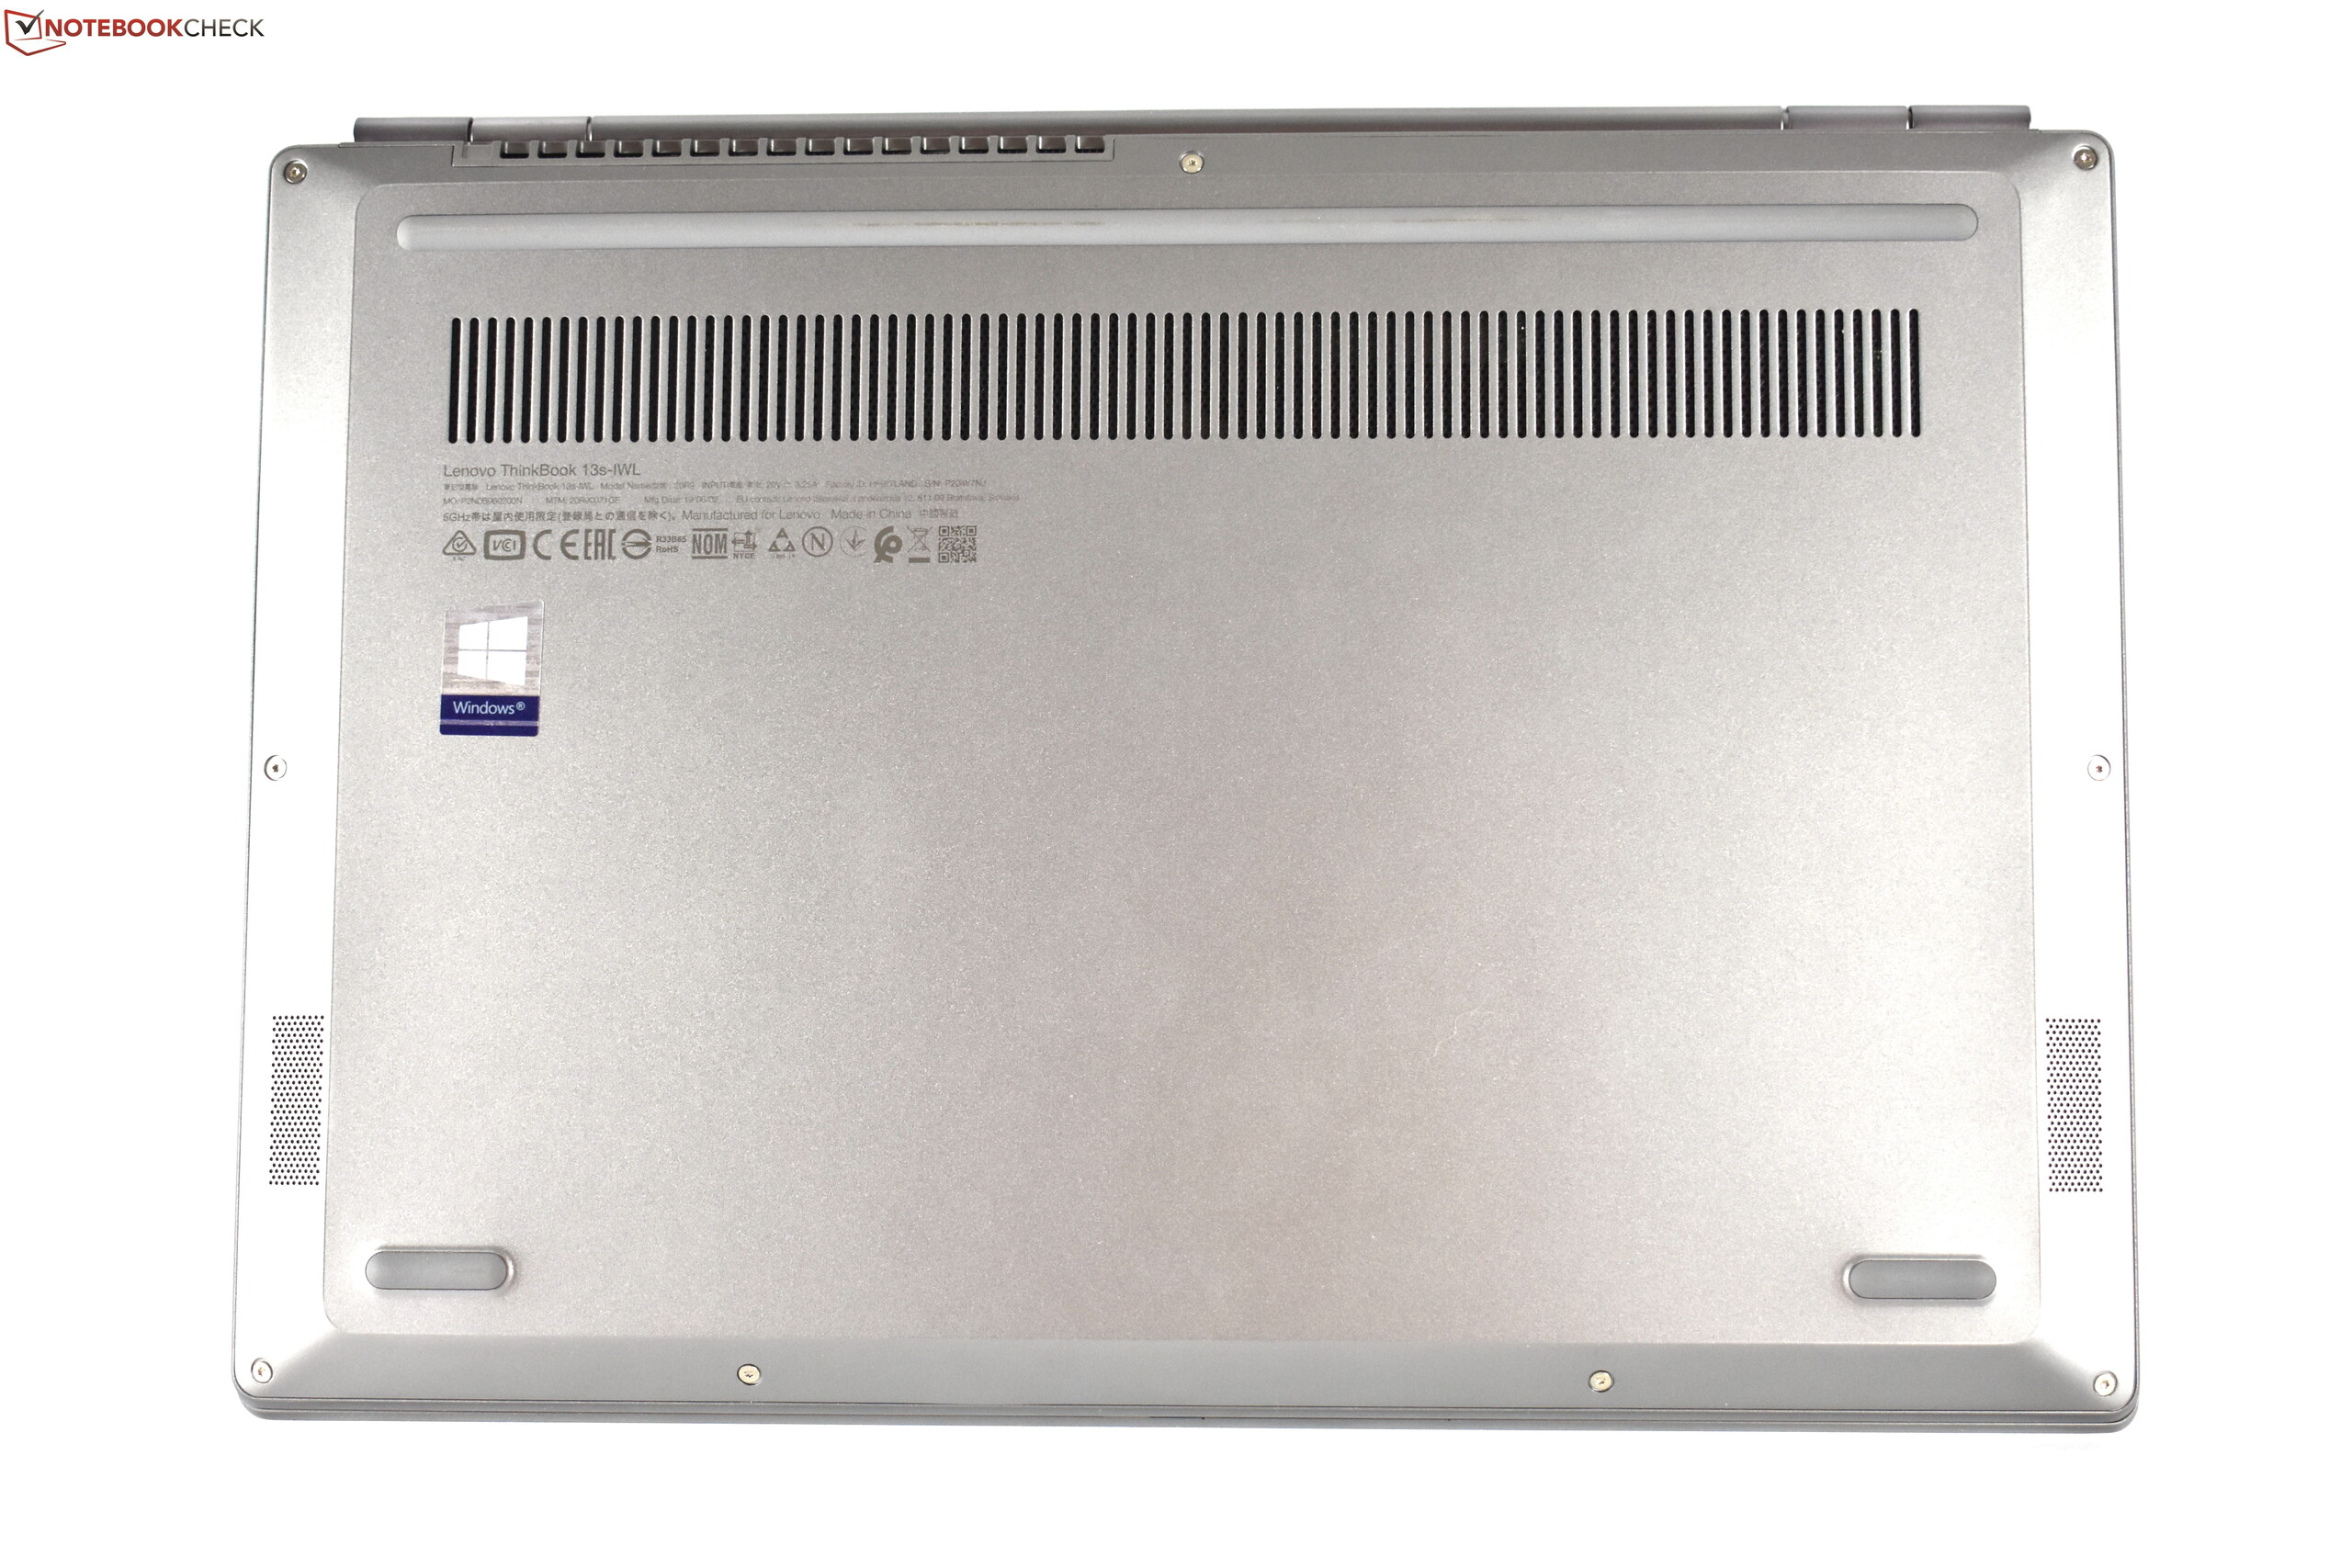
Uma das diferenças mais notáveis entre o ThinkBook 13s e seus pares ThinkPad, é o design da carcaça. O chassi de alumínio cinza-prateado parece premium, além de ser compacto e leve, embora não se pareça a um ThinkPad moderno. Não temos certeza se o ThinkPad será tão robusto e resistente quanto um ThinkPad a longo prazo, mas um ThinkPad similarmente compacto e leve é significativamente mais caro que o ThinkBook 13s. No entanto, gostamos do que a Lenovo fez com a tela, com seu painel mate mais brilhante do que o do ThinkPad L390, além de ter uma melhor cobertura de espaço de cores. O suporte para HDR também é um ótimo toque. A duração da bateria e as temperaturas baixas da nossa unidade de análise também são louváveis, assim como a capacidade de atualizar a memória RAM, caso seja necessário.
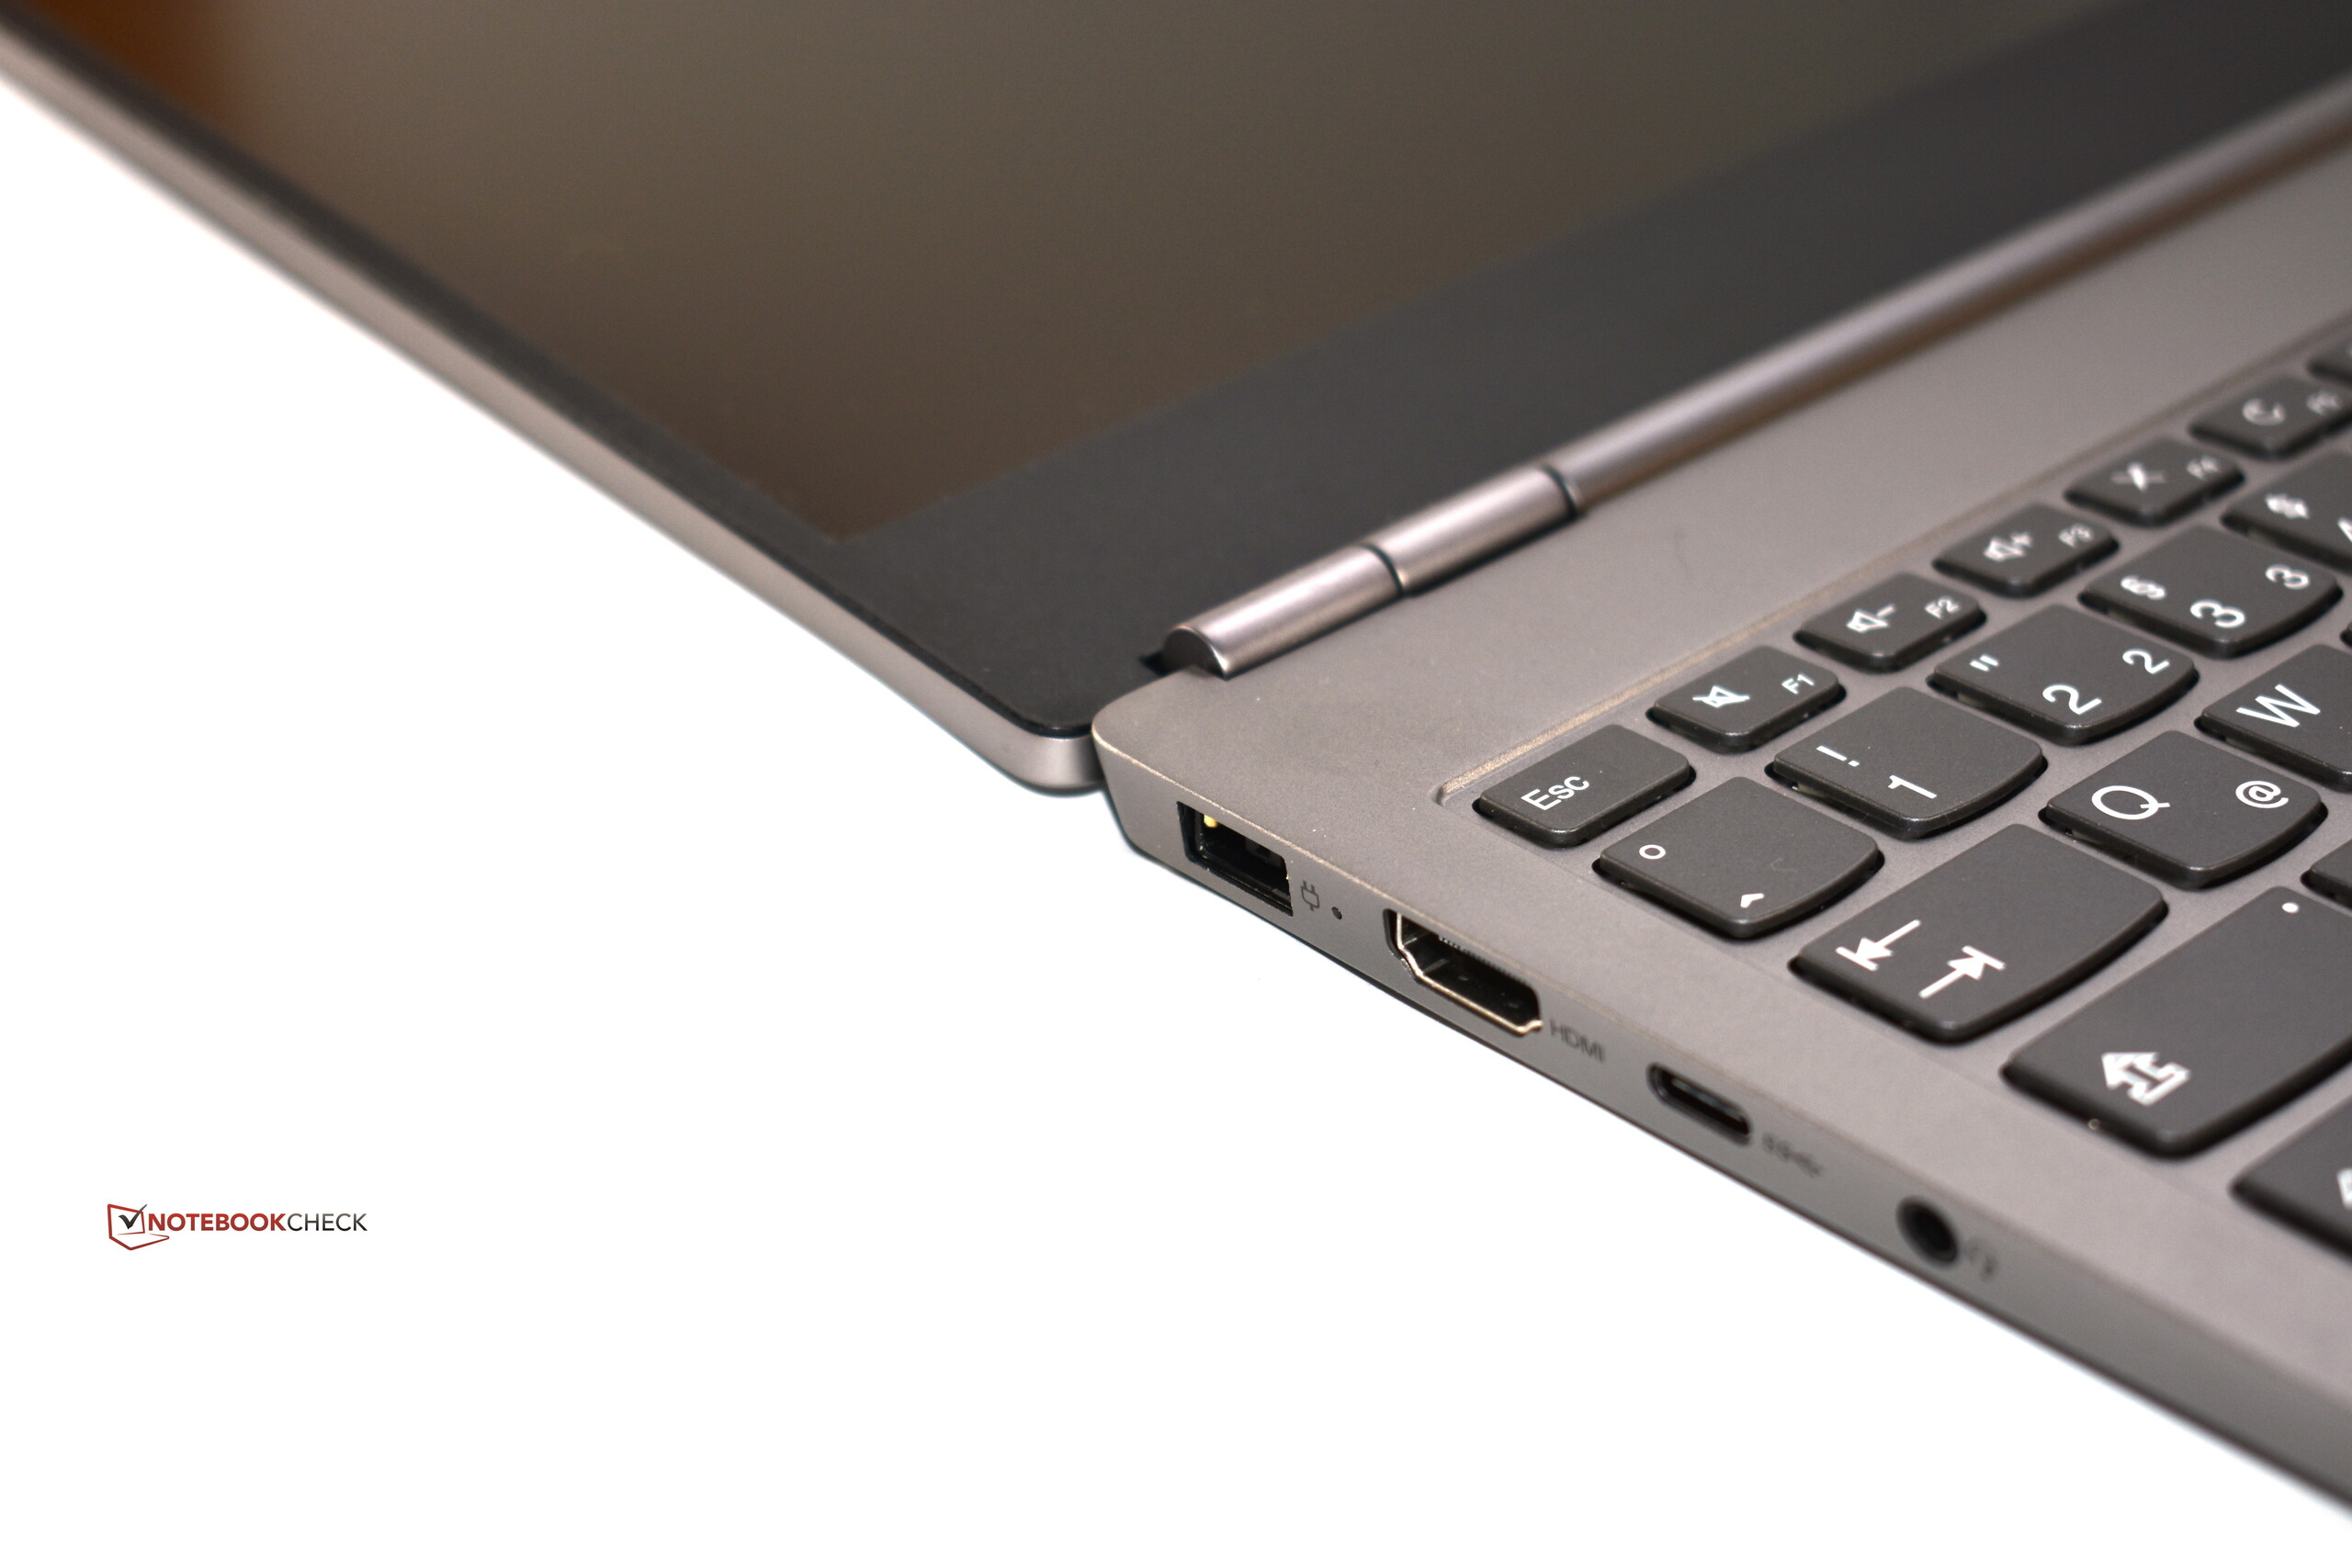
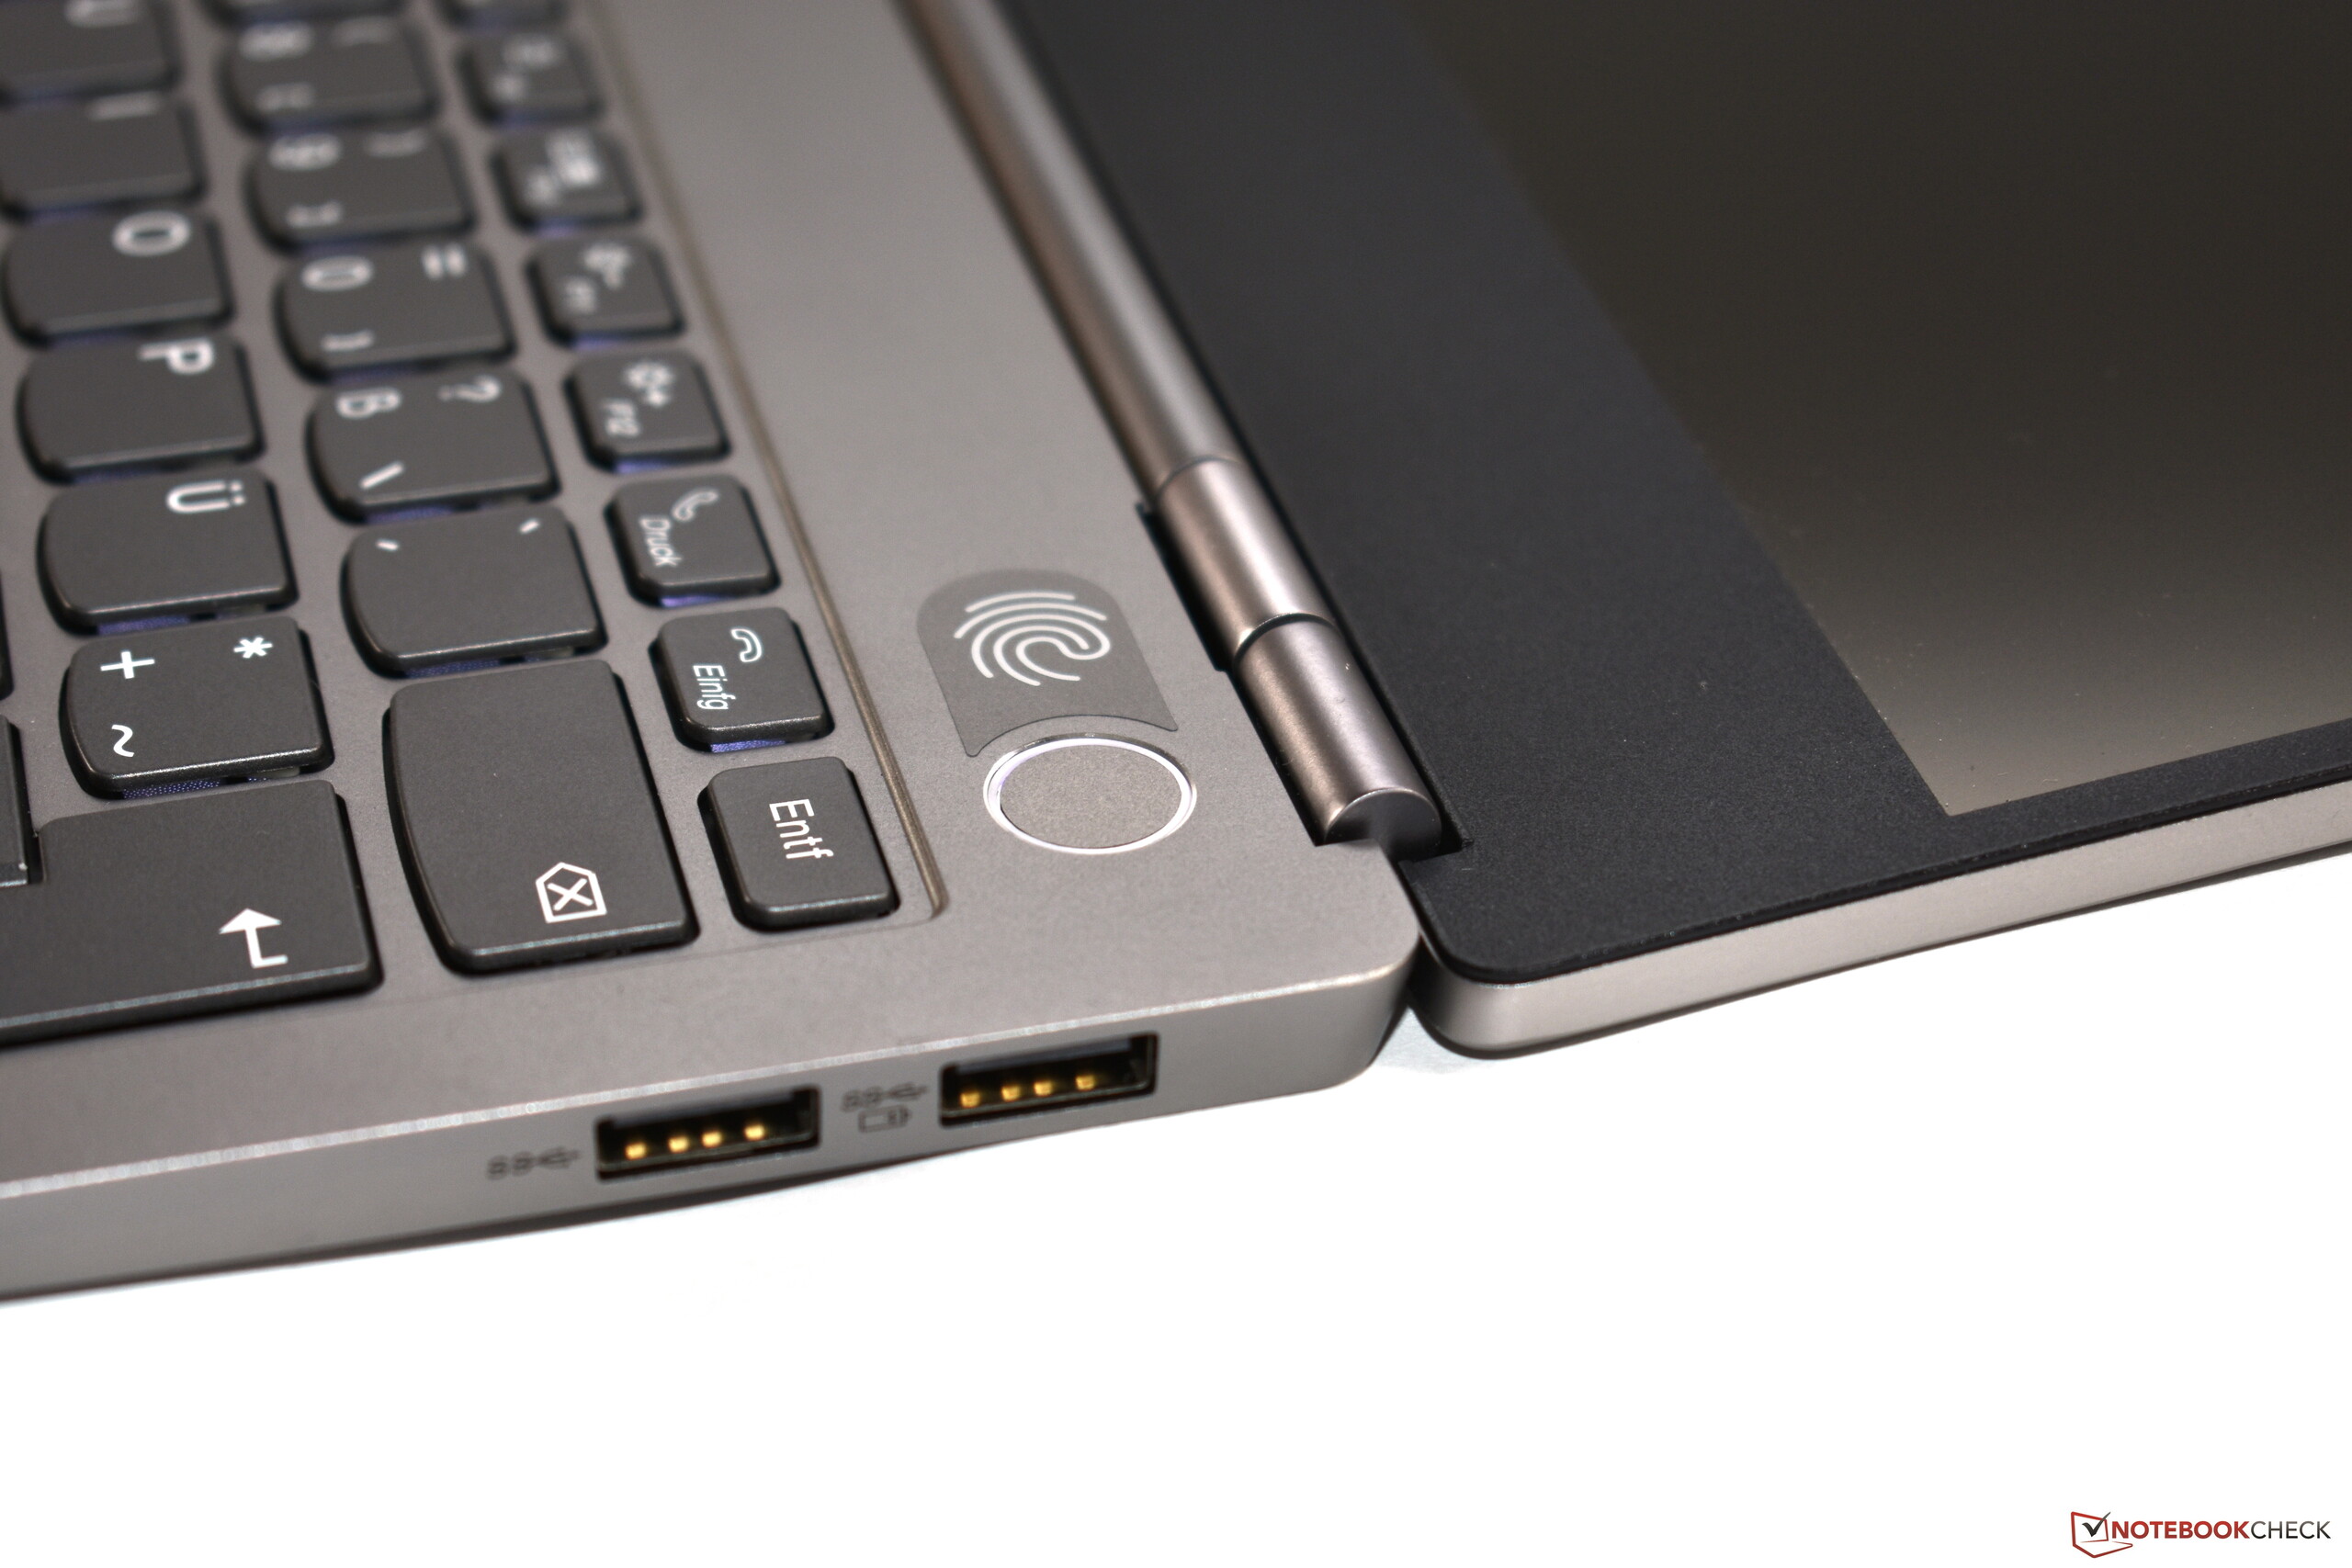
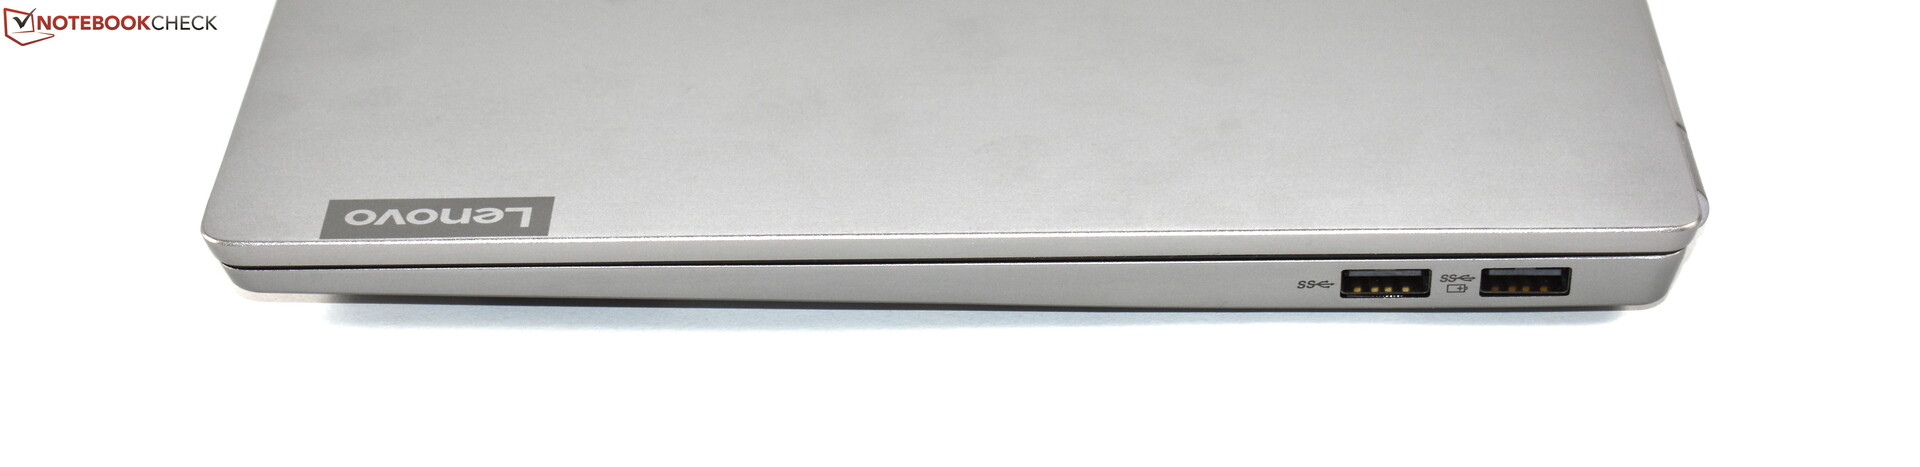
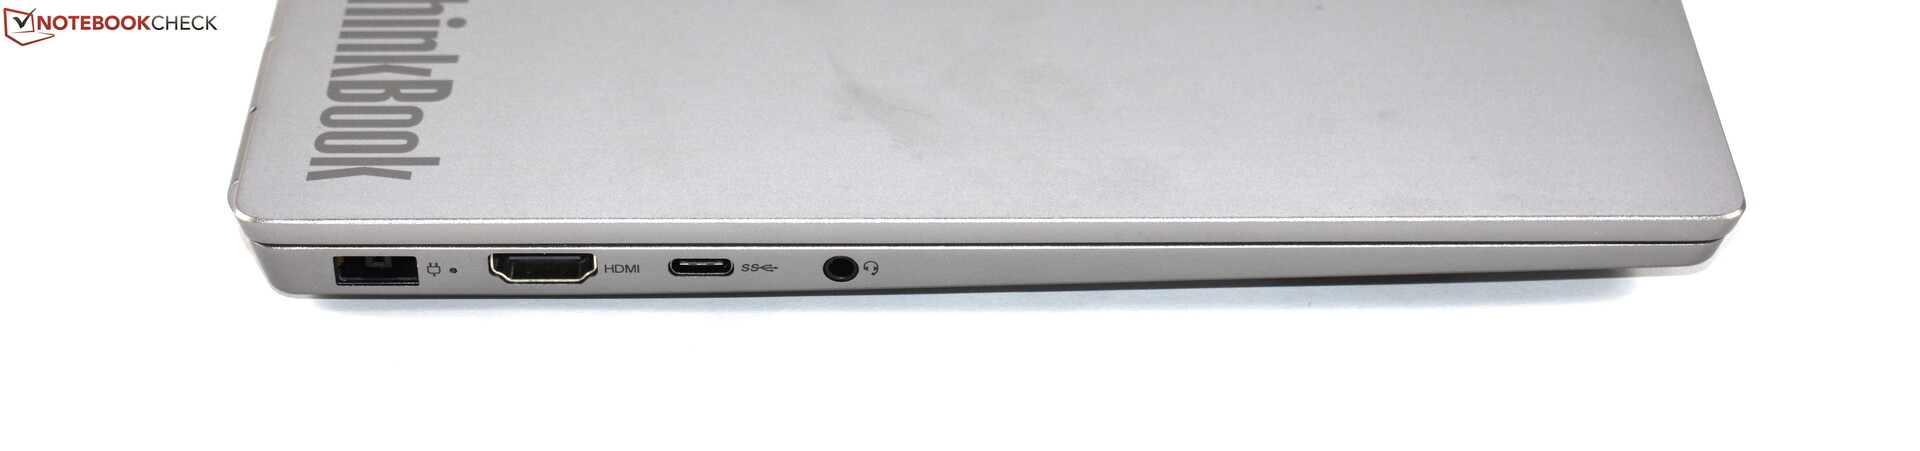
O maior problema que temos com o ThinkBook 13s é sua conectividade ou falta dela. Especificamente, nos referimos a seus recursos de segurança e comunicação junto com sua seleção de portas, com o ThinkBook 13s incapaz de competir com portáteis corporativos do mundo real em qualquer uma dessas três categorias. Embora não esperássemos que a Lenovo equipasse o dispositivo com uma porta Thunderbolt 3, não podemos entender por que a empresa decidiu não incluir suporte para o carregamento Type-C. Em vez disso, deve-se sempre usar o conector de alimentação de ponta fina proprietário, que é desnecessariamente inconveniente. A garantia de um ano é outra mancha na ficha do ThinkBook 13s, assim como o enorme marco inferior da tela.
IdeaPad Deluxe: O ThinkBook 13s combina alguns recursos do ThinkPad como uma tela mate e o ThinkShutter com o hardware do IdeaPad. O ThinkBook 13s pode ser um prospecto atraente para compradores domésticos, mas não é um substituto do ThinkPad.
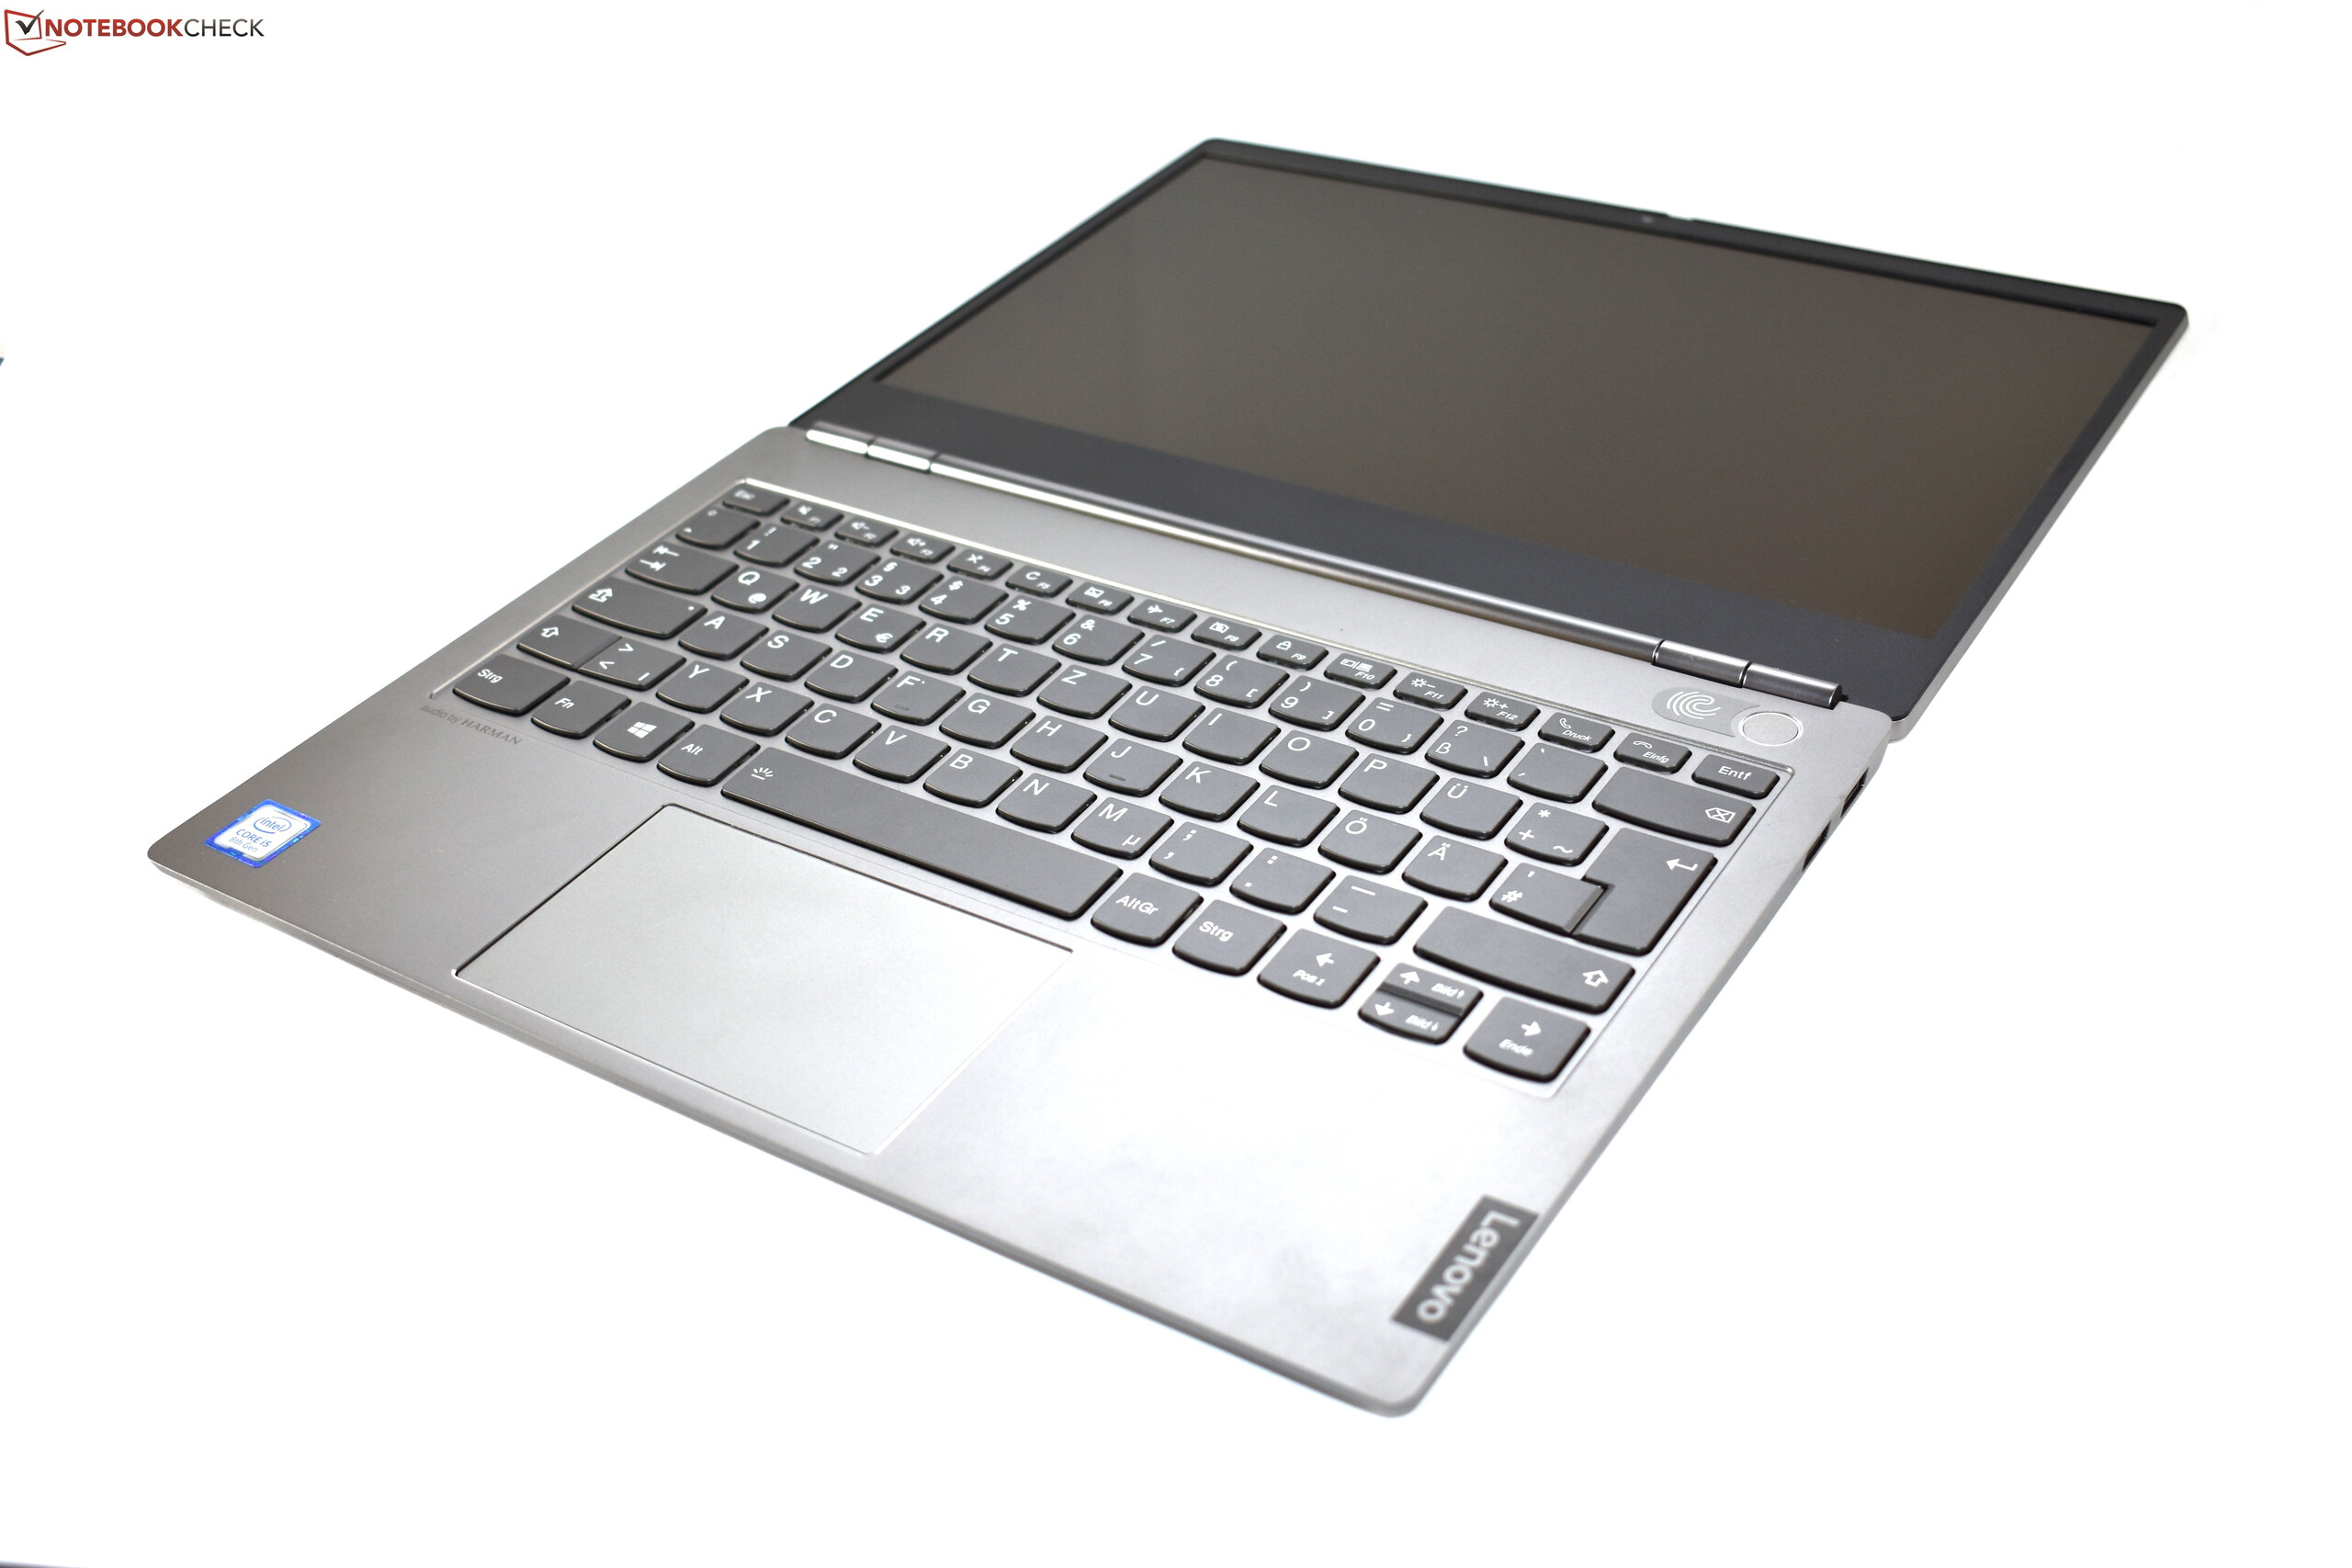
No geral, o Lenovo ThinkBook 13s não é um portátil ruim, mas é mais IdeaPad do que ThinkPad. Seu teclado e trackpad são a prova disso, com o ThinkBook sem um TrackPoint e também a experiência de digitação de qualidade que esperamos dos portáteis ThinkPad. Em suma, o ThinkBook 13s pode ser uma alternativa interessante para marcas estabelecidas para o público em geral ou estudantes, mas não é uma opção adequada se você precisa de um portátil empresarial. Com isso dito, há portáteis de 13,3 polegadas melhores do que os ThinkBook 13s se você estiver disposto a abrir mão dos recursos do ThinkPad que ele não possui.
Lenovo ThinkBook 13s-20R90071GE
- 09/26/2019 v7 (old)
Benjamin Herzig
Price comparison
