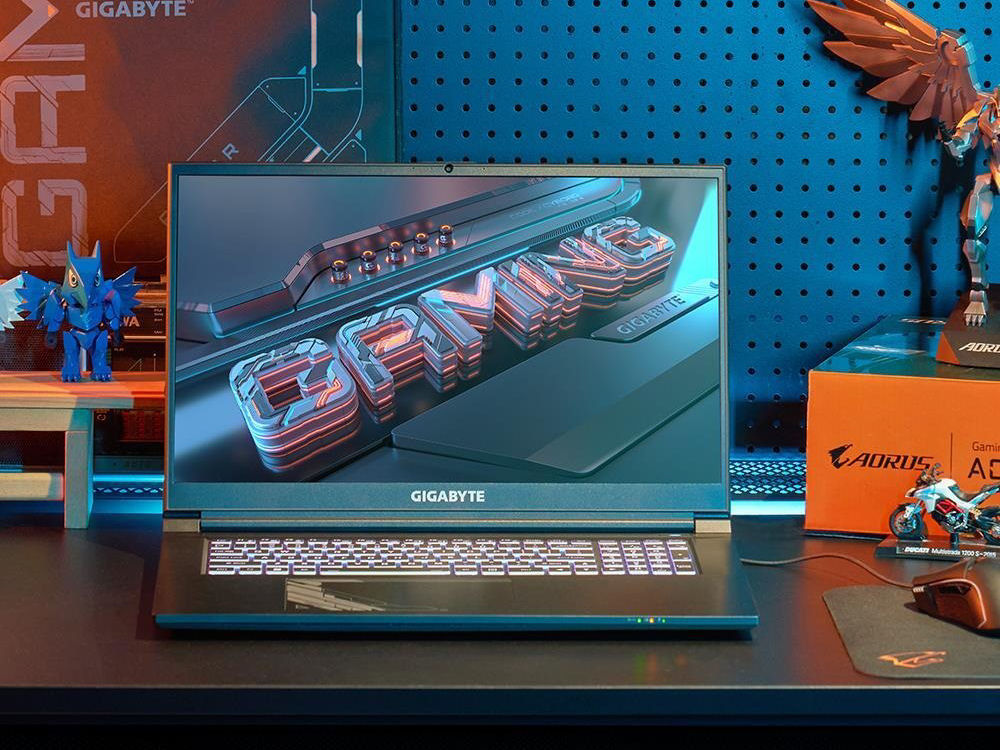
Gigabyte G7 KE em revisão: Laptop de jogo acessível com um poderoso RTX 3060
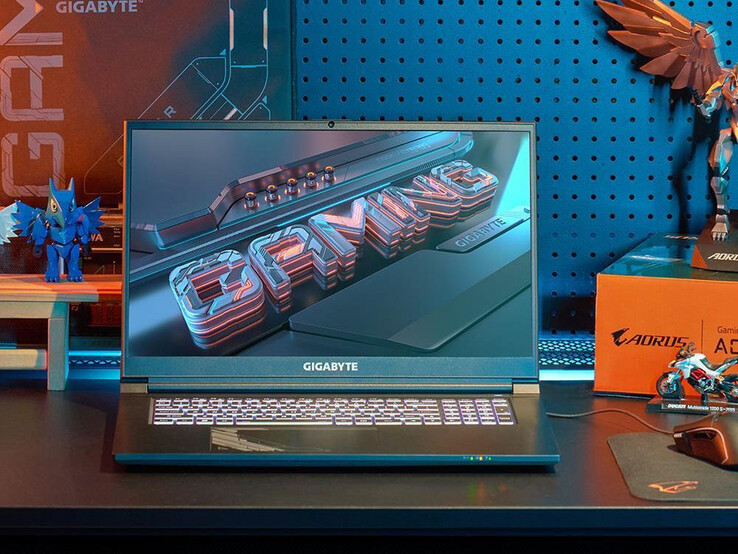
O G7 KE é um laptop para jogos de 17,3 polegadas a partir da faixa de preço mais baixo. Gigabyte combina uma CPU Alder Lake Core i5 com uma RTX 3060 GPU por cerca de 1.200 Euros (~1.300 USD). Modelos mais baratos com um GeForce RTX 3050 (G7 GE) ou GeForce RTX 3050 Ti (G7 ME) também estão disponíveis. Os concorrentes incluem dispositivos tais como o HP Pavilion Jogos 17, Acer Nitro 5 AN517-55, Lenovo IdeaPad Gaming 3 15IAH7 ou o Asus TUF Gaming F17 FX707Z.
Possíveis concorrentes em comparação
Avaliação | Data | Modelo | Peso | Altura | Size | Resolução | Preço |
|---|---|---|---|---|---|---|---|
| 83.3 % v7 (old) | 01/2023 | Gigabyte G7 KE i5-12500H, GeForce RTX 3060 Laptop GPU | 2.6 kg | 25 mm | 17.30" | 1920x1080 | |
| 82.7 % v7 (old) | 09/2022 | HP Pavilion Gaming 17-cd2146ng i5-11300H, GeForce RTX 3050 Ti Laptop GPU | 2.8 kg | 25 mm | 17.30" | 1920x1080 | |
| 83.9 % v7 (old) | 08/2022 | Acer Nitro 5 AN517-55-738R i7-12700H, GeForce RTX 3060 Laptop GPU | 3.1 kg | 28.6 mm | 17.30" | 1920x1080 | |
| 84.1 % v7 (old) | 04/2022 | Asus TUF Gaming F17 FX707Z-HX011W i7-12700H, GeForce RTX 3060 Laptop GPU | 2.5 kg | 25 mm | 17.30" | 1920x1080 | |
| 82.8 % v7 (old) | 10/2022 | Lenovo IdeaPad Gaming 3 15IAH7 i5-12500H, GeForce RTX 3050 Ti Laptop GPU | 2.4 kg | 26 mm | 15.60" | 1920x1080 |
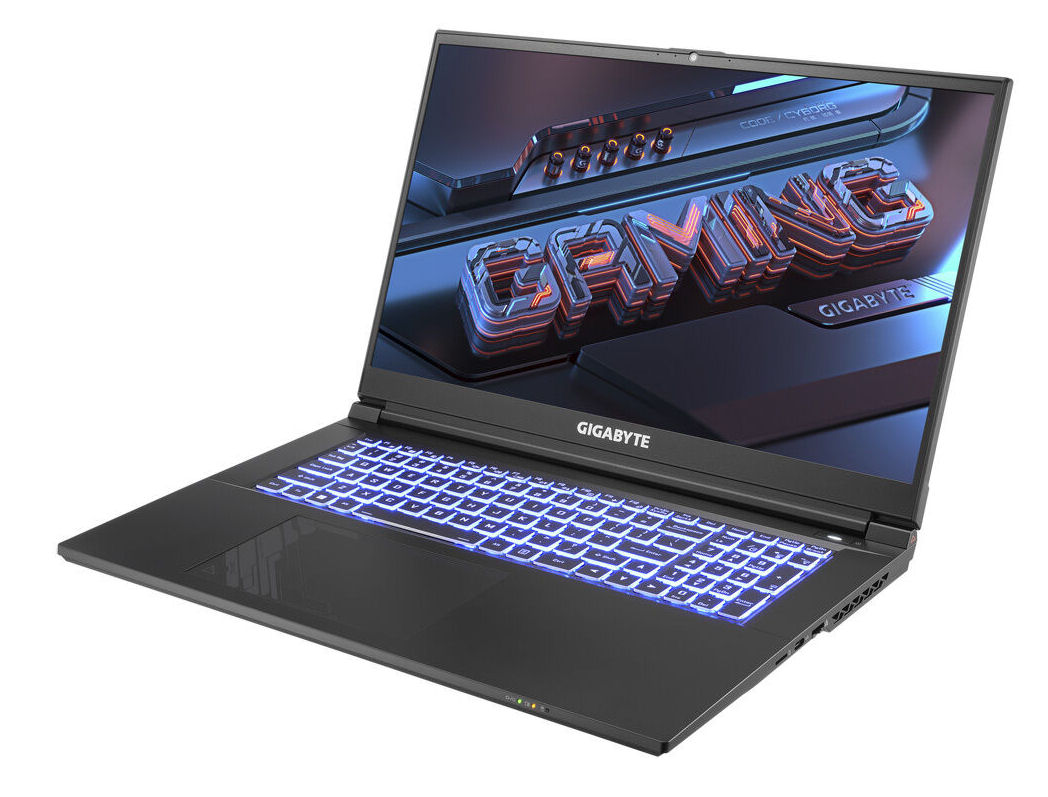
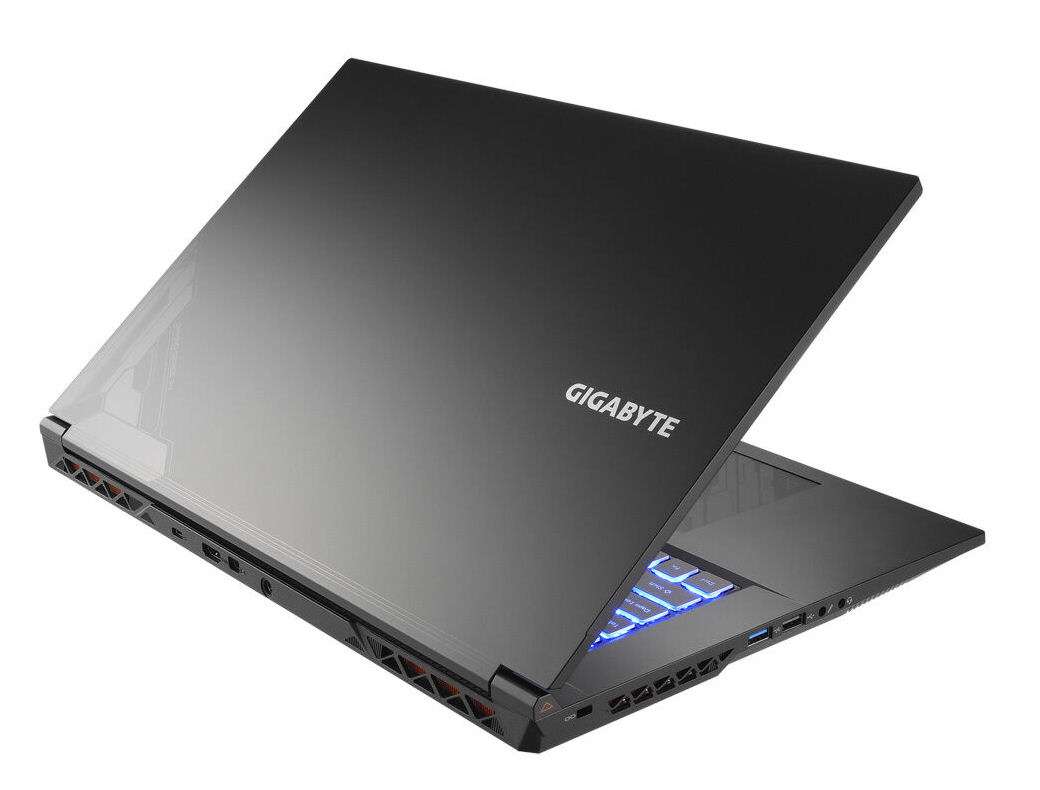
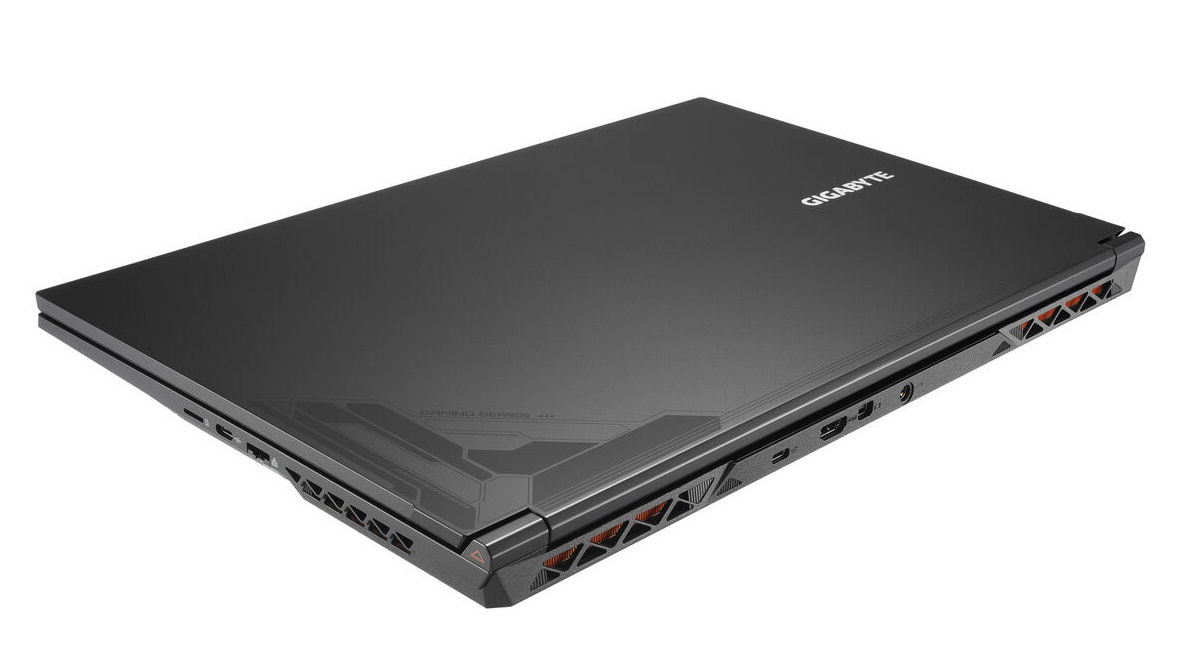
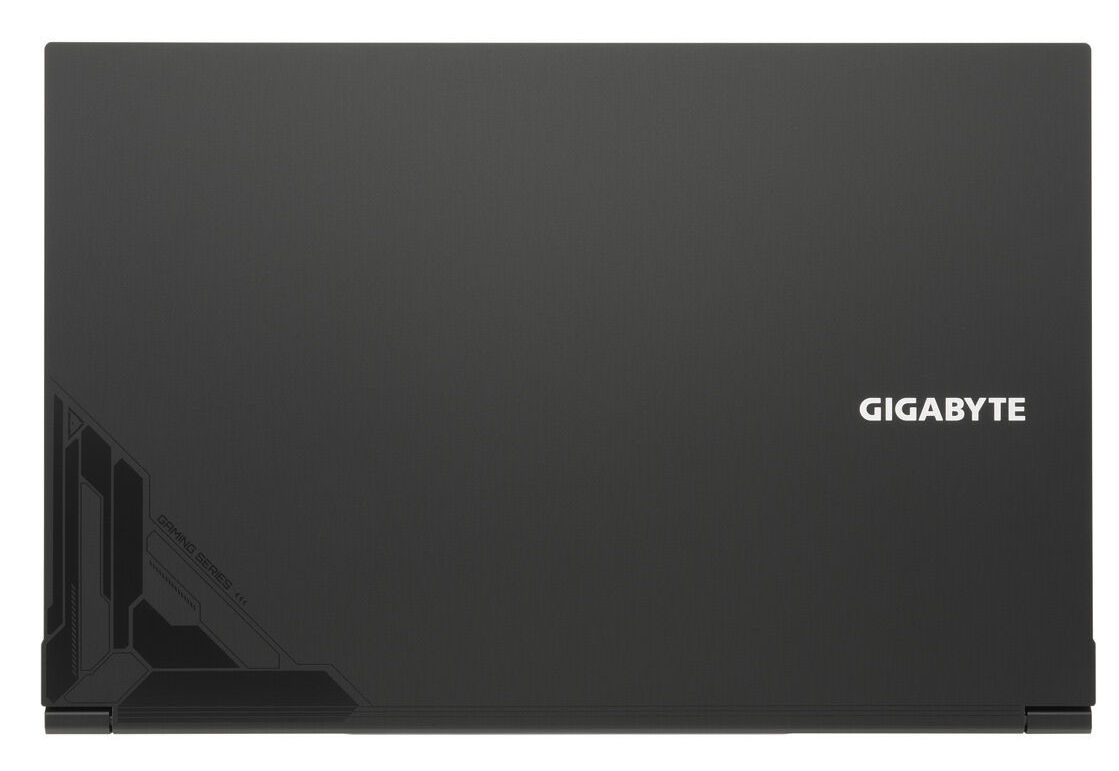
Estojo - G7 Com um Chassi Plástico
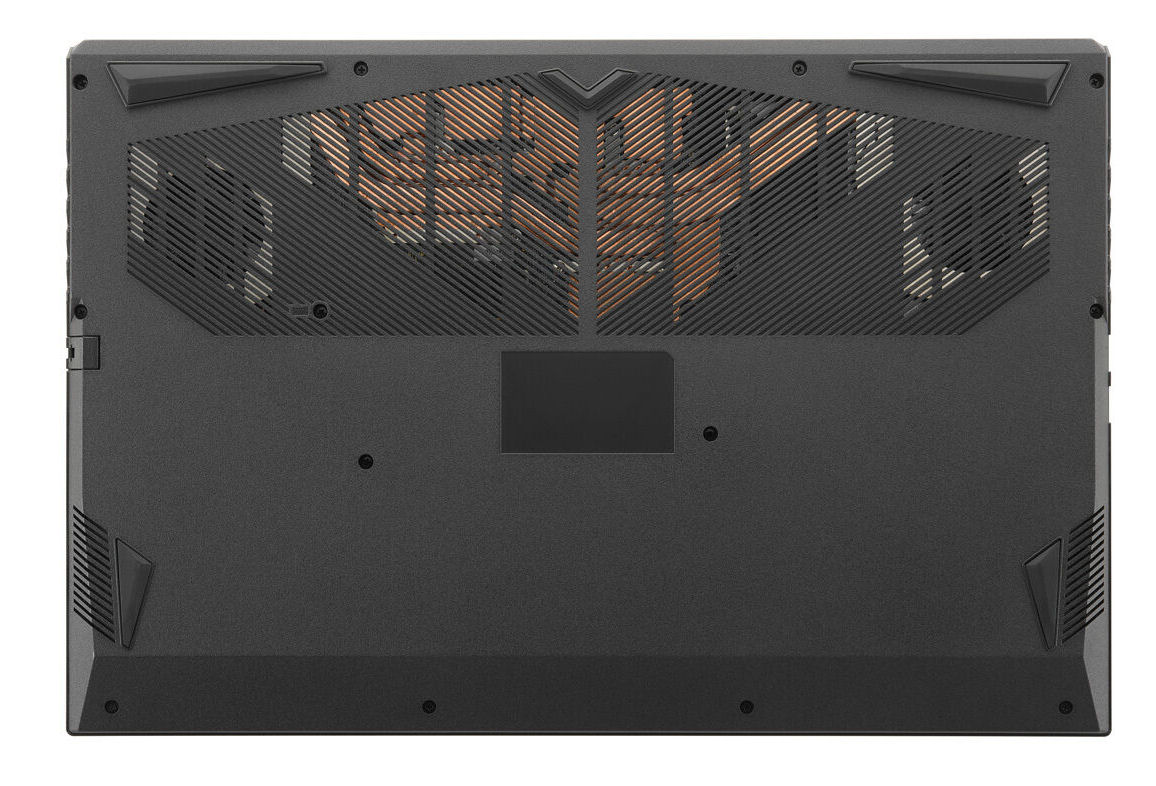
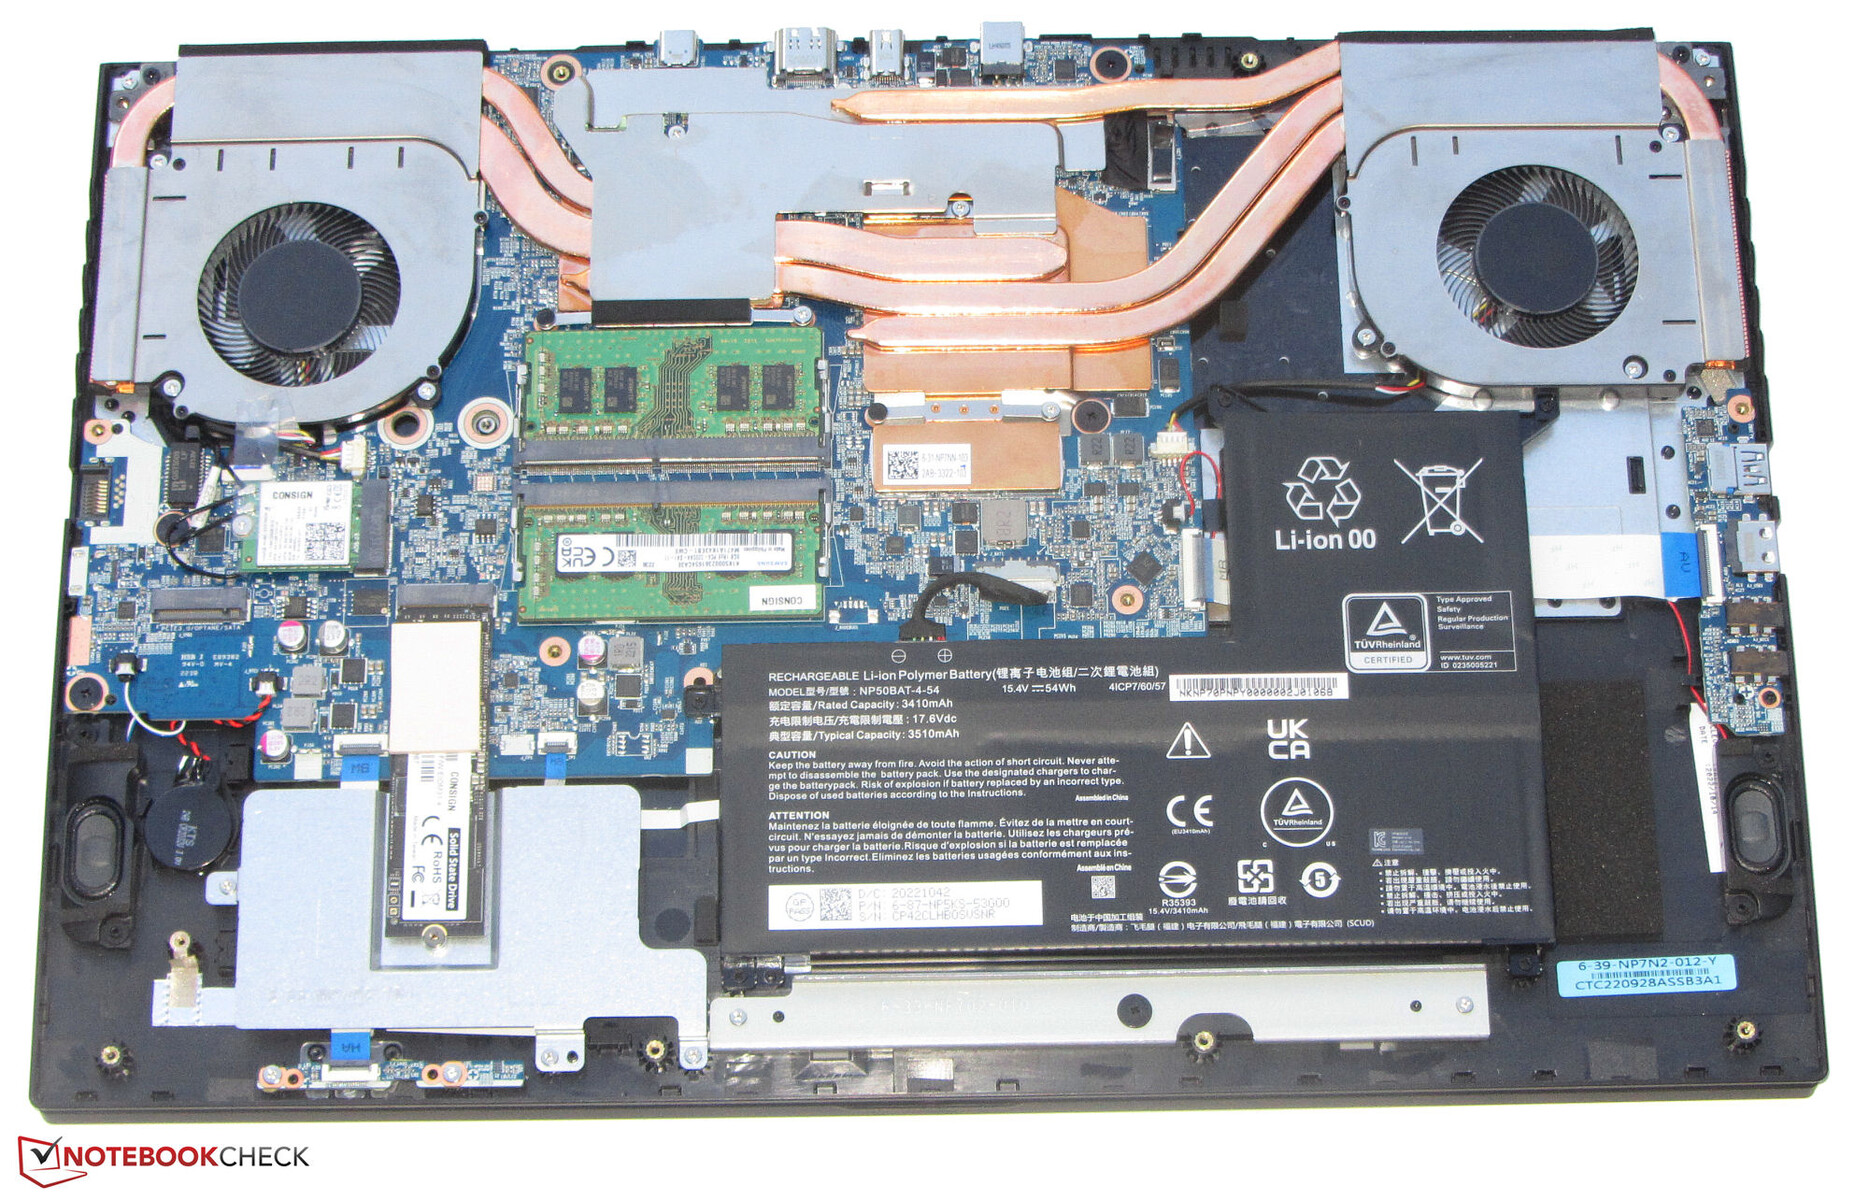
Gigabyte não utiliza materiais premium para o chassi do G7. Ao invés disso, o fabricante confia no plástico preto com superfícies lisas e foscas. Há alguns acentos sutis, visuais, pretos e cinzas impressos na parte de trás da tampa e do clickpad. O design do chassi é muito simples de outra forma e poderia ser descrito como "funcional". A bateria (aparafusada, não colada) e os outros componentes internos podem ser acessados após a remoção da placa inferior.
A qualidade de construção do chassi não justifica críticas. As folgas são apertadas e não há excesso de material protuberante. Embora a unidade base possa ser torcida pelos cantos, isto não deve ser um problema durante o uso diário. A rigidez da tampa deixa algo a desejar, no entanto. Enquanto as dobradiças seguram o visor firmemente no lugar, elas permitem um pouco de teetering. O visor pode ser aberto até um ângulo máximo de cerca de 140 graus. A abertura da tampa com uma mão é possível.
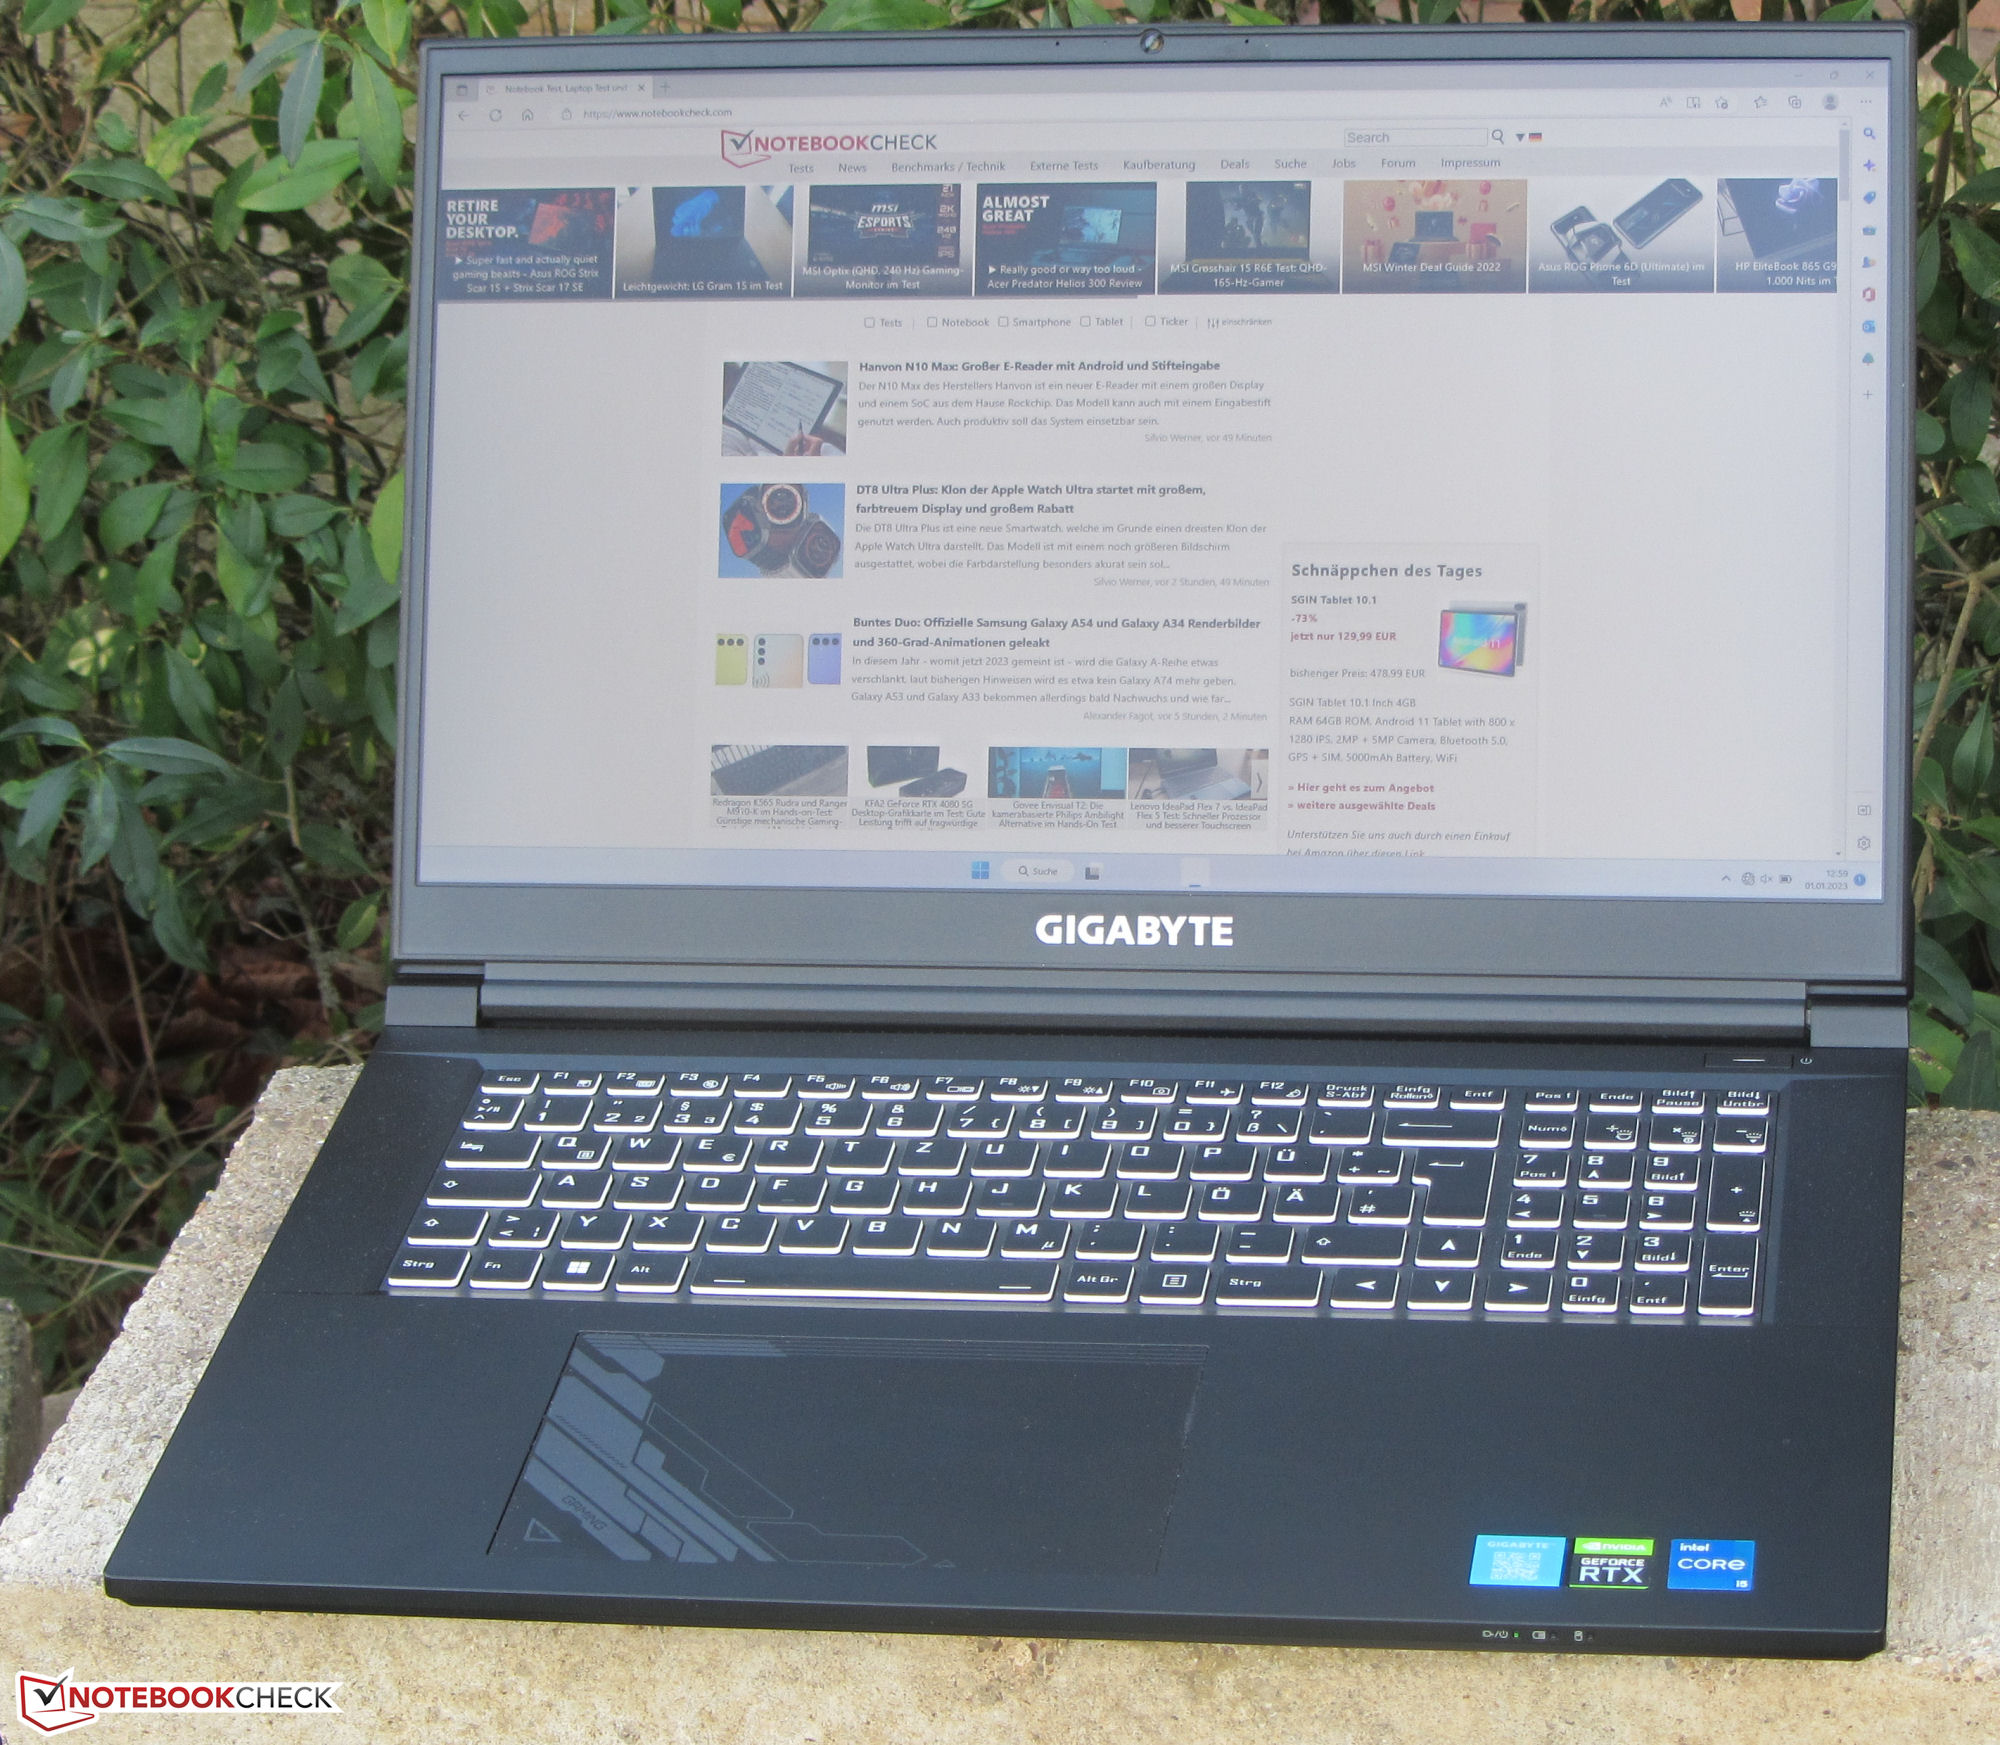

O G7 é um dos dispositivos mais compactos e leves de 17,3 polegadas em nossa comparação. Somente o Asus TUF Gaming F17 consegue ultrapassá-la por uma pequena margem.
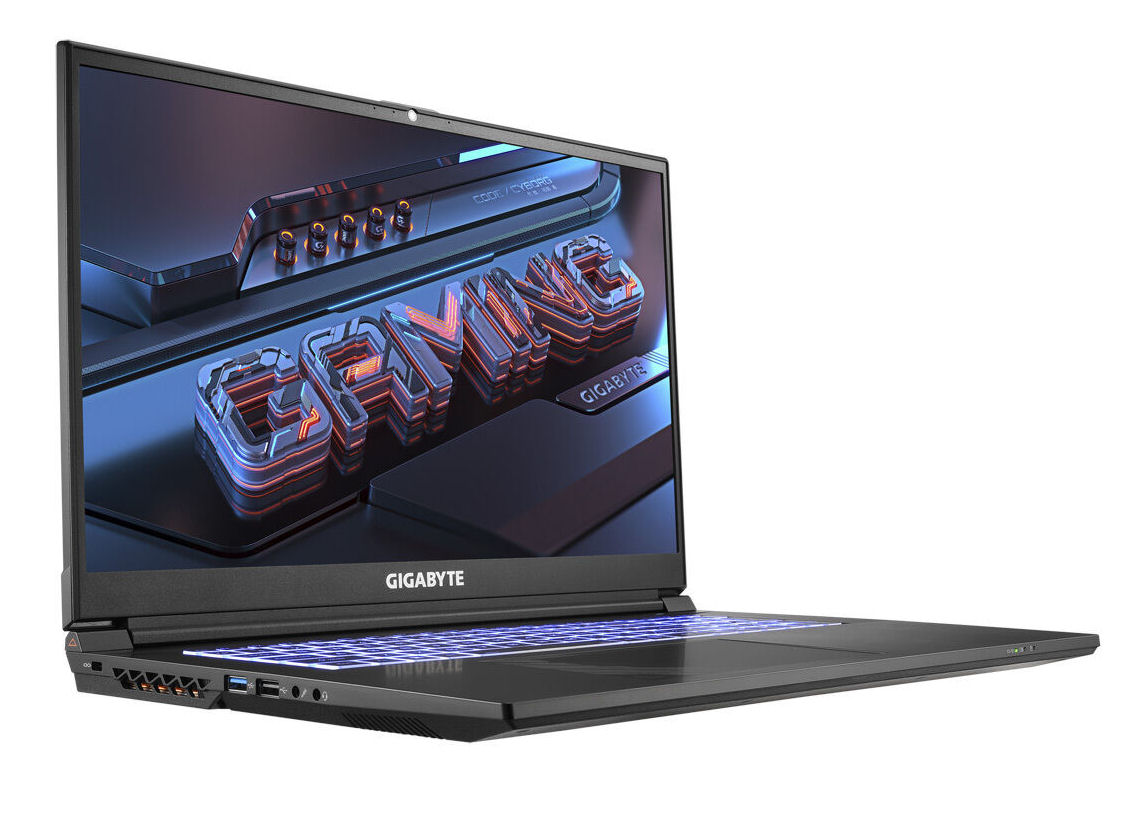
Conectividade - Caderno Gigabyte com Thunderbolt 4
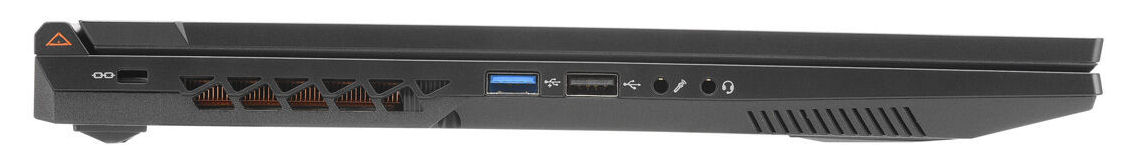
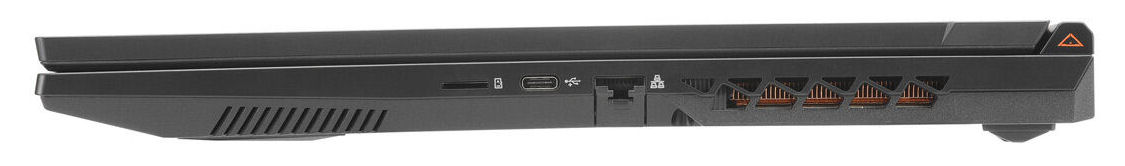
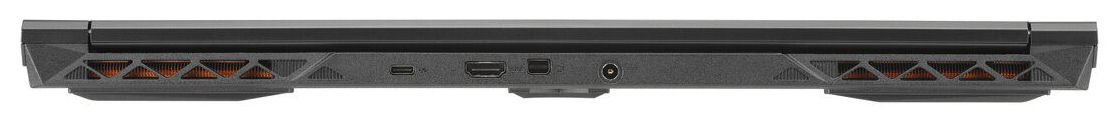
O G7 vem com duas portas USB-A (1x USB 2.0, 1x USB 3.2 gen. 1) e duas portas USB-C (1x USB 3.2 gen. 2, 1x Thunderbolt 4). As interfaces tipo C não suportam Power Delivery e somente a porta TB4 suporta DisplayPort via USB-C. Combinado com a porta HDMI (2.1) e a Mini DisplayPort dedicada (1.4), isto equivale a um total de três saídas de vídeo.
As portas do G7 são distribuídas em três lados do laptop. As duas saídas de vídeo dedicadas estão localizadas na parte de trás do dispositivo. Assim, os cabos conectados correm ao longo da parte traseira e não atrapalham o caminho. O mesmo não se aplica aos cabos Ethernet: A porta pode ser encontrada na borda direita do modelo.
Leitor de cartões SD
O desempenho do leitor de cartões microSD (cartão de referência: AV Pro SD microSD 128 GB V60) é médio com leituras seqüenciais em torno de 89 MB/s.
| SD Card Reader | |
| average JPG Copy Test (av. of 3 runs) | |
| Média da turma Gaming (20.9 - 210, n=54, últimos 2 anos) | |
| HP Pavilion Gaming 17-cd2146ng (AV PRO microSD 128 GB V60) | |
| maximum AS SSD Seq Read Test (1GB) | |
| Média da turma Gaming (25.5 - 261, n=51, últimos 2 anos) | |
| Gigabyte G7 KE (AV PRO microSD 128 GB V60) | |
Comunicação
Sob condições ideais (nenhum outro dispositivo Wi-Fi nas proximidades, curta distância entre o laptop e o servidor), as velocidades de transferência Wi-Fi são excelentes e esgotam mais ou menos as capacidades do módulo Wi-Fi (Intel AX211; Wi-Fi 6E, 802.11ax). Enquanto isso, uma interface Gigabit Ethernet (I-219V) da Intel trata de redes com fio.
| Networking | |
| iperf3 transmit AXE11000 | |
| Gigabyte G7 KE | |
| Média da turma Gaming (560 - 1862, n=93, últimos 2 anos) | |
| Média Intel Wi-Fi 6E AX211 (64 - 1921, n=276) | |
| iperf3 receive AXE11000 | |
| Gigabyte G7 KE | |
| Média da turma Gaming (680 - 1745, n=93, últimos 2 anos) | |
| Média Intel Wi-Fi 6E AX211 (582 - 1890, n=276) | |
| HP Pavilion Gaming 17-cd2146ng | |
| Lenovo IdeaPad Gaming 3 15IAH7 | |
Webcam
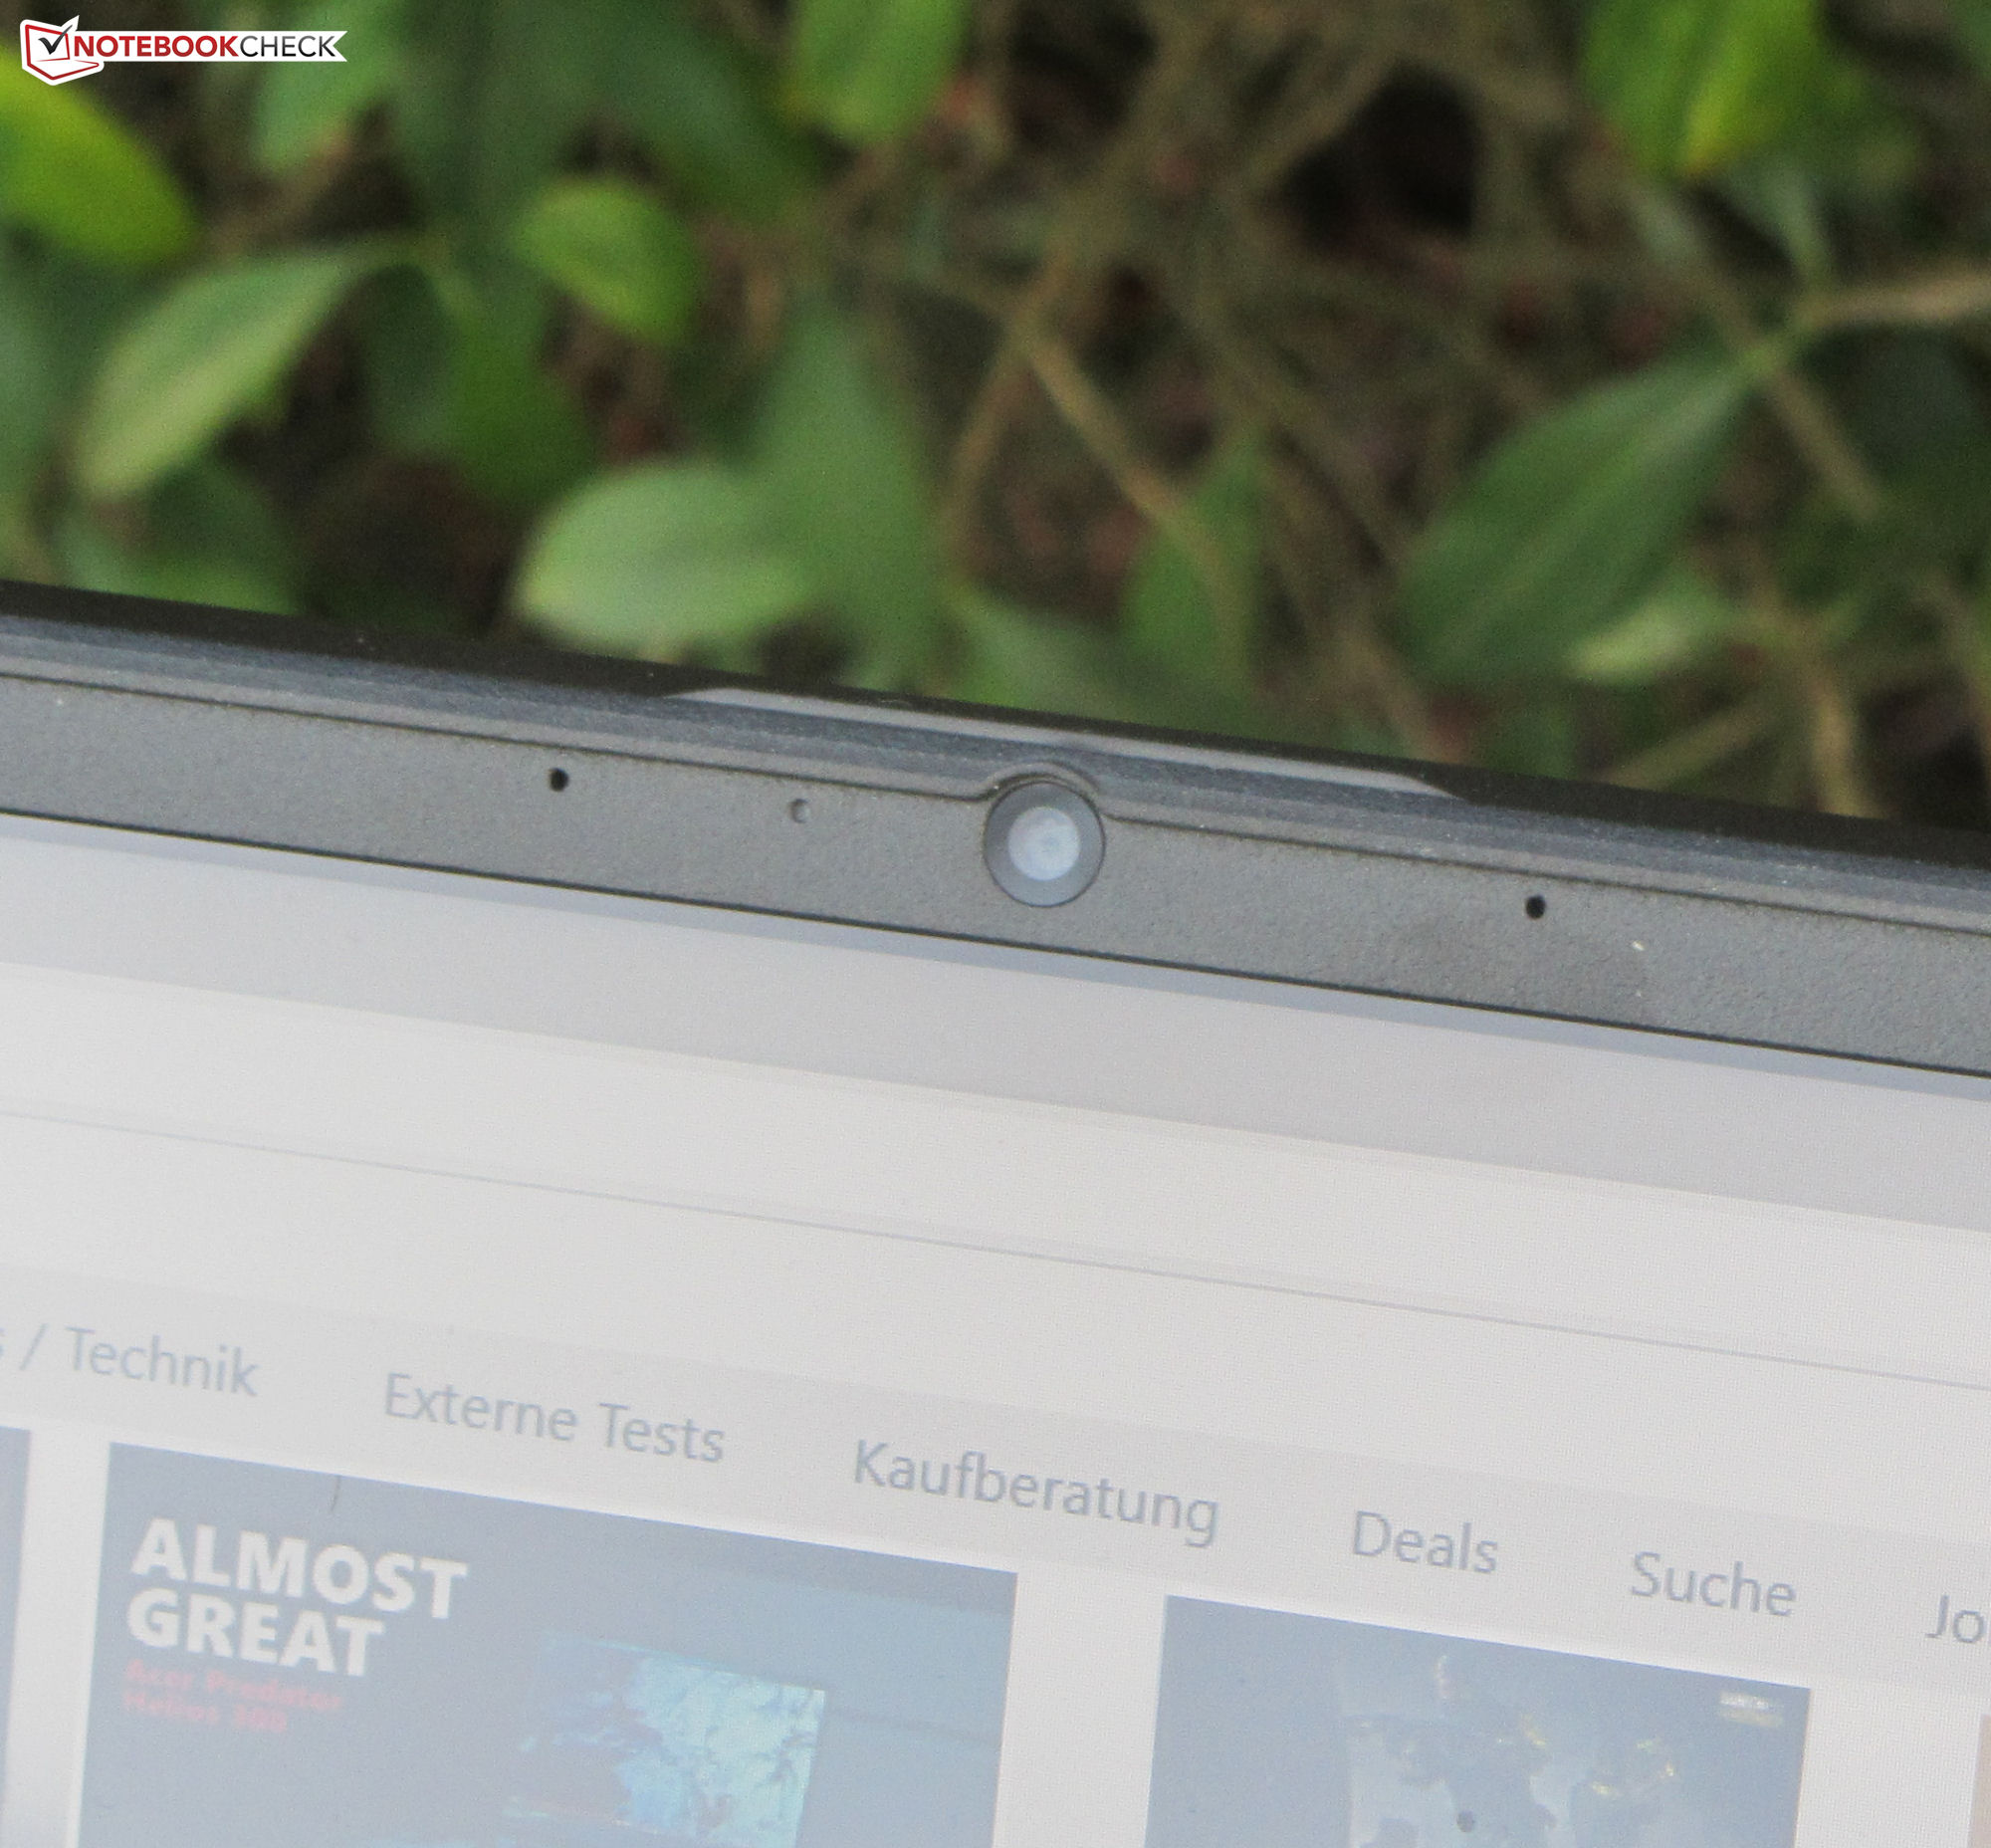
A webcam (0,9 MP) captura imagens com uma resolução máxima de 1280 x 720 pixels. A câmera produz resultados decentes com um desvio geral de cor relativamente baixo. A câmera não está equipada com um obturador mecânico da webcam.


Acessórios
Além da papelada usual (guia de início rápido e informações sobre garantia), o laptop também inclui um parafuso para instalação e uma almofada térmica para resfriamento do SSD secundário.
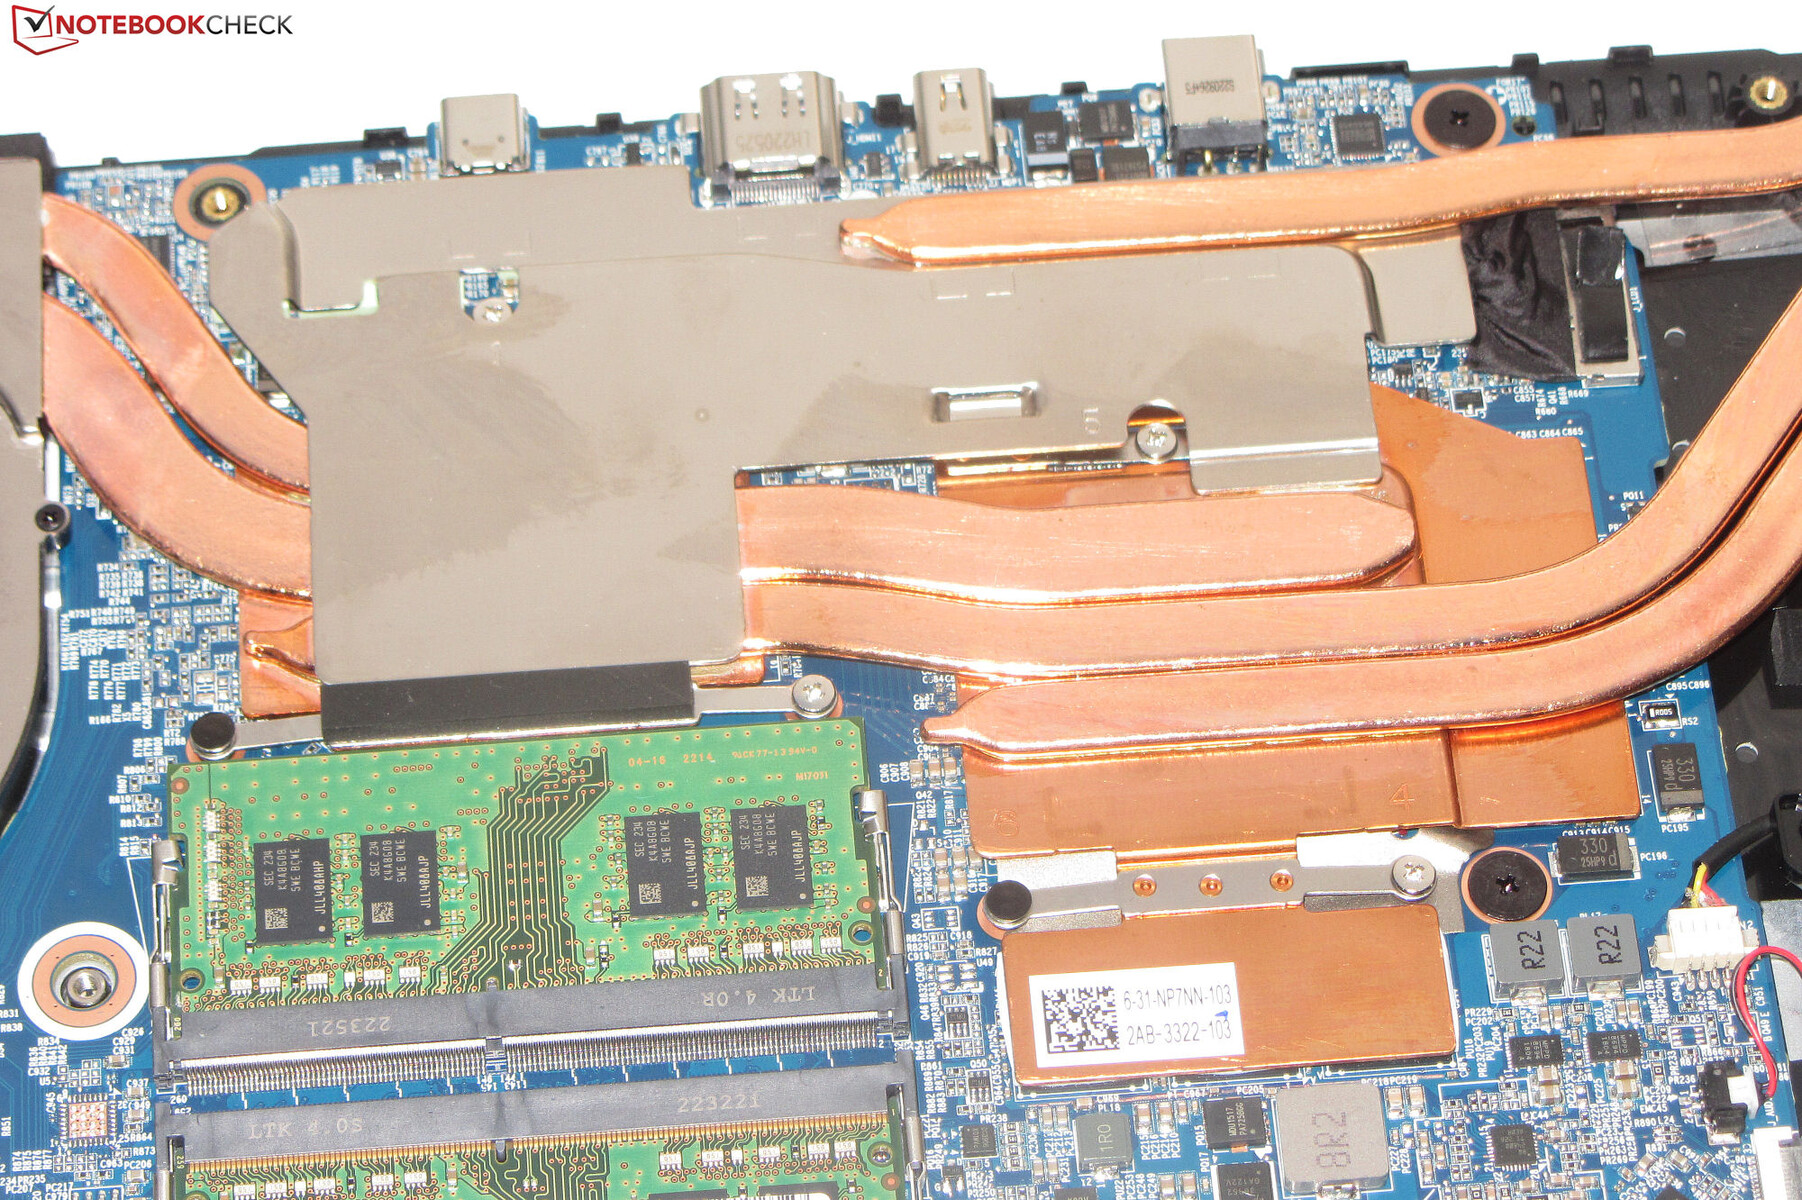
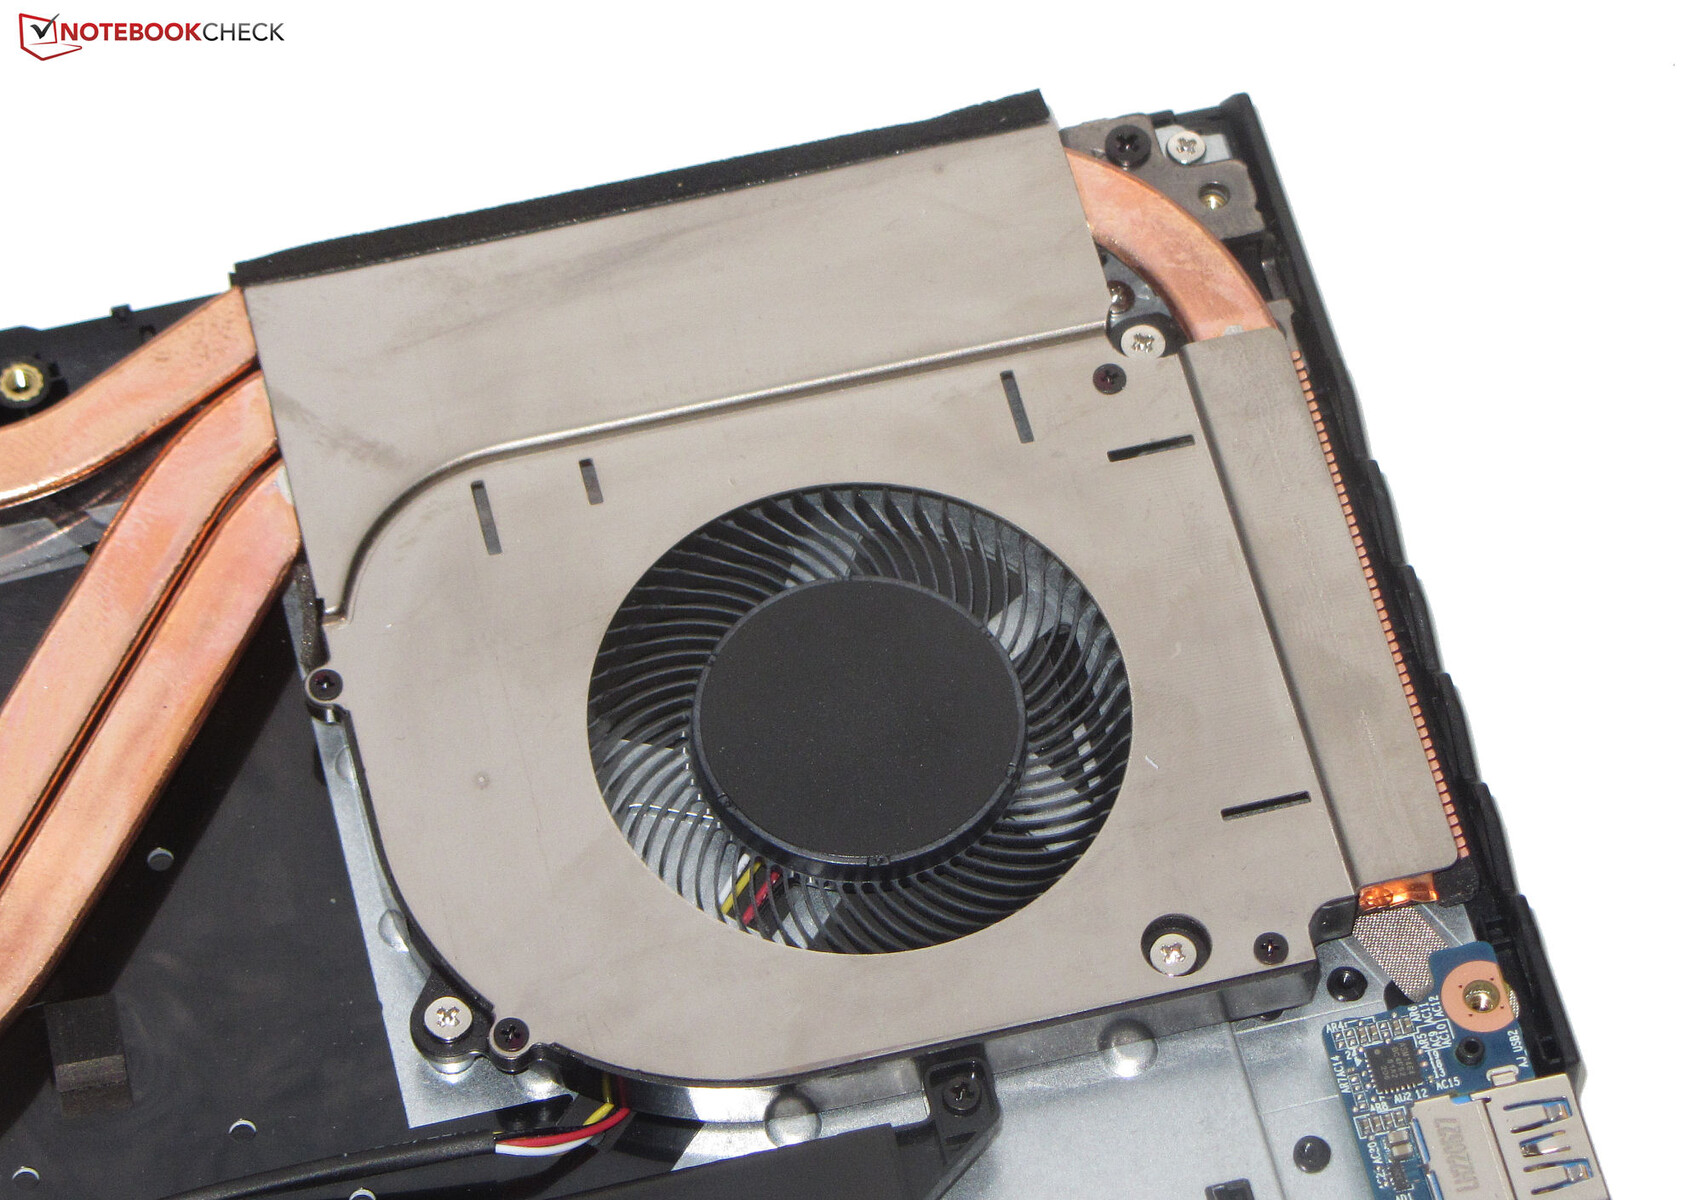
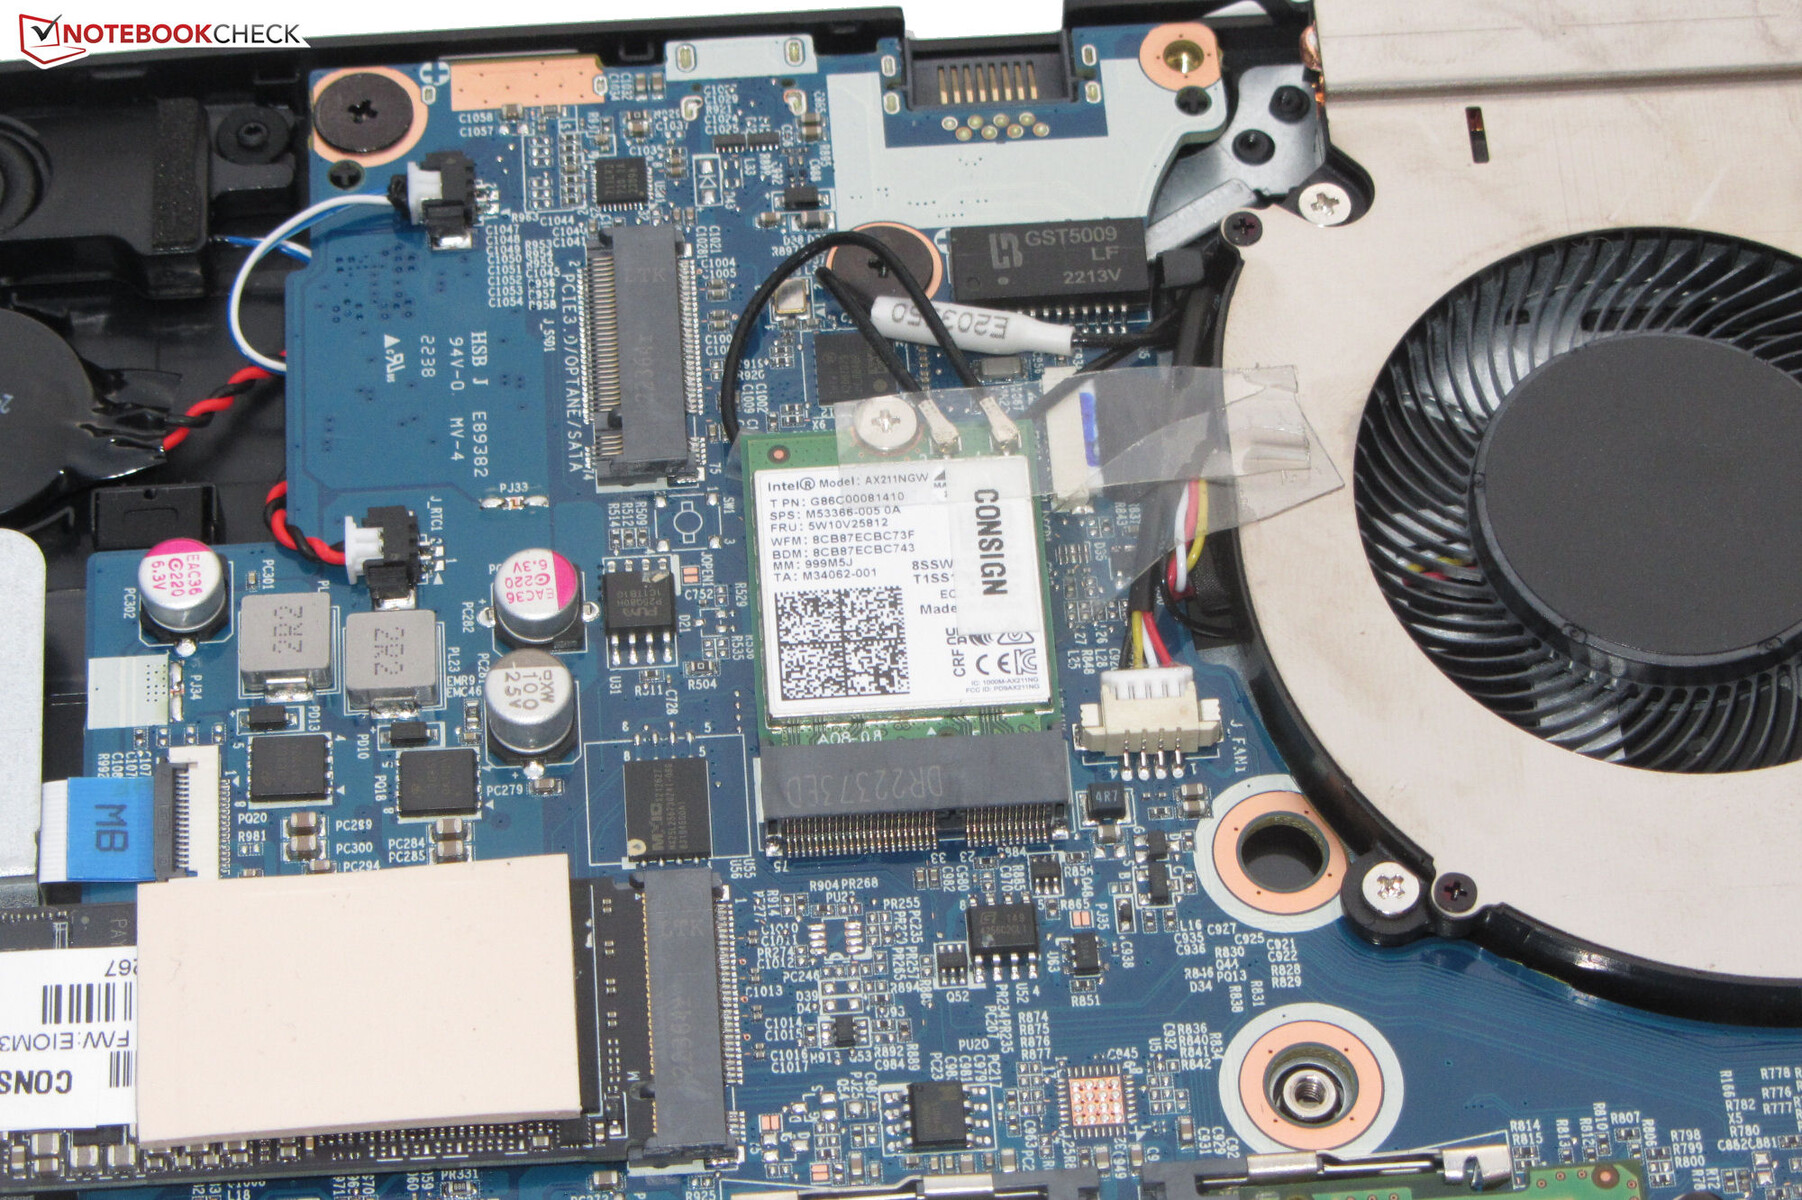
Manutenção
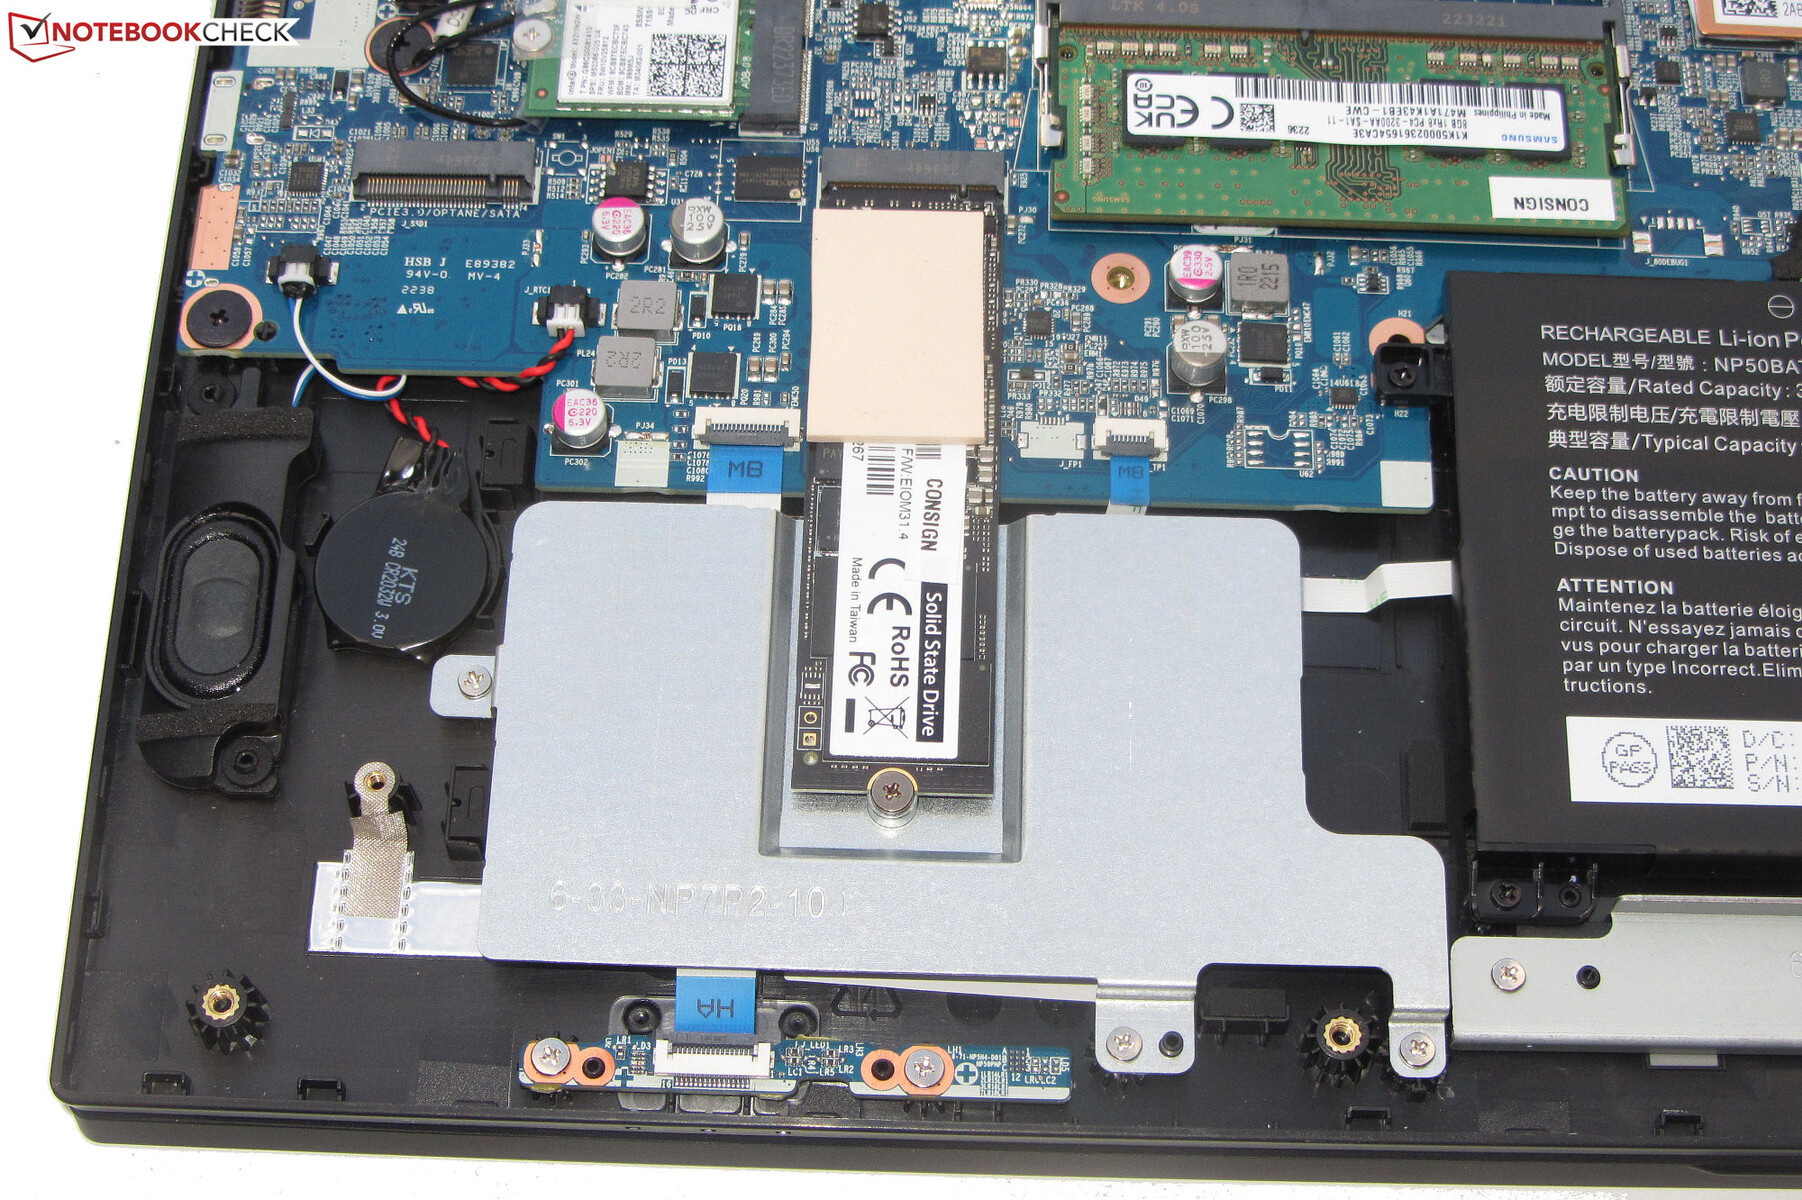
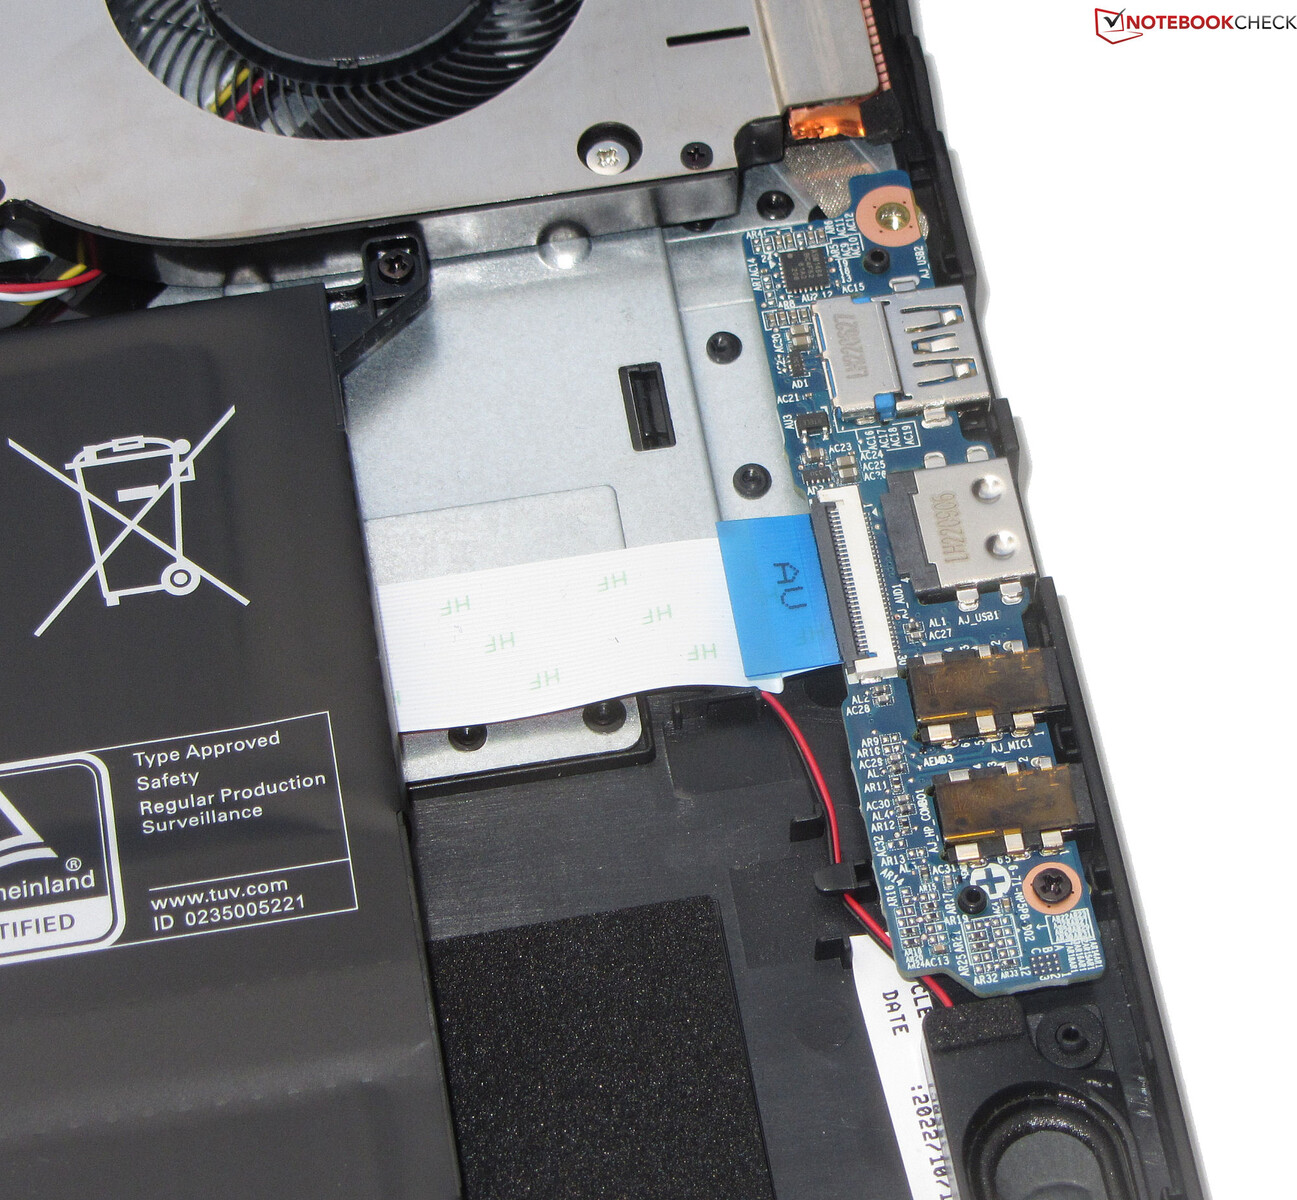
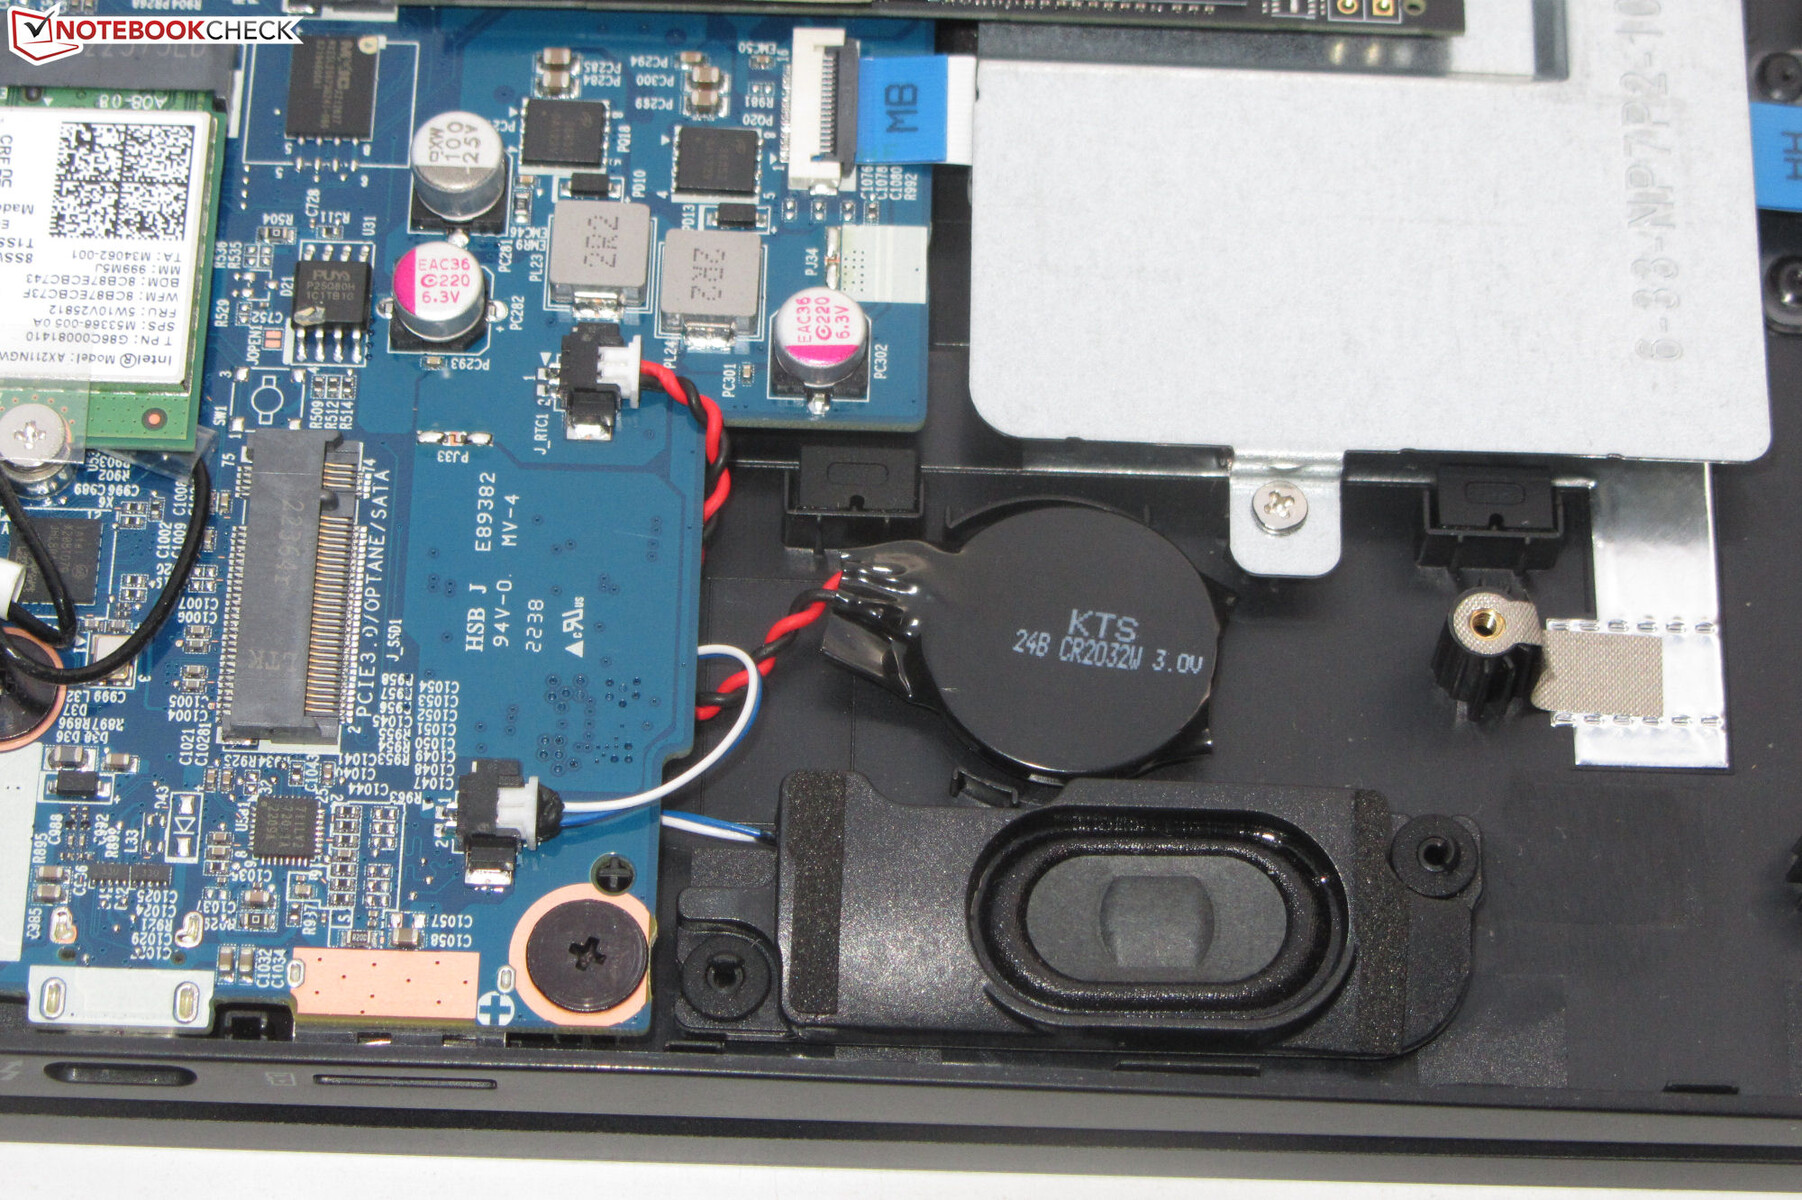
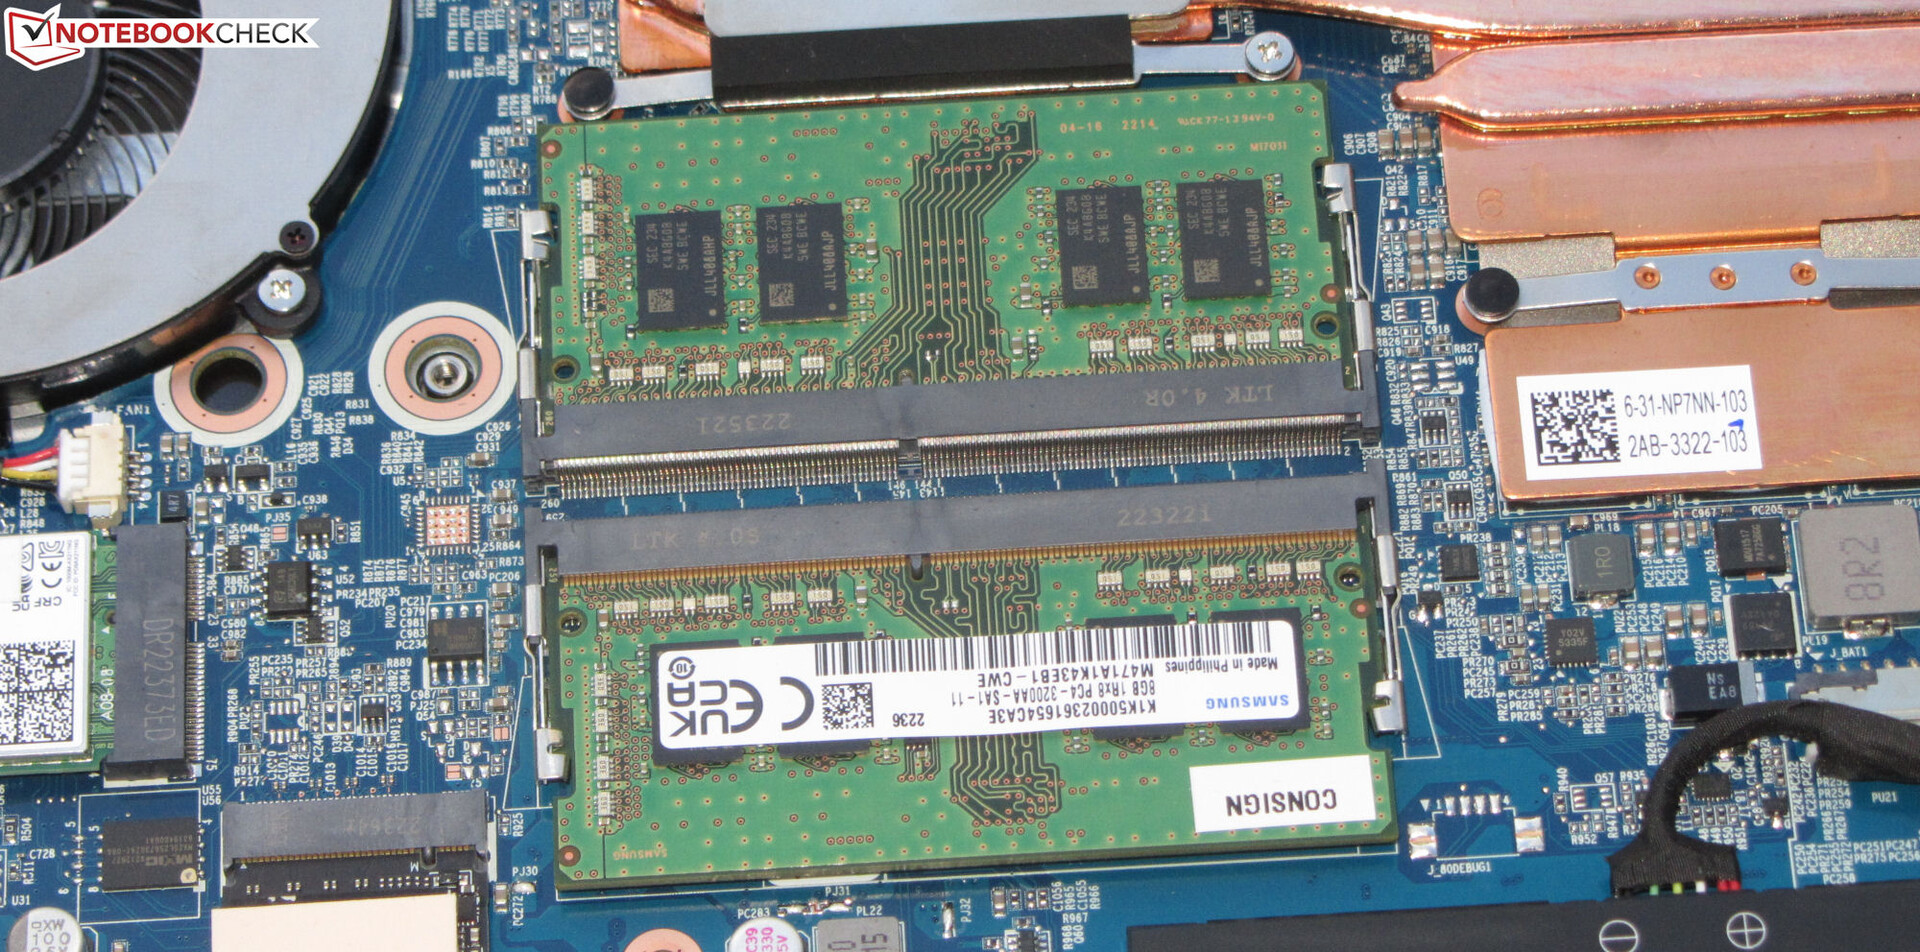
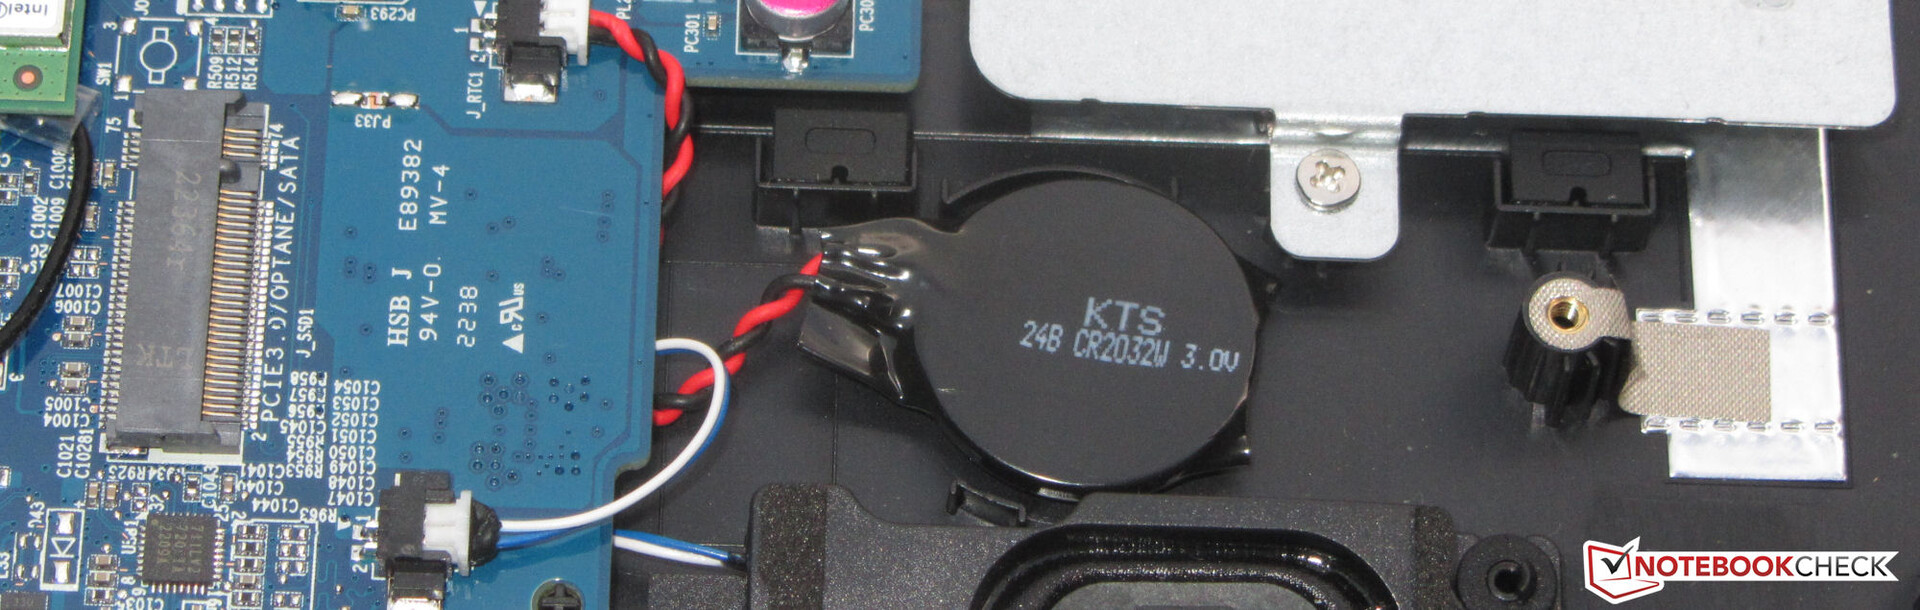
Depois de remover todos os parafusos no fundo do dispositivo, a placa inferior pode ser removida com a ajuda de uma aresta afiada - ela é fixada com muita firmeza em certas áreas, no entanto. No interior, os usuários podem acessar o SSD (PCIe 4), o slot secundário M.2 (PCIe 3), o módulo Wi-Fi, os slots de RAM (ambos em uso), a bateria BIOS, os ventiladores, e a bateria principal.
Garantia
O modelo Gigabyte de 17,3 polegadas vem com uma garantia padrão limitada de um ano. Não há atualmente extensões de garantia disponíveis.
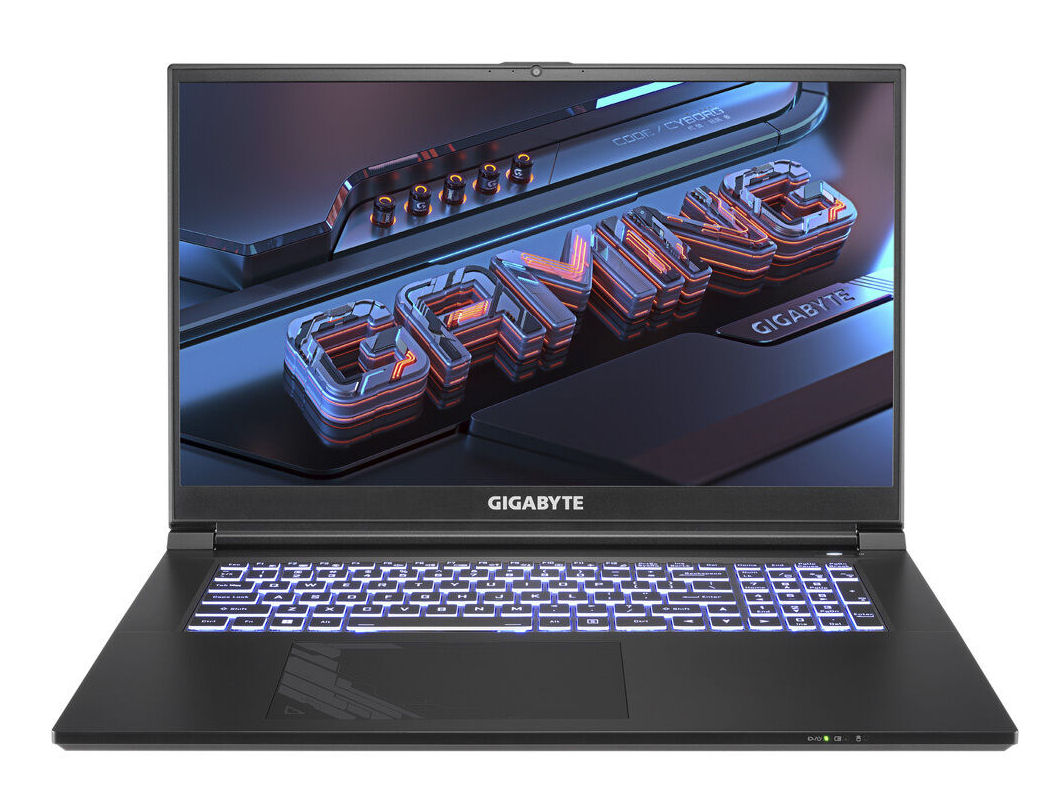
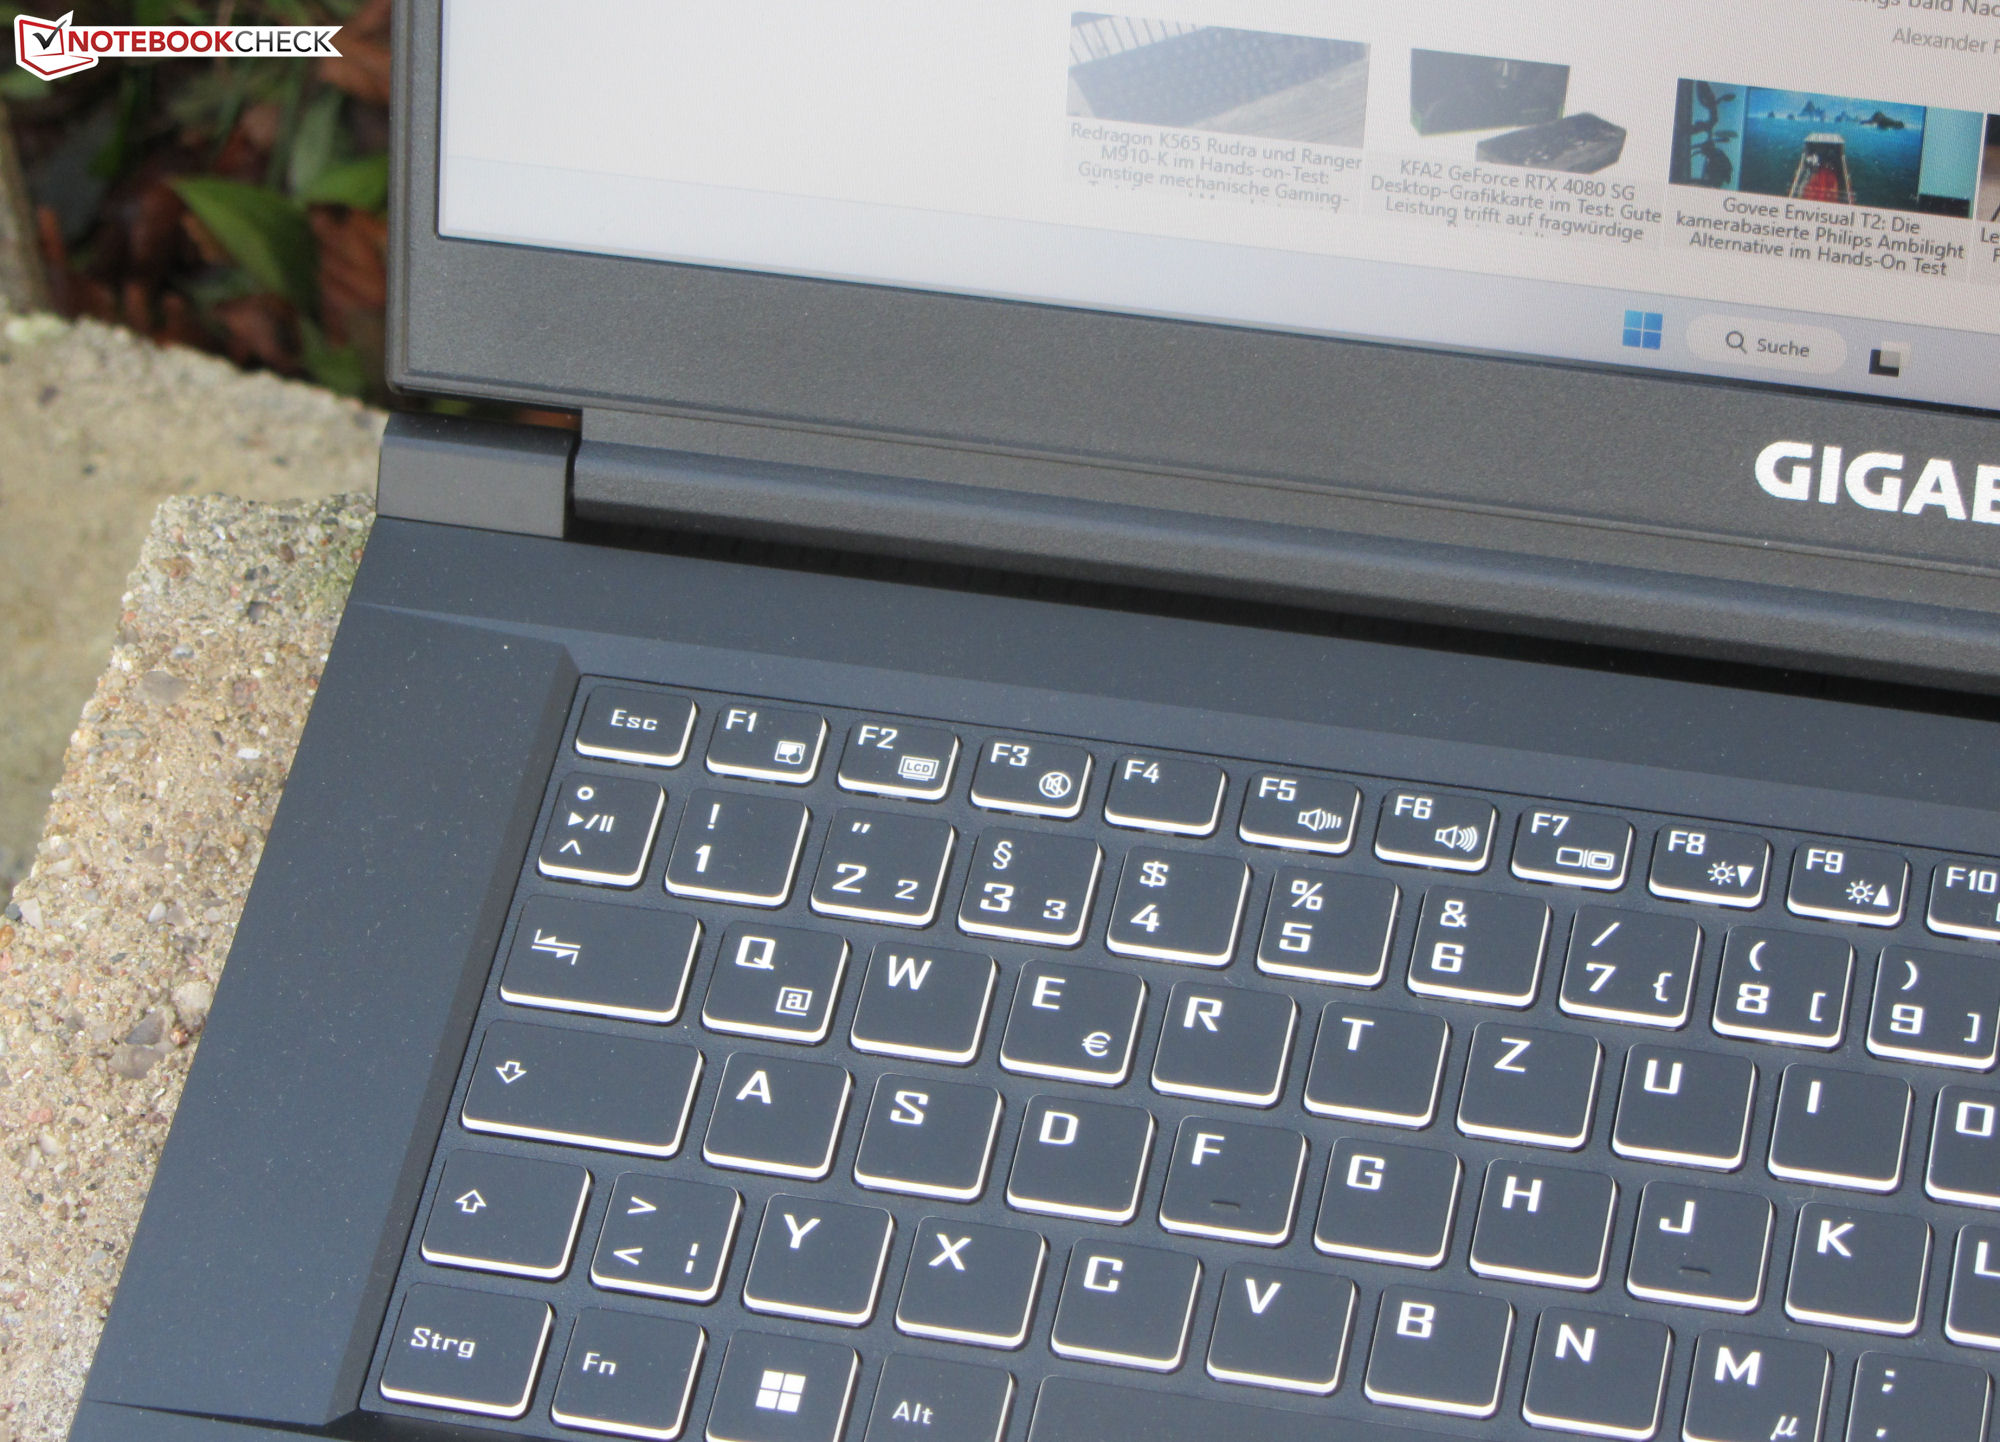
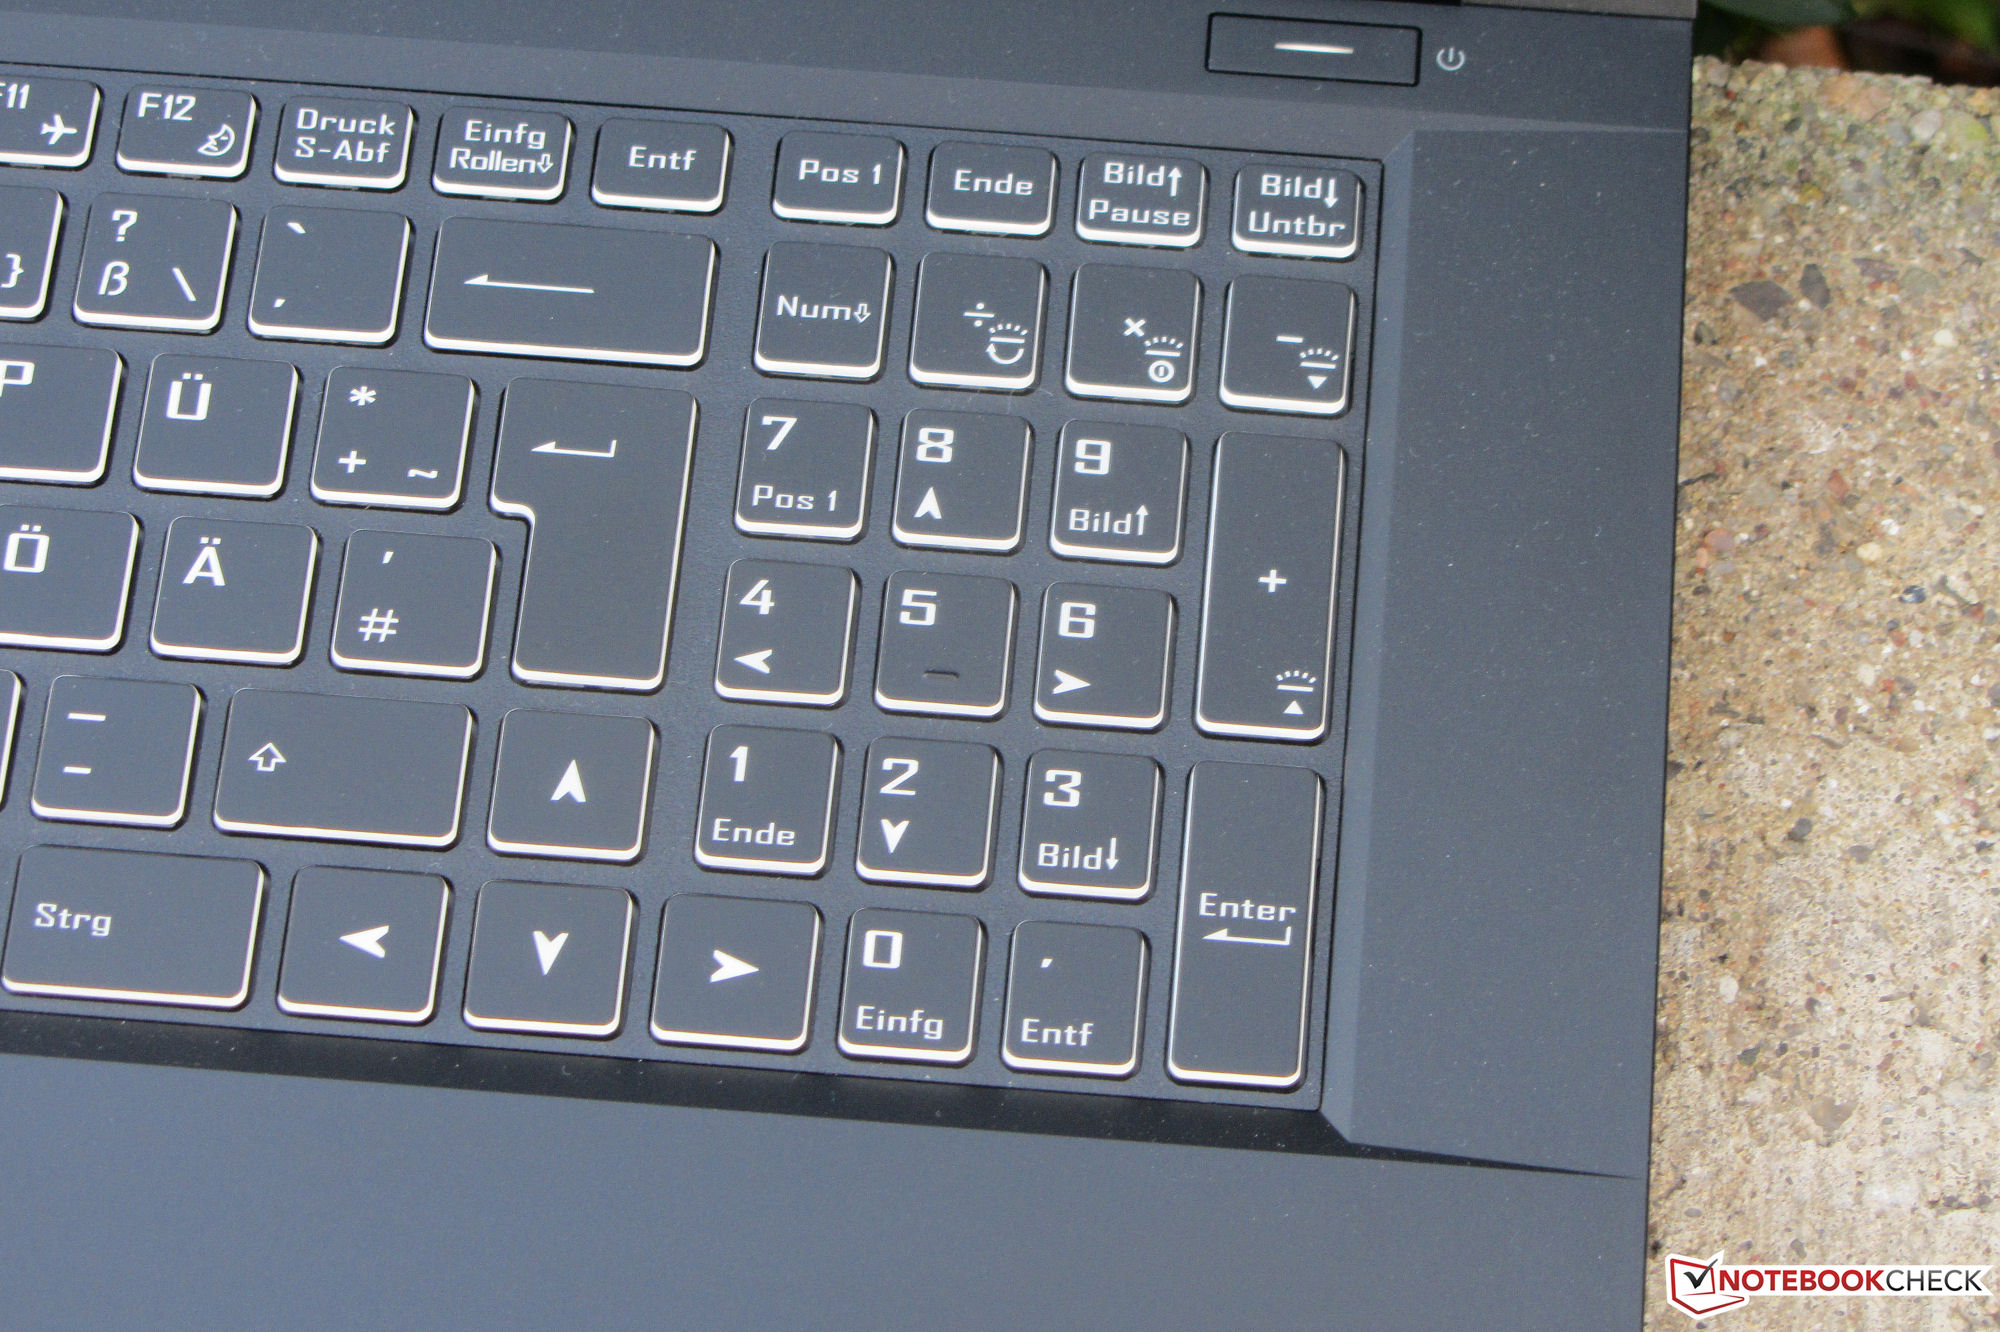
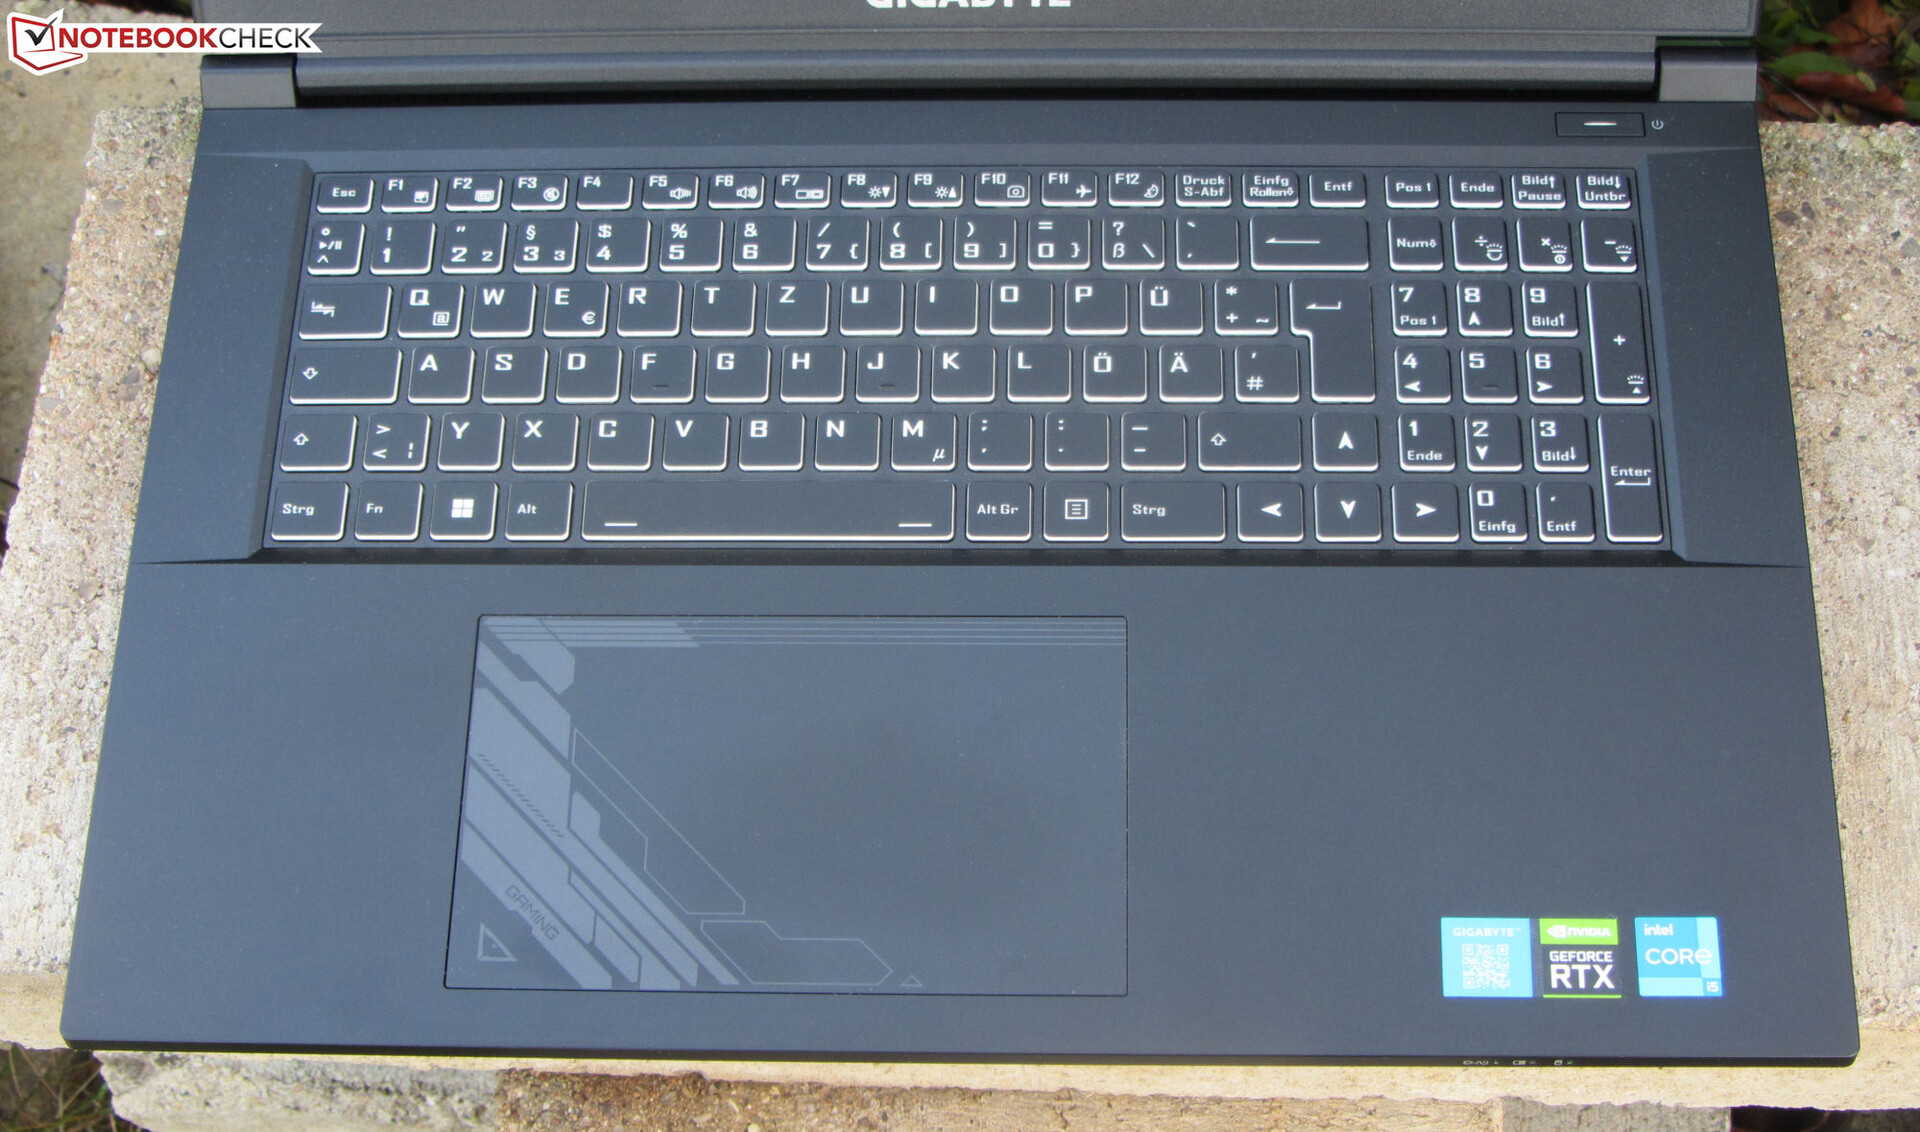
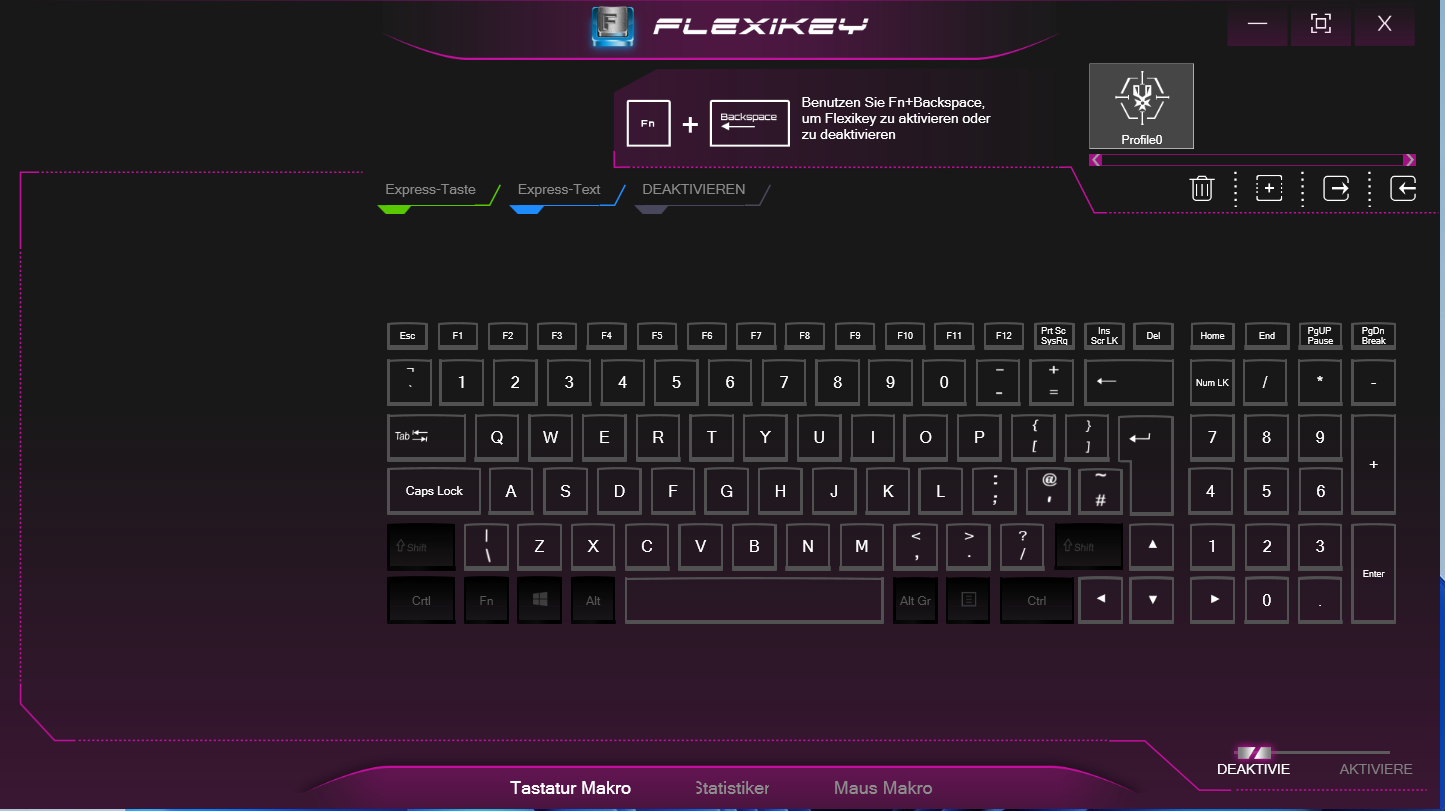
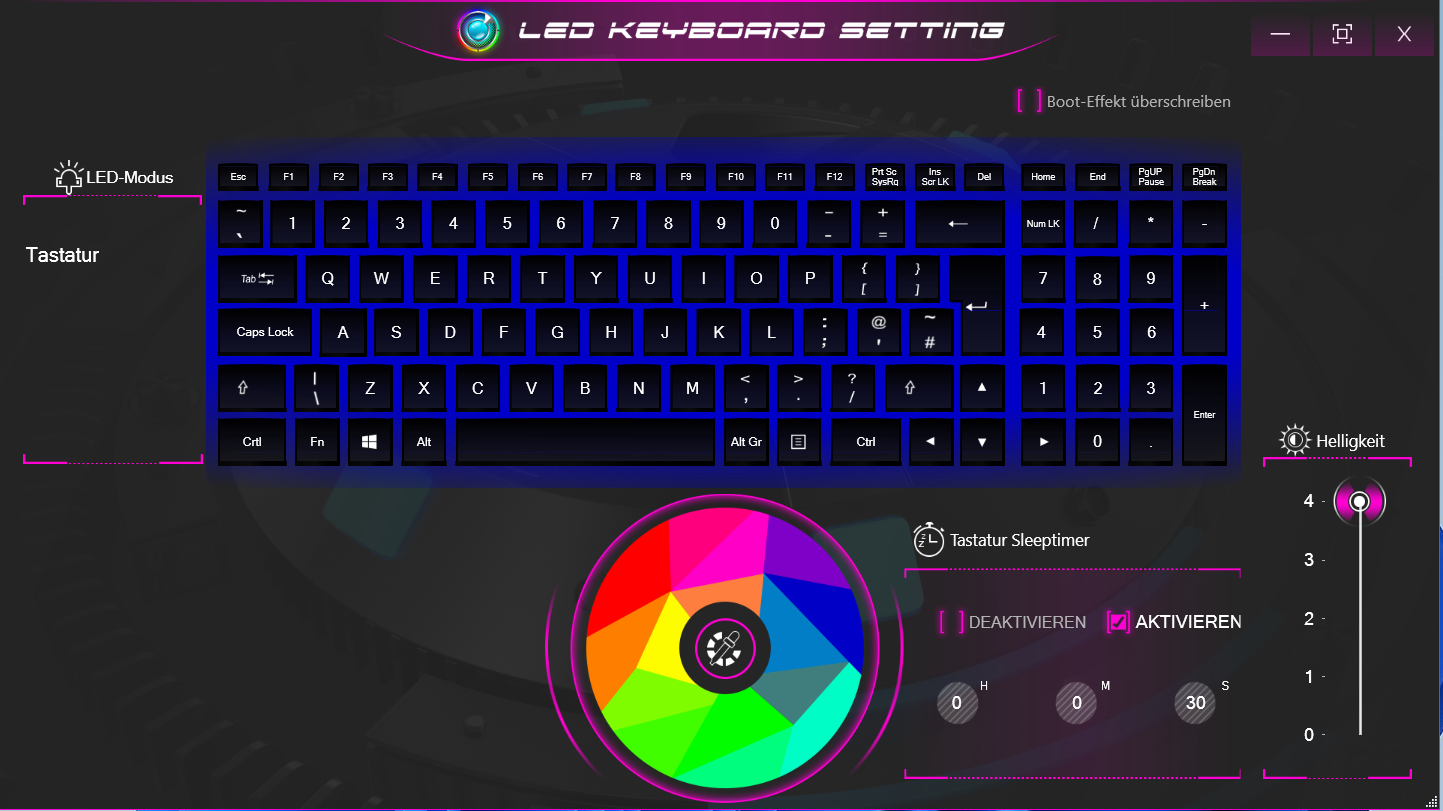
Dispositivos de entrada - Teclado com RGB Backlighting
Teclado
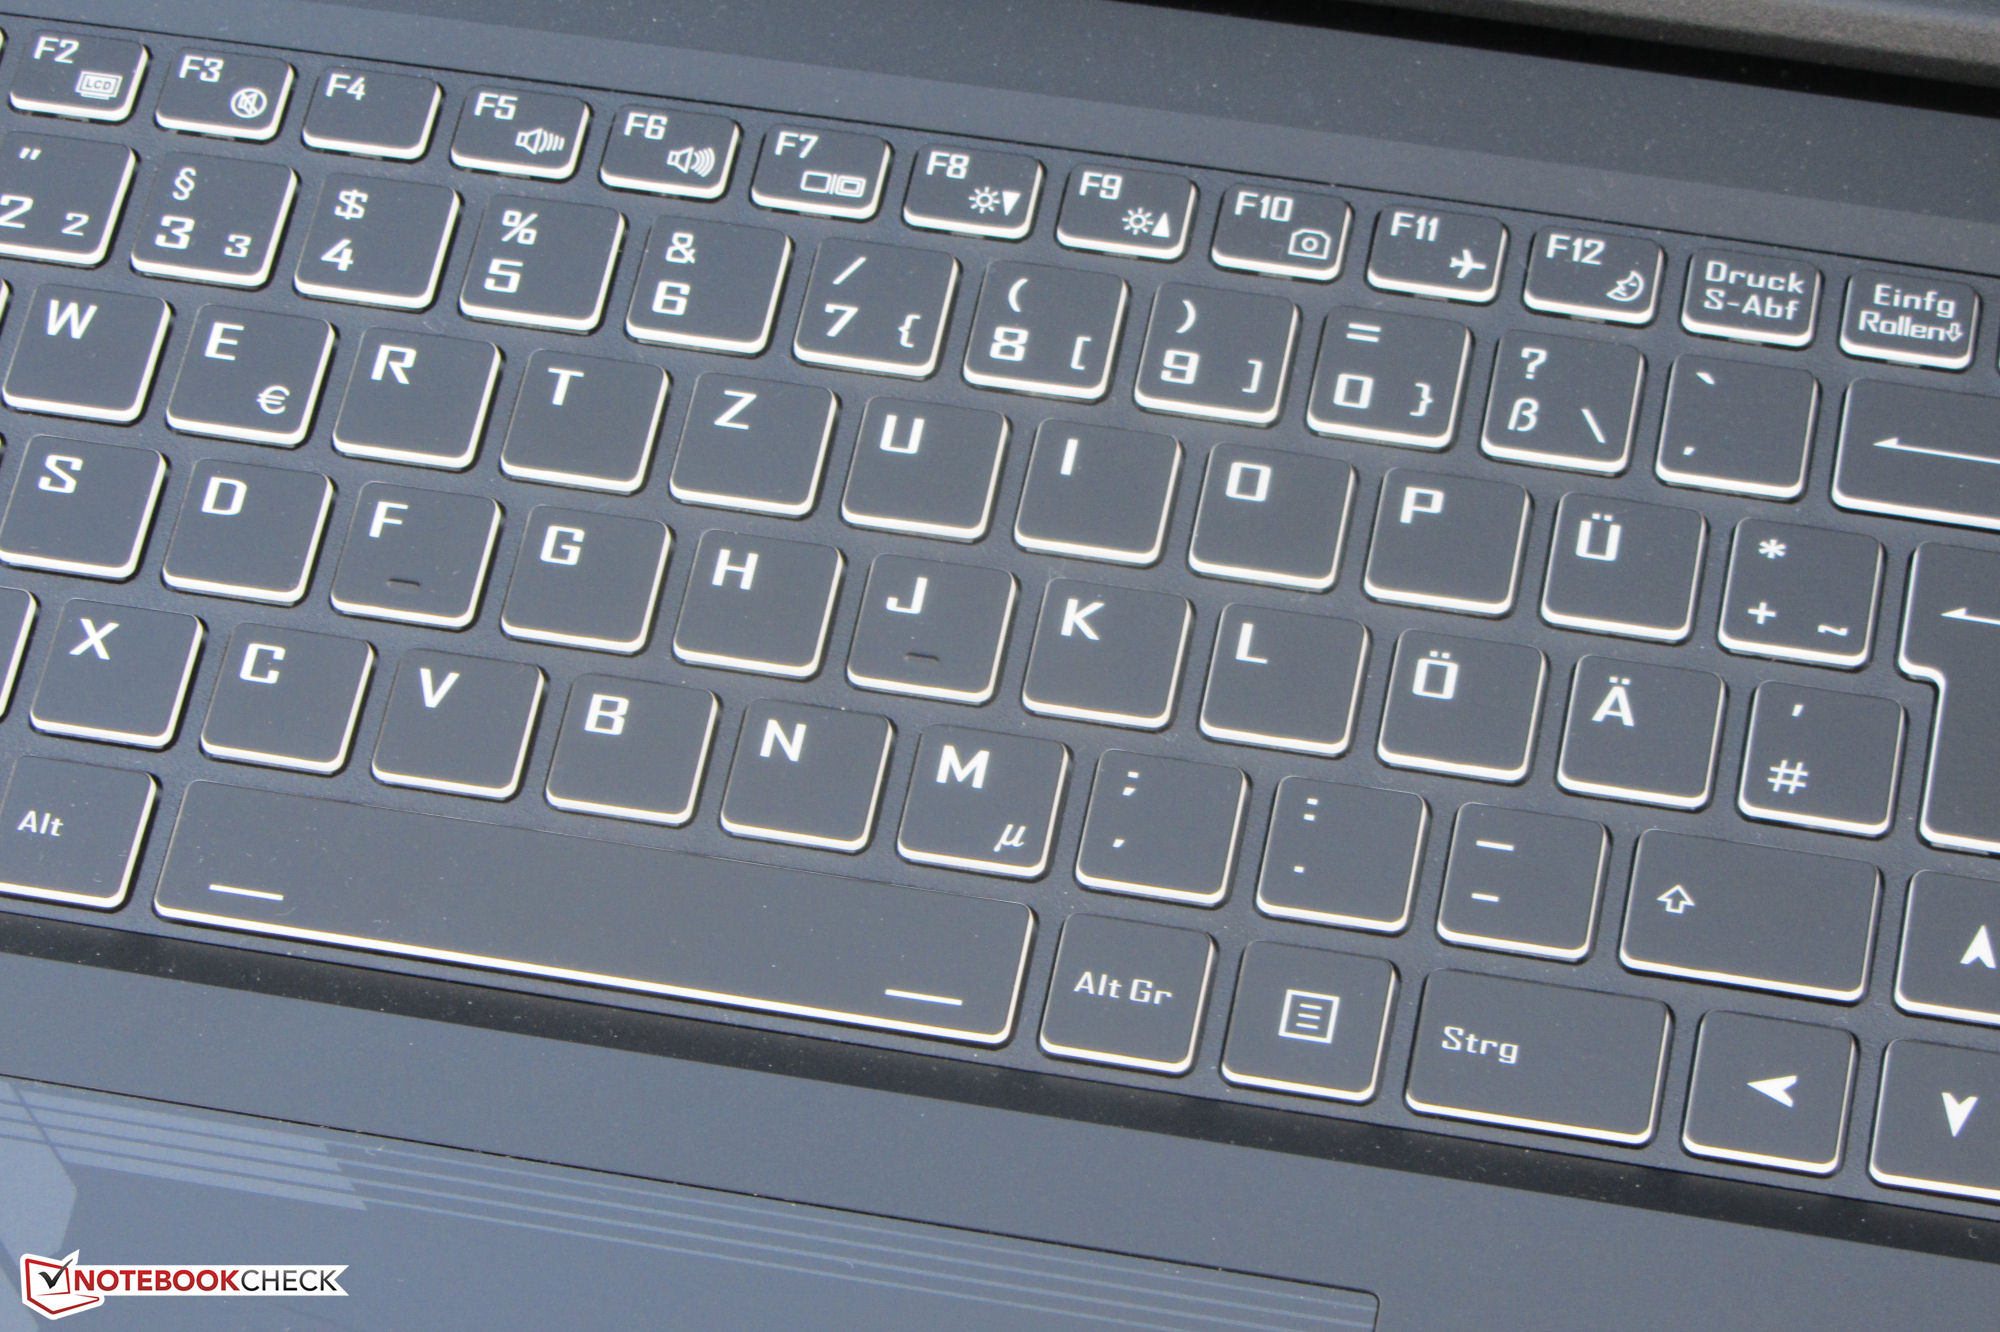
As teclas planas e suaves do teclado chiclet retroiluminado oferecem um deslocamento moderado e um ponto de atuação distinto. O feedback das teclas poderia ter sido mais firme. A área do teclado cede ligeiramente durante a digitação, embora isto não deva ser um problema na prática. Bom: O teclado usa teclas de seta de tamanho normal. A retroiluminação RGB (quatro níveis) pode ser controlada através de três teclas de função. Em geral, o Gigabyte fornece um bom teclado para o uso diário.
Touchpad
Graças ao clickpad grande, com vários toques (~ 15,2 x 9,1 cm), tecnicamente não há necessidade de um mouse externo, uma vez que a superfície lisa oferece boas propriedades de deslizamento. Ele é responsivo até os cantos. O touchpad tem curso curto e um ponto de atuação distinto.
Visor - IPS 300-Hz
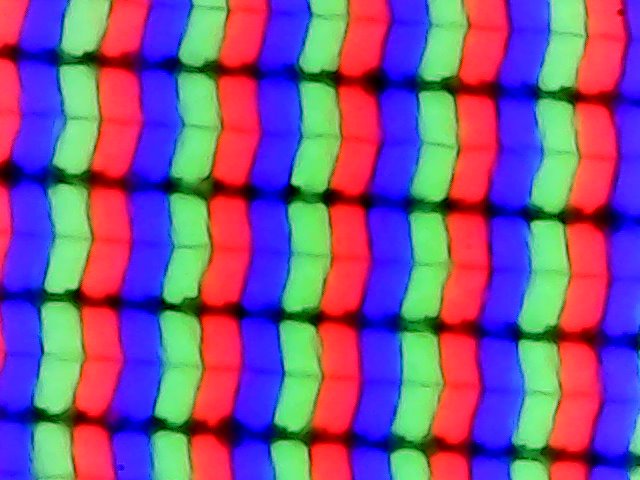
Gigabyte cabe no G7 com uma tela mate de 17,3 polegadas (1920 x 1080 pixels). O brilho (300 lêndeas) e a relação de contraste (1535:1) do painel responsivo 300-Hz atendem e superam nossas expectativas (>300 lêndeas e 1000:1). Além disso, a tela não sofre com a tremulação do PWM em nenhum nível de luminosidade.
| |||||||||||||||||||||||||
iluminação: 93 %
iluminação com acumulador: 307 cd/m²
Contraste: 1535:1 (Preto: 0.2 cd/m²)
ΔE ColorChecker Calman: 1.32 | ∀{0.5-29.43 Ø4.72}
calibrated: 1.03
ΔE Greyscale Calman: 2.1 | ∀{0.09-98 Ø4.97}
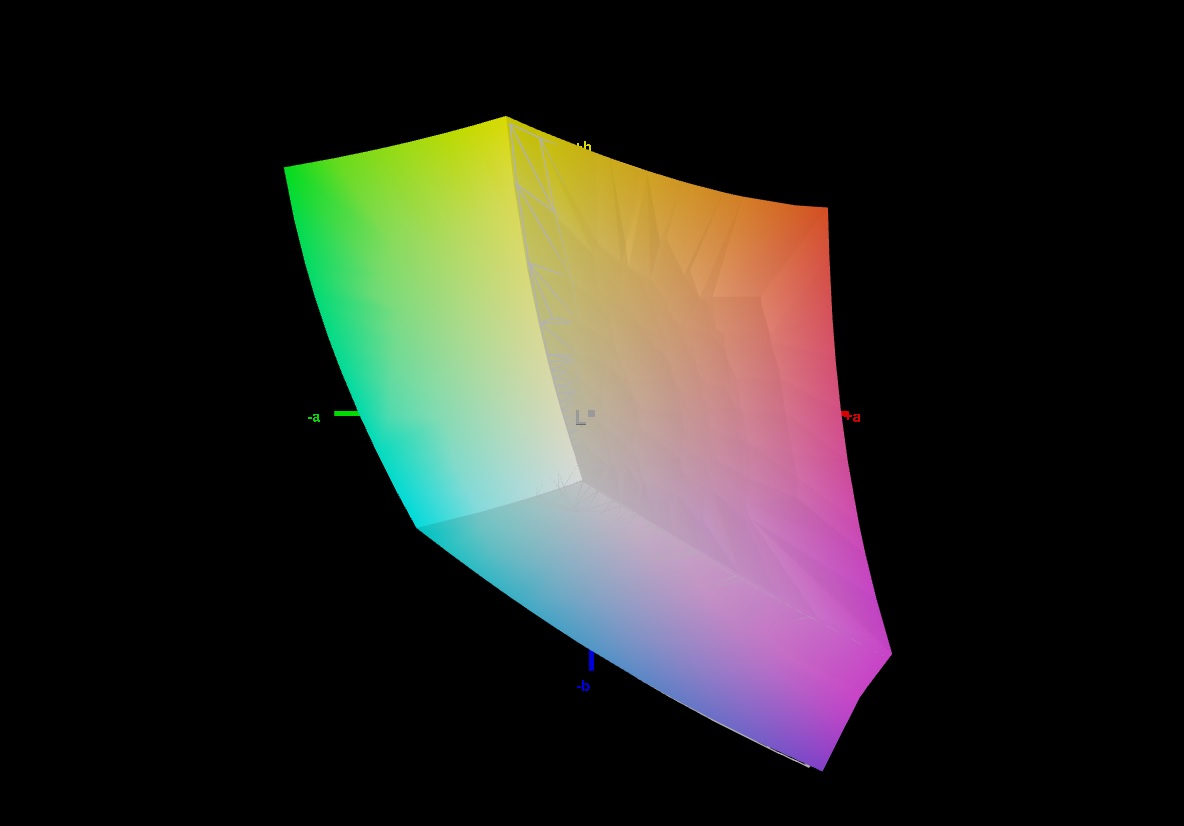
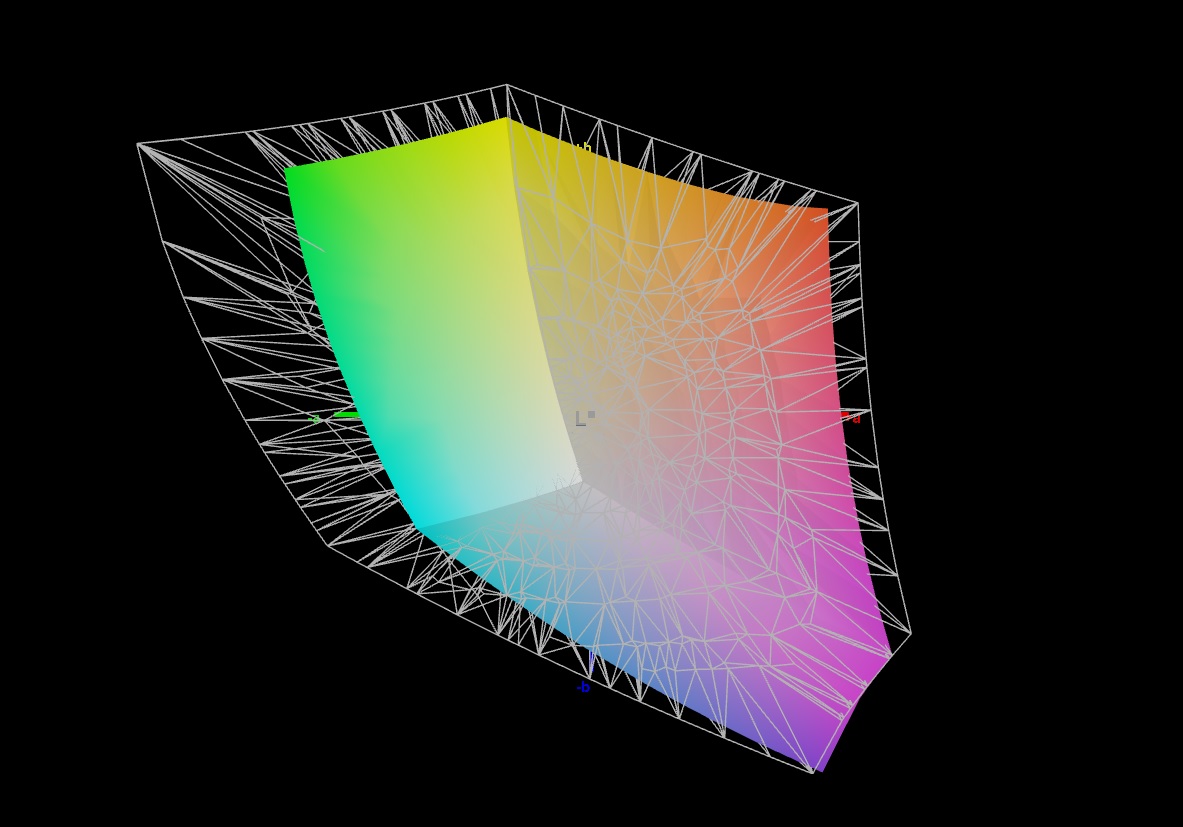
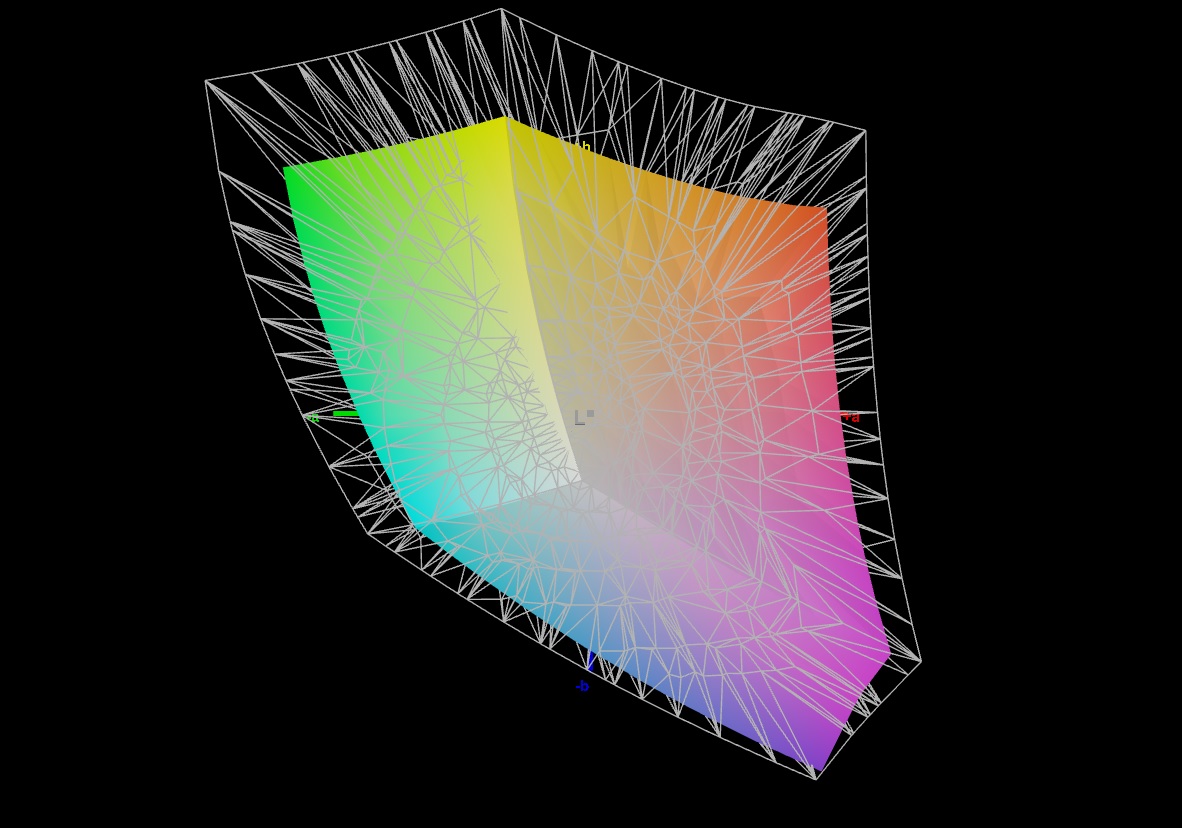
71.7% AdobeRGB 1998 (Argyll 3D)
99.8% sRGB (Argyll 3D)
70.4% Display P3 (Argyll 3D)
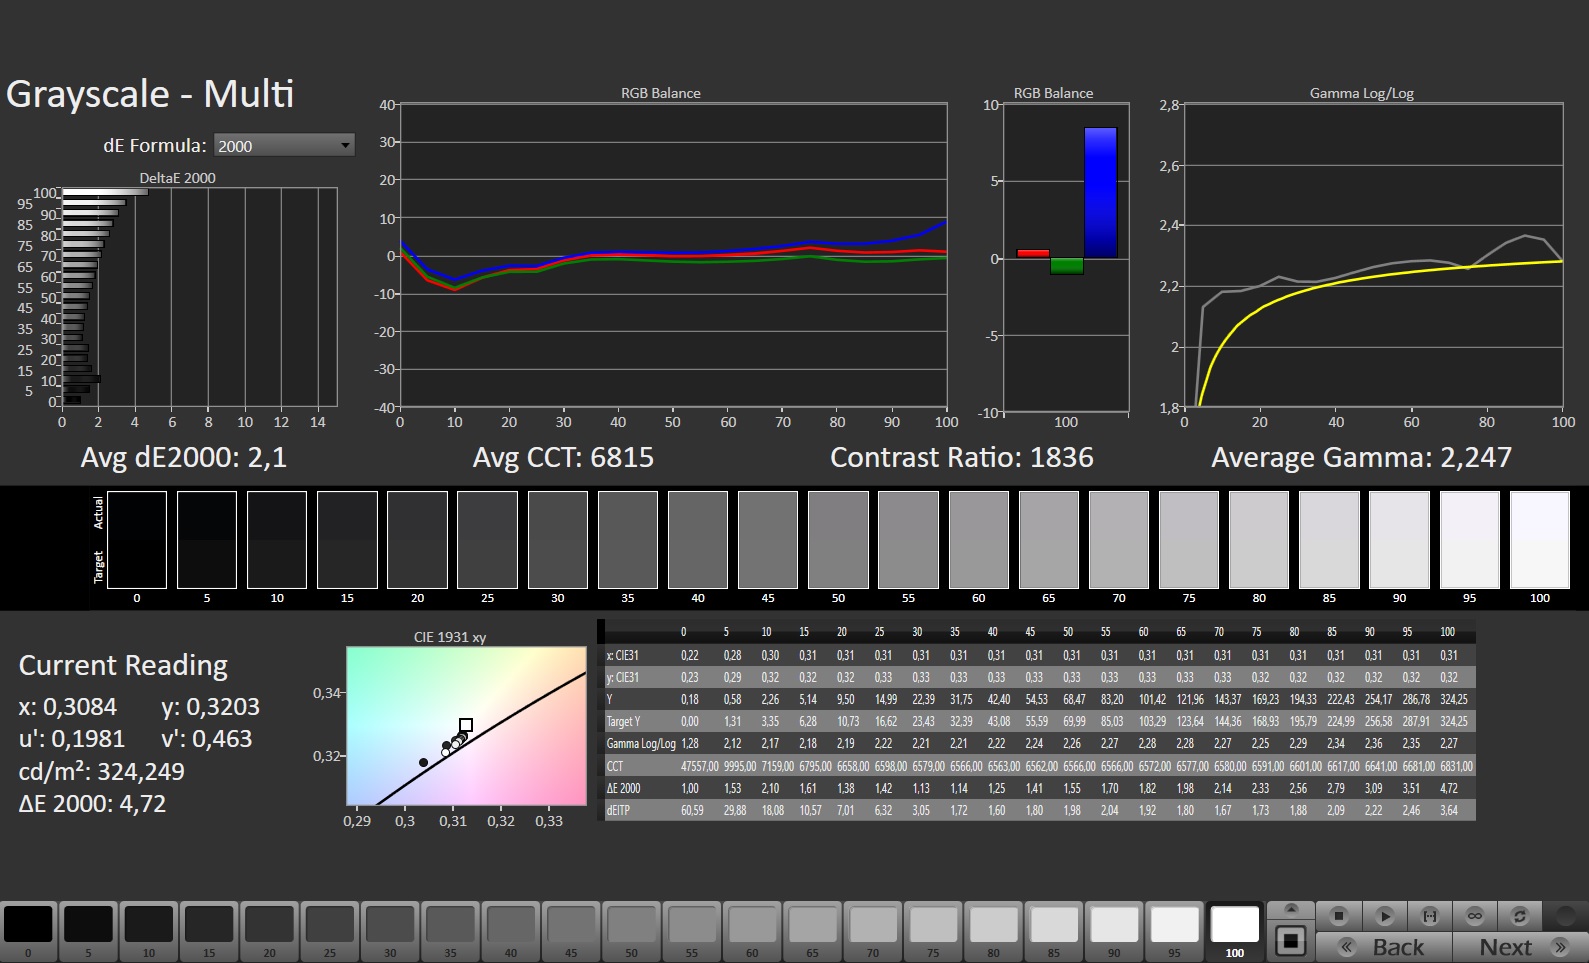
Gamma: 2.247
CCT: 6815 K
| Gigabyte G7 KE AU Optronics B173HAN05.1, IPS, 1920x1080, 17.3" | HP Pavilion Gaming 17-cd2146ng LGD0611, IPS, 1920x1080, 17.3" | Acer Nitro 5 AN517-55-738R B173HAN04.0, IPS, 1920x1080, 17.3" | Asus TUF Gaming F17 FX707Z-HX011W AU Optronics B173HAN04.9 (AUO4B9D), IPS, 1920x1080, 17.3" | Lenovo IdeaPad Gaming 3 15IAH7 Lenovo LEN156FHD, IPS, 1920x1080, 15.6" | |
|---|---|---|---|---|---|
| Display | -6% | -15% | -42% | -2% | |
| Display P3 Coverage (%) | 70.4 | 64.8 -8% | 58.9 -16% | 40.2 -43% | 69.1 -2% |
| sRGB Coverage (%) | 99.8 | 96.8 -3% | 86.4 -13% | 59.7 -40% | 99.2 -1% |
| AdobeRGB 1998 Coverage (%) | 71.7 | 66.5 -7% | 60.5 -16% | 41.5 -42% | 69.9 -3% |
| Response Times | -80% | -8% | -471% | -81% | |
| Response Time Grey 50% / Grey 80% * (ms) | 5 ? | 12.7 ? -154% | 6 ? -20% | 39.2 ? -684% | 13 ? -160% |
| Response Time Black / White * (ms) | 8.3 ? | 8.7 ? -5% | 8 ? 4% | 29.6 ? -257% | 8.4 ? -1% |
| PWM Frequency (Hz) | |||||
| Screen | -44% | -59% | -97% | -46% | |
| Brightness middle (cd/m²) | 307 | 328 7% | 286 -7% | 287 -7% | 338 10% |
| Brightness (cd/m²) | 301 | 317 5% | 278 -8% | 268 -11% | 329 9% |
| Brightness Distribution (%) | 93 | 94 1% | 89 -4% | 89 -4% | 92 -1% |
| Black Level * (cd/m²) | 0.2 | 0.23 -15% | 0.32 -60% | 0.17 15% | 0.27 -35% |
| Contrast (:1) | 1535 | 1426 -7% | 894 -42% | 1688 10% | 1252 -18% |
| Colorchecker dE 2000 * | 1.32 | 3.83 -190% | 3.05 -131% | 5.1 -286% | 2.88 -118% |
| Colorchecker dE 2000 max. * | 4.6 | 8.51 -85% | 5.83 -27% | 8.72 -90% | 9.35 -103% |
| Colorchecker dE 2000 calibrated * | 1.03 | 0.83 19% | 3.13 -204% | 5.1 -395% | 1.22 -18% |
| Greyscale dE 2000 * | 2.1 | 4.9 -133% | 3.17 -51% | 4.24 -102% | 5 -138% |
| Gamma | 2.247 98% | 2.177 101% | 2.29 96% | 2.44 90% | 2.162 102% |
| CCT | 6815 95% | 7881 82% | 6916 94% | 6008 108% | 7497 87% |
| Média Total (Programa/Configurações) | -43% /
-41% | -27% /
-43% | -203% /
-138% | -43% /
-41% |
* ... menor é melhor
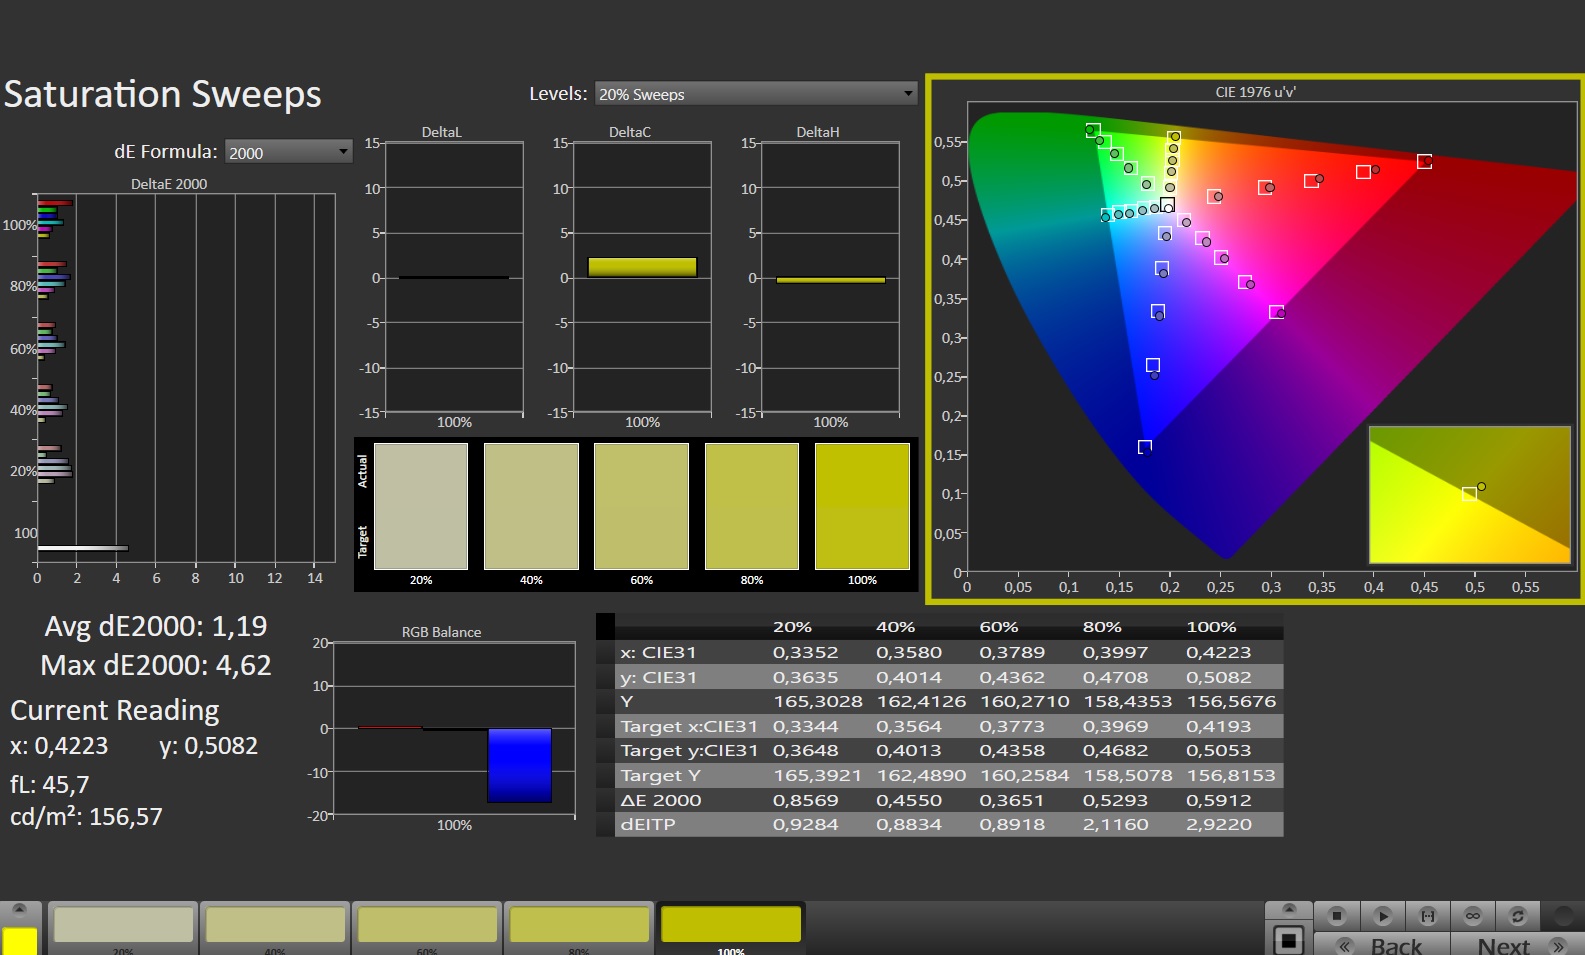
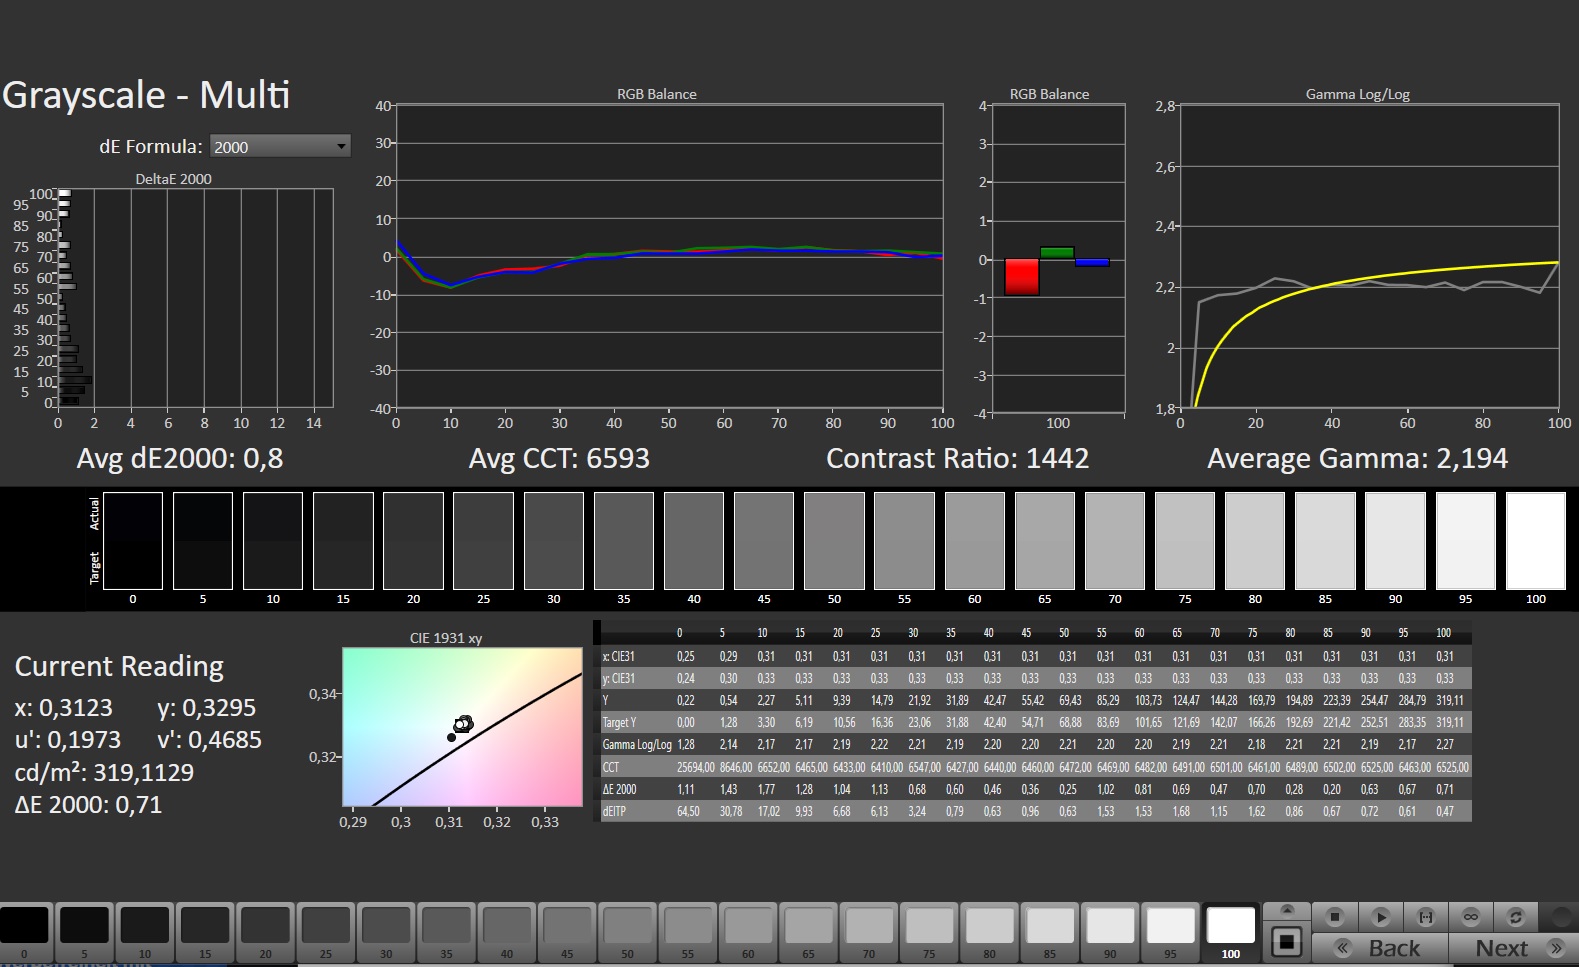
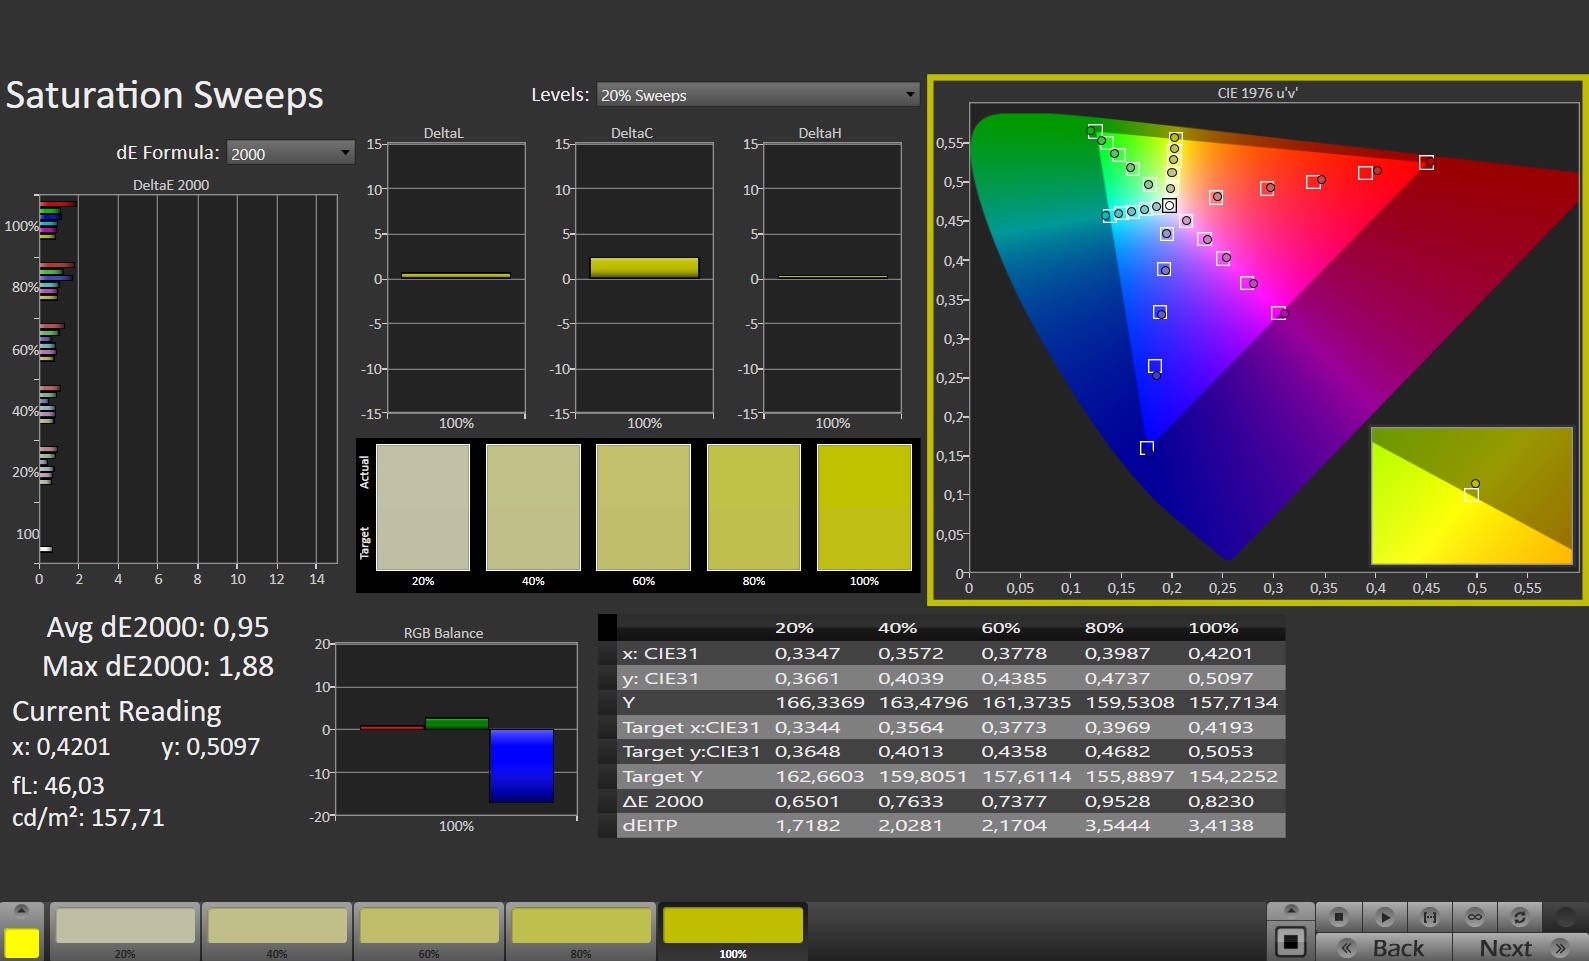
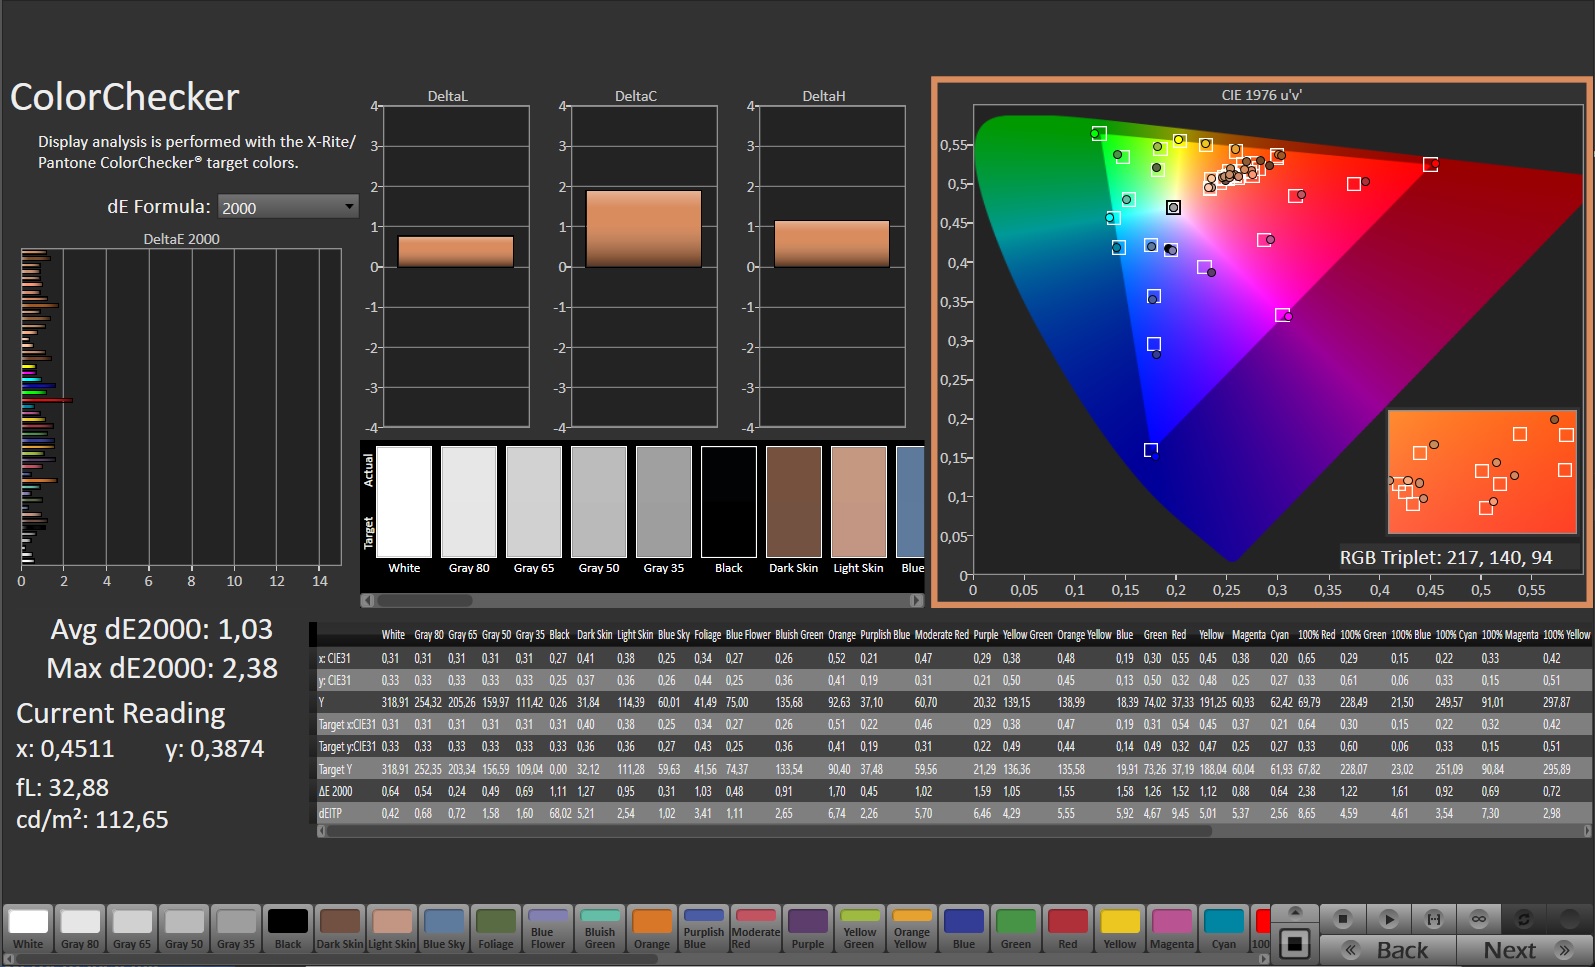
A precisão da cor do display é muito boa ex-fábrica: Com um desvio de 1,32, ele se enquadra confortavelmente na faixa ideal (deltaE < 3). Após calibrarmos nós mesmos o display, o desvio cai para 1,03 para uma representação ainda mais precisa da escala de cinza. O display é capaz de reproduzir todo o espaço de cor sRGB (100%), enquanto que os espaços de cor AdobeRGB (72%) e DCI-P3 (70%) não podem ser exibidos em sua totalidade. Estes resultados são semelhantes aos da maioria dos concorrentes.

Exibir tempos de resposta
| ↔ Tempo de resposta preto para branco | ||
|---|---|---|
| 8.3 ms ... ascensão ↗ e queda ↘ combinadas | ↗ 4.2 ms ascensão | 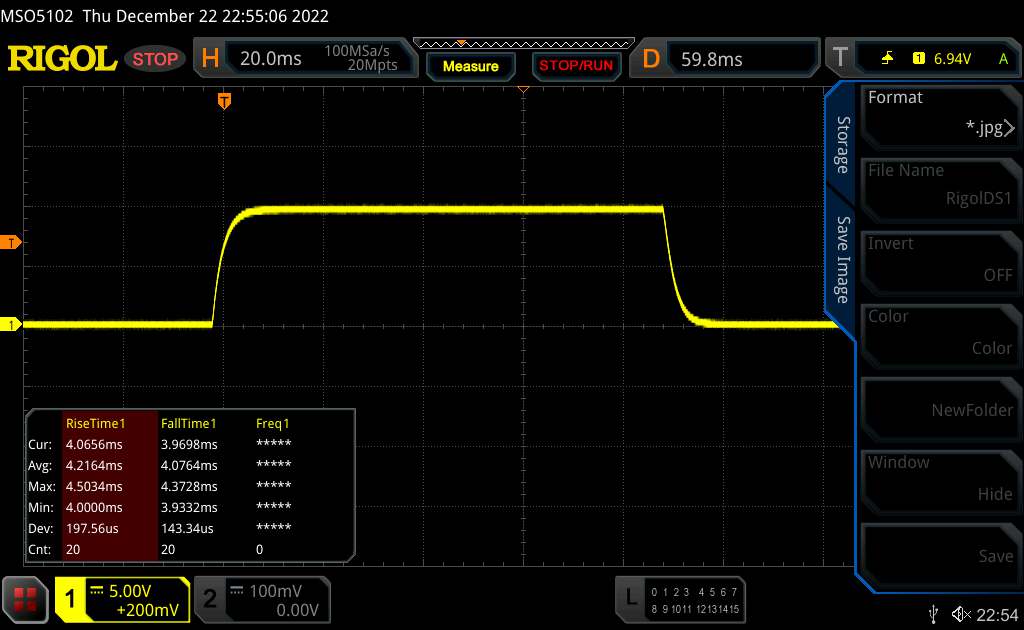 |
| ↘ 4.1 ms queda | ||
| A tela mostra taxas de resposta rápidas em nossos testes e deve ser adequada para jogos. Em comparação, todos os dispositivos testados variam de 0.1 (mínimo) a 240 (máximo) ms. » 24 % de todos os dispositivos são melhores. Isso significa que o tempo de resposta medido é melhor que a média de todos os dispositivos testados (19.8 ms). | ||
| ↔ Tempo de resposta 50% cinza a 80% cinza | ||
| 5 ms ... ascensão ↗ e queda ↘ combinadas | ↗ 2.1 ms ascensão | 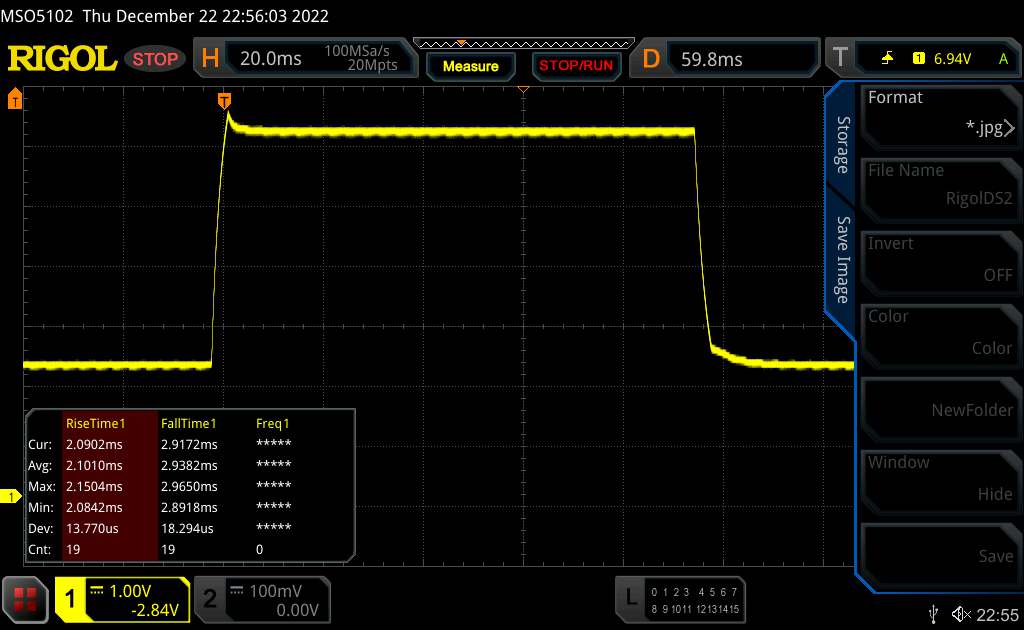 |
| ↘ 2.9 ms queda | ||
| A tela mostra taxas de resposta muito rápidas em nossos testes e deve ser muito adequada para jogos em ritmo acelerado. Em comparação, todos os dispositivos testados variam de 0.165 (mínimo) a 636 (máximo) ms. » 17 % de todos os dispositivos são melhores. Isso significa que o tempo de resposta medido é melhor que a média de todos os dispositivos testados (31 ms). | ||
Cintilação da tela / PWM (modulação por largura de pulso)
| Tela tremeluzindo / PWM não detectado | 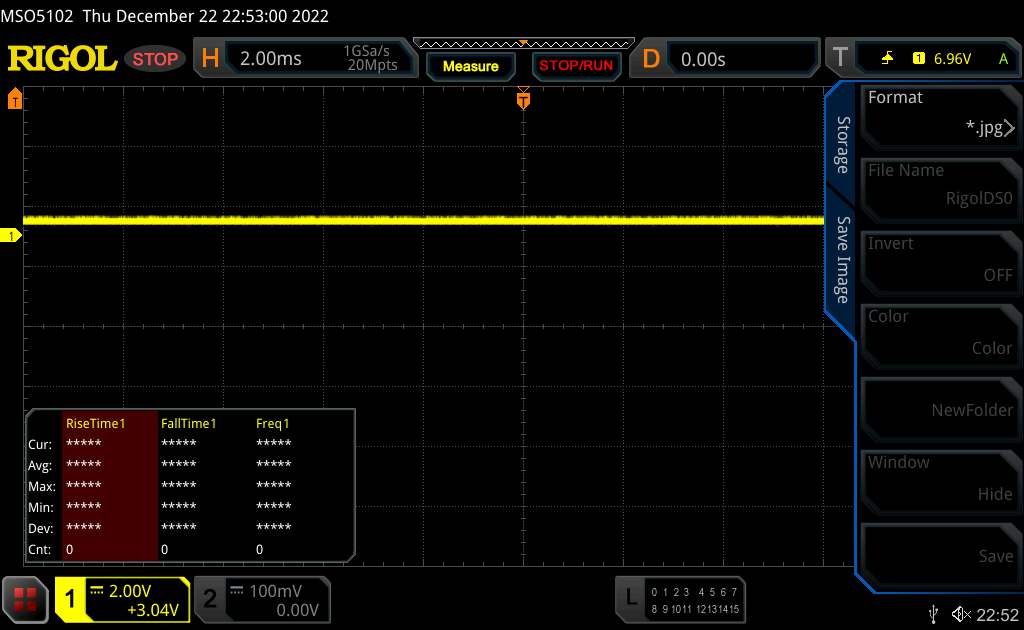 | ||
[pwm_comparison] Em comparação: 52 % de todos os dispositivos testados não usam PWM para escurecer a tela. Se PWM foi detectado, uma média de 7763 (mínimo: 5 - máximo: 343500) Hz foi medida. | |||
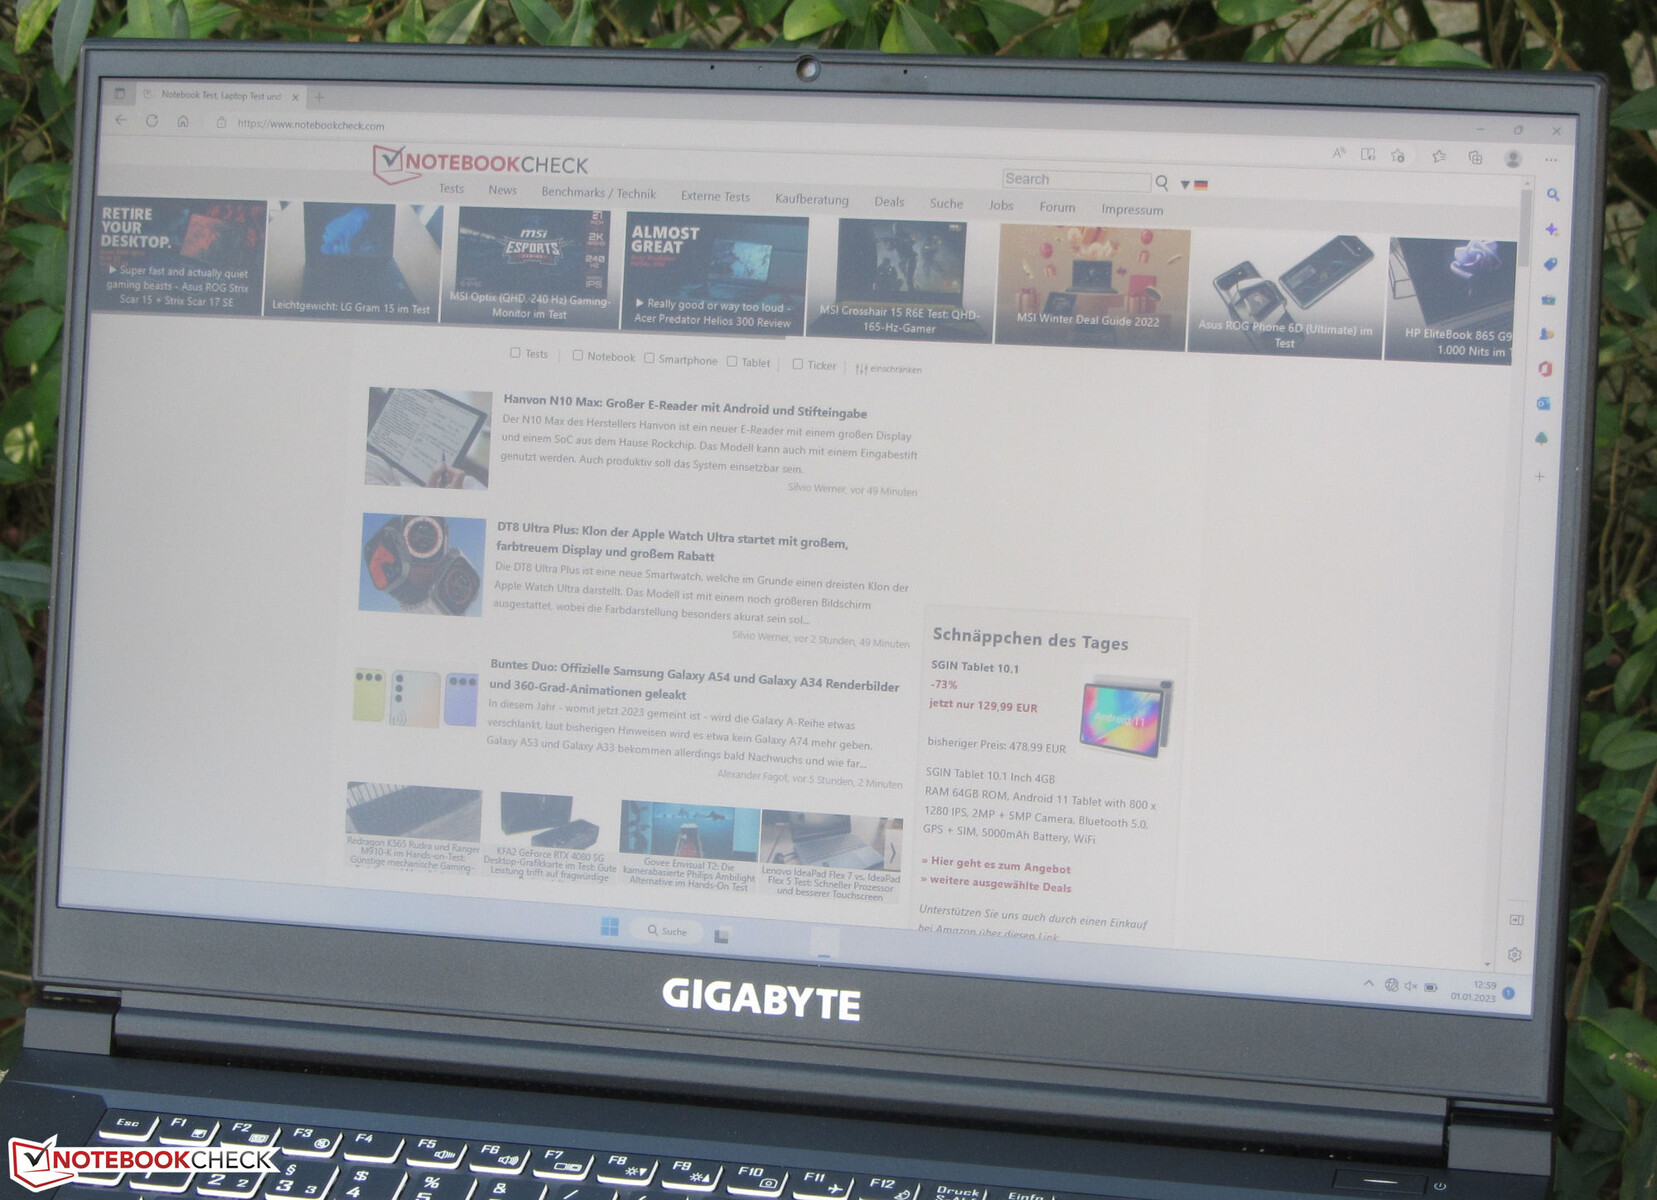
O painel IPS tem bons ângulos de visão e pode ser lido de qualquer ângulo. A leitura ao ar livre também é boa, desde que o sol não brilhe muito.

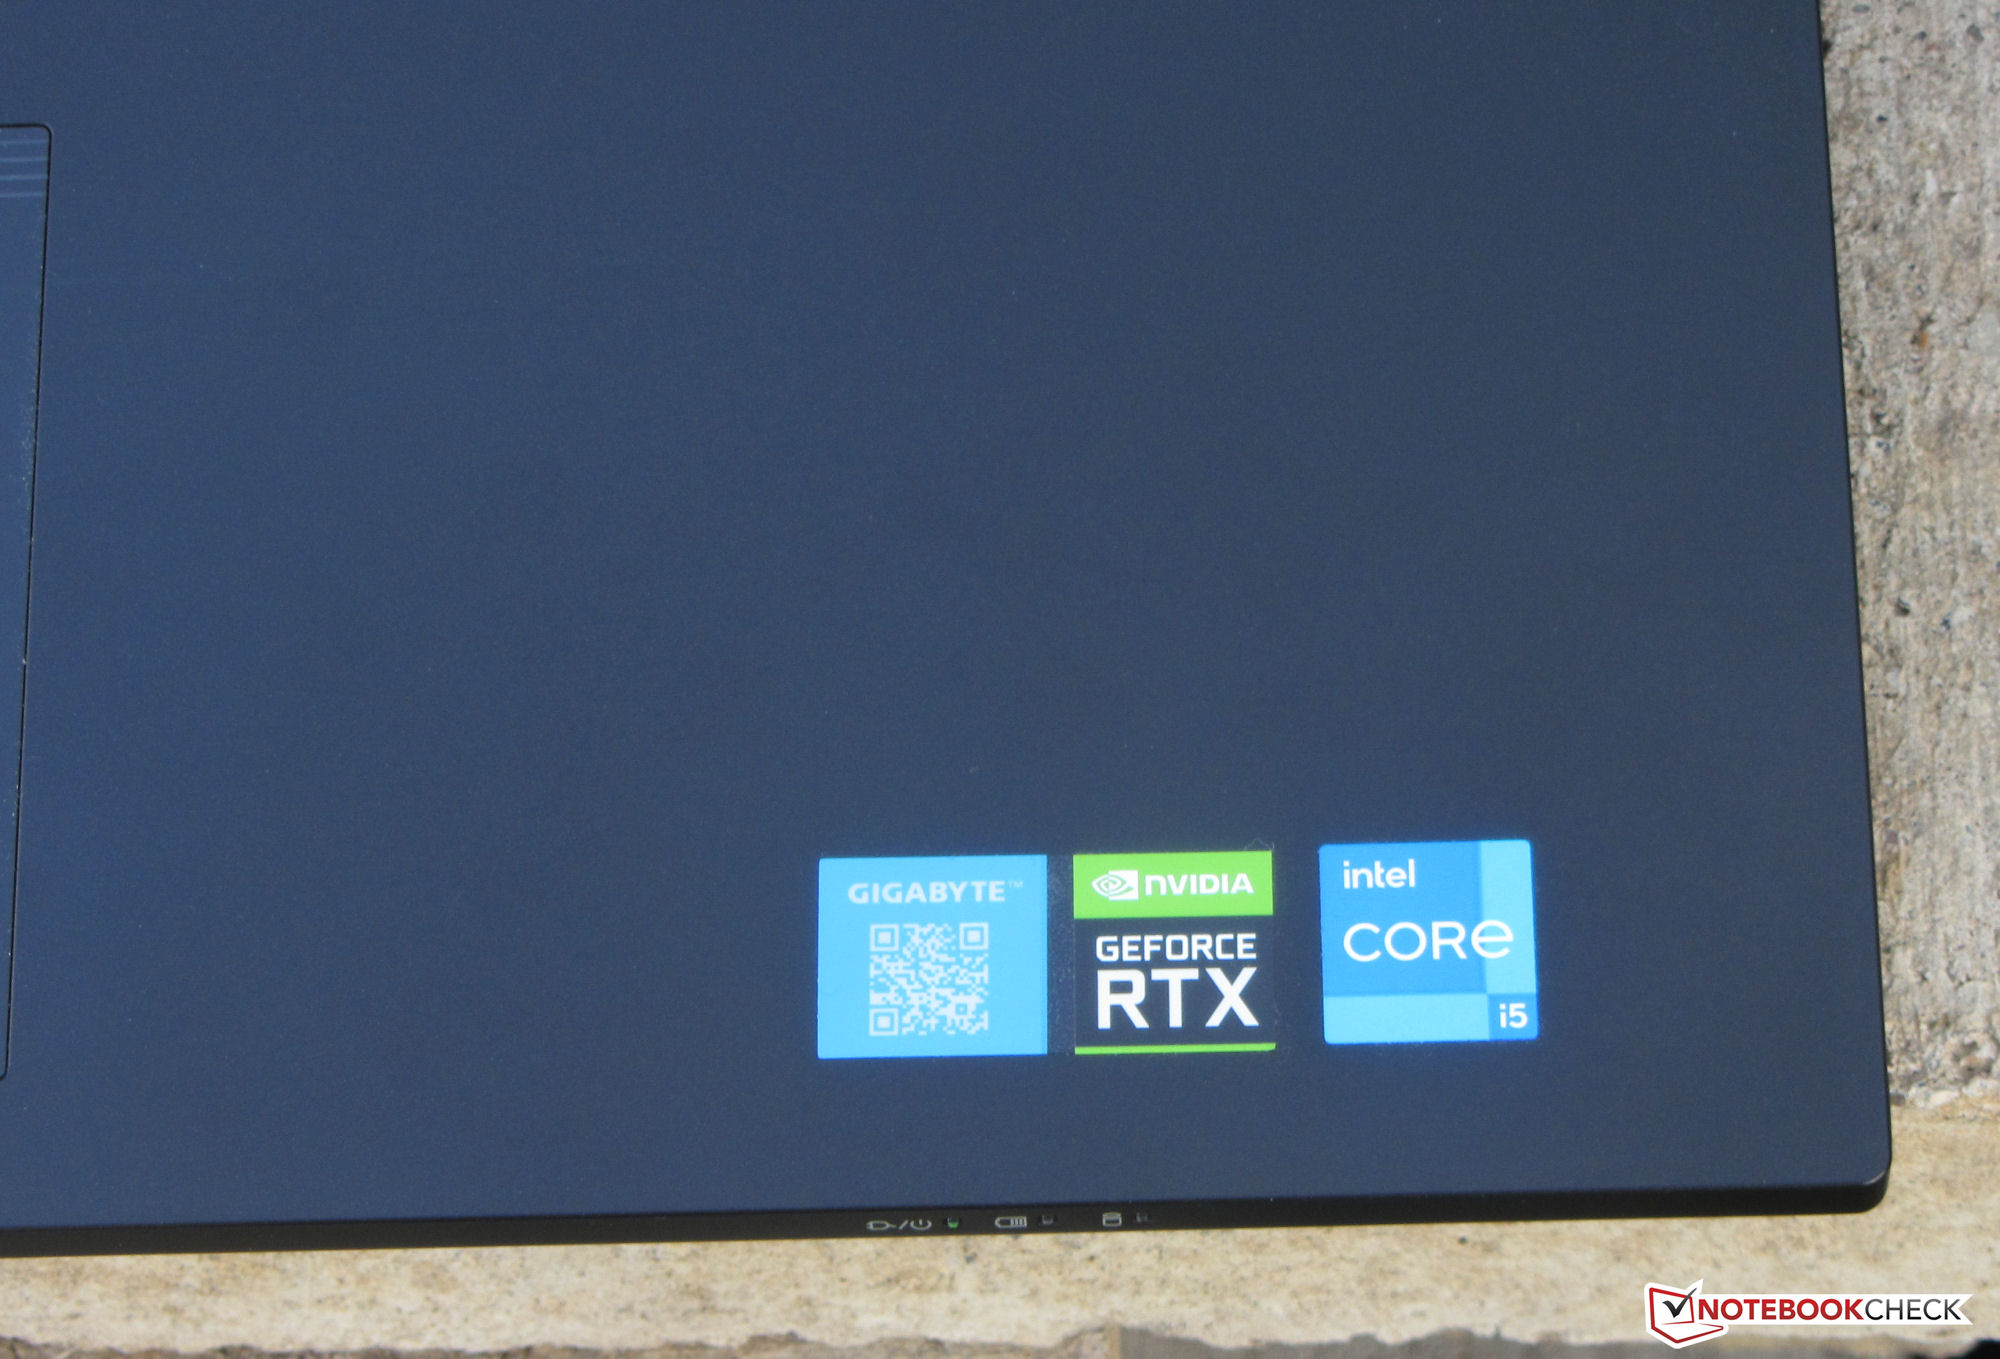
Desempenho - Gigabyte Relies on Alder Lake and Ampere
Gigabyte liefert mit dem G7 KE ein verhältnismäßig günstiges Gaming-Notebook, das auf FHD-Gaming (hohe bis maximale Settings) ausgelegt ist, aber auch in Bereichen wie Videobearbeitung und Rendering eine gute Figur abgibt.
Condições de teste
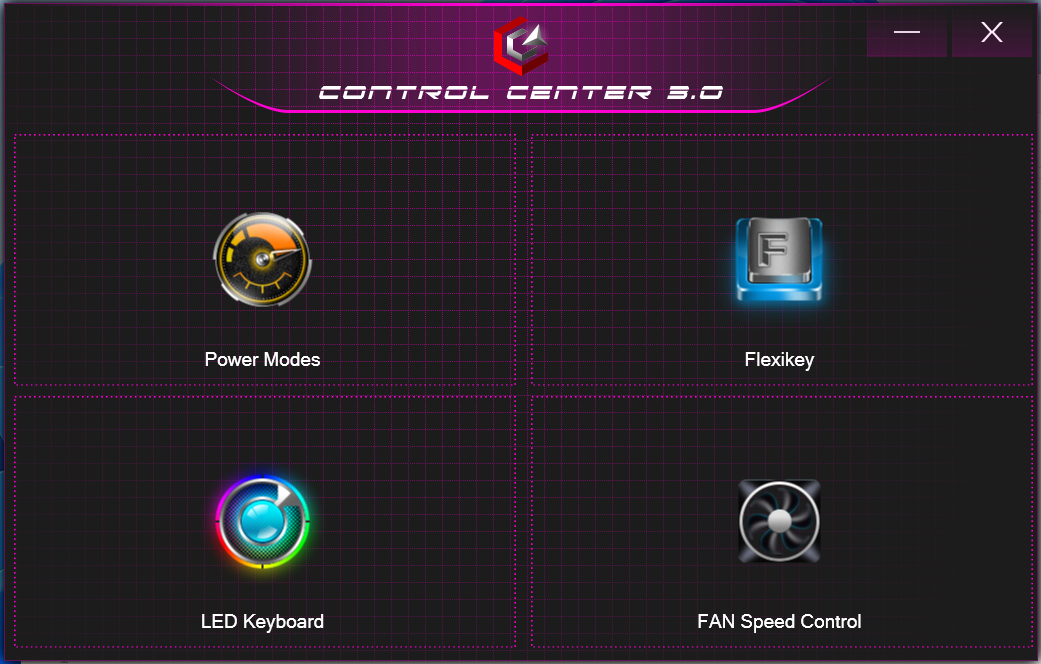
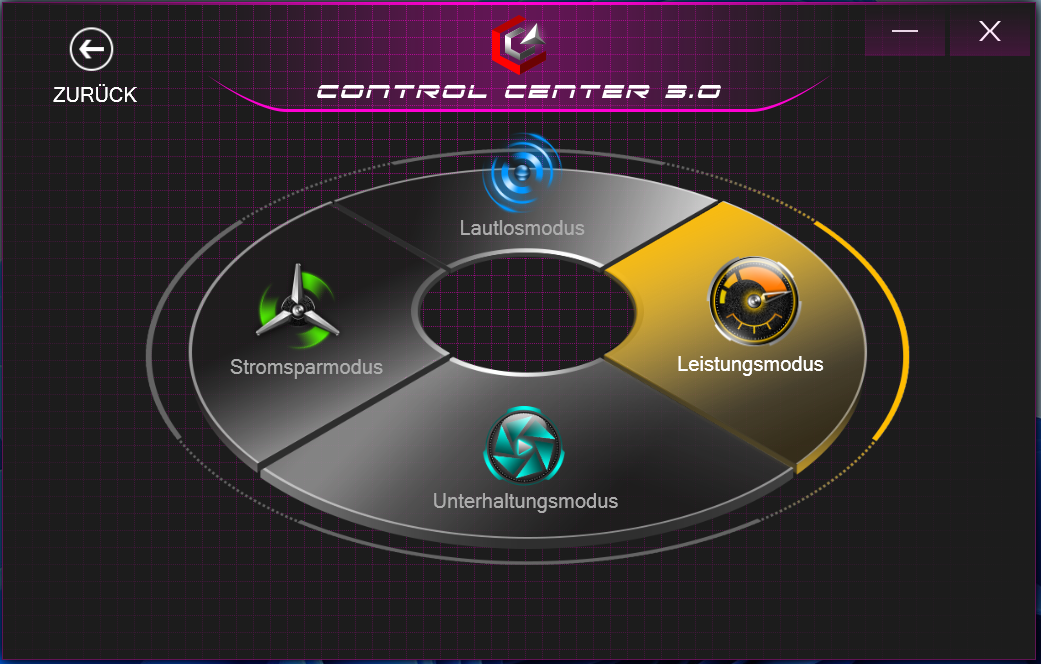
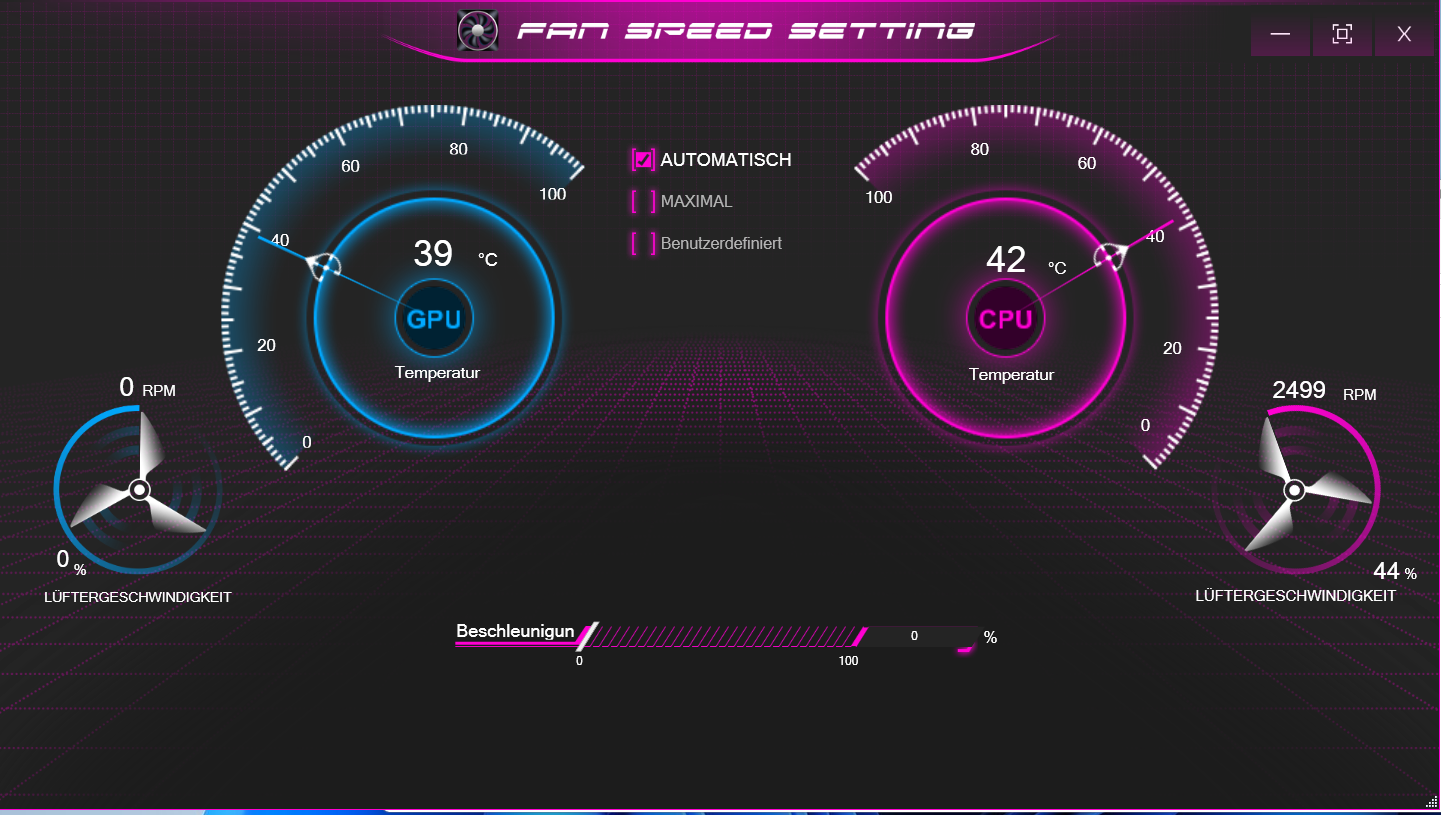
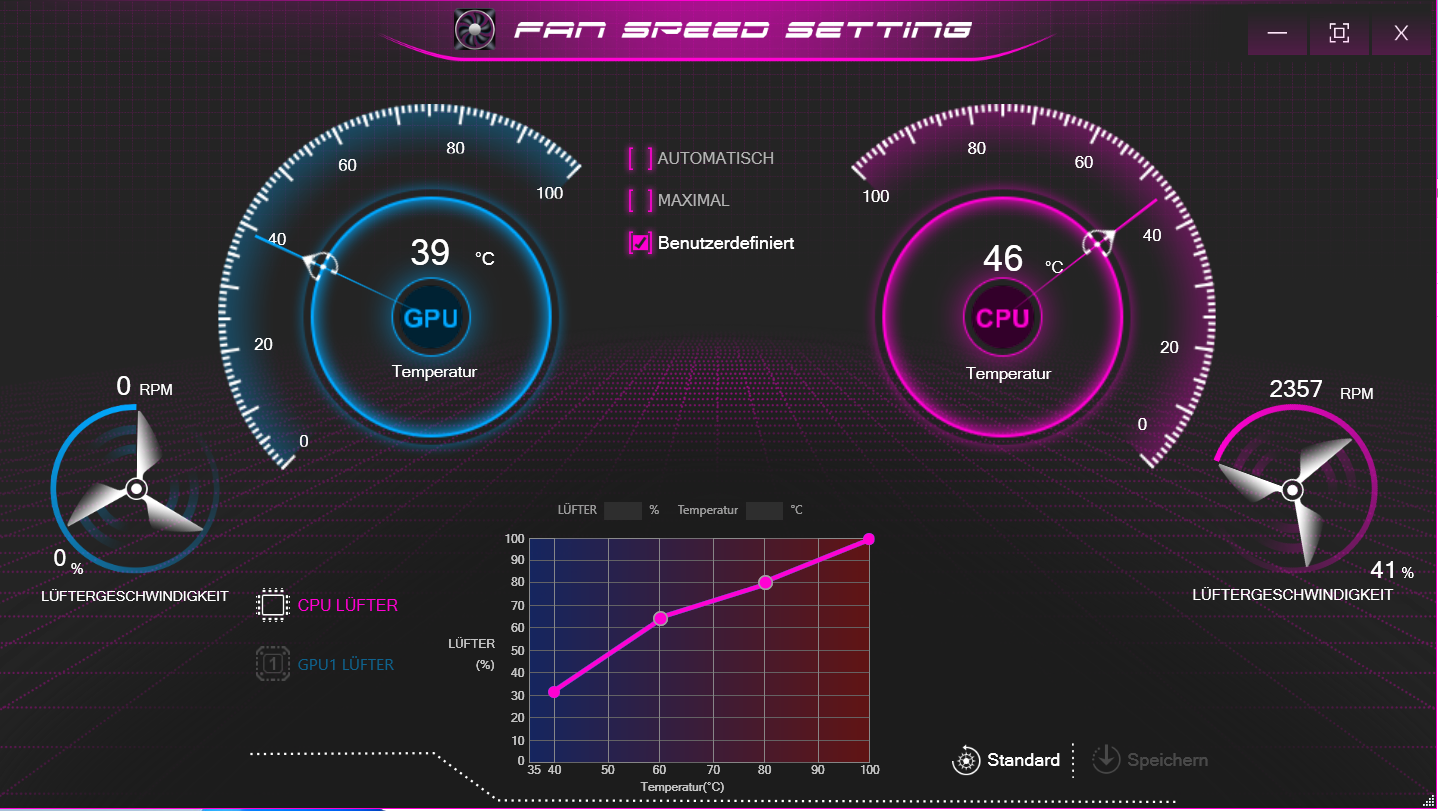
O Centro de Controle pré-instalado permite aos usuários controlar vários parâmetros, como a escolha de um perfil de potência (ver tabela). Utilizamos os perfis "Performance" (benchmarks) e "Energy Saver" (testes de bateria).
| Perfil de energia | Modo de entretenimento | Modo de economia de energia | Modo silencioso | |
|---|---|---|---|---|
| Limite de potência 1 | 80 watts | 45 watts | 15 watts | 15 watts |
| Limite de potência 2 | 135 watts | 115 watts | 30 watts | 30 watts |
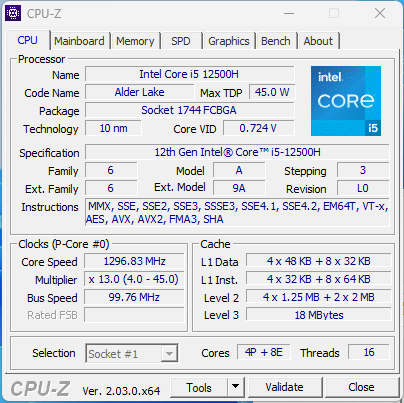
Processador
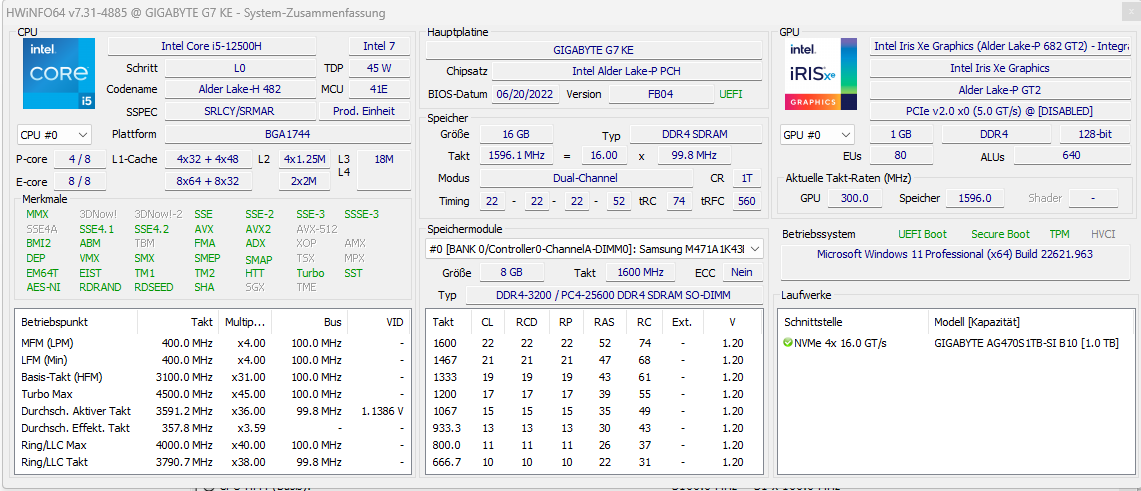
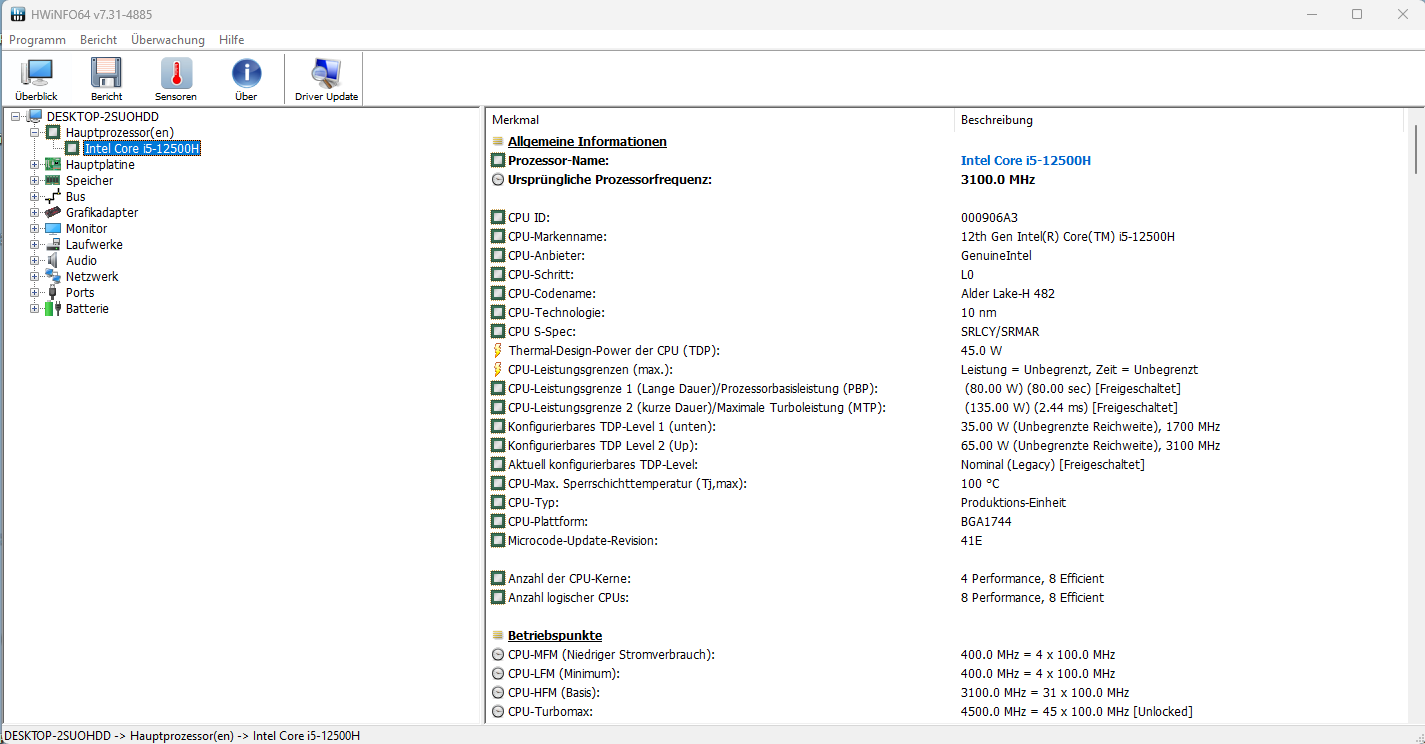
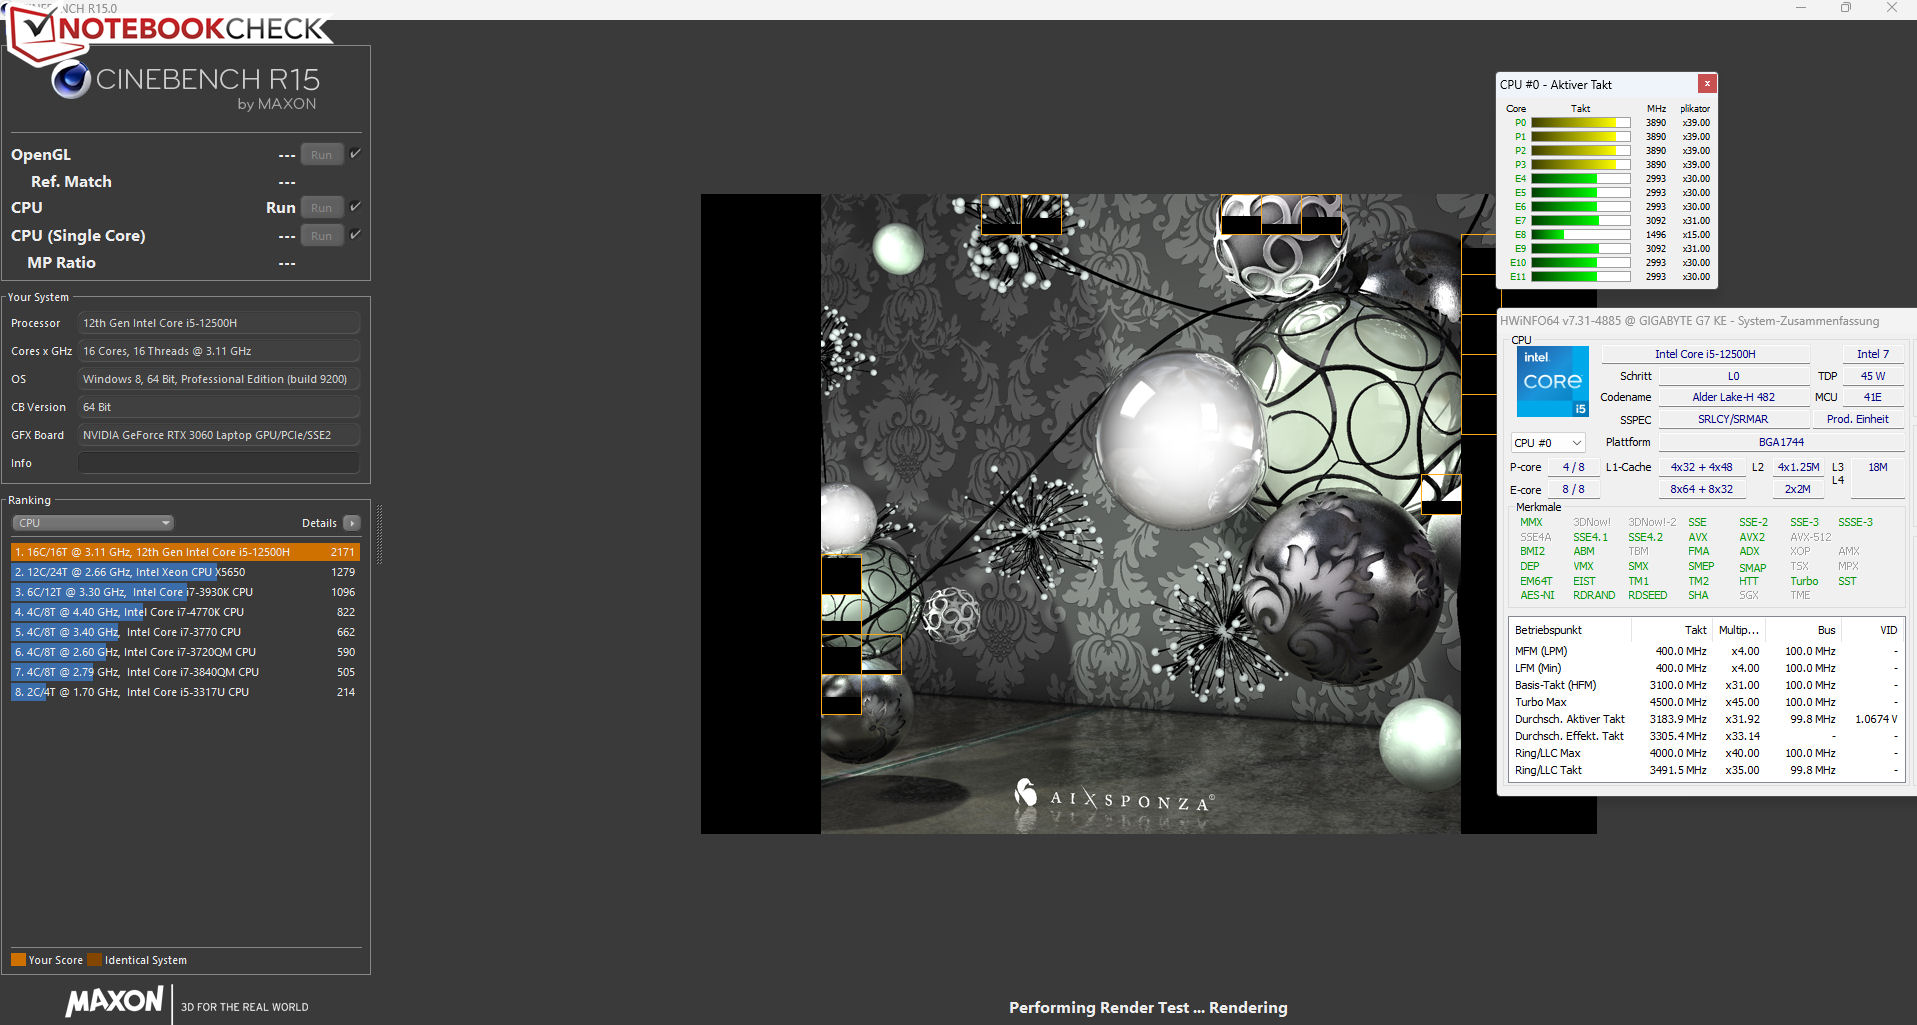
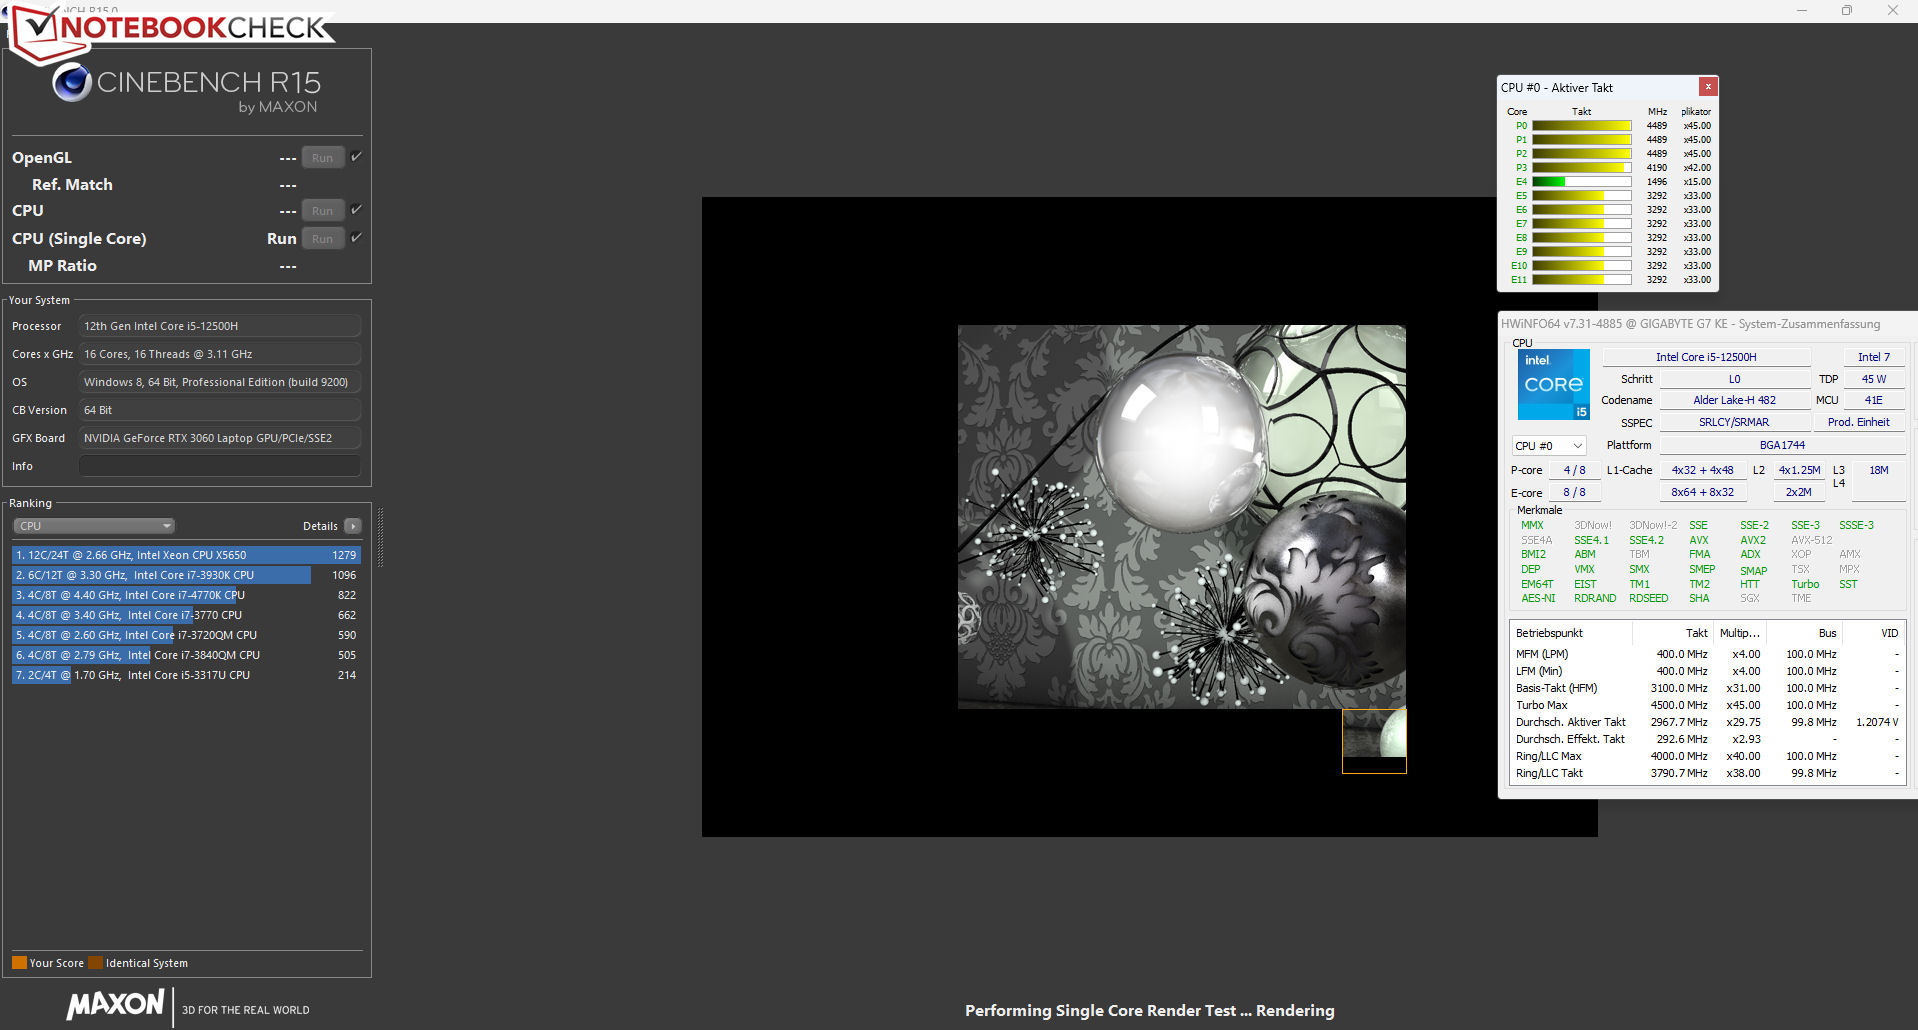
O Núcleo i5-12500H (Alder Lake) consiste em quatro núcleos de desempenho (Hyper-Threading, 2,5 a 4,5 GHz) e oito núcleos de eficiência (sem Hyper-Threading, 1,8 a 3,3 GHz). Assim, há um total de 16 núcleos lógicos de CPU.
As velocidades médias do relógio durante ambos os núcleos multi-core (núcleos P: 3,9 a 4,2 GHz, núcleos E: 1,5 a 3,1 GHz) e monocore (núcleos P: 4,2 a 4,5 GHz, núcleos E: 1,5 a 3,3 GHz) são altas. As velocidades do relógio são reduzidas no modo de bateria. Com nosso loop CB15, pudemos confirmar o uso contínuo da CPU Turbo. Os resultados do benchmark do Core i5 estão ligeiramente acima da média geral.
Cinebench R15 Multi Loop
* ... menor é melhor
AIDA64: FP32 Ray-Trace | FPU Julia | CPU SHA3 | CPU Queen | FPU SinJulia | FPU Mandel | CPU AES | CPU ZLib | FP64 Ray-Trace | CPU PhotoWorxx
| Performance rating | |
| Média da turma Gaming | |
| Gigabyte G7 KE | |
| Lenovo IdeaPad Gaming 3 15IAH7 | |
| Média Intel Core i5-12500H | |
| Acer Nitro 5 AN517-55-738R | |
| Asus TUF Gaming F17 FX707Z-HX011W | |
| HP Pavilion Gaming 17-cd2146ng | |
| AIDA64 / FP32 Ray-Trace | |
| Média da turma Gaming (10227 - 85542, n=107, últimos 2 anos) | |
| Lenovo IdeaPad Gaming 3 15IAH7 | |
| Gigabyte G7 KE | |
| Média Intel Core i5-12500H (6851 - 13947, n=9) | |
| Acer Nitro 5 AN517-55-738R | |
| HP Pavilion Gaming 17-cd2146ng | |
| Asus TUF Gaming F17 FX707Z-HX011W | |
| AIDA64 / FPU Julia | |
| Média da turma Gaming (51376 - 238426, n=107, últimos 2 anos) | |
| Lenovo IdeaPad Gaming 3 15IAH7 | |
| Gigabyte G7 KE | |
| Média Intel Core i5-12500H (29874 - 68178, n=9) | |
| Acer Nitro 5 AN517-55-738R | |
| Asus TUF Gaming F17 FX707Z-HX011W | |
| HP Pavilion Gaming 17-cd2146ng | |
| AIDA64 / CPU SHA3 | |
| Média da turma Gaming (2180 - 9817, n=107, últimos 2 anos) | |
| Lenovo IdeaPad Gaming 3 15IAH7 | |
| Gigabyte G7 KE | |
| Média Intel Core i5-12500H (2287 - 3337, n=9) | |
| Acer Nitro 5 AN517-55-738R | |
| Asus TUF Gaming F17 FX707Z-HX011W | |
| HP Pavilion Gaming 17-cd2146ng | |
| AIDA64 / CPU Queen | |
| Média da turma Gaming (49785 - 173351, n=95, últimos 2 anos) | |
| Asus TUF Gaming F17 FX707Z-HX011W | |
| Acer Nitro 5 AN517-55-738R | |
| Lenovo IdeaPad Gaming 3 15IAH7 | |
| Gigabyte G7 KE | |
| Média Intel Core i5-12500H (77935 - 80703, n=9) | |
| HP Pavilion Gaming 17-cd2146ng | |
| AIDA64 / FPU SinJulia | |
| Média da turma Gaming (4424 - 33636, n=107, últimos 2 anos) | |
| Acer Nitro 5 AN517-55-738R | |
| Asus TUF Gaming F17 FX707Z-HX011W | |
| Gigabyte G7 KE | |
| Lenovo IdeaPad Gaming 3 15IAH7 | |
| Média Intel Core i5-12500H (6590 - 7431, n=9) | |
| HP Pavilion Gaming 17-cd2146ng | |
| AIDA64 / FPU Mandel | |
| Média da turma Gaming (25115 - 128721, n=107, últimos 2 anos) | |
| Lenovo IdeaPad Gaming 3 15IAH7 | |
| Gigabyte G7 KE | |
| Média Intel Core i5-12500H (18252 - 34041, n=9) | |
| Acer Nitro 5 AN517-55-738R | |
| Asus TUF Gaming F17 FX707Z-HX011W | |
| HP Pavilion Gaming 17-cd2146ng | |
| AIDA64 / CPU AES | |
| Lenovo IdeaPad Gaming 3 15IAH7 | |
| Gigabyte G7 KE | |
| Média da turma Gaming (39258 - 247074, n=107, últimos 2 anos) | |
| Média Intel Core i5-12500H (50298 - 111567, n=9) | |
| Acer Nitro 5 AN517-55-738R | |
| Asus TUF Gaming F17 FX707Z-HX011W | |
| HP Pavilion Gaming 17-cd2146ng | |
| AIDA64 / CPU ZLib | |
| Média da turma Gaming (574 - 2531, n=107, últimos 2 anos) | |
| Gigabyte G7 KE | |
| Acer Nitro 5 AN517-55-738R | |
| Lenovo IdeaPad Gaming 3 15IAH7 | |
| Média Intel Core i5-12500H (746 - 924, n=9) | |
| Asus TUF Gaming F17 FX707Z-HX011W | |
| HP Pavilion Gaming 17-cd2146ng | |
| AIDA64 / FP64 Ray-Trace | |
| Média da turma Gaming (5509 - 45446, n=107, últimos 2 anos) | |
| Lenovo IdeaPad Gaming 3 15IAH7 | |
| Gigabyte G7 KE | |
| Média Intel Core i5-12500H (3848 - 7405, n=9) | |
| Acer Nitro 5 AN517-55-738R | |
| Asus TUF Gaming F17 FX707Z-HX011W | |
| HP Pavilion Gaming 17-cd2146ng | |
| AIDA64 / CPU PhotoWorxx | |
| Média da turma Gaming (12271 - 89891, n=107, últimos 2 anos) | |
| Asus TUF Gaming F17 FX707Z-HX011W | |
| Média Intel Core i5-12500H (13686 - 43813, n=9) | |
| Gigabyte G7 KE | |
| HP Pavilion Gaming 17-cd2146ng | |
| Acer Nitro 5 AN517-55-738R | |
| Lenovo IdeaPad Gaming 3 15IAH7 | |
Desempenho do sistema
O sistema é suave e responsivo e oferece desempenho suficiente para renderização, edição de vídeo e jogos. Os resultados dos testes do PCMark são bons. Para a memória DDR4-3200, as taxas de transferência da memória do sistema correspondem às nossas expectativas.
CrossMark: Overall | Productivity | Creativity | Responsiveness
| PCMark 10 / Score | |
| Média da turma Gaming (5828 - 11574, n=95, últimos 2 anos) | |
| Lenovo IdeaPad Gaming 3 15IAH7 | |
| Média Intel Core i5-12500H, NVIDIA GeForce RTX 3060 Laptop GPU (6126 - 7201, n=2) | |
| Acer Nitro 5 AN517-55-738R | |
| Gigabyte G7 KE | |
| Asus TUF Gaming F17 FX707Z-HX011W | |
| HP Pavilion Gaming 17-cd2146ng | |
| PCMark 10 / Essentials | |
| Média Intel Core i5-12500H, NVIDIA GeForce RTX 3060 Laptop GPU (10301 - 11150, n=2) | |
| Média da turma Gaming (8810 - 12600, n=99, últimos 2 anos) | |
| Gigabyte G7 KE | |
| Lenovo IdeaPad Gaming 3 15IAH7 | |
| Acer Nitro 5 AN517-55-738R | |
| Asus TUF Gaming F17 FX707Z-HX011W | |
| HP Pavilion Gaming 17-cd2146ng | |
| PCMark 10 / Productivity | |
| Média da turma Gaming (6845 - 21327, n=97, últimos 2 anos) | |
| Lenovo IdeaPad Gaming 3 15IAH7 | |
| Média Intel Core i5-12500H, NVIDIA GeForce RTX 3060 Laptop GPU (9038 - 9475, n=2) | |
| Acer Nitro 5 AN517-55-738R | |
| Gigabyte G7 KE | |
| HP Pavilion Gaming 17-cd2146ng | |
| Asus TUF Gaming F17 FX707Z-HX011W | |
| PCMark 10 / Digital Content Creation | |
| Média da turma Gaming (7602 - 19657, n=97, últimos 2 anos) | |
| Asus TUF Gaming F17 FX707Z-HX011W | |
| Acer Nitro 5 AN517-55-738R | |
| Lenovo IdeaPad Gaming 3 15IAH7 | |
| Média Intel Core i5-12500H, NVIDIA GeForce RTX 3060 Laptop GPU (6703 - 9593, n=2) | |
| Gigabyte G7 KE | |
| HP Pavilion Gaming 17-cd2146ng | |
| CrossMark / Overall | |
| Média da turma Gaming (1366 - 2409, n=96, últimos 2 anos) | |
| Gigabyte G7 KE | |
| Acer Nitro 5 AN517-55-738R | |
| Média Intel Core i5-12500H, NVIDIA GeForce RTX 3060 Laptop GPU (1752 - 1824, n=2) | |
| Asus TUF Gaming F17 FX707Z-HX011W | |
| CrossMark / Productivity | |
| Média da turma Gaming (1386 - 2254, n=96, últimos 2 anos) | |
| Gigabyte G7 KE | |
| Acer Nitro 5 AN517-55-738R | |
| Média Intel Core i5-12500H, NVIDIA GeForce RTX 3060 Laptop GPU (1720 - 1804, n=2) | |
| Asus TUF Gaming F17 FX707Z-HX011W | |
| CrossMark / Creativity | |
| Média da turma Gaming (1343 - 2729, n=96, últimos 2 anos) | |
| Asus TUF Gaming F17 FX707Z-HX011W | |
| Acer Nitro 5 AN517-55-738R | |
| Gigabyte G7 KE | |
| Média Intel Core i5-12500H, NVIDIA GeForce RTX 3060 Laptop GPU (1778 - 1800, n=2) | |
| CrossMark / Responsiveness | |
| Gigabyte G7 KE | |
| Média Intel Core i5-12500H, NVIDIA GeForce RTX 3060 Laptop GPU (1771 - 1966, n=2) | |
| Acer Nitro 5 AN517-55-738R | |
| Média da turma Gaming (1226 - 2334, n=96, últimos 2 anos) | |
| Asus TUF Gaming F17 FX707Z-HX011W | |
| PCMark 8 Home Score Accelerated v2 | 4560 pontos | |
| PCMark 8 Work Score Accelerated v2 | 6853 pontos | |
| PCMark 10 Score | 6126 pontos | |
Ajuda | ||
| AIDA64 / Memory Copy | |
| Média da turma Gaming (21750 - 129946, n=107, últimos 2 anos) | |
| Asus TUF Gaming F17 FX707Z-HX011W | |
| Média Intel Core i5-12500H (23850 - 66598, n=9) | |
| Gigabyte G7 KE | |
| Acer Nitro 5 AN517-55-738R | |
| HP Pavilion Gaming 17-cd2146ng | |
| Lenovo IdeaPad Gaming 3 15IAH7 | |
| AIDA64 / Memory Read | |
| Média da turma Gaming (22956 - 118858, n=107, últimos 2 anos) | |
| Asus TUF Gaming F17 FX707Z-HX011W | |
| Média Intel Core i5-12500H (24879 - 68013, n=9) | |
| Gigabyte G7 KE | |
| Acer Nitro 5 AN517-55-738R | |
| HP Pavilion Gaming 17-cd2146ng | |
| Lenovo IdeaPad Gaming 3 15IAH7 | |
| AIDA64 / Memory Write | |
| Média da turma Gaming (22297 - 135096, n=107, últimos 2 anos) | |
| Asus TUF Gaming F17 FX707Z-HX011W | |
| Acer Nitro 5 AN517-55-738R | |
| Média Intel Core i5-12500H (23543 - 58797, n=9) | |
| Gigabyte G7 KE | |
| HP Pavilion Gaming 17-cd2146ng | |
| Lenovo IdeaPad Gaming 3 15IAH7 | |
| AIDA64 / Memory Latency | |
| Média da turma Gaming (75.3 - 259, n=107, últimos 2 anos) | |
| Média Intel Core i5-12500H (83.8 - 114.7, n=9) | |
| Lenovo IdeaPad Gaming 3 15IAH7 | |
| Gigabyte G7 KE | |
| HP Pavilion Gaming 17-cd2146ng | |
| Asus TUF Gaming F17 FX707Z-HX011W | |
| Acer Nitro 5 AN517-55-738R | |
* ... menor é melhor
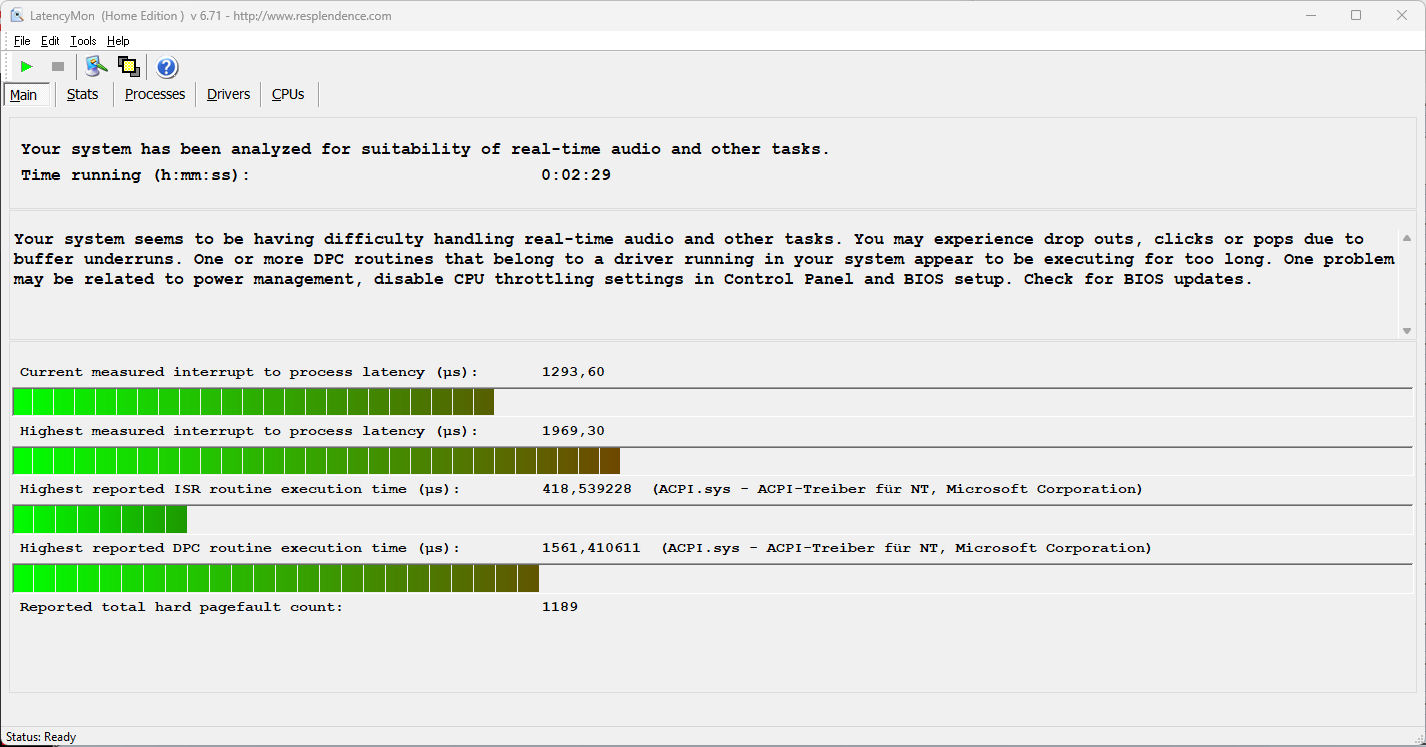
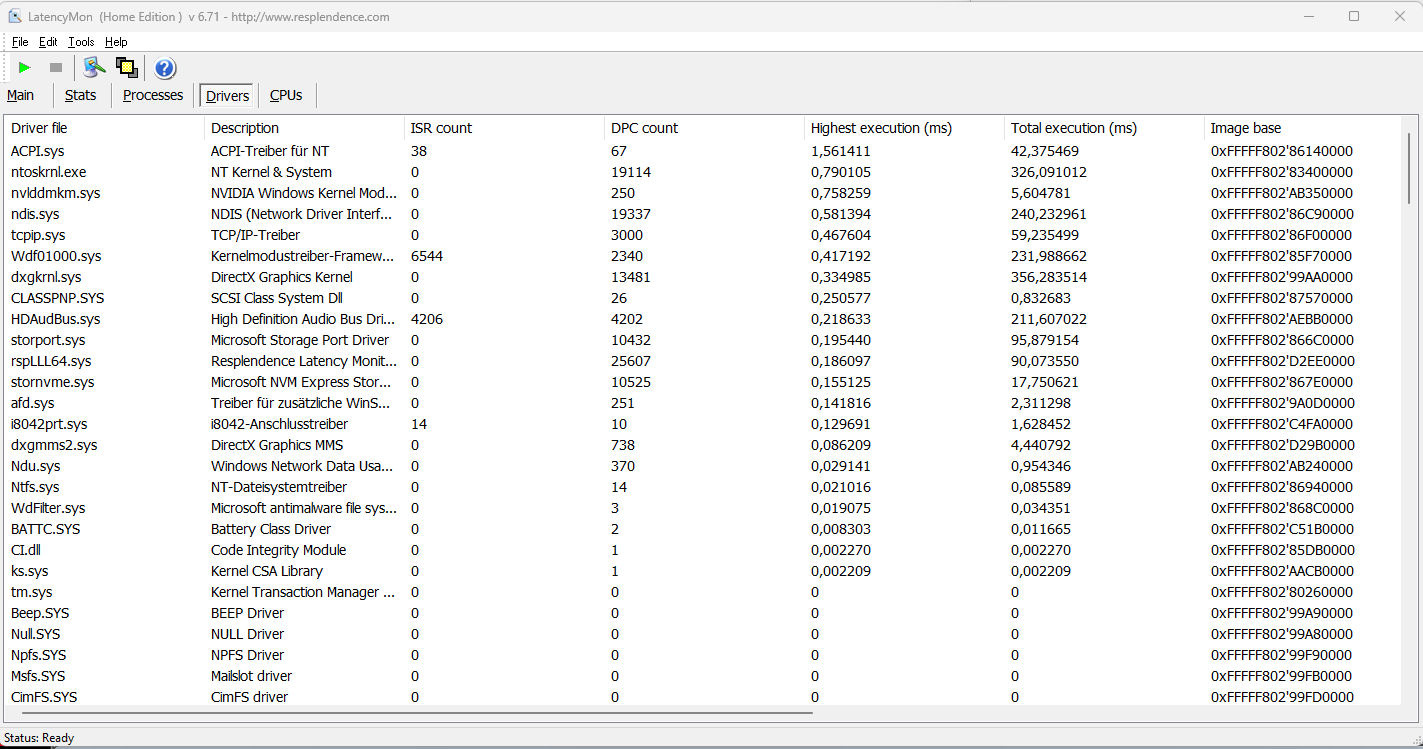
Latência do DPC
Nosso teste padronizado de Monitor de Latência (navegação na web, reprodução de vídeo 4K, Prime95 de alta carga) revela latências DPC problemáticas. Com a configuração de hardware e software no momento do teste, o sistema parece ser inadequado para edição de áudio e vídeo em tempo real. As futuras atualizações de software podem melhorar ou piorar o problema.
| DPC Latencies / LatencyMon - interrupt to process latency (max), Web, Youtube, Prime95 | |
| Asus TUF Gaming F17 FX707Z-HX011W | |
| Gigabyte G7 KE | |
| Lenovo IdeaPad Gaming 3 15IAH7 | |
| HP Pavilion Gaming 17-cd2146ng | |
| Acer Nitro 5 AN517-55-738R | |
* ... menor é melhor
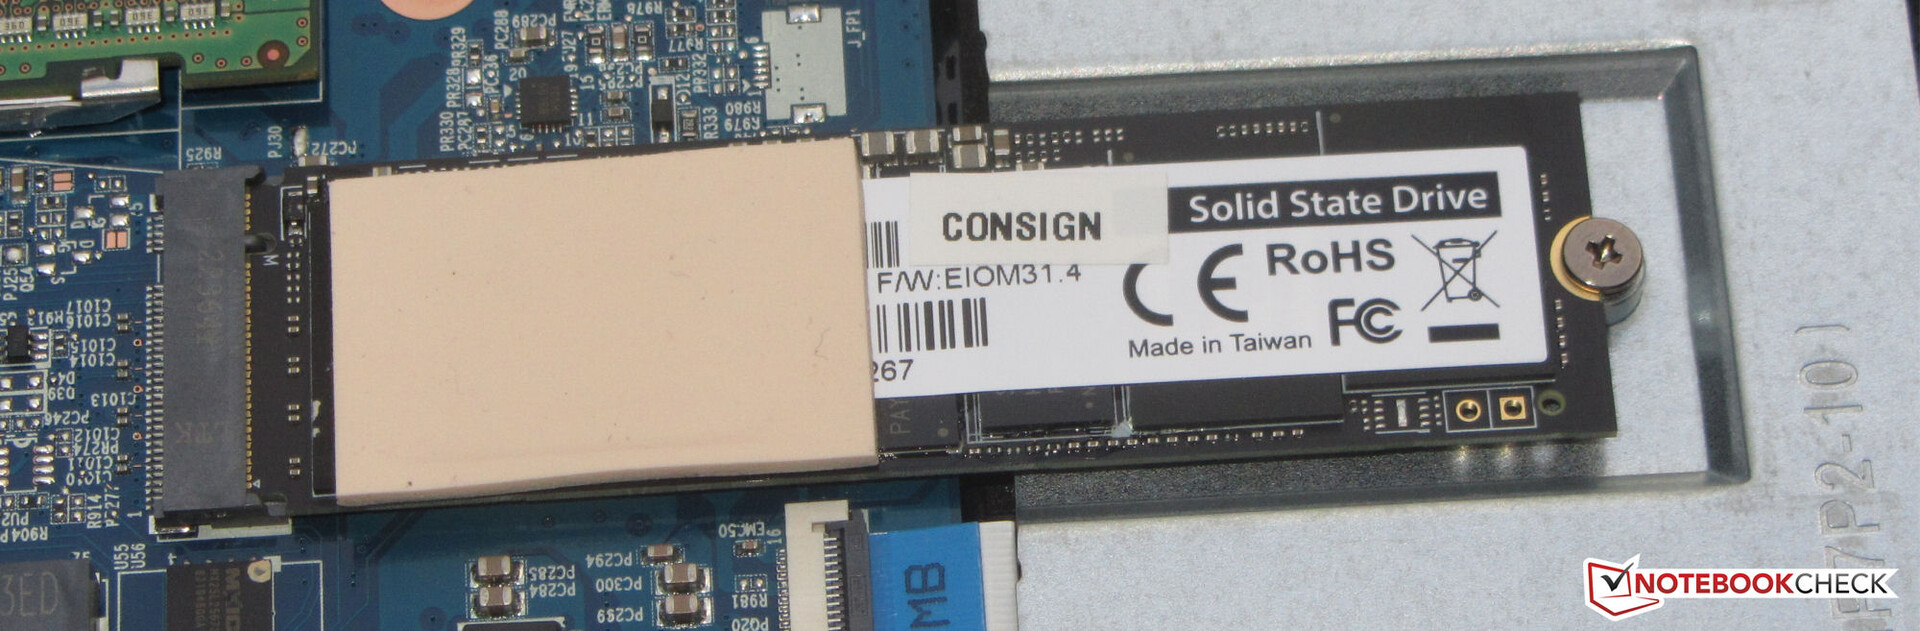
Solução de armazenamento
A Gigabyte equipa o laptop com seu próprio SSD PCIe-4 (1 TB, M.2-2280), que atinge excelentes taxas de transferência. Infelizmente, o acionamento sofre de estrangulamento térmico apesar da chapa de resfriamento metálico no interior da placa inferior. Há espaço para um total de dois M.2-2280 SSDs (1x PCIe 4.0, 1x PCIe 3.0).

* ... menor é melhor
Disk Throttling: DiskSpd Read Loop, Queue Depth 8
Desempenho da GPU
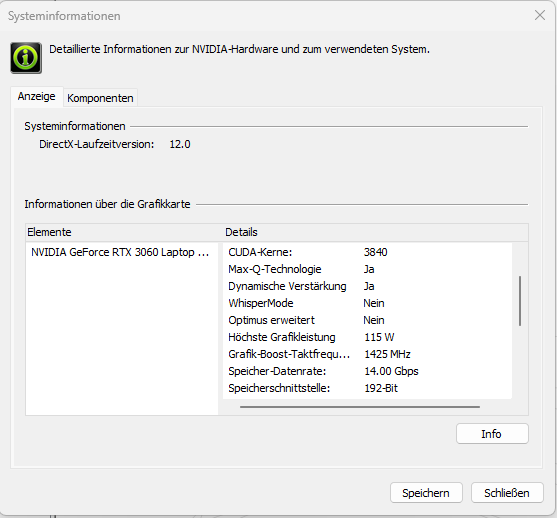
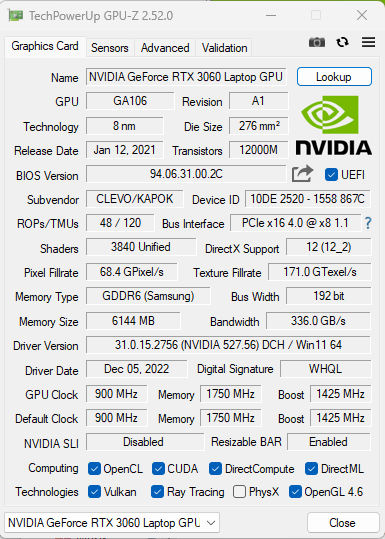
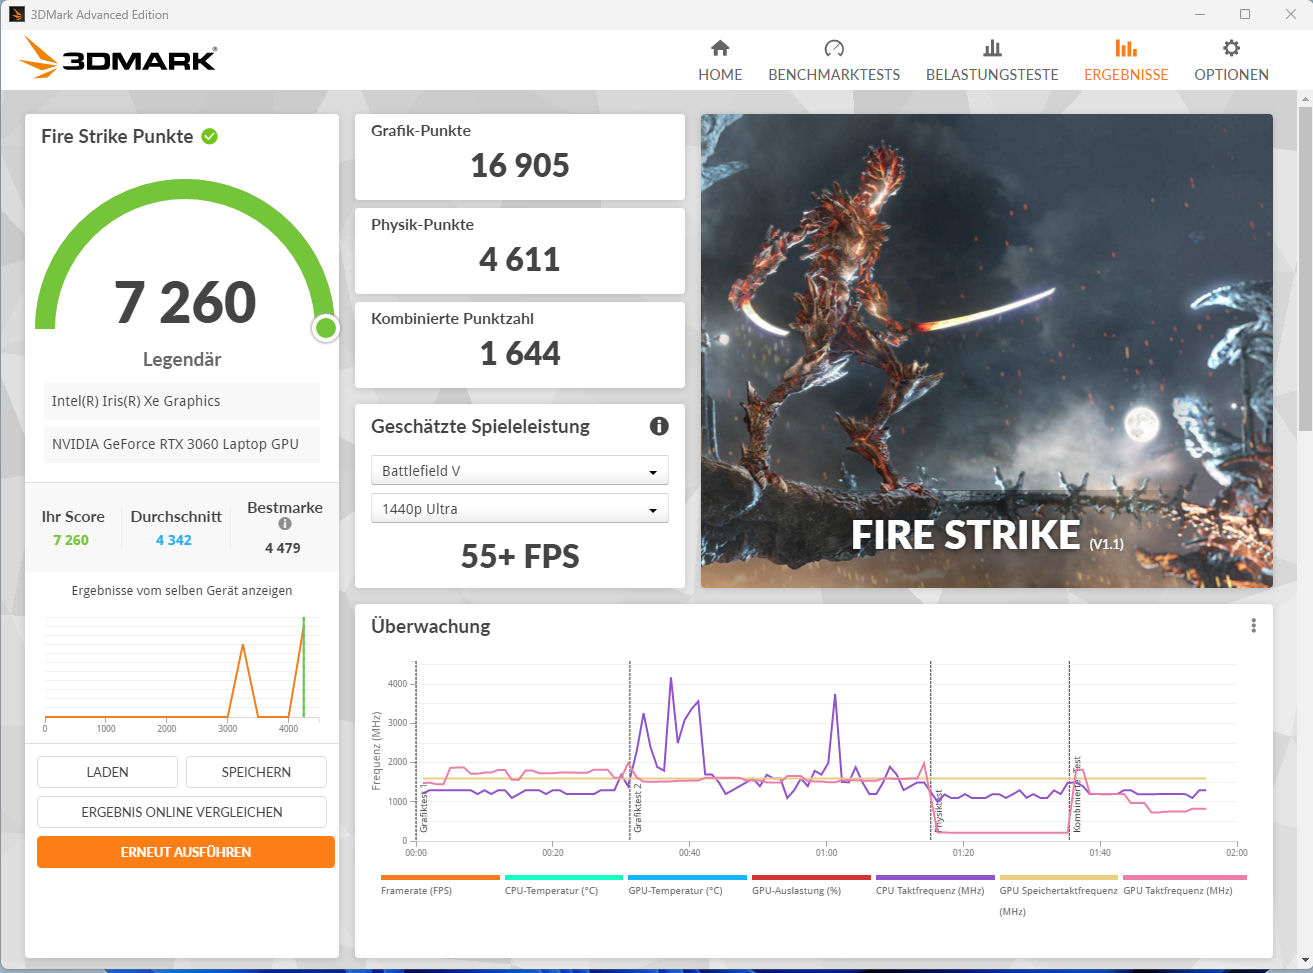
O desempenho de uma GPU RTX-3000 depende de alguns fatores na prática: A solução de resfriamento, configuração de memória e o TGP máximo, que é definido pelo fabricante do laptop dentro da faixa especificada pela Nvidia. Neste caso, a Gigabyte definiu o TGP máximo do GeForce Computador portátil RTX 3060 GPU a 115 watts. Como nossa Witcher 3 o teste mostra, no entanto, que este valor do TGP não é bem alcançado.
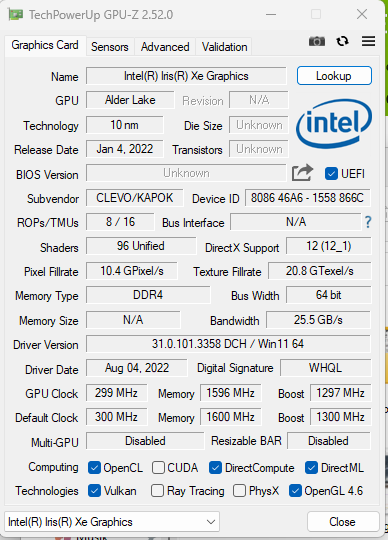
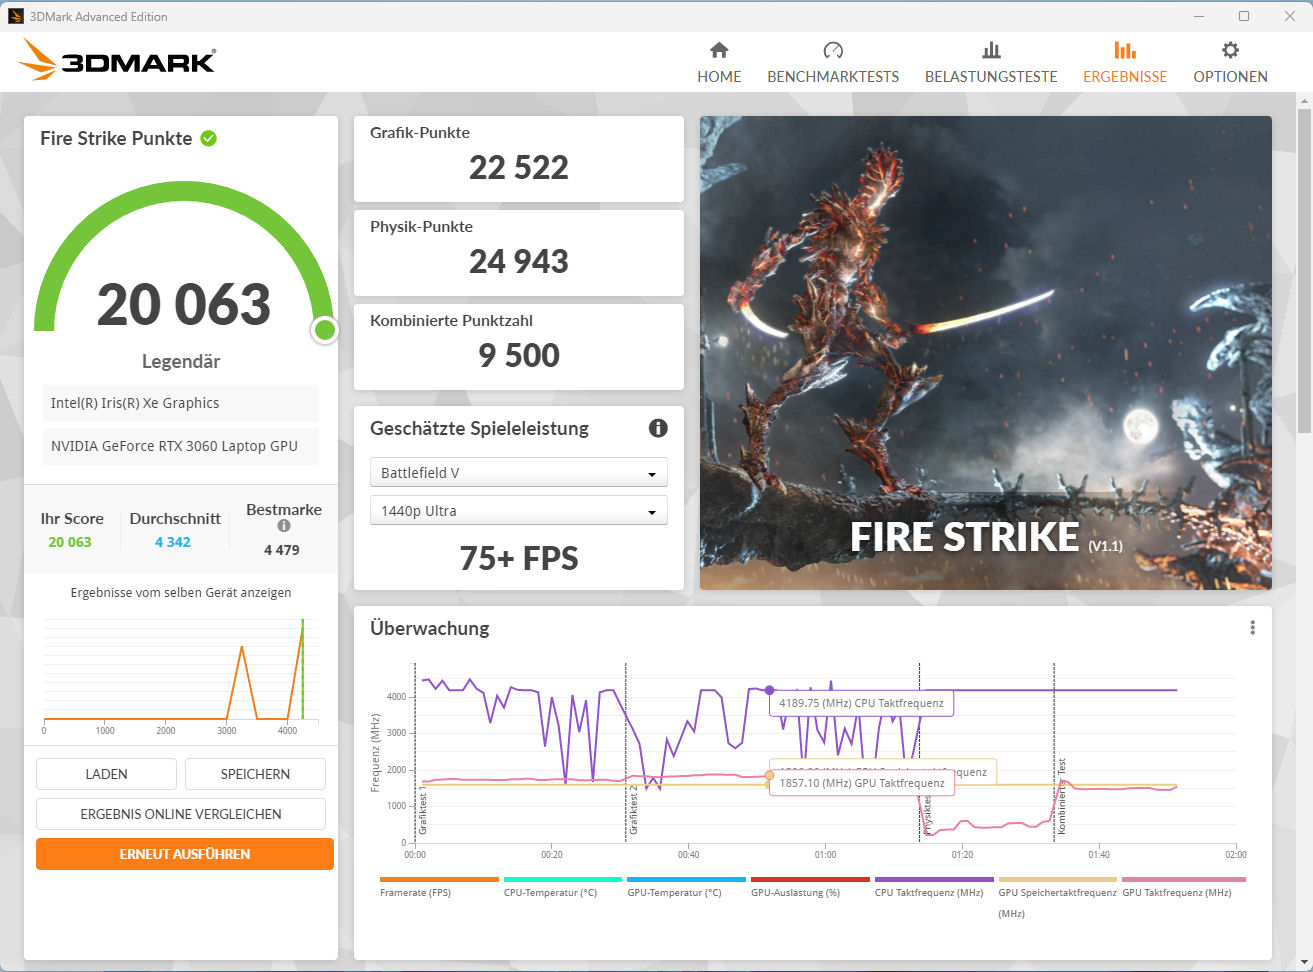
Os resultados do 3DMark excedem a média de nossos modelos RTX 3060 previamente revisados. A GPU tem acesso à rápida memória de vídeo GDDR6 (6144 MB). OGráfica Iris Xe G7 80EU a solução gráfica integrada do processador está ativa e o laptop usa a tecnologia de comutação gráfica Optimus da Nvidia. Embora um modo dGPU esteja disponível, ele não resultou em um melhor desempenho.

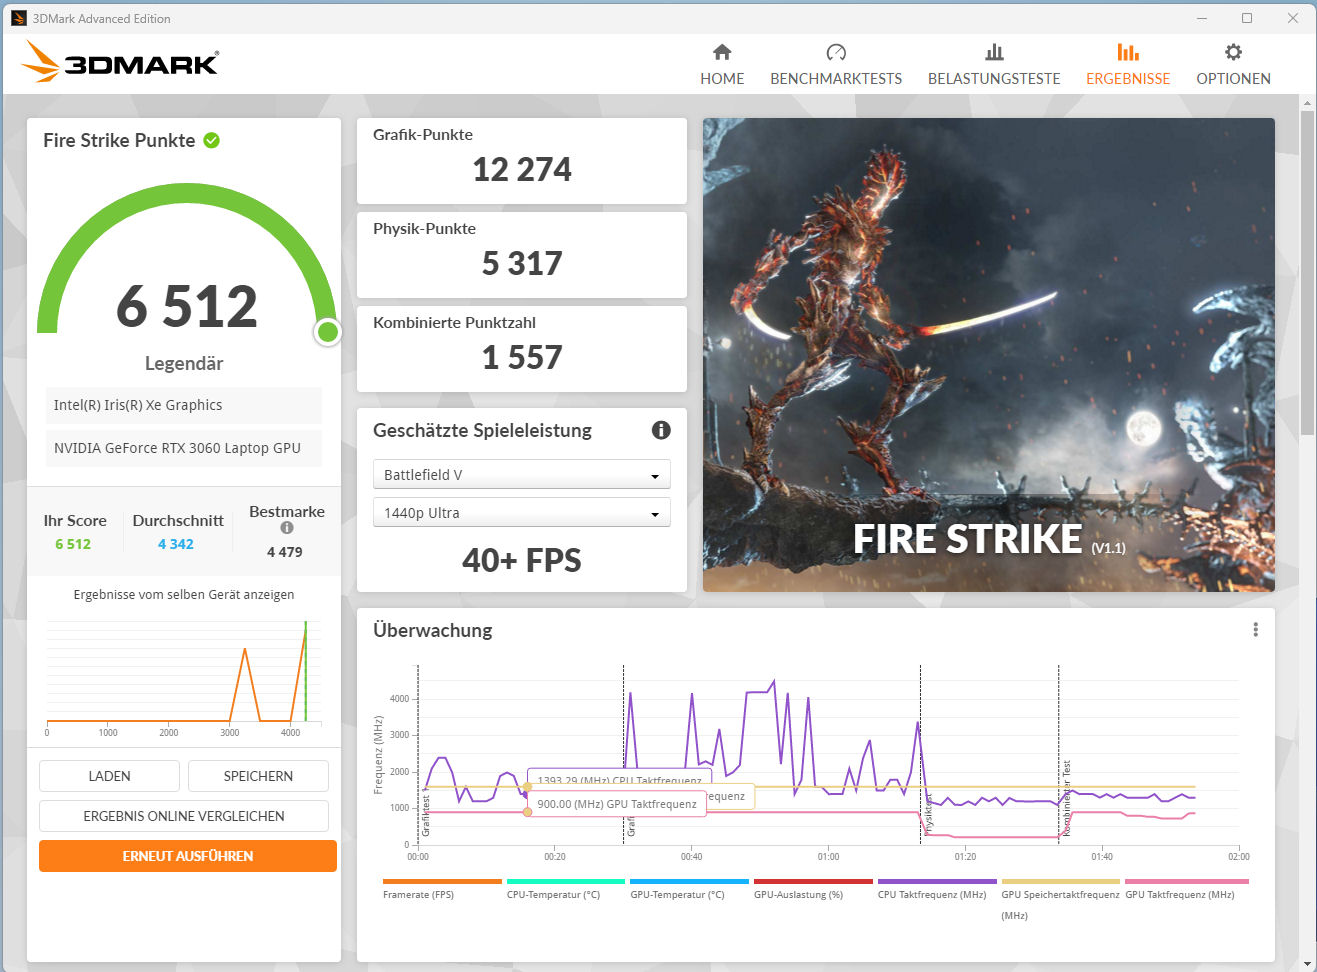
| 3DMark 06 Standard Score | 47733 pontos | |
| 3DMark 11 Performance | 26102 pontos | |
| 3DMark Cloud Gate Standard Score | 37608 pontos | |
| 3DMark Fire Strike Score | 20063 pontos | |
| 3DMark Time Spy Score | 8799 pontos | |
Ajuda | ||
| GPUScore: Sacred Path | |
| 2560x1440 Official VRS | |
| Média da turma Gaming (13.8 - 330, n=148, últimos 2 anos) | |
| Média NVIDIA GeForce RTX 3060 Laptop GPU (111.2 - 113.7, n=2) | |
| Gigabyte G7 KE | |
| 2560x1440 Official | |
| Média da turma Gaming (11 - 331, n=245, últimos 2 anos) | |
| Média NVIDIA GeForce RTX 3060 Laptop GPU (2.34 - 110.1, n=3) | |
| Gigabyte G7 KE | |
| Geekbench 5.5 - Vulkan Score 5.5 | |
| Média da turma Gaming (9296 - 246759, n=81, últimos 2 anos) | |
| Média NVIDIA GeForce RTX 3060 Laptop GPU (46619 - 81150, n=25) | |
| Gigabyte G7 KE | |
| Acer Nitro 5 AN517-55-738R | |
* ... menor é melhor
Desempenho nos jogos
Os componentes instalados permitem jogos FHD em configurações altas a máximas. Também é possível usar um monitor externo com uma resolução mais alta, embora isto possa exigir a redução das configurações. As taxas de quadros excedem a média para um RTX 3060 de nosso banco de dados.
| The Witcher 3 - 1920x1080 Ultra Graphics & Postprocessing (HBAO+) | |
| Média da turma Gaming (95 - 240, n=8, últimos 2 anos) | |
| Asus TUF Gaming F17 FX707Z-HX011W | |
| Acer Nitro 5 AN517-55-738R | |
| Gigabyte G7 KE | |
| Média NVIDIA GeForce RTX 3060 Laptop GPU (58.2 - 91.5, n=48) | |
| Lenovo IdeaPad Gaming 3 15IAH7 | |
| HP Pavilion Gaming 17-cd2146ng | |
A fim de determinar se as taxas de quadros permanecem consistentes durante um longo período de tempo, executamos o The Witcher 3 por cerca de 60 minutos com resolução Full HD e ajustes de qualidade máxima. O caráter não é movido durante toda a duração. Não observamos um mergulho no desempenho.
Witcher 3 FPS Graph
| baixo | média | alto | ultra | |
|---|---|---|---|---|
| GTA V (2015) | 182.8 | 179.5 | 172.1 | 103 |
| The Witcher 3 (2015) | 339 | 233 | 137.1 | 82.4 |
| Dota 2 Reborn (2015) | 170.5 | 153 | 145.9 | 137.3 |
| Final Fantasy XV Benchmark (2018) | 180.4 | 112.4 | 84.7 | |
| X-Plane 11.11 (2018) | 120.5 | 106 | 86.8 | |
| Far Cry 5 (2018) | 168 | 131 | 122 | 115 |
| Strange Brigade (2018) | 369 | 211 | 168 | 146.4 |
| Flight Simulator 2020 (2020) | 135.7 | 85.1 | 62.8 | 45.9 |
| Guardians of the Galaxy (2021) | 120 | 114 | 114 | 110 |
| Cyberpunk 2077 1.6 (2022) | 96.7 | 75.5 | 66 | 60.7 |
| F1 22 (2022) | 190.5 | 186.3 | 149.6 | 54.4 |
| The Quarry (2022) | 126.9 | 97.2 | 80 | 64.1 |
| A Plague Tale Requiem (2022) | 87.5 | 73 | 62.8 | 52.8 |
| Uncharted Legacy of Thieves Collection (2022) | 72.2 | 69.8 | 65.6 | 62.3 |
| Call of Duty Modern Warfare 2 2022 (2022) | 111 | 99 | 77 | 72 |
| Spider-Man Miles Morales (2022) | 103.3 | 94.2 | 86.4 | 77.5 |
| The Callisto Protocol (2022) | 105.5 | 83.9 | 55.6 | 55.3 |
| Need for Speed Unbound (2022) | 114.9 | 106.7 | 88.6 | 76.6 |
| High On Life (2023) | 177.1 | 134.2 | 99.3 | 79.4 |
| The Witcher 3 v4 (2023) | 170.1 | 132.2 | 108.4 | 87.5 |
| Dead Space Remake (2023) | 69.2 | 66.5 | 59 | 54 |
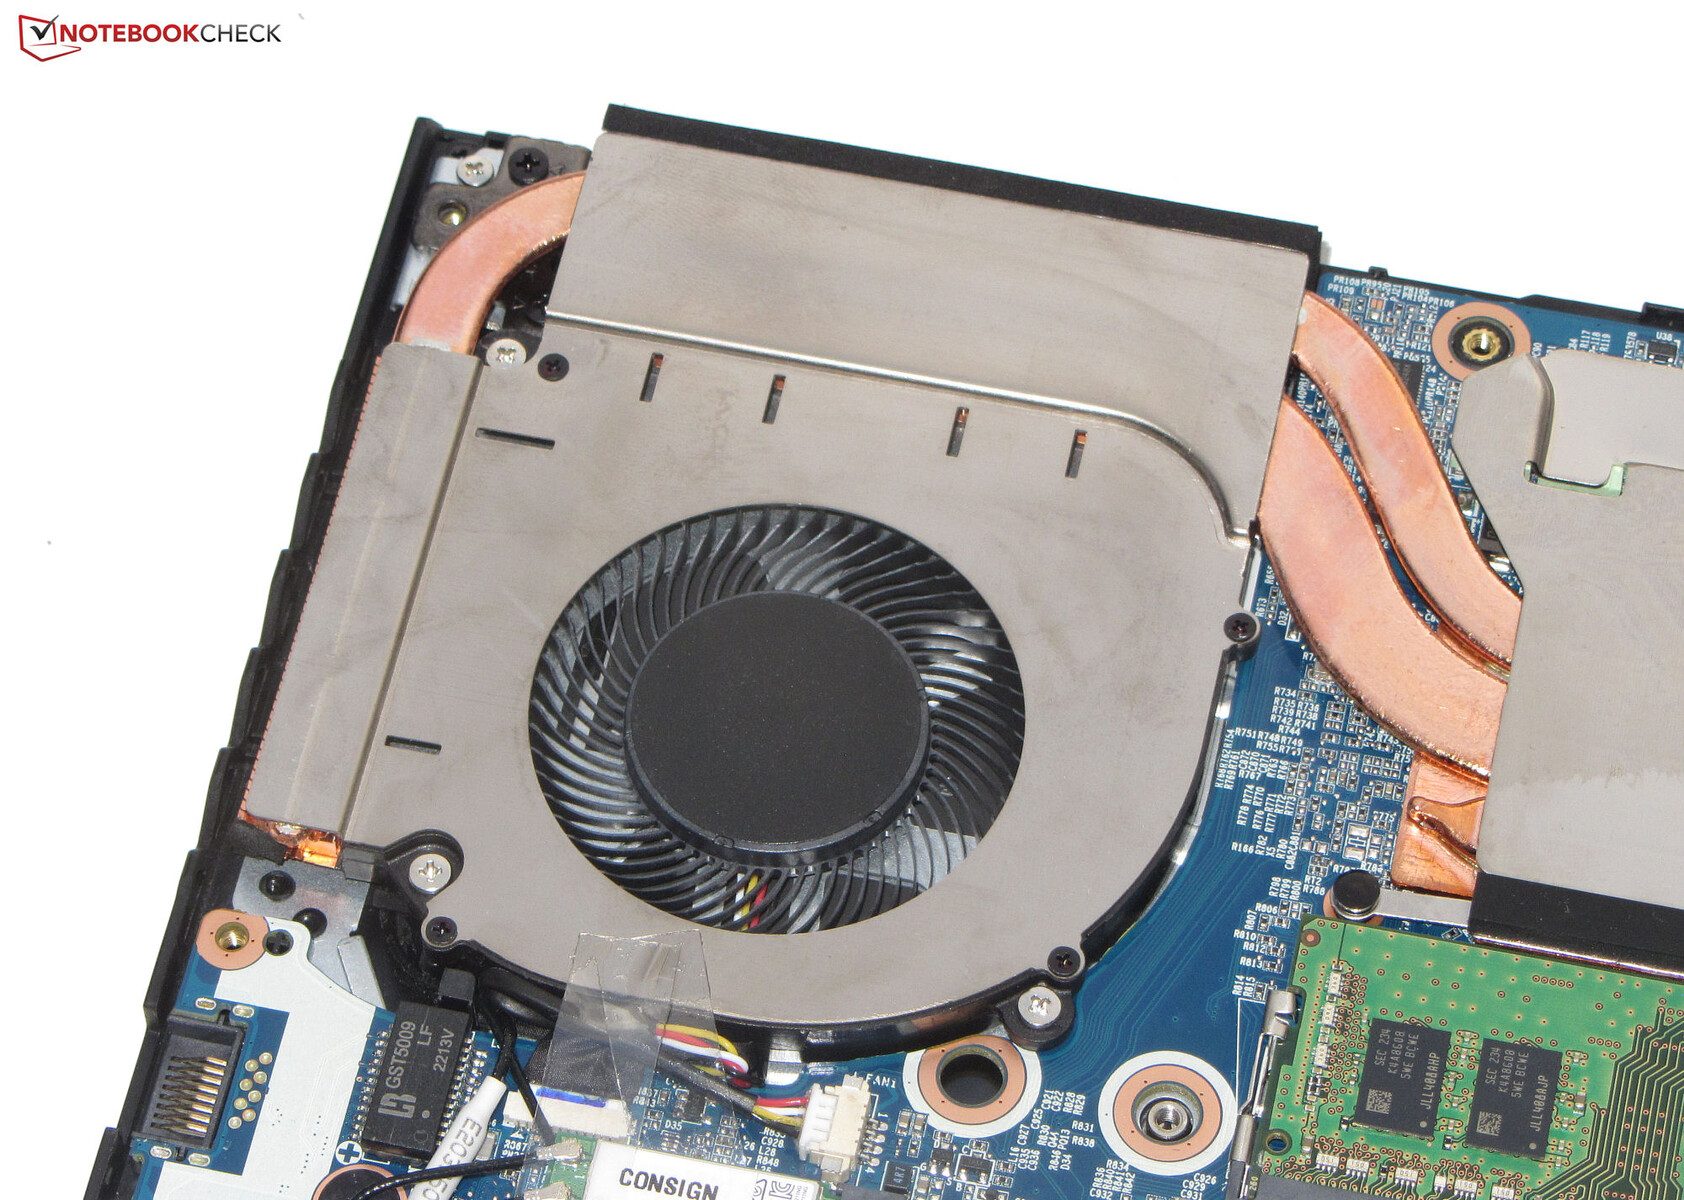
Emissões - O sistema Gigabyte pode ser muito barulhento
Emissões sonoras
Mesmo durante o uso diário (escritório, web), os dois ventiladores são freqüentemente perceptíveis - níveis de ruído de até 38 dB(A) são possíveis. Eles raramente ficam ociosos. Sob carga, o laptop pode atingir níveis de ruído muito altos de até 59 dB(A) (teste de estresse) e 56 dB(A) (Witcher 3) - isto torna nosso modelo de teste substancialmente mais alto do que a maioria dos concorrentes nestes cenários. As emissões sonoras podem ser reduzidas usando um dos três perfis de desempenho "Entretenimento", "Economia de Energia", "Silêncio" - ao custo de algum desempenho.
Barulho
| Ocioso |
| 27 / 35 / 38 dB |
| Carga |
| 52 / 59 dB |
 | ||
30 dB silencioso 40 dB(A) audível 50 dB(A) ruidosamente alto |
||
min: | ||
| Gigabyte G7 KE i5-12500H, GeForce RTX 3060 Laptop GPU | HP Pavilion Gaming 17-cd2146ng i5-11300H, GeForce RTX 3050 Ti Laptop GPU | Acer Nitro 5 AN517-55-738R i7-12700H, GeForce RTX 3060 Laptop GPU | Asus TUF Gaming F17 FX707Z-HX011W i7-12700H, GeForce RTX 3060 Laptop GPU | Lenovo IdeaPad Gaming 3 15IAH7 i5-12500H, GeForce RTX 3050 Ti Laptop GPU | |
|---|---|---|---|---|---|
| Noise | 17% | 9% | 21% | 11% | |
| desligado / ambiente * (dB) | 27 | 25 7% | 25.5 6% | 24 11% | 25 7% |
| Idle Minimum * (dB) | 27 | 27 -0% | 25.5 6% | 24 11% | 29 -7% |
| Idle Average * (dB) | 35 | 28 20% | 25.5 27% | 24 31% | 30 14% |
| Idle Maximum * (dB) | 38 | 30 21% | 27 29% | 24 37% | 32 16% |
| Load Average * (dB) | 52 | 39 25% | 52.6 -1% | 42.6 18% | 42 19% |
| Witcher 3 ultra * (dB) | 56 | 44 21% | 46.84 16% | 46 18% | |
| Load Maximum * (dB) | 59 | 46 22% | 68.2 -16% | 46.84 21% | 54 8% |
* ... menor é melhor
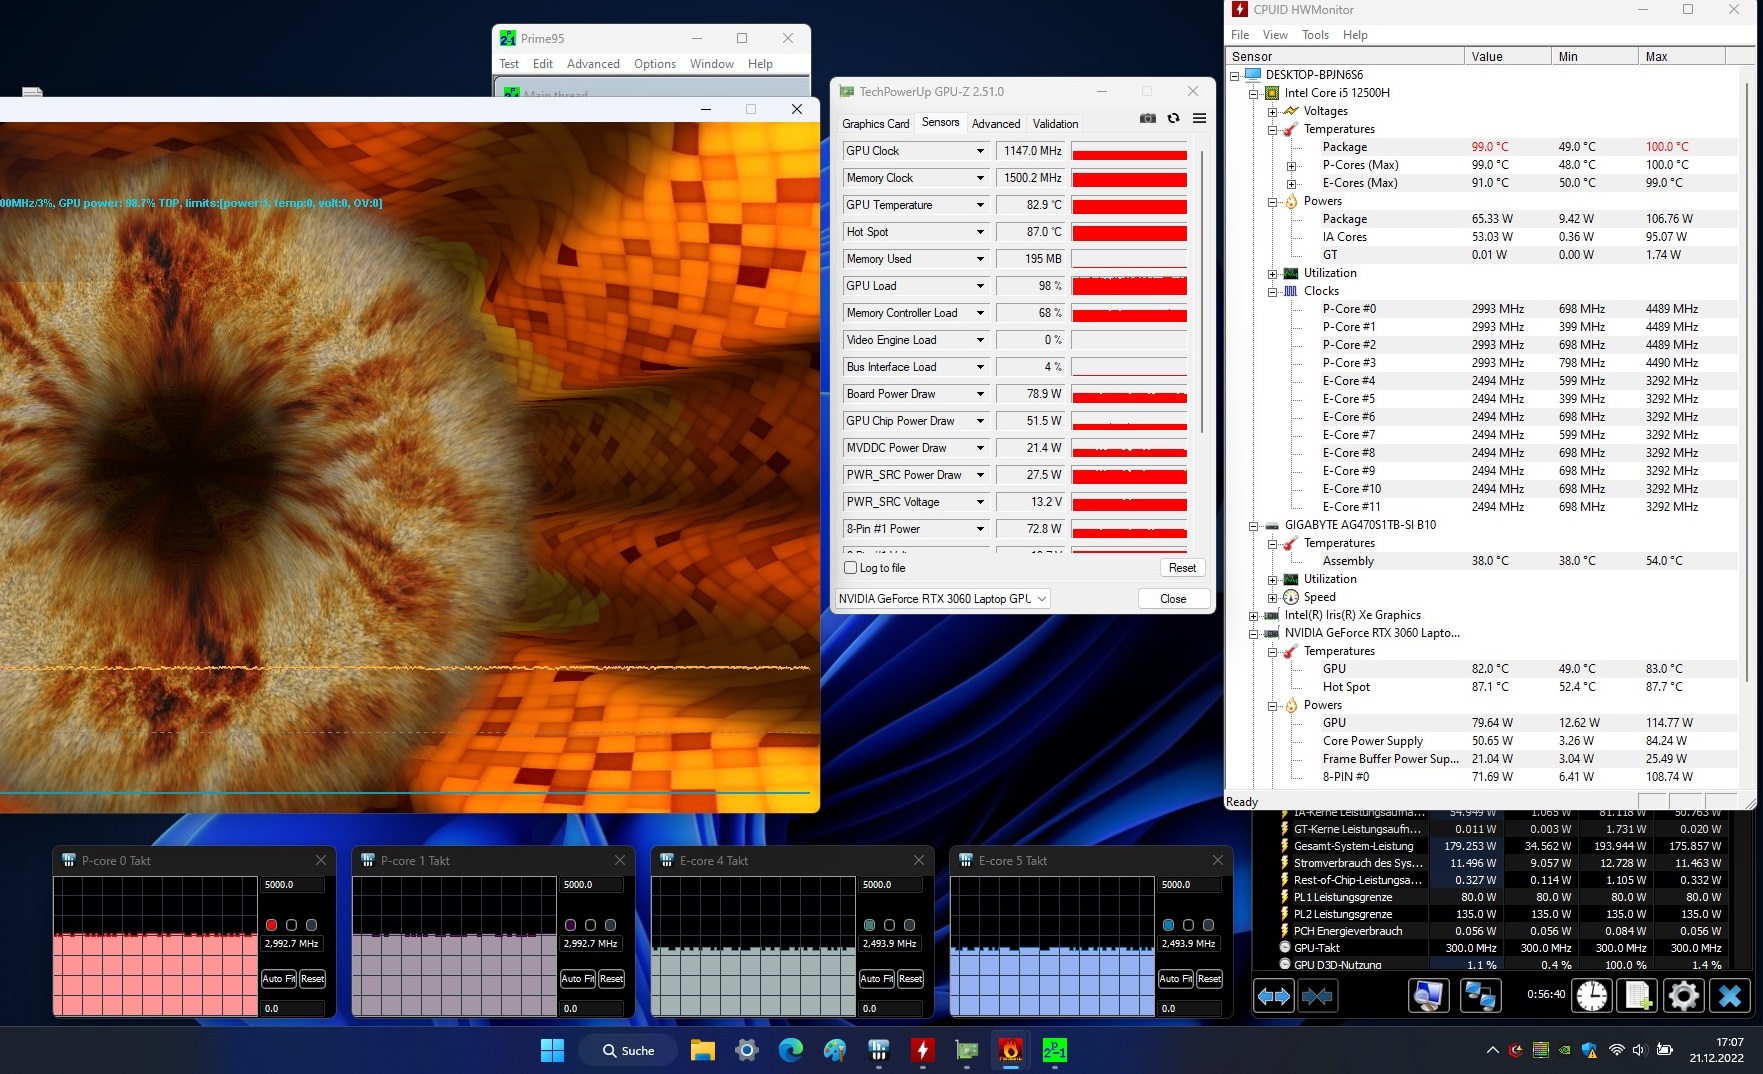
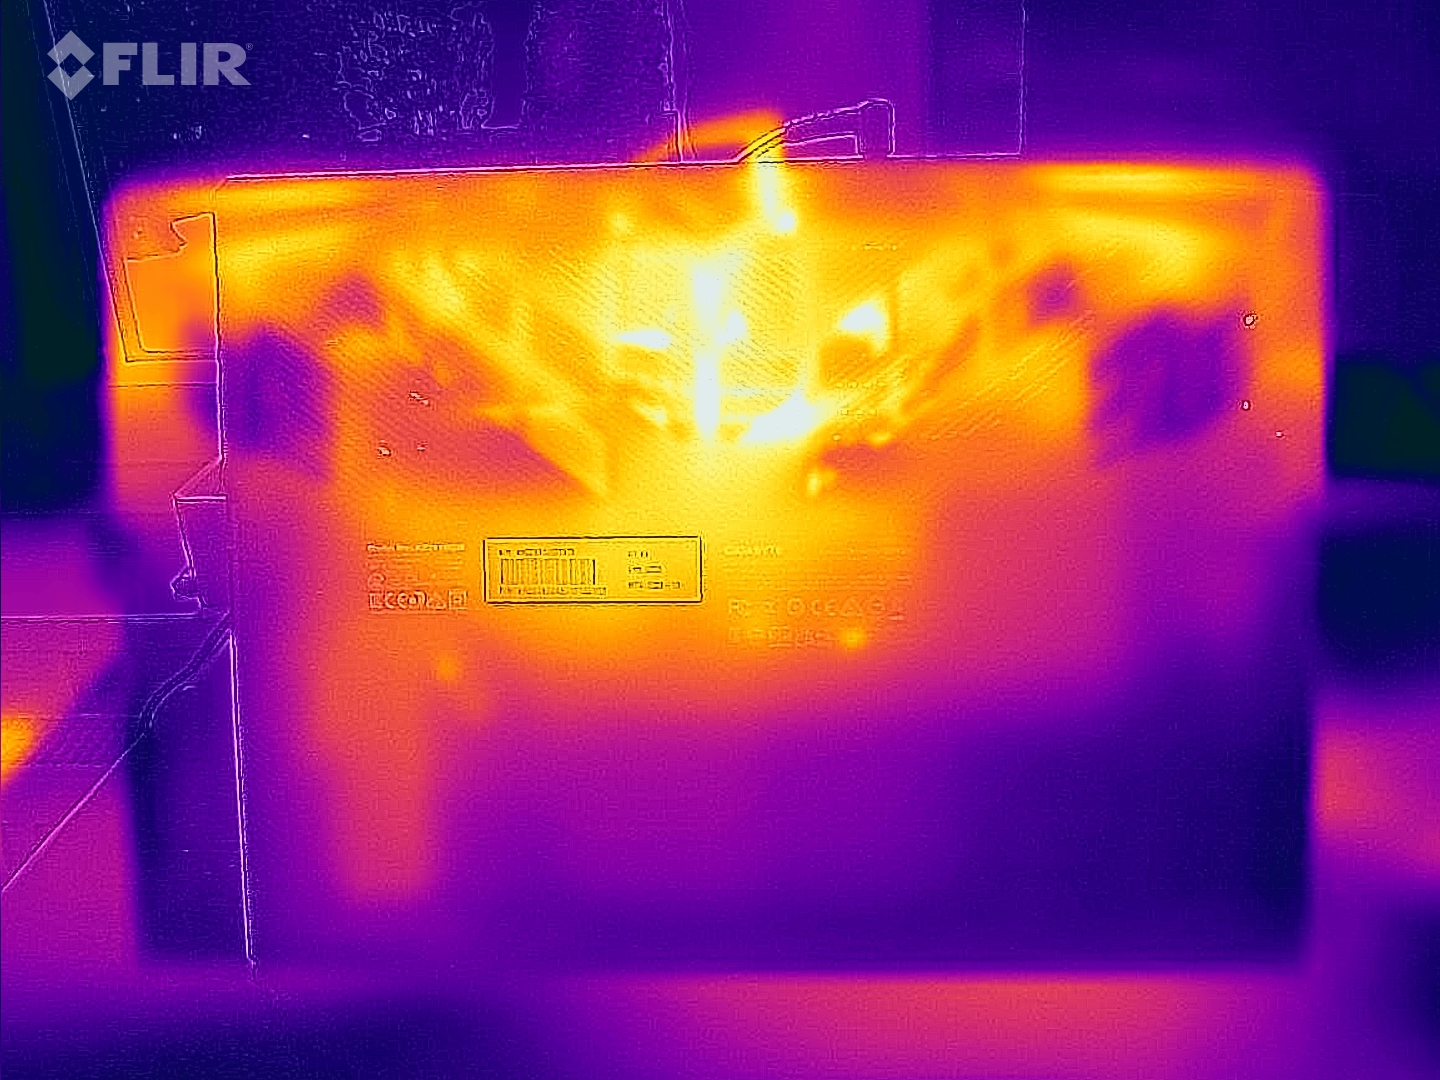
Temperaturas
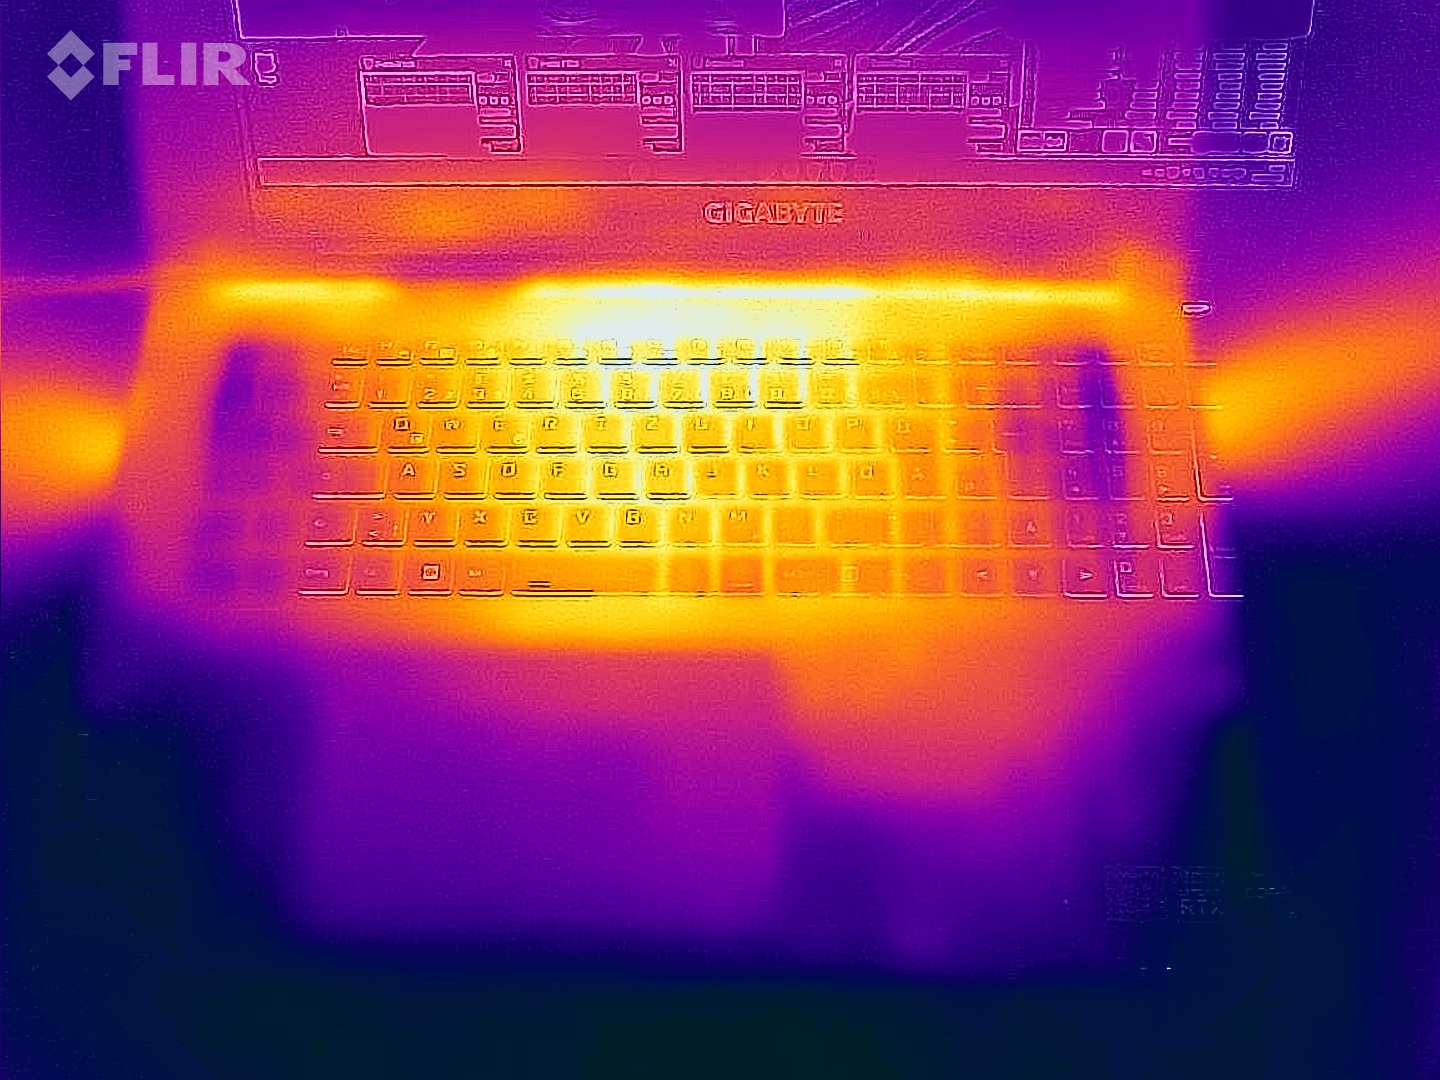
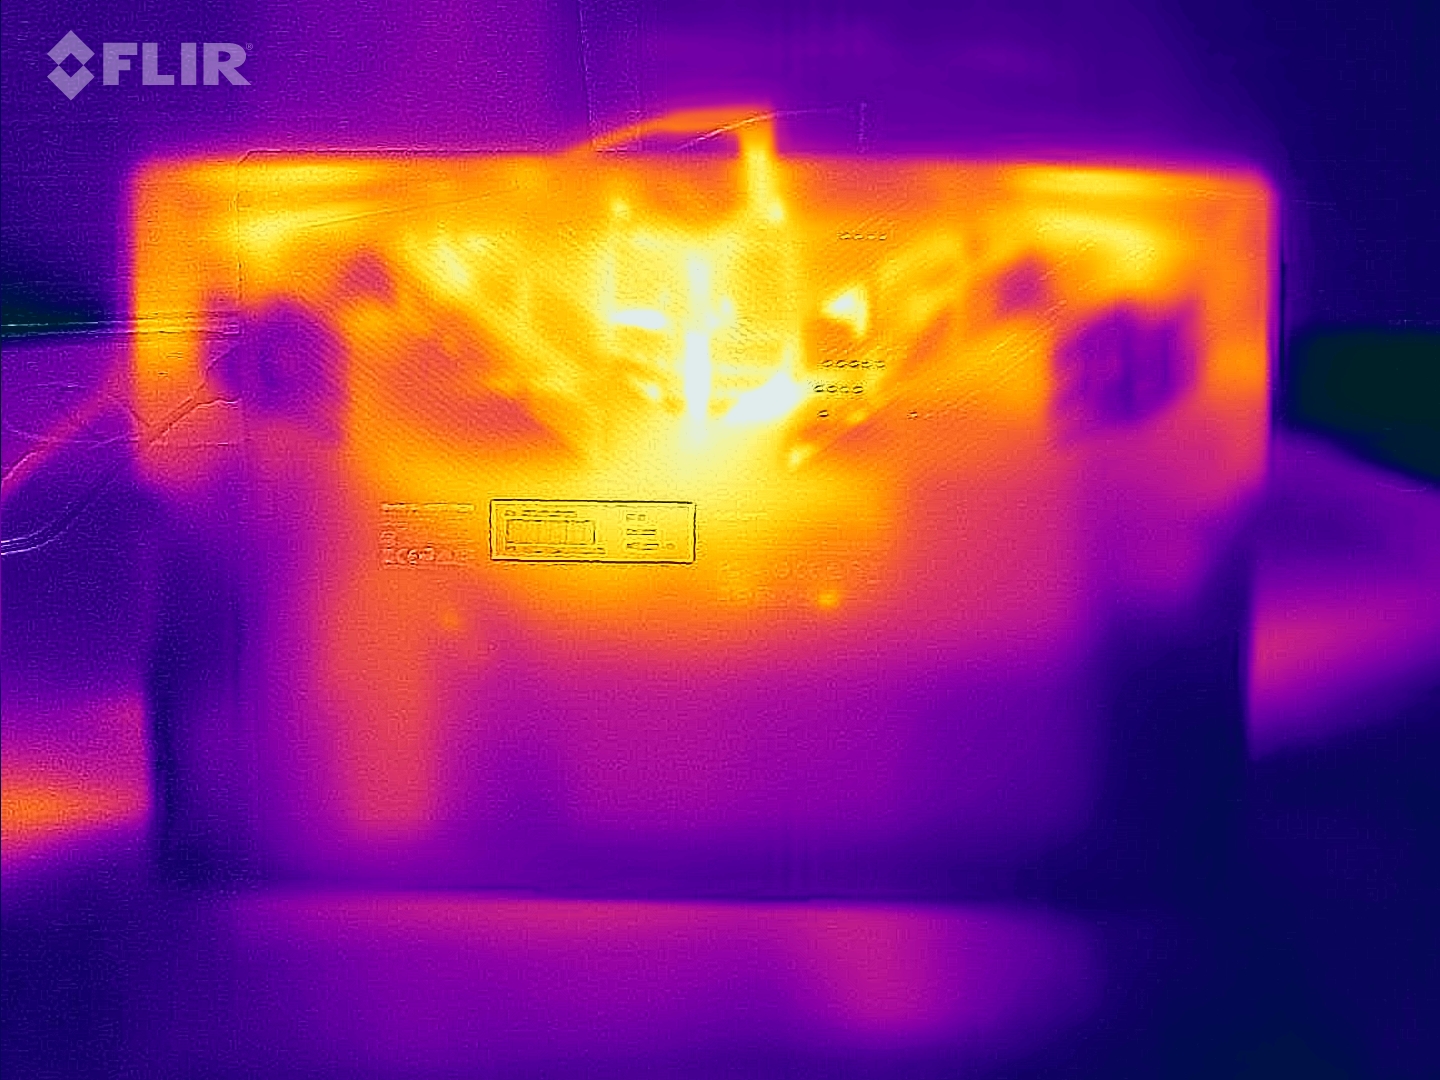
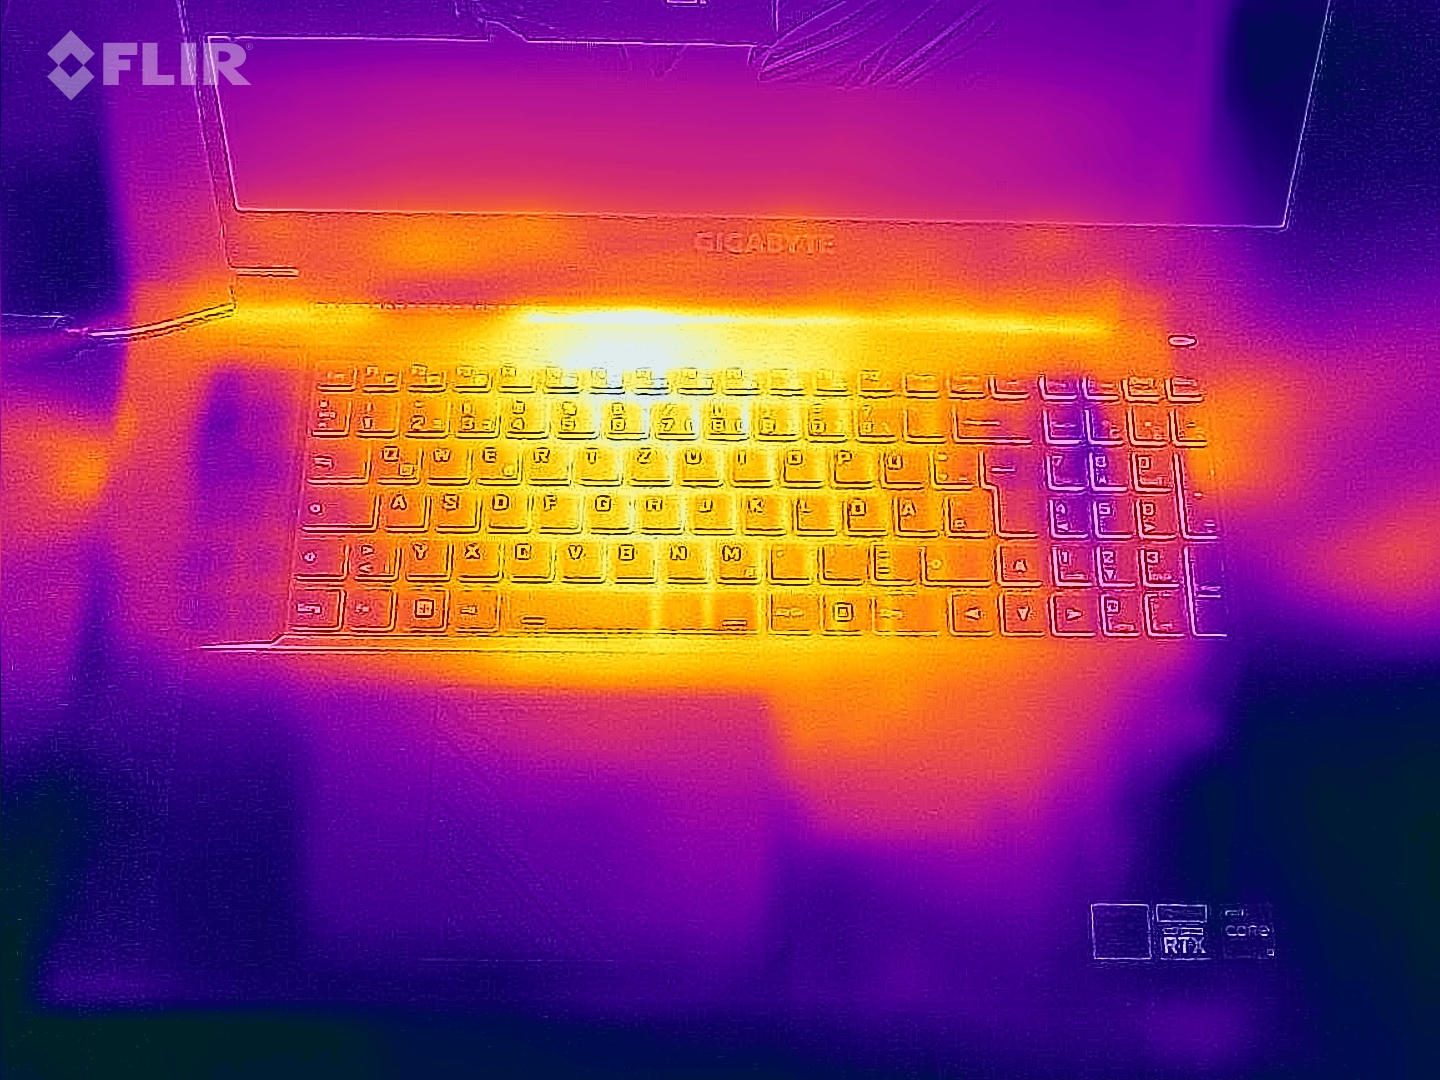
Durante o uso diário (escritório, web), as temperaturas de superfície permanecem razoáveis. Enquanto o desenvolvimento do calor sob carga (teste de estresse, Witcher 3) é significativo, não atinge níveis críticos. A CPU atinge temperaturas próximas a seu limite de 100°C.
(-) A temperatura máxima no lado superior é 52 °C / 126 F, em comparação com a média de 40.4 °C / 105 F , variando de 21.2 a 68.8 °C para a classe Gaming.
(-) A parte inferior aquece até um máximo de 54 °C / 129 F, em comparação com a média de 43.2 °C / 110 F
(+) Em uso inativo, a temperatura média para o lado superior é 26.6 °C / 80 F, em comparação com a média do dispositivo de 33.9 °C / ### class_avg_f### F.
(-) Jogando The Witcher 3, a temperatura média para o lado superior é 40.6 °C / 105 F, em comparação com a média do dispositivo de 33.9 °C / ## #class_avg_f### F.
(+) Os apoios para as mãos e o touchpad estão atingindo a temperatura máxima da pele (34 °C / 93.2 F) e, portanto, não estão quentes.
(-) A temperatura média da área do apoio para as mãos de dispositivos semelhantes foi 28.8 °C / 83.8 F (-5.2 °C / -9.4 F).
| Gigabyte G7 KE Intel Core i5-12500H, NVIDIA GeForce RTX 3060 Laptop GPU | HP Pavilion Gaming 17-cd2146ng Intel Core i5-11300H, NVIDIA GeForce RTX 3050 Ti Laptop GPU | Acer Nitro 5 AN517-55-738R Intel Core i7-12700H, NVIDIA GeForce RTX 3060 Laptop GPU | Asus TUF Gaming F17 FX707Z-HX011W Intel Core i7-12700H, NVIDIA GeForce RTX 3060 Laptop GPU | Lenovo IdeaPad Gaming 3 15IAH7 Intel Core i5-12500H, NVIDIA GeForce RTX 3050 Ti Laptop GPU | |
|---|---|---|---|---|---|
| Heat | 12% | -6% | 1% | 13% | |
| Maximum Upper Side * (°C) | 52 | 44 15% | 48.3 7% | 52 -0% | 47 10% |
| Maximum Bottom * (°C) | 54 | 48 11% | 52 4% | 47 13% | 52 4% |
| Idle Upper Side * (°C) | 28 | 27 4% | 34.5 -23% | 31 -11% | 25 11% |
| Idle Bottom * (°C) | 32 | 27 16% | 35.8 -12% | 31 3% | 24 25% |
* ... menor é melhor
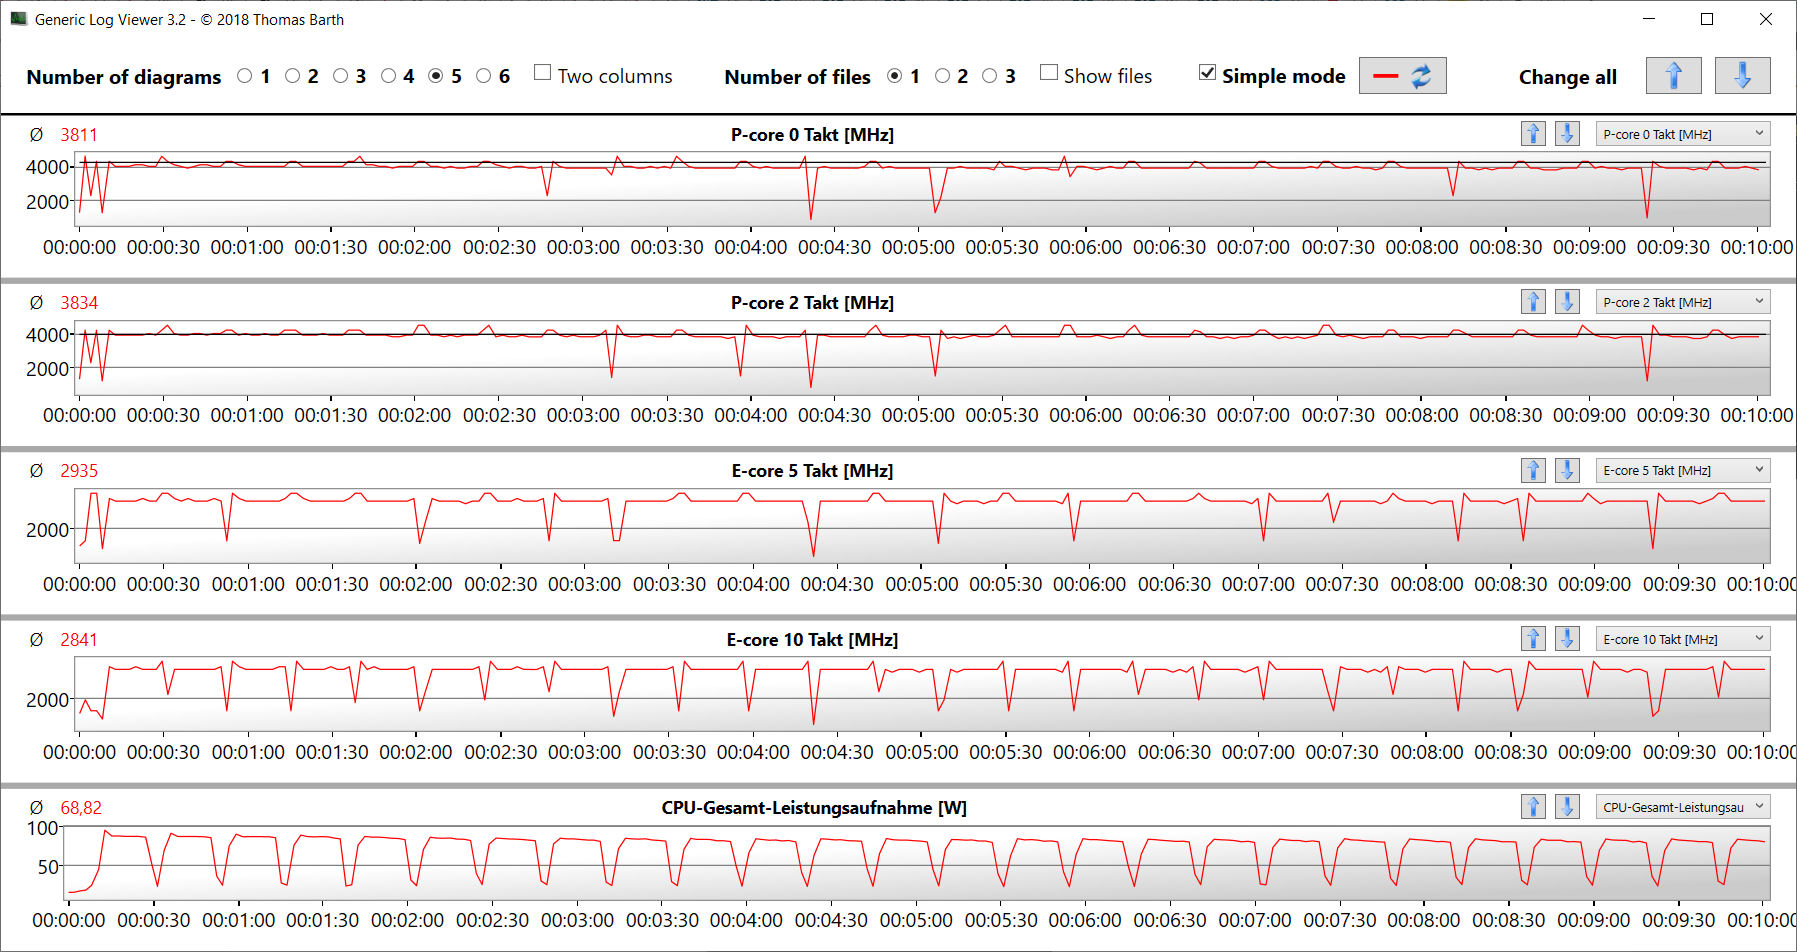
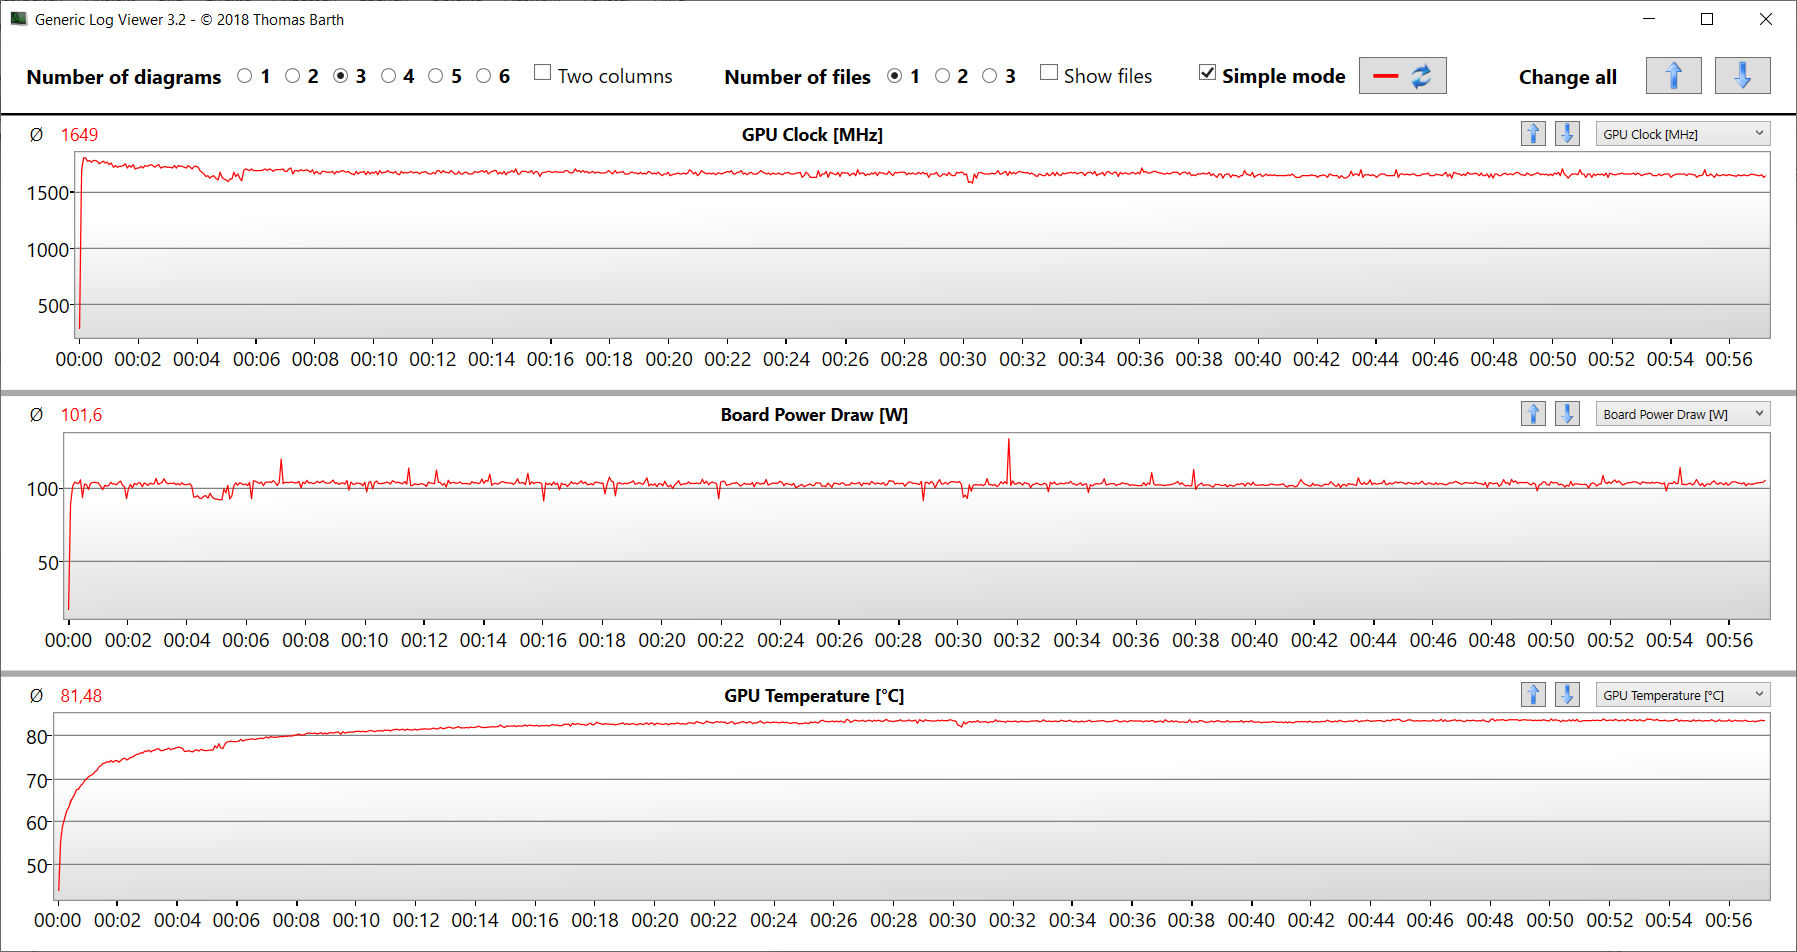
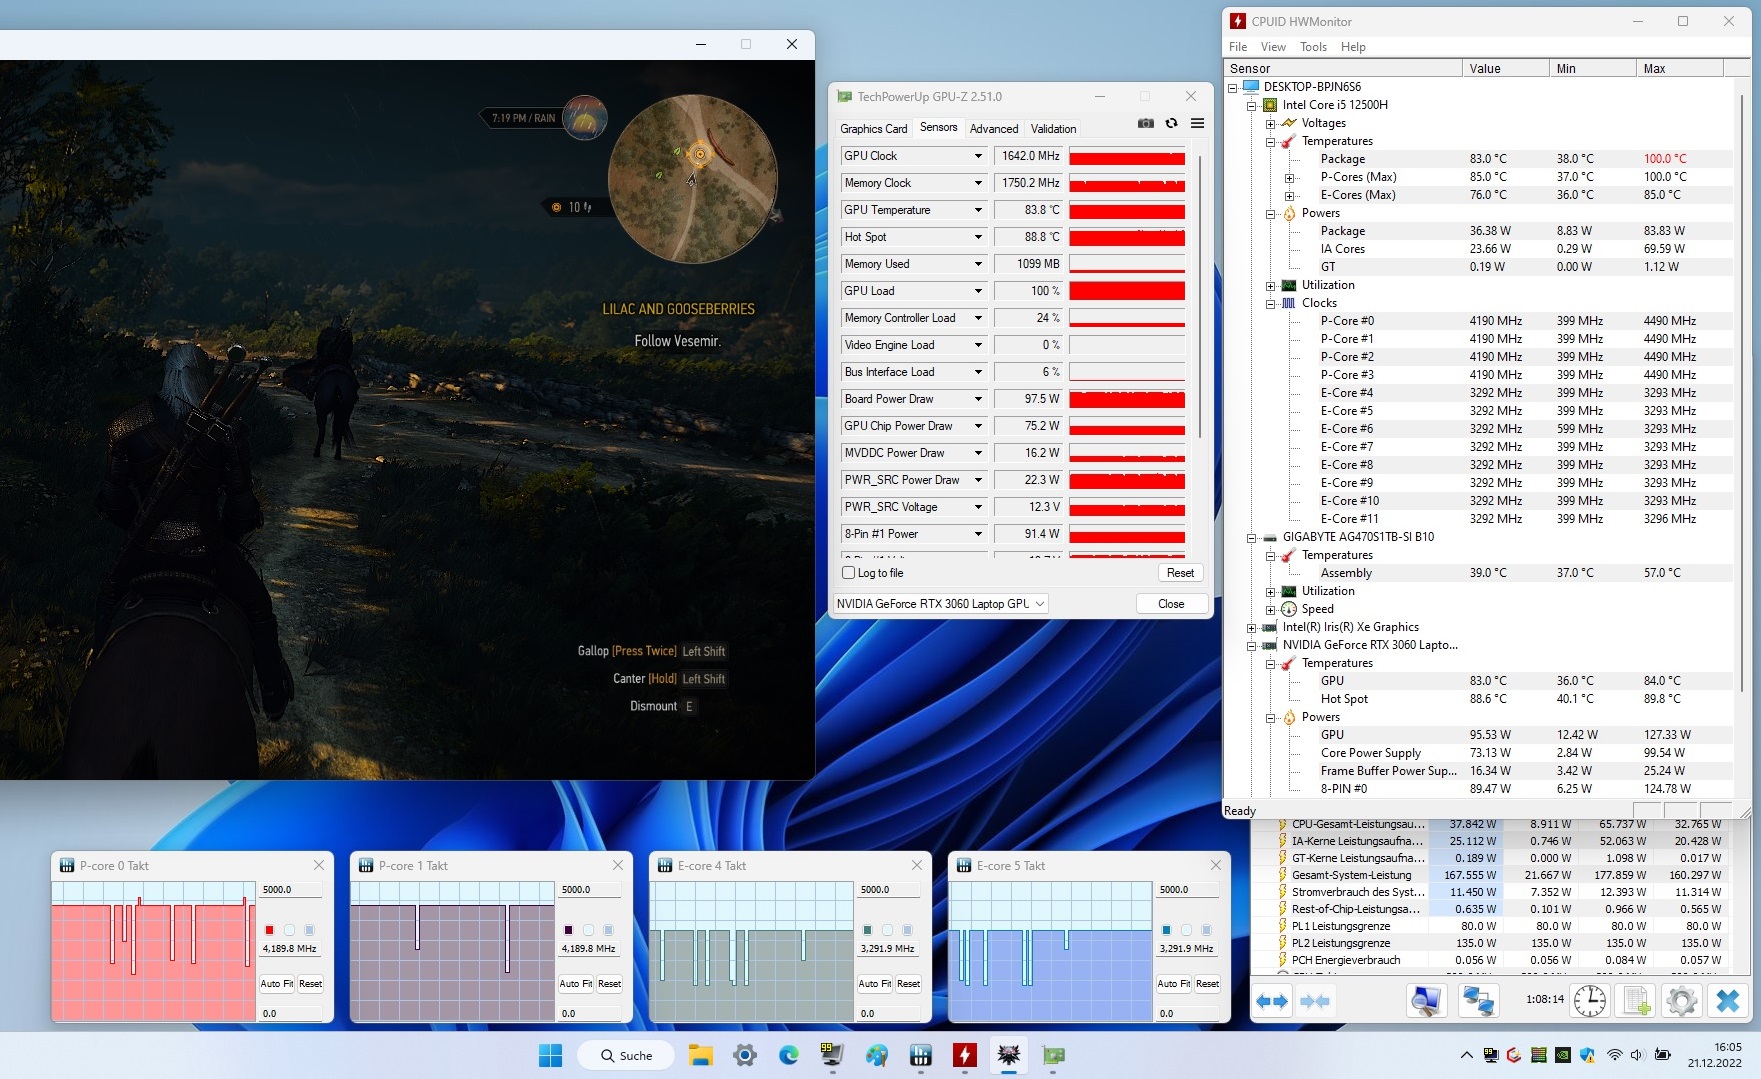
Teste de estresse
Nosso teste de estresse (estresse contínuo Prime95 e FurMark) representa um cenário extremo e serve como um teste de estabilidade para quando o sistema está com 100% de carga. A velocidade do relógio da CPU cai de 4,1 GHz (núcleos P) e 3,1 GHz (núcleos E) para em torno do relógio de base (P: 3 GHz, E: 2,5 GHz) ao longo de 15 minutos e, em seguida, permanece a esse nível. A velocidade do relógio GPU inicialmente flutua entre 1200 MHz e 1500 MHz, antes de eventualmente se estabilizar em 1150 MHz.
Oradores
O som produzido pelos alto-falantes estereofônicos é fino e carente em termos de graves. Recomendamos fones de ouvido externos ou alto-falantes para um melhor áudio.
Gigabyte G7 KE análise de áudio
(±) | o volume do alto-falante é médio, mas bom (###valor### dB)
Graves 100 - 315Hz
(-) | quase nenhum baixo - em média 23.4% menor que a mediana
(±) | a linearidade dos graves é média (10.8% delta para a frequência anterior)
Médios 400 - 2.000 Hz
(±) | médios mais altos - em média 11.1% maior que a mediana
(±) | a linearidade dos médios é média (10.6% delta para frequência anterior)
Altos 2 - 16 kHz
(±) | máximos mais altos - em média 6.5% maior que a mediana
(±) | a linearidade dos máximos é média (7.7% delta para frequência anterior)
Geral 100 - 16.000 Hz
(-) | o som geral não é linear (32% diferença em relação à mediana)
Comparado com a mesma classe
» 97% de todos os dispositivos testados nesta classe foram melhores, 1% semelhantes, 2% piores
» O melhor teve um delta de 6%, a média foi 18%, o pior foi 132%
Comparado com todos os dispositivos testados
» 91% de todos os dispositivos testados foram melhores, 2% semelhantes, 7% piores
» O melhor teve um delta de 4%, a média foi 24%, o pior foi 134%
HP Pavilion Gaming 17-cd2146ng análise de áudio
(±) | o volume do alto-falante é médio, mas bom (###valor### dB)
Graves 100 - 315Hz
(-) | quase nenhum baixo - em média 19.5% menor que a mediana
(±) | a linearidade dos graves é média (11.5% delta para a frequência anterior)
Médios 400 - 2.000 Hz
(+) | médios equilibrados - apenas 3.2% longe da mediana
(+) | médios são lineares (3.8% delta para frequência anterior)
Altos 2 - 16 kHz
(±) | máximos mais altos - em média 8.6% maior que a mediana
(±) | a linearidade dos máximos é média (8% delta para frequência anterior)
Geral 100 - 16.000 Hz
(±) | a linearidade do som geral é média (20.5% diferença em relação à mediana)
Comparado com a mesma classe
» 73% de todos os dispositivos testados nesta classe foram melhores, 5% semelhantes, 22% piores
» O melhor teve um delta de 6%, a média foi 18%, o pior foi 132%
Comparado com todos os dispositivos testados
» 54% de todos os dispositivos testados foram melhores, 8% semelhantes, 38% piores
» O melhor teve um delta de 4%, a média foi 24%, o pior foi 134%
Gerenciamento de energia - G7 Laptop com tempos de funcionamento aceitáveis
Consumo de energia
Durante o ocioso, observamos um ligeiro aumento da potência extraída do laptop Gigabyte. Uma olhada nos concorrentes mostra onde a faixa normal para um laptop Optimus. Durante o teste de estresse e o Witcher 3 teste, o consumo de energia corresponde às nossas expectativas para os componentes instalados. O adaptador AC incluído é bem dimensionado e capaz de gerenciar picos de consumo curtos, que excedem sua potência nominal (180 watts).
| desligado | |
| Ocioso | |
| Carga |
|
Key:
min: | |
| Gigabyte G7 KE i5-12500H, GeForce RTX 3060 Laptop GPU | HP Pavilion Gaming 17-cd2146ng i5-11300H, GeForce RTX 3050 Ti Laptop GPU | Acer Nitro 5 AN517-55-738R i7-12700H, GeForce RTX 3060 Laptop GPU | Asus TUF Gaming F17 FX707Z-HX011W i7-12700H, GeForce RTX 3060 Laptop GPU | Lenovo IdeaPad Gaming 3 15IAH7 i5-12500H, GeForce RTX 3050 Ti Laptop GPU | Média da turma Gaming | |
|---|---|---|---|---|---|---|
| Power Consumption | 35% | 3% | 25% | 28% | -4% | |
| Idle Minimum * (Watt) | 15 | 3 80% | 9.7 35% | 6.6 56% | 8 47% | 13.2 ? 12% |
| Idle Average * (Watt) | 17 | 8 53% | 14.6 14% | 8.3 51% | 10 41% | 18.9 ? -11% |
| Idle Maximum * (Watt) | 24 | 28 -17% | 16.7 30% | 11.8 51% | 16 33% | 24.5 ? -2% |
| Load Average * (Watt) | 111 | 88 21% | 166 -50% | 119 -7% | 99 11% | 108.8 ? 2% |
| Witcher 3 ultra * (Watt) | 174.1 | 98.2 44% | 169 3% | 144.6 17% | ||
| Load Maximum * (Watt) | 208 | 152 27% | 235 -13% | 222 -7% | 168 19% | 254 ? -22% |
* ... menor é melhor
Consumption Witcher 3 / Stress Test
Consumption external Monitor
Vida útil da bateria
O laptop de 17,3 polegadas atinge um tempo de execução de 5:17 h e 2:12 h em nosso Wi-Fi (navegação na web através de um roteiro) e teste de vídeo (reprodução do codec H.264, curta-metragem FHD Big Buck Bunny in a loop), respectivamente. Desabilitamos os recursos de economia de energia do laptop e definimos o brilho da tela para aproximadamente 150 nits antes de executar os testes. Além disso, desabilitamos os módulos sem fio para o teste de vídeo.
O tempo de execução do vídeo é muito decepcionante. Normalmente, esperaríamos pelo menos paridade com o tempo de execução do Wi-Fi. Evidentemente, o sistema sofre de um aumento do consumo de energia durante a reprodução. A fim de descartar um problema de software, testamos várias versões diferentes do driver para o iGPU da Intel, que foi usado para reprodução. Da mesma forma, o sistema operacional também não parece ser o culpado: observamos um curto tempo de execução tanto no Windows 10 quanto no Windows 11. Isto sugere um problema interno que somente o Gigabyte pode ser capaz de resolver.
| Gigabyte G7 KE i5-12500H, GeForce RTX 3060 Laptop GPU, 54 Wh | HP Pavilion Gaming 17-cd2146ng i5-11300H, GeForce RTX 3050 Ti Laptop GPU, 52.5 Wh | Acer Nitro 5 AN517-55-738R i7-12700H, GeForce RTX 3060 Laptop GPU, 90.61 Wh | Asus TUF Gaming F17 FX707Z-HX011W i7-12700H, GeForce RTX 3060 Laptop GPU, 90 Wh | Lenovo IdeaPad Gaming 3 15IAH7 i5-12500H, GeForce RTX 3050 Ti Laptop GPU, 60 Wh | Média da turma Gaming | |
|---|---|---|---|---|---|---|
| Duração da bateria | -6% | 69% | 130% | 11% | 86% | |
| Reader / Idle (h) | 7.1 | 11.7 65% | 8.71 ? 23% | |||
| H.264 (h) | 2.2 | 5.3 141% | 7.7 250% | 8.28 ? 276% | ||
| WiFi v1.3 (h) | 5.3 | 5 -6% | 6.5 23% | 8.7 64% | 5.9 11% | 6.96 ? 31% |
| Load (h) | 1.3 | 1.9 46% | 2.3 77% | 1.47 ? 13% |
Pro
Contra
Veredicto - Caderno de Jogos Acessível
Com o G7 KE, a Gigabyte criou um laptop para jogos FHD relativamente acessível, que também funciona bem quando se trata de edição e renderização de vídeo - isso é possível graças ao Núcleo i5-12500H CPU e o GeForce Computador portátil RTX 3060 GPU. Enquanto isso, o SSD PCIe-4 (1 TB) de alta velocidade garante curtos tempos de carregamento.
O Gigabyte G7 KE é um sólido laptop para jogos. Os inconvenientes que encontramos são bem menores.
Embora o desenvolvimento de calor do sistema sob carga não seja excessivo, os níveis de ruído resultantes são relativamente altos - muitos concorrentes se saem melhor a este respeito. Ficamos satisfeitos com a qualidade do display mate de 17,3 polegadas (FHD, IPS, 300 Hz, sRGB) em geral.
O G7 atinge tempos de execução razoavelmente aceitáveis apesar de sua bateria de baixa capacidade (54 Wh). Infelizmente, a bateria não pode ser recarregada através de um carregador USB-C universal - nenhuma das portas USB-C (1x Thunderbolt 4, 1x USB 3.2 gen. 2) oferece suporte de fornecimento de energia.
A falta de um sistema operacional Windows incluído não é uma razão insignificante para o preço relativamente barato. Se você não possui uma licença Windows válida e não deseja comprar uma, a instalação de uma distribuição Linux também deve ser possível. Entretanto, o processo de instalação e configuração do sistema operacional alternativo pode ser muito desafiador para alguns usuários.
O Asus TUF Gaming F17 pode ser uma alternativa para o G7 KE. Embora esteja equipada com a mesma GPU, seu desempenho 3D é ligeiramente melhor e a vida útil da bateria também é mais longa. Dito isto, o sistema vem com um prêmio de cerca de 200-300 USD.
Preço e Disponibilidade
Embora o Gigabyte G7 KE configurado ainda não esteja amplamente disponível nos principais varejistas dos EUA, esperamos que os modelos cheguem em breve por cerca de 1.200 USD.
Gigabyte G7 KE
- 01/21/2023 v7 (old)
Sascha Mölck
Price comparison

