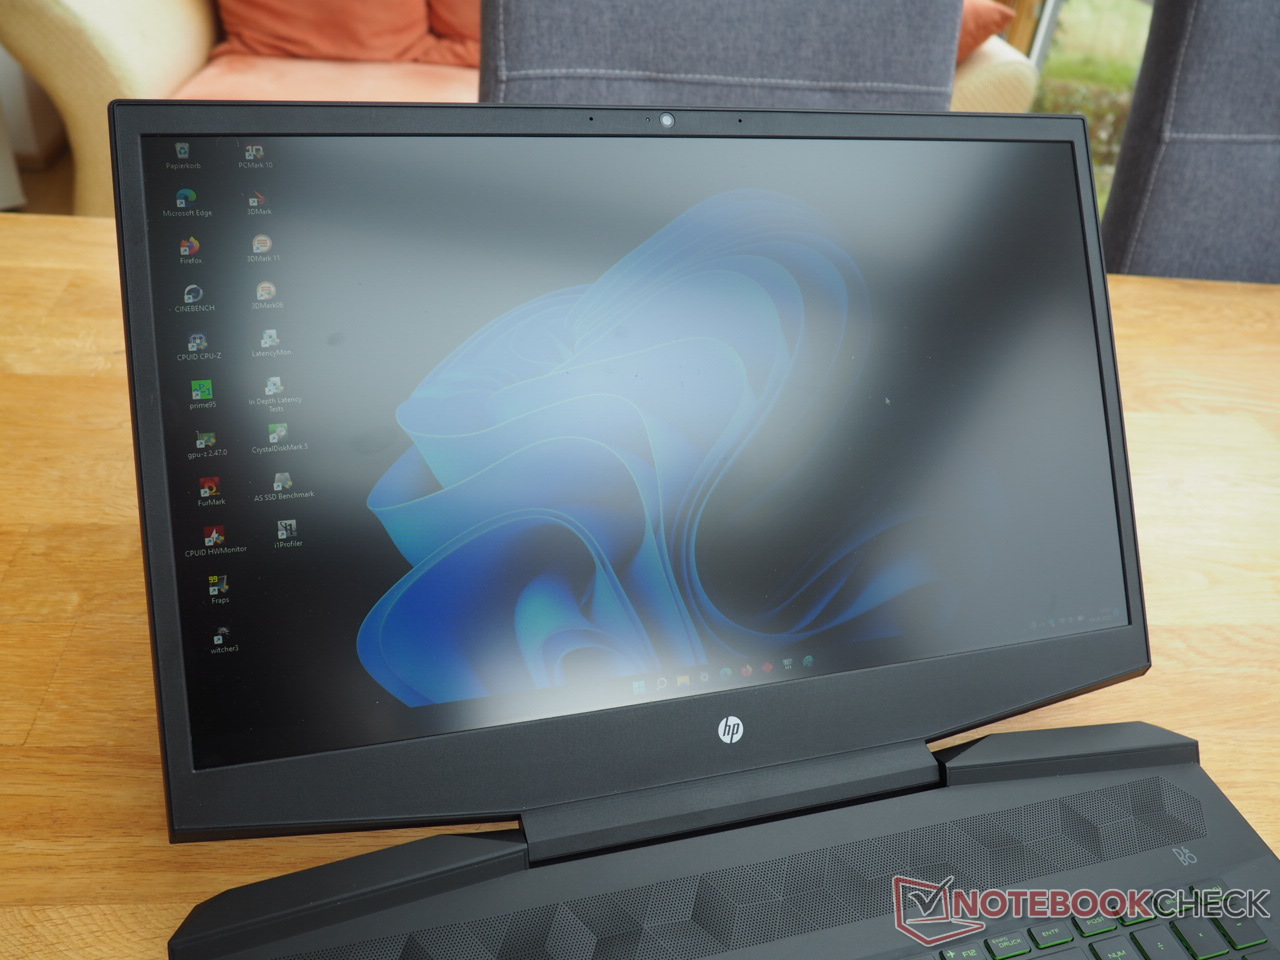
HP Pavilion Revisão do laptop Gaming 17: Uma boa exibição a um preço orçamentário
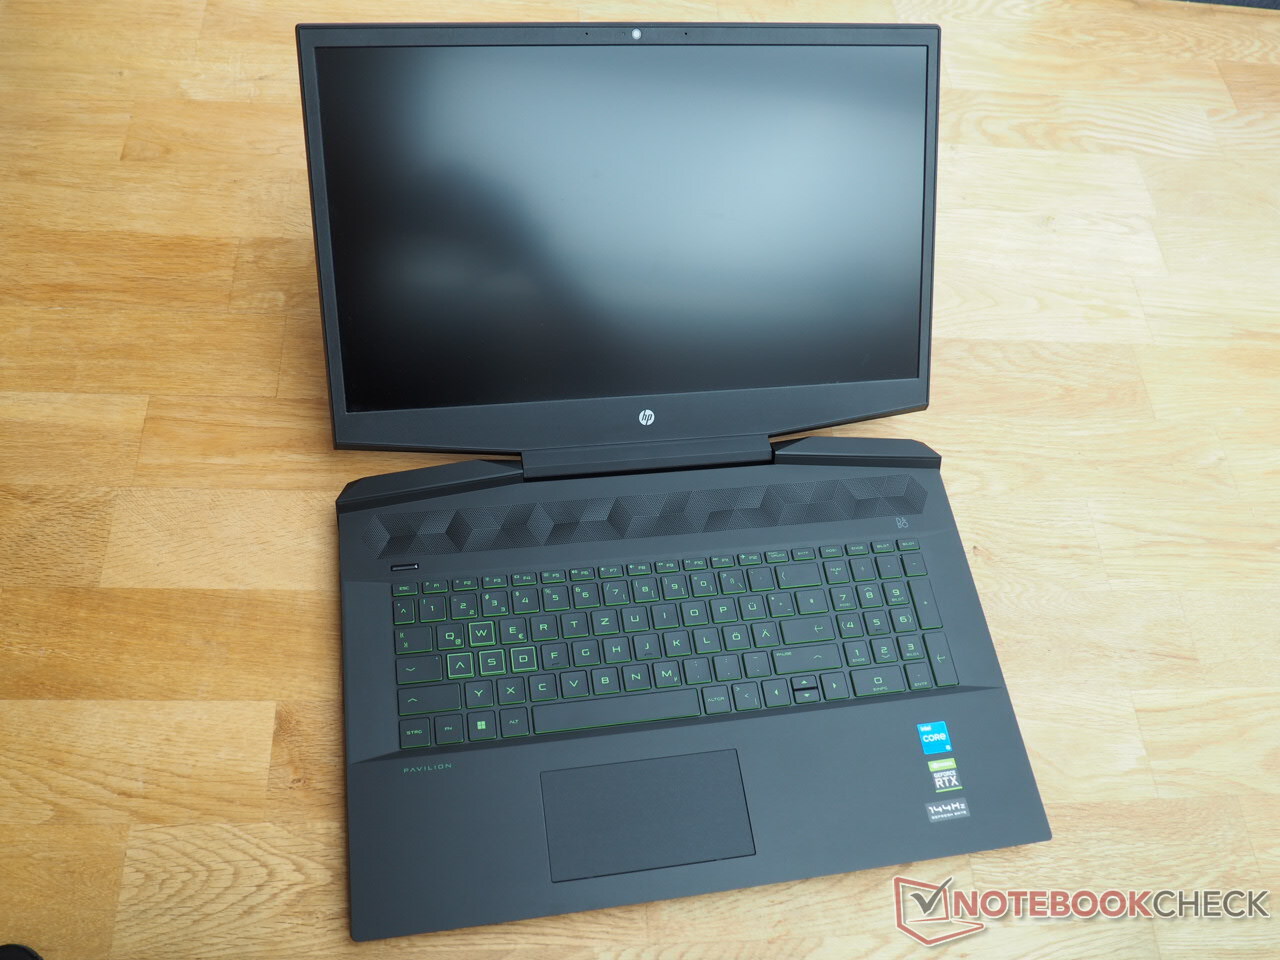
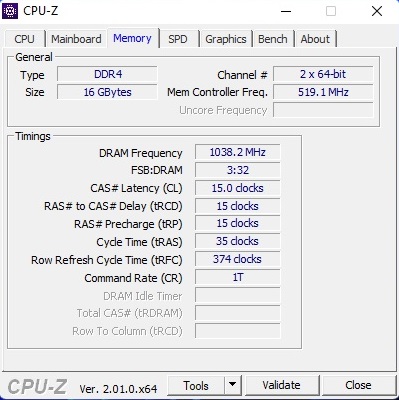
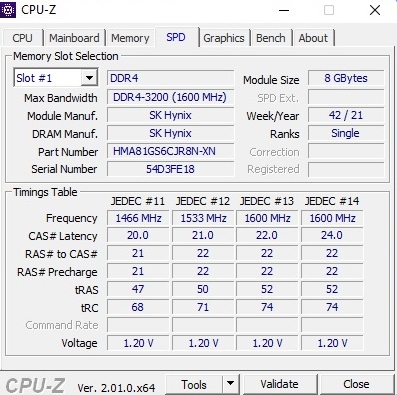
Os usuários que procuram um laptop para jogos por menos de 1.000 Euros (~$1.002) já devem ter se deparado com o Pavilion Gaming 17. O modelo cd2146ng que revisamos está equipado com componentes de médio alcance bem balanceados, ou seja, umNúcleo i5-11300H e umGeForce RTX 3050 Ti incluindo 4 GB de VRAM. 16 GB de RAM DDR4 (2x 8 GB em canal duplo) e um SSD NVMe de 512 GB também é decente nesta faixa de preço. A exibição é mais do que satisfatória: A tela Matte Full HD IPS suporta 144 Hz e deve atingir cerca de 300 nits de acordo com a HP. Analisaremos se esta afirmação é verdadeira em um momento. Enquanto isso, é um pouco vergonhoso que nosso modelo de revisão não tenha um sistema operacional "real" (apenas o FreeDOS está a bordo). Entretanto, licenças compatíveis com Windows - como a da versão 11 Pro que instalamos mais tarde - podem ser compradas online a um preço muito baixo
Os principais concorrentes do Pavilion Gaming 17 incluem outros laptops de 15 a 17 polegadas de orçamento equipados com o GeForce RTX 3050 Ti, tais como o Dell G15 5510o Lenovo IdeaPad Gaming 3 15IHUe o interno HP Victus 16. Cada um destes últimos laptops aparecem nas tabelas como dispositivos de comparação
Possíveis concorrentes em comparação
Avaliação | Data | Modelo | Peso | Altura | Size | Resolução | Preço |
|---|---|---|---|---|---|---|---|
| 82.7 % v7 (old) | 09/2022 | HP Pavilion Gaming 17-cd2146ng i5-11300H, GeForce RTX 3050 Ti Laptop GPU | 2.8 kg | 25 mm | 17.30" | 1920x1080 | |
| 79.1 % v7 (old) | 05/2022 | Dell G15 5510-43NHT i5-10200H, GeForce RTX 3050 Ti Laptop GPU | 2.5 kg | 23.33 mm | 15.60" | 1920x1080 | |
| 79.7 % v7 (old) | 03/2022 | Lenovo Ideapad Gaming 3 15IHU-82K1002RGE i5-11300H, GeForce RTX 3050 Ti Laptop GPU | 2 kg | 24.2 mm | 15.60" | 1920x1080 | |
| 82.3 % v7 (old) | 05/2022 | HP Victus 16-e0145ng R5 5600H, GeForce RTX 3050 Ti Laptop GPU | 2.4 kg | 23.5 mm | 16.10" | 1920x1080 | |
| 81.6 % v7 (old) | 07/2019 | HP Pavilion Gaming 17-cd0085cl i7-9750H, GeForce GTX 1660 Ti Max-Q | 2.8 kg | 25 mm | 17.30" | 1920x1080 |
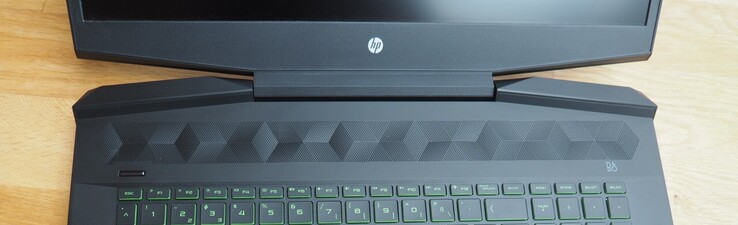
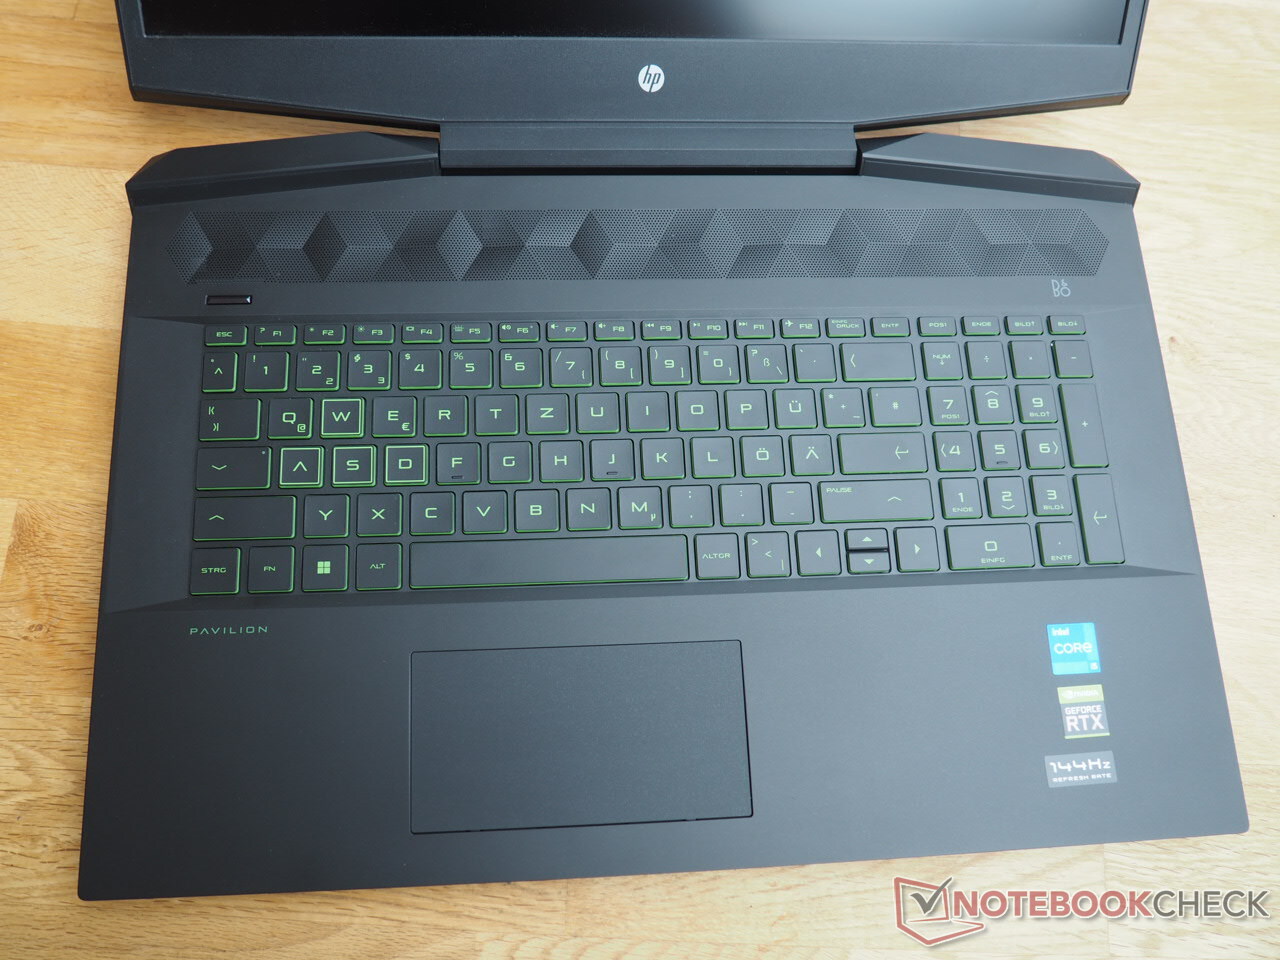
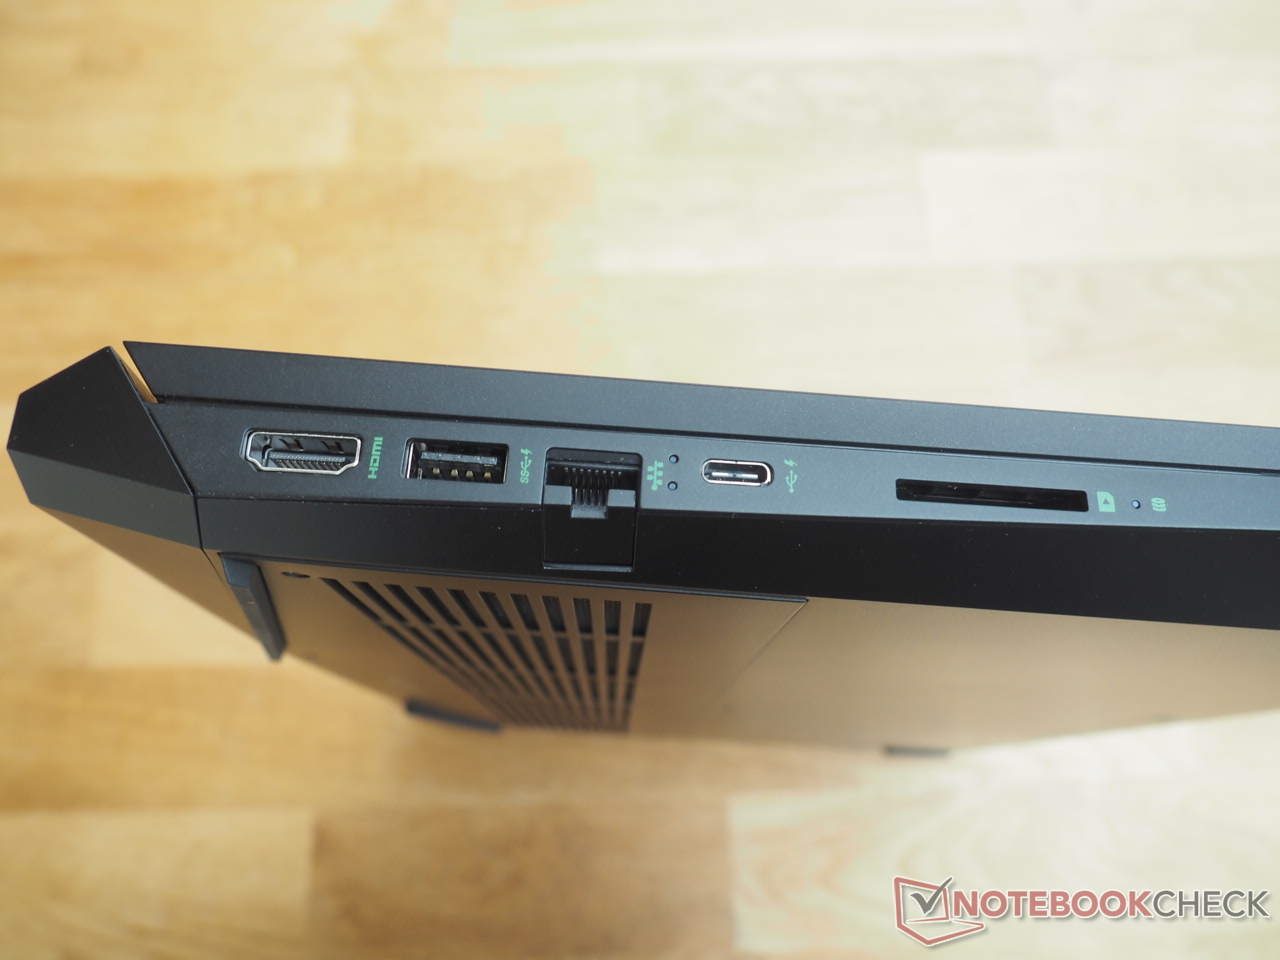
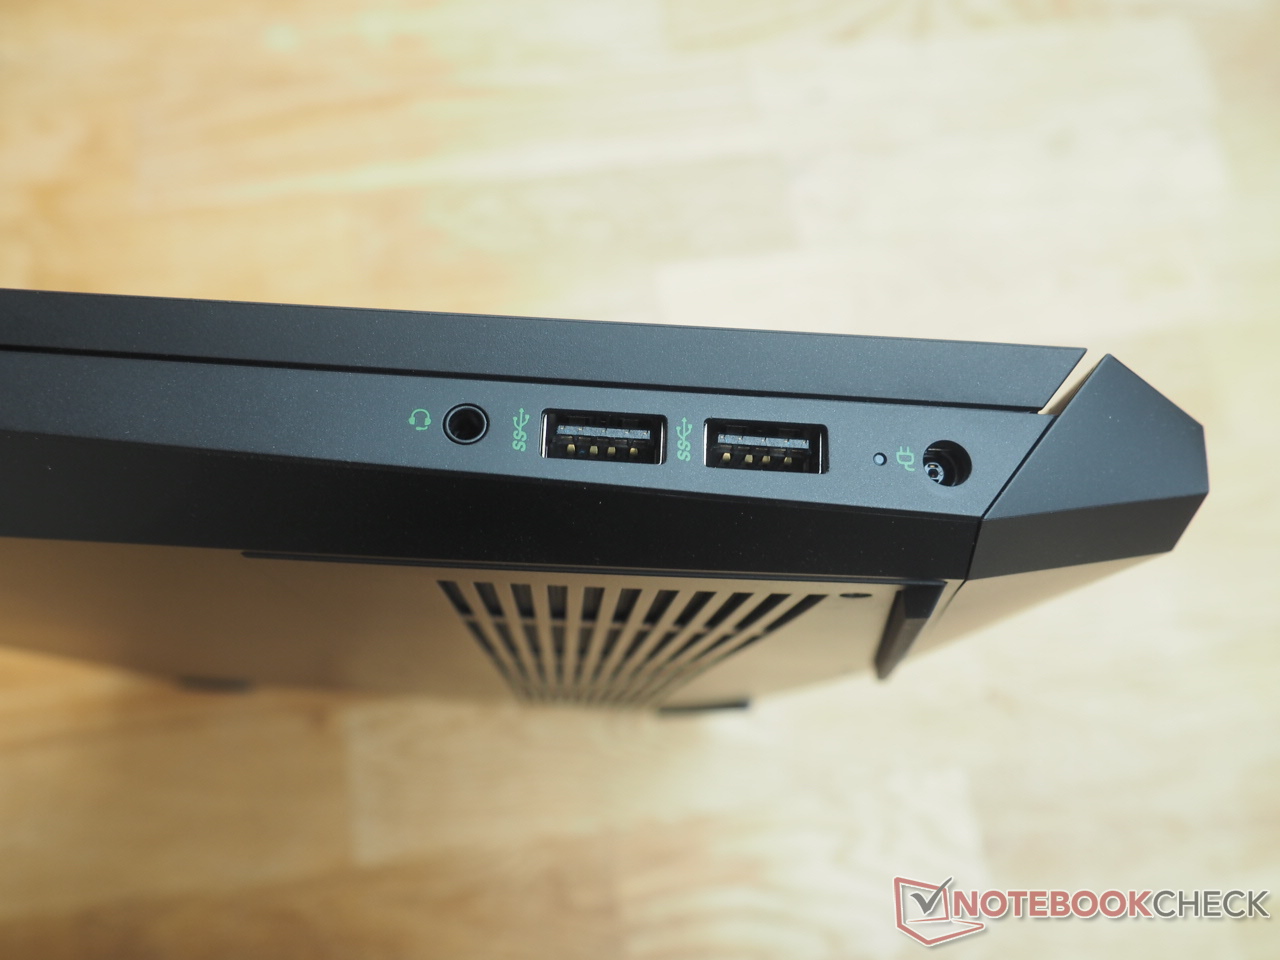
Como o chassi é externamente idêntico ao do (pré)antecessor, não entraremos novamente no caso, os dispositivos de entrada e a conectividade neste artigo. Você pode encontrar as informações correspondentes em nossa revisão do Pavilion Jogos 17-cd0085cl
Leitor de cartões SD
| SD Card Reader - average JPG Copy Test (av. of 3 runs) | |
| Média da turma Gaming (20.9 - 210, n=55, últimos 2 anos) | |
| HP Pavilion Gaming 17-cd0085cl (Toshiba Exceria Pro SDXC 64 GB UHS-II) | |
| HP Victus 16-e0145ng (AV PRO microSD 128 GB V60) | |
| HP Pavilion Gaming 17-cd2146ng (AV PRO microSD 128 GB V60) | |
Comunicação
| Networking - iperf3 receive AXE11000 | |
| Média da turma Gaming (680 - 1745, n=96, últimos 2 anos) | |
| HP Pavilion Gaming 17-cd2146ng | |
| Média Realtek RTL8852AE (n=1) | |
| HP Victus 16-e0145ng | |
Webcam


Mostrar
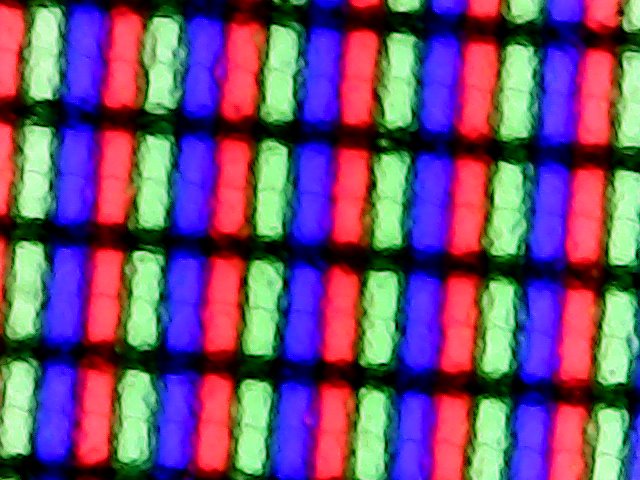
Como mencionado anteriormente, é bastante incomum encontrar boas exibições em laptops de baixo preço para jogos. Felizmente, o Pavilion Gaming 17 é uma das poucas exceções
| |||||||||||||||||||||||||
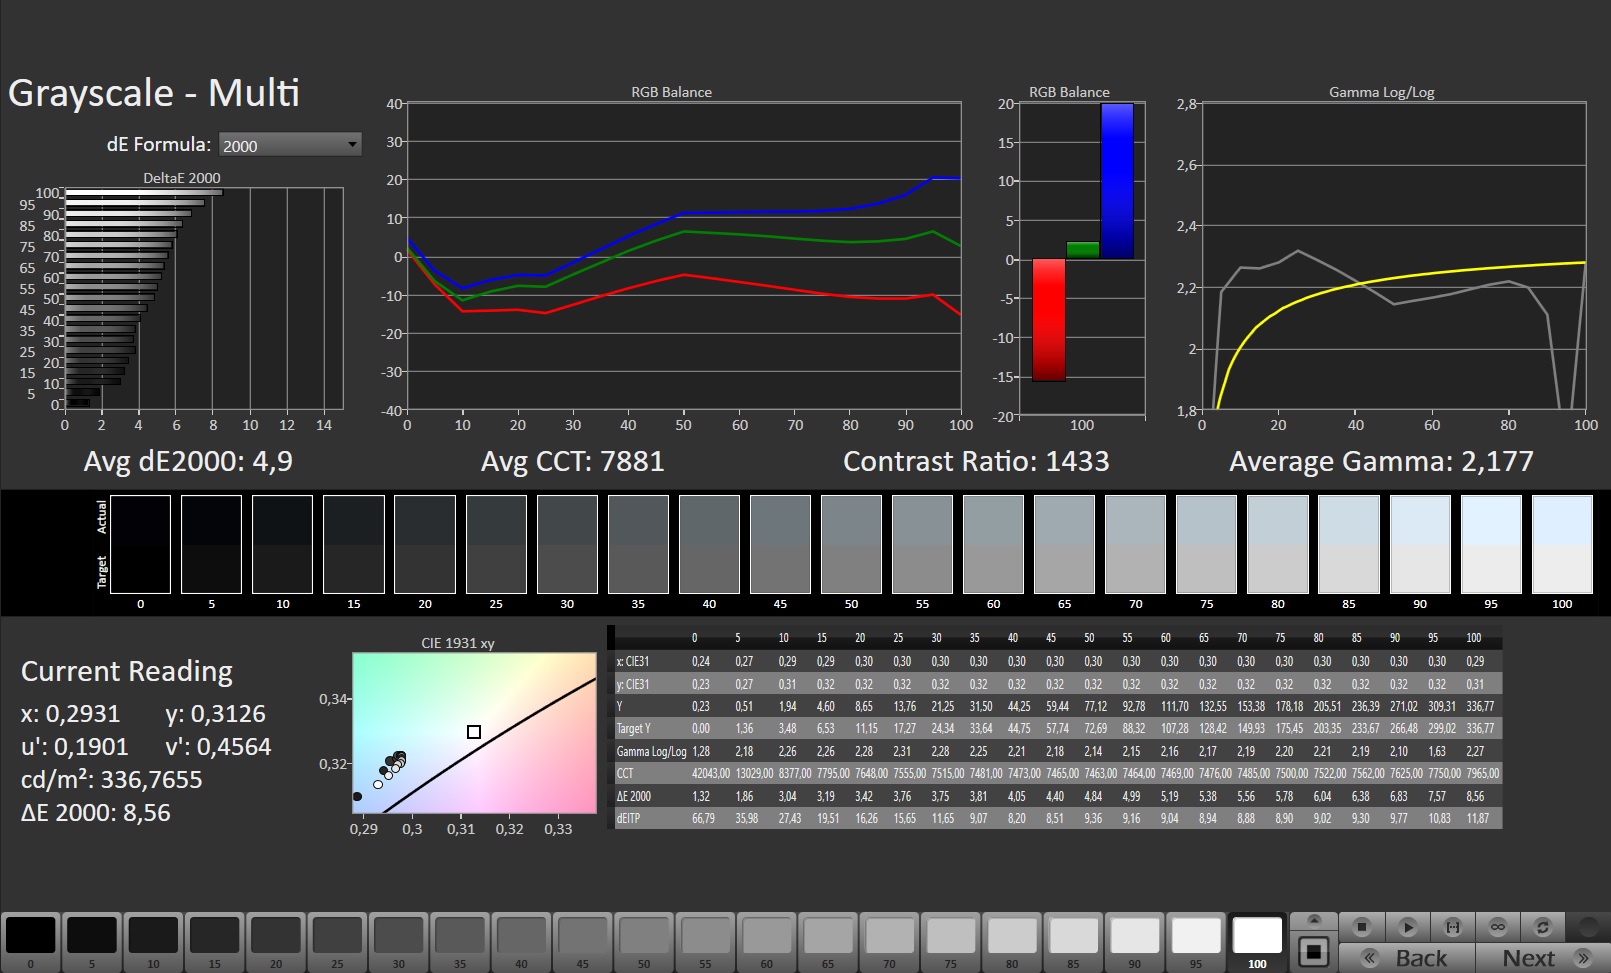
iluminação: 94 %
iluminação com acumulador: 328 cd/m²
Contraste: 1426:1 (Preto: 0.23 cd/m²)
ΔE ColorChecker Calman: 3.83 | ∀{0.5-29.43 Ø4.73}
calibrated: 0.83
ΔE Greyscale Calman: 4.9 | ∀{0.09-98 Ø4.97}
66.5% AdobeRGB 1998 (Argyll 3D)
96.8% sRGB (Argyll 3D)
64.8% Display P3 (Argyll 3D)
Gamma: 2.177
CCT: 7881 K
| HP Pavilion Gaming 17-cd2146ng LGD0611, IPS, 1920x1080, 17.3" | Dell G15 5510-43NHT Dell 156GL05, IPS, 1920x1080, 15.6" | Lenovo Ideapad Gaming 3 15IHU-82K1002RGE LEN156FHD, IPS, 1920x1080, 15.6" | HP Victus 16-e0145ng CMN1609, IPS, 1920x1080, 16.1" | HP Pavilion Gaming 17-cd0085cl BOE0825, IPS, 1920x1080, 17.3" | |
|---|---|---|---|---|---|
| Display | -37% | -38% | -36% | -4% | |
| Display P3 Coverage (%) | 64.8 | 40.8 -37% | 39.7 -39% | 41.6 -36% | 63.3 -2% |
| sRGB Coverage (%) | 96.8 | 61.4 -37% | 59.6 -38% | 61.9 -36% | 90.2 -7% |
| AdobeRGB 1998 Coverage (%) | 66.5 | 42.2 -37% | 41.1 -38% | 43 -35% | 64.3 -3% |
| Response Times | -193% | -285% | -128% | -137% | |
| Response Time Grey 50% / Grey 80% * (ms) | 12.7 ? | 35 ? -176% | 46.4 ? -265% | 29.6 ? -133% | 31.6 ? -149% |
| Response Time Black / White * (ms) | 8.7 ? | 27 ? -210% | 35.2 ? -305% | 19.4 ? -123% | 19.6 ? -125% |
| PWM Frequency (Hz) | |||||
| Screen | -117% | -77% | -80% | -40% | |
| Brightness middle (cd/m²) | 328 | 290 -12% | 307 -6% | 257 -22% | 299.6 -9% |
| Brightness (cd/m²) | 317 | 267 -16% | 292 -8% | 239 -25% | 285 -10% |
| Brightness Distribution (%) | 94 | 87 -7% | 88 -6% | 88 -6% | 86 -9% |
| Black Level * (cd/m²) | 0.23 | 1.085 -372% | 0.21 9% | 0.25 -9% | 0.33 -43% |
| Contrast (:1) | 1426 | 267 -81% | 1462 3% | 1028 -28% | 908 -36% |
| Colorchecker dE 2000 * | 3.83 | 6.5 -70% | 5.9 -54% | 6.91 -80% | 3.68 4% |
| Colorchecker dE 2000 max. * | 8.51 | 16.96 -99% | 21.6 -154% | 22.27 -162% | 8.05 5% |
| Colorchecker dE 2000 calibrated * | 0.83 | 4.11 -395% | 4.8 -478% | 3.61 -335% | 3.15 -280% |
| Greyscale dE 2000 * | 4.9 | 4.85 1% | 4.9 -0% | 7.5 -53% | 3.8 22% |
| Gamma | 2.177 101% | 2.22 99% | 2.26 97% | 2.125 104% | 2.12 104% |
| CCT | 7881 82% | 7401 88% | 6504 100% | 6025 108% | 7240 90% |
| Color Space (Percent of AdobeRGB 1998) (%) | 58.1 | ||||
| Color Space (Percent of sRGB) (%) | 89.8 | ||||
| Média Total (Programa/Configurações) | -116% /
-111% | -133% /
-99% | -81% /
-77% | -60% /
-46% |
* ... menor é melhor
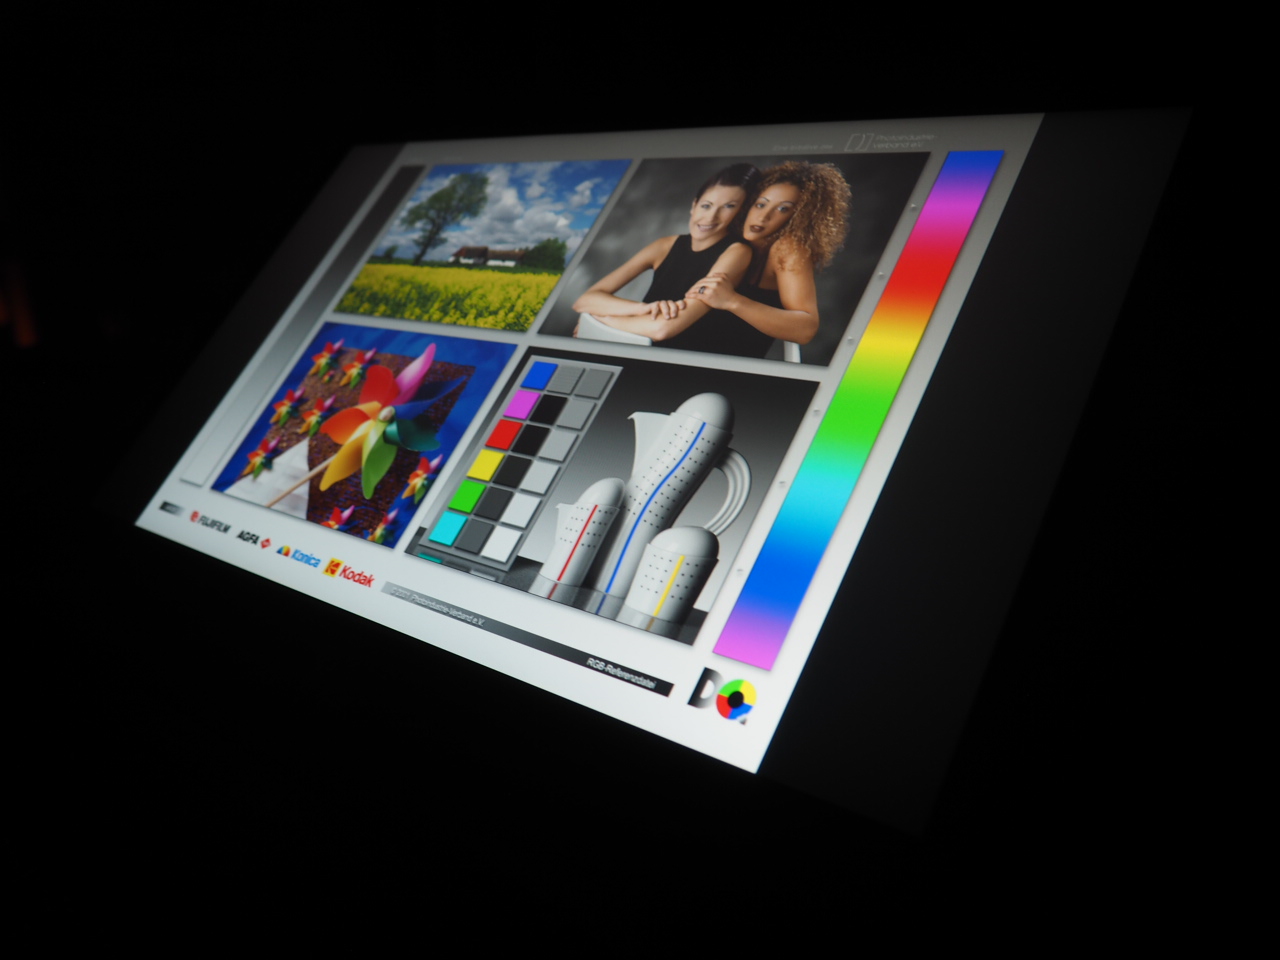
Com uma cobertura sRGB registrada de 97%, que está próxima da especificação do fabricante, o laptop da HP está dando um salto e se antecipando à concorrência. Tanto o Dell G15 quanto o Lenovo IdeaPad Gaming 3 alcançam apenas cerca de 60%, resultando em uma imagem muito mais pálida independentemente do contraste, que tende a ser adequada apenas para navegação no escritório e na Internet, mas não para consumo de mídia (vídeos, filmes, jogos, etc.). Em contraste, o Pavilion 17 corta um belo número em cada aplicação
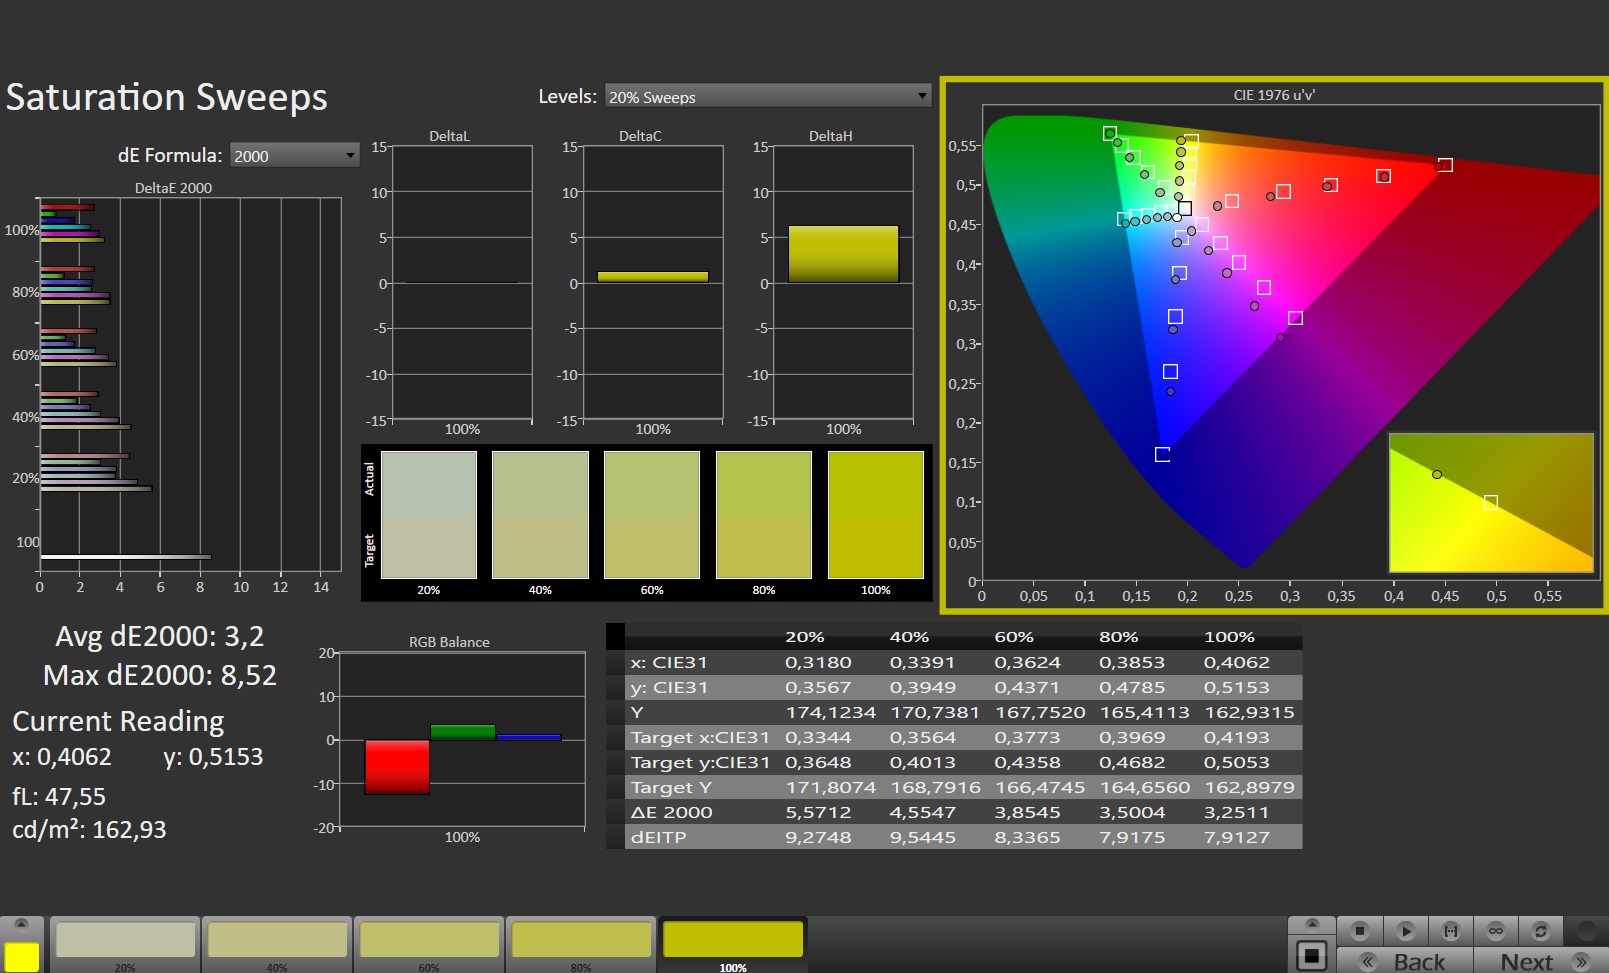
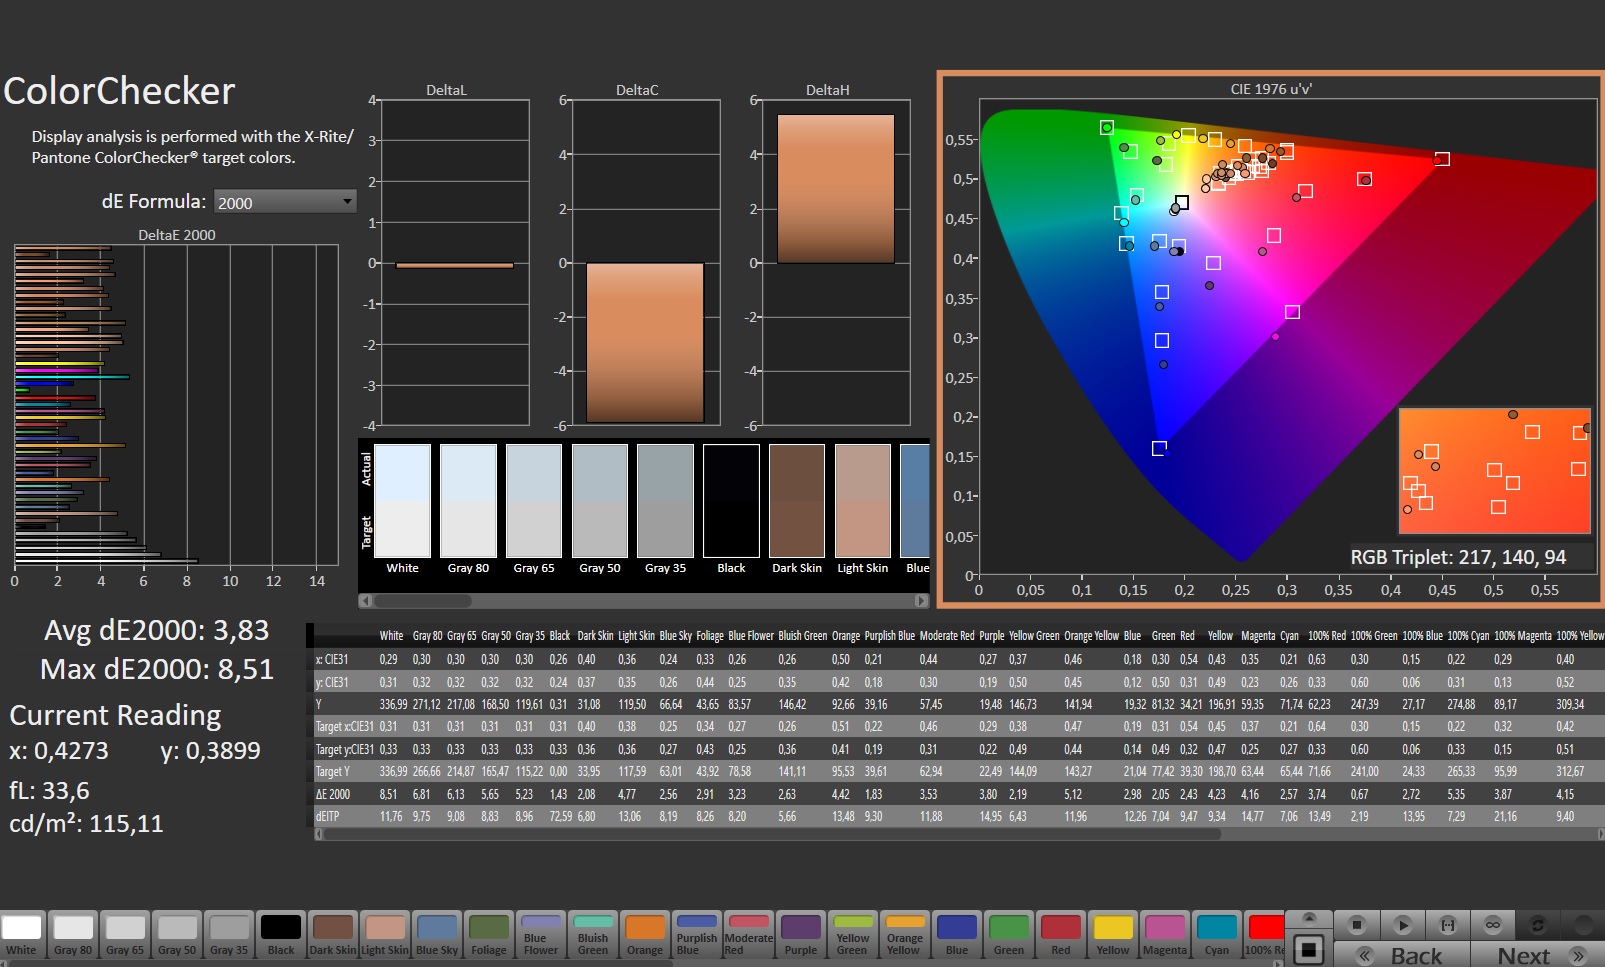
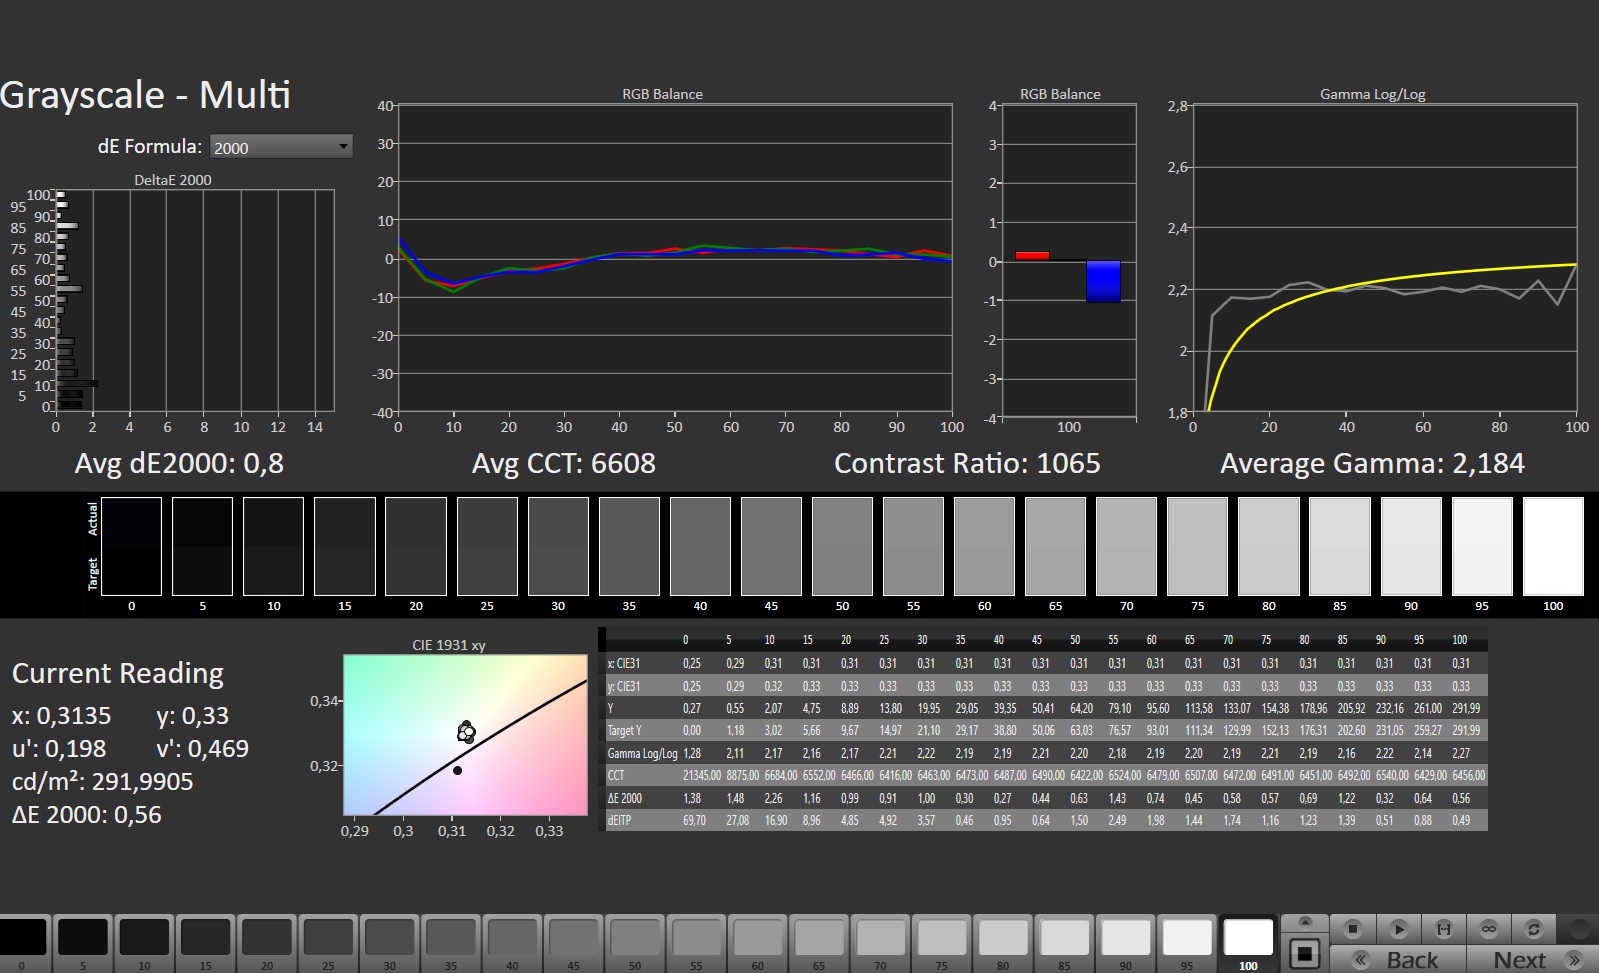
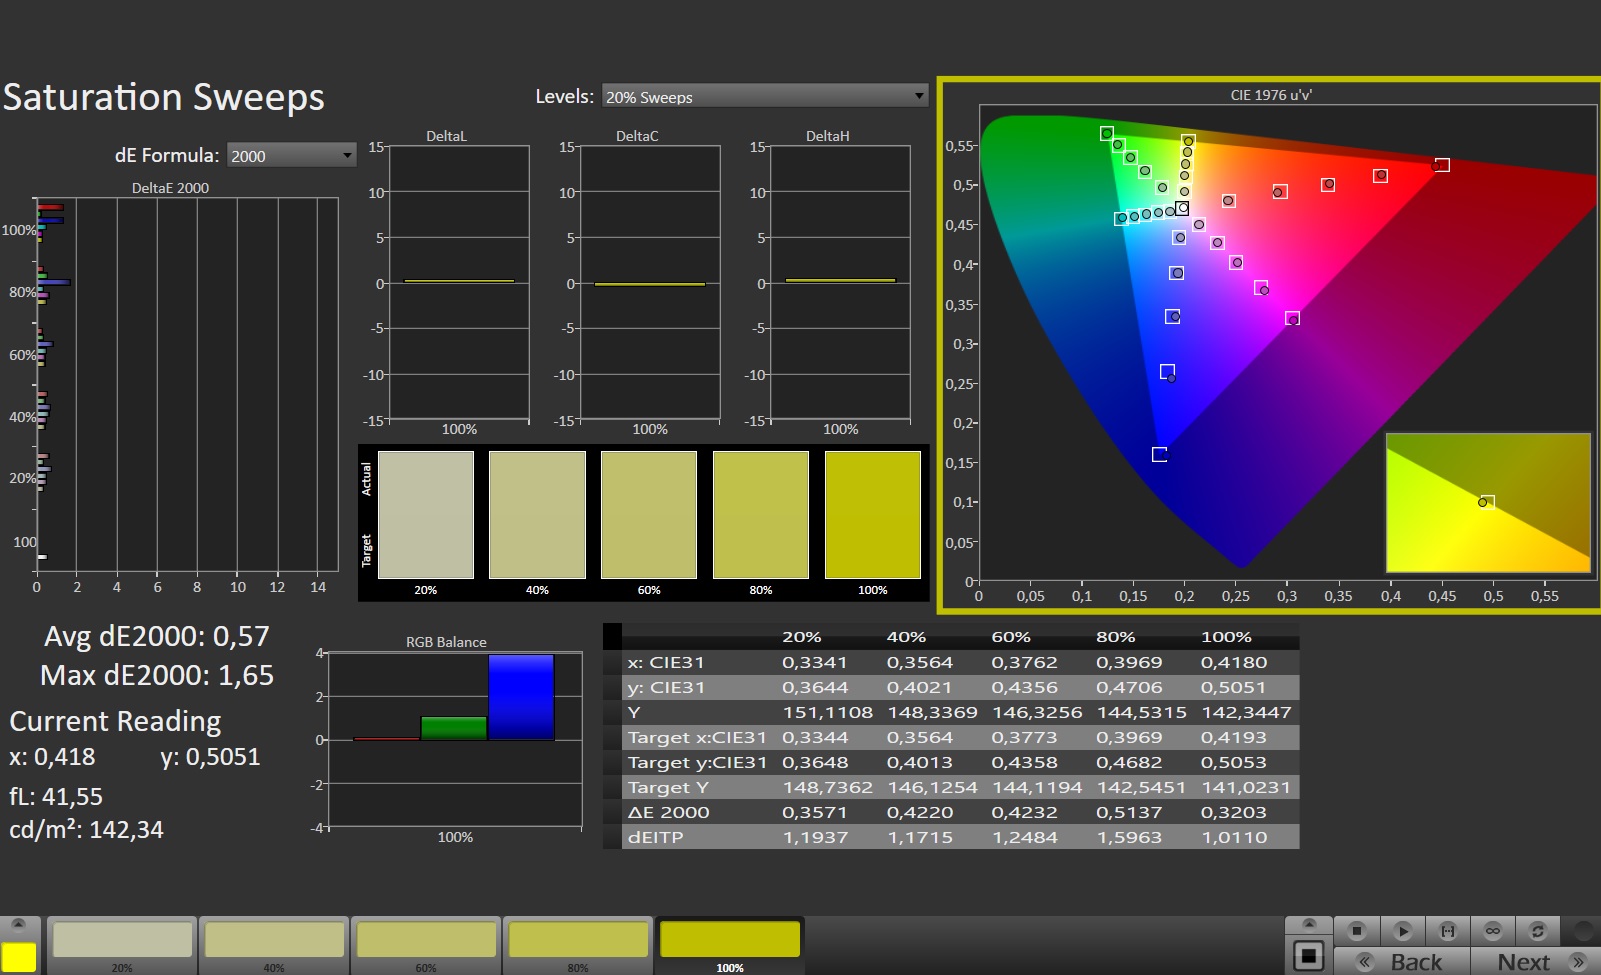
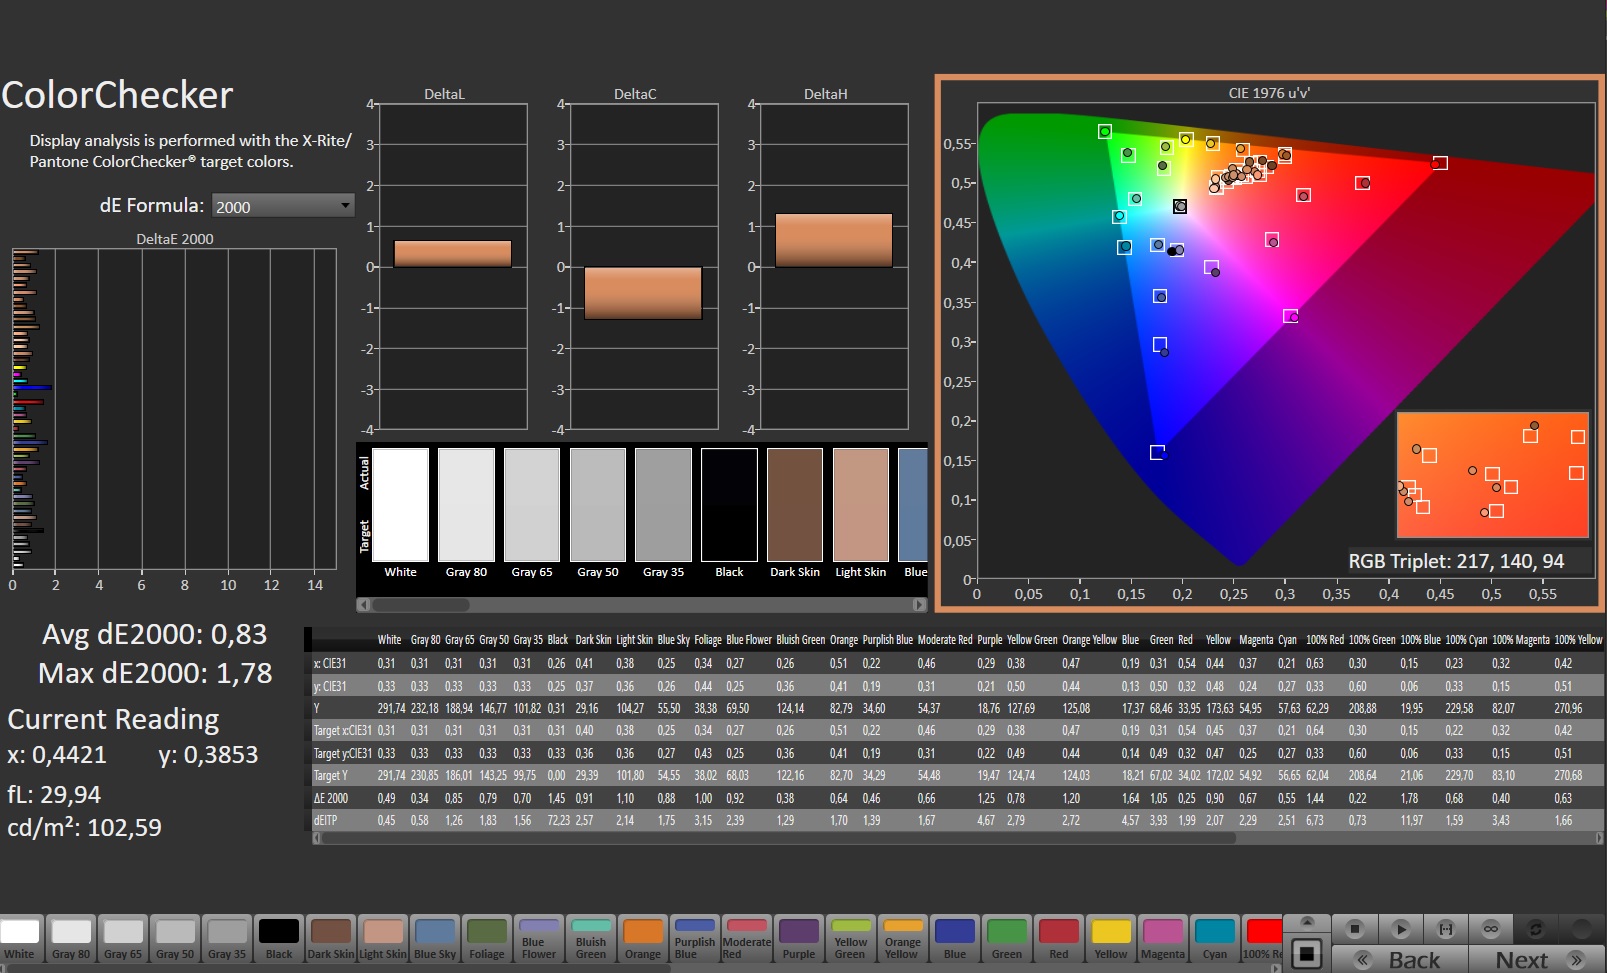
Também não há nada a reclamar em termos de contraste. 1.426:1 é muito alto pelos padrões IPS, e este valor só é superado apenas pelo laptop Lenovo. Quando se trata de brilho, o Pavilion assume mais uma vez o primeiro lugar. Uma média de 317 cd/m² não é uma taxa máxima, mas deve ser suficiente para a maioria das necessidades, desde que se evite locais particularmente brilhantes ou ensolarados. Para comparação: A concorrência permanece abaixo de 300 cd/m² em média
O laptop HP marca ainda mais pontos por seus rápidos tempos de resposta, que nenhum concorrente consegue igualar. Entretanto, o fabricante poderia usar algumas melhorias em termos de precisão de cor. O painel mostra uma leve tonalidade azul fora da caixa, que pode ser corrigida por calibração (há um link para nosso arquivo ICC no canto superior direito ao lado da tabela de distribuição de brilho). Os ângulos de visualização estão de acordo com os padrões IPS típicos. O dispositivo de 17 polegadas não sofre de sangramento excessivo da tela ou cintilação
Exibir tempos de resposta
| ↔ Tempo de resposta preto para branco | ||
|---|---|---|
| 8.7 ms ... ascensão ↗ e queda ↘ combinadas | ↗ 4.4 ms ascensão | 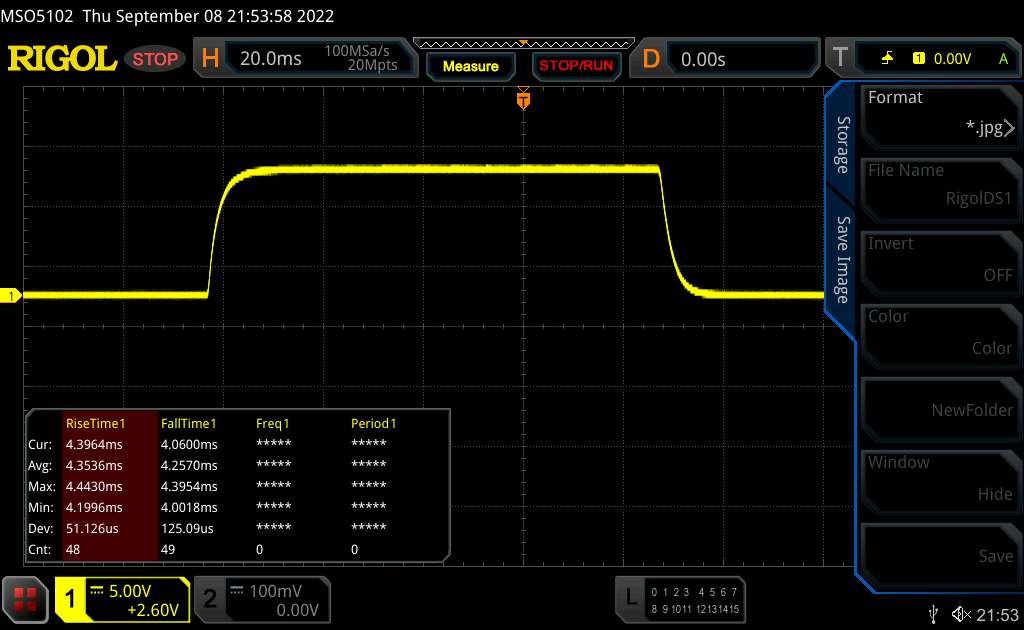 |
| ↘ 4.3 ms queda | ||
| A tela mostra taxas de resposta rápidas em nossos testes e deve ser adequada para jogos. Em comparação, todos os dispositivos testados variam de 0.1 (mínimo) a 240 (máximo) ms. » 24 % de todos os dispositivos são melhores. Isso significa que o tempo de resposta medido é melhor que a média de todos os dispositivos testados (19.9 ms). | ||
| ↔ Tempo de resposta 50% cinza a 80% cinza | ||
| 12.7 ms ... ascensão ↗ e queda ↘ combinadas | ↗ 6.1 ms ascensão | 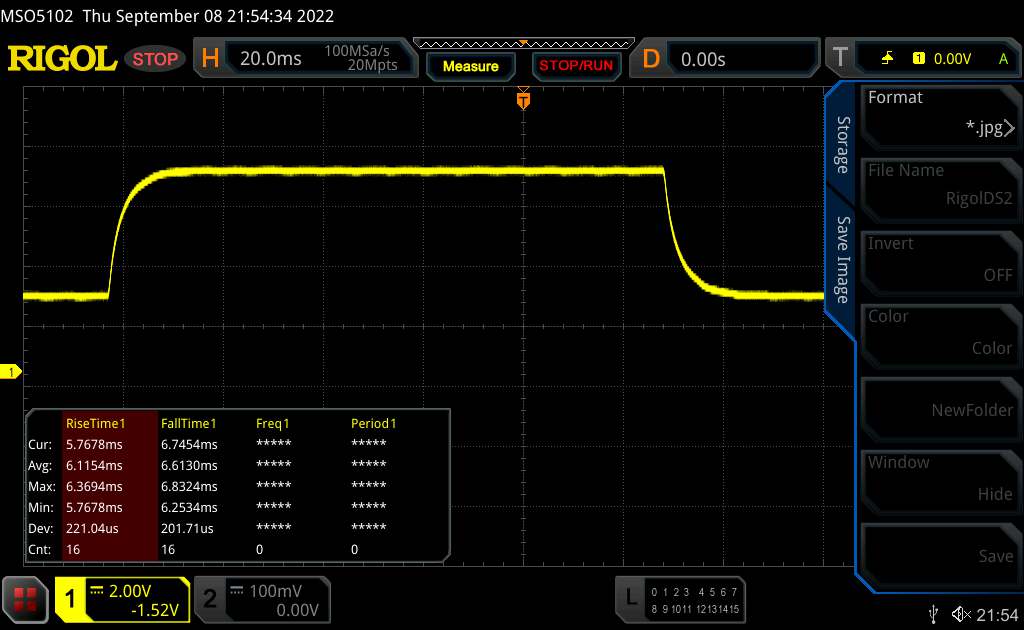 |
| ↘ 6.6 ms queda | ||
| A tela mostra boas taxas de resposta em nossos testes, mas pode ser muito lenta para jogadores competitivos. Em comparação, todos os dispositivos testados variam de 0.165 (mínimo) a 636 (máximo) ms. » 26 % de todos os dispositivos são melhores. Isso significa que o tempo de resposta medido é melhor que a média de todos os dispositivos testados (31.1 ms). | ||
Cintilação da tela / PWM (modulação por largura de pulso)
| Tela tremeluzindo / PWM não detectado |  | ||
[pwm_comparison] Em comparação: 52 % de todos os dispositivos testados não usam PWM para escurecer a tela. Se PWM foi detectado, uma média de 7798 (mínimo: 5 - máximo: 343500) Hz foi medida. | |||
Desempenho
Com uma CPU quad-core e uma GPU de 4 GB, a Pavilion Gaming 17 está posicionada no segmento de médio porte. 16 GB de RAM devem ser suficientes para os próximos anos. As coisas podem ficar apertadas com o SSD quando vários (grandes) jogos forem instalados. Entretanto, o armazenamento e a RAM podem ser trocados sem nenhum problema
Condições de teste
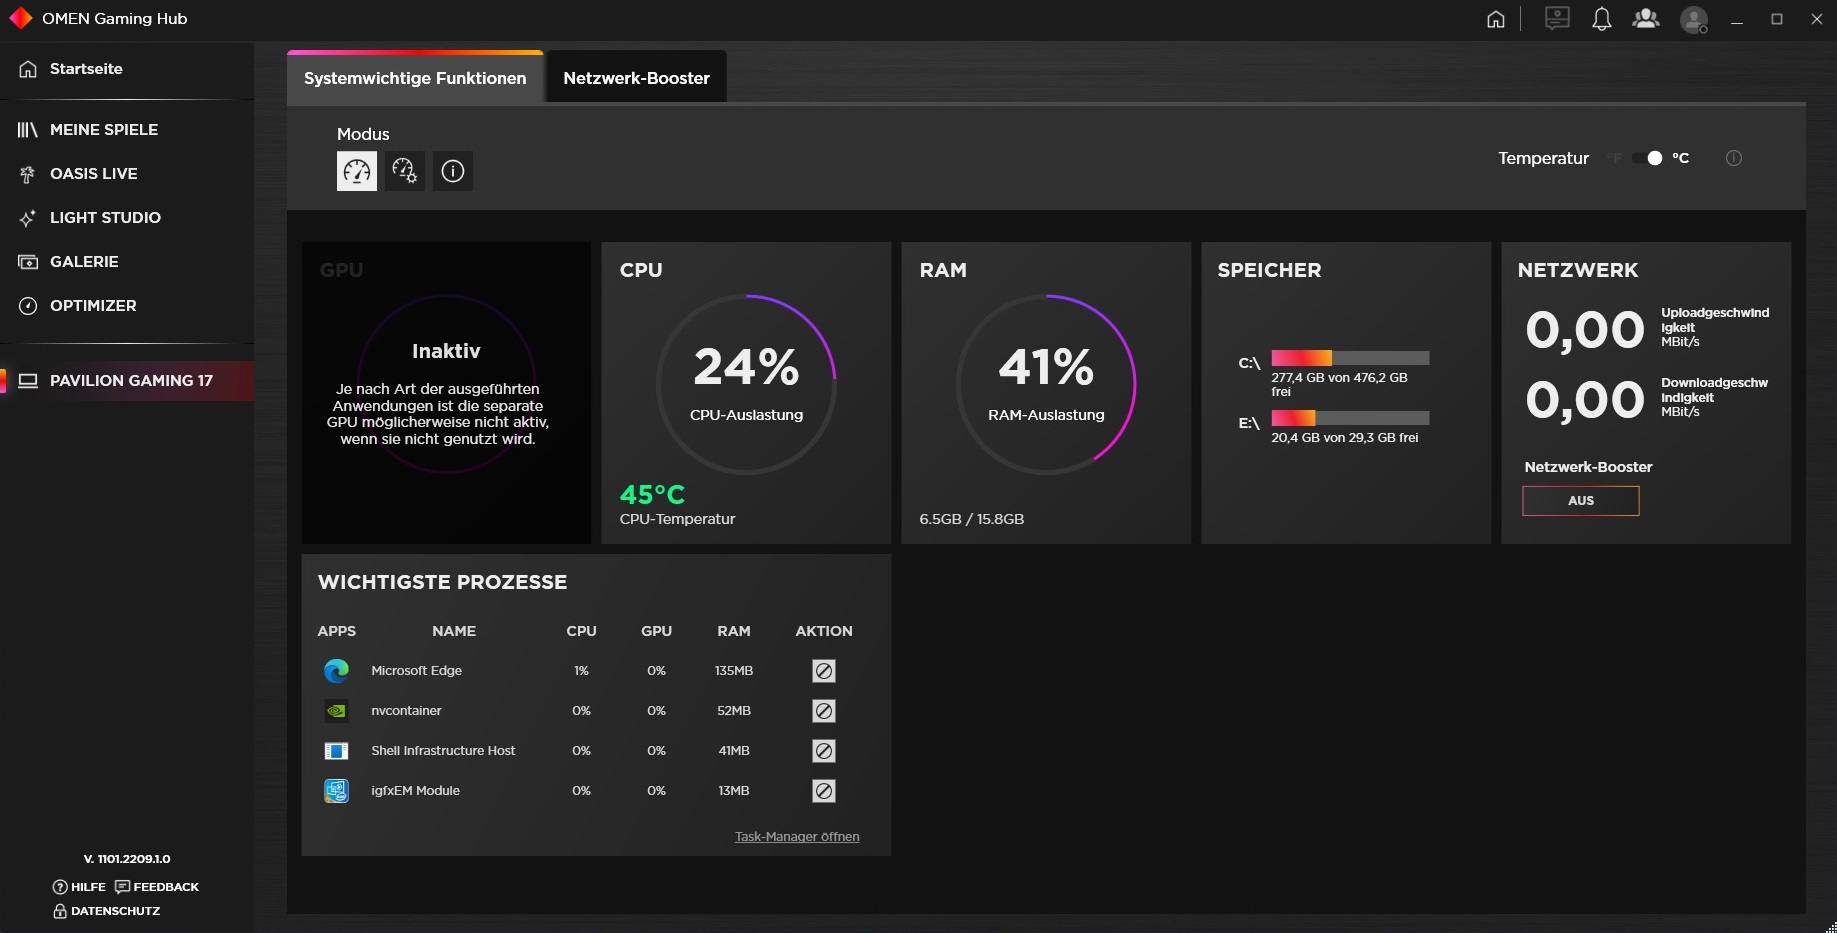
Além dos drivers e atualizações que são instalados automaticamente pelo Windows, instalamos apenas o Omen Gaming Hub no dispositivo. No entanto, no caso do Pavilion Gaming 17, não havia modos de desempenho diferentes disponíveis lá, como é usual para outros laptops
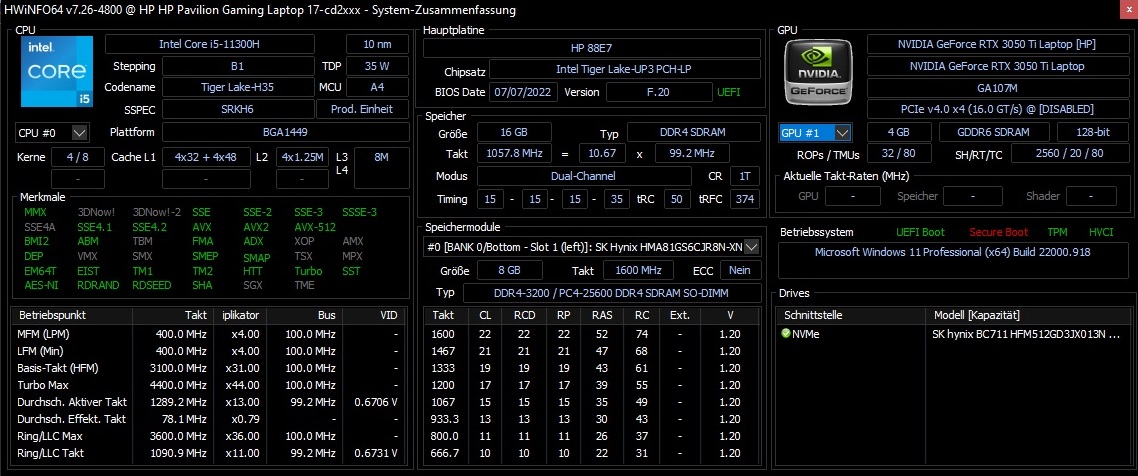
Processador
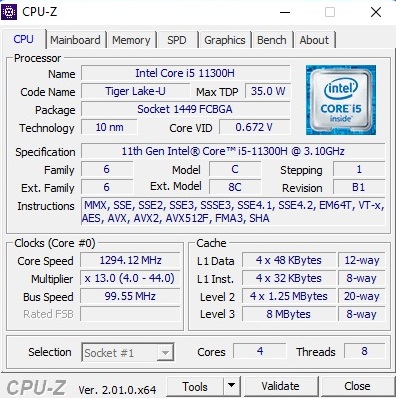
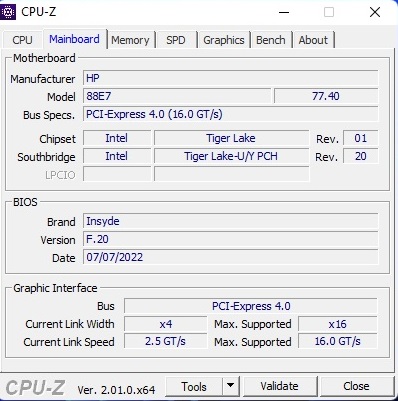
O Core i5-11300H é uma poderosa CPU quad-core que pertence à geração Tiger-Lake da Intel, que não é tão nova como costumava ser. O chip de 10 nm oferece 8 MB de cache L3 assim como até 8 threads que podem ser processados em paralelo via Hyper-Threading. O processador se comportou sem nenhum problema em nosso curso de referência. Seu desempenho é semelhante ao do Lenovo IdeaPad Gaming 3, que também é equipado com um i5-11300H. Entretanto, quando se trata de aplicações multi-core, a CPU não tem nenhuma chance contra a antigaNúcleo i7-9750H e oRyzen 5 5600H (6 núcleos cada um) em particular. Entretanto, a i5-11300H é um bom modelo versátil
Cinebench R15 Multi endurance test
* ... menor é melhor
AIDA64: FP32 Ray-Trace | FPU Julia | CPU SHA3 | CPU Queen | FPU SinJulia | FPU Mandel | CPU AES | CPU ZLib | FP64 Ray-Trace | CPU PhotoWorxx
| Performance rating | |
| Média da turma Gaming | |
| HP Victus 16-e0145ng | |
| Lenovo Ideapad Gaming 3 15IHU-82K1002RGE | |
| Média Intel Core i5-11300H | |
| HP Pavilion Gaming 17-cd2146ng | |
| Dell G15 5510-43NHT | |
| AIDA64 / FP32 Ray-Trace | |
| Média da turma Gaming (10227 - 85542, n=110, últimos 2 anos) | |
| HP Victus 16-e0145ng | |
| Lenovo Ideapad Gaming 3 15IHU-82K1002RGE | |
| Média Intel Core i5-11300H (6128 - 8440, n=9) | |
| HP Pavilion Gaming 17-cd2146ng | |
| Dell G15 5510-43NHT | |
| AIDA64 / FPU Julia | |
| Média da turma Gaming (51376 - 238426, n=110, últimos 2 anos) | |
| HP Victus 16-e0145ng | |
| Lenovo Ideapad Gaming 3 15IHU-82K1002RGE | |
| Dell G15 5510-43NHT | |
| Média Intel Core i5-11300H (25739 - 33986, n=9) | |
| HP Pavilion Gaming 17-cd2146ng | |
| AIDA64 / CPU SHA3 | |
| Média da turma Gaming (2180 - 9817, n=110, últimos 2 anos) | |
| HP Victus 16-e0145ng | |
| Lenovo Ideapad Gaming 3 15IHU-82K1002RGE | |
| Média Intel Core i5-11300H (1773 - 2286, n=9) | |
| HP Pavilion Gaming 17-cd2146ng | |
| Dell G15 5510-43NHT | |
| AIDA64 / CPU Queen | |
| Média da turma Gaming (49785 - 173351, n=101, últimos 2 anos) | |
| HP Victus 16-e0145ng | |
| Lenovo Ideapad Gaming 3 15IHU-82K1002RGE | |
| Média Intel Core i5-11300H (41257 - 49312, n=9) | |
| Dell G15 5510-43NHT | |
| HP Pavilion Gaming 17-cd2146ng | |
| AIDA64 / FPU SinJulia | |
| Média da turma Gaming (4424 - 33636, n=110, últimos 2 anos) | |
| HP Victus 16-e0145ng | |
| Dell G15 5510-43NHT | |
| Lenovo Ideapad Gaming 3 15IHU-82K1002RGE | |
| Média Intel Core i5-11300H (3925 - 4677, n=9) | |
| HP Pavilion Gaming 17-cd2146ng | |
| AIDA64 / FPU Mandel | |
| Média da turma Gaming (25115 - 128721, n=110, últimos 2 anos) | |
| HP Victus 16-e0145ng | |
| Lenovo Ideapad Gaming 3 15IHU-82K1002RGE | |
| Média Intel Core i5-11300H (15820 - 20669, n=9) | |
| HP Pavilion Gaming 17-cd2146ng | |
| Dell G15 5510-43NHT | |
| AIDA64 / CPU AES | |
| Média da turma Gaming (39258 - 247074, n=110, últimos 2 anos) | |
| Lenovo Ideapad Gaming 3 15IHU-82K1002RGE | |
| Média Intel Core i5-11300H (37694 - 71519, n=9) | |
| HP Victus 16-e0145ng | |
| HP Pavilion Gaming 17-cd2146ng | |
| Dell G15 5510-43NHT | |
| AIDA64 / CPU ZLib | |
| Média da turma Gaming (574 - 2531, n=110, últimos 2 anos) | |
| HP Victus 16-e0145ng | |
| Lenovo Ideapad Gaming 3 15IHU-82K1002RGE | |
| Média Intel Core i5-11300H (269 - 390, n=9) | |
| Dell G15 5510-43NHT | |
| HP Pavilion Gaming 17-cd2146ng | |
| AIDA64 / FP64 Ray-Trace | |
| Média da turma Gaming (5509 - 45446, n=110, últimos 2 anos) | |
| HP Victus 16-e0145ng | |
| Lenovo Ideapad Gaming 3 15IHU-82K1002RGE | |
| Média Intel Core i5-11300H (3322 - 4613, n=9) | |
| HP Pavilion Gaming 17-cd2146ng | |
| Dell G15 5510-43NHT | |
| AIDA64 / CPU PhotoWorxx | |
| Média da turma Gaming (12271 - 89891, n=110, últimos 2 anos) | |
| HP Pavilion Gaming 17-cd2146ng | |
| Média Intel Core i5-11300H (9705 - 38002, n=9) | |
| HP Victus 16-e0145ng | |
| Lenovo Ideapad Gaming 3 15IHU-82K1002RGE | |
| Dell G15 5510-43NHT | |
Desempenho do sistema
Em termos de desempenho do sistema, o laptop de 17 polegadas fica confortavelmente no meio da competição. 5.442 pontos no PCMark 10 é um resultado sólido e absolutamente adequado para o preço estimado
CrossMark: Overall | Productivity | Creativity | Responsiveness
| PCMark 10 / Score | |
| Média da turma Gaming (5828 - 11574, n=96, últimos 2 anos) | |
| HP Victus 16-e0145ng | |
| Lenovo Ideapad Gaming 3 15IHU-82K1002RGE | |
| Média Intel Core i5-11300H, NVIDIA GeForce RTX 3050 Ti Laptop GPU (5442 - 5641, n=2) | |
| HP Pavilion Gaming 17-cd2146ng | |
| HP Pavilion Gaming 17-cd0085cl | |
| Dell G15 5510-43NHT | |
| PCMark 10 / Essentials | |
| Média da turma Gaming (8810 - 12600, n=100, últimos 2 anos) | |
| HP Victus 16-e0145ng | |
| HP Pavilion Gaming 17-cd0085cl | |
| HP Pavilion Gaming 17-cd2146ng | |
| Média Intel Core i5-11300H, NVIDIA GeForce RTX 3050 Ti Laptop GPU (8524 - 8829, n=2) | |
| Lenovo Ideapad Gaming 3 15IHU-82K1002RGE | |
| Dell G15 5510-43NHT | |
| PCMark 10 / Productivity | |
| Média da turma Gaming (6845 - 18766, n=98, últimos 2 anos) | |
| Lenovo Ideapad Gaming 3 15IHU-82K1002RGE | |
| Média Intel Core i5-11300H, NVIDIA GeForce RTX 3050 Ti Laptop GPU (7664 - 9112, n=2) | |
| HP Victus 16-e0145ng | |
| HP Pavilion Gaming 17-cd2146ng | |
| HP Pavilion Gaming 17-cd0085cl | |
| Dell G15 5510-43NHT | |
| PCMark 10 / Digital Content Creation | |
| Média da turma Gaming (7602 - 19657, n=98, últimos 2 anos) | |
| HP Victus 16-e0145ng | |
| HP Pavilion Gaming 17-cd0085cl | |
| HP Pavilion Gaming 17-cd2146ng | |
| Média Intel Core i5-11300H, NVIDIA GeForce RTX 3050 Ti Laptop GPU (6271 - 6462, n=2) | |
| Lenovo Ideapad Gaming 3 15IHU-82K1002RGE | |
| Dell G15 5510-43NHT | |
| CrossMark / Overall | |
| Média da turma Gaming (1366 - 2409, n=98, últimos 2 anos) | |
| Lenovo Ideapad Gaming 3 15IHU-82K1002RGE | |
| Média Intel Core i5-11300H, NVIDIA GeForce RTX 3050 Ti Laptop GPU (n=1) | |
| CrossMark / Productivity | |
| Média da turma Gaming (1386 - 2254, n=98, últimos 2 anos) | |
| Lenovo Ideapad Gaming 3 15IHU-82K1002RGE | |
| Média Intel Core i5-11300H, NVIDIA GeForce RTX 3050 Ti Laptop GPU (n=1) | |
| CrossMark / Creativity | |
| Média da turma Gaming (1343 - 2729, n=98, últimos 2 anos) | |
| Lenovo Ideapad Gaming 3 15IHU-82K1002RGE | |
| Média Intel Core i5-11300H, NVIDIA GeForce RTX 3050 Ti Laptop GPU (n=1) | |
| CrossMark / Responsiveness | |
| Média da turma Gaming (1226 - 2334, n=98, últimos 2 anos) | |
| Lenovo Ideapad Gaming 3 15IHU-82K1002RGE | |
| Média Intel Core i5-11300H, NVIDIA GeForce RTX 3050 Ti Laptop GPU (n=1) | |
| PCMark 10 Score | 5442 pontos | |
Ajuda | ||
| AIDA64 / Memory Copy | |
| Média da turma Gaming (21750 - 129946, n=110, últimos 2 anos) | |
| HP Victus 16-e0145ng | |
| Média Intel Core i5-11300H (19947 - 60141, n=9) | |
| HP Pavilion Gaming 17-cd2146ng | |
| Lenovo Ideapad Gaming 3 15IHU-82K1002RGE | |
| Dell G15 5510-43NHT | |
| AIDA64 / Memory Read | |
| Média da turma Gaming (22956 - 118858, n=110, últimos 2 anos) | |
| HP Victus 16-e0145ng | |
| Média Intel Core i5-11300H (22688 - 62684, n=9) | |
| HP Pavilion Gaming 17-cd2146ng | |
| Lenovo Ideapad Gaming 3 15IHU-82K1002RGE | |
| Dell G15 5510-43NHT | |
| AIDA64 / Memory Write | |
| Média da turma Gaming (22297 - 135096, n=110, últimos 2 anos) | |
| HP Victus 16-e0145ng | |
| Média Intel Core i5-11300H (20959 - 65245, n=9) | |
| HP Pavilion Gaming 17-cd2146ng | |
| Lenovo Ideapad Gaming 3 15IHU-82K1002RGE | |
| Dell G15 5510-43NHT | |
| AIDA64 / Memory Latency | |
| Média da turma Gaming (75.3 - 259, n=110, últimos 2 anos) | |
| Lenovo Ideapad Gaming 3 15IHU-82K1002RGE | |
| HP Pavilion Gaming 17-cd2146ng | |
| Média Intel Core i5-11300H (76.3 - 93.6, n=9) | |
| HP Victus 16-e0145ng | |
| Dell G15 5510-43NHT | |
* ... menor é melhor
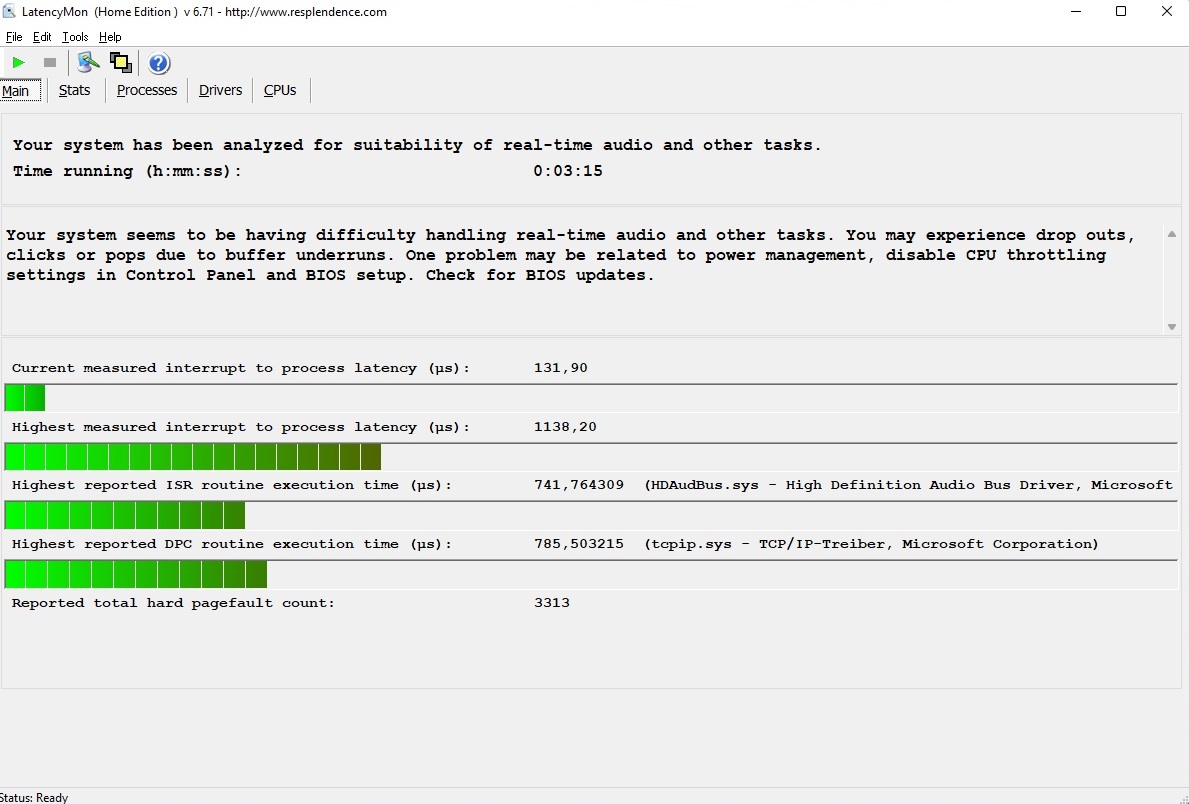
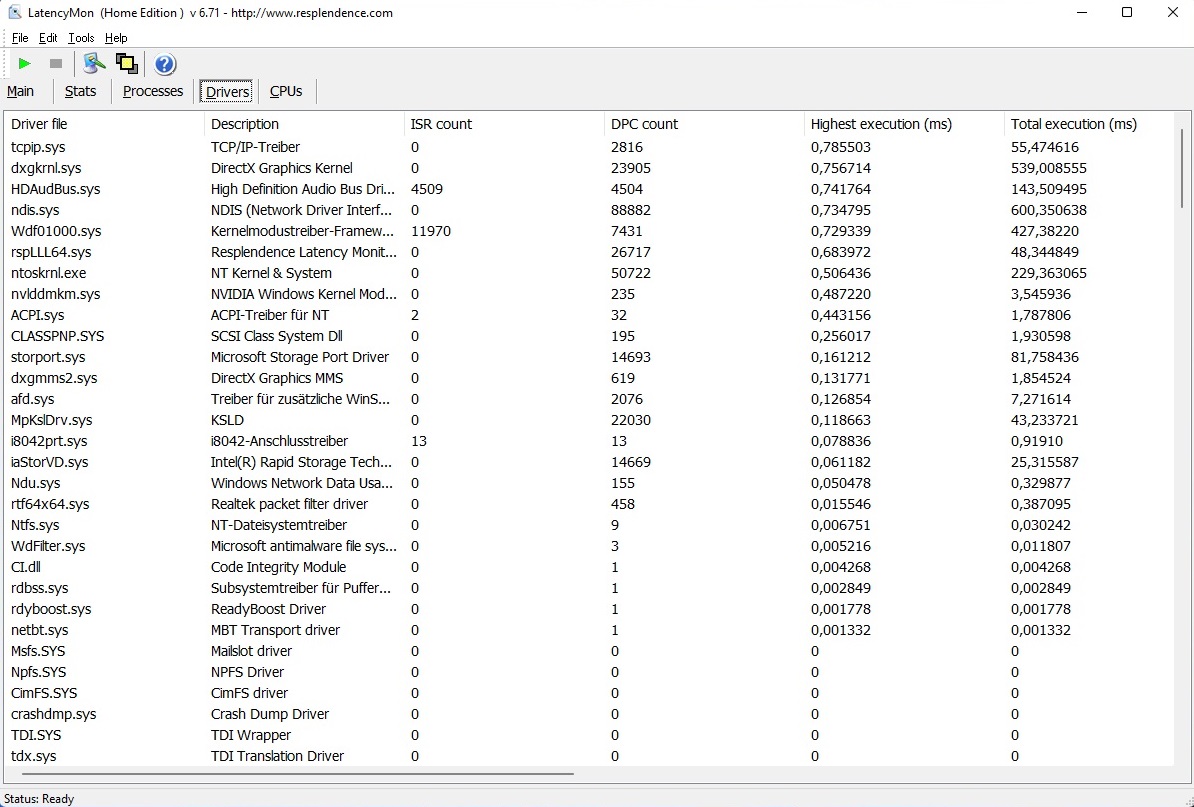
Latências DPC
As coisas não são inteiramente ótimas quando se trata de latências. Como muitos outros laptops, o Pavilion Gaming 17 não é particularmente adequado para edição de áudio e vídeo em tempo real de acordo com a ferramenta LatencyMon
| DPC Latencies / LatencyMon - interrupt to process latency (max), Web, Youtube, Prime95 | |
| Dell G15 5510-43NHT | |
| HP Pavilion Gaming 17-cd2146ng | |
| Lenovo Ideapad Gaming 3 15IHU-82K1002RGE | |
| HP Victus 16-e0145ng | |
* ... menor é melhor
Armazenamento
O dispositivo de armazenamento rápido deve ser enfatizado positivamente. A HP equipou nosso modelo de revisão com um drive PCIe de 512 GB (M.2 2280) da SK Hynix (BC711), que atinge velocidades de leitura e escrita sequenciais superiores a 2.500 MB/s, algo que somente a HP Victus 16 pode alcançar. Irritante: Infelizmente, o slot de 2,5 polegadas existente, que contém um "boneco de HDD", não pode ser usado, uma vez que não há nenhum cabo adequado integrado

* ... menor é melhor
Continuous load read: DiskSpd Read Loop, Queue Depth 8
Placa gráfica
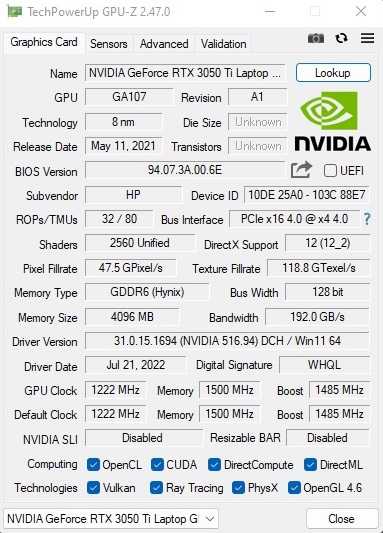
A GeForce RTX 3050 Ti da Nvidia é uma placa gráfica ideal para jogadores casuais que não querem necessariamente jogar cada novo título com o máximo de detalhes. O modelo de 8 nm é baseado na mais recente arquitetura Ampere e está equipado com 2.560 unidades de sombreamento. O desempenho dos chips Nvidia depende muito do TGP especificado, que os fabricantes de laptops podem escolher livremente dentro de uma determinada faixa. Neste caso, a HP optou por 60 watts, o que corresponde a um nível médio para o RTX 3050 Ti. No entanto, o Pavilion Gaming 17 tem um desempenho ligeiramente melhor no circuito GPU em comparação com a média de 3050 Ti
| 3DMark 11 Performance | 15245 pontos | |
| 3DMark Ice Storm Standard Score | 98555 pontos | |
| 3DMark Cloud Gate Standard Score | 26005 pontos | |
| 3DMark Fire Strike Score | 11649 pontos | |
| 3DMark Time Spy Score | 5155 pontos | |
Ajuda | ||
Desempenho do jogo
Desde que você mantenha os 1920x1080 pixels nativos e não conecte uma tela externa de alta resolução, o RTX 3050 Ti oferece um sólido desempenho 3D. Além de jogos muito exigentes ou moderadamente otimizados, como Deus da Guerraa maioria dos títulos atuais funciona sem problemas, mesmo em configurações máximas, embora o 144 Hz esteja muitas vezes longe de ser totalmente explorado. A GPU revela fraquezas no traçado de raio em particular, o que é mostrado em F1 22. 4 GB de VRAM também não é ideal a longo prazo. Se você estiver procurando por um certo grau de resistência futura, você deve comprar uma placa gráfica com pelo menos 6 ou, de preferência, 8 GB de VRAM
| The Witcher 3 | |
| 1920x1080 High Graphics & Postprocessing (Nvidia HairWorks Off) | |
| Média da turma Gaming (181 - 341, n=3, últimos 2 anos) | |
| HP Victus 16-e0145ng | |
| HP Pavilion Gaming 17-cd2146ng | |
| HP Pavilion Gaming 17-cd0085cl | |
| Lenovo Ideapad Gaming 3 15IHU-82K1002RGE | |
| Média NVIDIA GeForce RTX 3050 Ti Laptop GPU (30 - 110, n=26) | |
| Dell G15 5510-43NHT | |
| 1920x1080 Ultra Graphics & Postprocessing (HBAO+) | |
| Média da turma Gaming (95 - 240, n=8, últimos 2 anos) | |
| HP Victus 16-e0145ng | |
| Dell G15 5510-43NHT | |
| HP Pavilion Gaming 17-cd2146ng | |
| HP Pavilion Gaming 17-cd0085cl | |
| Média NVIDIA GeForce RTX 3050 Ti Laptop GPU (19 - 58.5, n=29) | |
| Lenovo Ideapad Gaming 3 15IHU-82K1002RGE | |
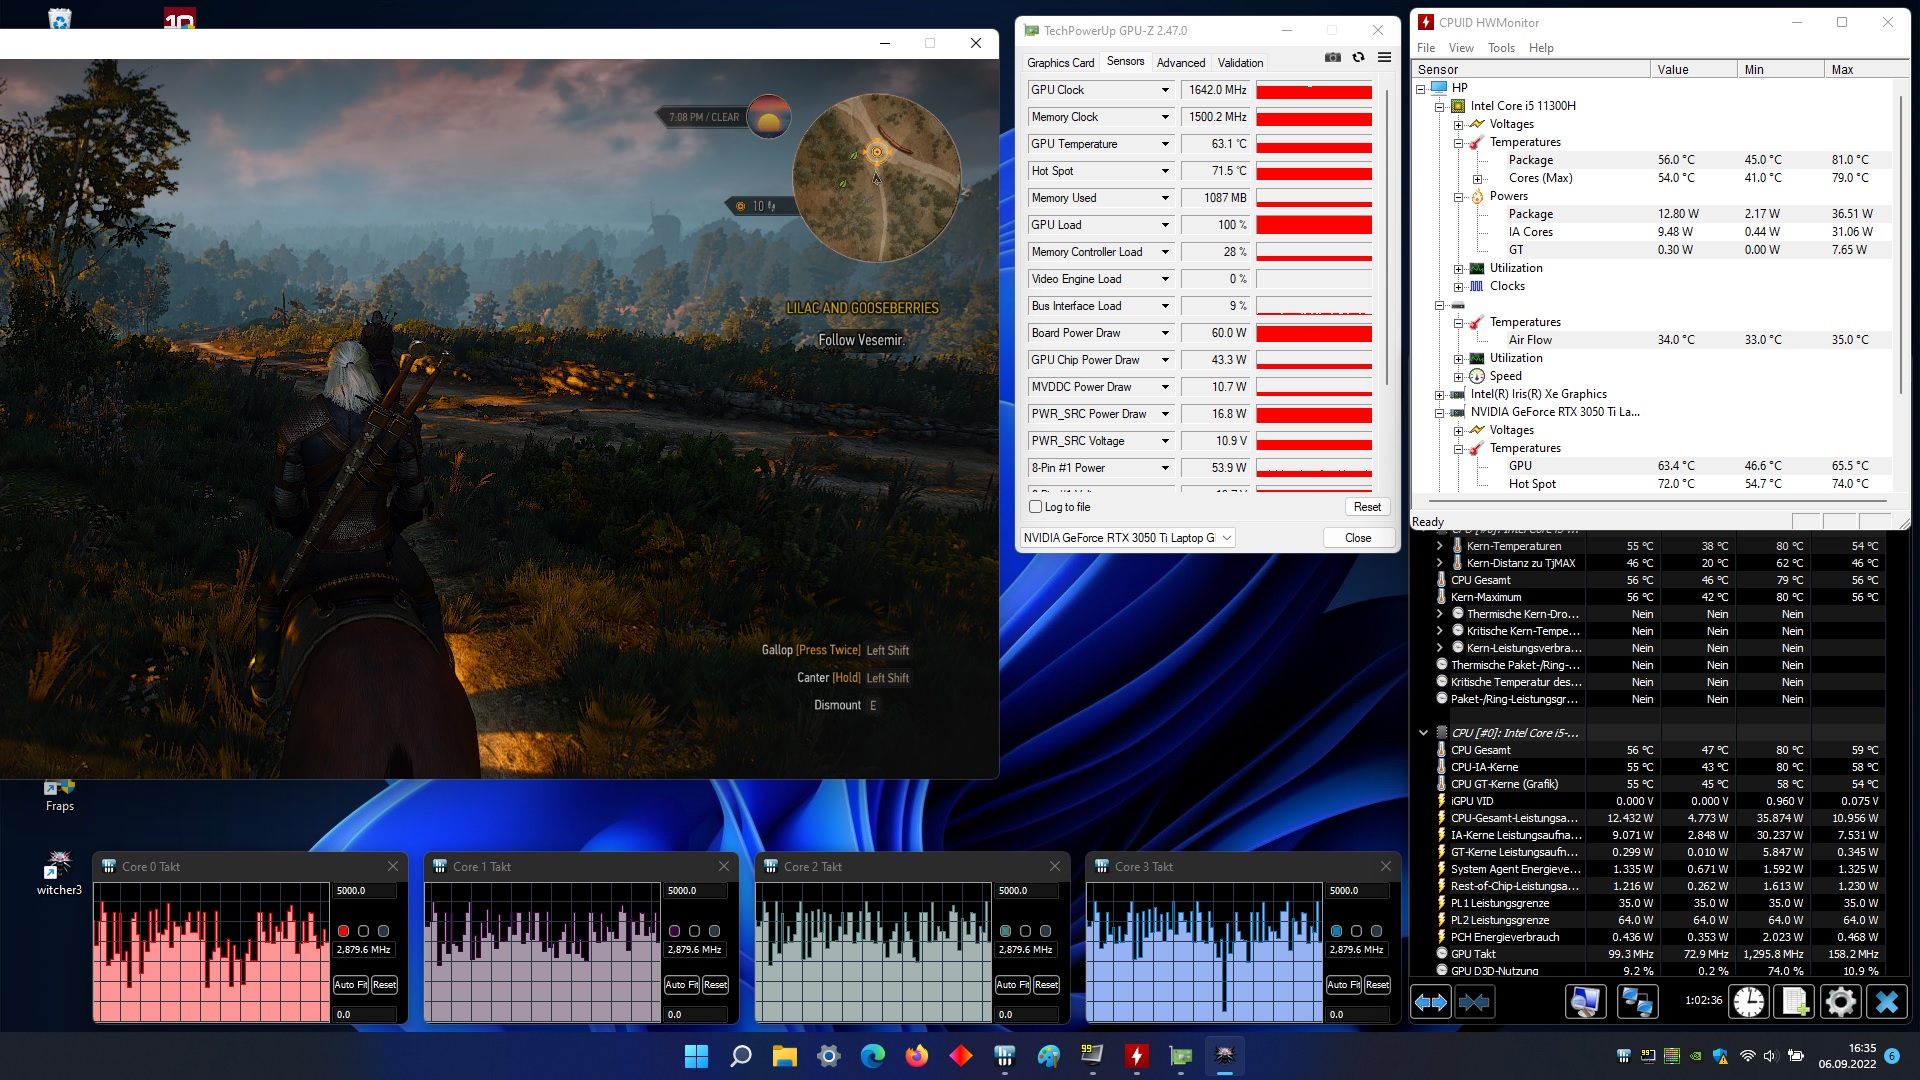
Não houve irregularidades em nosso teste de resistência (uma hora de O Witcher 3). A taxa de quadros permaneceu bastante constante ao longo de todo o tempo
The Witcher 3 FPS diagram
| baixo | média | alto | ultra | |
|---|---|---|---|---|
| GTA V (2015) | 156.1 | 119.9 | 66.9 | |
| The Witcher 3 (2015) | 170 | 94.4 | 51.4 | |
| Dota 2 Reborn (2015) | 119.7 | 108.5 | 104.8 | 100.7 |
| Final Fantasy XV Benchmark (2018) | 76 | 53.3 | ||
| X-Plane 11.11 (2018) | 87.5 | 75.3 | 64.3 | |
| Strange Brigade (2018) | 132.8 | 105.8 | 90.3 | |
| God of War (2022) | 60.7 | 48.6 | 30.6 | |
| Rainbow Six Extraction (2022) | 112 | 108 | 83 | |
| Dying Light 2 (2022) | 46.7 | 38.8 | ||
| Elden Ring (2022) | 55.4 | 53.8 | 52.7 | |
| Elex 2 (2022) | 52.2 | 50.9 | 46.1 | |
| F1 22 (2022) | 132 | 93 | 28 | |
| The Quarry (2022) | 63.1 | 51.5 | 39.7 |
Emissões
Emissões sonoras
Ao olhar para o predecessor com o Core i7-9750H e o GeForce GTX 1660 Ti Max-Qelogiamos particularmente o menor desenvolvimento do ruído. Enquanto o novo Pavilion Gaming 17 ainda é um dos portáteis de jogos mais silenciosos, o equipamento de 17 polegadas não é mais verdadeiramente silencioso. Ao invés de 34 a 44 dB(A), medimos 39 a 46 dB(A) sob carga, o que é claramente audível, mas não irritante. Por outro lado, o dispositivo é agradavelmente silencioso com 27 a 30 dB(A) em uso ocioso, embora os ventiladores nunca se desliguem completamente. No entanto, este último pode ser alterado na BIOS, desativando a opção "sempre ligado". Isto resulta na desativação dos ventiladores durante tarefas simples, às vezes.
Barulho
| Ocioso |
| 27 / 28 / 30 dB |
| Carga |
| 39 / 46 dB |
 | ||
30 dB silencioso 40 dB(A) audível 50 dB(A) ruidosamente alto |
||
min: | ||
| HP Pavilion Gaming 17-cd2146ng i5-11300H, GeForce RTX 3050 Ti Laptop GPU | Dell G15 5510-43NHT i5-10200H, GeForce RTX 3050 Ti Laptop GPU | Lenovo Ideapad Gaming 3 15IHU-82K1002RGE i5-11300H, GeForce RTX 3050 Ti Laptop GPU | HP Victus 16-e0145ng R5 5600H, GeForce RTX 3050 Ti Laptop GPU | HP Pavilion Gaming 17-cd0085cl i7-9750H, GeForce GTX 1660 Ti Max-Q | |
|---|---|---|---|---|---|
| Noise | -2% | 1% | -7% | 1% | |
| desligado / ambiente * (dB) | 25 | 25 -0% | 23.9 4% | 26 -4% | 28.2 -13% |
| Idle Minimum * (dB) | 27 | 25 7% | 23.9 11% | 26 4% | 30.1 -11% |
| Idle Average * (dB) | 28 | 25 11% | 26.8 4% | 28 -0% | 30.1 -8% |
| Idle Maximum * (dB) | 30 | 25 17% | 26.8 11% | 34 -13% | 30.1 -0% |
| Load Average * (dB) | 39 | 52.2 -34% | 43.5 -12% | 44 -13% | 34.2 12% |
| Witcher 3 ultra * (dB) | 44 | 43.5 1% | 48 -9% | 34.2 22% | |
| Load Maximum * (dB) | 46 | 52.2 -13% | 53.1 -15% | 53 -15% | 43.8 5% |
* ... menor é melhor
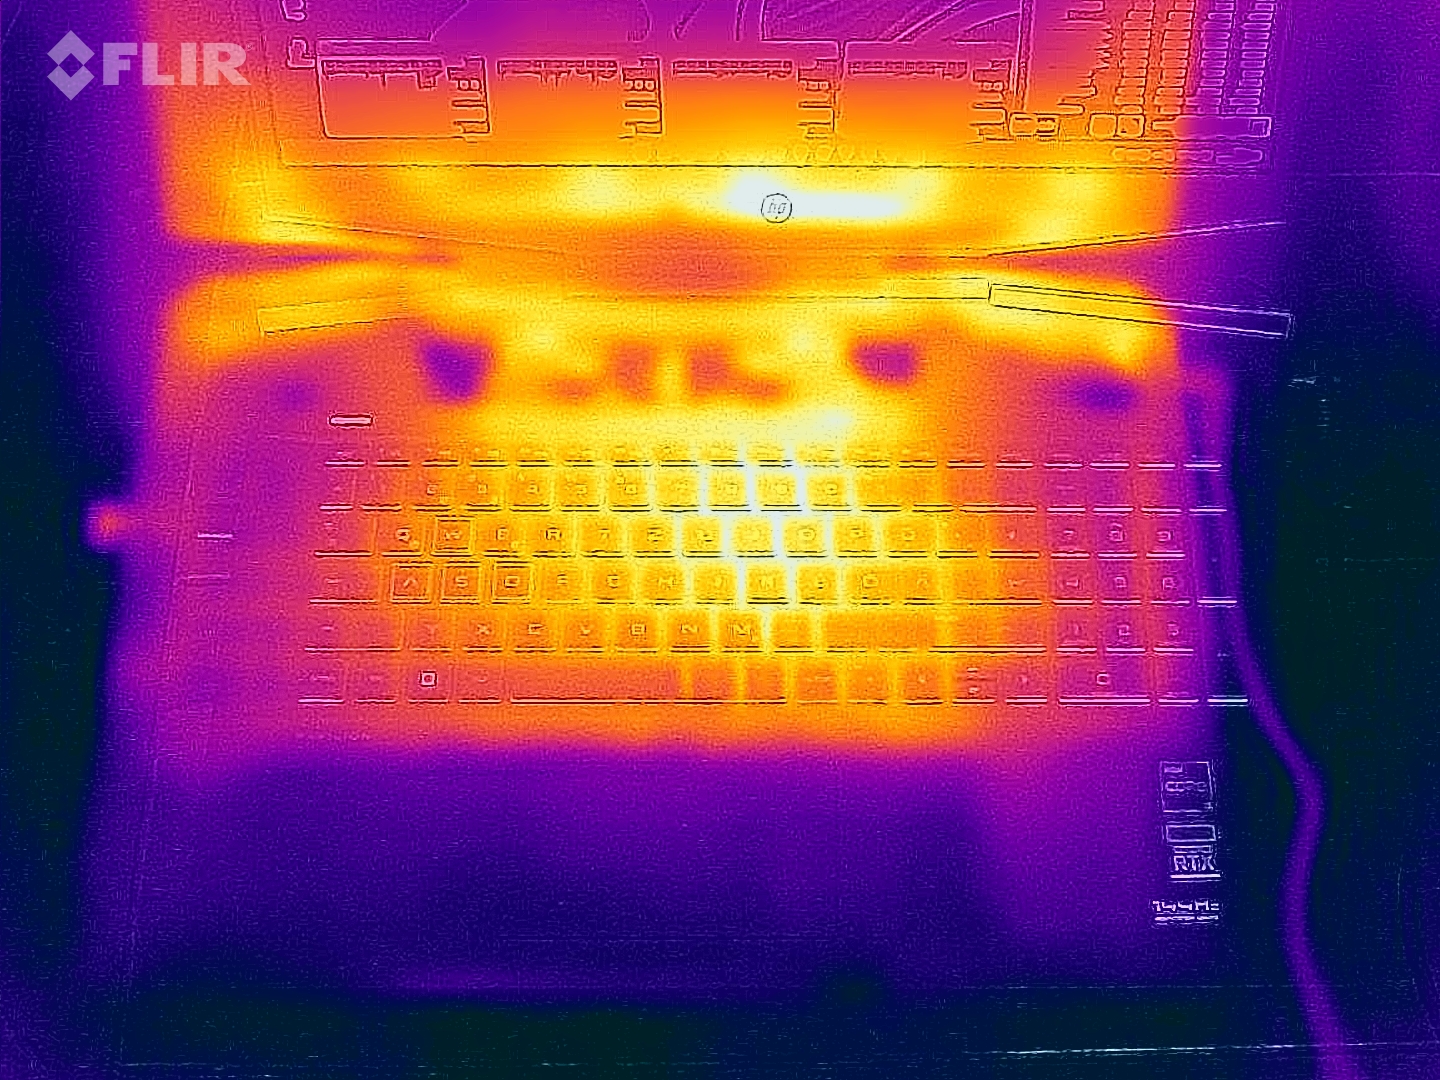
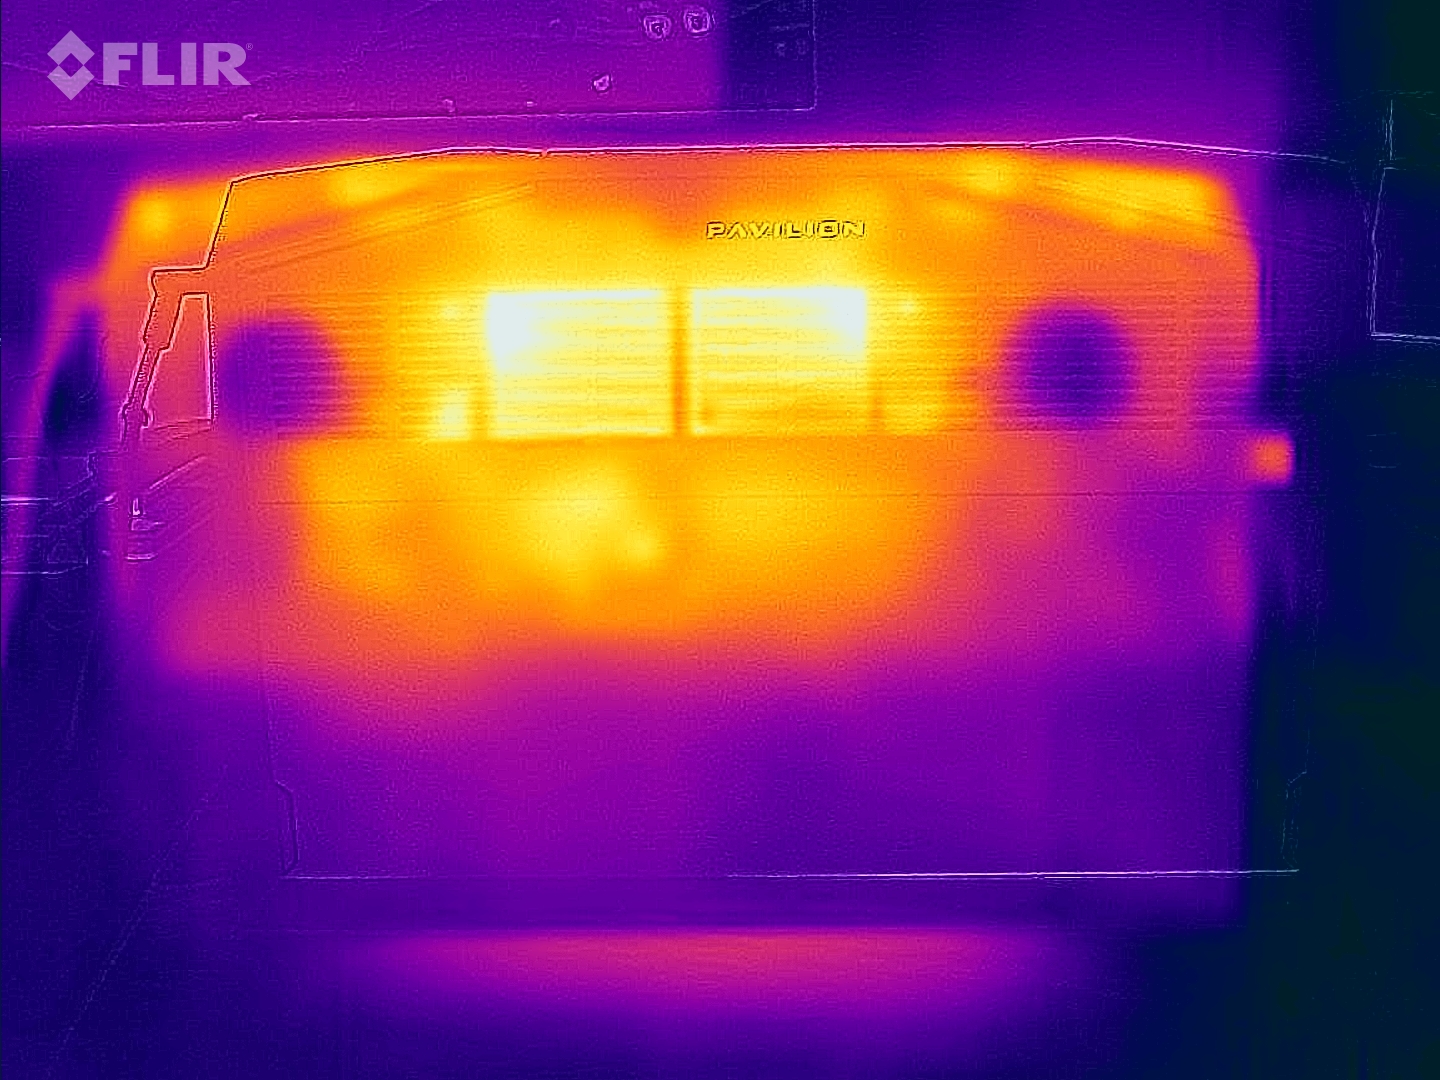
Temperatura
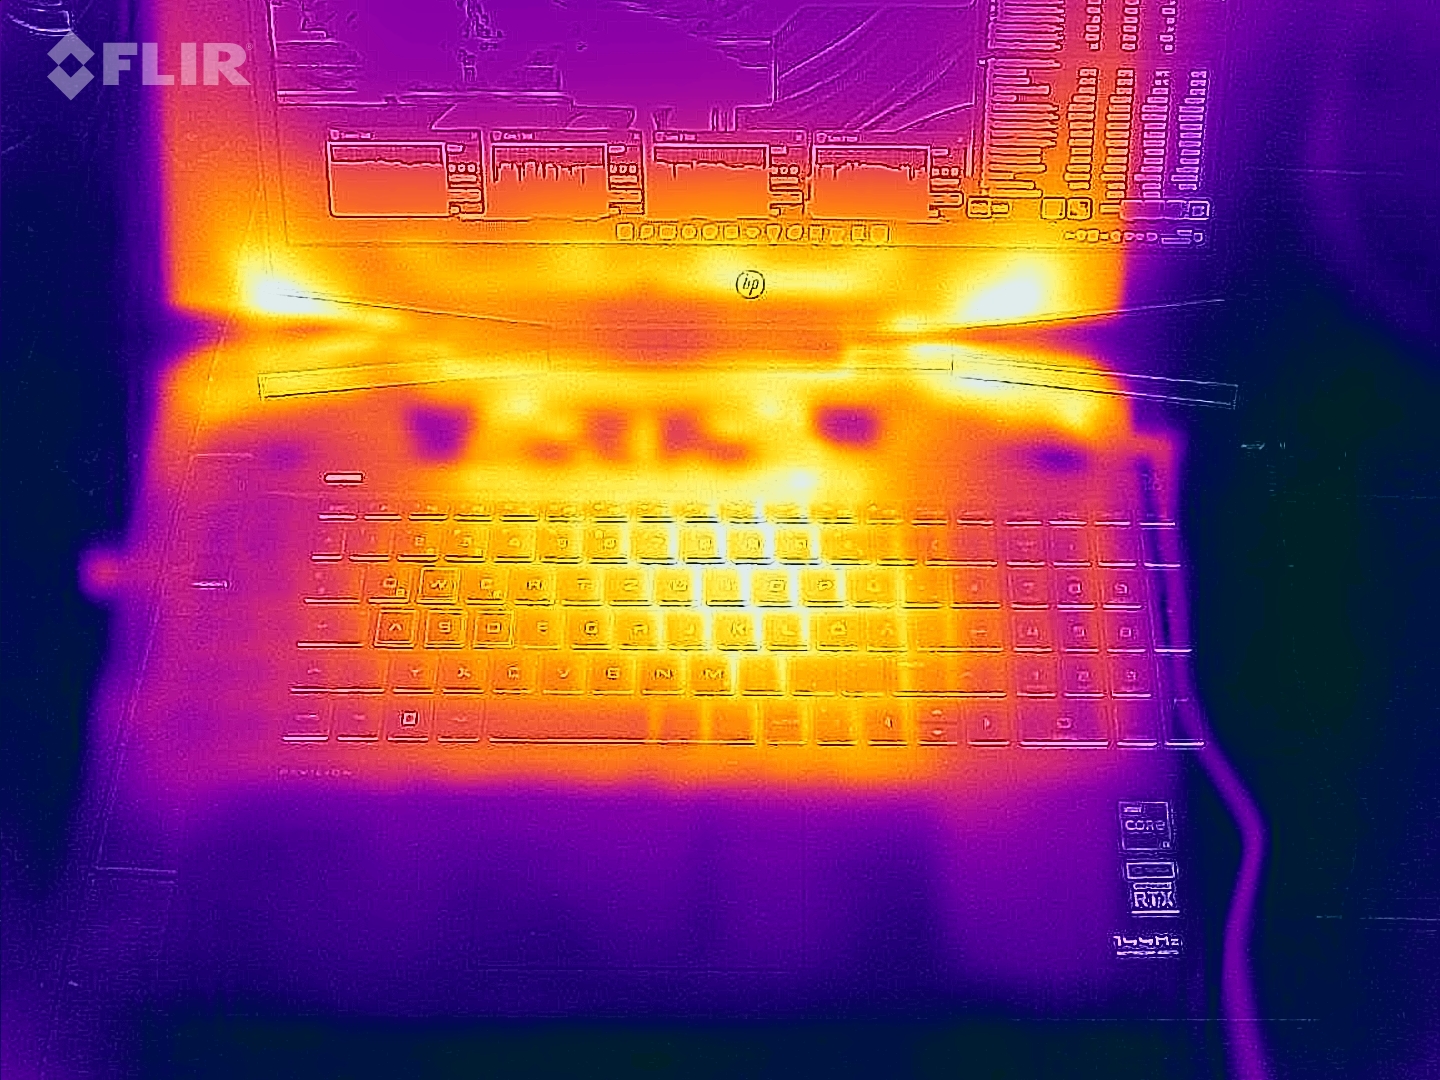
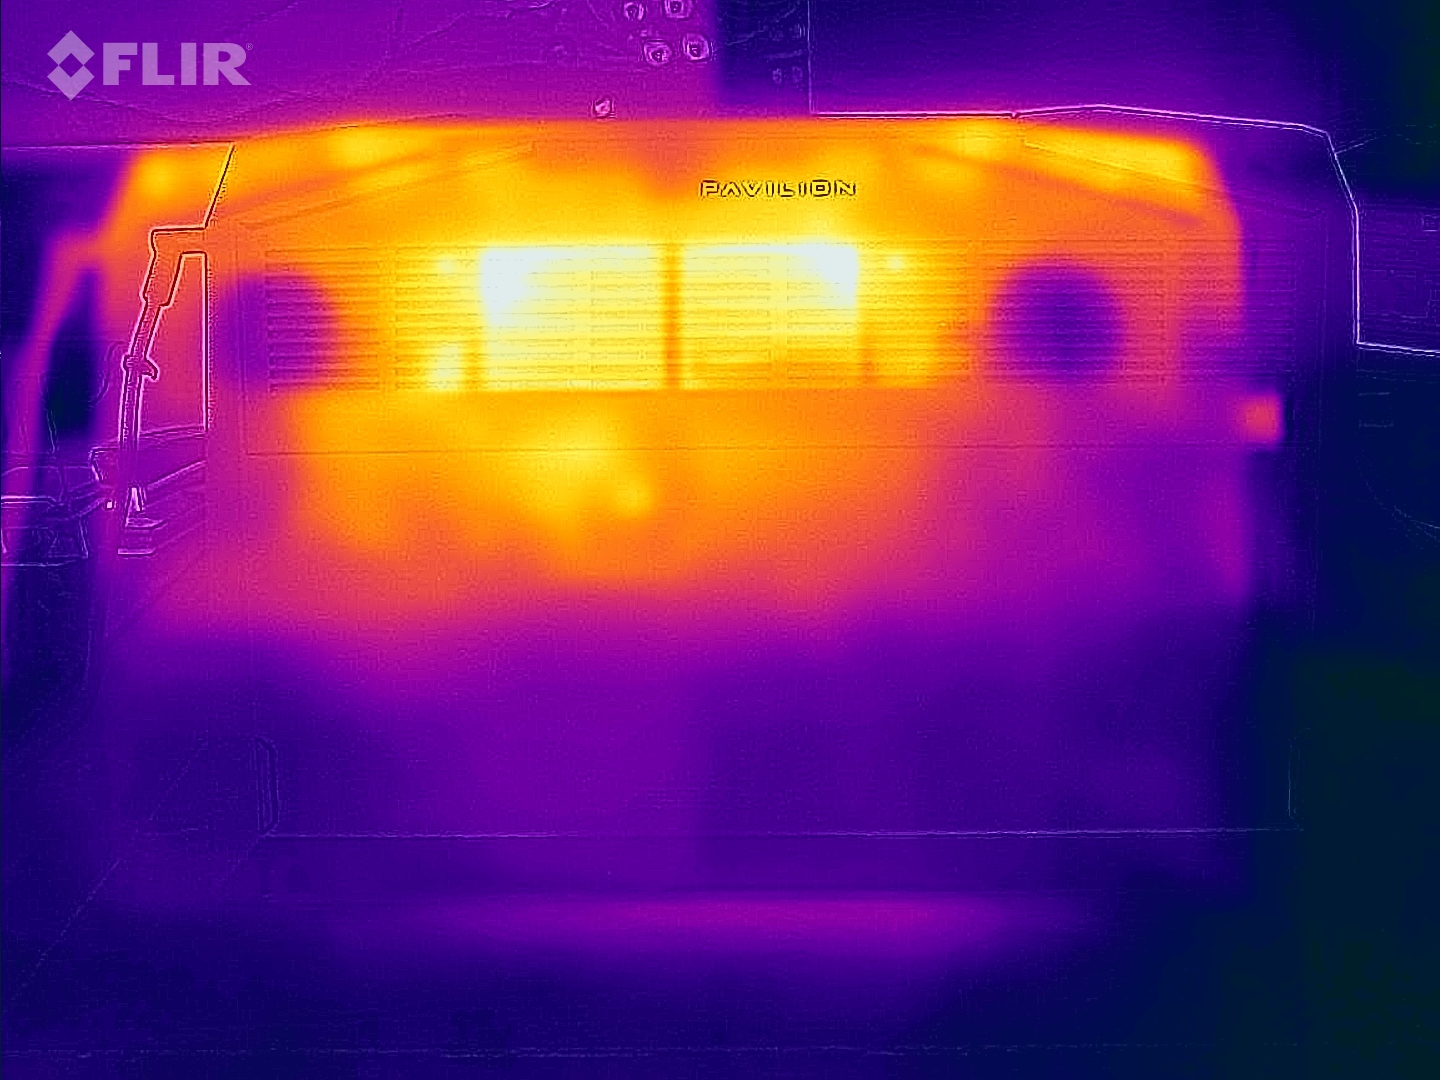
A Pavilion Gaming 17 também não mostra nada de anormal no desenvolvimento do calor. Um máximo de 44 °C (~111 °F) na parte superior e 48 °C (~115 °F) na parte inferior após 60 minutos de testes de estresse com as ferramentas FurMark e Prime95 são típicos para o hardware embutido. O chassi inteiro permanece abaixo da marca de 30 °C (~86 °F) em uso ocioso, o que o torna agradavelmente fresco
(±) A temperatura máxima no lado superior é 44 °C / 111 F, em comparação com a média de 40.4 °C / 105 F , variando de 21.2 a 68.8 °C para a classe Gaming.
(-) A parte inferior aquece até um máximo de 48 °C / 118 F, em comparação com a média de 43.2 °C / 110 F
(+) Em uso inativo, a temperatura média para o lado superior é 26.6 °C / 80 F, em comparação com a média do dispositivo de 33.9 °C / ### class_avg_f### F.
(±) Jogando The Witcher 3, a temperatura média para o lado superior é 36.2 °C / 97 F, em comparação com a média do dispositivo de 33.9 °C / ## #class_avg_f### F.
(+) Os apoios para as mãos e o touchpad estão atingindo a temperatura máxima da pele (34 °C / 93.2 F) e, portanto, não estão quentes.
(-) A temperatura média da área do apoio para as mãos de dispositivos semelhantes foi 28.8 °C / 83.8 F (-5.2 °C / -9.4 F).
| HP Pavilion Gaming 17-cd2146ng i5-11300H, GeForce RTX 3050 Ti Laptop GPU | Dell G15 5510-43NHT i5-10200H, GeForce RTX 3050 Ti Laptop GPU | Lenovo Ideapad Gaming 3 15IHU-82K1002RGE i5-11300H, GeForce RTX 3050 Ti Laptop GPU | HP Victus 16-e0145ng R5 5600H, GeForce RTX 3050 Ti Laptop GPU | HP Pavilion Gaming 17-cd0085cl i7-9750H, GeForce GTX 1660 Ti Max-Q | |
|---|---|---|---|---|---|
| Heat | -9% | 3% | -22% | -18% | |
| Maximum Upper Side * (°C) | 44 | 45.9 -4% | 43.2 2% | 54 -23% | 42.6 3% |
| Maximum Bottom * (°C) | 48 | 51.9 -8% | 47.9 -0% | 47 2% | 49 -2% |
| Idle Upper Side * (°C) | 27 | 30.1 -11% | 24.9 8% | 41 -52% | 34 -26% |
| Idle Bottom * (°C) | 27 | 30.1 -11% | 27 -0% | 31 -15% | 39.4 -46% |
* ... menor é melhor
Teste de estresse
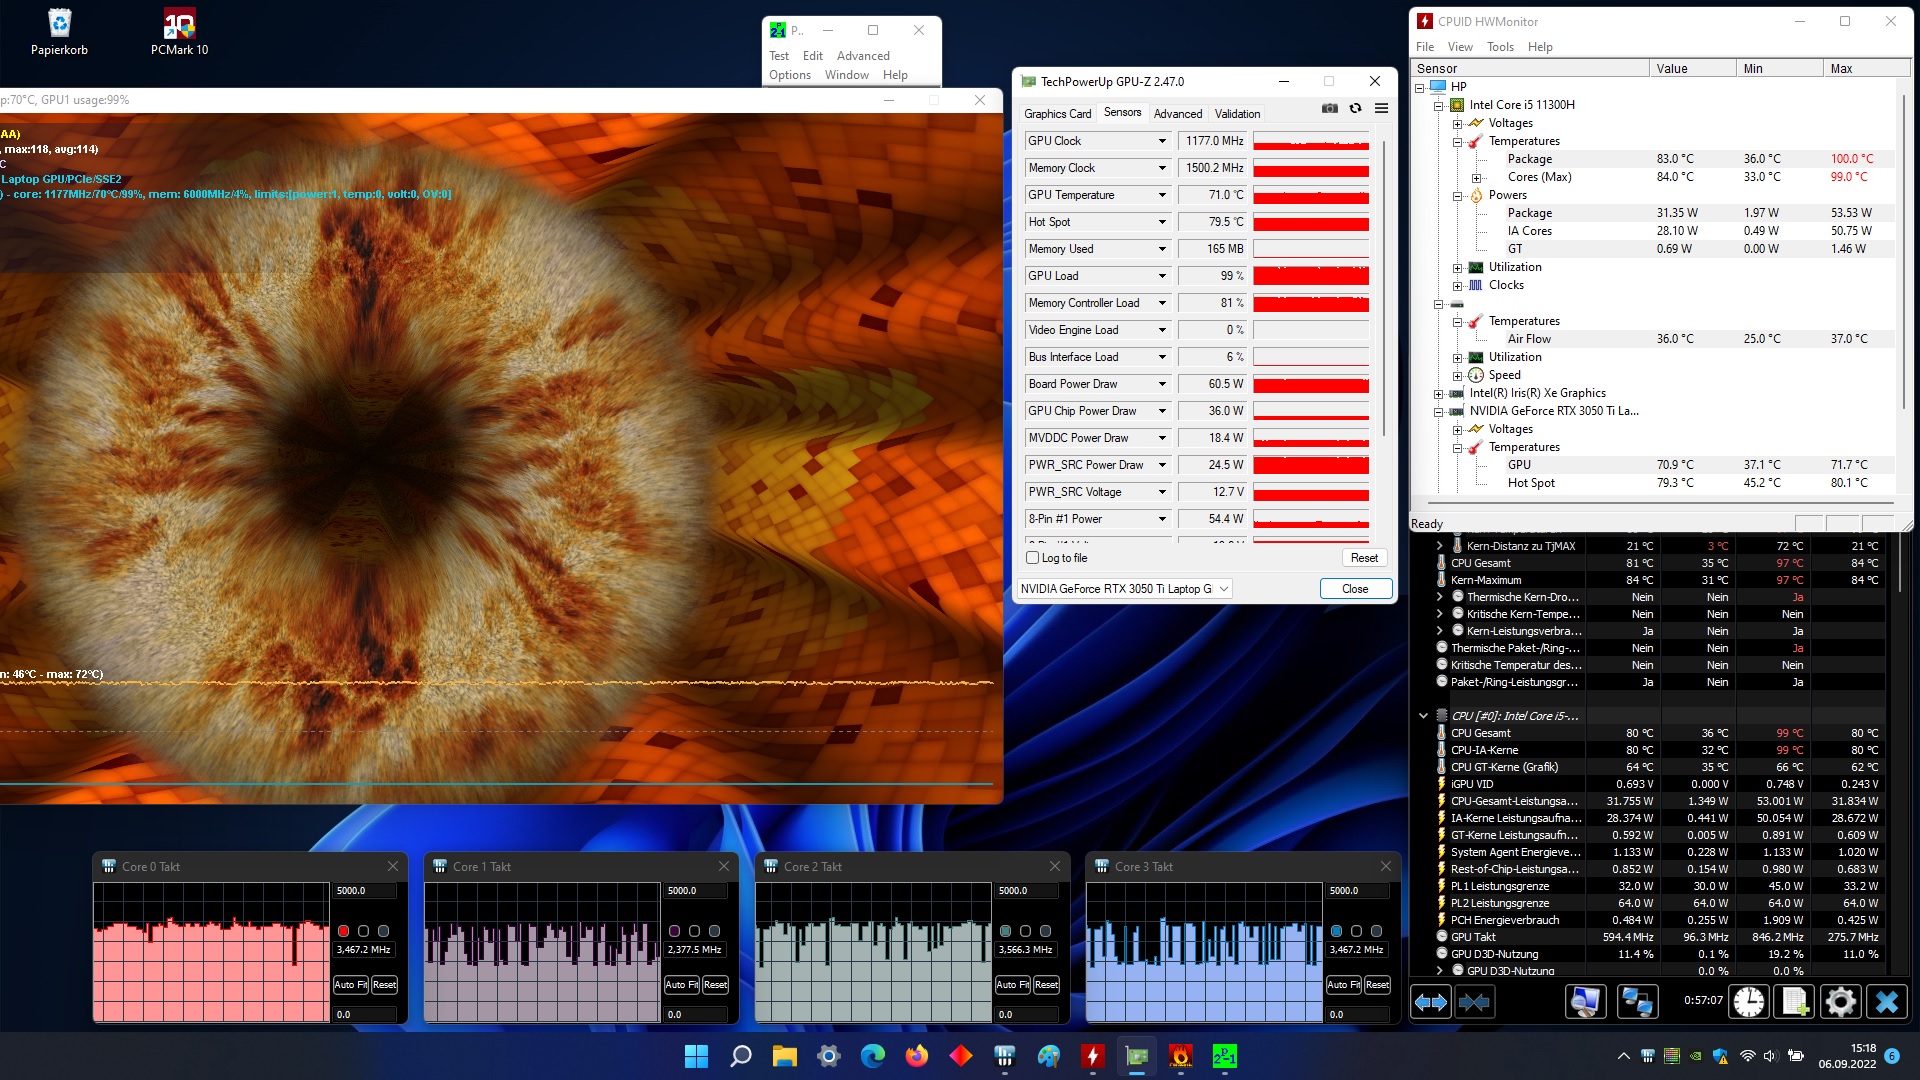
Os componentes também não sofrem com o superaquecimento. Embora o núcleo i5-11300H alcance brevemente 100 °C (~212 °F) sob carga total (de acordo com a ferramenta HWMonitor), a temperatura se estabelece a 83 °C (~181 °F) aceitável após algum tempo (a uma taxa de relógio decente). O GeForce RTX 3050 Ti atinge uma temperatura média de 71 °C (~160 °F), o que também é um valor aceitável e inofensivo
Oradores
HP Pavilion Gaming 17-cd2146ng análise de áudio
(±) | o volume do alto-falante é médio, mas bom (###valor### dB)
Graves 100 - 315Hz
(-) | quase nenhum baixo - em média 19.5% menor que a mediana
(±) | a linearidade dos graves é média (11.5% delta para a frequência anterior)
Médios 400 - 2.000 Hz
(+) | médios equilibrados - apenas 3.2% longe da mediana
(+) | médios são lineares (3.8% delta para frequência anterior)
Altos 2 - 16 kHz
(±) | máximos mais altos - em média 8.6% maior que a mediana
(±) | a linearidade dos máximos é média (8% delta para frequência anterior)
Geral 100 - 16.000 Hz
(±) | a linearidade do som geral é média (20.5% diferença em relação à mediana)
Comparado com a mesma classe
» 73% de todos os dispositivos testados nesta classe foram melhores, 5% semelhantes, 22% piores
» O melhor teve um delta de 6%, a média foi 18%, o pior foi 132%
Comparado com todos os dispositivos testados
» 54% de todos os dispositivos testados foram melhores, 8% semelhantes, 38% piores
» O melhor teve um delta de 4%, a média foi 24%, o pior foi 134%
HP Victus 16-e0145ng análise de áudio
(±) | o volume do alto-falante é médio, mas bom (###valor### dB)
Graves 100 - 315Hz
(-) | quase nenhum baixo - em média 21% menor que a mediana
(±) | a linearidade dos graves é média (12.6% delta para a frequência anterior)
Médios 400 - 2.000 Hz
(+) | médios equilibrados - apenas 1.1% longe da mediana
(+) | médios são lineares (3.6% delta para frequência anterior)
Altos 2 - 16 kHz
(+) | agudos equilibrados - apenas 4.2% longe da mediana
(+) | os máximos são lineares (5.3% delta da frequência anterior)
Geral 100 - 16.000 Hz
(±) | a linearidade do som geral é média (16.2% diferença em relação à mediana)
Comparado com a mesma classe
» 40% de todos os dispositivos testados nesta classe foram melhores, 7% semelhantes, 54% piores
» O melhor teve um delta de 6%, a média foi 18%, o pior foi 132%
Comparado com todos os dispositivos testados
» 26% de todos os dispositivos testados foram melhores, 6% semelhantes, 68% piores
» O melhor teve um delta de 4%, a média foi 24%, o pior foi 134%
Gestão de energia
| desligado | |
| Ocioso | |
| Carga |
|
Key:
min: | |
| HP Pavilion Gaming 17-cd2146ng i5-11300H, GeForce RTX 3050 Ti Laptop GPU | Dell G15 5510-43NHT i5-10200H, GeForce RTX 3050 Ti Laptop GPU | Lenovo Ideapad Gaming 3 15IHU-82K1002RGE i5-11300H, GeForce RTX 3050 Ti Laptop GPU | HP Victus 16-e0145ng R5 5600H, GeForce RTX 3050 Ti Laptop GPU | HP Pavilion Gaming 17-cd0085cl i7-9750H, GeForce GTX 1660 Ti Max-Q | Média da turma Gaming | |
|---|---|---|---|---|---|---|
| Power Consumption | -13% | -4% | -28% | -12% | -112% | |
| Idle Minimum * (Watt) | 3 | 4.6 -53% | 4.9 -63% | 7 -133% | 5.4 -80% | 13.3 ? -343% |
| Idle Average * (Watt) | 8 | 6.5 19% | 8.3 -4% | 9 -13% | 9.2 -15% | 19 ? -138% |
| Idle Maximum * (Watt) | 28 | 10.1 64% | 8.9 68% | 15 46% | 13 54% | 24.5 ? 12% |
| Load Average * (Watt) | 88 | 129 -47% | 81 8% | 93 -6% | 85.9 2% | 108.1 ? -23% |
| Witcher 3 ultra * (Watt) | 98.2 | 129 -31% | 119 -21% | 134.5 -37% | 107.9 -10% | |
| Load Maximum * (Watt) | 152 | 195 -28% | 172 -13% | 185 -22% | 182.2 -20% | 254 ? -67% |
* ... menor é melhor
Energy consumption during The Witcher 3 / stress test
Energy consumption with an external monitor
Duração da bateria
Não compreendemos totalmente a decisão da HP de instalar um slot de 2,5 polegadas em vez de uma bateria maior. 52.5 Wh é bastante modesto, o que também se torna perceptível nos tempos de funcionamento da bateria. Pouco menos de 5 horas de navegação na Internet sobre Wi-Fi com brilho médio não é mais motivo de comemoração nos dias de hoje. A concorrência está um pouco à frente aqui
| HP Pavilion Gaming 17-cd2146ng i5-11300H, GeForce RTX 3050 Ti Laptop GPU, 52.5 Wh | Dell G15 5510-43NHT i5-10200H, GeForce RTX 3050 Ti Laptop GPU, 56 Wh | Lenovo Ideapad Gaming 3 15IHU-82K1002RGE i5-11300H, GeForce RTX 3050 Ti Laptop GPU, 45 Wh | HP Victus 16-e0145ng R5 5600H, GeForce RTX 3050 Ti Laptop GPU, 70 Wh | HP Pavilion Gaming 17-cd0085cl i7-9750H, GeForce GTX 1660 Ti Max-Q, 52.5 Wh | Média da turma Gaming | |
|---|---|---|---|---|---|---|
| Duração da bateria | 26% | 32% | 42% | 14% | 40% | |
| WiFi v1.3 (h) | 5 | 6.3 26% | 6.6 32% | 7.1 42% | 5.7 14% | 7.01 ? 40% |
| H.264 (h) | 8.6 | 7.7 | 8.26 ? | |||
| Load (h) | 1.1 | 1.1 | 1 | 1.47 ? | ||
| Reader / Idle (h) | 11.6 | 8.71 ? |
Pro
Contra
Veredicto
A HP oferece um bom laptop para jogos com o Pavilion Gaming 17-cd2146ng.
Ao contrário da maioria dos concorrentes, o laptop de 17 polegadas tem uma tela surpreendentemente boa que não falta contraste ou espaço de cor. O brilho e os tempos de resposta também são comparativamente bons.
O portátil de 17 polegadas não se destaca positiva ou negativamente da multidão nas demais categorias - independentemente de serem os dispositivos de entrada, a caixa, as portas, as emissões ou a qualidade sonora.
Conseqüentemente, dificilmente se pode errar ao comprar o Pavilion Gaming 17. Abaixo de 1.000 Euros (~$1.002), o dispositivo é uma opção muito atraente e aconselhável para jogadores conscientes dos preços.
Preço e disponibilidade
No momento em que escrevemos, nossa configuração de revisão parece não estar disponível nos Estados Unidos. No entanto, você pode ficar de olho em Amazônia e veja se o dispositivo aparece aqui.
HP Pavilion Gaming 17-cd2146ng
- 09/10/2022 v7 (old)
Florian Glaser
Price comparison

