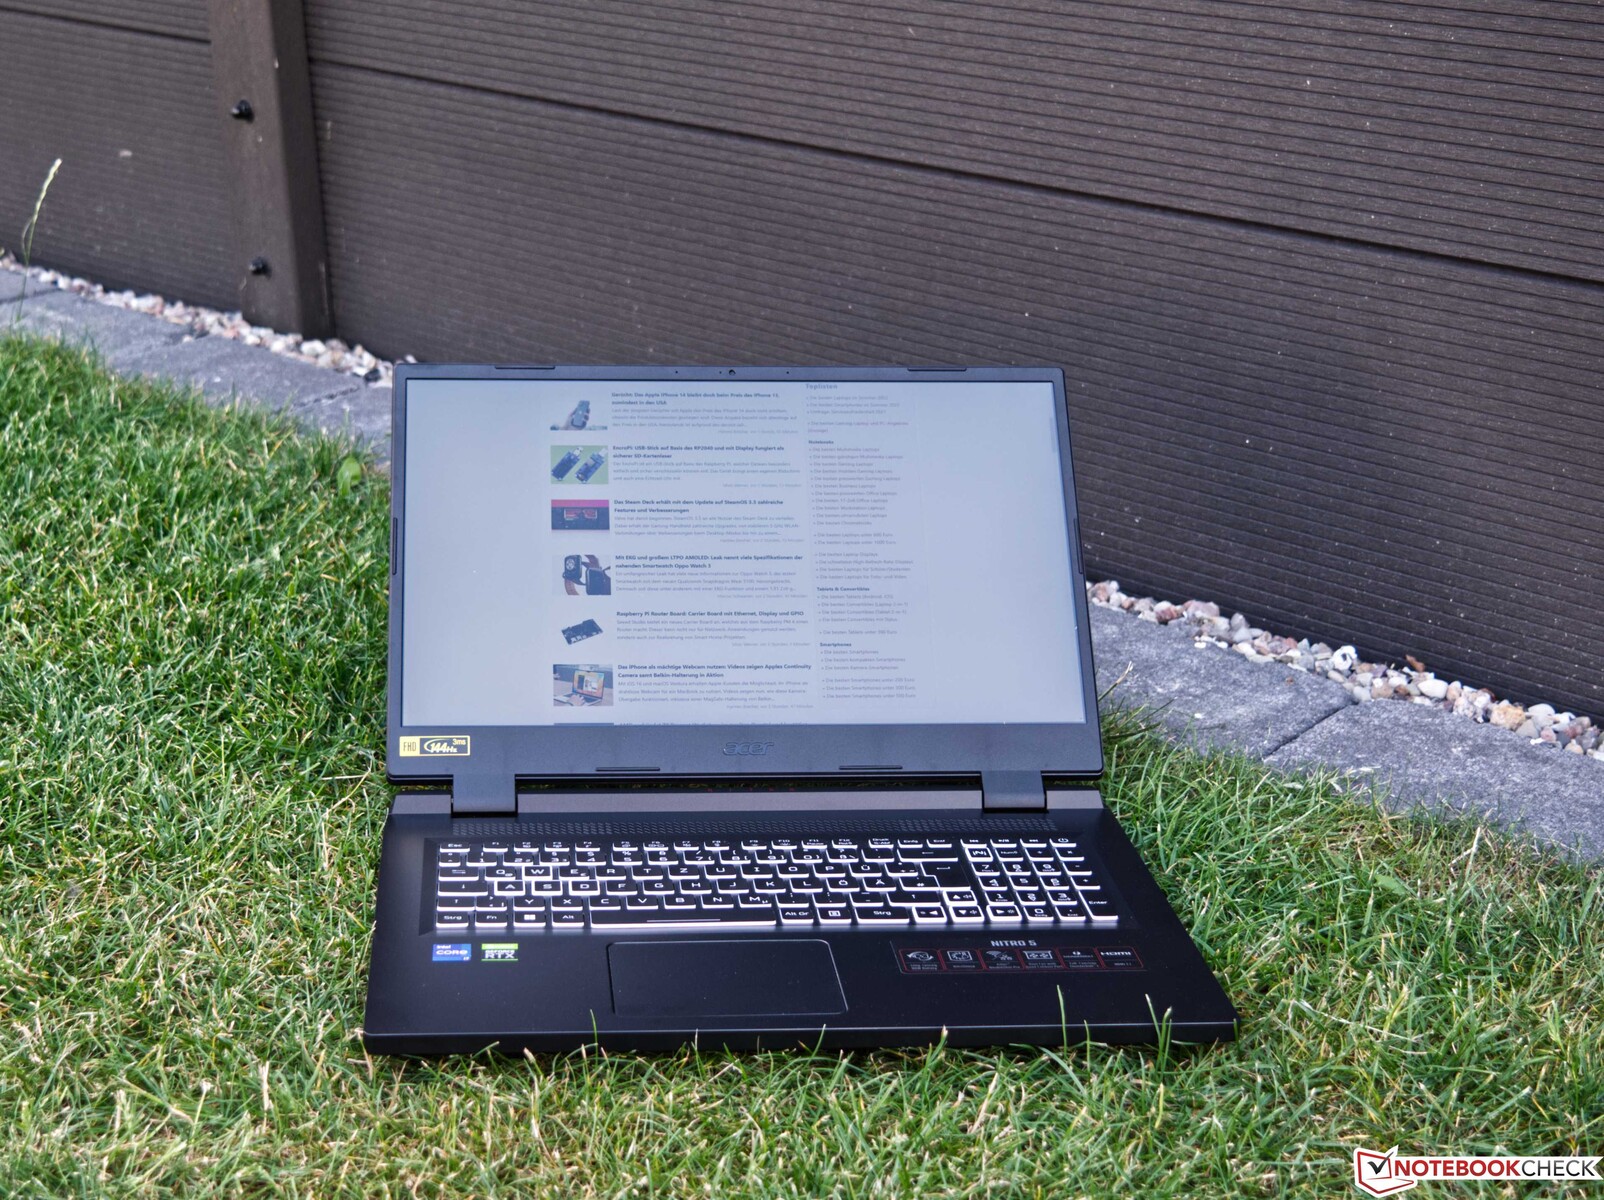
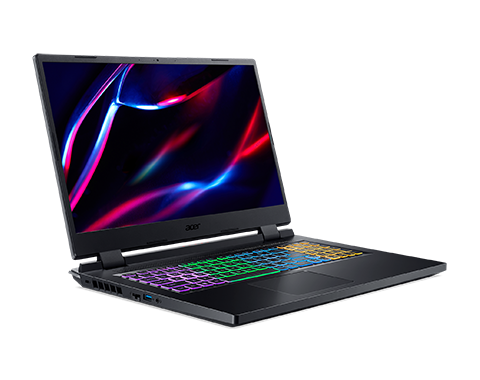
Acer Nitro 5 com RTX 3060 em revisão: Laptop de jogo rápido com a mais recente CPU Intel Alder Lake

A Acer sempre teve laptops para jogos baratos, vendendo-os sob o pseudônimo "Nitro" há alguns anos. O modelo atual da Acer não é diferente e permanece fiel à filosofia da empresa. O atual Acer Nitro 5 AN517-55-738R combina umIntel Core i7-12700H e um Nvidia GeForce RTX 3060 GPU para laptop em uma base de 17 polegadas. A tela também é destinada aos jogadores com seus 144 Hz e tempos de resposta rápidos. O dispositivo em nossa configuração de revisão está atualmente disponível por EUR 1.449 (US$1450) em vários varejistas on-line. Entretanto, o RRP do fabricante de EUR 1.699 (US$1700) é significativamente maior.
O Acer Nitro AN517-55 também está disponível com o mais potente Nvidia GeForce RTX 3070 Ti GPU laptopno entanto, isto chega a mais 300 euros (300 dólares) em comparação com nossa configuração de revisão
Dispositivos igualmente equipados são usados como dispositivos de comparação. Uma lista dos dispositivos pode ser encontrada na tabela a seguir.
Possíveis concorrentes em comparação
Avaliação | Data | Modelo | Peso | Altura | Size | Resolução | Preço |
|---|---|---|---|---|---|---|---|
| 83.9 % v7 (old) | 08/2022 | Acer Nitro 5 AN517-55-738R i7-12700H, GeForce RTX 3060 Laptop GPU | 3.1 kg | 28.6 mm | 17.30" | 1920x1080 | |
| 85.2 % v7 (old) | 02/2022 | Lenovo Legion 5 17ACH6H-82JY0003GE R5 5600H, GeForce RTX 3060 Laptop GPU | 3.1 kg | 24.3 mm | 17.30" | 1920x1080 | |
| 84.1 % v7 (old) | 04/2022 | Asus TUF Gaming F17 FX707Z-HX011W i7-12700H, GeForce RTX 3060 Laptop GPU | 2.5 kg | 25 mm | 17.30" | 1920x1080 | |
| 81.3 % v7 (old) | 08/2021 | Acer Nitro 5 AN517-41-R5Z7 R7 5800H, GeForce RTX 3070 Laptop GPU | 2.7 kg | 24.9 mm | 17.30" | 1920x1080 | |
| 83.9 % v7 (old) | 06/2021 | Schenker XMG Core 17 (Early 2021) i7-10870H, GeForce RTX 3060 Laptop GPU | 2.5 kg | 30.05 mm | 17.30" | 2560x1440 | |
| 80.4 % v7 (old) | 06/2021 | MSI Katana GF76 11UE i7-11800H, GeForce RTX 3060 Laptop GPU | 2.7 kg | 25.2 mm | 17.30" | 1920x1080 |
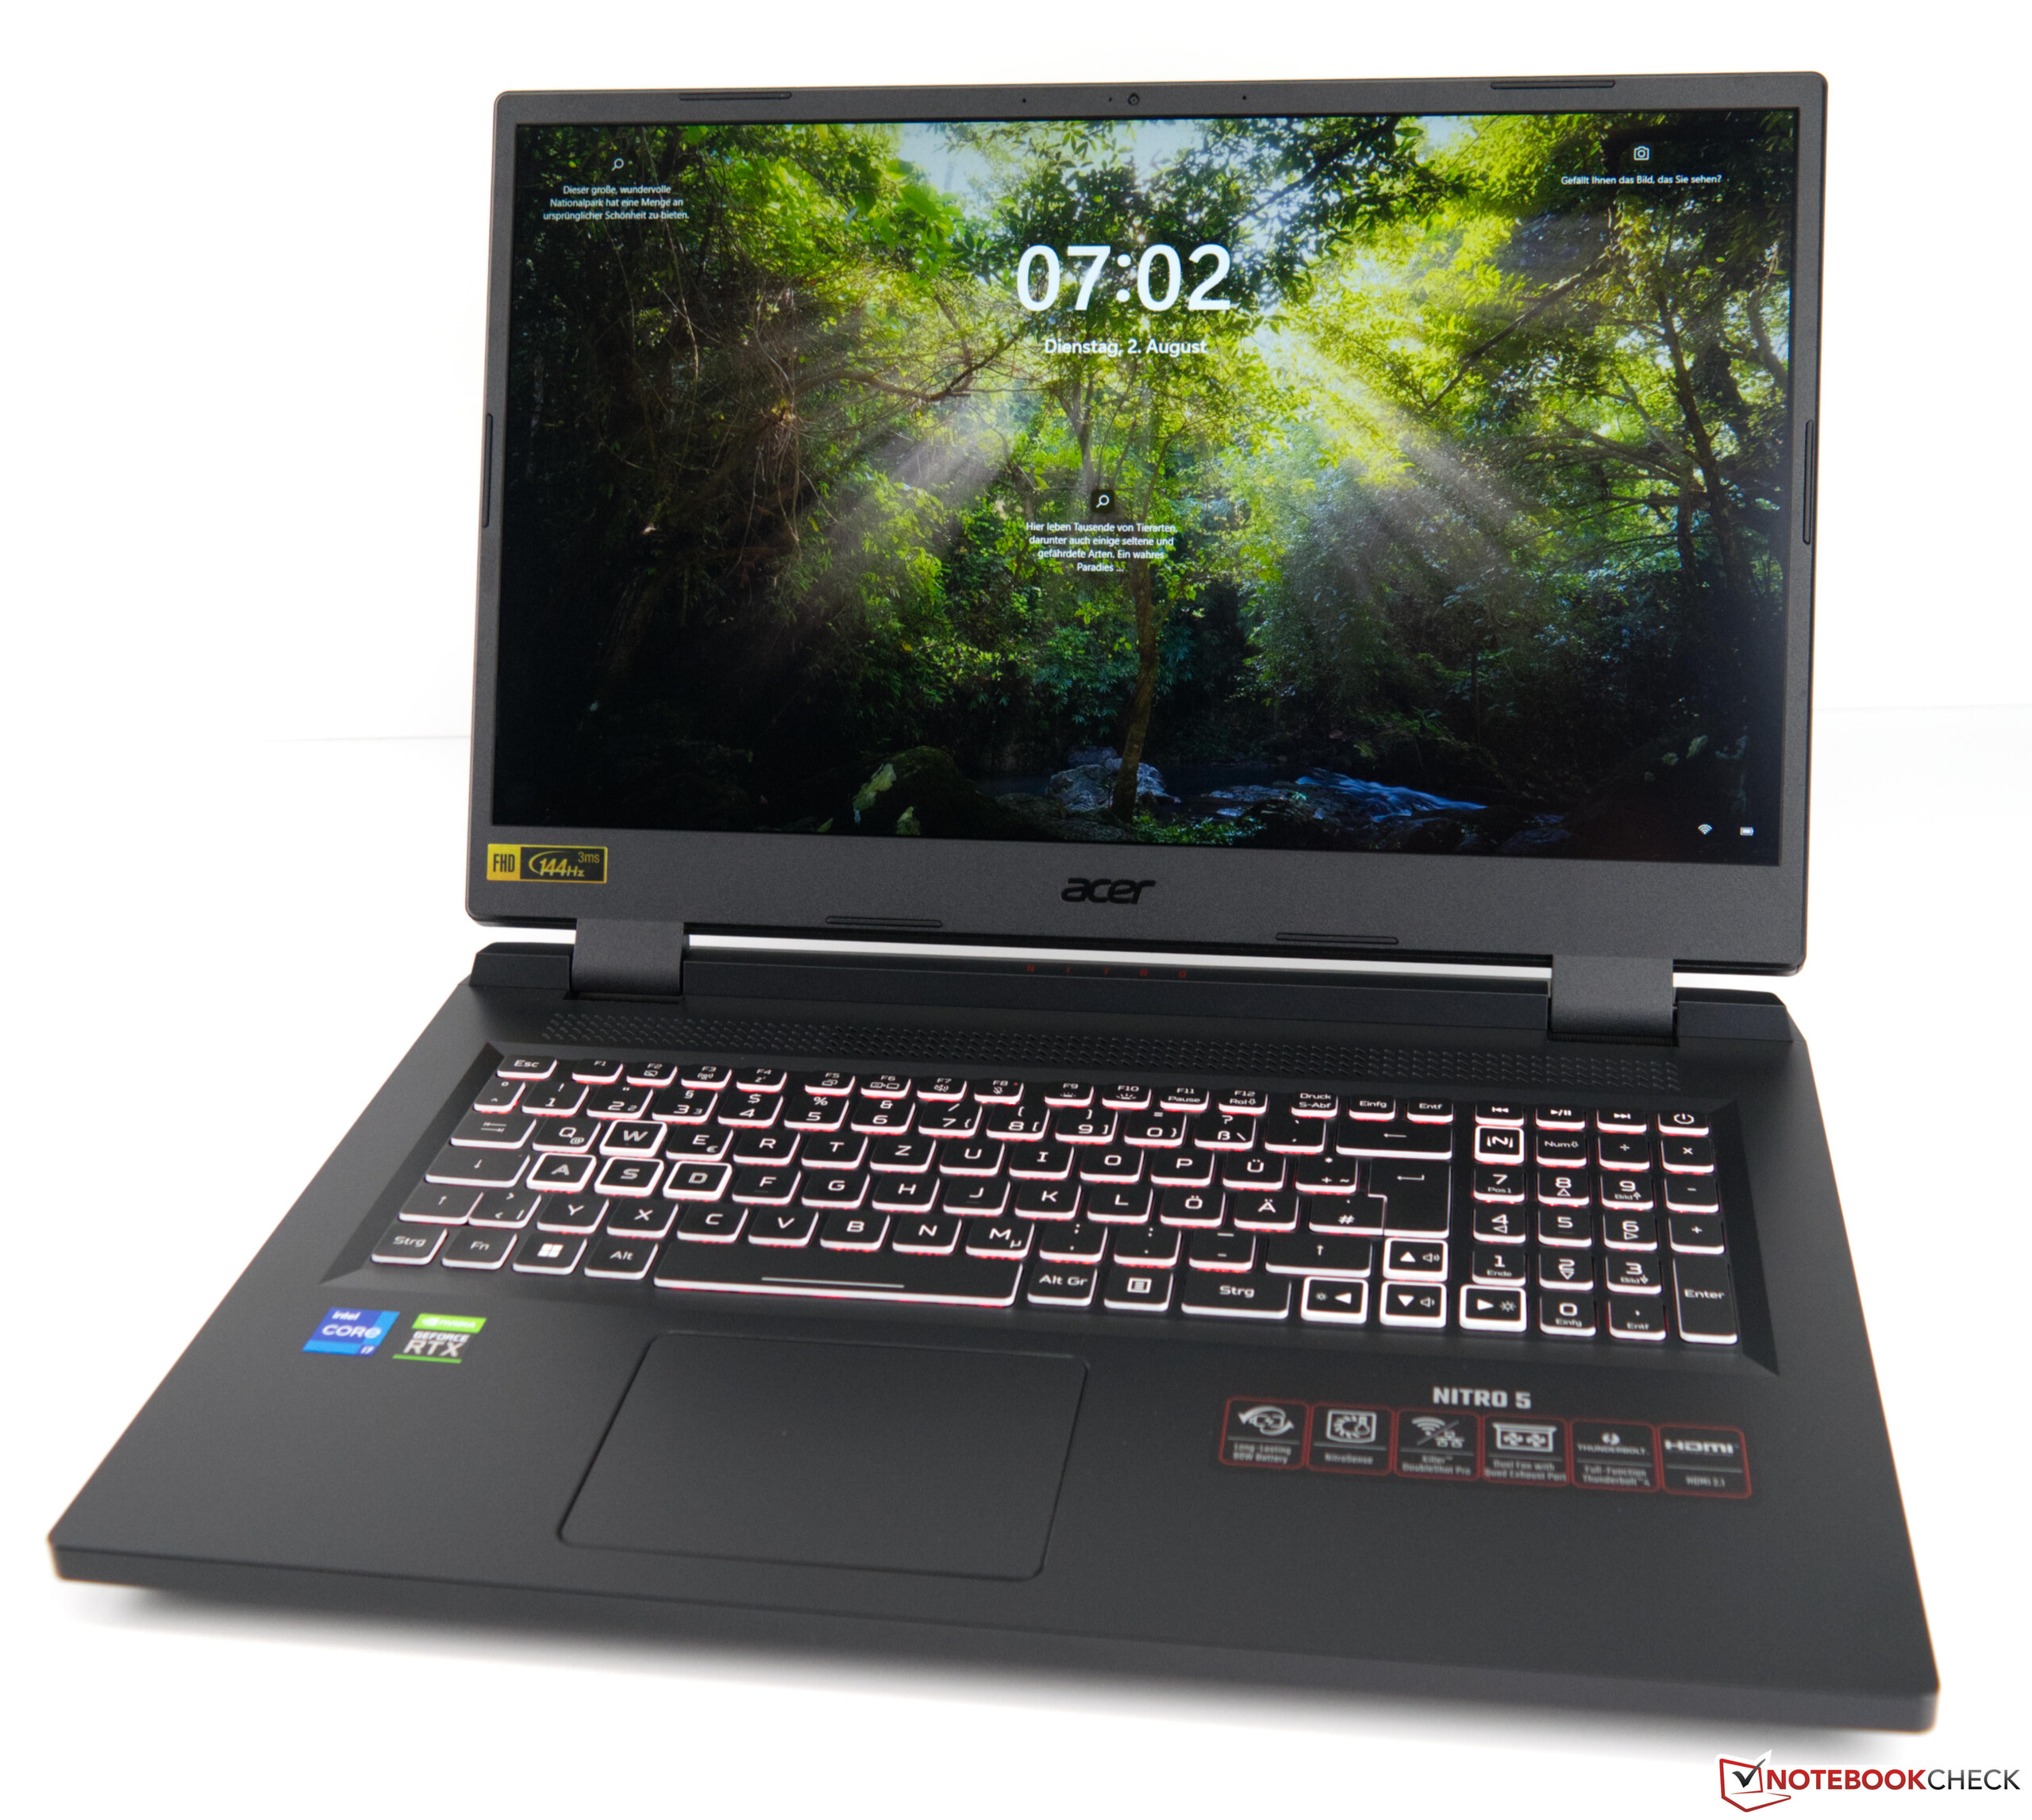
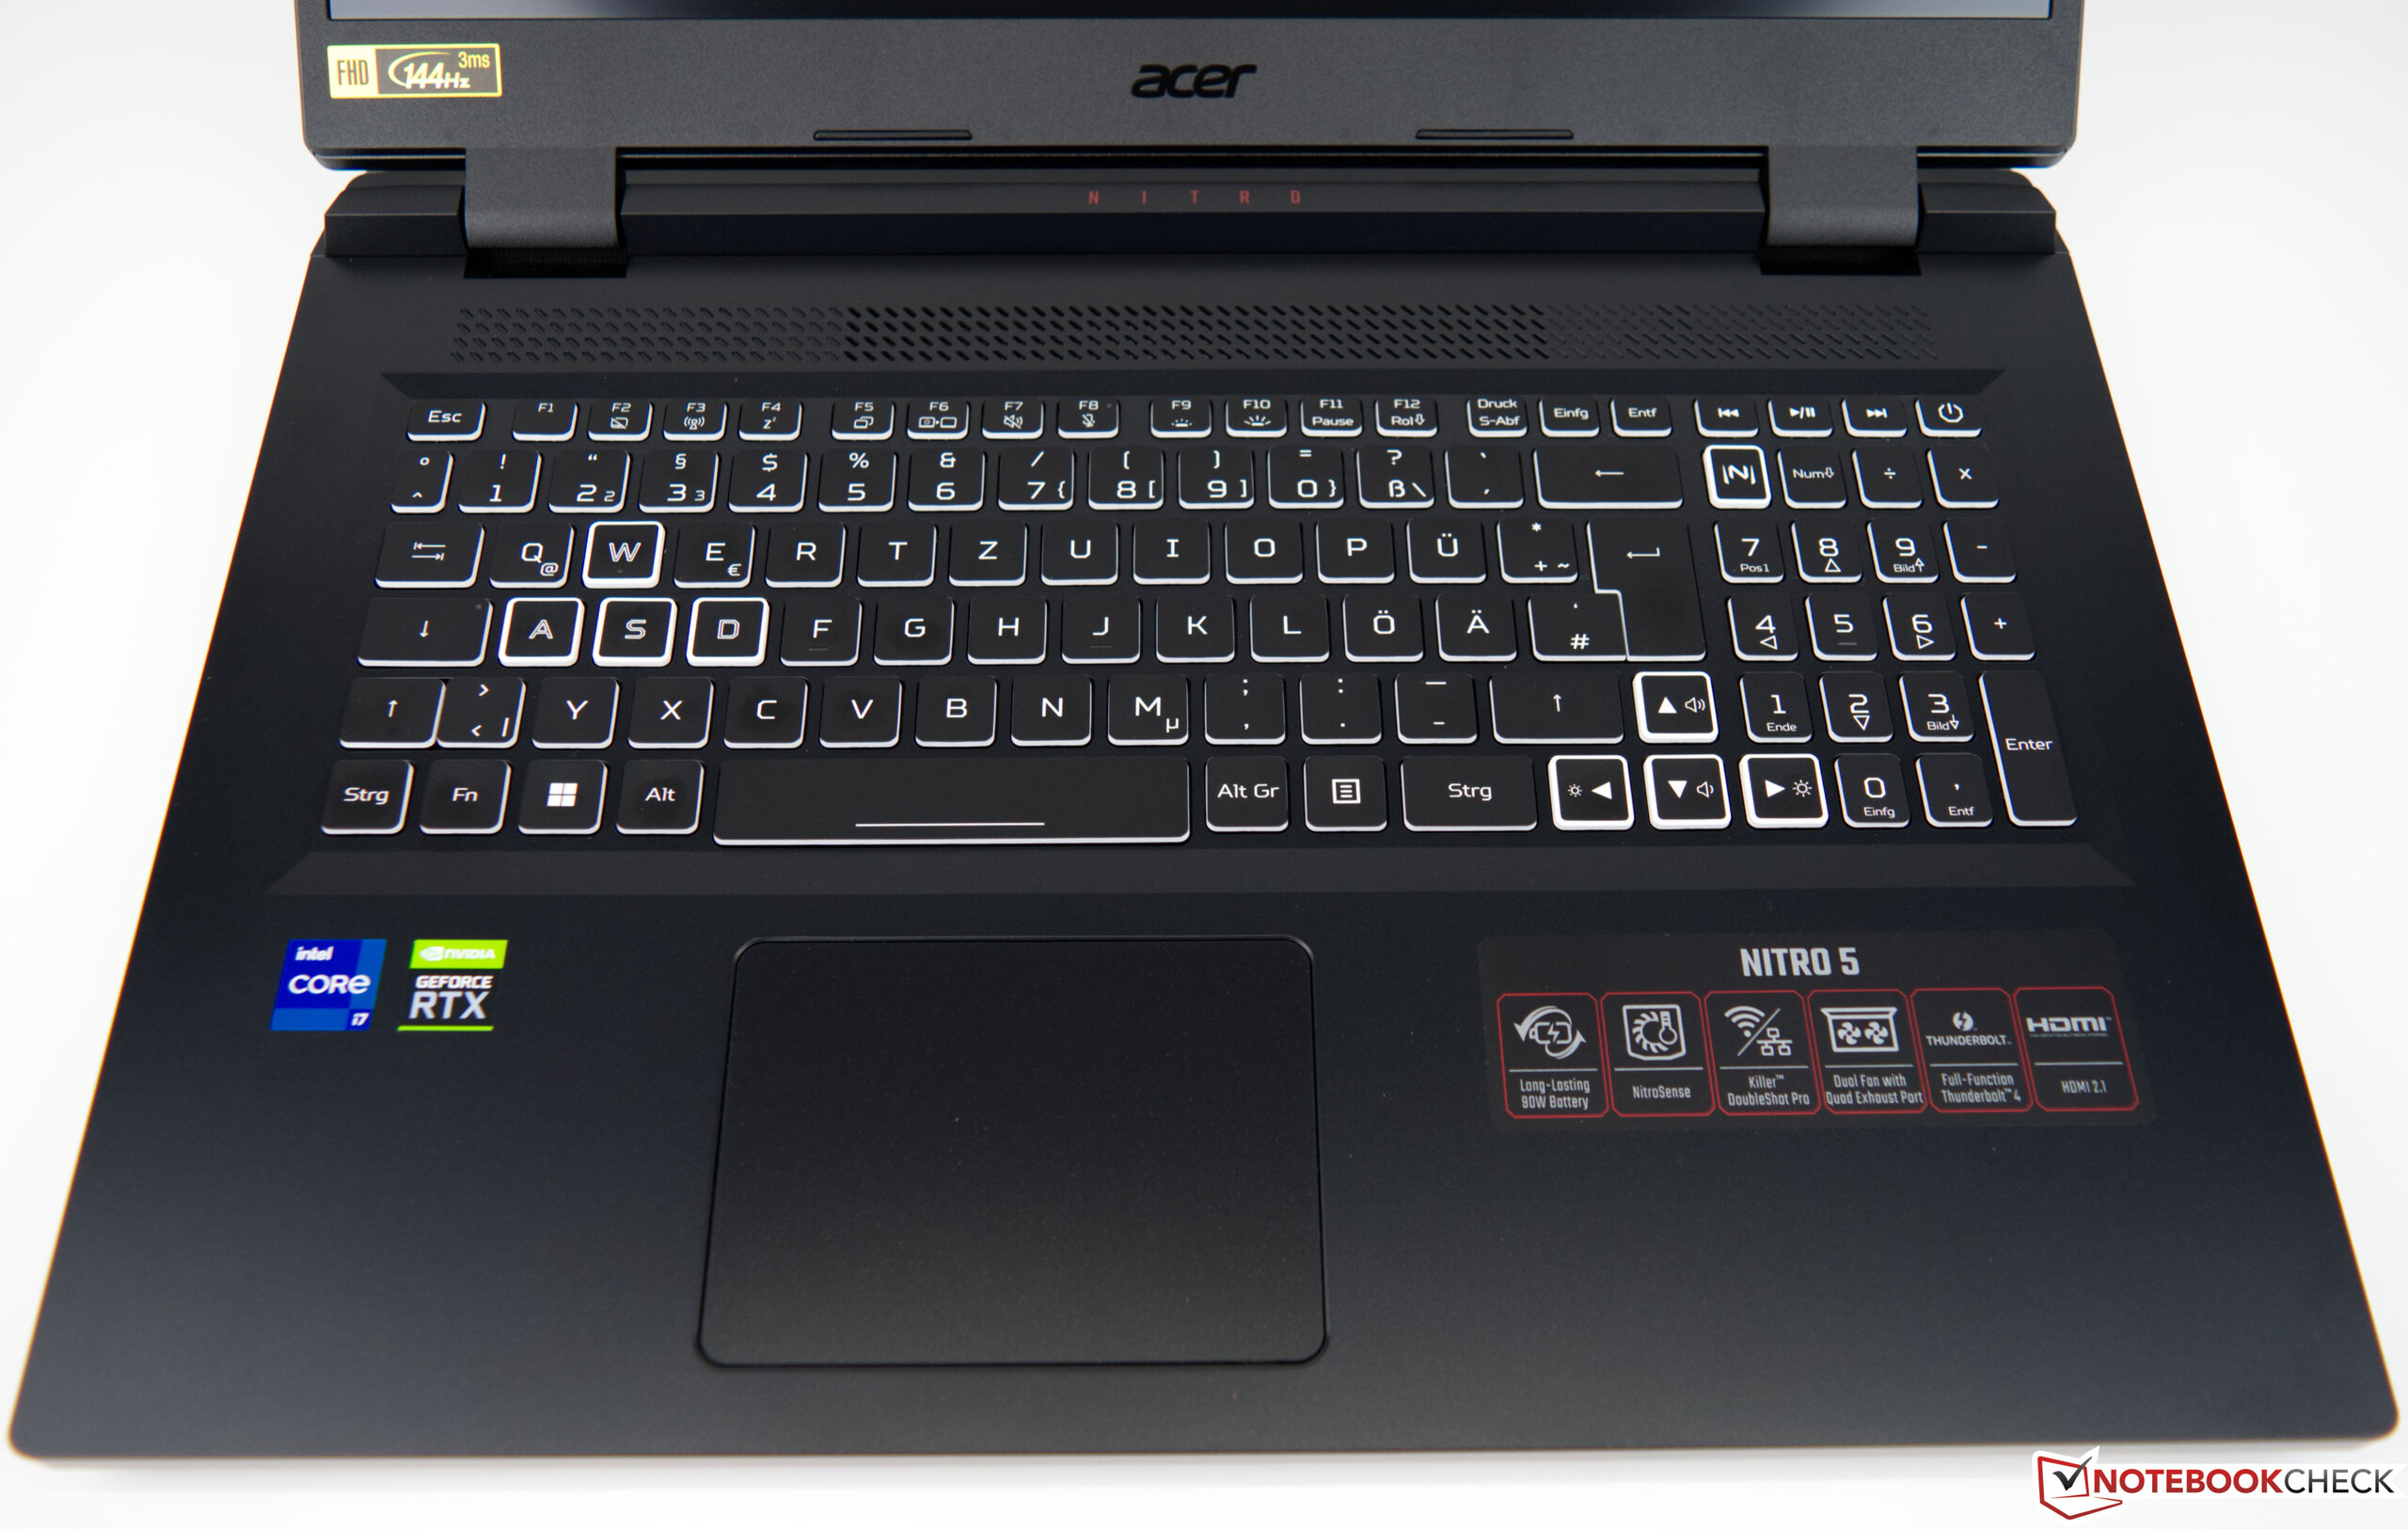
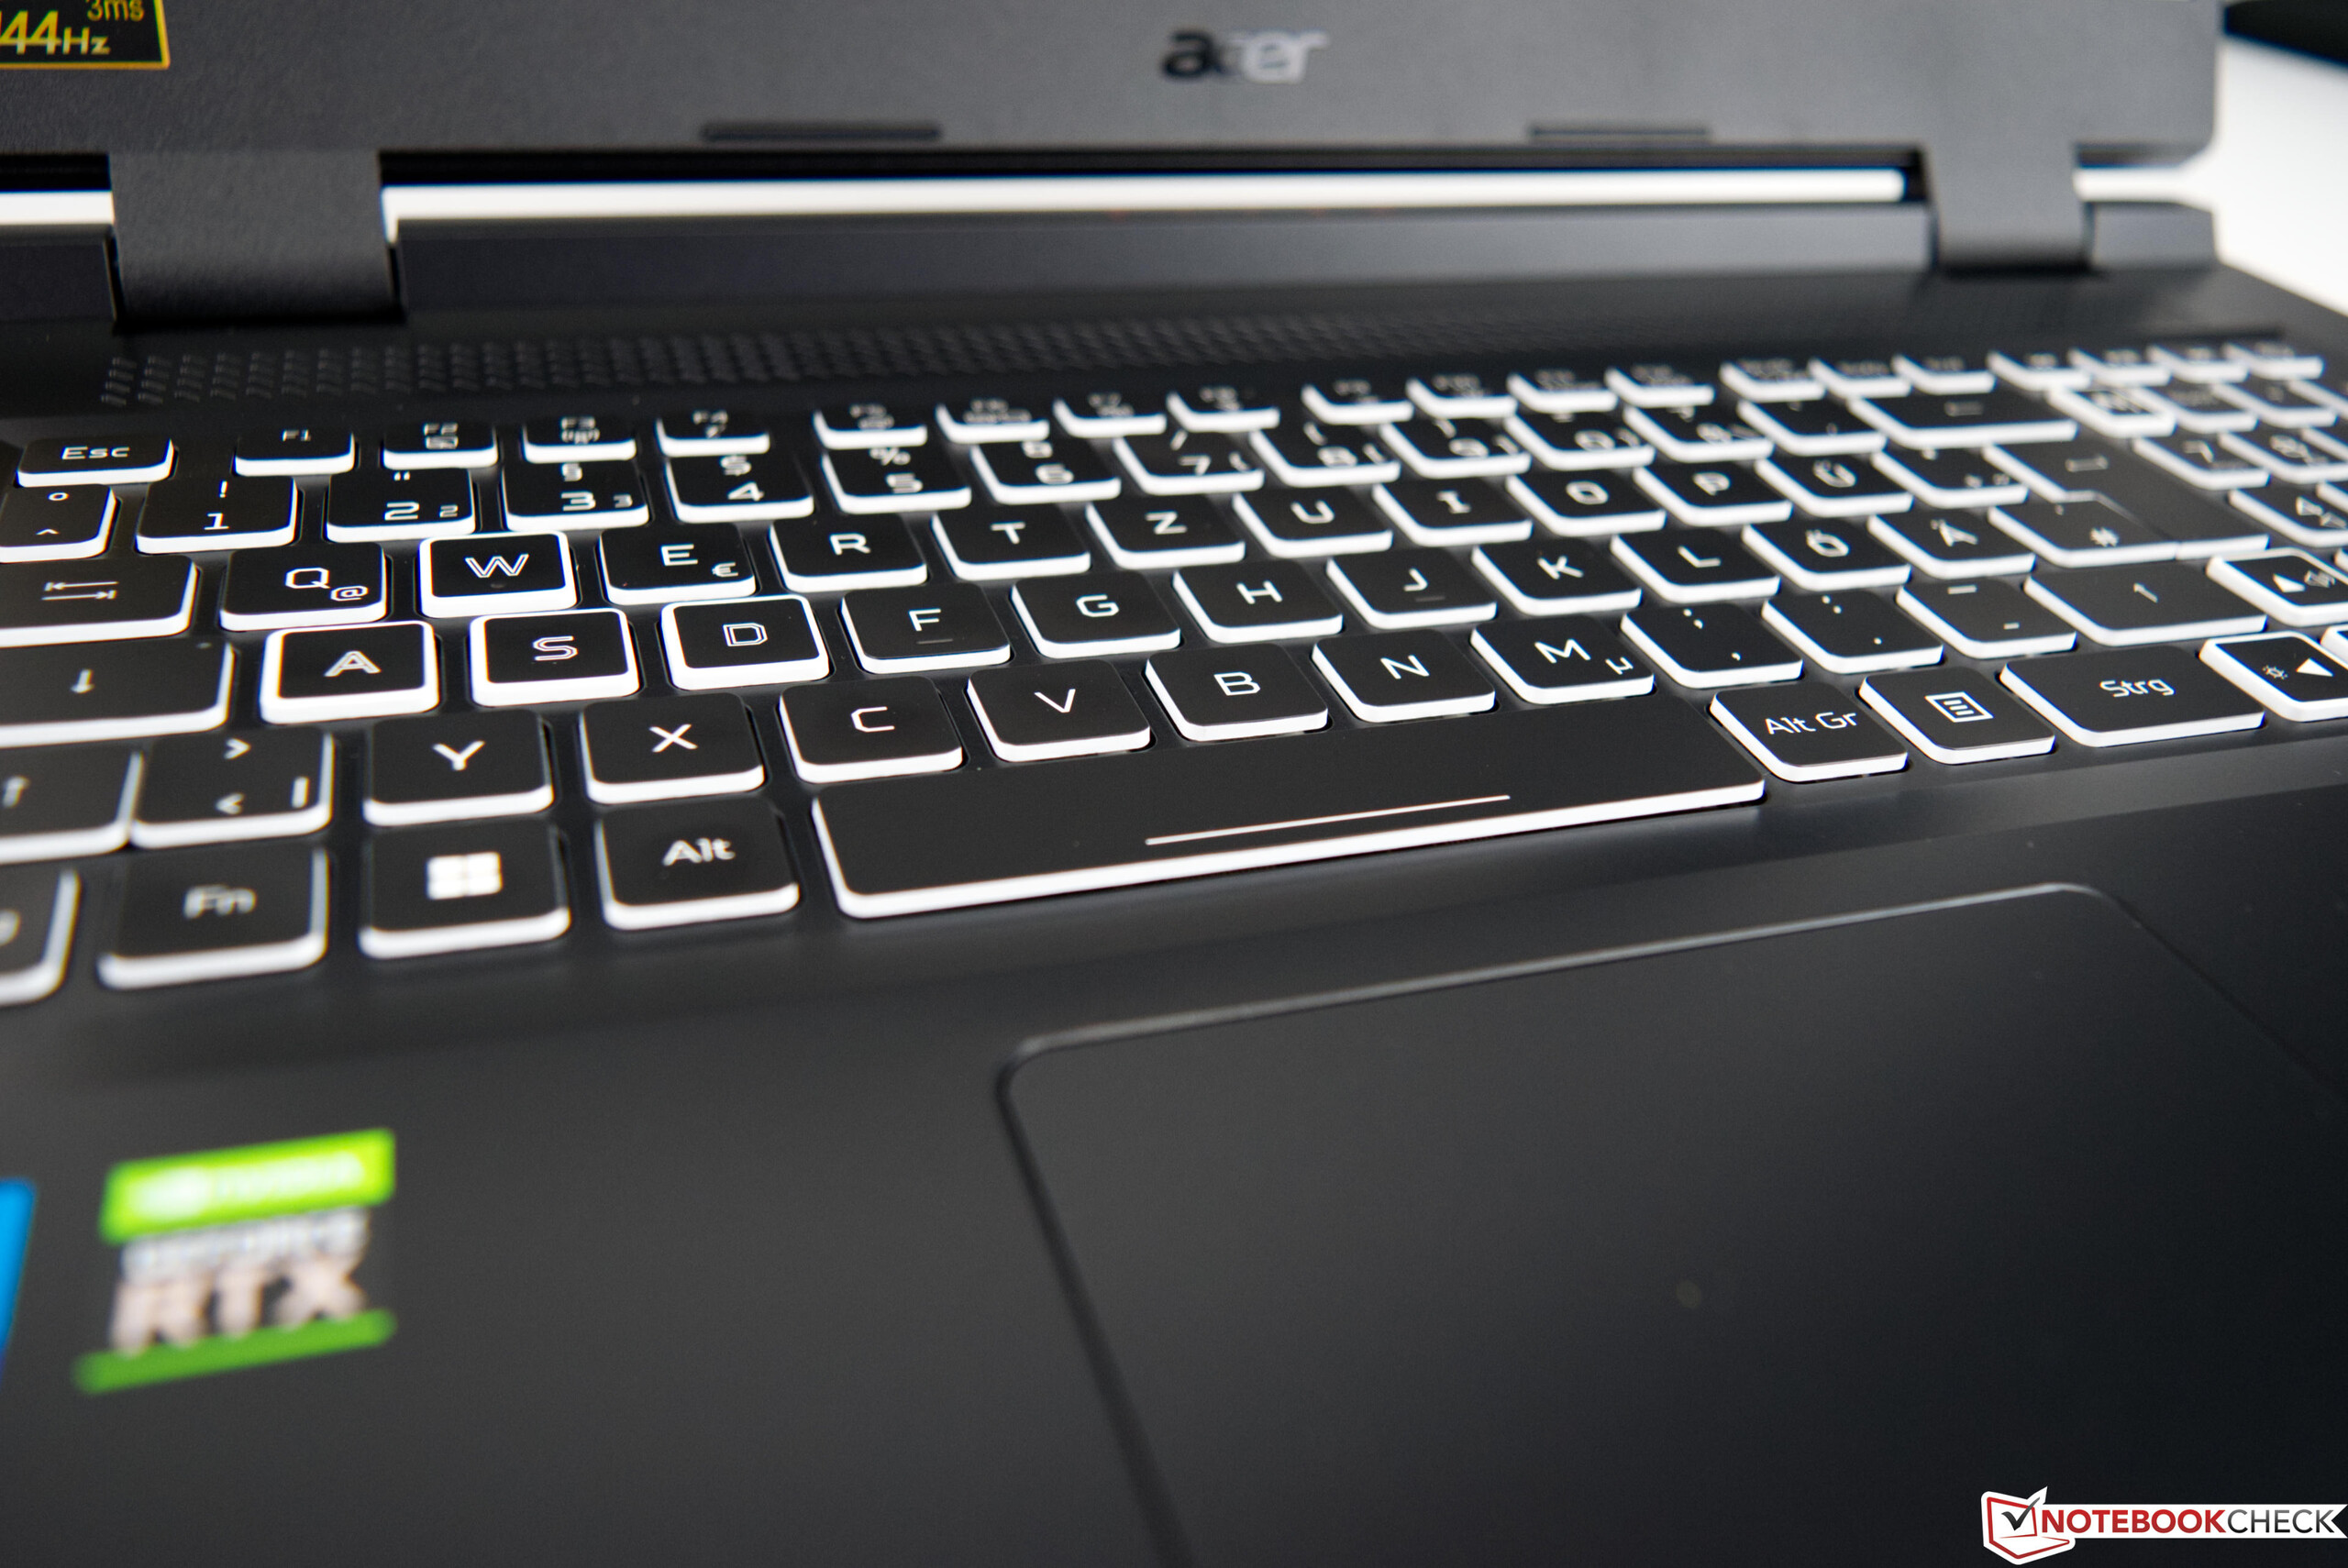
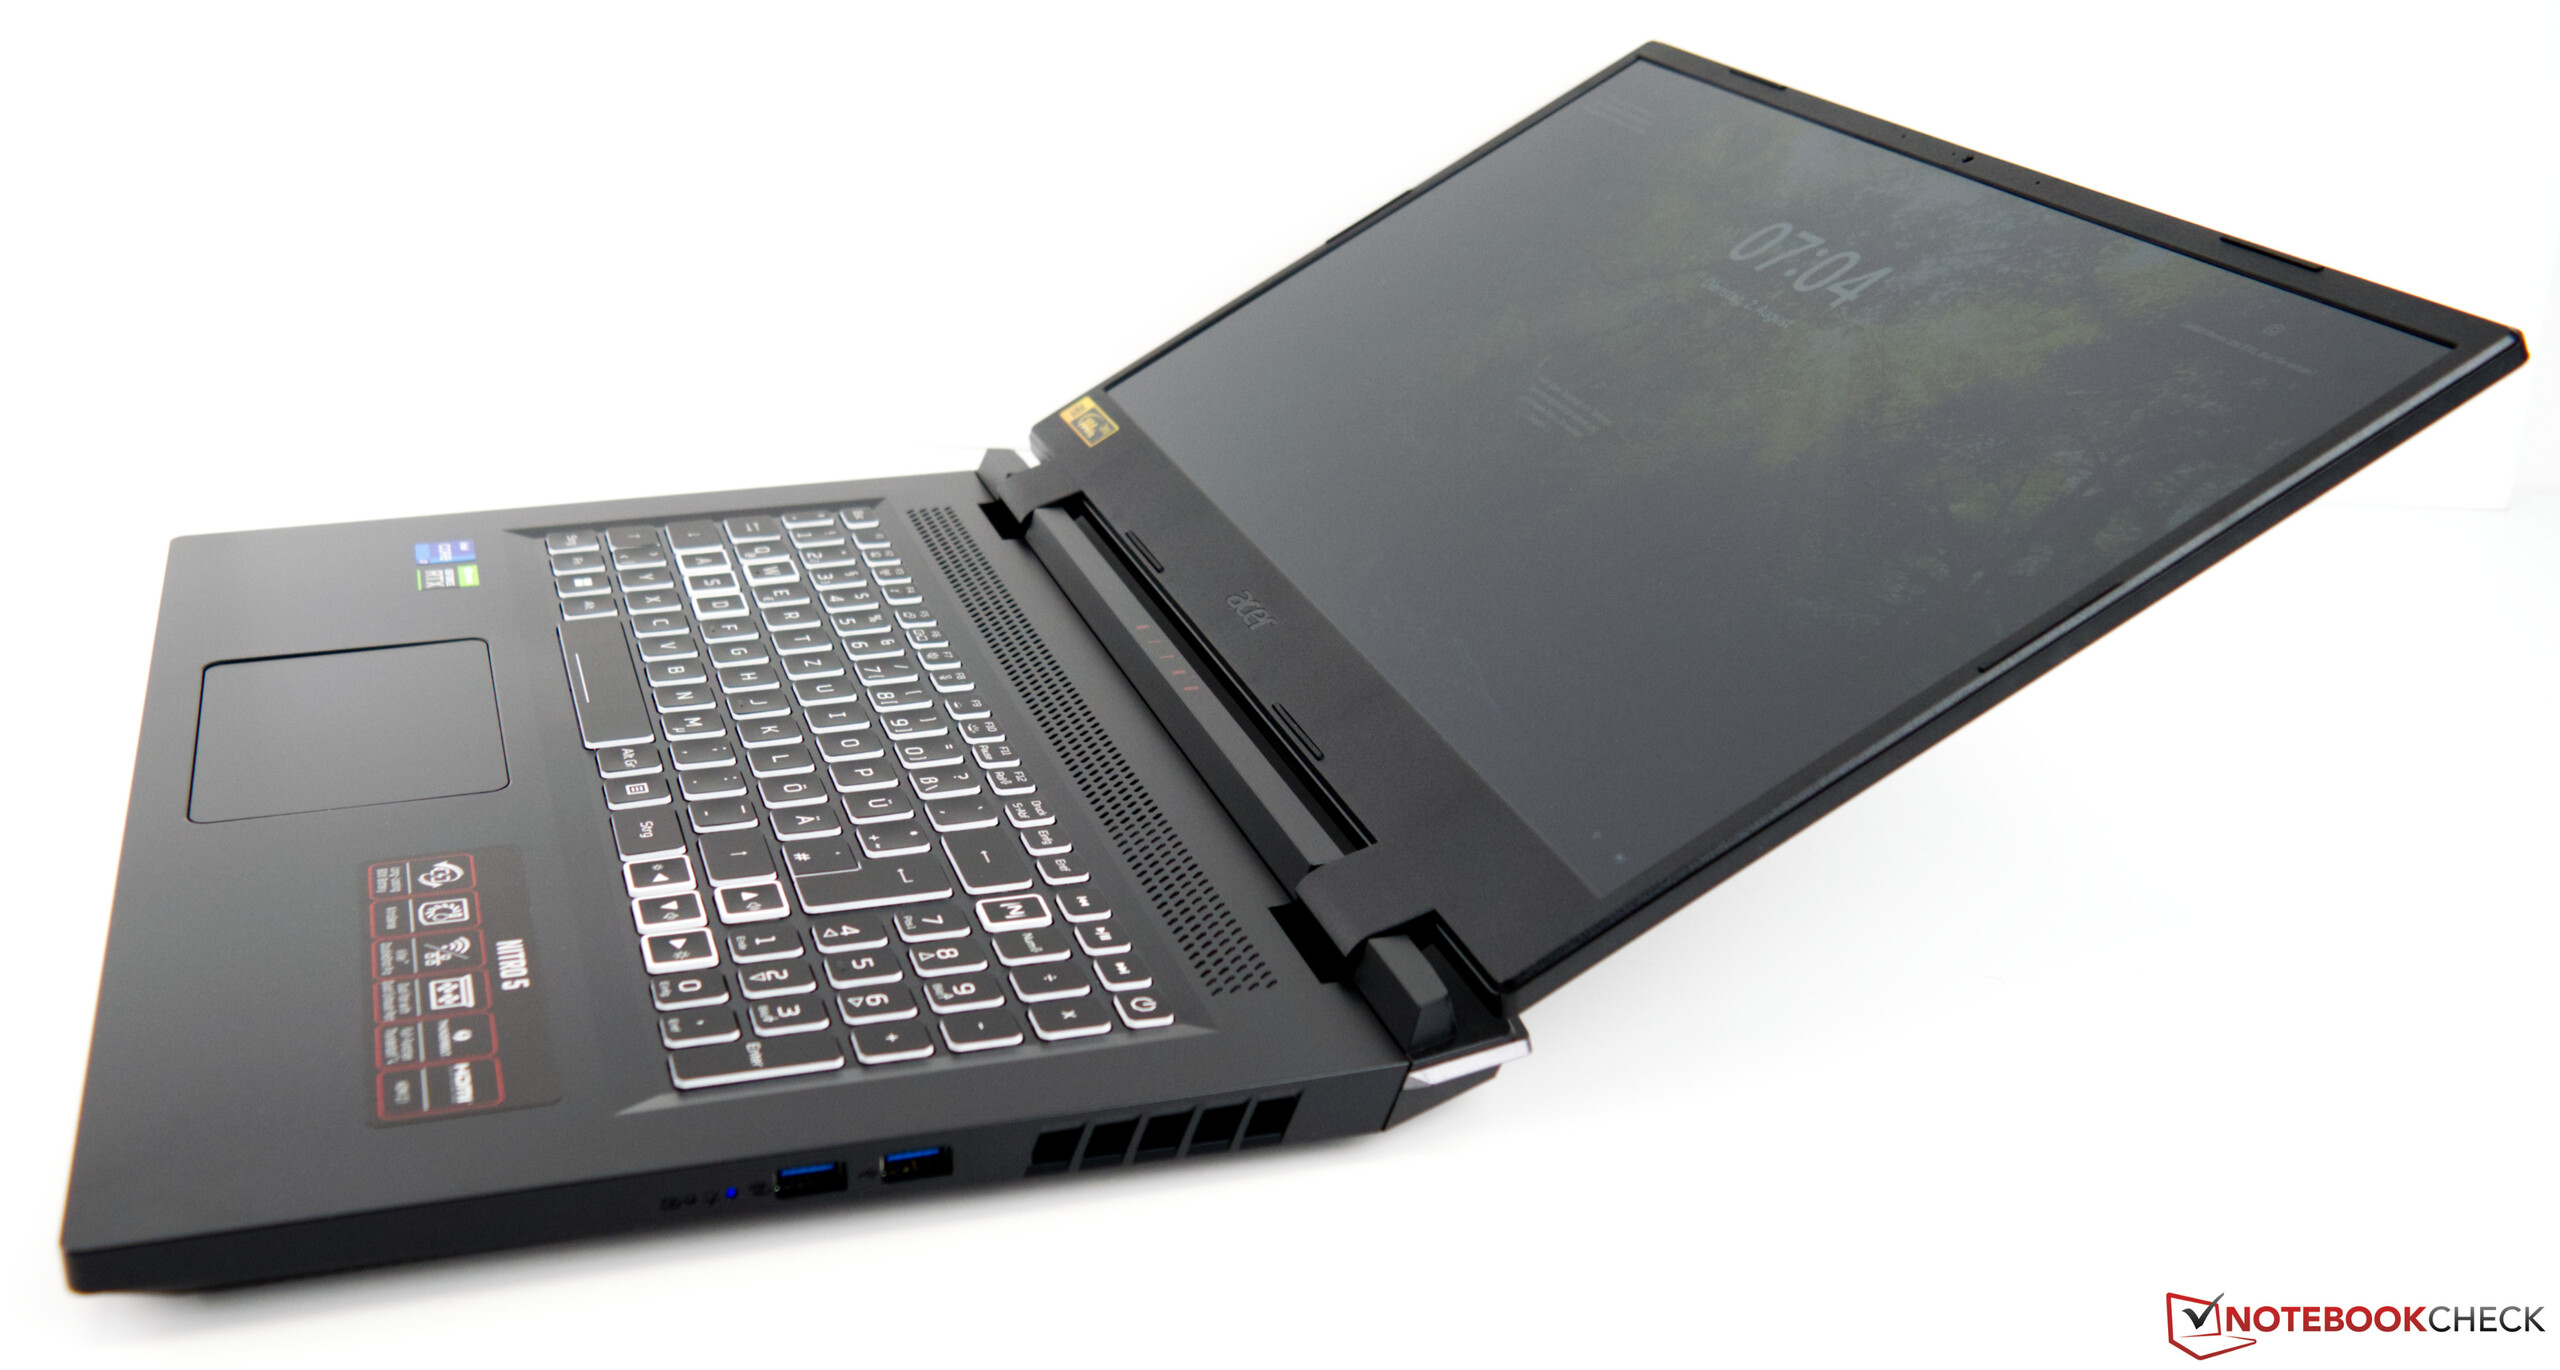
Estojo - Nada especial
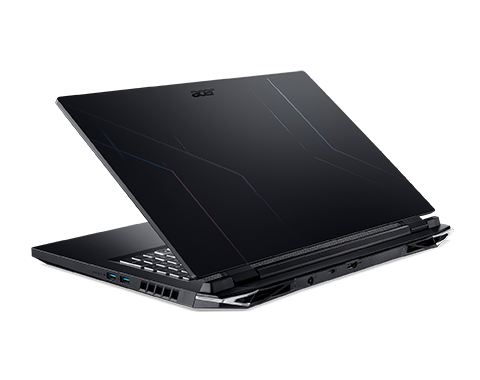
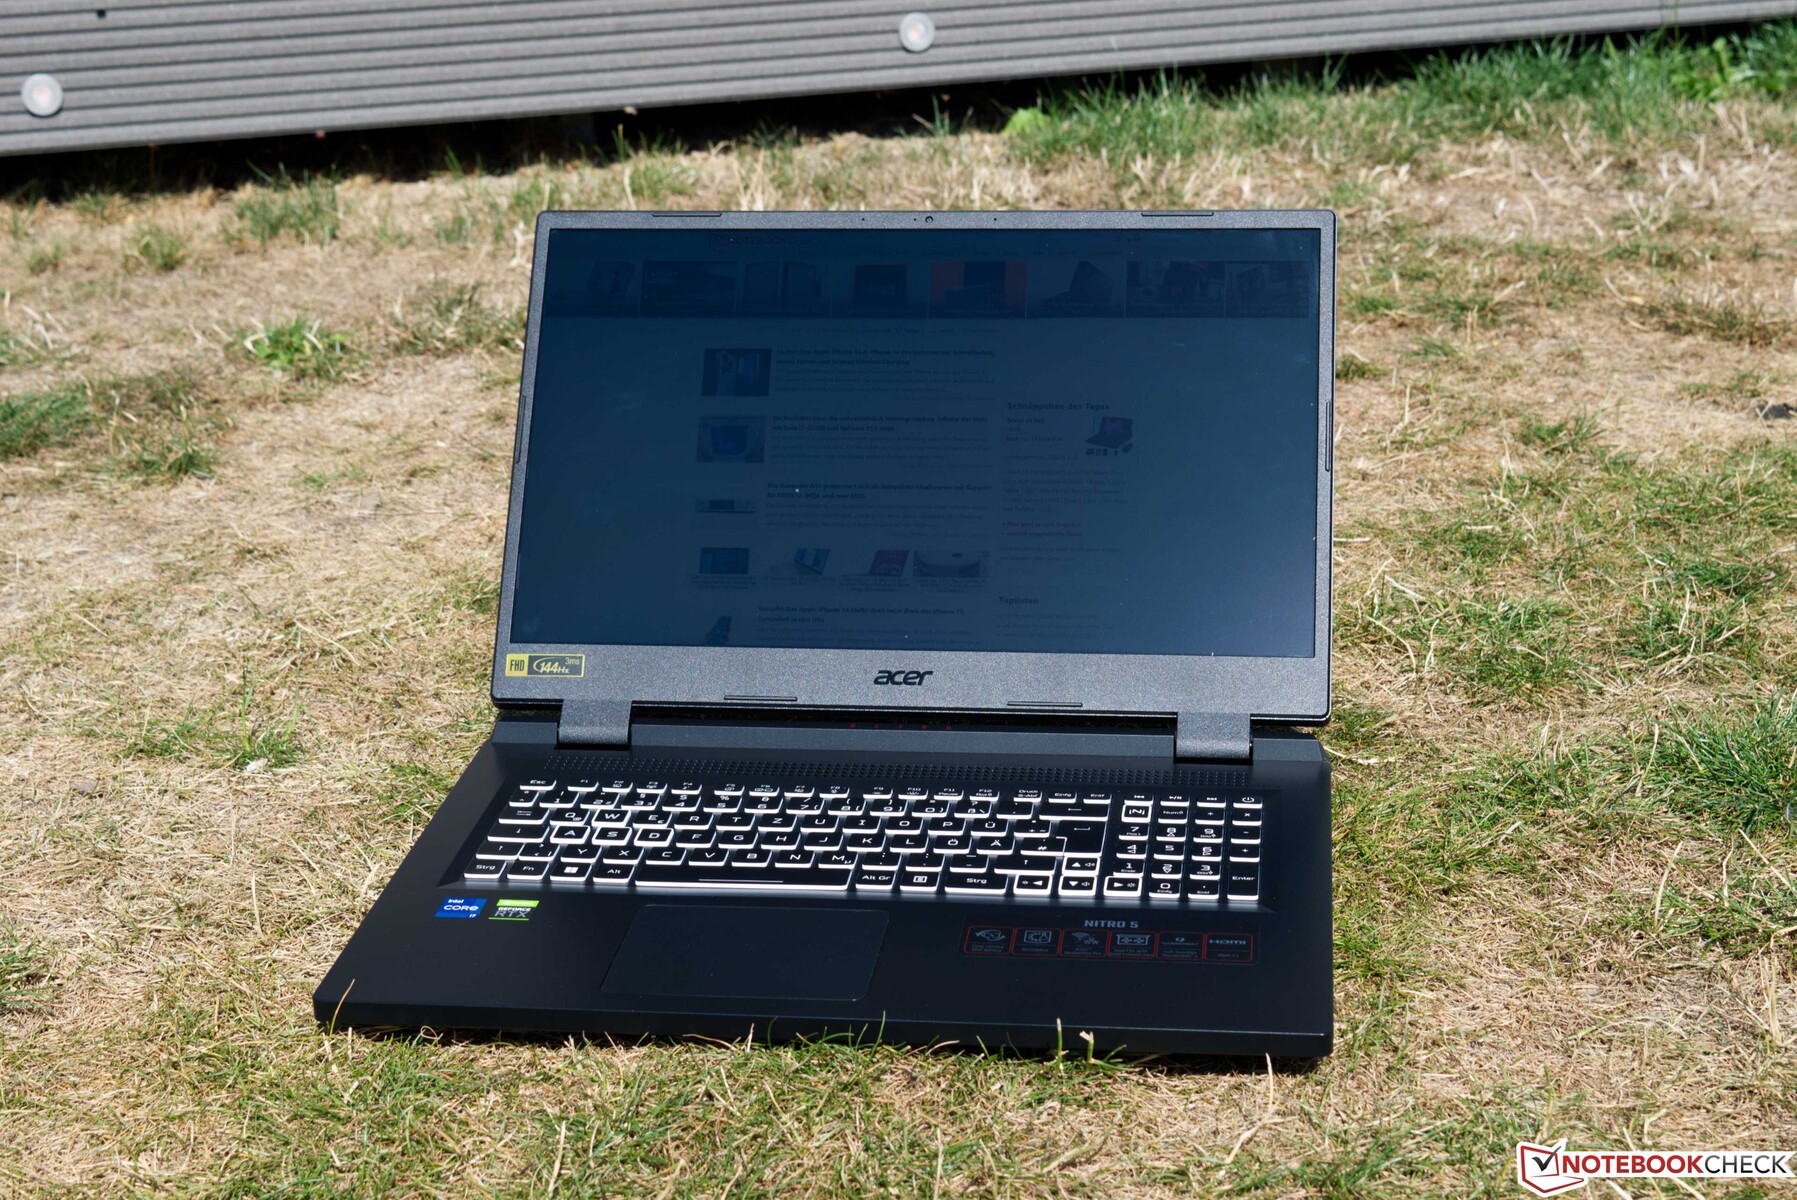
O Acer Nitro 5 AN517 é claramente reconhecível como um notebook para jogos, embora o fabricante não use RGB em absoluto. O dispositivo oferece apenas destaques visuais na tampa do visor na forma de acentos coloridos que soltam a seriedade da caixa completamente preta. Devido ao seu tamanho, a estabilidade da base é boa, mesmo que ela ceda sob pressão seletiva. A tampa do visor também poderia ter feito com um pouco mais de rigidez, mas outros notebooks de 17 polegadas também podem ser facilmente torcidos, o que se deve ao seu tamanho. Os impactos seletivos da força são bem absorvidos. O ângulo de abertura do visor não chega a 180°, mas isto não é motivo de reclamação. As duas dobradiças funcionam suavemente, portanto, a abertura com uma só mão não é um problema. No entanto, não é possível evitar a formação de teetering em quantidades relativamente grandes.
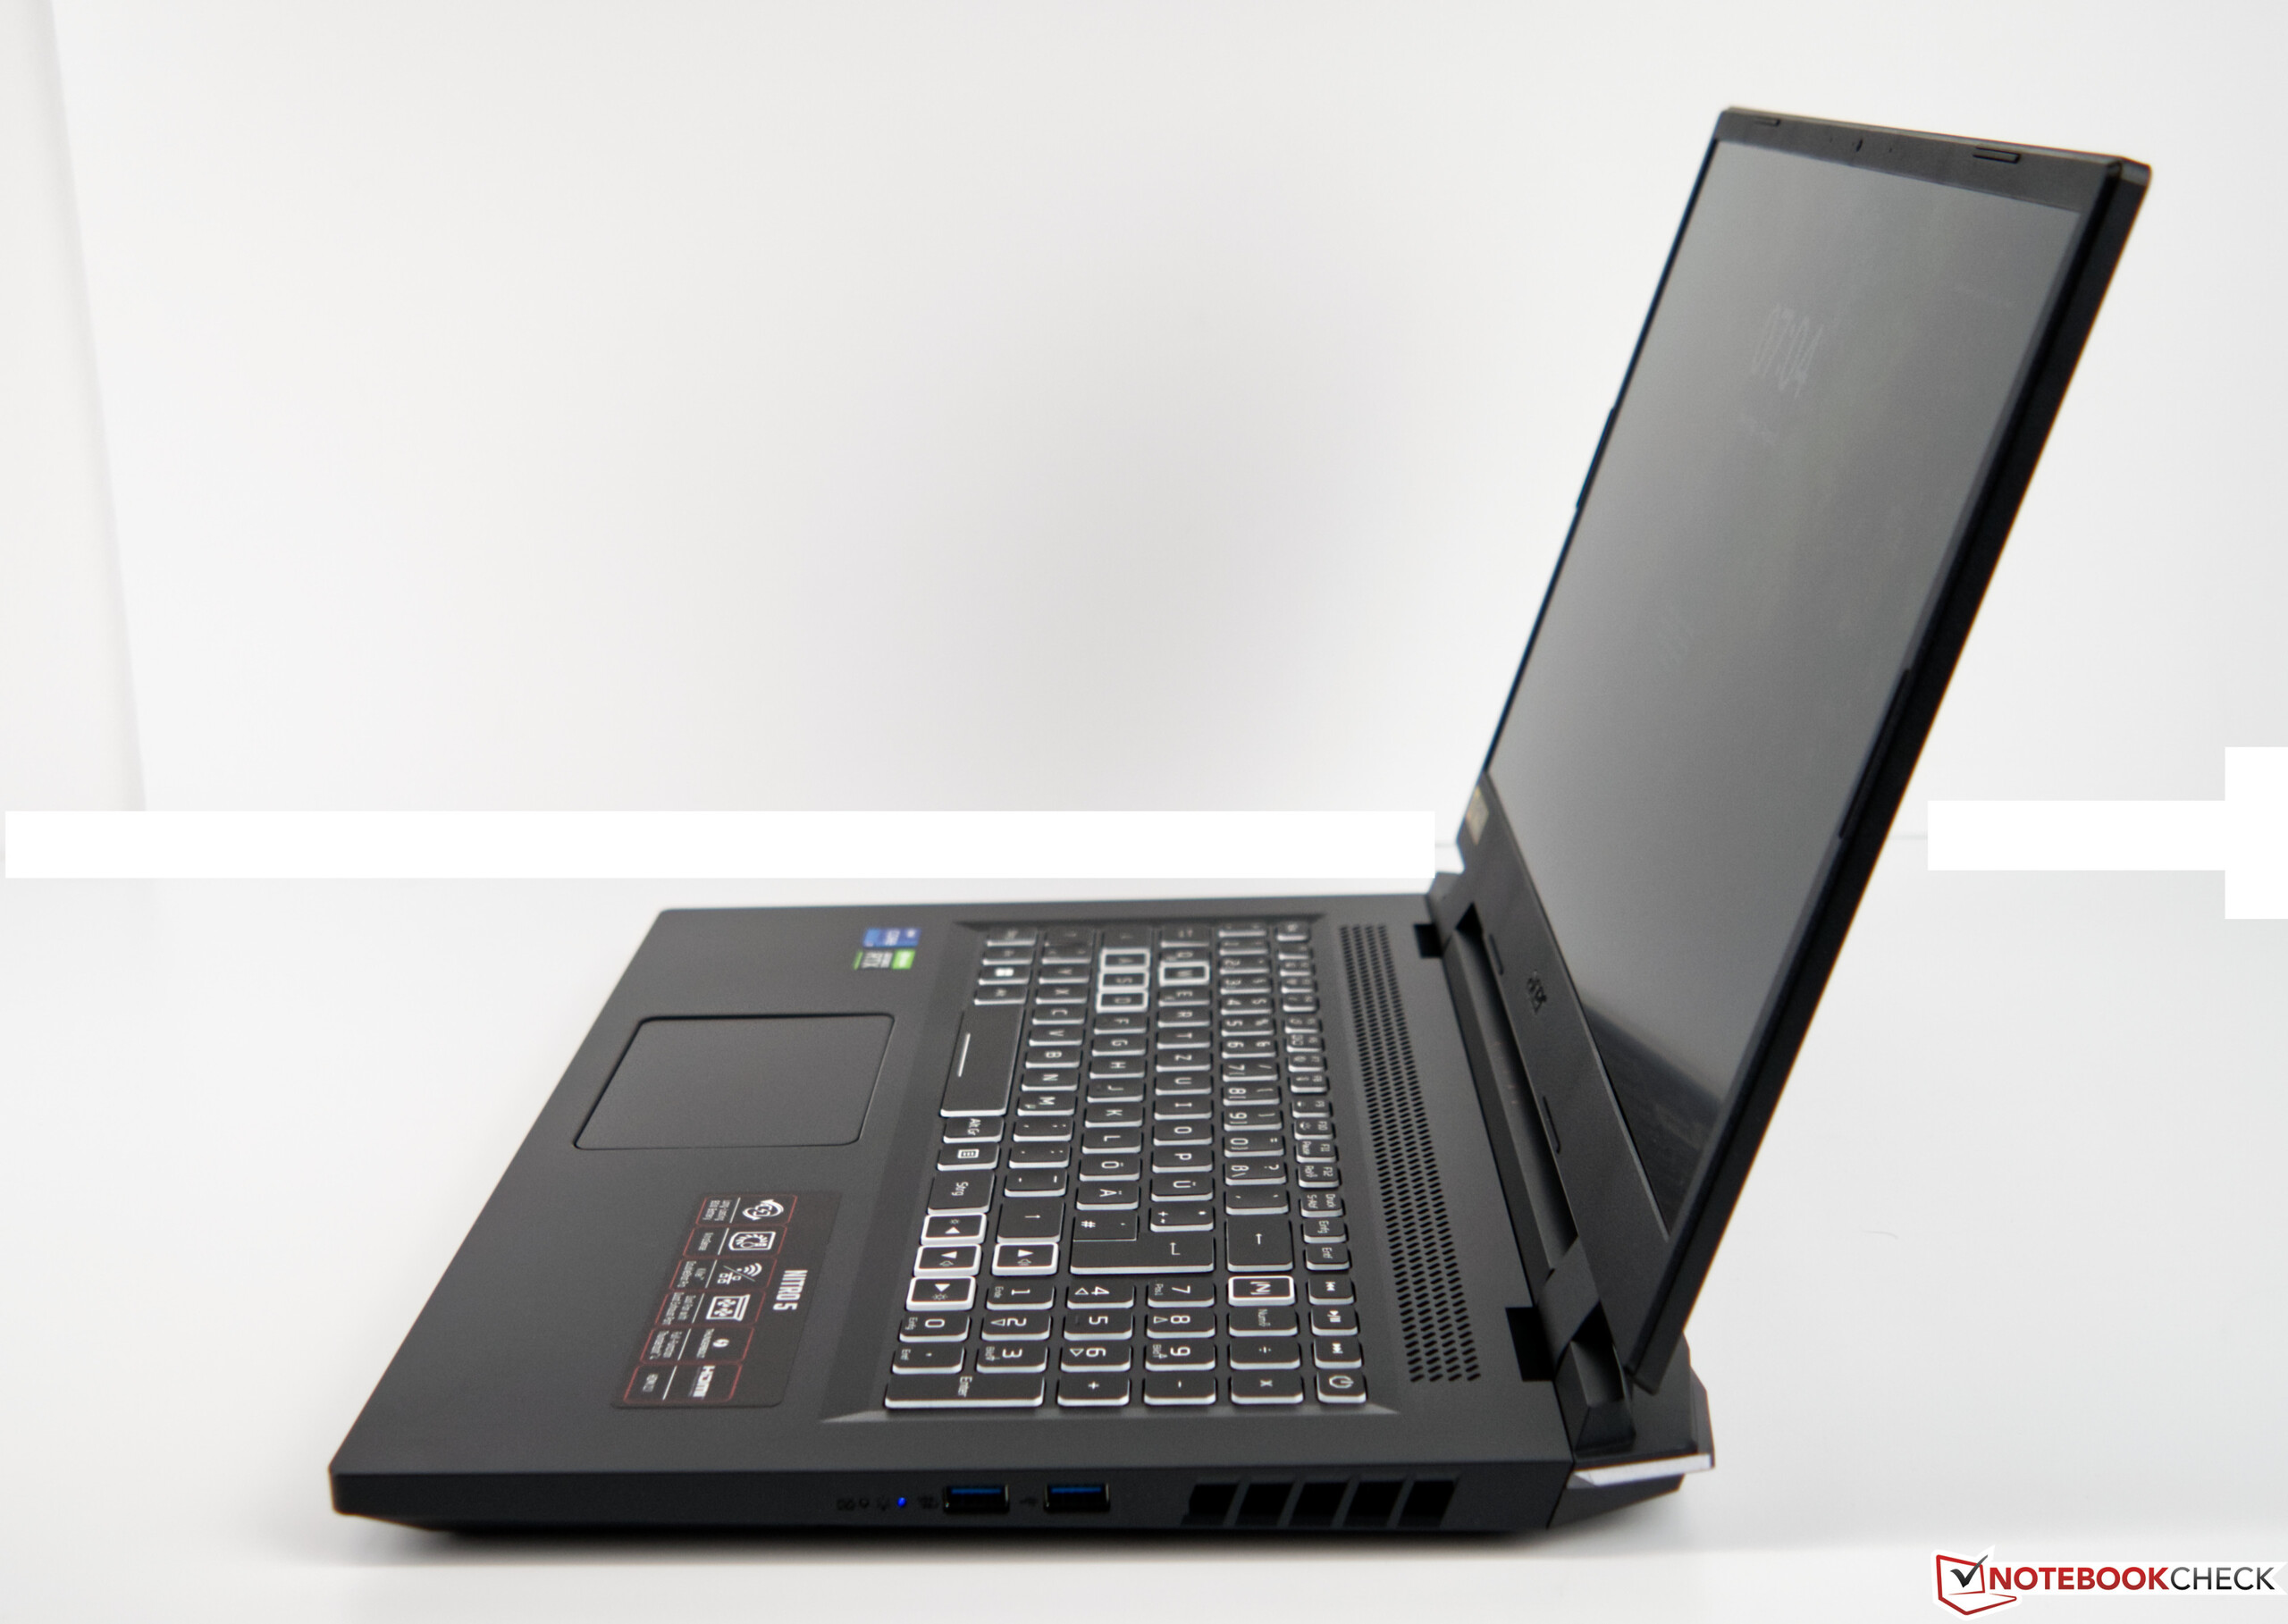
Comparação de tamanhos
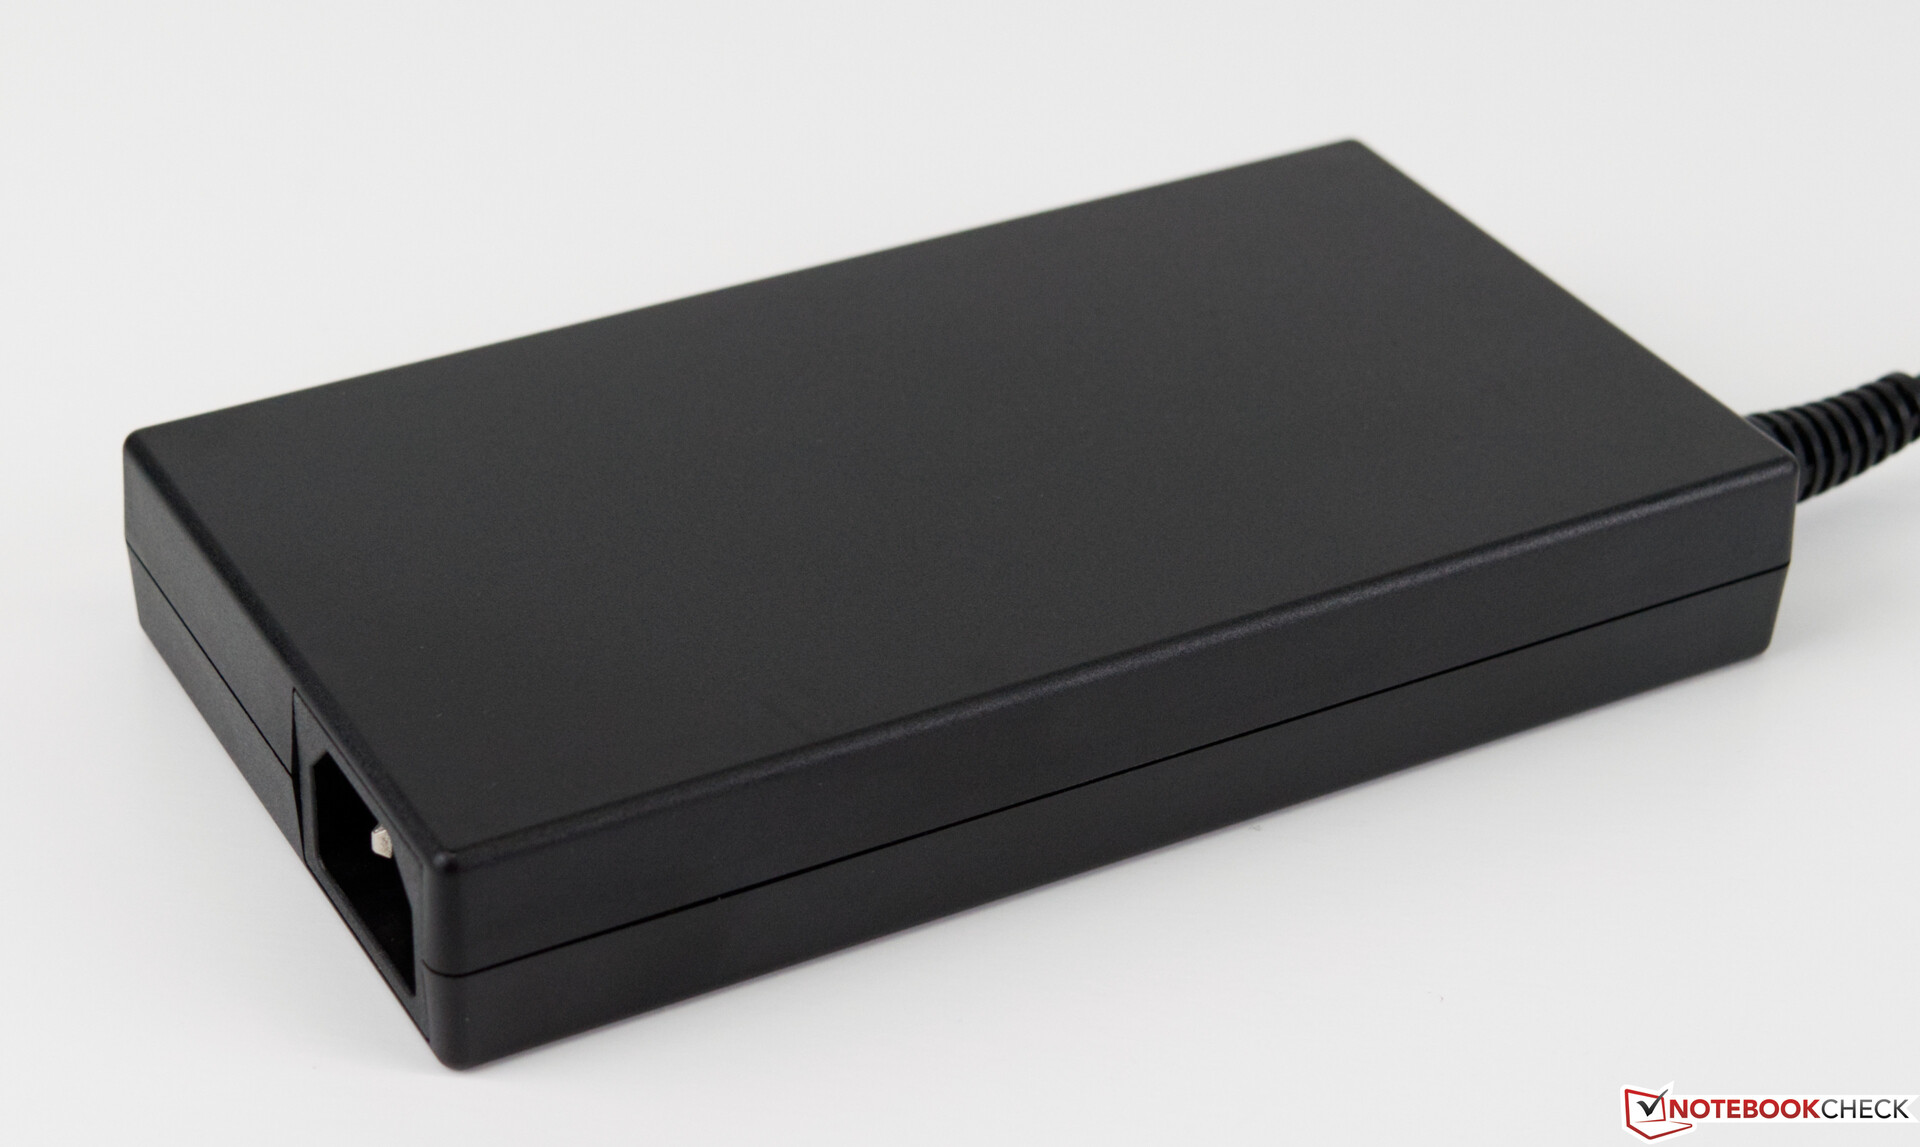
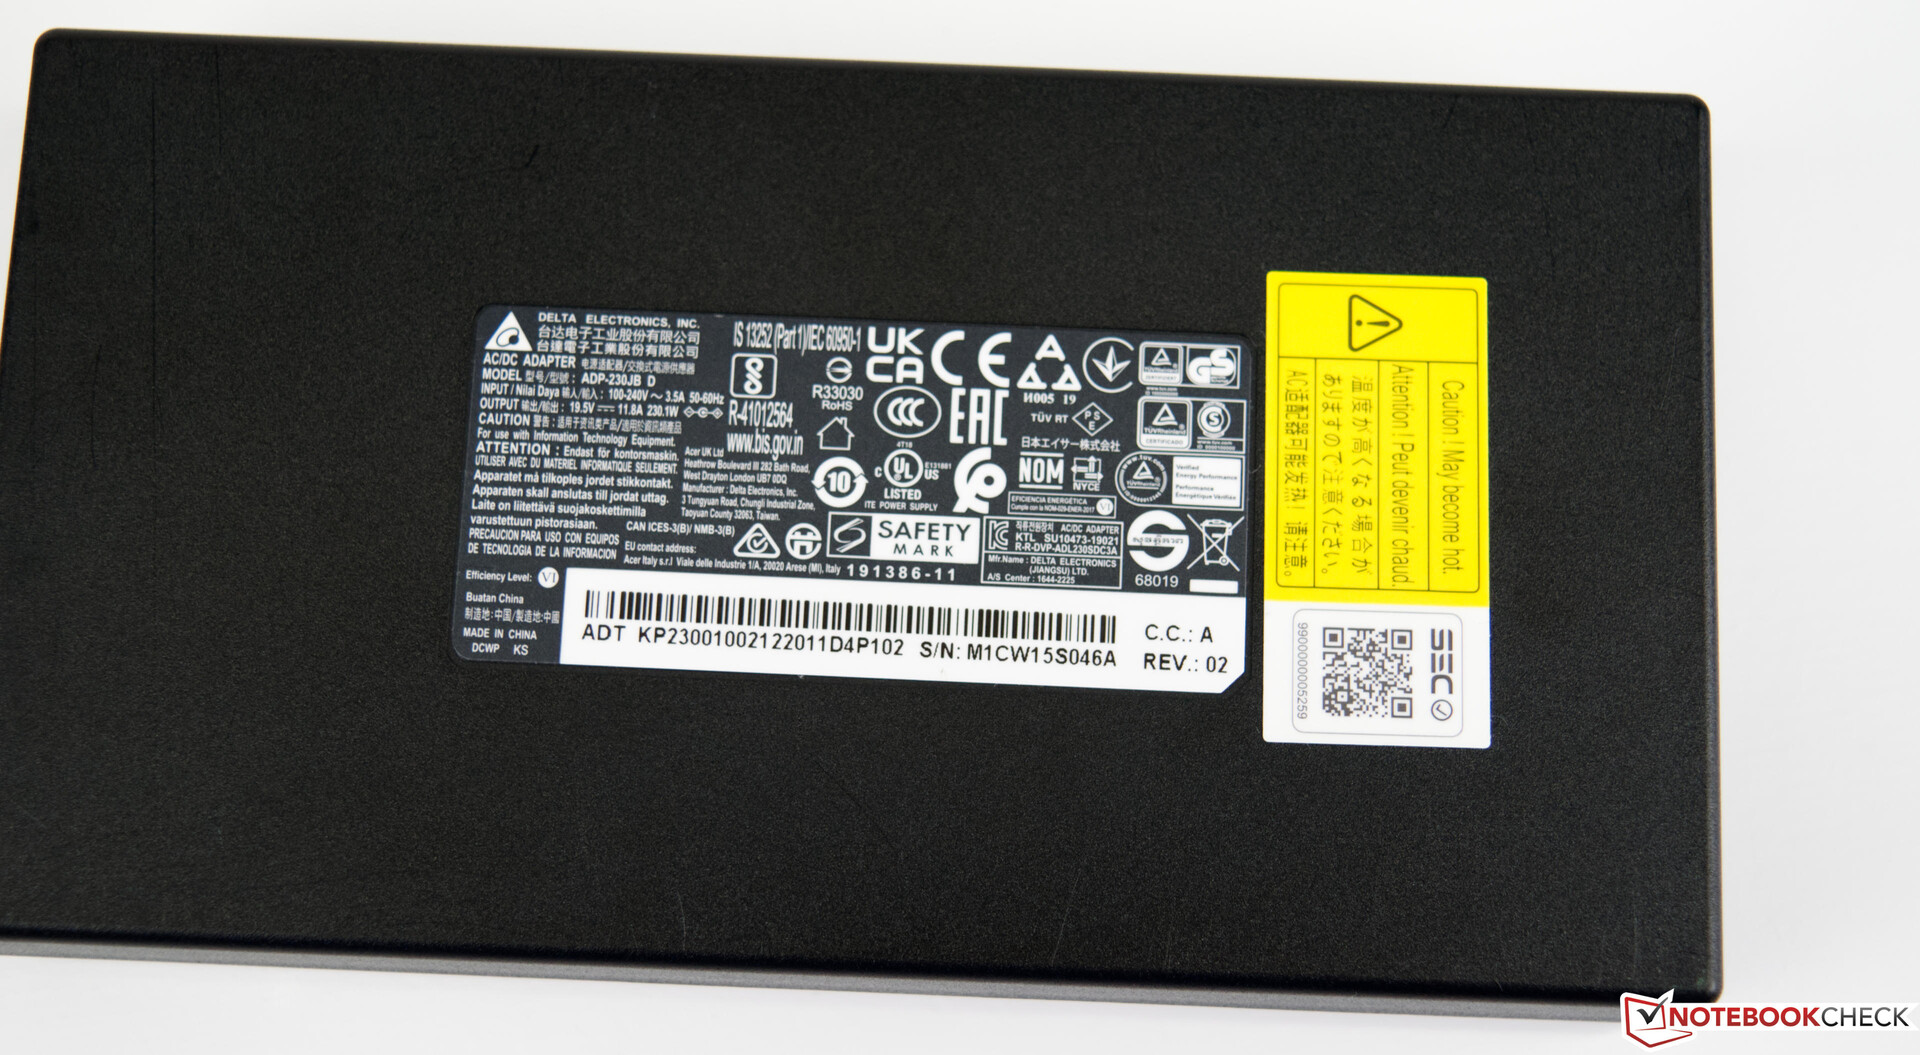
Com 3,1 quilos, o Acer Nitro 5 AN517 pertence aos representantes mais pesados de sua classe. No entanto, o peso é aceitável para um equipamento de 17 polegadas. Seu tamanho não é muito compacto devido à base volumosa e está em um nível semelhante ao da Lenovo Legion 5 17. A fonte de alimentação plana, mas forte, de 230 watts acrescenta mais 800 gramas às balanças.
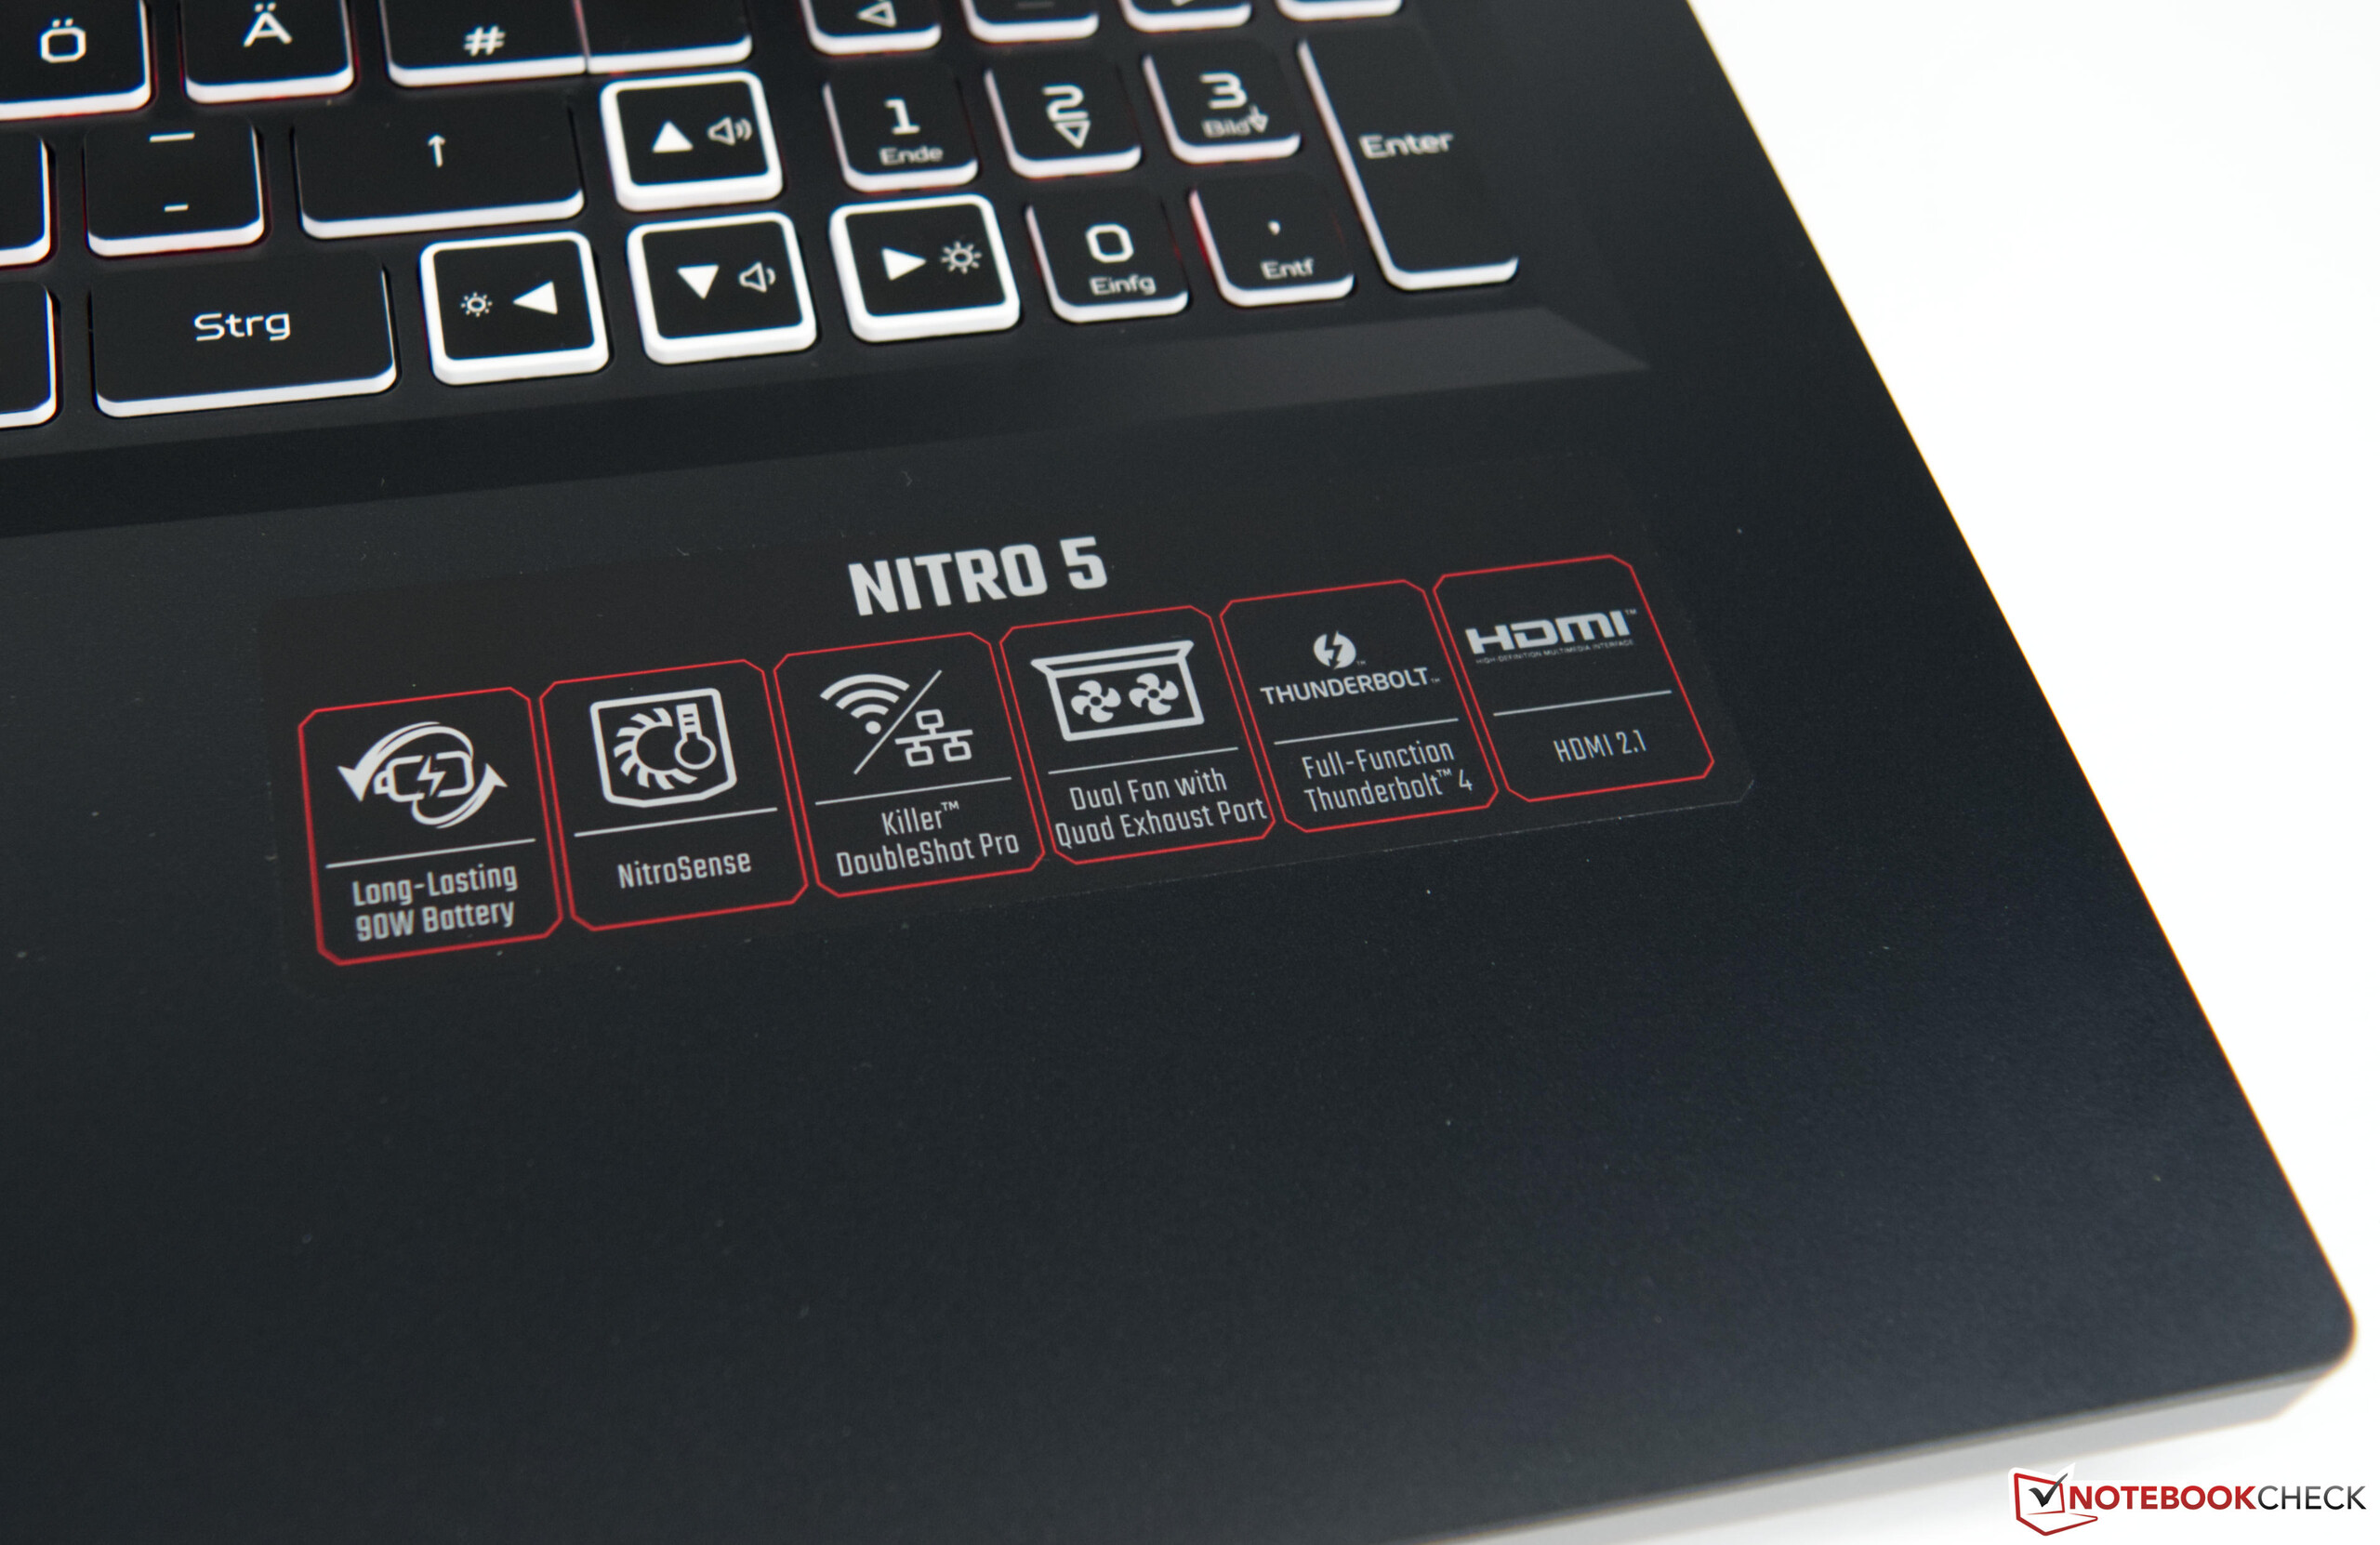
Equipamento - Cai um pouco curto
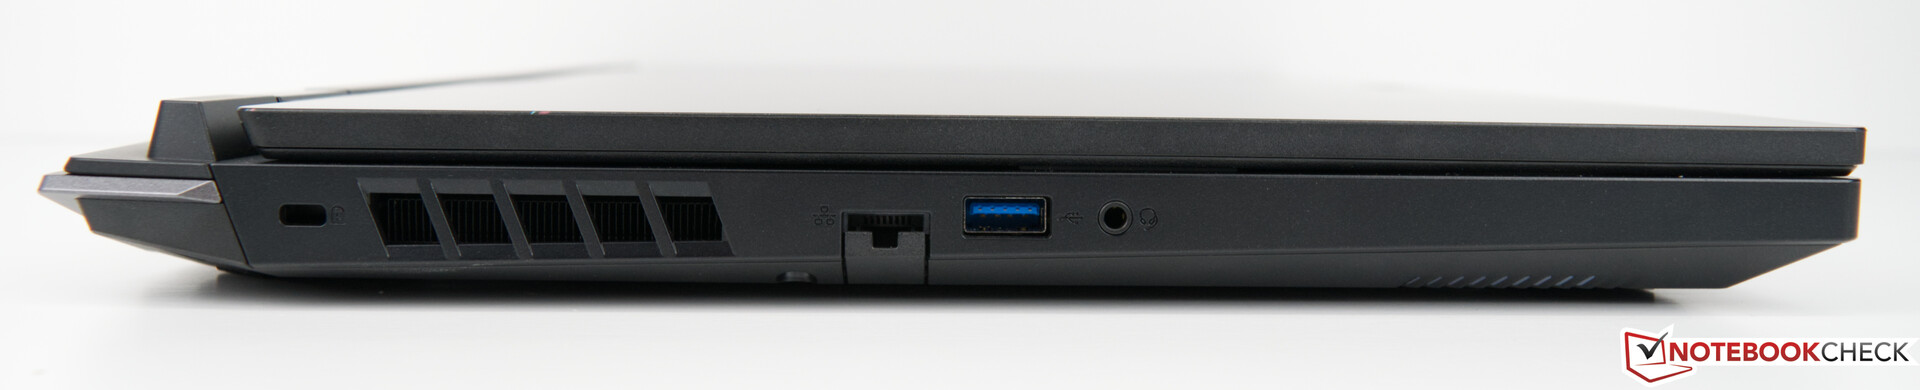
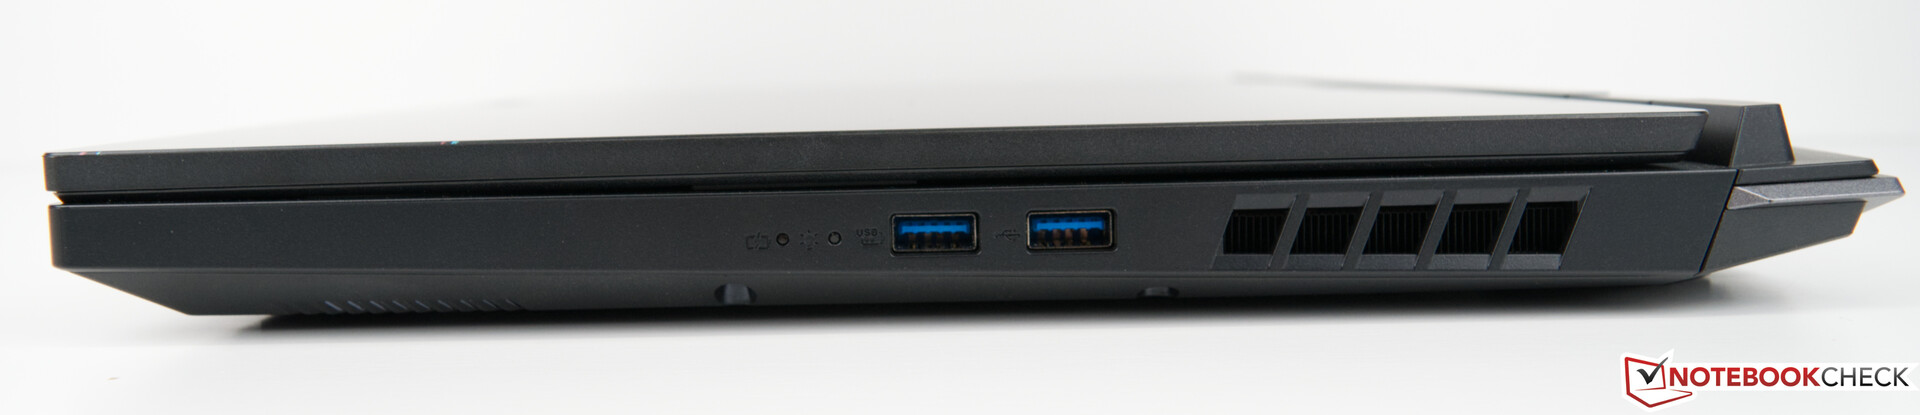
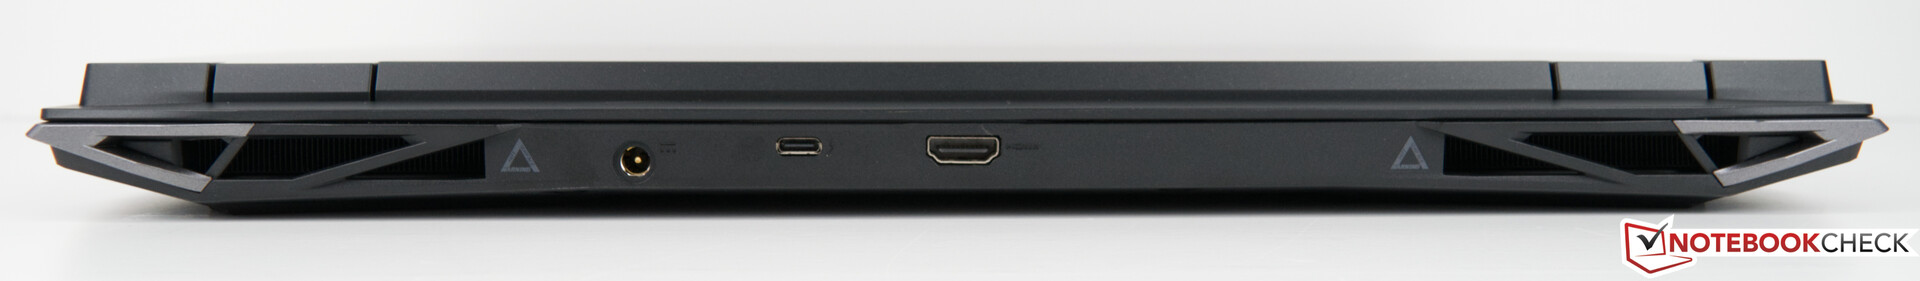
O Acer Nitro 5 AN517 oferece uma boa variedade de portas externas padrão, incluindo Thunderbolt 4. Entretanto, o fato de haver apenas 3x USB Tipo A, que é apenas a média para um dispositivo de 17 polegadas, deve ser visto criticamente. Certamente, teria havido espaço suficiente para mais portas. Um leitor de cartões SD também está faltando. Embora a distribuição das portas seja boa, isto não é recomendável, dado o número de portas e o espaço disponível.
Comunicação
O Acer Nitro 5 AN517 é equipado com um módulo Wi-Fi 6 AX1650i WLAN. Em testes, nossa amostra de revisão alcançou boas taxas de transferência tanto no envio quanto no recebimento de dados. O Acer Nitro 5 AN517 está, portanto, em igualdade com oSchenker XMG Core 17que oferece tarifas quase idênticas. Como alternativa, você também pode usar a conexão LAN GBit. Ambas as conexões de rede funcionaram sem falhas durante os testes.
Webcam
Quase nenhum laptop para jogos oferece boa qualidade de webcam. Isto também se aplica ao Acer Nitro 5 AN517, embora ele tenha os menores desvios Delta-E em comparação. No entanto, a nitidez da imagem é tão ruim quanto a dos dispositivos de comparação.


Acessórios
Além do notebook, os compradores recebem um adaptador de energia pesado de 230 watts de quase 800 g, bem como alguns folhetos informativos.
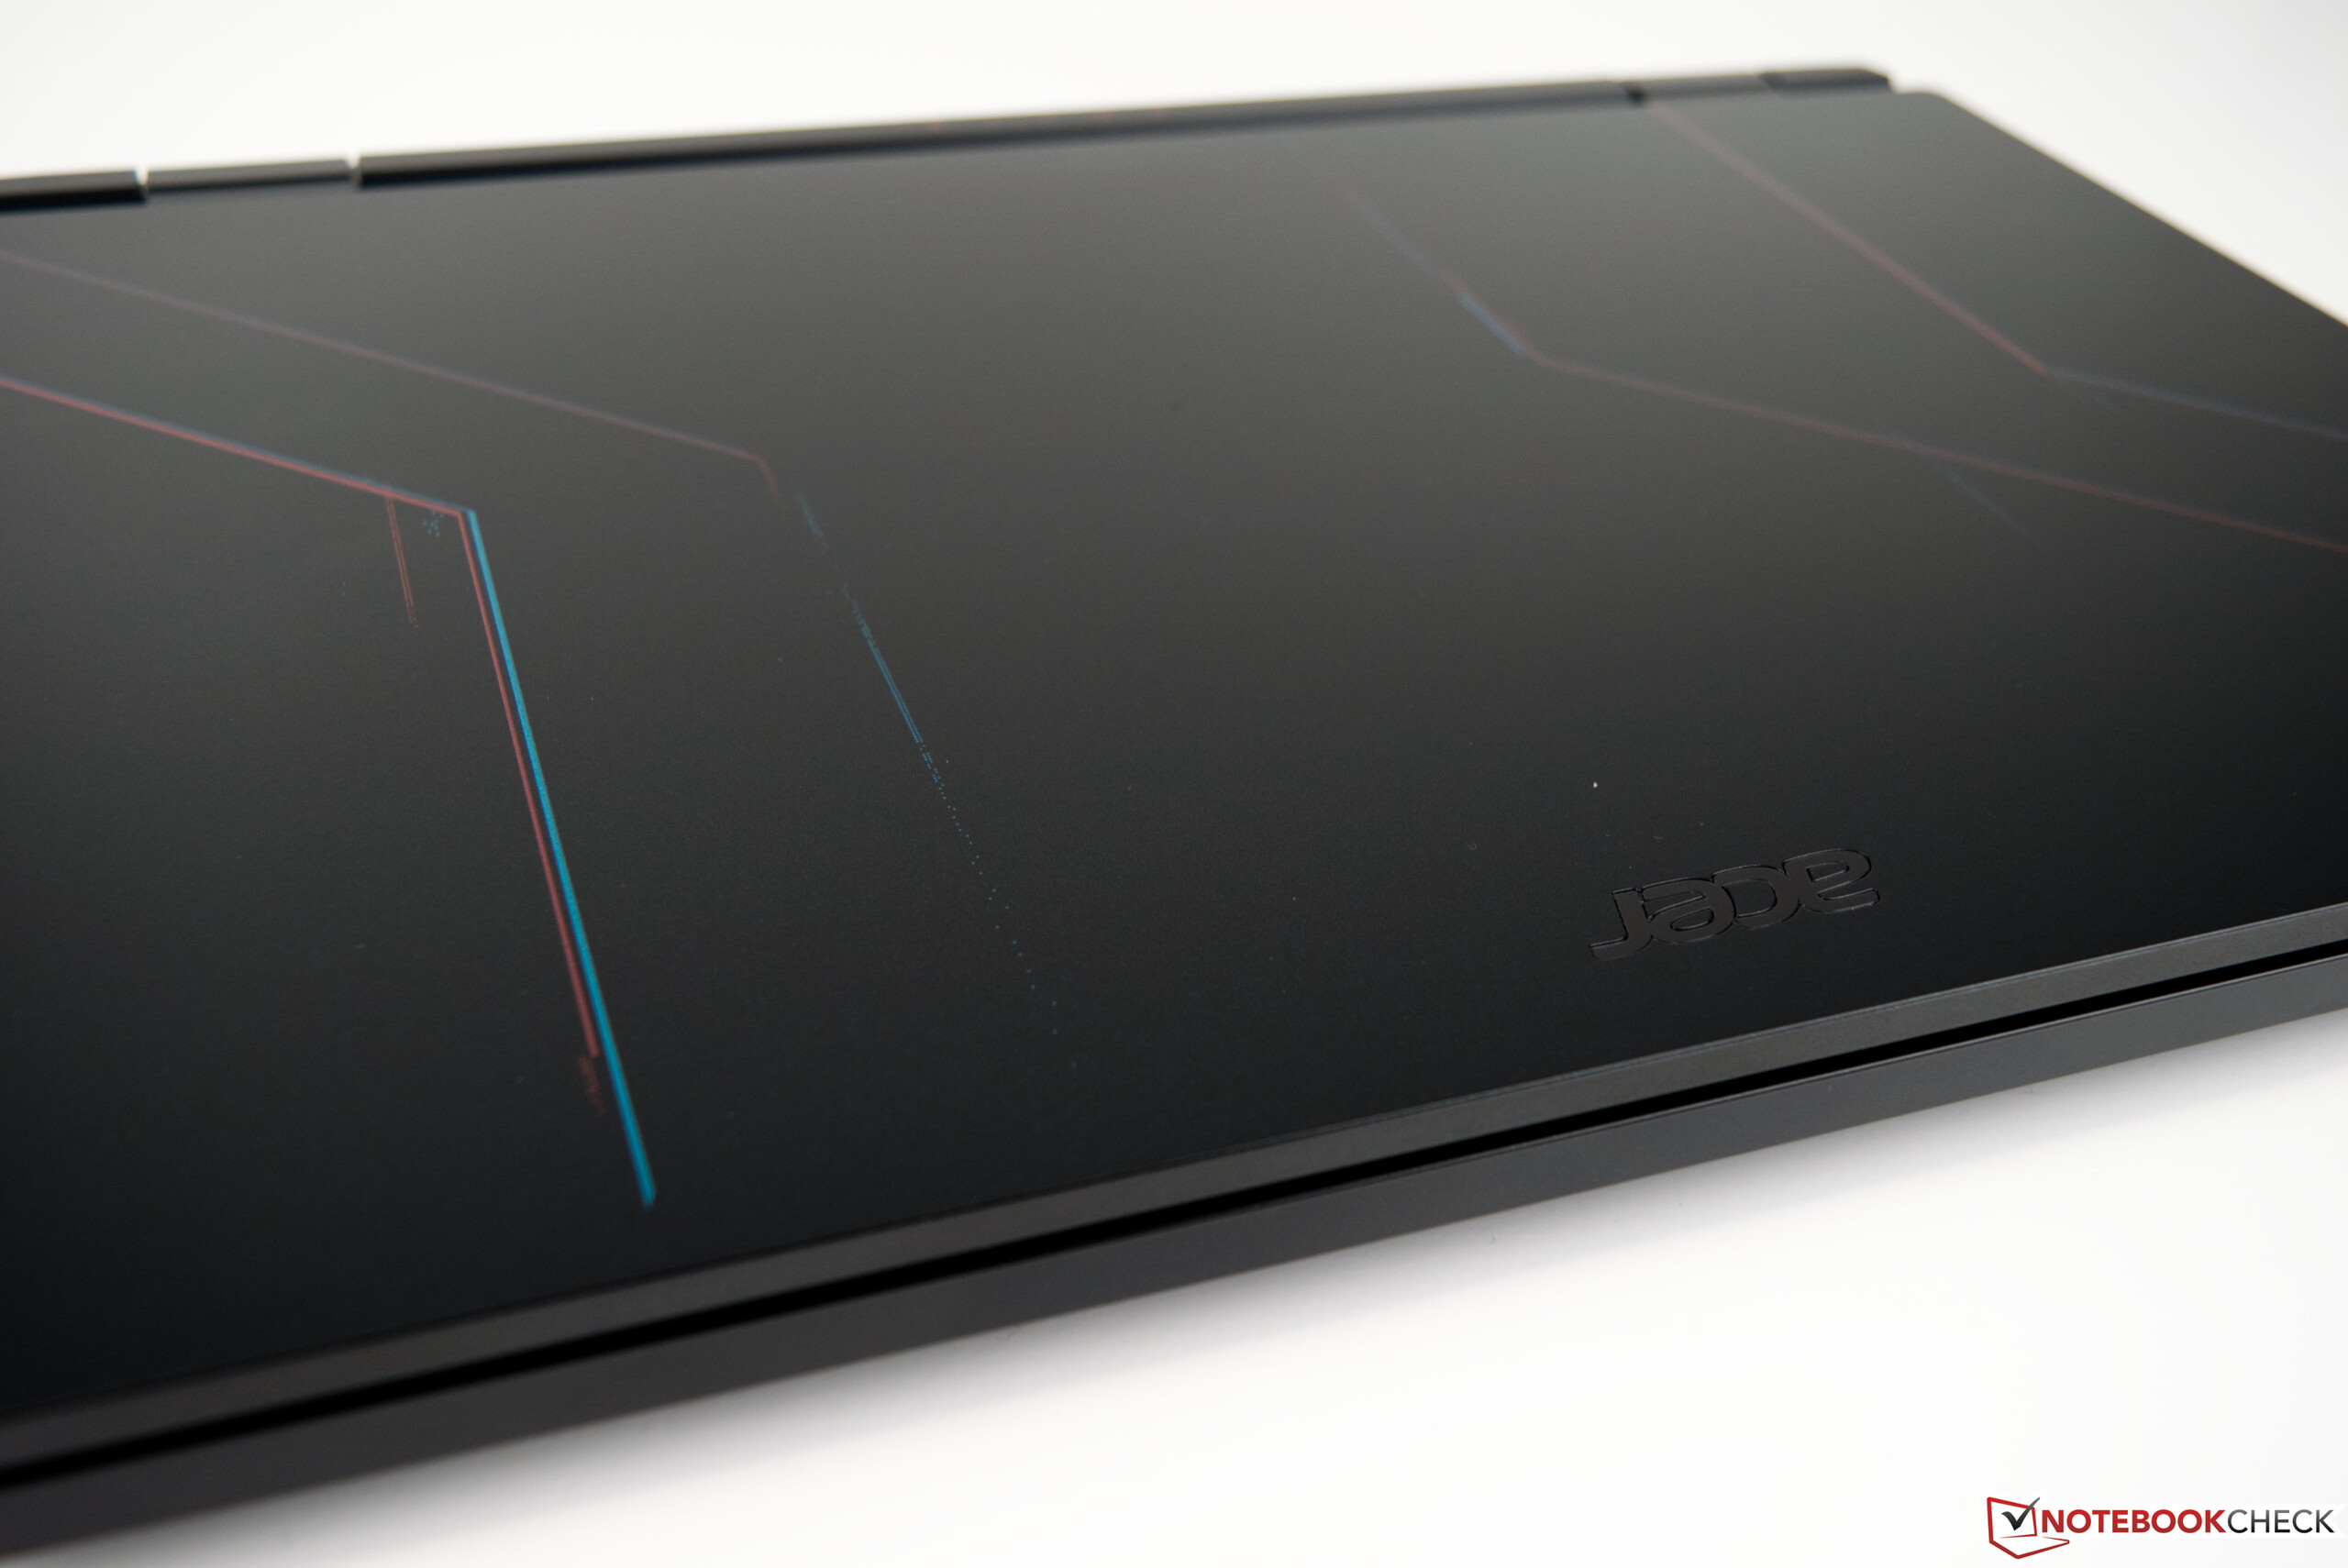
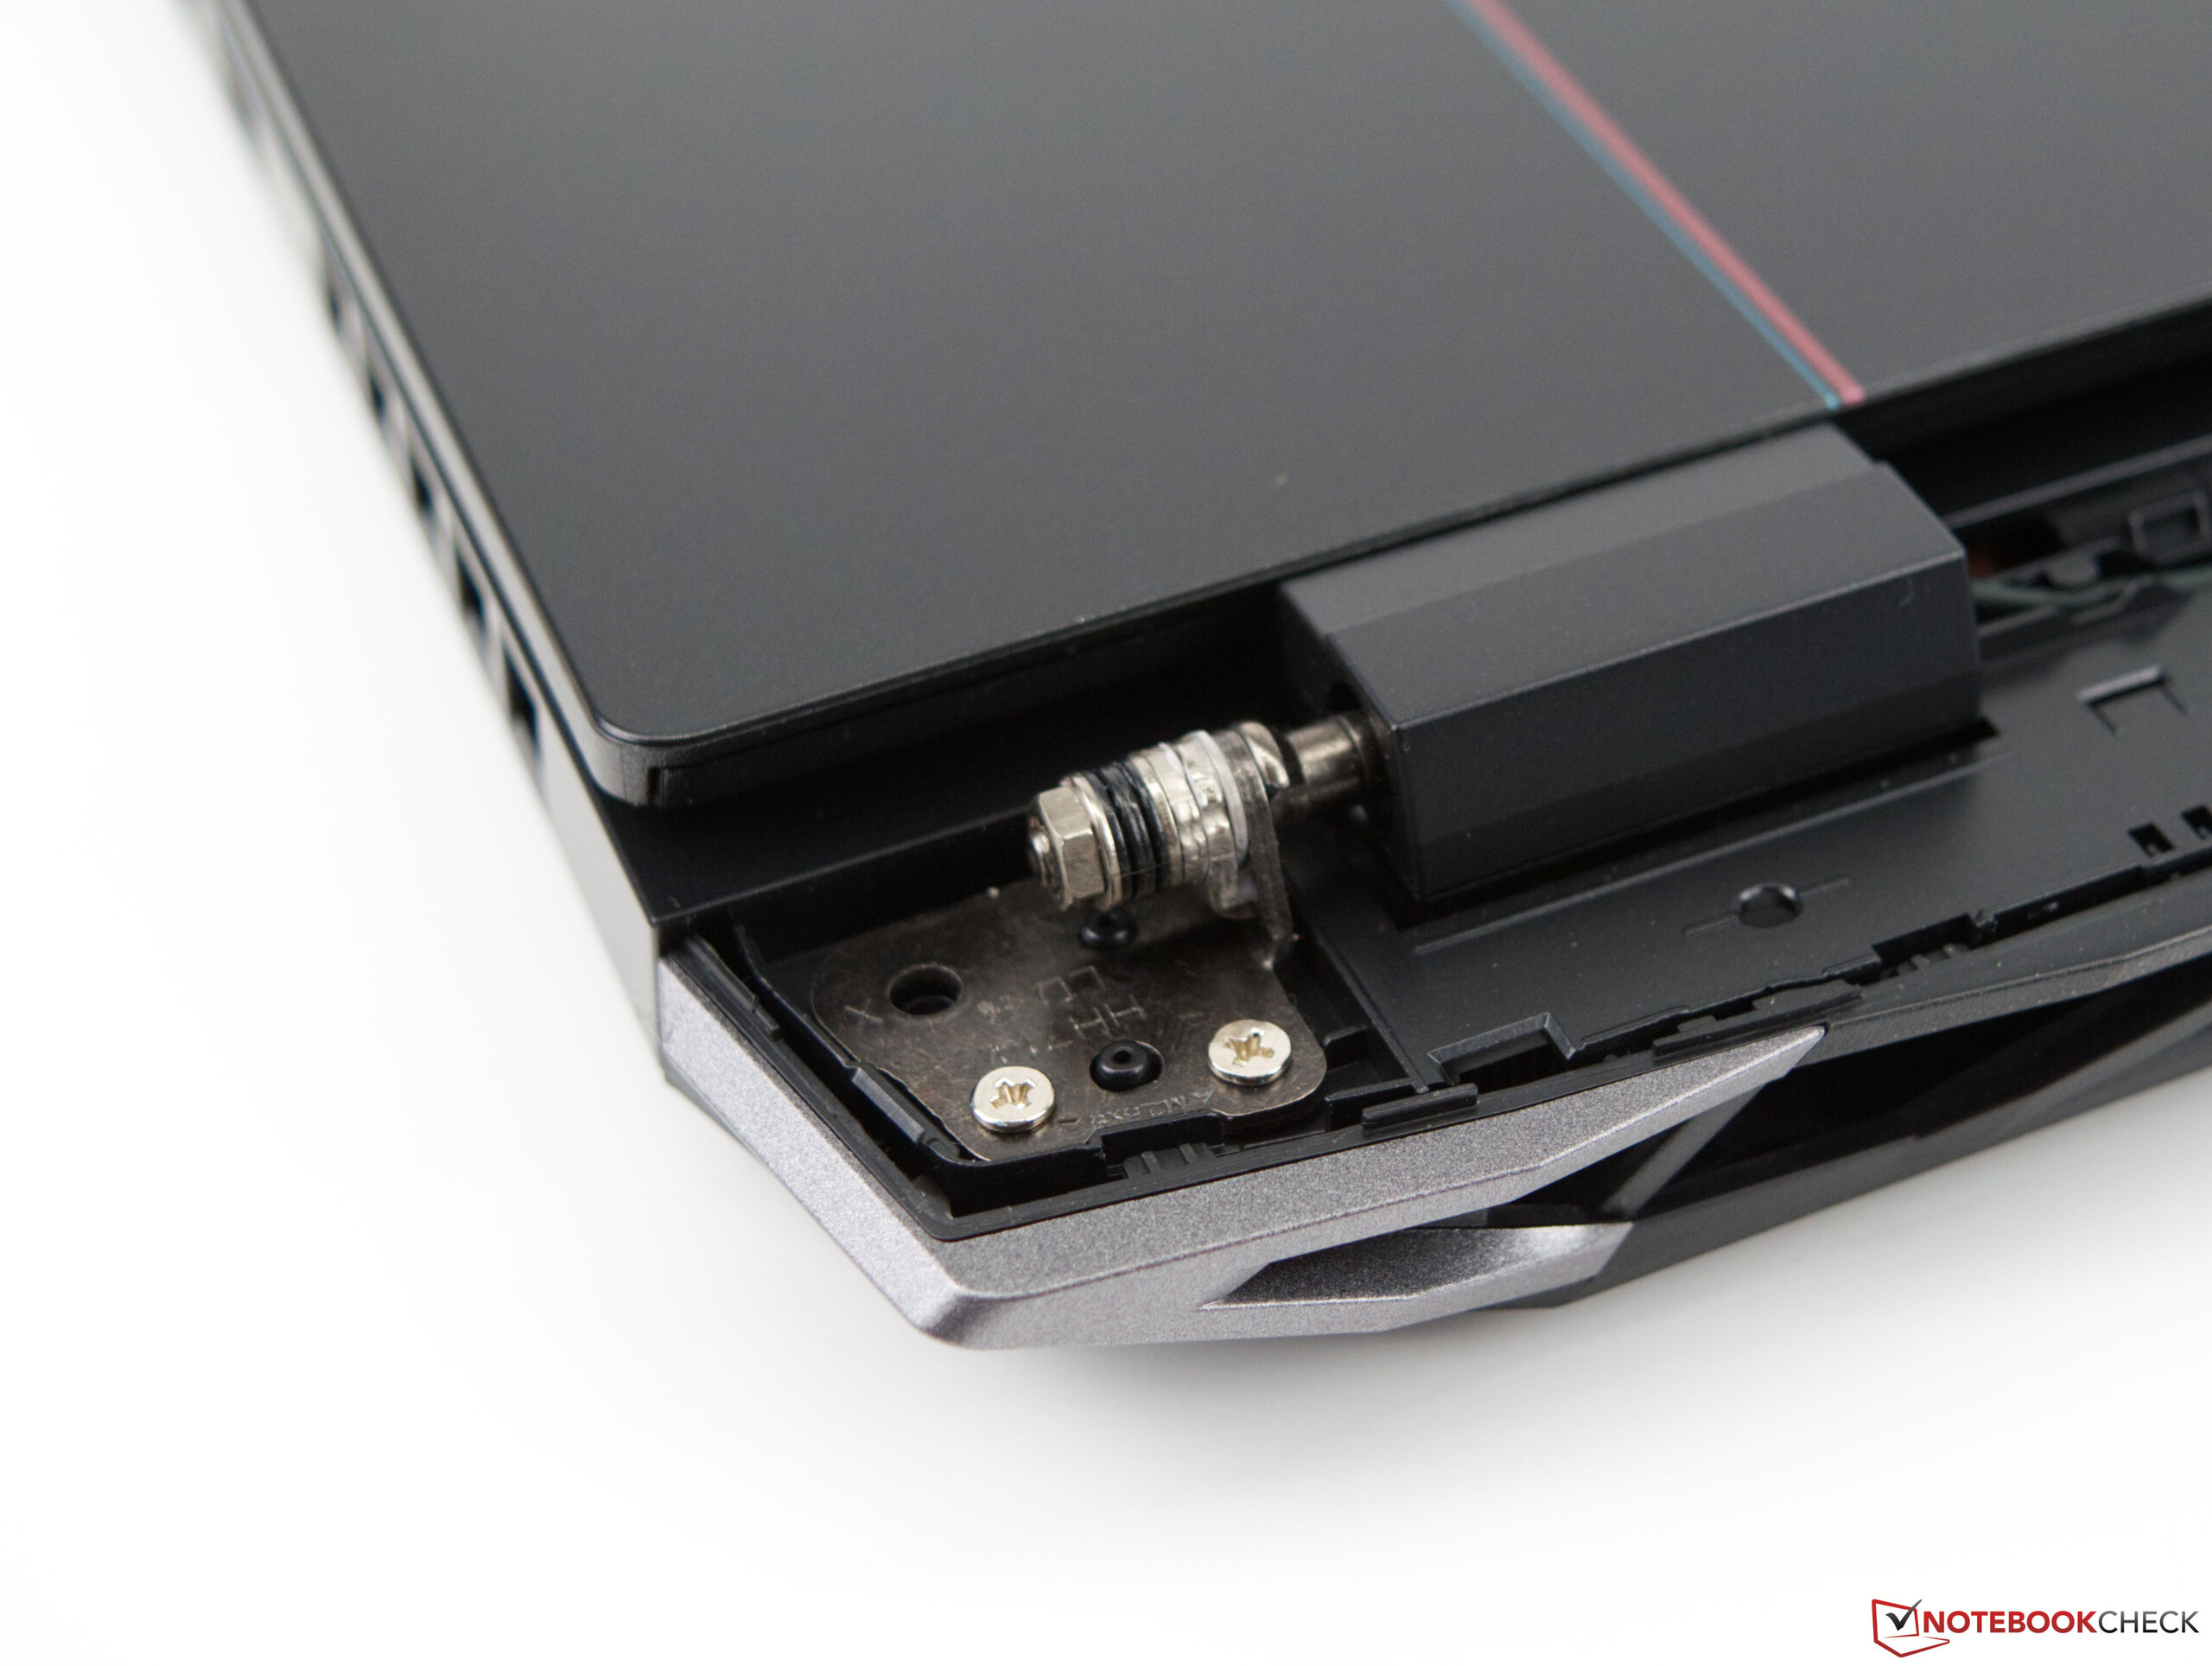
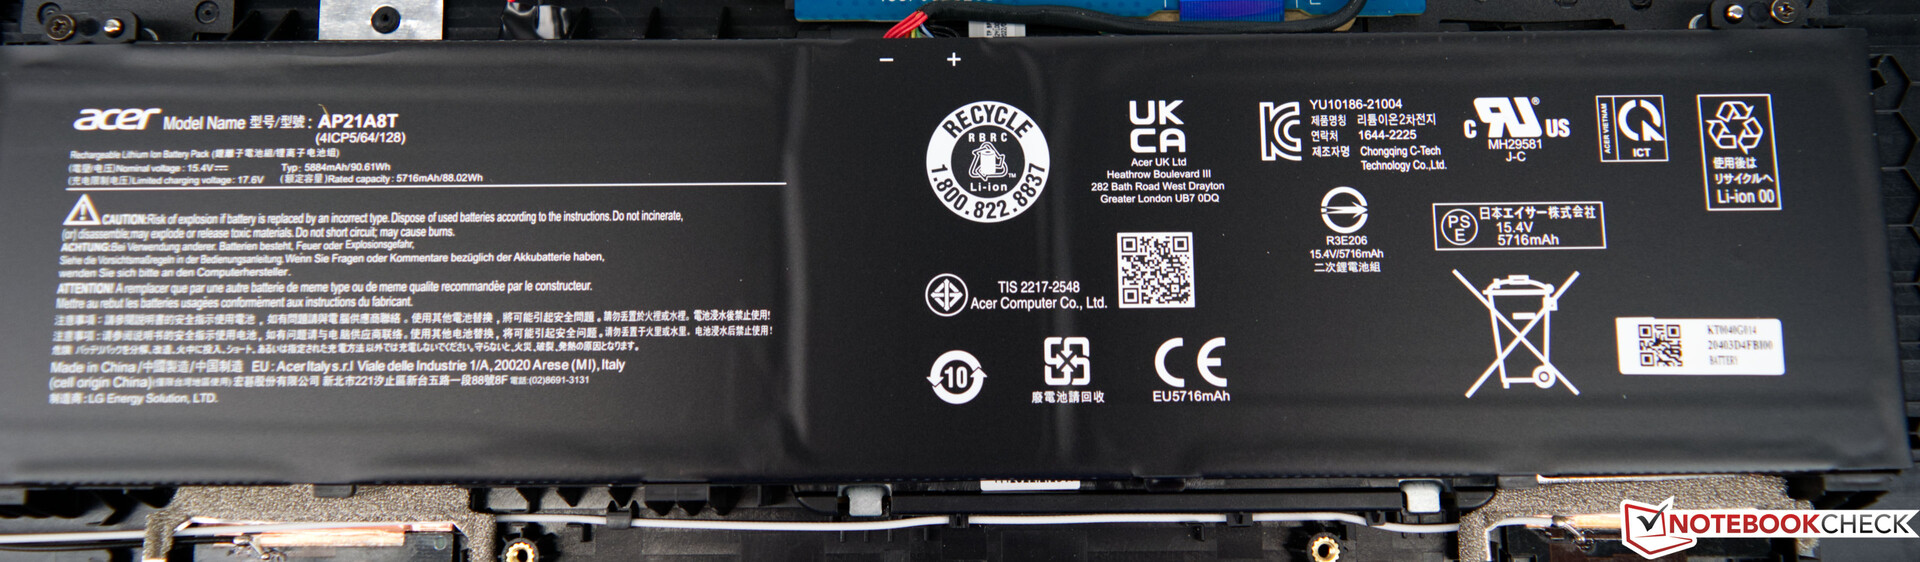
Manutenção
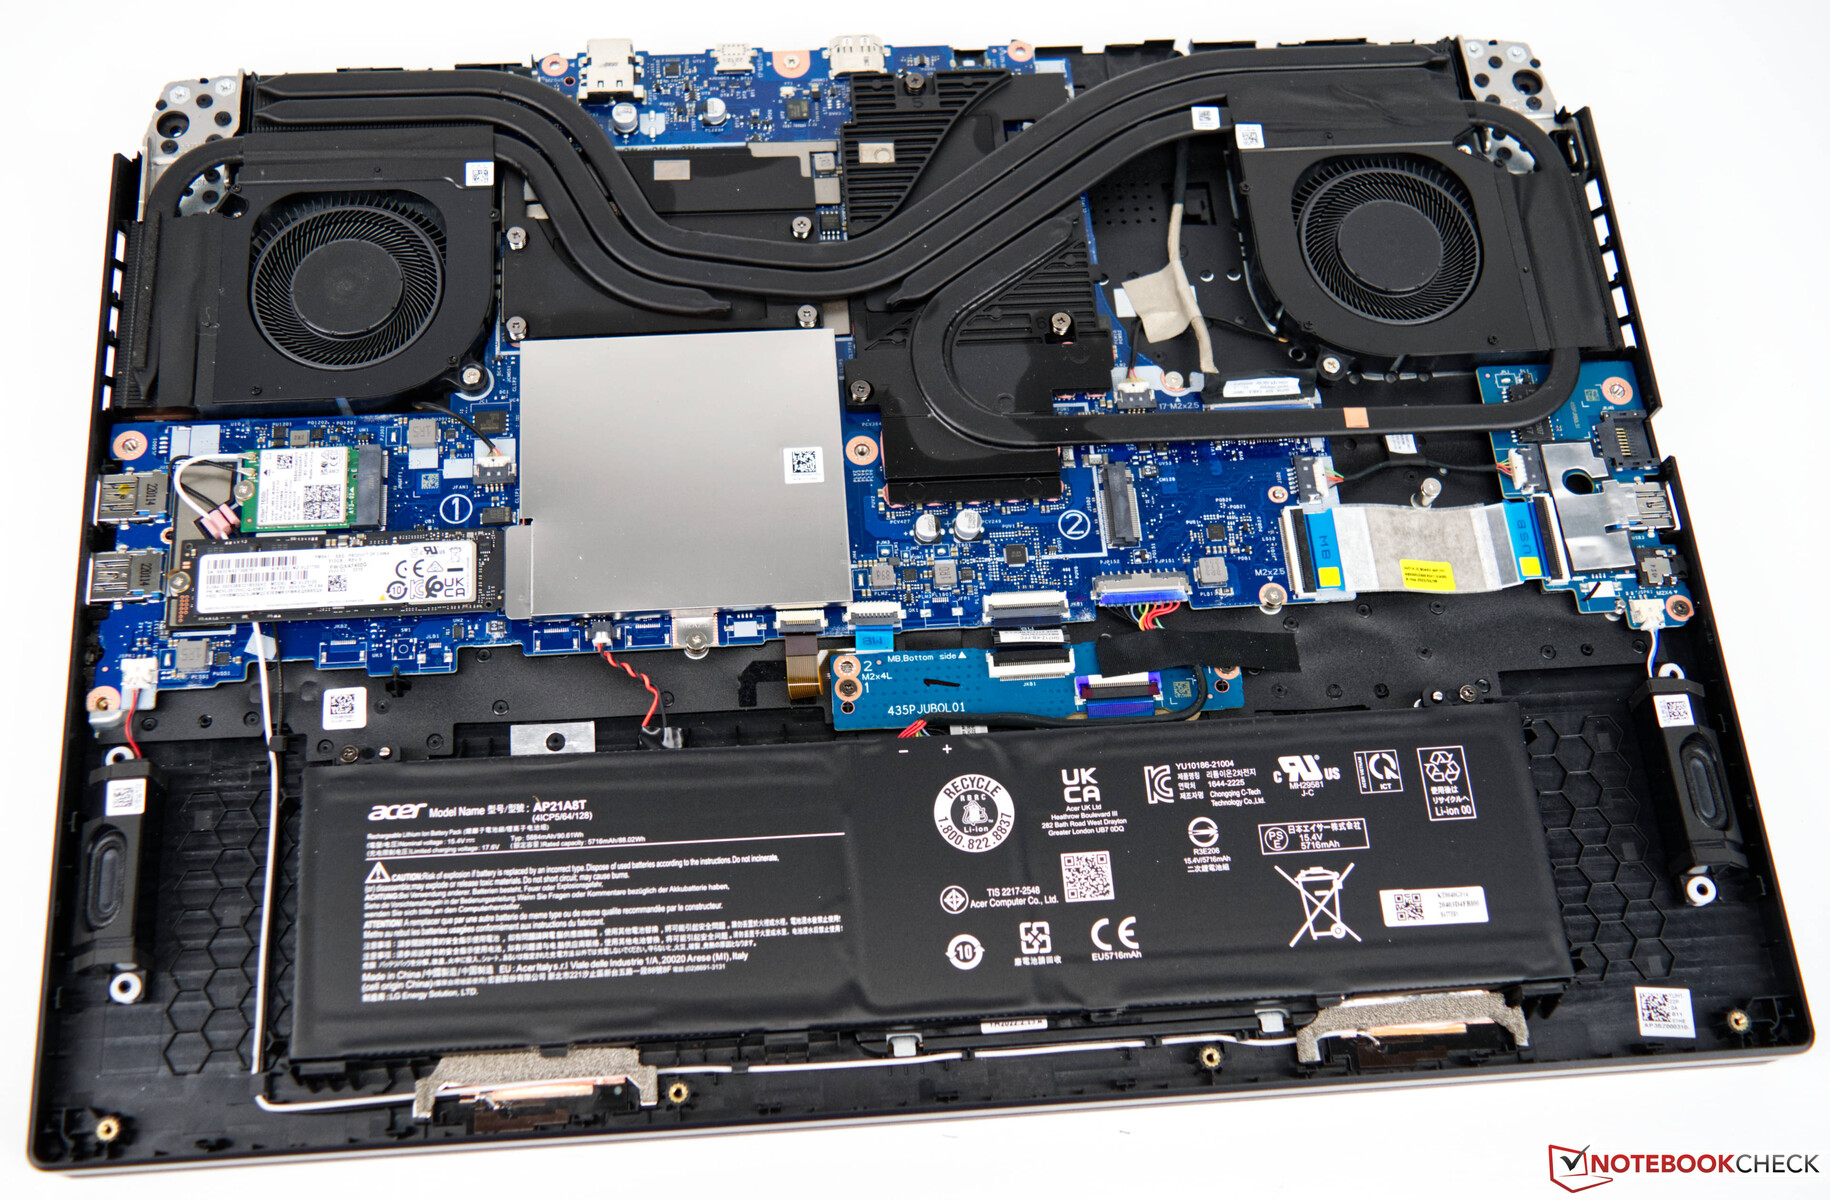
A troca ou substituição de hardware interno é fácil de realizar após a desmontagem da placa de base. Entretanto, deve-se ter cuidado ao fazê-lo - muitos grampos pequenos seguram a tampa no lugar mesmo depois que todos os parafusos foram removidos. As aberturas em nosso dispositivo de amostra também são muito pequenas, por isso tivemos dificuldades para abri-lo com o kit de ferramentas iFixit. Internamente, os componentes instalados podem ser acessados muito facilmente e sem desmontagem adicional.
Garantia
Na Alemanha, a Lenovo oferece aos clientes uma garantia de 24 meses, incluindo o serviço de envio/retorno. Isto pode variar de região para região, para ter certeza de verificar com seu fornecedor antes de comprar
Dispositivos de entrada - Bastante utilizável
Teclado
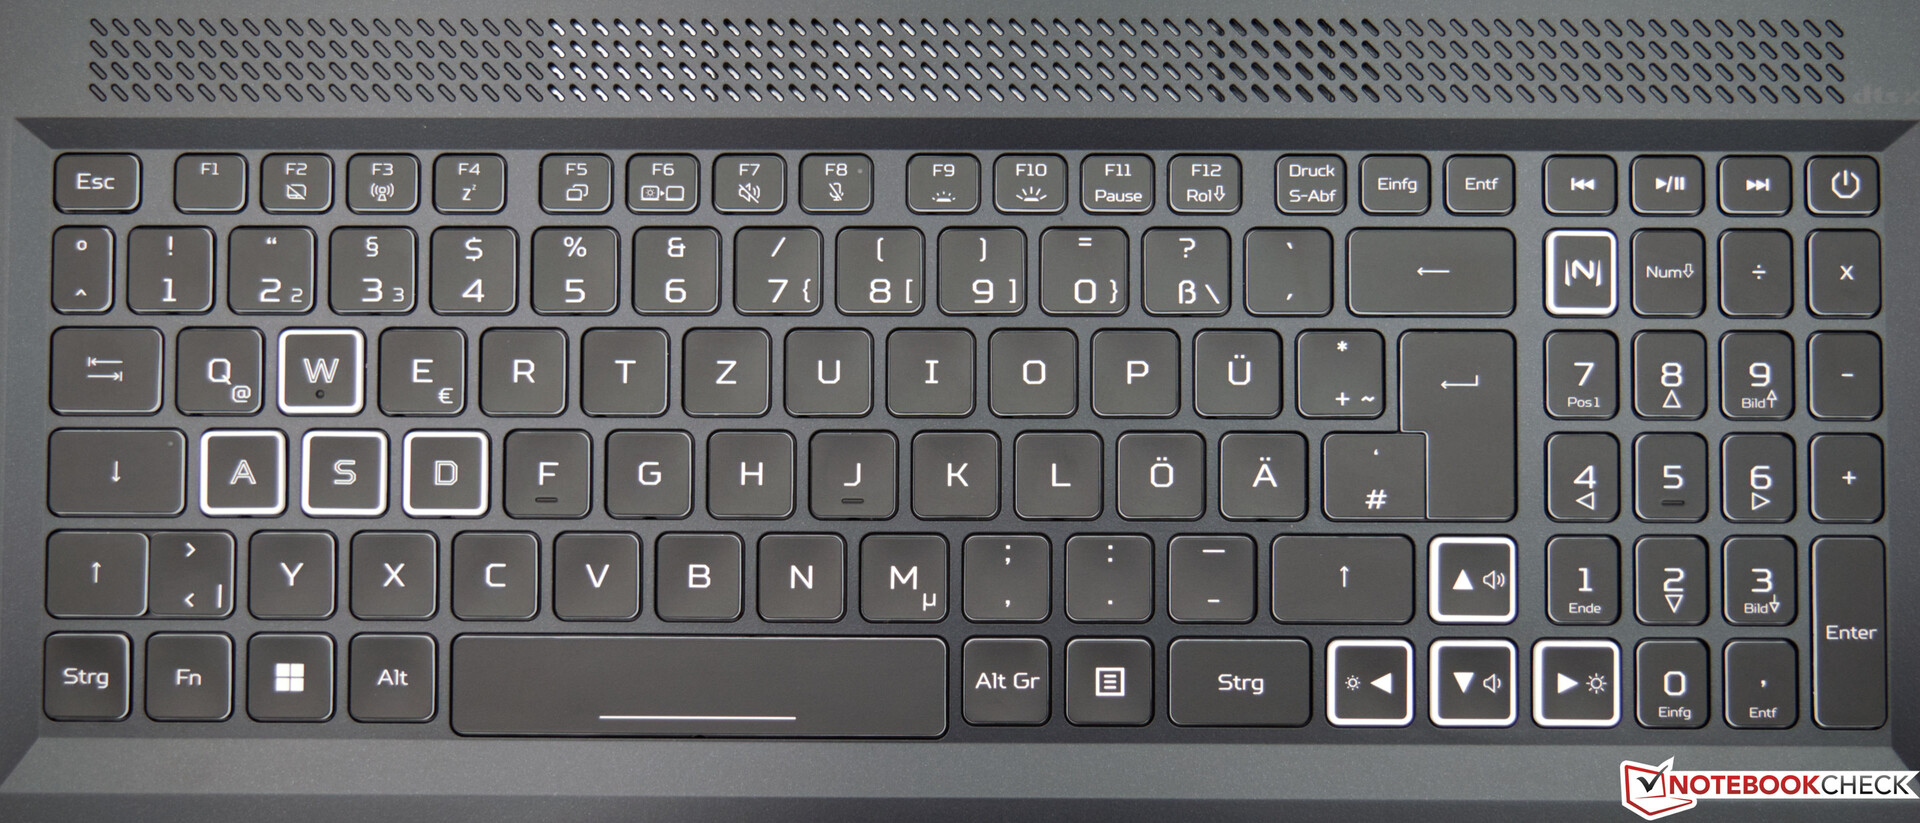
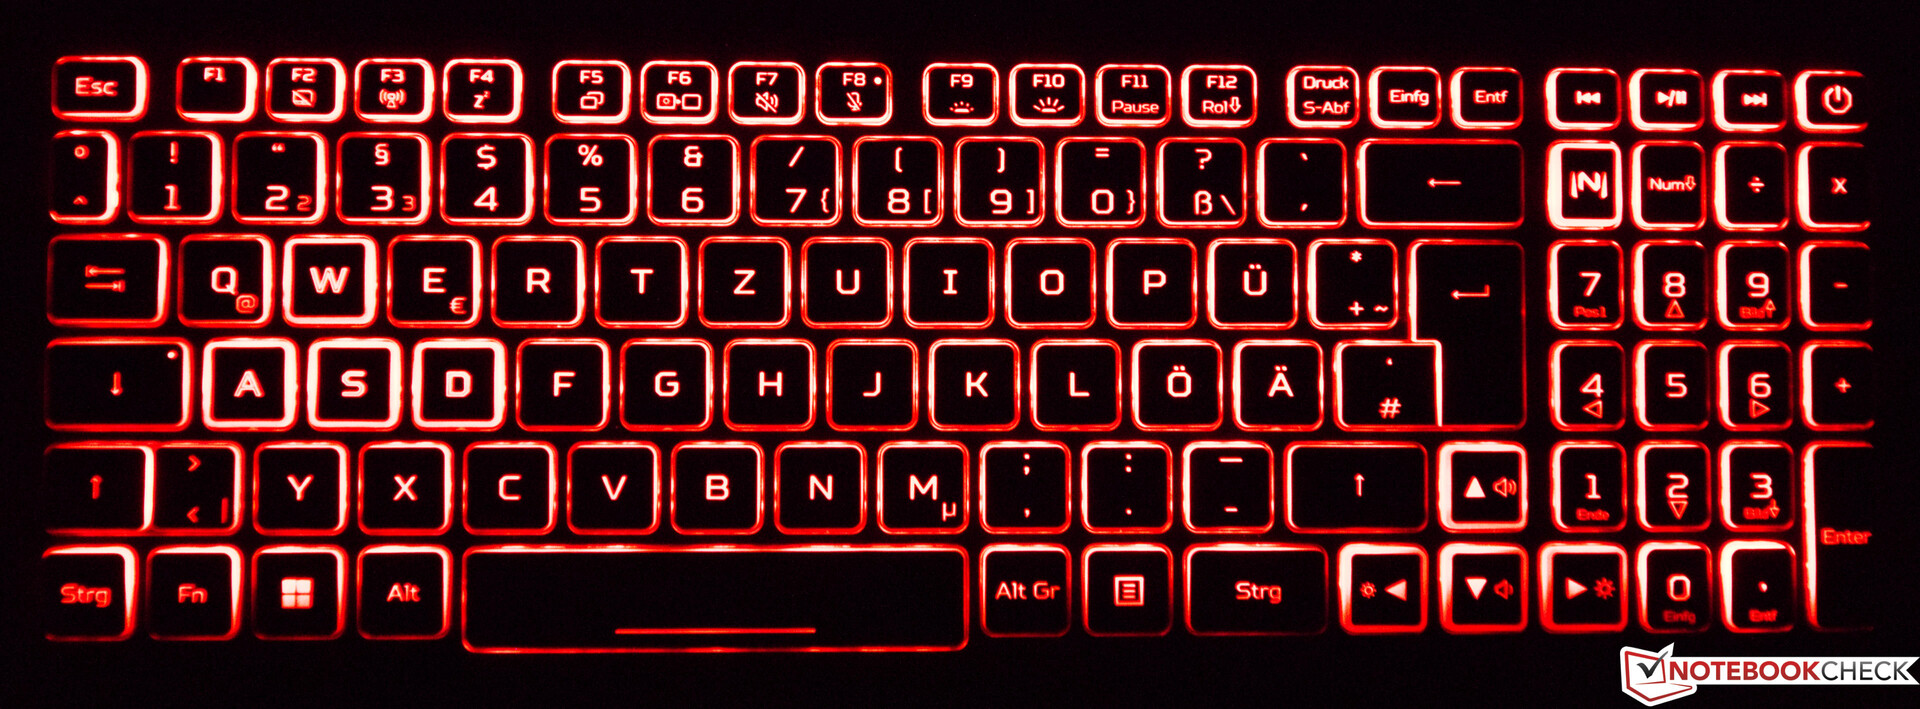
O teclado chiclet de 6 linhas do Acer Nitro 5 AN517 é bom e dá um bom feedback ao digitar. Enquanto a tecla é ligeiramente abafada, isto não leva a uma sensação de digitação esponjosa. Com 15x15 milímetros, as teclas individuais são agradavelmente dimensionadas. As teclas de função e o teclado numérico são um pouco menores, mas isto não causa nenhum problema na prática. A retroiluminação RGB pode ser controlada e ajustada em até 4 zonas via Nitro Sense.
Touchpad
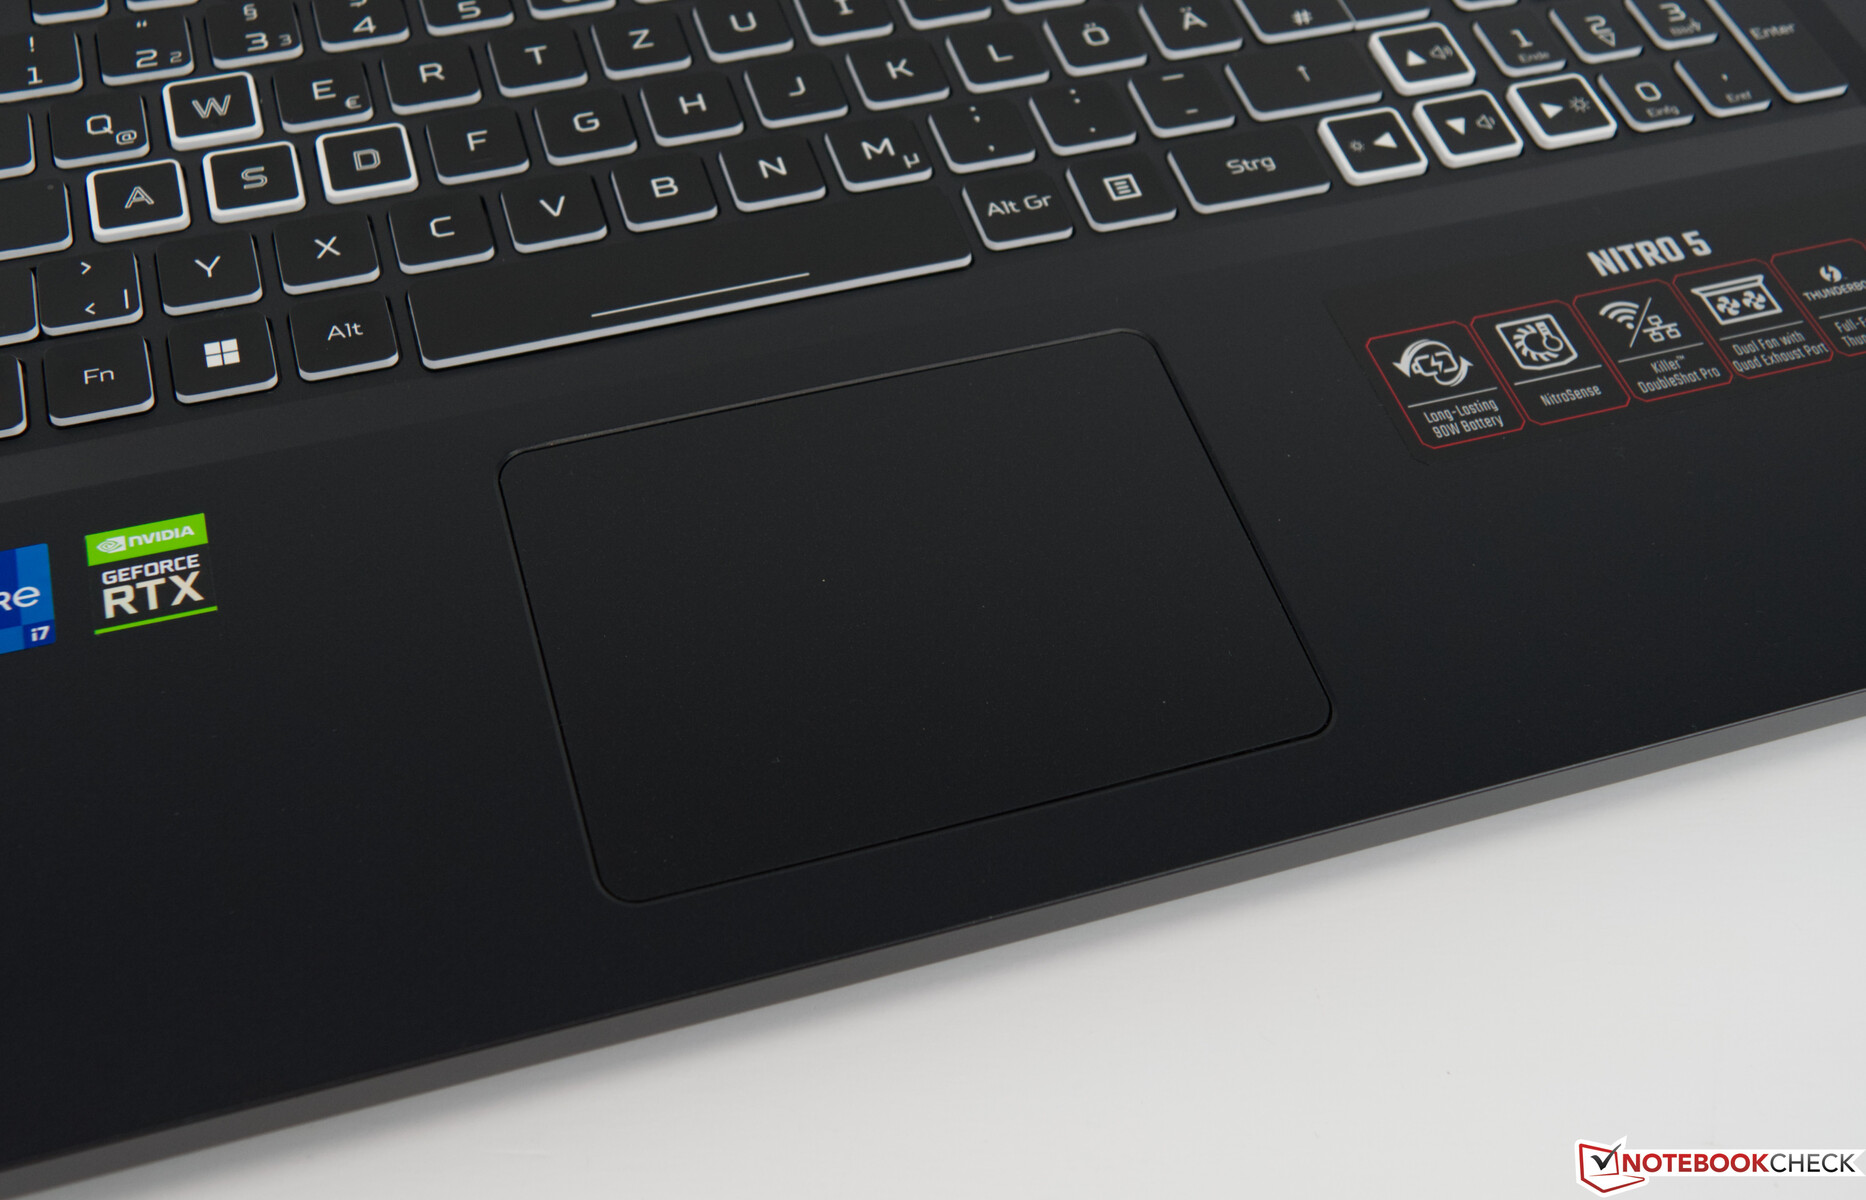
O touchpad embutido mede 10,6x7,8 centímetros, fazendo bom uso do espaço disponível. A substituição do mouse é responsiva em toda a superfície de entrada. A superfície lisa combina visualmente muito bem com o conceito geral. Felizmente, a superfície de entrada é lisa e também bem adequada para gestos multi-toque devido ao seu tamanho. As duas teclas de entrada estão localizadas na área inferior, que fornecem feedback na forma de cliques silenciosos quando pressionadas.
Display - Rápido e 144 Hz


O Acer Nitro 5 AN517 vem com um bom painel Full HD que deve atender as necessidades da maioria dos jogadores com seus 144 Hz e baixos tempos de resposta. Entretanto, o brilho médio de nossa amostra de revisão é um pouco mais fraco. Medimos apenas 278 cd/m², o que não é o pior resultado em comparação direta com outros dispositivos concorrentes
O Acer Nitro 5 AN517 também perde pontos importantes na pontuação geral devido a halos leves. Por outro lado, não detectamos nenhuma PWN, o que pode evitar a fadiga durante longos períodos de uso
Opções alternativas de exibição, tais como um painel QHD ou 4K, não estão disponíveis para o Acer Nitro 5 AN517.
| |||||||||||||||||||||||||
iluminação: 89 %
iluminação com acumulador: 297 cd/m²
Contraste: 894:1 (Preto: 0.32 cd/m²)
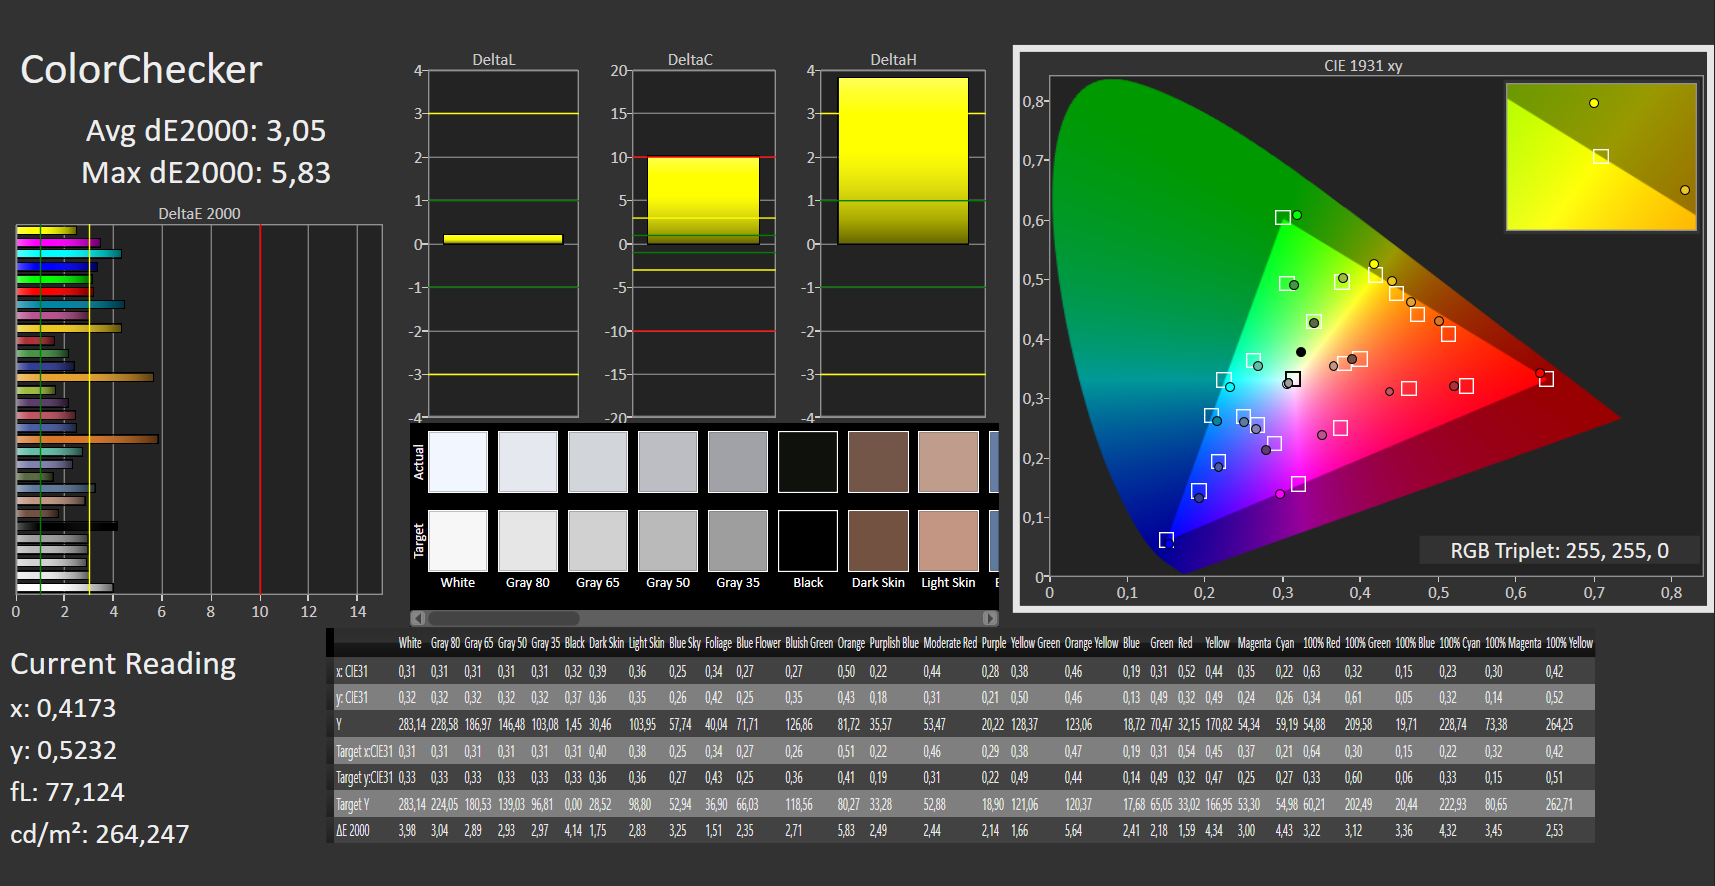
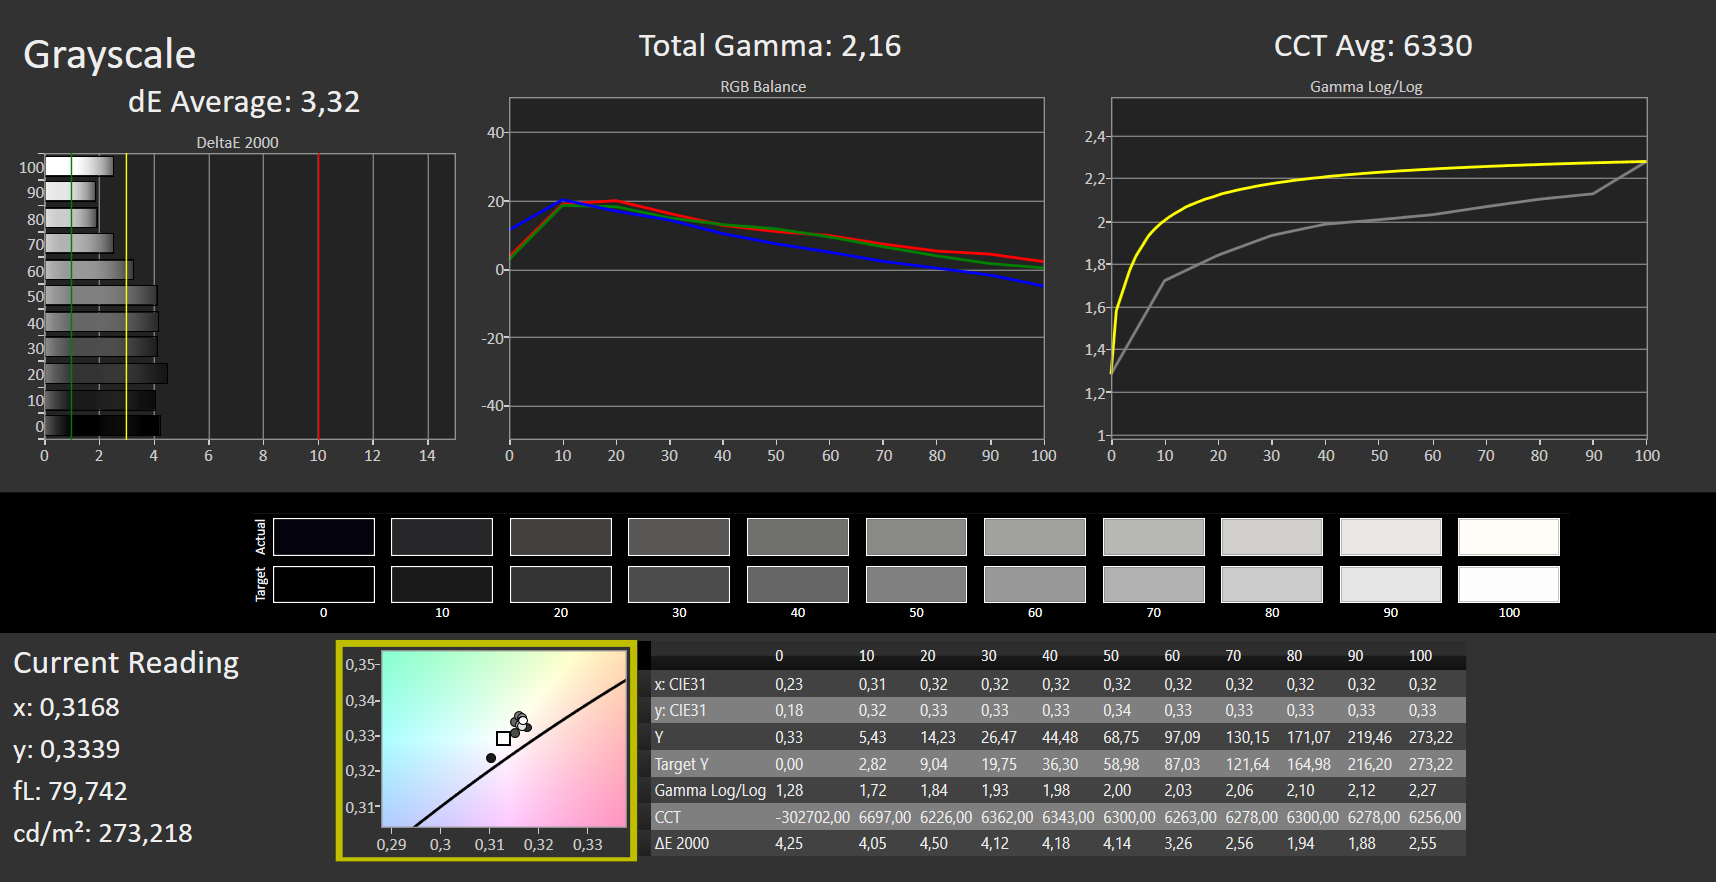
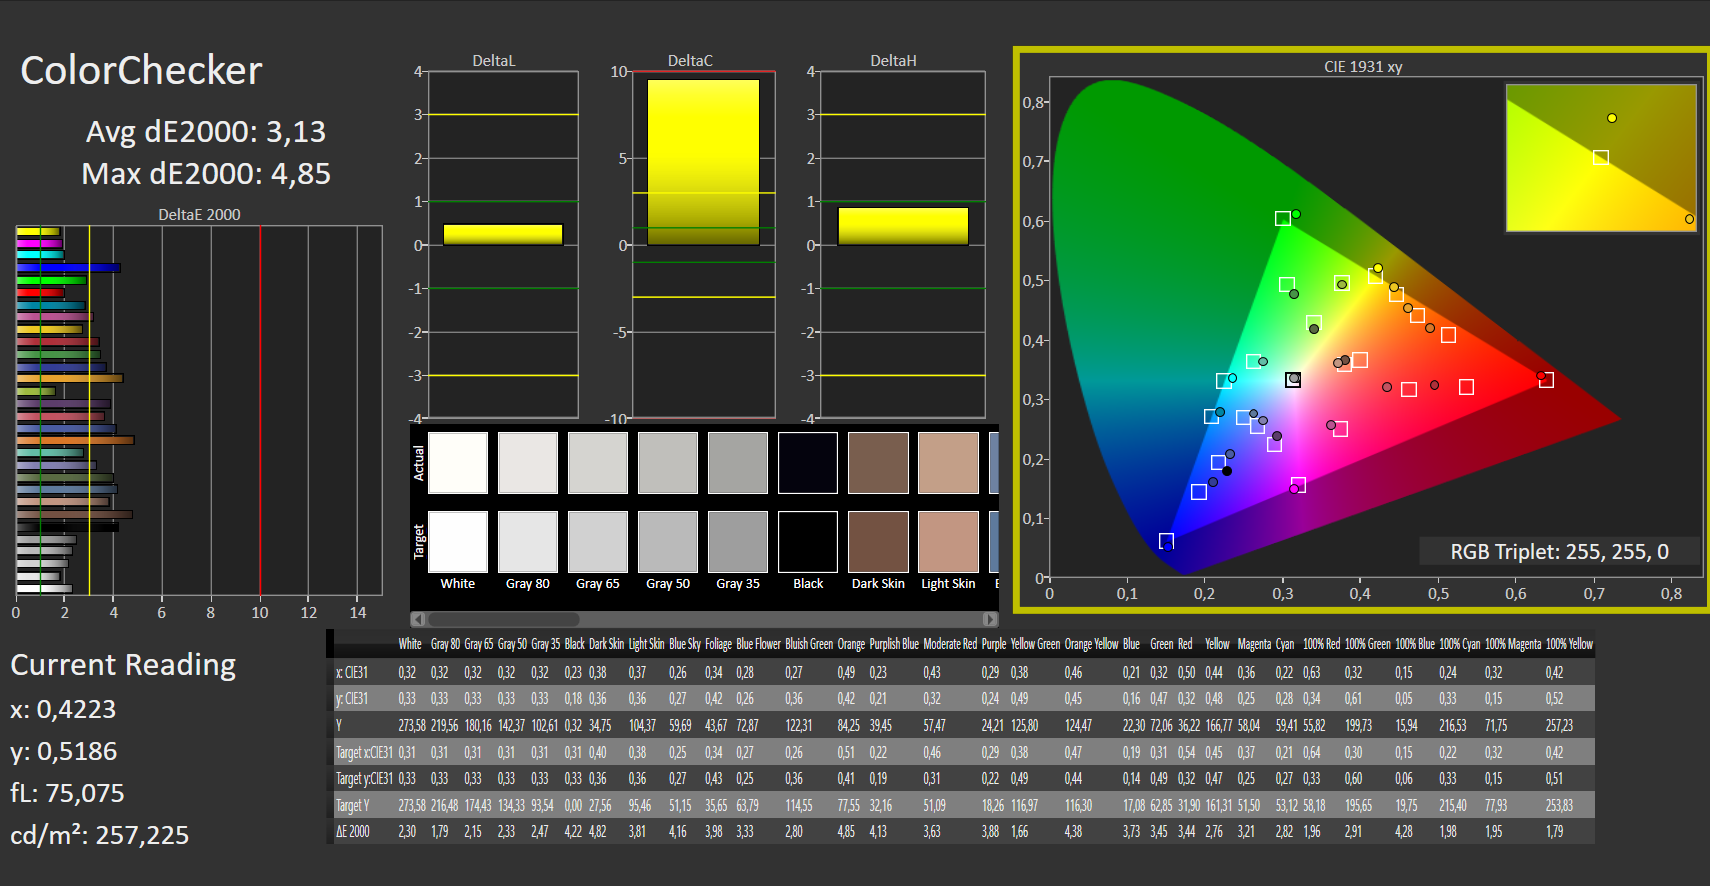
ΔE ColorChecker Calman: 3.05 | ∀{0.5-29.43 Ø4.73}
calibrated: 3.13
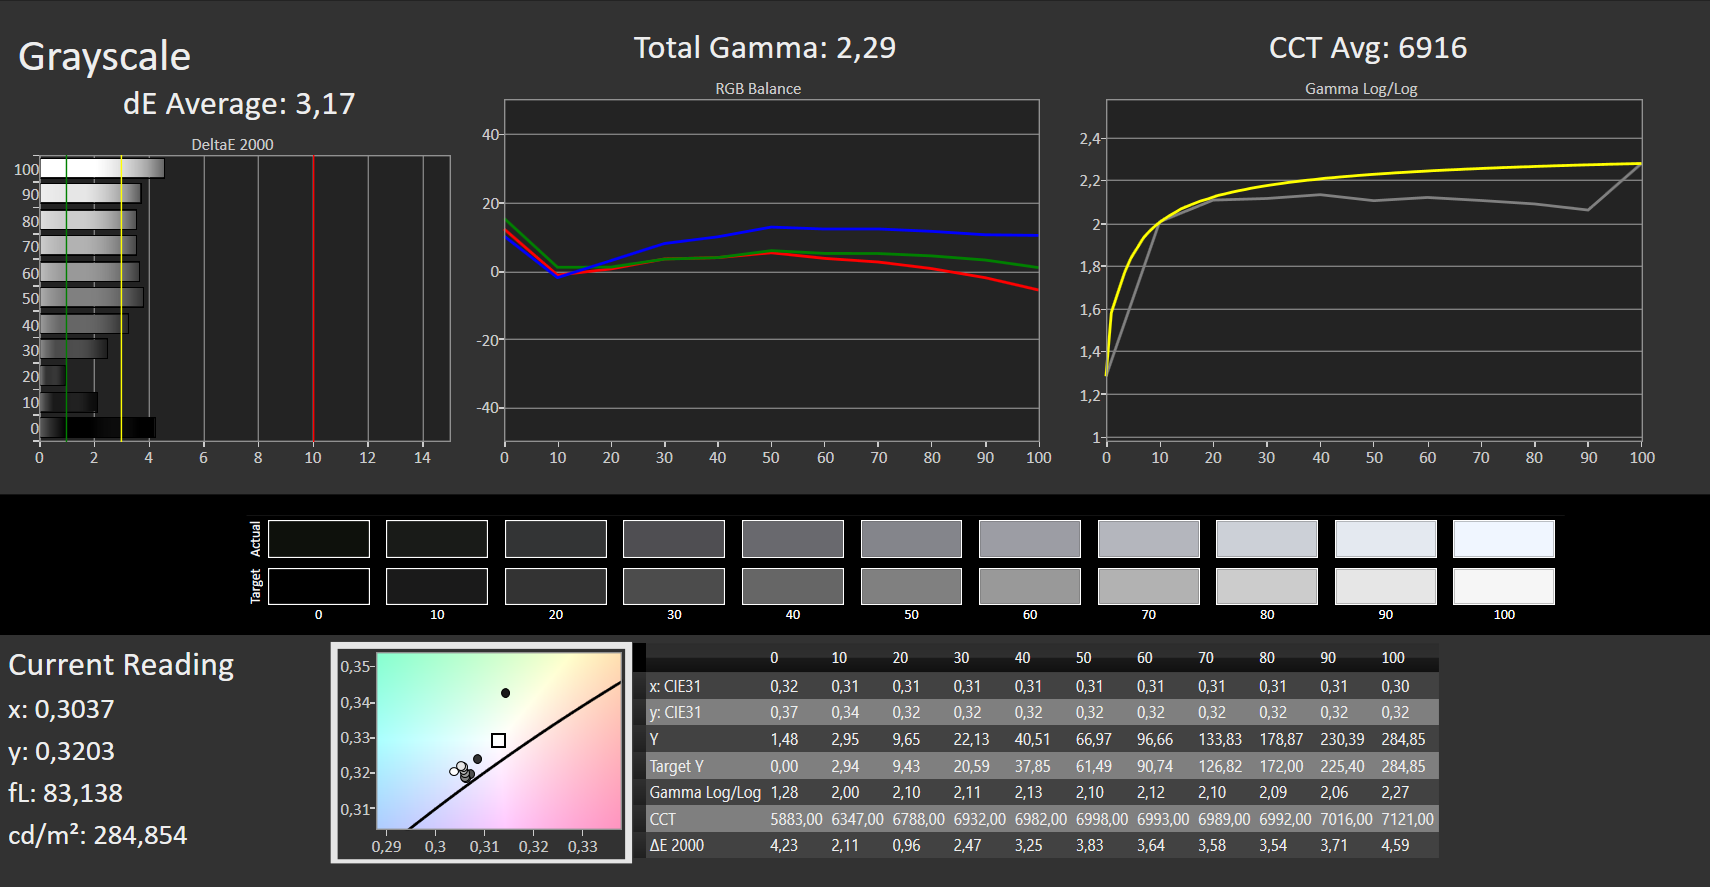
ΔE Greyscale Calman: 3.17 | ∀{0.09-98 Ø4.97}
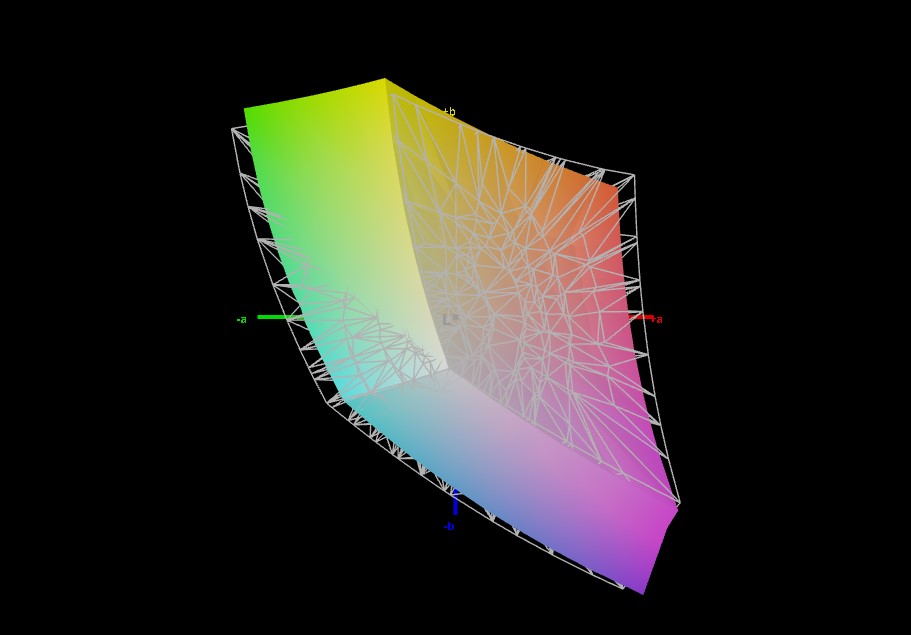
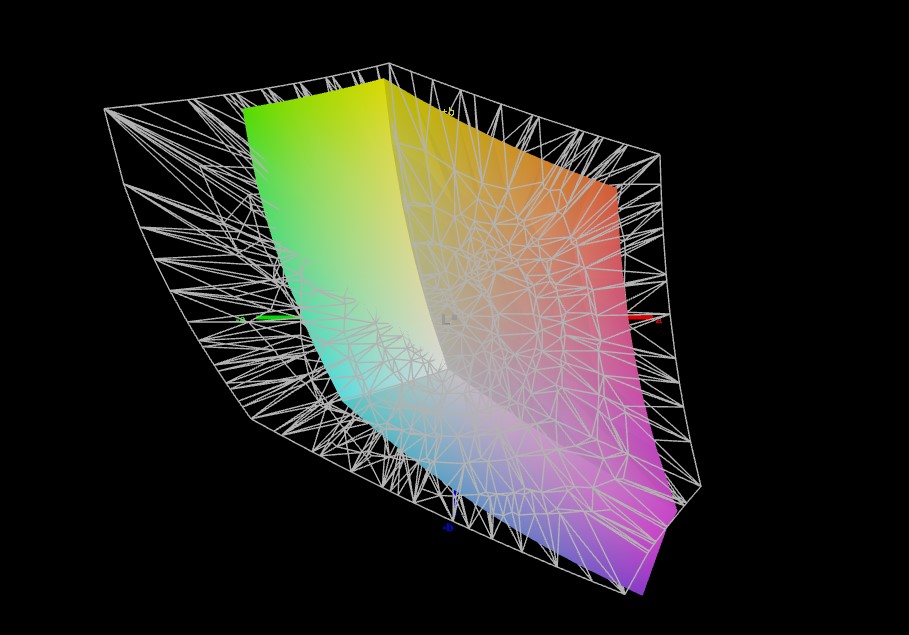
60.5% AdobeRGB 1998 (Argyll 3D)
86.4% sRGB (Argyll 3D)
58.9% Display P3 (Argyll 3D)
Gamma: 2.29
CCT: 6916 K
| Acer Nitro 5 AN517-55-738R B173HAN04.0, IPS, 1920x1080, 17.3" | Lenovo Legion 5 17ACH6H-82JY0003GE LEN173FHD, IPS, 1920x1080, 17.3" | Asus TUF Gaming F17 FX707Z-HX011W AU Optronics B173HAN04.9 (AUO4B9D), IPS, 1920x1080, 17.3" | Acer Nitro 5 AN517-41-R5Z7 BOE NV173FHM-NX4, IPS, 1920x1080, 17.3" | Schenker XMG Core 17 (Early 2021) BOE CQ NE173QHM-NY2, IPS, 2560x1440, 17.3" | MSI Katana GF76 11UE AU Optronics B173HAN04.9, IPS, 1920x1080, 17.3" | |
|---|---|---|---|---|---|---|
| Display | 11% | -31% | -37% | 15% | -32% | |
| Display P3 Coverage (%) | 58.9 | 64.8 10% | 40.2 -32% | 36.7 -38% | 68.1 16% | 39.8 -32% |
| sRGB Coverage (%) | 86.4 | 97.2 13% | 59.7 -31% | 55.3 -36% | 98.5 14% | 59.5 -31% |
| AdobeRGB 1998 Coverage (%) | 60.5 | 66.7 10% | 41.5 -31% | 37.9 -37% | 69.3 15% | 41.12 -32% |
| Response Times | -82% | -412% | -138% | -103% | -369% | |
| Response Time Grey 50% / Grey 80% * (ms) | 6 ? | 15 ? -150% | 39.2 ? -553% | 18 ? -200% | 16.8 ? -180% | 36.8 ? -513% |
| Response Time Black / White * (ms) | 8 ? | 9 ? -13% | 29.6 ? -270% | 14 ? -75% | 10 ? -25% | 26 ? -225% |
| PWM Frequency (Hz) | ||||||
| Screen | 26% | -9% | -28% | 7% | -27% | |
| Brightness middle (cd/m²) | 286 | 323 13% | 287 0% | 282 -1% | 370 29% | 260 -9% |
| Brightness (cd/m²) | 278 | 305 10% | 268 -4% | 255 -8% | 333 20% | 251 -10% |
| Brightness Distribution (%) | 89 | 89 0% | 89 0% | 85 -4% | 84 -6% | 85 -4% |
| Black Level * (cd/m²) | 0.32 | 0.25 22% | 0.17 47% | 0.24 25% | 0.38 -19% | 0.26 19% |
| Contrast (:1) | 894 | 1292 45% | 1688 89% | 1175 31% | 974 9% | 1000 12% |
| Colorchecker dE 2000 * | 3.05 | 1.87 39% | 5.1 -67% | 5.91 -94% | 2.41 21% | 3.9 -28% |
| Colorchecker dE 2000 max. * | 5.83 | 4.84 17% | 8.72 -50% | 10.98 -88% | 7.32 -26% | 20.64 -254% |
| Colorchecker dE 2000 calibrated * | 3.13 | 0.92 71% | 5.1 -63% | 1.19 62% | 3.71 -19% | |
| Greyscale dE 2000 * | 3.17 | 2.57 19% | 4.24 -34% | 5.85 -85% | 3.9 -23% | 1.6 50% |
| Gamma | 2.29 96% | 2.42 91% | 2.44 90% | 2.32 95% | 2.287 96% | 2.068 106% |
| CCT | 6916 94% | 7012 93% | 6008 108% | 7372 88% | 7302 89% | 6511 100% |
| Color Space (Percent of AdobeRGB 1998) (%) | 35 | 69 | ||||
| Color Space (Percent of sRGB) (%) | 55 | 93 | ||||
| Média Total (Programa/Configurações) | -15% /
8% | -151% /
-71% | -68% /
-47% | -27% /
-7% | -143% /
-77% |
* ... menor é melhor
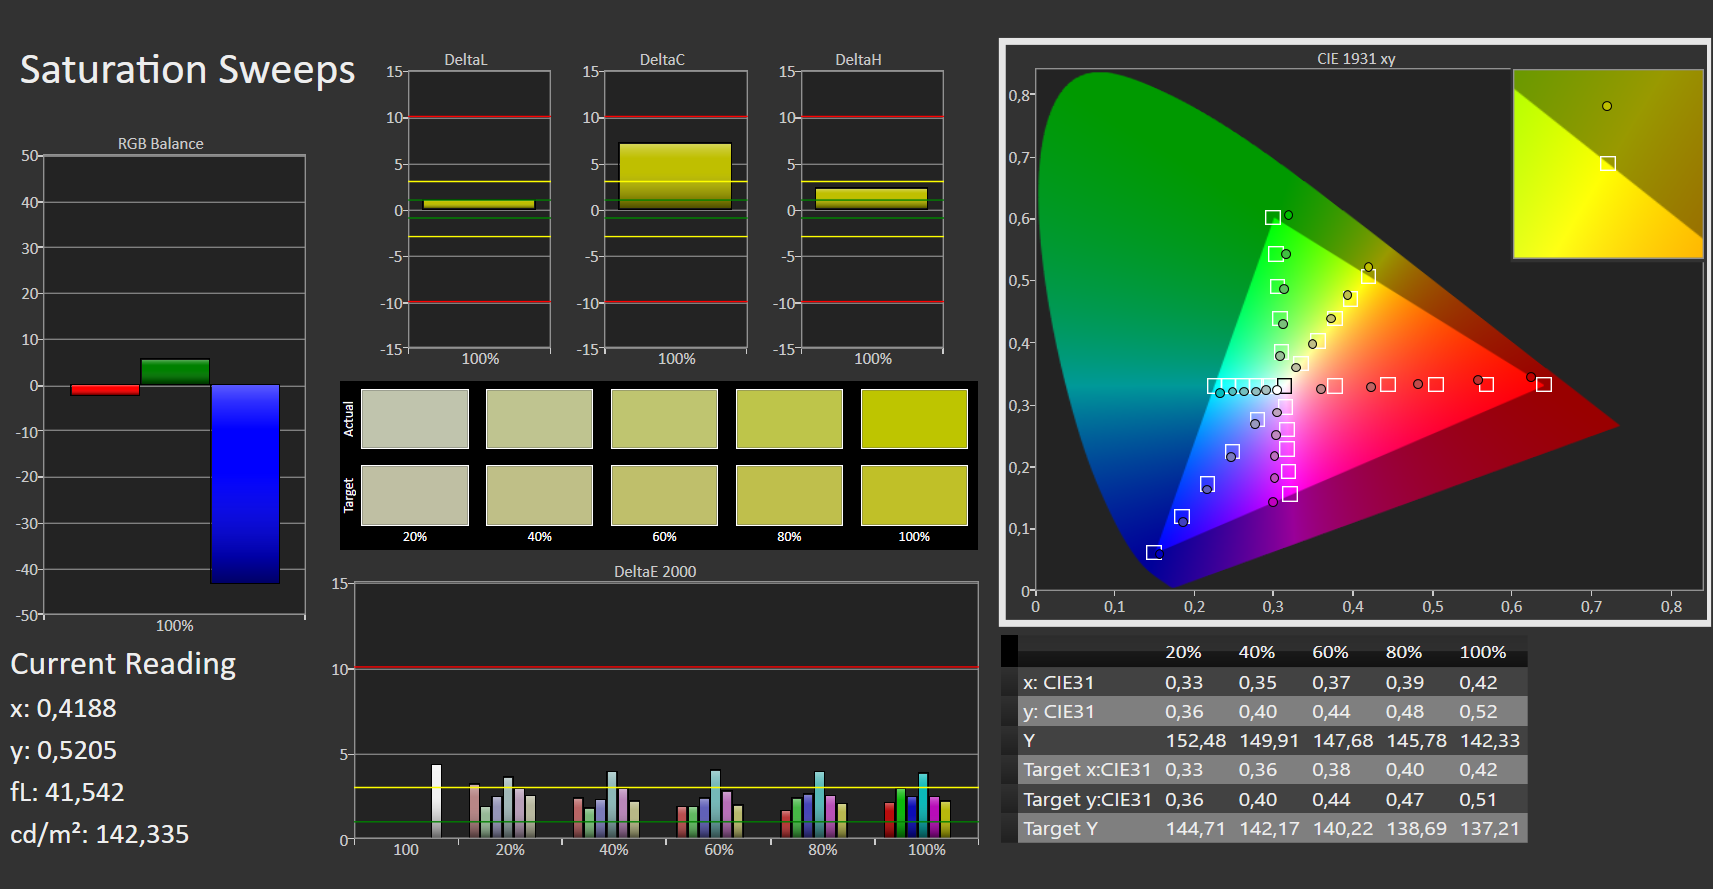
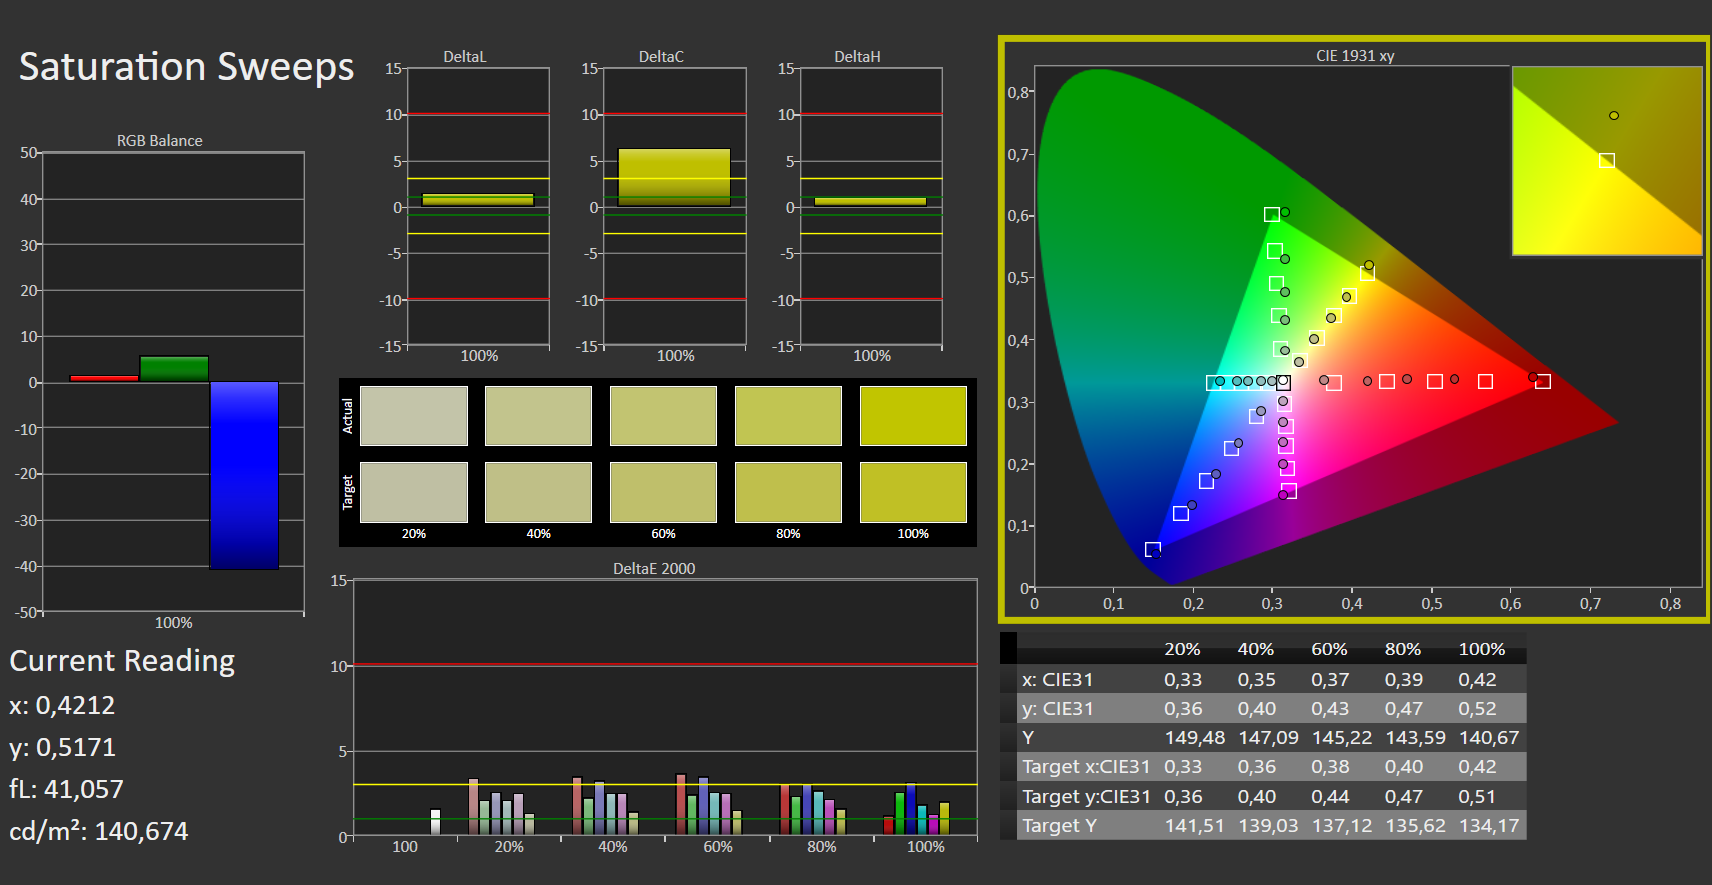
A qualidade de exibição da tela embutida é subjetivamente boa e não há grãos visíveis apesar da superfície fosca. Em geral, os valores medidos de DeltaE-2000 da escala de cinza e cores estão relativamente próximos do valor-alvo de 3, em comparação com o espaço de cor sRGB no estado de entrega. Entretanto, a concorrência prova que pode ser melhor aqui. Não fomos capazes de trazer nenhuma melhoria séria através da calibração manual. Apenas o leve elenco azul foi reduzido um pouco.
Exibir tempos de resposta
| ↔ Tempo de resposta preto para branco | ||
|---|---|---|
| 8 ms ... ascensão ↗ e queda ↘ combinadas | ↗ 4 ms ascensão |  |
| ↘ 4 ms queda | ||
| A tela mostra taxas de resposta rápidas em nossos testes e deve ser adequada para jogos. Em comparação, todos os dispositivos testados variam de 0.1 (mínimo) a 240 (máximo) ms. » 22 % de todos os dispositivos são melhores. Isso significa que o tempo de resposta medido é melhor que a média de todos os dispositivos testados (19.9 ms). | ||
| ↔ Tempo de resposta 50% cinza a 80% cinza | ||
| 6 ms ... ascensão ↗ e queda ↘ combinadas | ↗ 3 ms ascensão |  |
| ↘ 3 ms queda | ||
| A tela mostra taxas de resposta muito rápidas em nossos testes e deve ser muito adequada para jogos em ritmo acelerado. Em comparação, todos os dispositivos testados variam de 0.165 (mínimo) a 636 (máximo) ms. » 18 % de todos os dispositivos são melhores. Isso significa que o tempo de resposta medido é melhor que a média de todos os dispositivos testados (31.1 ms). | ||
Cintilação da tela / PWM (modulação por largura de pulso)
| Tela tremeluzindo / PWM não detectado |  | ||
[pwm_comparison] Em comparação: 52 % de todos os dispositivos testados não usam PWM para escurecer a tela. Se PWM foi detectado, uma média de 7797 (mínimo: 5 - máximo: 343500) Hz foi medida. | |||
Devido ao baixo brilho da tela, não recomendamos o uso ao ar livre. Se isto não puder ser evitado, você deve definitivamente procurar um lugar à sombra. Felizmente, a superfície da tela mate evita reflexos irritantes. Para o teste do ângulo de visão, observamos um resultado que é típico de um painel IPS. Uma leve mudança de cor pode ser observada nas imagens dos quatro cantos, mas isto não é excessivamente pronunciado e não pode ser visto durante o uso normal.

Desempenho - Rápido o suficiente apesar do limite de temperatura
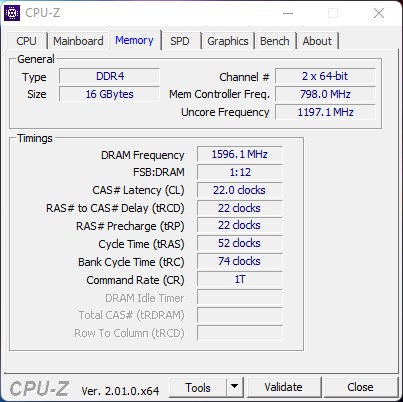
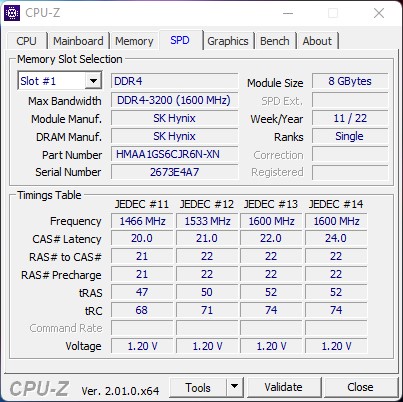
Devido à classe do dispositivo, o desempenho da CPU e da GPU é decisivo. A interação daIntel Core i7-12700H e o Nvidia GeForce RTX 3060 GPU para laptopé bom e completamente suficiente para a resolução da tela nativa. A RAM DDR4 de 16 GB também é boa e não é muito mesquinha, portanto, não houve problemas durante os testes. No entanto, as críticas se estendem ao SSD instalado porque 512 GB se tornam rapidamente cheios devido ao espaço exigido pelos jogos atuais. Poderia ser mais aqui.
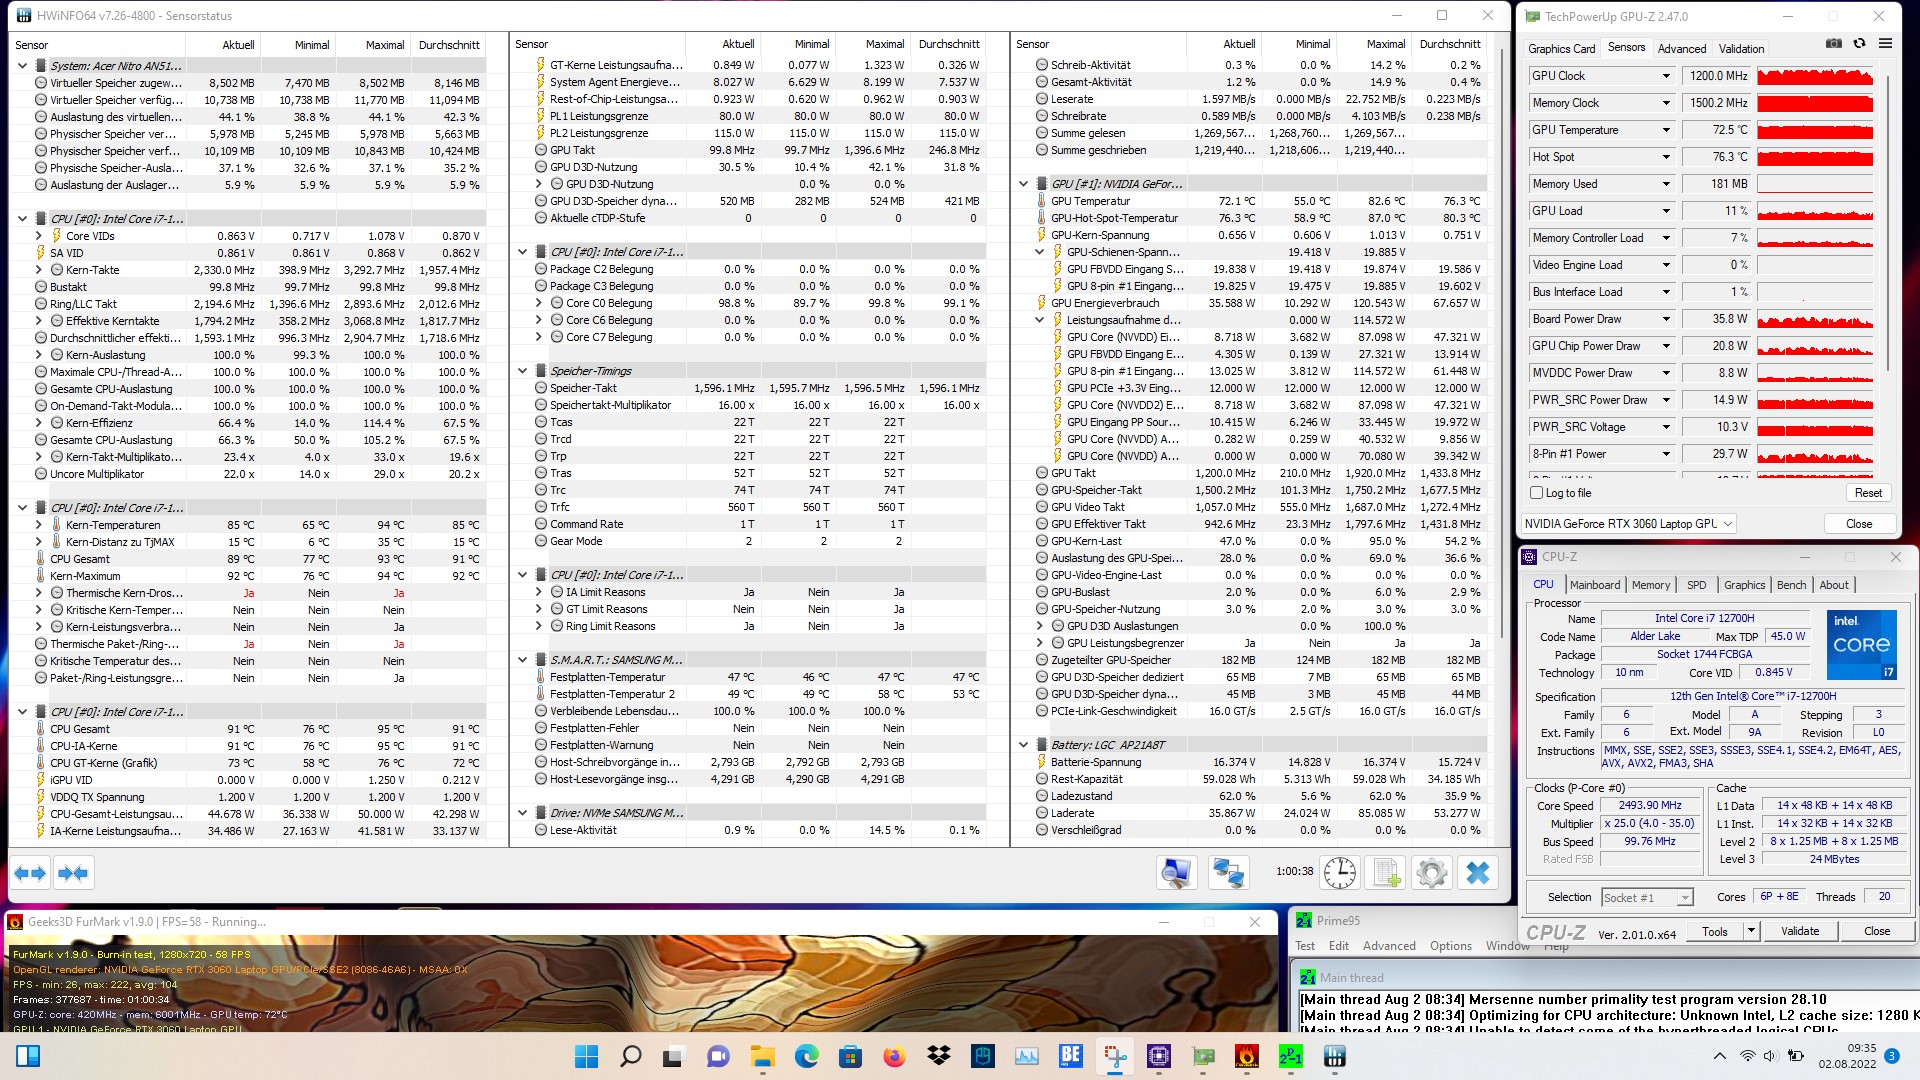
Condições de teste
Os perfis "Quiet", "Standard" e "Performance" podem ser selecionados através da ferramenta "Nitro Sense". Realizamos todos os testes de CPU e GPU no perfil "Standard", já que este perfil representa a melhor opção em termos de desempenho e emissão de ruído. Mais detalhes sobre por que escolhemos este perfil podem ser encontrados na seção de medições de volume. O TDP do processador não foi restrito, embora a refrigeração estabeleça o limite aqui. Registramos um consumo máximo de energia de cerca de 100 watts para oNvidia GeForce RTX 3060 GPU para laptop. Isto deixa o modelo um pouco atrás dos 130 watts máximos possíveis.
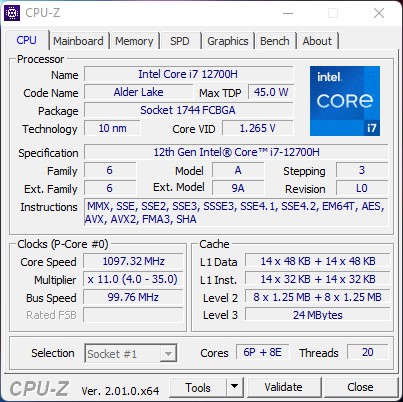
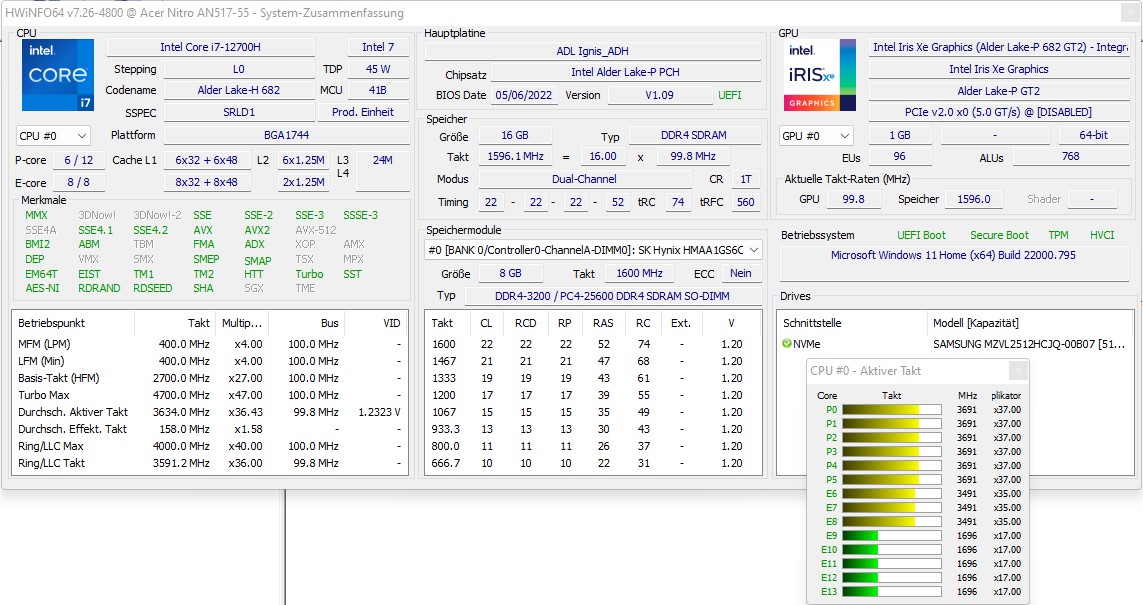
Prozessor
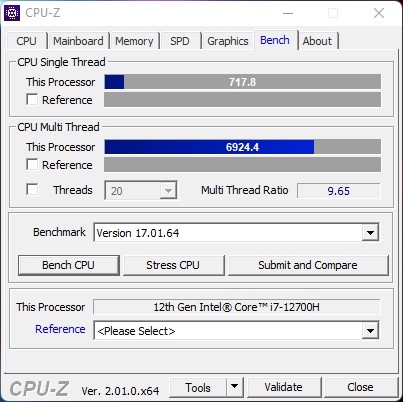
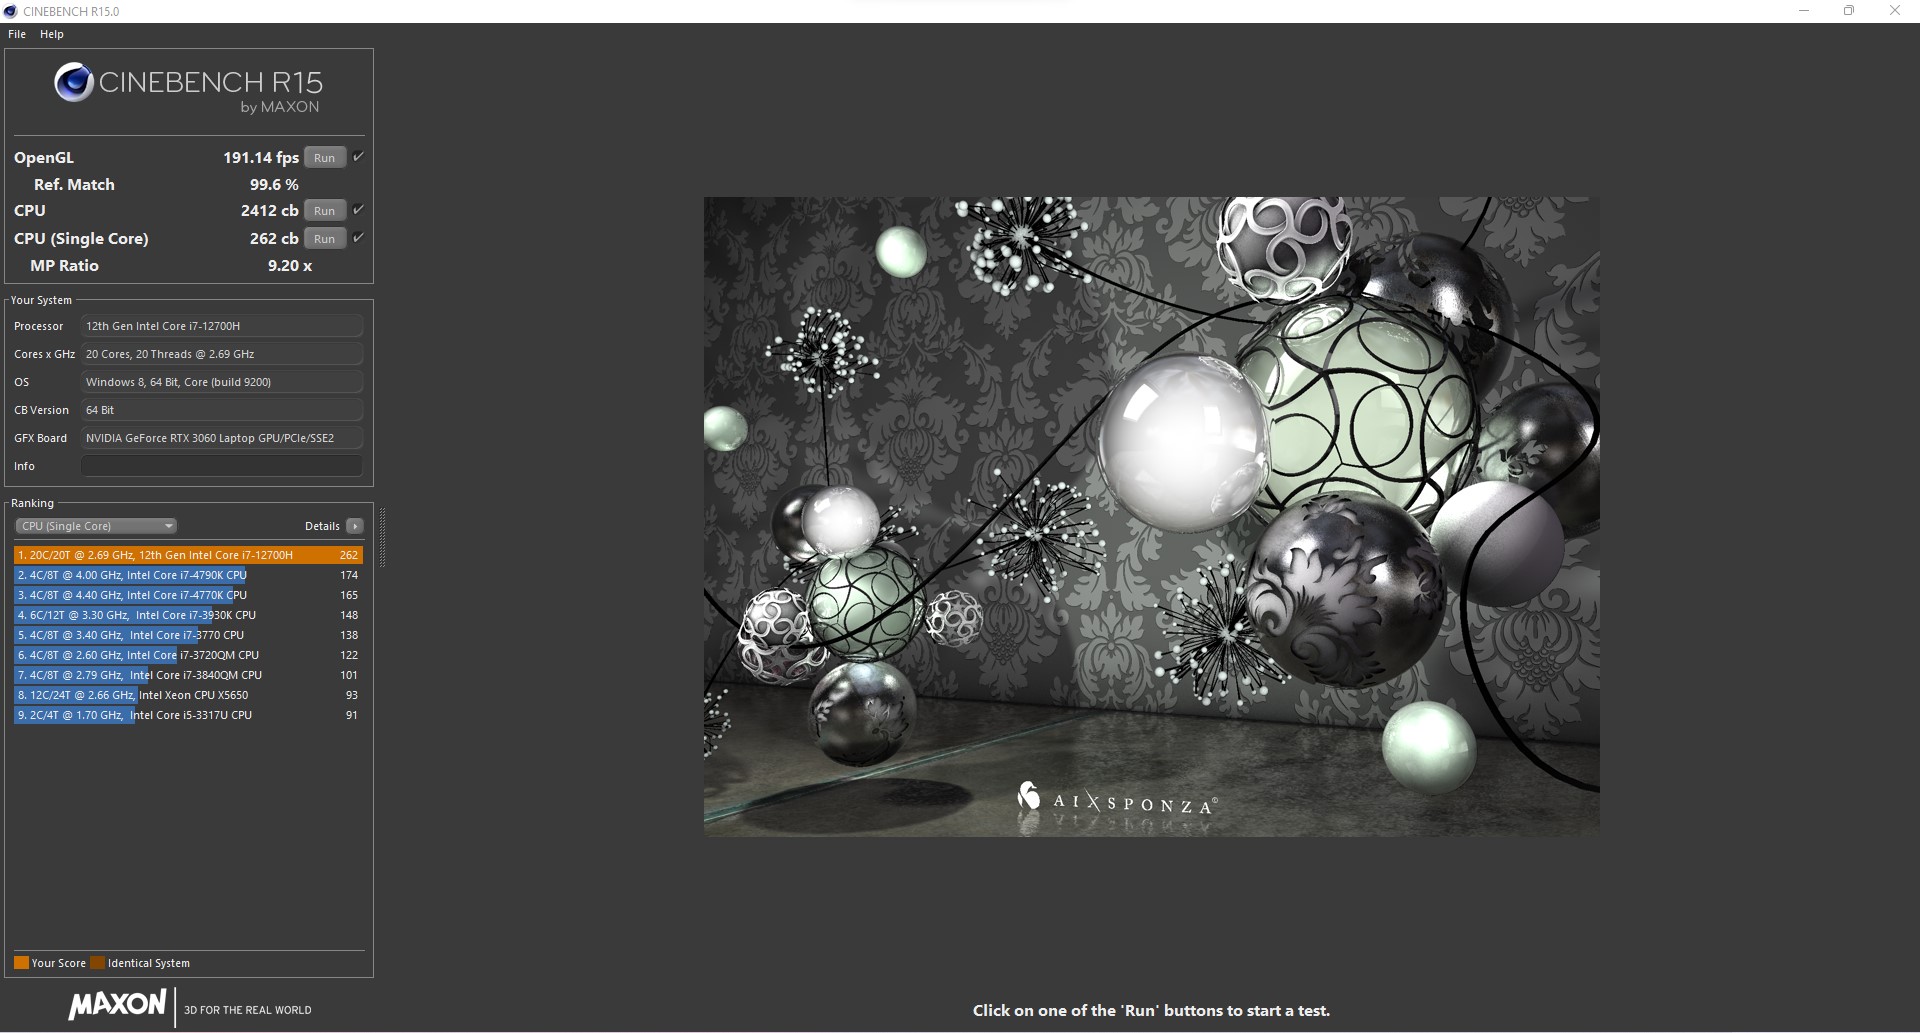
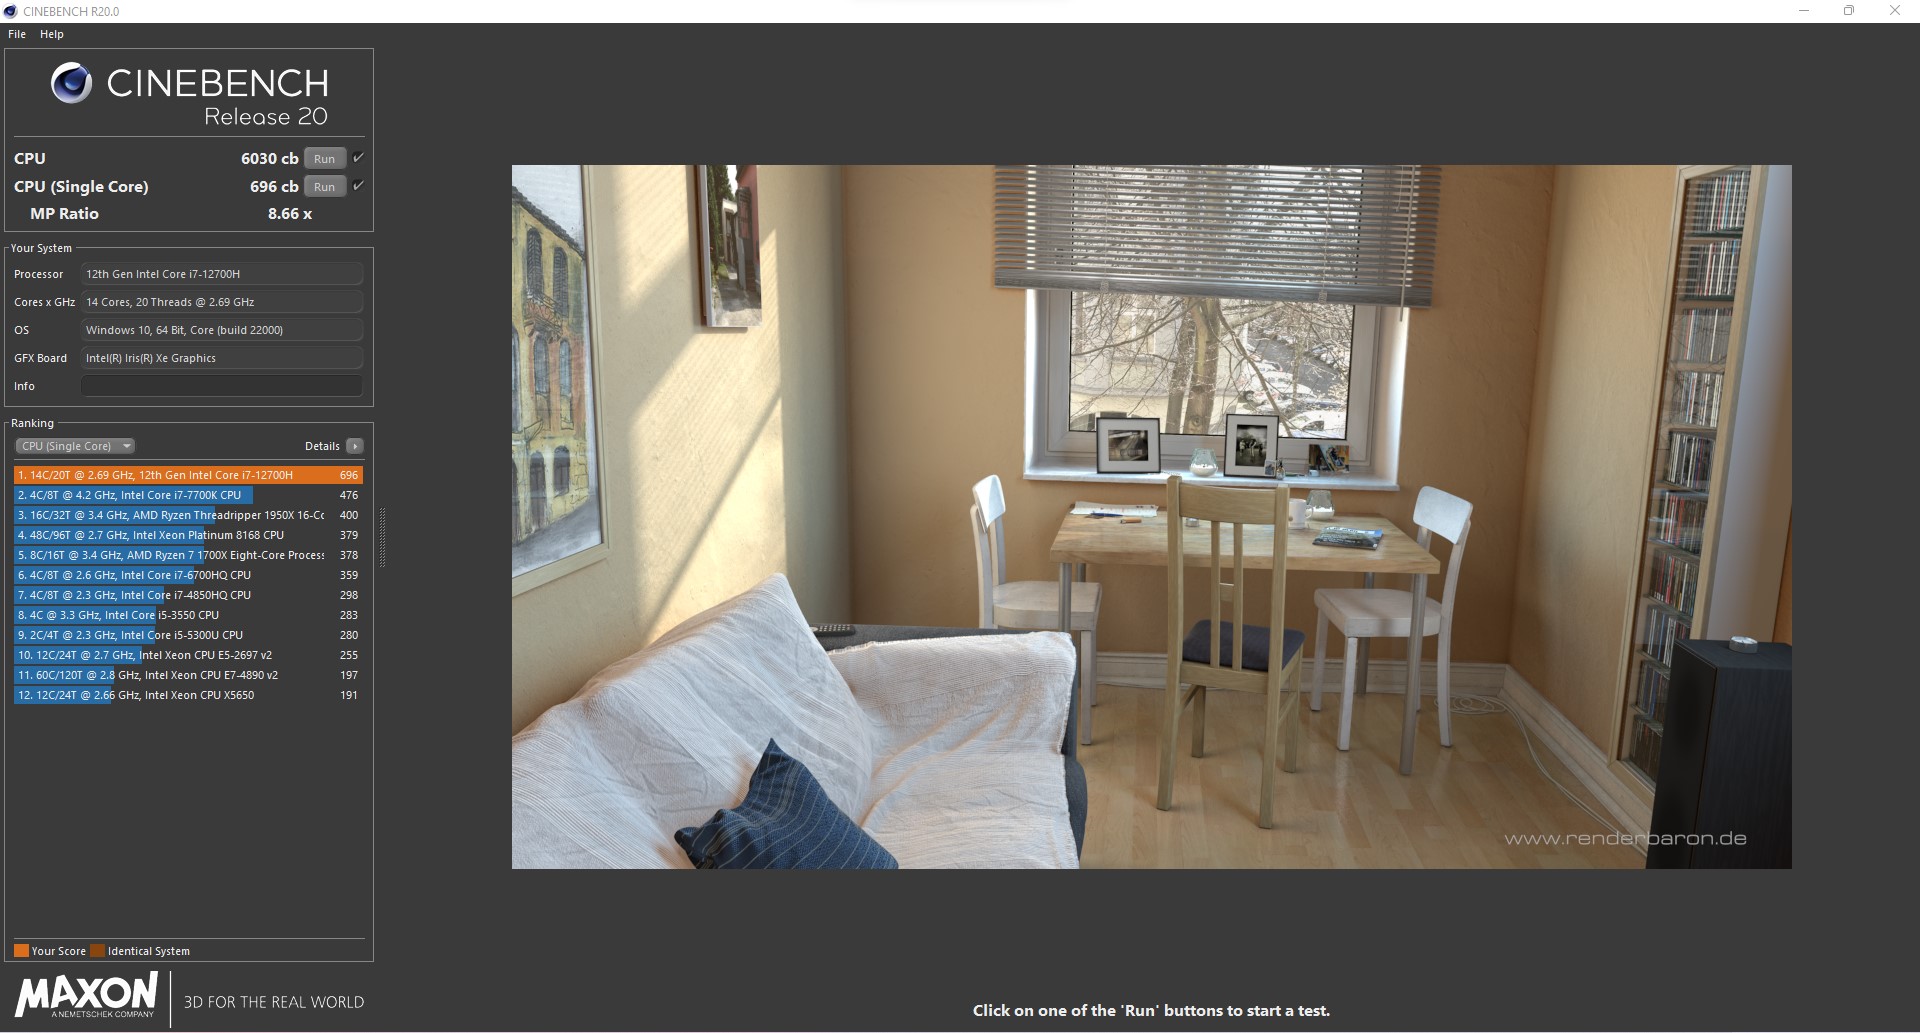
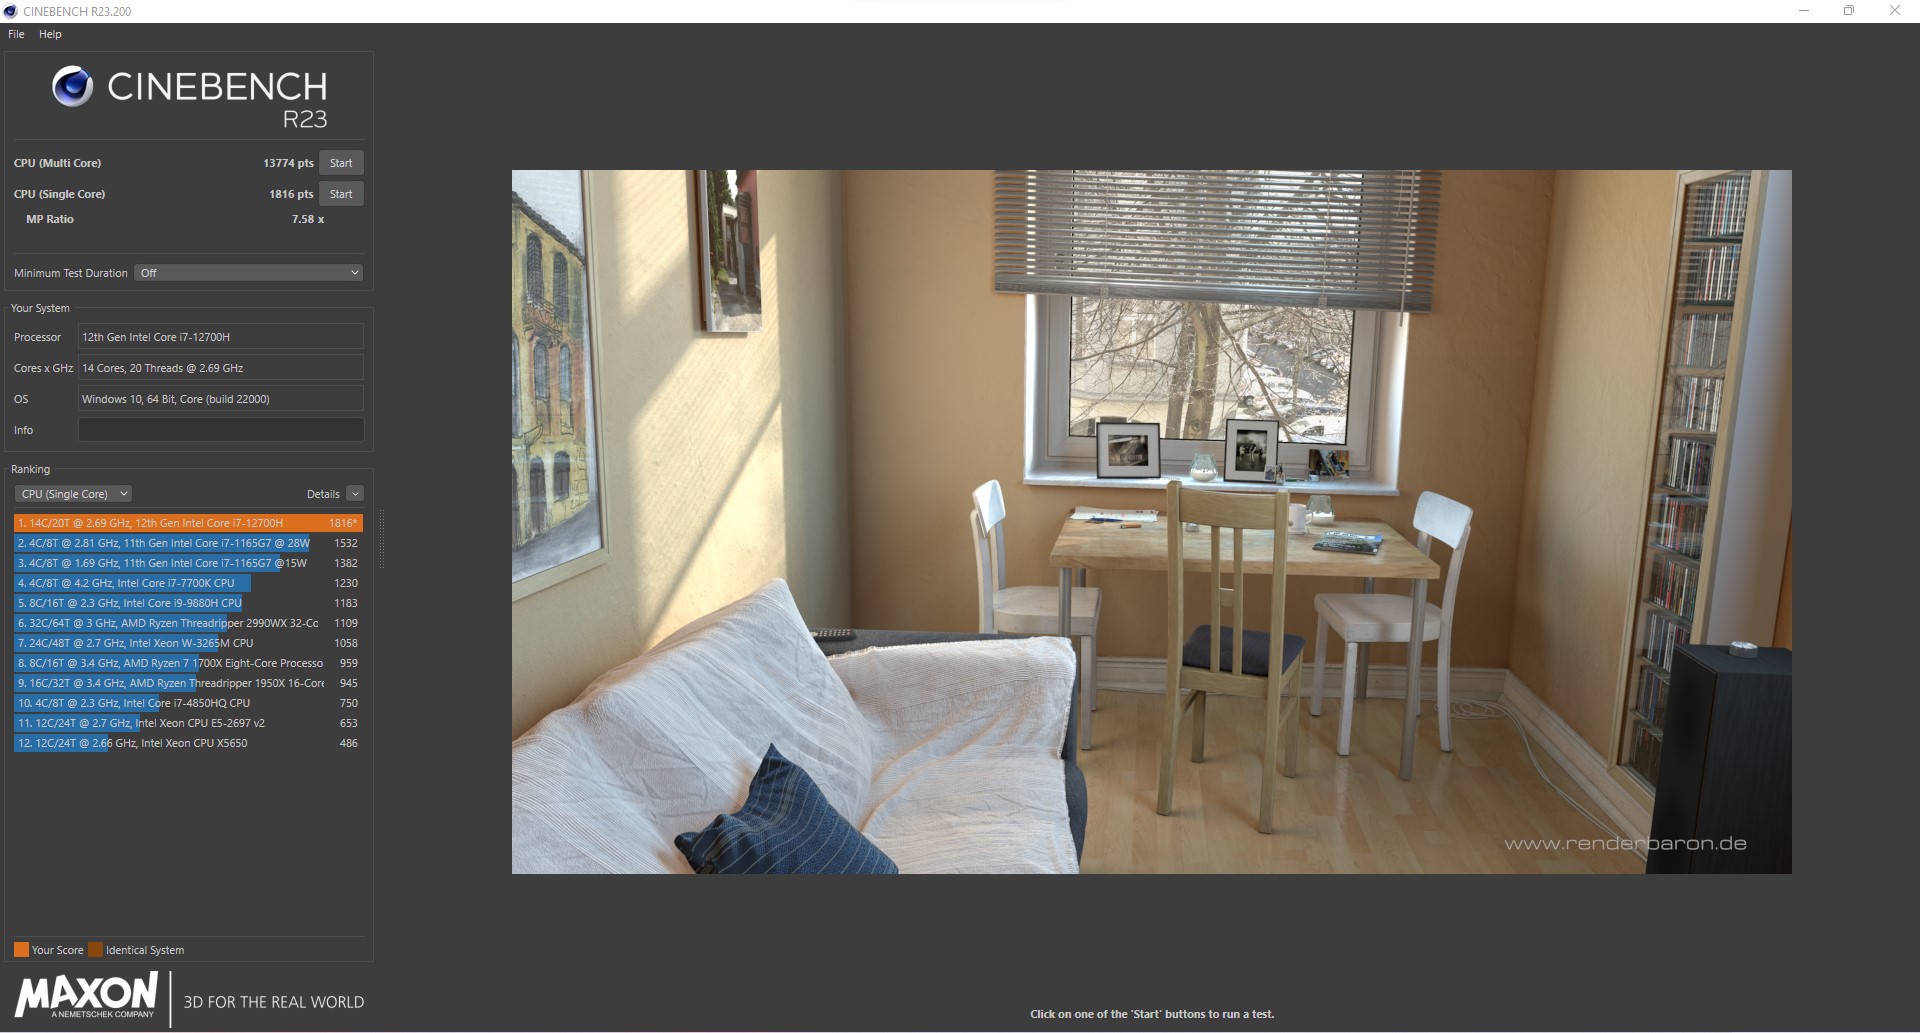
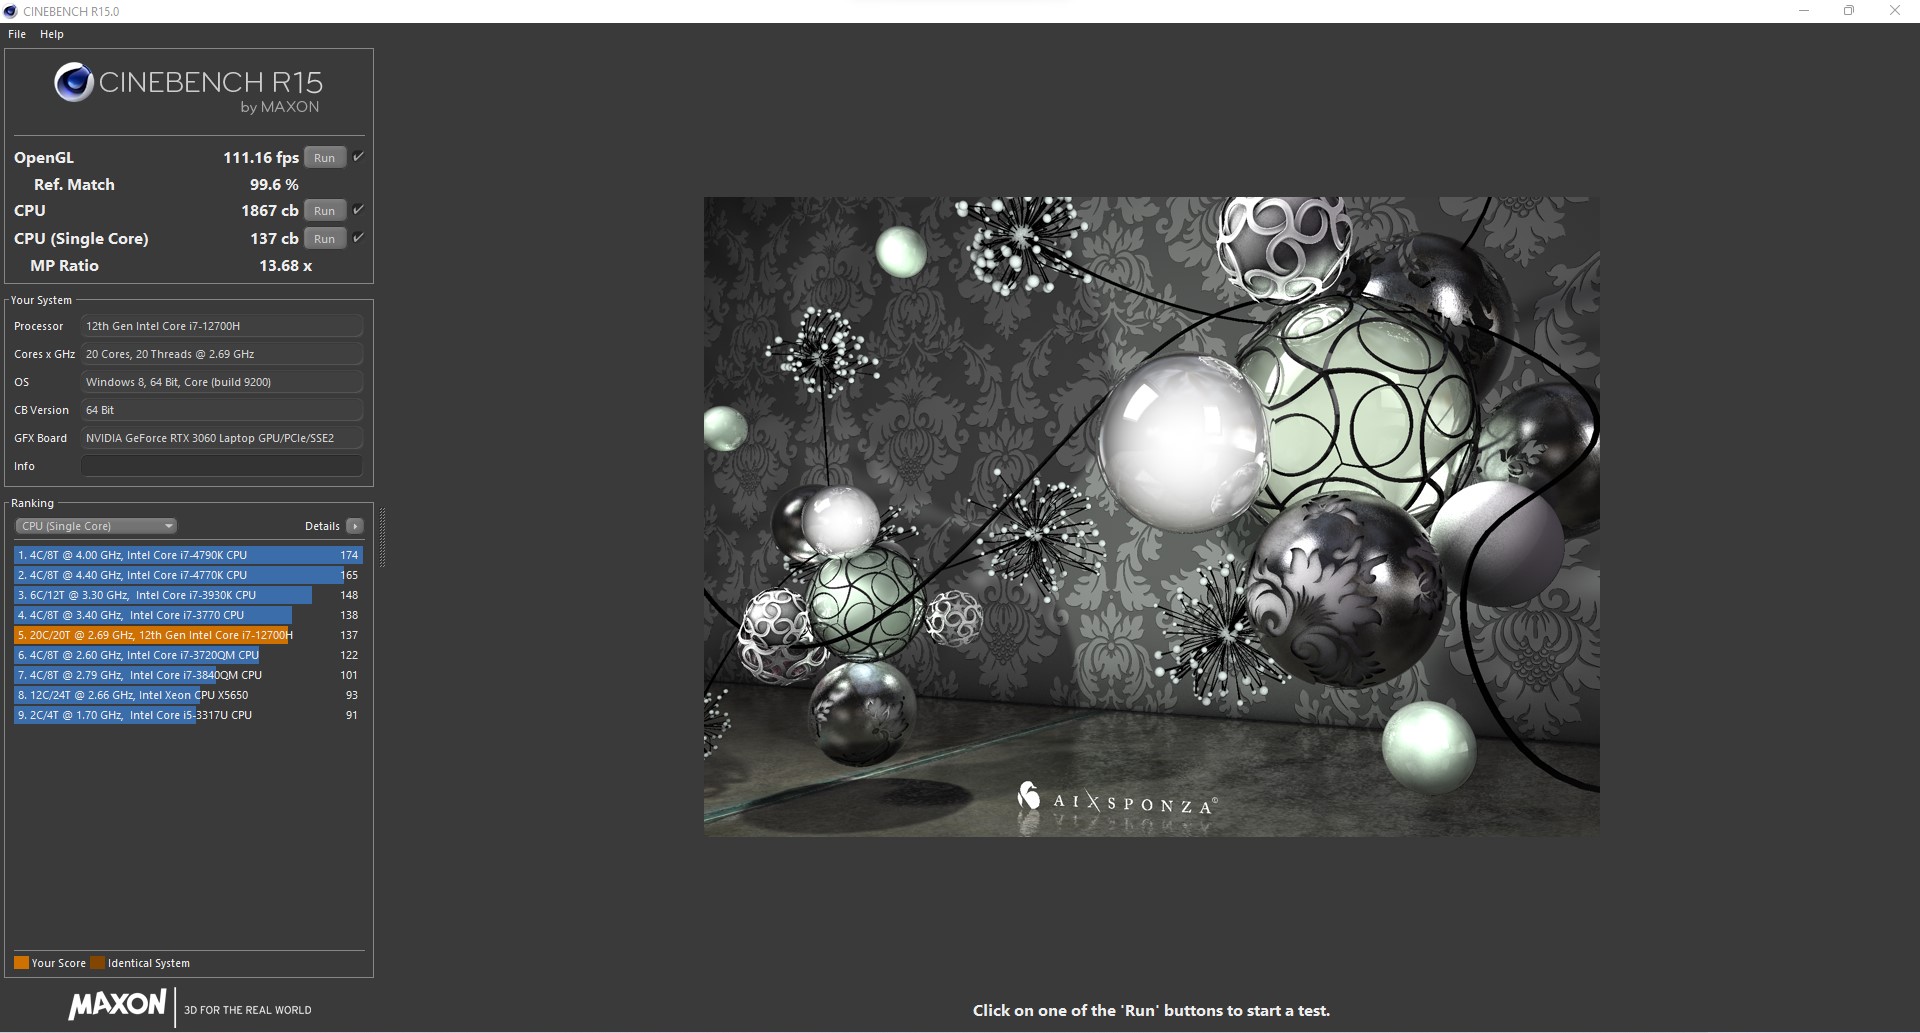
O inbuiltIntel Core i7-12700Hpertence à arquitetura Alder-Lake-S da Intel e combina os núcleos P e E. O SoC de 45 watts oferece assim um total de 20 fios, que são divididos em 6 núcleos P com hyperthreading e 8 núcleos E. Com taxas de clock de até 4,7 GHz nos núcleos de desempenho, o SoC oferece valores de desempenho realmente impressionantes. Em comparação com o equipamento similar Asus TUT Jogo F17nossa amostra de revisão prevalece por pouco nos testes de CPU. Mesmo os rivais baseados na AMD não conseguem se manter aqui em cima.
Nosso Acer Nitro 5 AN517 tem um desempenho relativamente bom no teste de estresse, que é executado com o Cinebench R15 multi-loop. O desempenho permanece relativamente estável e se estabiliza em 2.176 pontos em 50 corridas.
Para mais comparações e benchmarks, nos referimos ao nossoTabela comparativa de CPU.
Cinebench R15 Multi Sustained Load
Cinebench R23: Multi Core | Single Core
Cinebench R20: CPU (Multi Core) | CPU (Single Core)
Cinebench R15: CPU Multi 64Bit | CPU Single 64Bit
Blender: v2.79 BMW27 CPU
7-Zip 18.03: 7z b 4 | 7z b 4 -mmt1
Geekbench 5.5: Multi-Core | Single-Core
HWBOT x265 Benchmark v2.2: 4k Preset
LibreOffice : 20 Documents To PDF
R Benchmark 2.5: Overall mean
| CPU Performance rating | |
| Média da turma Gaming | |
| Média Intel Core i7-12700H | |
| Acer Nitro 5 AN517-55-738R | |
| Asus TUF Gaming F17 FX707Z-HX011W | |
| Acer Nitro 5 AN517-41-R5Z7 | |
| MSI Katana GF76 11UE | |
| Lenovo Legion 5 17ACH6H-82JY0003GE | |
| Schenker XMG Core 17 (Early 2021) | |
| Cinebench R23 / Multi Core | |
| Média da turma Gaming (10488 - 40970, n=112, últimos 2 anos) | |
| Média Intel Core i7-12700H (4032 - 19330, n=64) | |
| Asus TUF Gaming F17 FX707Z-HX011W | |
| Acer Nitro 5 AN517-55-738R | |
| Acer Nitro 5 AN517-41-R5Z7 | |
| MSI Katana GF76 11UE | |
| Lenovo Legion 5 17ACH6H-82JY0003GE | |
| Schenker XMG Core 17 (Early 2021) | |
| Cinebench R23 / Single Core | |
| Média da turma Gaming (1166 - 2356, n=112, últimos 2 anos) | |
| Acer Nitro 5 AN517-55-738R | |
| Asus TUF Gaming F17 FX707Z-HX011W | |
| Média Intel Core i7-12700H (778 - 1826, n=63) | |
| MSI Katana GF76 11UE | |
| Acer Nitro 5 AN517-41-R5Z7 | |
| Lenovo Legion 5 17ACH6H-82JY0003GE | |
| Schenker XMG Core 17 (Early 2021) | |
| Cinebench R20 / CPU (Multi Core) | |
| Média da turma Gaming (4029 - 16108, n=111, últimos 2 anos) | |
| Acer Nitro 5 AN517-55-738R | |
| Média Intel Core i7-12700H (1576 - 7407, n=64) | |
| Asus TUF Gaming F17 FX707Z-HX011W | |
| Acer Nitro 5 AN517-41-R5Z7 | |
| MSI Katana GF76 11UE | |
| Lenovo Legion 5 17ACH6H-82JY0003GE | |
| Schenker XMG Core 17 (Early 2021) | |
| Cinebench R20 / CPU (Single Core) | |
| Média da turma Gaming (442 - 895, n=111, últimos 2 anos) | |
| Acer Nitro 5 AN517-55-738R | |
| Asus TUF Gaming F17 FX707Z-HX011W | |
| Média Intel Core i7-12700H (300 - 704, n=64) | |
| MSI Katana GF76 11UE | |
| Acer Nitro 5 AN517-41-R5Z7 | |
| Lenovo Legion 5 17ACH6H-82JY0003GE | |
| Schenker XMG Core 17 (Early 2021) | |
| Cinebench R15 / CPU Multi 64Bit | |
| Média da turma Gaming (1578 - 6271, n=111, últimos 2 anos) | |
| Asus TUF Gaming F17 FX707Z-HX011W | |
| Média Intel Core i7-12700H (1379 - 2916, n=70) | |
| Acer Nitro 5 AN517-55-738R | |
| Acer Nitro 5 AN517-41-R5Z7 | |
| MSI Katana GF76 11UE | |
| Lenovo Legion 5 17ACH6H-82JY0003GE | |
| Schenker XMG Core 17 (Early 2021) | |
| Cinebench R15 / CPU Single 64Bit | |
| Média da turma Gaming (188.8 - 343, n=111, últimos 2 anos) | |
| Acer Nitro 5 AN517-55-738R | |
| Asus TUF Gaming F17 FX707Z-HX011W | |
| Média Intel Core i7-12700H (113 - 263, n=65) | |
| Acer Nitro 5 AN517-41-R5Z7 | |
| MSI Katana GF76 11UE | |
| Lenovo Legion 5 17ACH6H-82JY0003GE | |
| Schenker XMG Core 17 (Early 2021) | |
| Blender / v2.79 BMW27 CPU | |
| Schenker XMG Core 17 (Early 2021) | |
| Lenovo Legion 5 17ACH6H-82JY0003GE | |
| MSI Katana GF76 11UE | |
| Acer Nitro 5 AN517-41-R5Z7 | |
| Asus TUF Gaming F17 FX707Z-HX011W | |
| Acer Nitro 5 AN517-55-738R | |
| Média Intel Core i7-12700H (168 - 732, n=63) | |
| Média da turma Gaming (80 - 330, n=109, últimos 2 anos) | |
| 7-Zip 18.03 / 7z b 4 | |
| Média da turma Gaming (33491 - 148086, n=110, últimos 2 anos) | |
| Média Intel Core i7-12700H (22844 - 73067, n=63) | |
| Asus TUF Gaming F17 FX707Z-HX011W | |
| Acer Nitro 5 AN517-41-R5Z7 | |
| Acer Nitro 5 AN517-55-738R | |
| Lenovo Legion 5 17ACH6H-82JY0003GE | |
| MSI Katana GF76 11UE | |
| Schenker XMG Core 17 (Early 2021) | |
| 7-Zip 18.03 / 7z b 4 -mmt1 | |
| Média da turma Gaming (4199 - 7436, n=110, últimos 2 anos) | |
| Acer Nitro 5 AN517-55-738R | |
| Média Intel Core i7-12700H (2743 - 5972, n=63) | |
| Acer Nitro 5 AN517-41-R5Z7 | |
| Asus TUF Gaming F17 FX707Z-HX011W | |
| MSI Katana GF76 11UE | |
| Schenker XMG Core 17 (Early 2021) | |
| Lenovo Legion 5 17ACH6H-82JY0003GE | |
| Geekbench 5.5 / Multi-Core | |
| Média da turma Gaming (6460 - 27010, n=110, últimos 2 anos) | |
| Acer Nitro 5 AN517-55-738R | |
| Asus TUF Gaming F17 FX707Z-HX011W | |
| Média Intel Core i7-12700H (5144 - 13745, n=64) | |
| MSI Katana GF76 11UE | |
| Acer Nitro 5 AN517-41-R5Z7 | |
| Schenker XMG Core 17 (Early 2021) | |
| Lenovo Legion 5 17ACH6H-82JY0003GE | |
| Geekbench 5.5 / Single-Core | |
| Média da turma Gaming (986 - 2474, n=110, últimos 2 anos) | |
| Asus TUF Gaming F17 FX707Z-HX011W | |
| Média Intel Core i7-12700H (803 - 1851, n=64) | |
| Acer Nitro 5 AN517-55-738R | |
| MSI Katana GF76 11UE | |
| Acer Nitro 5 AN517-41-R5Z7 | |
| Lenovo Legion 5 17ACH6H-82JY0003GE | |
| Schenker XMG Core 17 (Early 2021) | |
| HWBOT x265 Benchmark v2.2 / 4k Preset | |
| Média da turma Gaming (11.5 - 44.3, n=110, últimos 2 anos) | |
| Média Intel Core i7-12700H (4.67 - 21.8, n=64) | |
| Acer Nitro 5 AN517-41-R5Z7 | |
| Asus TUF Gaming F17 FX707Z-HX011W | |
| MSI Katana GF76 11UE | |
| Lenovo Legion 5 17ACH6H-82JY0003GE | |
| Schenker XMG Core 17 (Early 2021) | |
| Acer Nitro 5 AN517-55-738R | |
| LibreOffice / 20 Documents To PDF | |
| Asus TUF Gaming F17 FX707Z-HX011W | |
| Acer Nitro 5 AN517-41-R5Z7 | |
| Schenker XMG Core 17 (Early 2021) | |
| Lenovo Legion 5 17ACH6H-82JY0003GE | |
| Acer Nitro 5 AN517-55-738R | |
| Média da turma Gaming (19 - 88.8, n=110, últimos 2 anos) | |
| MSI Katana GF76 11UE | |
| Média Intel Core i7-12700H (34.2 - 95.3, n=63) | |
| R Benchmark 2.5 / Overall mean | |
| Schenker XMG Core 17 (Early 2021) | |
| MSI Katana GF76 11UE | |
| Lenovo Legion 5 17ACH6H-82JY0003GE | |
| Acer Nitro 5 AN517-41-R5Z7 | |
| Média Intel Core i7-12700H (0.4441 - 1.052, n=63) | |
| Acer Nitro 5 AN517-55-738R | |
| Asus TUF Gaming F17 FX707Z-HX011W | |
| Média da turma Gaming (0.3439 - 0.759, n=111, últimos 2 anos) | |
* ... menor é melhor
AIDA64: FP32 Ray-Trace | FPU Julia | CPU SHA3 | CPU Queen | FPU SinJulia | FPU Mandel | CPU AES | CPU ZLib | FP64 Ray-Trace | CPU PhotoWorxx
| Performance rating | |
| Média da turma Gaming | |
| Acer Nitro 5 AN517-41-R5Z7 | |
| Média Intel Core i7-12700H | |
| Lenovo Legion 5 17ACH6H-82JY0003GE | |
| Acer Nitro 5 AN517-55-738R | |
| Asus TUF Gaming F17 FX707Z-HX011W | |
| Schenker XMG Core 17 (Early 2021) | |
| MSI Katana GF76 11UE -9! | |
| AIDA64 / FP32 Ray-Trace | |
| Média da turma Gaming (10227 - 85542, n=109, últimos 2 anos) | |
| Acer Nitro 5 AN517-41-R5Z7 | |
| Lenovo Legion 5 17ACH6H-82JY0003GE | |
| Média Intel Core i7-12700H (2585 - 17957, n=64) | |
| Schenker XMG Core 17 (Early 2021) | |
| Acer Nitro 5 AN517-55-738R | |
| Asus TUF Gaming F17 FX707Z-HX011W | |
| AIDA64 / FPU Julia | |
| Média da turma Gaming (51376 - 238426, n=109, últimos 2 anos) | |
| Acer Nitro 5 AN517-41-R5Z7 | |
| Lenovo Legion 5 17ACH6H-82JY0003GE | |
| Média Intel Core i7-12700H (12439 - 90760, n=64) | |
| Schenker XMG Core 17 (Early 2021) | |
| Acer Nitro 5 AN517-55-738R | |
| Asus TUF Gaming F17 FX707Z-HX011W | |
| AIDA64 / CPU SHA3 | |
| Média da turma Gaming (2180 - 9817, n=109, últimos 2 anos) | |
| Acer Nitro 5 AN517-41-R5Z7 | |
| Média Intel Core i7-12700H (833 - 4242, n=64) | |
| Acer Nitro 5 AN517-55-738R | |
| Lenovo Legion 5 17ACH6H-82JY0003GE | |
| Schenker XMG Core 17 (Early 2021) | |
| Asus TUF Gaming F17 FX707Z-HX011W | |
| AIDA64 / CPU Queen | |
| Média da turma Gaming (49785 - 173351, n=100, últimos 2 anos) | |
| Asus TUF Gaming F17 FX707Z-HX011W | |
| Acer Nitro 5 AN517-55-738R | |
| Acer Nitro 5 AN517-41-R5Z7 | |
| Média Intel Core i7-12700H (57923 - 103202, n=63) | |
| Lenovo Legion 5 17ACH6H-82JY0003GE | |
| Schenker XMG Core 17 (Early 2021) | |
| AIDA64 / FPU SinJulia | |
| Média da turma Gaming (4424 - 33636, n=109, últimos 2 anos) | |
| Acer Nitro 5 AN517-41-R5Z7 | |
| Lenovo Legion 5 17ACH6H-82JY0003GE | |
| Acer Nitro 5 AN517-55-738R | |
| Média Intel Core i7-12700H (3249 - 9939, n=64) | |
| Schenker XMG Core 17 (Early 2021) | |
| Asus TUF Gaming F17 FX707Z-HX011W | |
| AIDA64 / FPU Mandel | |
| Média da turma Gaming (25115 - 128721, n=109, últimos 2 anos) | |
| Acer Nitro 5 AN517-41-R5Z7 | |
| Lenovo Legion 5 17ACH6H-82JY0003GE | |
| Média Intel Core i7-12700H (7135 - 44760, n=64) | |
| Schenker XMG Core 17 (Early 2021) | |
| Acer Nitro 5 AN517-55-738R | |
| Asus TUF Gaming F17 FX707Z-HX011W | |
| AIDA64 / CPU AES | |
| Acer Nitro 5 AN517-41-R5Z7 | |
| Média da turma Gaming (39258 - 247074, n=109, últimos 2 anos) | |
| Lenovo Legion 5 17ACH6H-82JY0003GE | |
| Média Intel Core i7-12700H (31839 - 144360, n=64) | |
| Acer Nitro 5 AN517-55-738R | |
| Asus TUF Gaming F17 FX707Z-HX011W | |
| Schenker XMG Core 17 (Early 2021) | |
| AIDA64 / CPU ZLib | |
| Média da turma Gaming (574 - 2531, n=109, últimos 2 anos) | |
| Média Intel Core i7-12700H (305 - 1171, n=64) | |
| Acer Nitro 5 AN517-55-738R | |
| Acer Nitro 5 AN517-41-R5Z7 | |
| Asus TUF Gaming F17 FX707Z-HX011W | |
| Lenovo Legion 5 17ACH6H-82JY0003GE | |
| Schenker XMG Core 17 (Early 2021) | |
| MSI Katana GF76 11UE | |
| AIDA64 / FP64 Ray-Trace | |
| Média da turma Gaming (5509 - 45446, n=109, últimos 2 anos) | |
| Acer Nitro 5 AN517-41-R5Z7 | |
| Lenovo Legion 5 17ACH6H-82JY0003GE | |
| Média Intel Core i7-12700H (1437 - 9692, n=64) | |
| Schenker XMG Core 17 (Early 2021) | |
| Acer Nitro 5 AN517-55-738R | |
| Asus TUF Gaming F17 FX707Z-HX011W | |
| AIDA64 / CPU PhotoWorxx | |
| Média da turma Gaming (12271 - 89891, n=109, últimos 2 anos) | |
| Média Intel Core i7-12700H (12863 - 52207, n=64) | |
| Asus TUF Gaming F17 FX707Z-HX011W | |
| Schenker XMG Core 17 (Early 2021) | |
| Acer Nitro 5 AN517-55-738R | |
| Lenovo Legion 5 17ACH6H-82JY0003GE | |
| Acer Nitro 5 AN517-41-R5Z7 | |
Desempenho do sistema
Em termos de desempenho do sistema, o Acer Nitro 5 AN517 continua a partir de seu sólido desempenho nos benchmarks de CPU e garante por pouco o segundo lugar no PCMark 10. Em geral, o Acer Nitro 5 AN517 representa muito bem a média da classe de todos os laptops de jogos testados. Subjetivamente, os valores de desempenho dados também correspondem ao hardware instalado.
CrossMark: Overall | Productivity | Creativity | Responsiveness
| PCMark 10 / Score | |
| Média da turma Gaming (5828 - 11574, n=95, últimos 2 anos) | |
| Média Intel Core i7-12700H, NVIDIA GeForce RTX 3060 Laptop GPU (5986 - 8156, n=12) | |
| Acer Nitro 5 AN517-41-R5Z7 | |
| Acer Nitro 5 AN517-55-738R | |
| Lenovo Legion 5 17ACH6H-82JY0003GE | |
| MSI Katana GF76 11UE | |
| Asus TUF Gaming F17 FX707Z-HX011W | |
| Schenker XMG Core 17 (Early 2021) | |
| PCMark 10 / Essentials | |
| Média da turma Gaming (8810 - 12600, n=99, últimos 2 anos) | |
| Média Intel Core i7-12700H, NVIDIA GeForce RTX 3060 Laptop GPU (9289 - 12144, n=12) | |
| Acer Nitro 5 AN517-41-R5Z7 | |
| Acer Nitro 5 AN517-55-738R | |
| MSI Katana GF76 11UE | |
| Lenovo Legion 5 17ACH6H-82JY0003GE | |
| Asus TUF Gaming F17 FX707Z-HX011W | |
| Schenker XMG Core 17 (Early 2021) | |
| PCMark 10 / Productivity | |
| Média da turma Gaming (6845 - 18766, n=97, últimos 2 anos) | |
| Acer Nitro 5 AN517-41-R5Z7 | |
| Média Intel Core i7-12700H, NVIDIA GeForce RTX 3060 Laptop GPU (6161 - 10362, n=12) | |
| Acer Nitro 5 AN517-55-738R | |
| Lenovo Legion 5 17ACH6H-82JY0003GE | |
| MSI Katana GF76 11UE | |
| Schenker XMG Core 17 (Early 2021) | |
| Asus TUF Gaming F17 FX707Z-HX011W | |
| PCMark 10 / Digital Content Creation | |
| Média da turma Gaming (7602 - 19657, n=97, últimos 2 anos) | |
| Média Intel Core i7-12700H, NVIDIA GeForce RTX 3060 Laptop GPU (8950 - 12554, n=12) | |
| Asus TUF Gaming F17 FX707Z-HX011W | |
| Lenovo Legion 5 17ACH6H-82JY0003GE | |
| Acer Nitro 5 AN517-55-738R | |
| Acer Nitro 5 AN517-41-R5Z7 | |
| MSI Katana GF76 11UE | |
| Schenker XMG Core 17 (Early 2021) | |
| CrossMark / Overall | |
| Média da turma Gaming (1366 - 2409, n=97, últimos 2 anos) | |
| Acer Nitro 5 AN517-55-738R | |
| Média Intel Core i7-12700H, NVIDIA GeForce RTX 3060 Laptop GPU (1649 - 2017, n=11) | |
| Asus TUF Gaming F17 FX707Z-HX011W | |
| Lenovo Legion 5 17ACH6H-82JY0003GE | |
| CrossMark / Productivity | |
| Média da turma Gaming (1386 - 2254, n=97, últimos 2 anos) | |
| Acer Nitro 5 AN517-55-738R | |
| Média Intel Core i7-12700H, NVIDIA GeForce RTX 3060 Laptop GPU (1536 - 1958, n=11) | |
| Asus TUF Gaming F17 FX707Z-HX011W | |
| Lenovo Legion 5 17ACH6H-82JY0003GE | |
| CrossMark / Creativity | |
| Média da turma Gaming (1343 - 2729, n=97, últimos 2 anos) | |
| Asus TUF Gaming F17 FX707Z-HX011W | |
| Média Intel Core i7-12700H, NVIDIA GeForce RTX 3060 Laptop GPU (1816 - 2084, n=11) | |
| Acer Nitro 5 AN517-55-738R | |
| Lenovo Legion 5 17ACH6H-82JY0003GE | |
| CrossMark / Responsiveness | |
| Acer Nitro 5 AN517-55-738R | |
| Média da turma Gaming (1226 - 2334, n=97, últimos 2 anos) | |
| Média Intel Core i7-12700H, NVIDIA GeForce RTX 3060 Laptop GPU (1210 - 2207, n=11) | |
| Asus TUF Gaming F17 FX707Z-HX011W | |
| Lenovo Legion 5 17ACH6H-82JY0003GE | |
| PCMark 10 Score | 6651 pontos | |
Ajuda | ||
| AIDA64 / Memory Copy | |
| Média da turma Gaming (21750 - 129946, n=109, últimos 2 anos) | |
| Média Intel Core i7-12700H (25615 - 80511, n=64) | |
| Asus TUF Gaming F17 FX707Z-HX011W | |
| Acer Nitro 5 AN517-55-738R | |
| Lenovo Legion 5 17ACH6H-82JY0003GE | |
| Acer Nitro 5 AN517-41-R5Z7 | |
| Schenker XMG Core 17 (Early 2021) | |
| AIDA64 / Memory Read | |
| Média da turma Gaming (22956 - 118858, n=109, últimos 2 anos) | |
| Asus TUF Gaming F17 FX707Z-HX011W | |
| Média Intel Core i7-12700H (25586 - 79442, n=64) | |
| Lenovo Legion 5 17ACH6H-82JY0003GE | |
| Acer Nitro 5 AN517-41-R5Z7 | |
| Acer Nitro 5 AN517-55-738R | |
| Schenker XMG Core 17 (Early 2021) | |
| AIDA64 / Memory Write | |
| Média da turma Gaming (22297 - 135096, n=109, últimos 2 anos) | |
| Asus TUF Gaming F17 FX707Z-HX011W | |
| Média Intel Core i7-12700H (23679 - 88660, n=64) | |
| Acer Nitro 5 AN517-55-738R | |
| Schenker XMG Core 17 (Early 2021) | |
| Lenovo Legion 5 17ACH6H-82JY0003GE | |
| Acer Nitro 5 AN517-41-R5Z7 | |
| AIDA64 / Memory Latency | |
| Média da turma Gaming (75.3 - 259, n=109, últimos 2 anos) | |
| Lenovo Legion 5 17ACH6H-82JY0003GE | |
| Média Intel Core i7-12700H (76.2 - 133.9, n=62) | |
| Acer Nitro 5 AN517-41-R5Z7 | |
| Schenker XMG Core 17 (Early 2021) | |
| MSI Katana GF76 11UE | |
| Asus TUF Gaming F17 FX707Z-HX011W | |
| Acer Nitro 5 AN517-55-738R | |
* ... menor é melhor
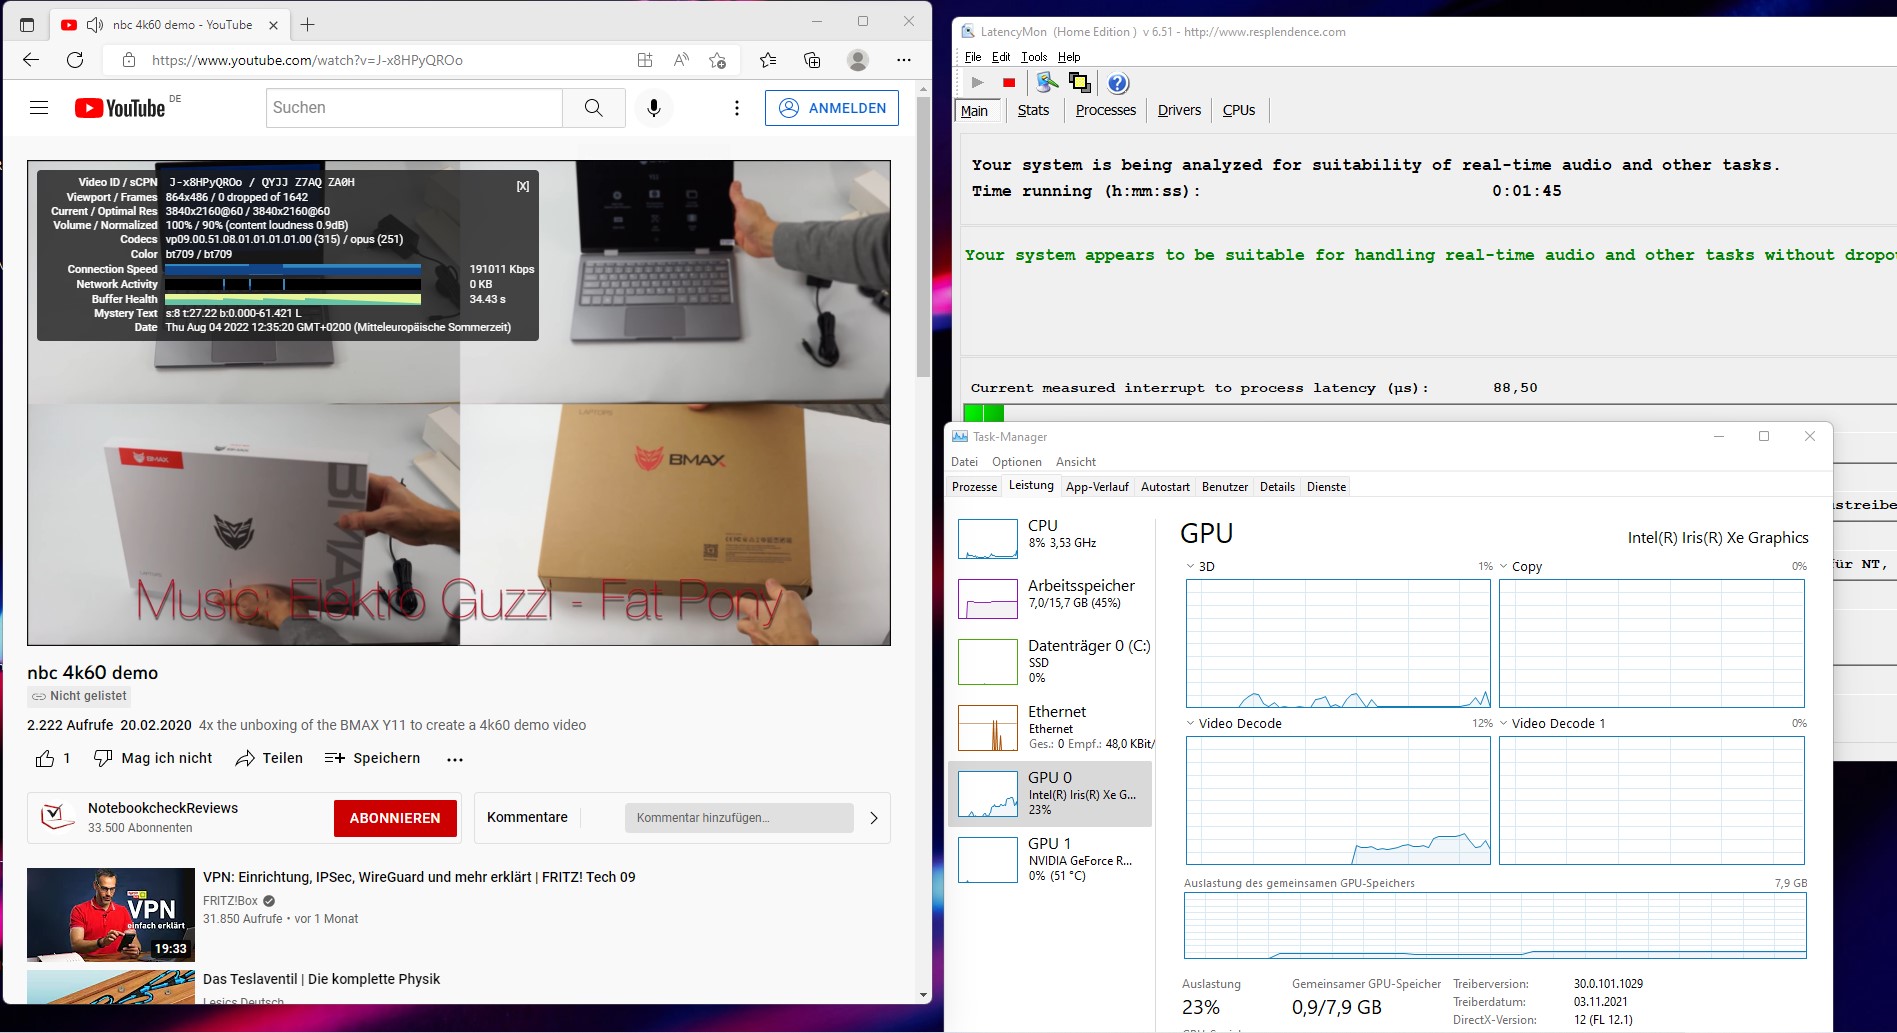
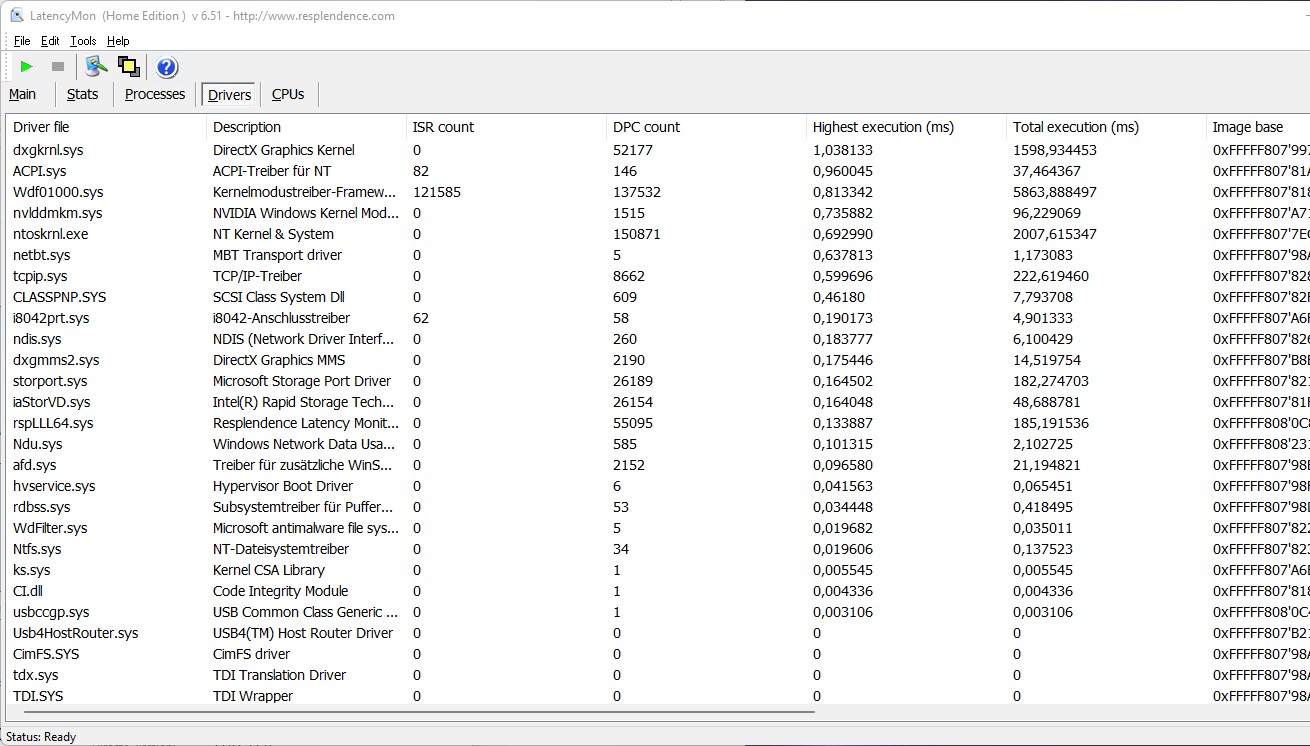
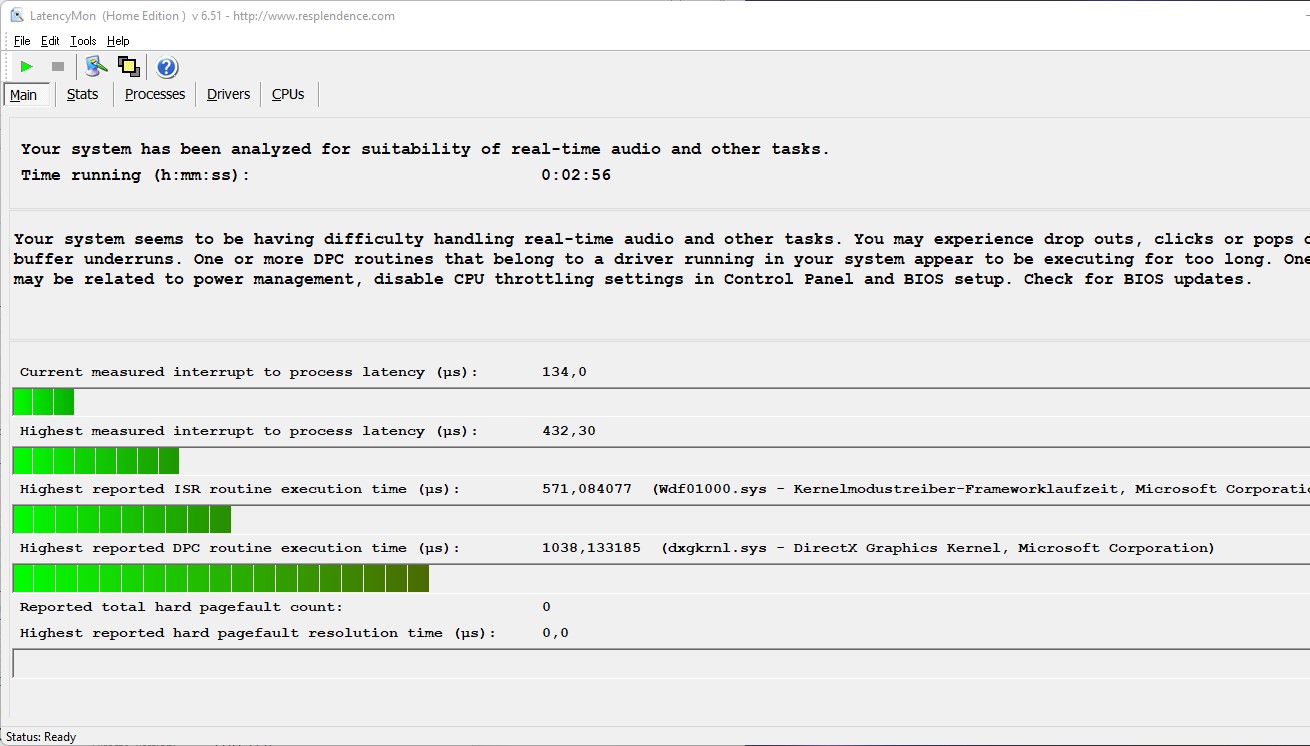
Latência do DPC
A Acer tem as latências DPC bastante sob controle no Nitro 5 AN517. Elas aumentaram apenas ligeiramente durante o teste de estresse Prime95. Não houve nenhum problema ou fotogramas pulados durante a reprodução do vídeo do 4K YouTube. O iGPU do SoC é utilizado em cerca de 25% durante a reprodução.
| DPC Latencies / LatencyMon - interrupt to process latency (max), Web, Youtube, Prime95 | |
| MSI Katana GF76 11UE | |
| Asus TUF Gaming F17 FX707Z-HX011W | |
| Lenovo Legion 5 17ACH6H-82JY0003GE | |
| Acer Nitro 5 AN517-41-R5Z7 | |
| Acer Nitro 5 AN517-55-738R | |
| Schenker XMG Core 17 (Early 2021) | |
* ... menor é melhor
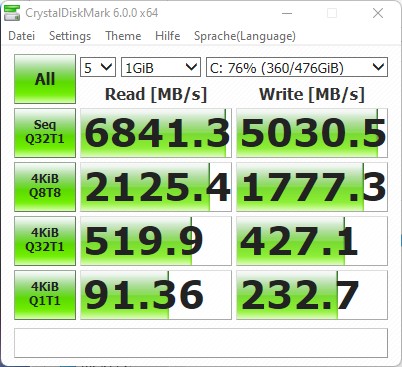
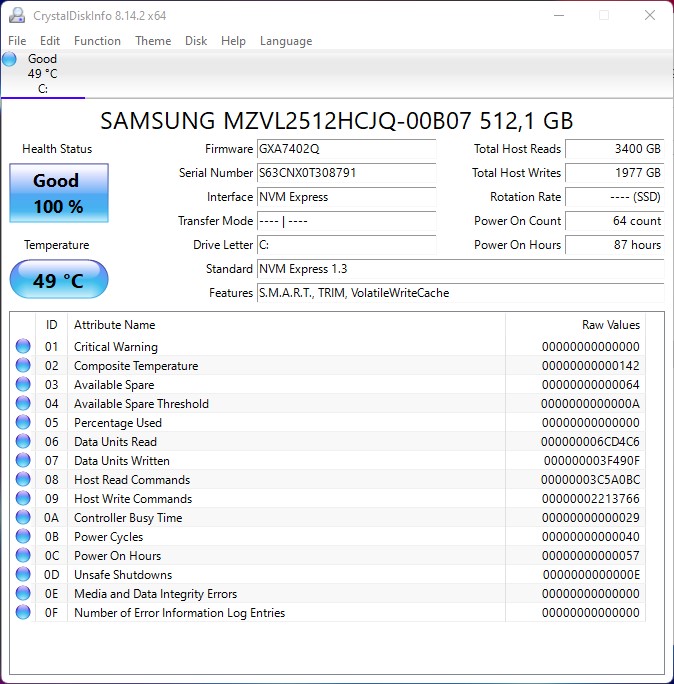
Dispositivos de armazenamento
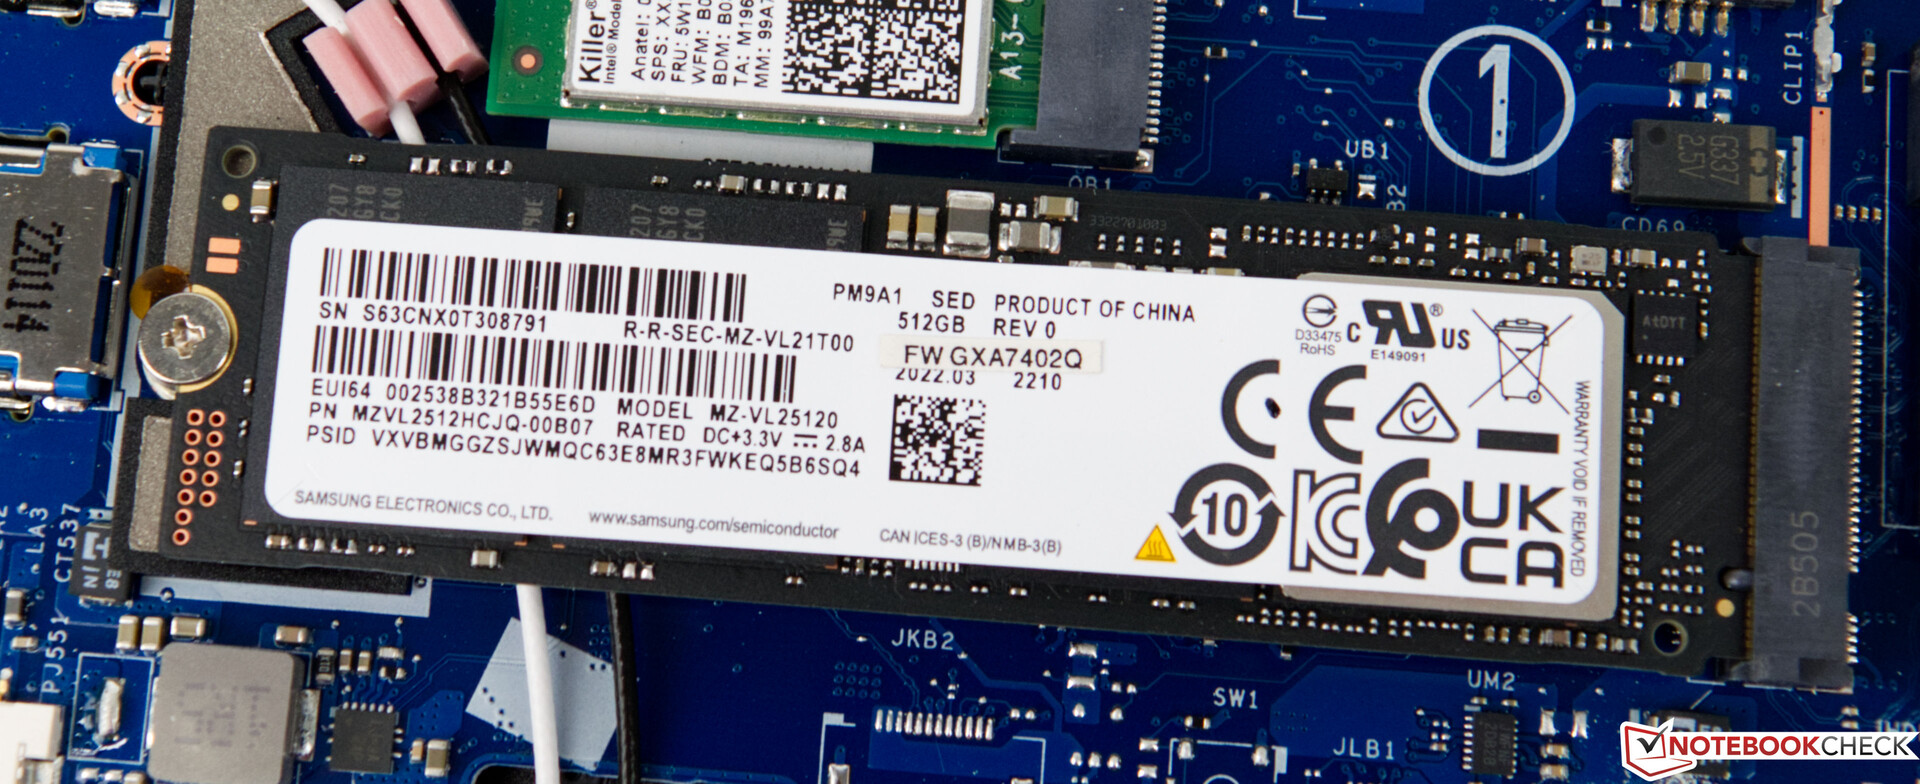
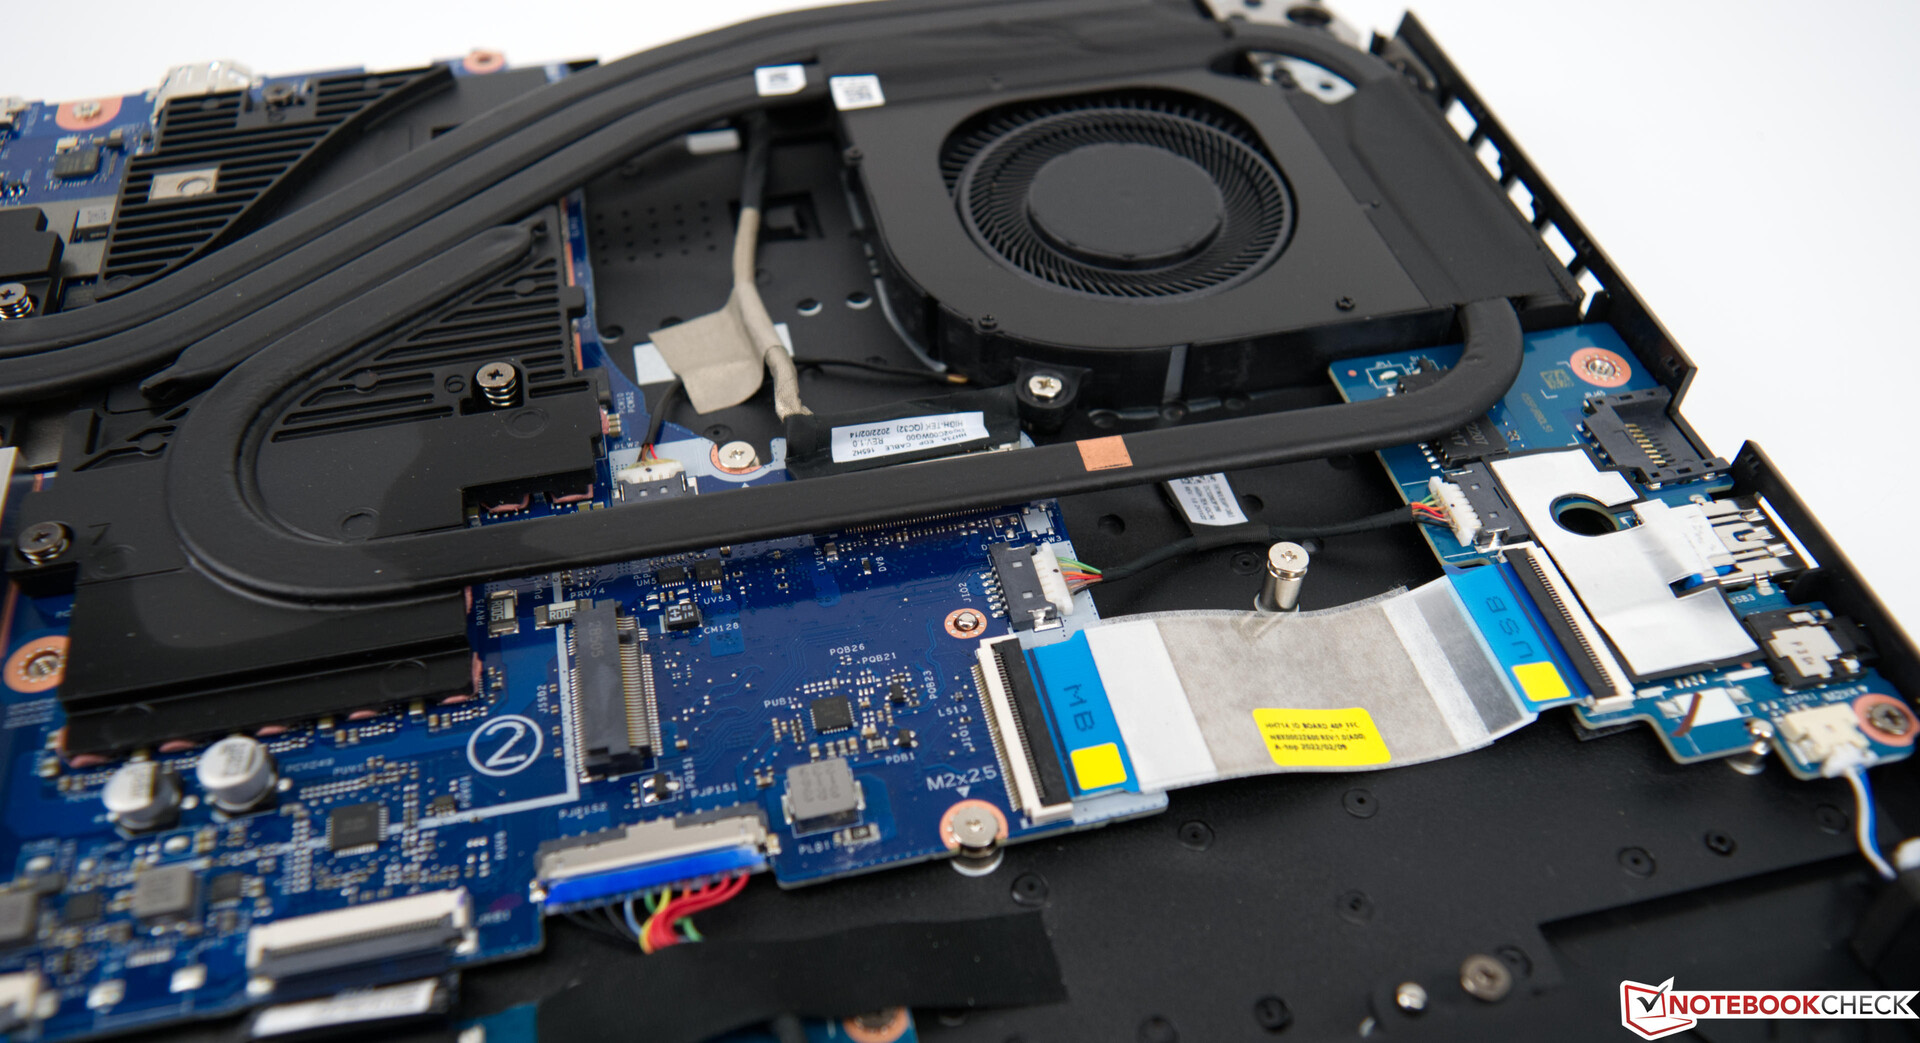
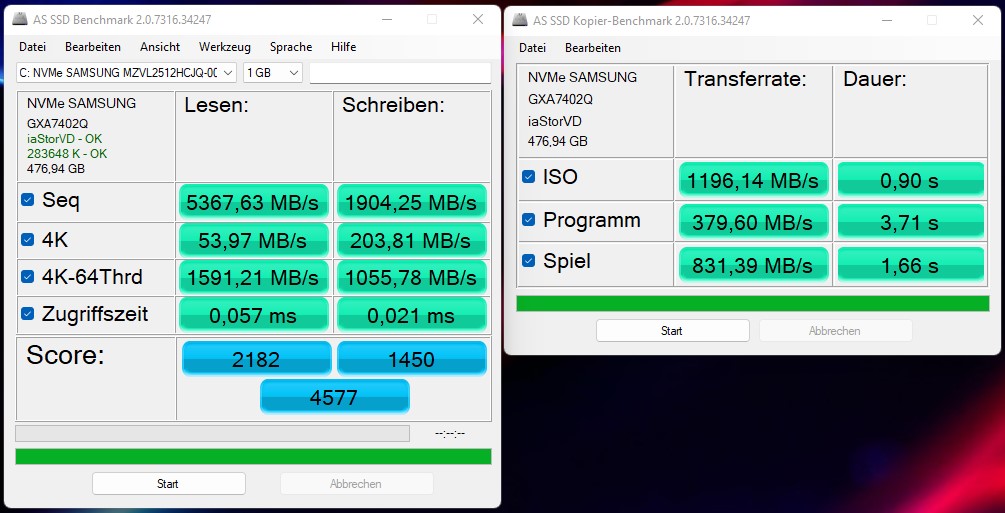
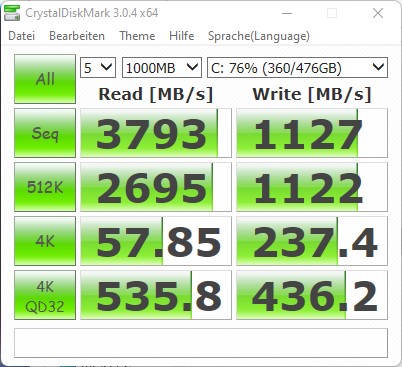
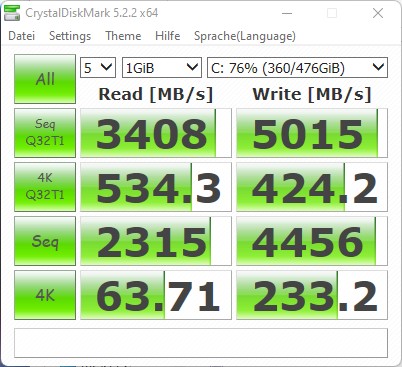
O SSD usado no Acer Nitro 5 AN517 é um modelo Samsung, que suporta PCIe 4.0 e, portanto, oferece valores de desempenho muito bons sob teste. Apenas o tamanho de armazenamento é um pouco pequeno demais, considerando a área de aplicação (jogos). Um modelo com pelo menos 1 TB seria melhor. Felizmente, um slot M.2 gratuito ainda está disponível.
Para mais comparações e benchmarks, nos referimos ao nosso tabela comparativa.

* ... menor é melhor
Sustained Performance Read: DiskSpd Read Loop, Queue Depth 8
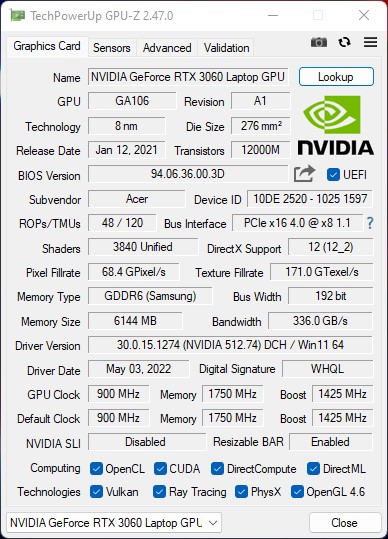
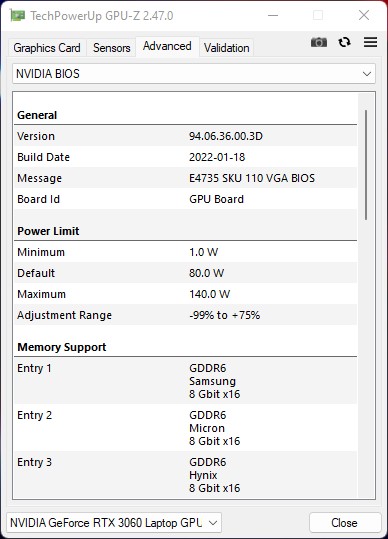
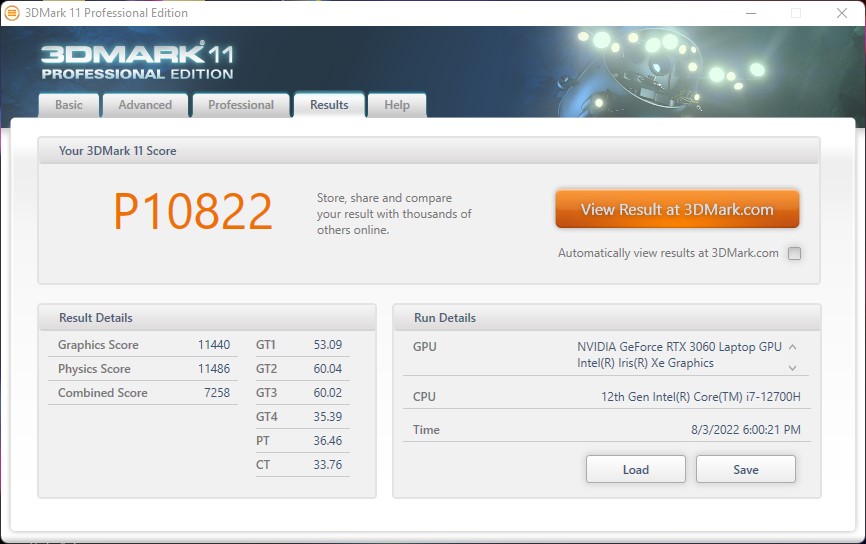
Placa Gráfica
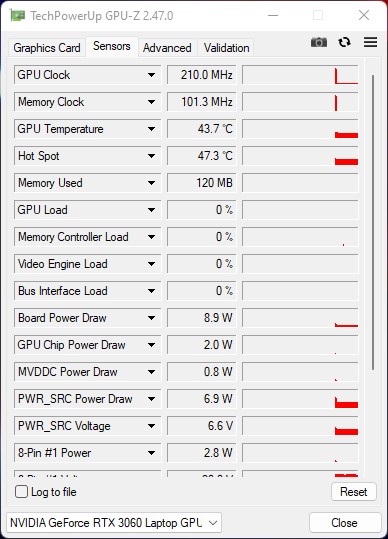
Uma GPU para laptop Nvidia GeForce RTX 3060 é usada como placa gráfica, oferecendo um desempenho sólido no Acer Nitro 5 AN517 e caindo entre o Asus TUF Gaming F17 e o Schenker XMG Core17 em nossos gráficos. Como a faixa de desempenho varia de 80 a 130 watts devido ao TDP configurável, há ocasionalmente diferenças significativas de desempenho aqui. Sob carga, registramos pouco menos de 100 watts para a placa gráfica dedicada no Nitro 5 AN517 da Acer. Como o laptop também tem um iGPU, o sistema economiza muita energia no modo 2D. A troca entre os dois adaptadores gráficos funciona sem falhas.
Para mais comparações e benchmarks, nos referimos ao nossoGTabela de comparação PU.
| 3DMark 05 Standard | 48758 pontos | |
| 3DMark 06 Standard Score | 48609 pontos | |
| 3DMark Vantage P Result | 57333 pontos | |
| 3DMark 11 Performance | 20105 pontos | |
| 3DMark Ice Storm Standard Score | 119349 pontos | |
| 3DMark Cloud Gate Standard Score | 34496 pontos | |
| 3DMark Fire Strike Score | 17369 pontos | |
| 3DMark Fire Strike Extreme Score | 9418 pontos | |
| 3DMark Time Spy Score | 7847 pontos | |
Ajuda | ||
Desempenho nos jogos
Em termos de desempenho de jogos, o Acer Nitro 5 AN517 está atrás do Asus TUF Gaming F17. Mas esta lacuna se fecha com o aumento da carga, por exemplo, no The Witcher 3, de modo que ambos os dispositivos têm aproximadamente os mesmos valores de desempenho no final. Nossa amostra de revisão é capaz de ter um bom desempenho nos jogos atuais, funcionando bem acima de 60 fps na maior parte do tempo.
| F1 2020 | |
| 1920x1080 High Preset AA:T AF:16x | |
| Lenovo Legion 5 17ACH6H-82JY0003GE | |
| Média NVIDIA GeForce RTX 3060 Laptop GPU (138 - 193, n=7) | |
| MSI Katana GF76 11UE | |
| Acer Nitro 5 AN517-55-738R | |
| 1920x1080 Ultra High Preset AA:T AF:16x | |
| Lenovo Legion 5 17ACH6H-82JY0003GE | |
| Acer Nitro 5 AN517-55-738R | |
| Média NVIDIA GeForce RTX 3060 Laptop GPU (97.6 - 142, n=7) | |
| MSI Katana GF76 11UE | |
| F1 2021 | |
| 1920x1080 High Preset AA:T AF:16x | |
| Lenovo Legion 5 17ACH6H-82JY0003GE | |
| Média NVIDIA GeForce RTX 3060 Laptop GPU (119 - 227, n=9) | |
| Acer Nitro 5 AN517-55-738R | |
| 1920x1080 Ultra High Preset + Raytracing AA:T AF:16x | |
| Lenovo Legion 5 17ACH6H-82JY0003GE | |
| Acer Nitro 5 AN517-55-738R | |
| Média NVIDIA GeForce RTX 3060 Laptop GPU (67 - 112.8, n=9) | |
O teste de estresse, para o qual fizemos o The Witcher 3 em Ultra settings, não mostrou nenhuma queda de desempenho. Portanto, não é de se esperar taxas de quadros não jogáveis durante longos períodos de tempo de jogo.
Witcher 3 FPS Chart
| baixo | média | alto | ultra | |
|---|---|---|---|---|
| GTA V (2015) | 181.4 | 174.1 | 135.1 | 82.5 |
| The Witcher 3 (2015) | 297 | 233 | 154 | 83 |
| Dota 2 Reborn (2015) | 203.9 | 177.4 | 169.2 | 154.7 |
| Final Fantasy XV Benchmark (2018) | 122.5 | 99.6 | 75.7 | |
| X-Plane 11.11 (2018) | 120.1 | 100.9 | 83.5 | |
| Far Cry 5 (2018) | 128 | 102 | 95 | 94 |
| Strange Brigade (2018) | 328 | 204 | 165.5 | 142.9 |
| Far Cry New Dawn (2019) | 115 | 91 | 89 | 82 |
| Metro Exodus (2019) | 154.3 | 96.3 | 74.5 | 59.4 |
| Borderlands 3 (2019) | 133.7 | 107.4 | 84.4 | 69.3 |
| F1 2020 (2020) | 253 | 150 | 144.4 | 132.7 |
| F1 2021 (2021) | 206 | 155.2 | 142.5 | 95.5 |
Emissões - Alto e quente, mas bom tempo de funcionamento da bateria
Ruído do sistema
Estamos acostumados a laptops de jogo barulhentos e muitas vezes apontamos que dispositivos muito potentes também podem ser muito barulhentos. Embora o Acer Nitro 5 AN517 seja silencioso quando ocioso, isto muda rapidamente quando o notebook é colocado em seus passos. Medimos 52,6 dB(A) sob carga média e até 68,2 dB(A) no pico de carga, o que é claramente demais. Estes valores foram determinados com o perfil "Performance", o que nos levou a selecionar o "Modo Padrão" a fim de permitir emissões de ruído razoavelmente toleráveis. Mesmo com um fone de ouvido, o ruído alto do ventilador nem sempre pode ser suprimido. Portanto, simplesmente não podemos recomendar o perfil de desempenho na prática. O Acer Nitro 5 AN517 é de longe o dispositivo mais barulhento de sua classe.
Barulho
| Ocioso |
| 25.5 / 25.5 / 27 dB |
| Carga |
| 52.6 / 68.2 dB |
 | ||
30 dB silencioso 40 dB(A) audível 50 dB(A) ruidosamente alto |
||
min: | ||
| Acer Nitro 5 AN517-55-738R GeForce RTX 3060 Laptop GPU, i7-12700H, Samsung PM9A1 MZVL2512HCJQ | Lenovo Legion 5 17ACH6H-82JY0003GE GeForce RTX 3060 Laptop GPU, R5 5600H, Samsung PM991a MZALQ512HBLU | Asus TUF Gaming F17 FX707Z-HX011W GeForce RTX 3060 Laptop GPU, i7-12700H, SK Hynix HFM001TD3JX013N | Acer Nitro 5 AN517-41-R5Z7 GeForce RTX 3070 Laptop GPU, R7 5800H, SK Hynix BC711 1TB HFM001TD3JX016N | Schenker XMG Core 17 (Early 2021) GeForce RTX 3060 Laptop GPU, i7-10870H, Samsung SSD 970 EVO Plus 1TB | MSI Katana GF76 11UE GeForce RTX 3060 Laptop GPU, i7-11800H, Kingston OM8PCP3512F-AB | |
|---|---|---|---|---|---|---|
| Noise | 8% | 13% | -3% | -9% | -13% | |
| desligado / ambiente * (dB) | 25.5 | 25 2% | 24 6% | 26 -2% | 25 2% | 25 2% |
| Idle Minimum * (dB) | 25.5 | 25 2% | 24 6% | 26 -2% | 30 -18% | 33 -29% |
| Idle Average * (dB) | 25.5 | 25 2% | 24 6% | 33.1 -30% | 32 -25% | 34 -33% |
| Idle Maximum * (dB) | 27 | 30.5 -13% | 24 11% | 31.3 -16% | 36 -33% | 35 -30% |
| Load Average * (dB) | 52.6 | 37.5 29% | 42.6 19% | 49.8 5% | 53 -1% | 53 -1% |
| Load Maximum * (dB) | 68.2 | 51 25% | 46.84 31% | 49.6 27% | 54 21% | 57 16% |
| Witcher 3 ultra * (dB) | 46.84 | 51 | 49 |
* ... menor é melhor
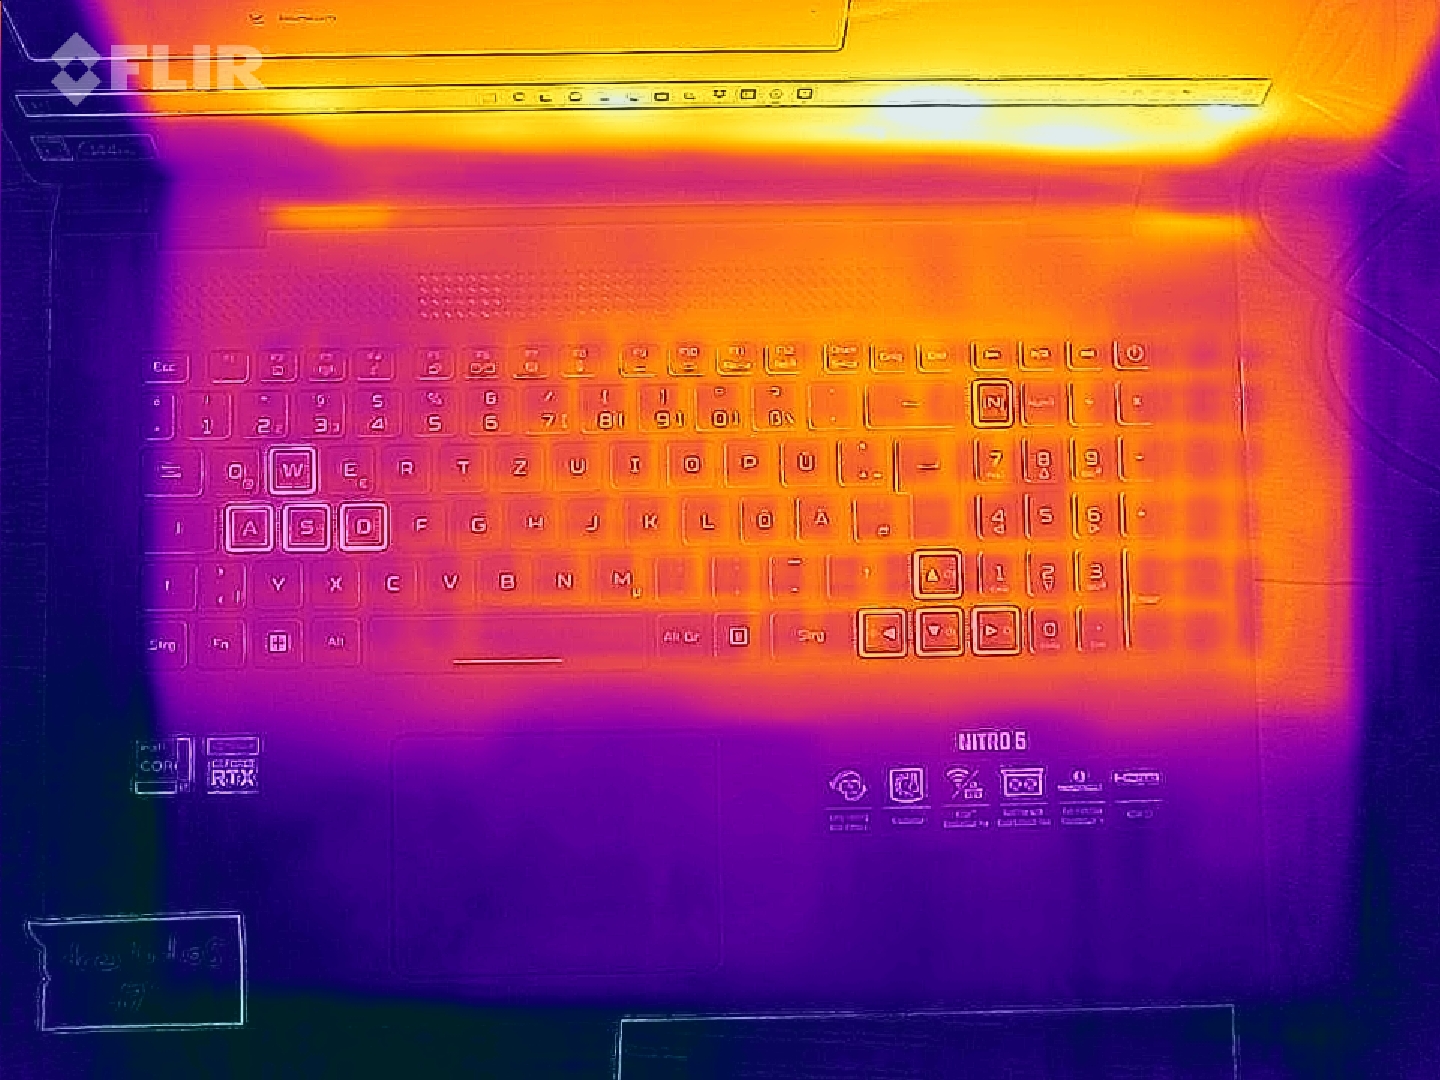
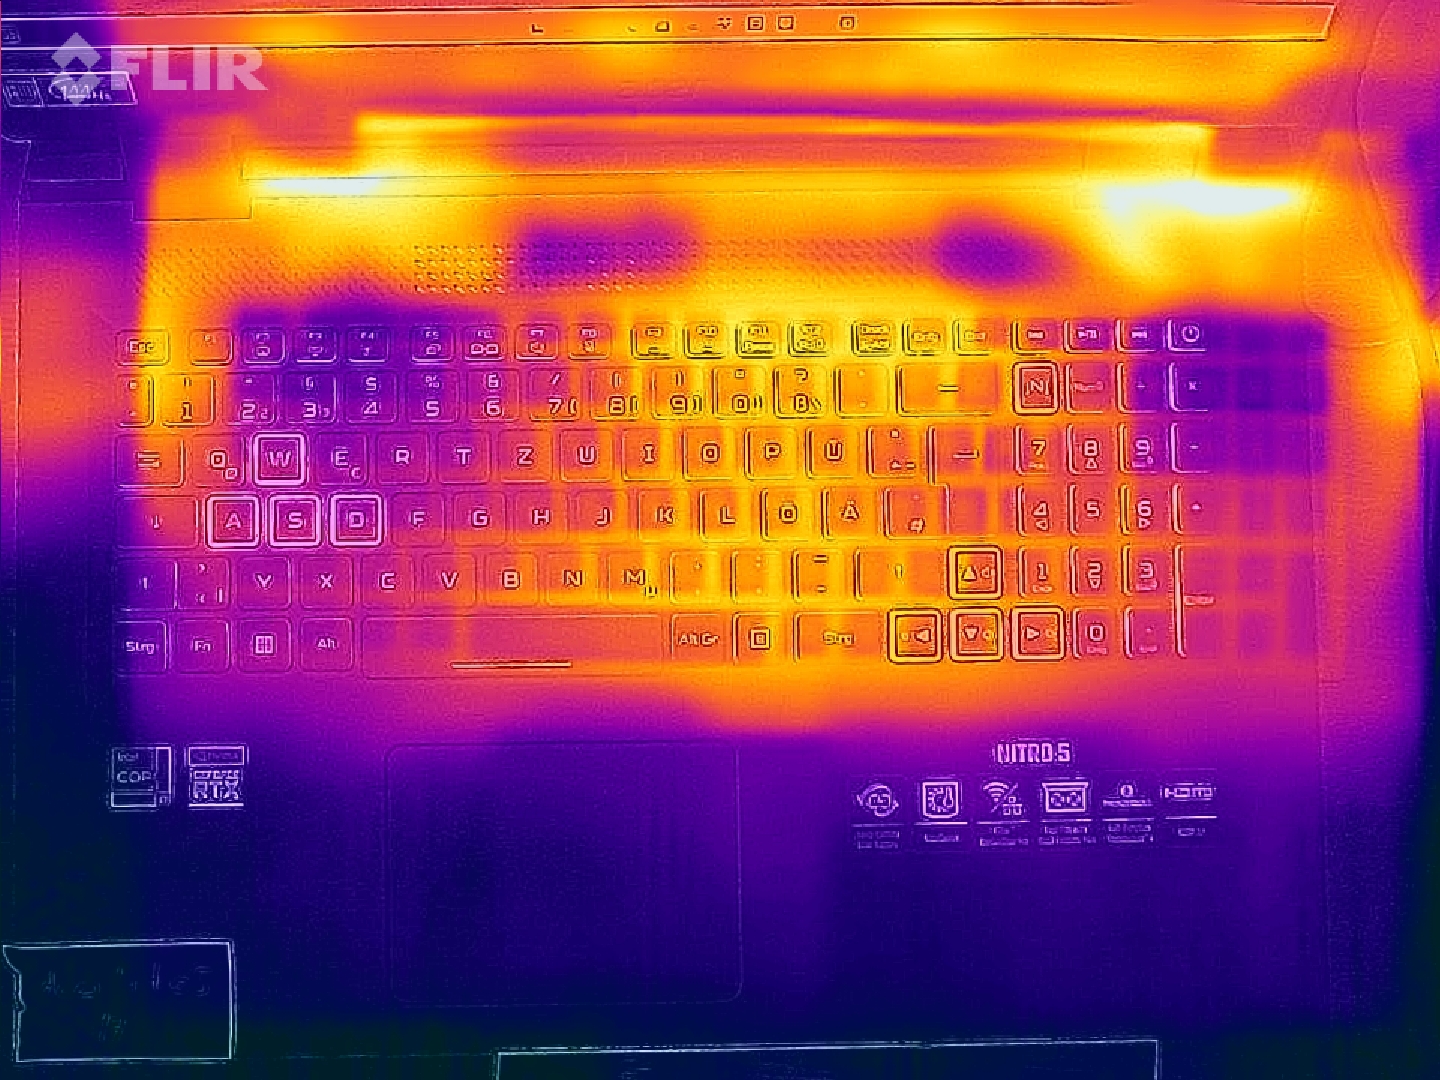
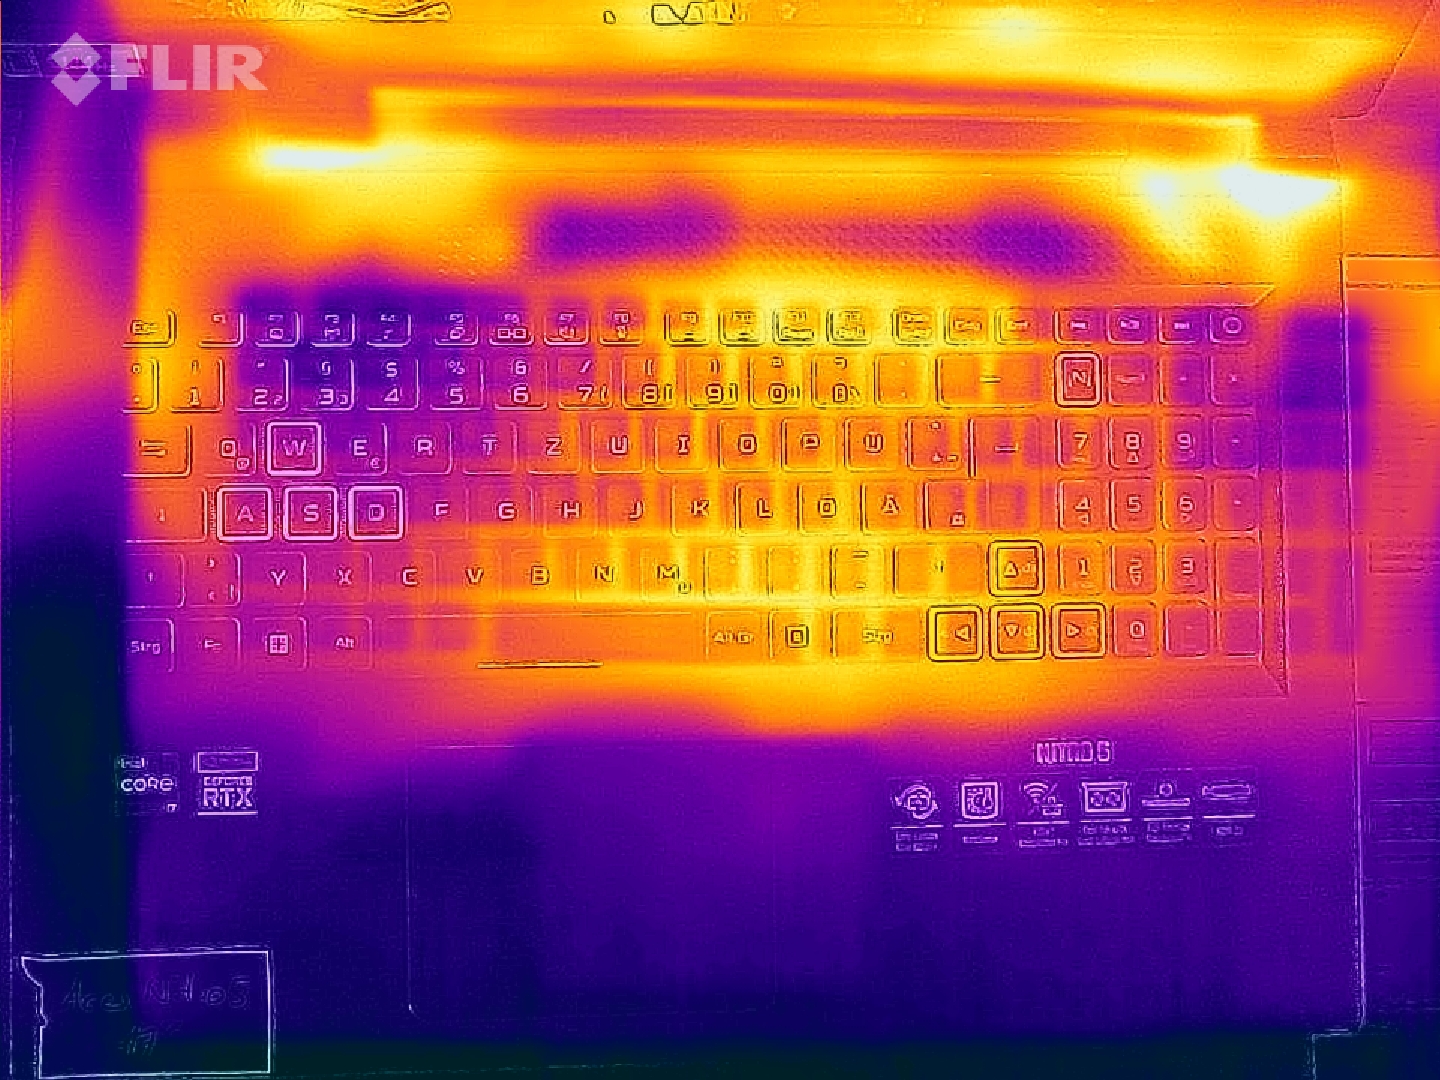
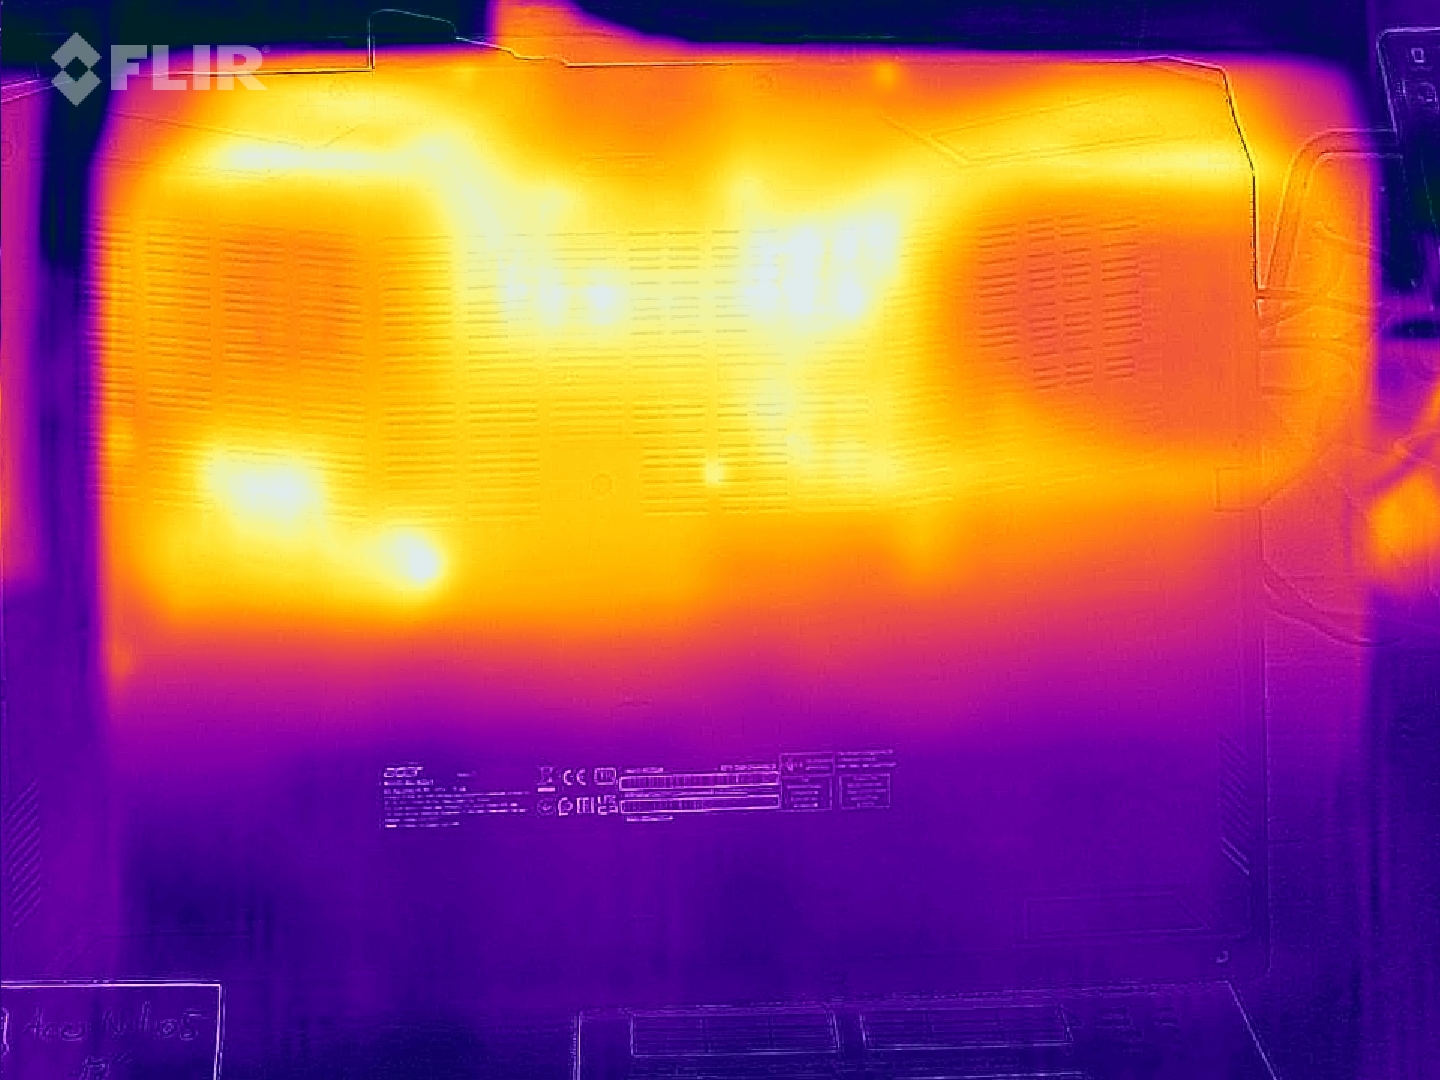
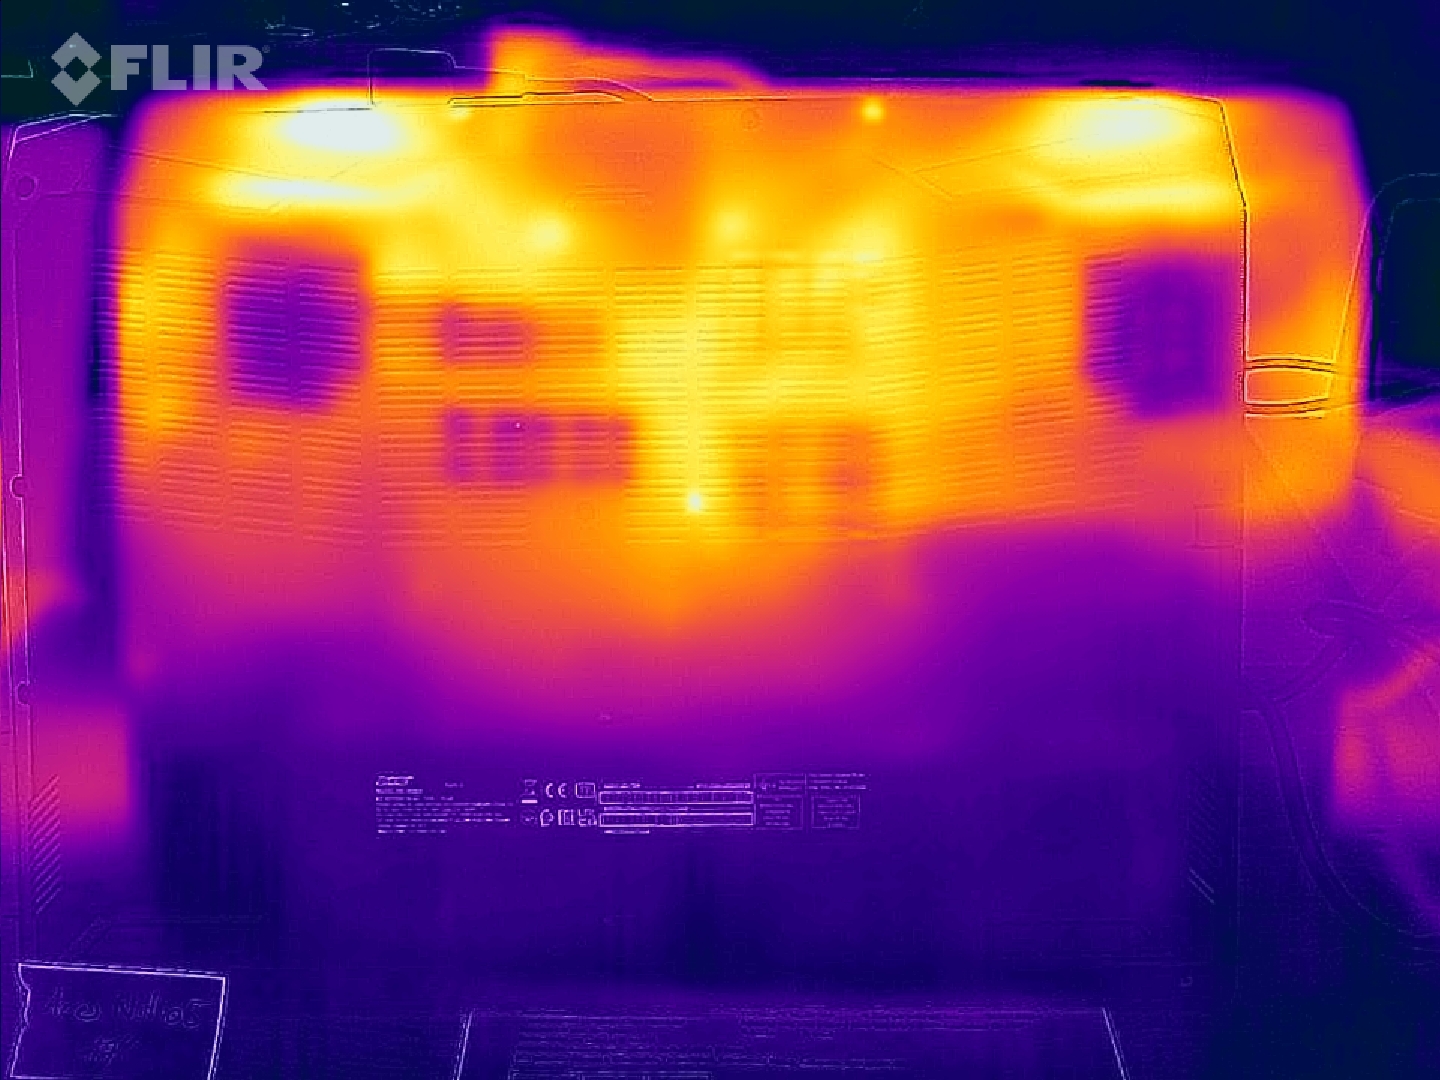
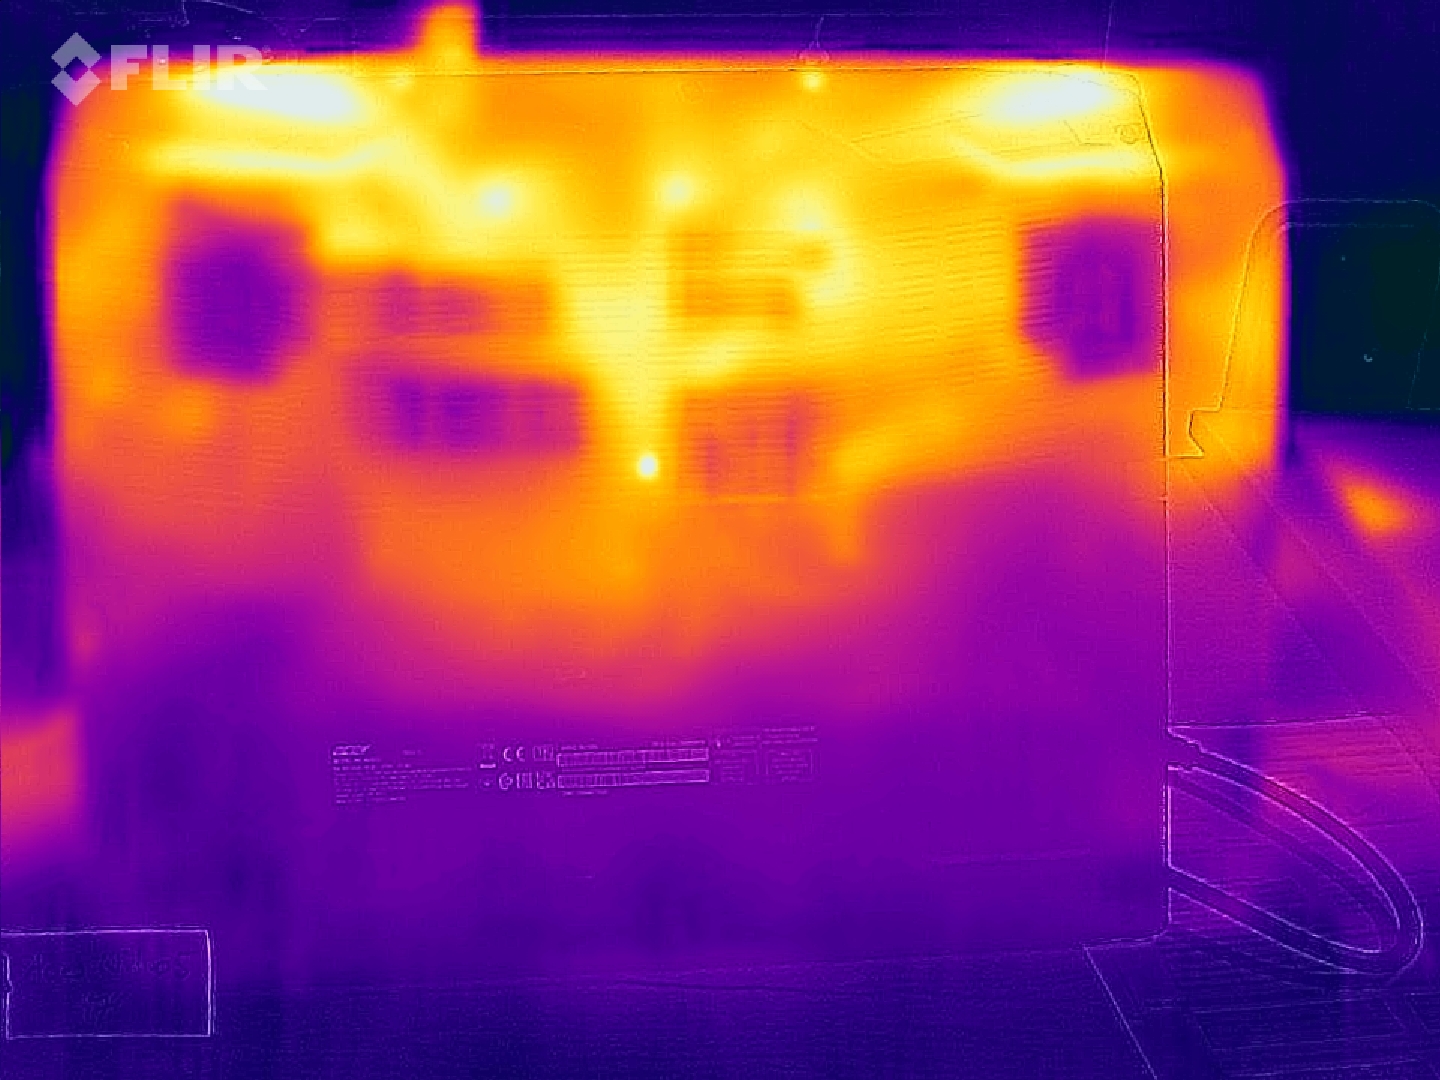
Temperatura
As temperaturas do caso não deixam muito espaço para críticas. Em nenhum momento são excedidos 50 °C sob carga. Quando ocioso, o Acer Nitro 5 AN517 tem um desempenho um pouco pior em comparação direta com a concorrência, mas isto não é um grande problema.
(-) A temperatura máxima no lado superior é 48.3 °C / 119 F, em comparação com a média de 40.4 °C / 105 F , variando de 21.2 a 68.8 °C para a classe Gaming.
(-) A parte inferior aquece até um máximo de 52 °C / 126 F, em comparação com a média de 43.2 °C / 110 F
(+) Em uso inativo, a temperatura média para o lado superior é 29.1 °C / 84 F, em comparação com a média do dispositivo de 33.9 °C / ### class_avg_f### F.
(±) Jogando The Witcher 3, a temperatura média para o lado superior é 32.9 °C / 91 F, em comparação com a média do dispositivo de 33.9 °C / ## #class_avg_f### F.
(+) Os apoios para as mãos e o touchpad são mais frios que a temperatura da pele, com um máximo de 28.9 °C / 84 F e, portanto, são frios ao toque.
(±) A temperatura média da área do apoio para as mãos de dispositivos semelhantes foi 28.8 °C / 83.8 F (-0.1 °C / -0.2 F).
| Acer Nitro 5 AN517-55-738R Intel Core i7-12700H, NVIDIA GeForce RTX 3060 Laptop GPU | Lenovo Legion 5 17ACH6H-82JY0003GE AMD Ryzen 5 5600H, NVIDIA GeForce RTX 3060 Laptop GPU | Asus TUF Gaming F17 FX707Z-HX011W Intel Core i7-12700H, NVIDIA GeForce RTX 3060 Laptop GPU | Acer Nitro 5 AN517-41-R5Z7 AMD Ryzen 7 5800H, NVIDIA GeForce RTX 3070 Laptop GPU | Schenker XMG Core 17 (Early 2021) Intel Core i7-10870H, NVIDIA GeForce RTX 3060 Laptop GPU | MSI Katana GF76 11UE Intel Core i7-11800H, NVIDIA GeForce RTX 3060 Laptop GPU | |
|---|---|---|---|---|---|---|
| Heat | 7% | 6% | 6% | 6% | 5% | |
| Maximum Upper Side * (°C) | 48.3 | 42.2 13% | 52 -8% | 44 9% | 44 9% | 51 -6% |
| Maximum Bottom * (°C) | 52 | 50.9 2% | 47 10% | 52.7 -1% | 50 4% | 52 -0% |
| Idle Upper Side * (°C) | 34.5 | 34.3 1% | 31 10% | 32.6 6% | 30 13% | 32 7% |
| Idle Bottom * (°C) | 35.8 | 32 11% | 31 13% | 32.1 10% | 36 -1% | 29 19% |
* ... menor é melhor
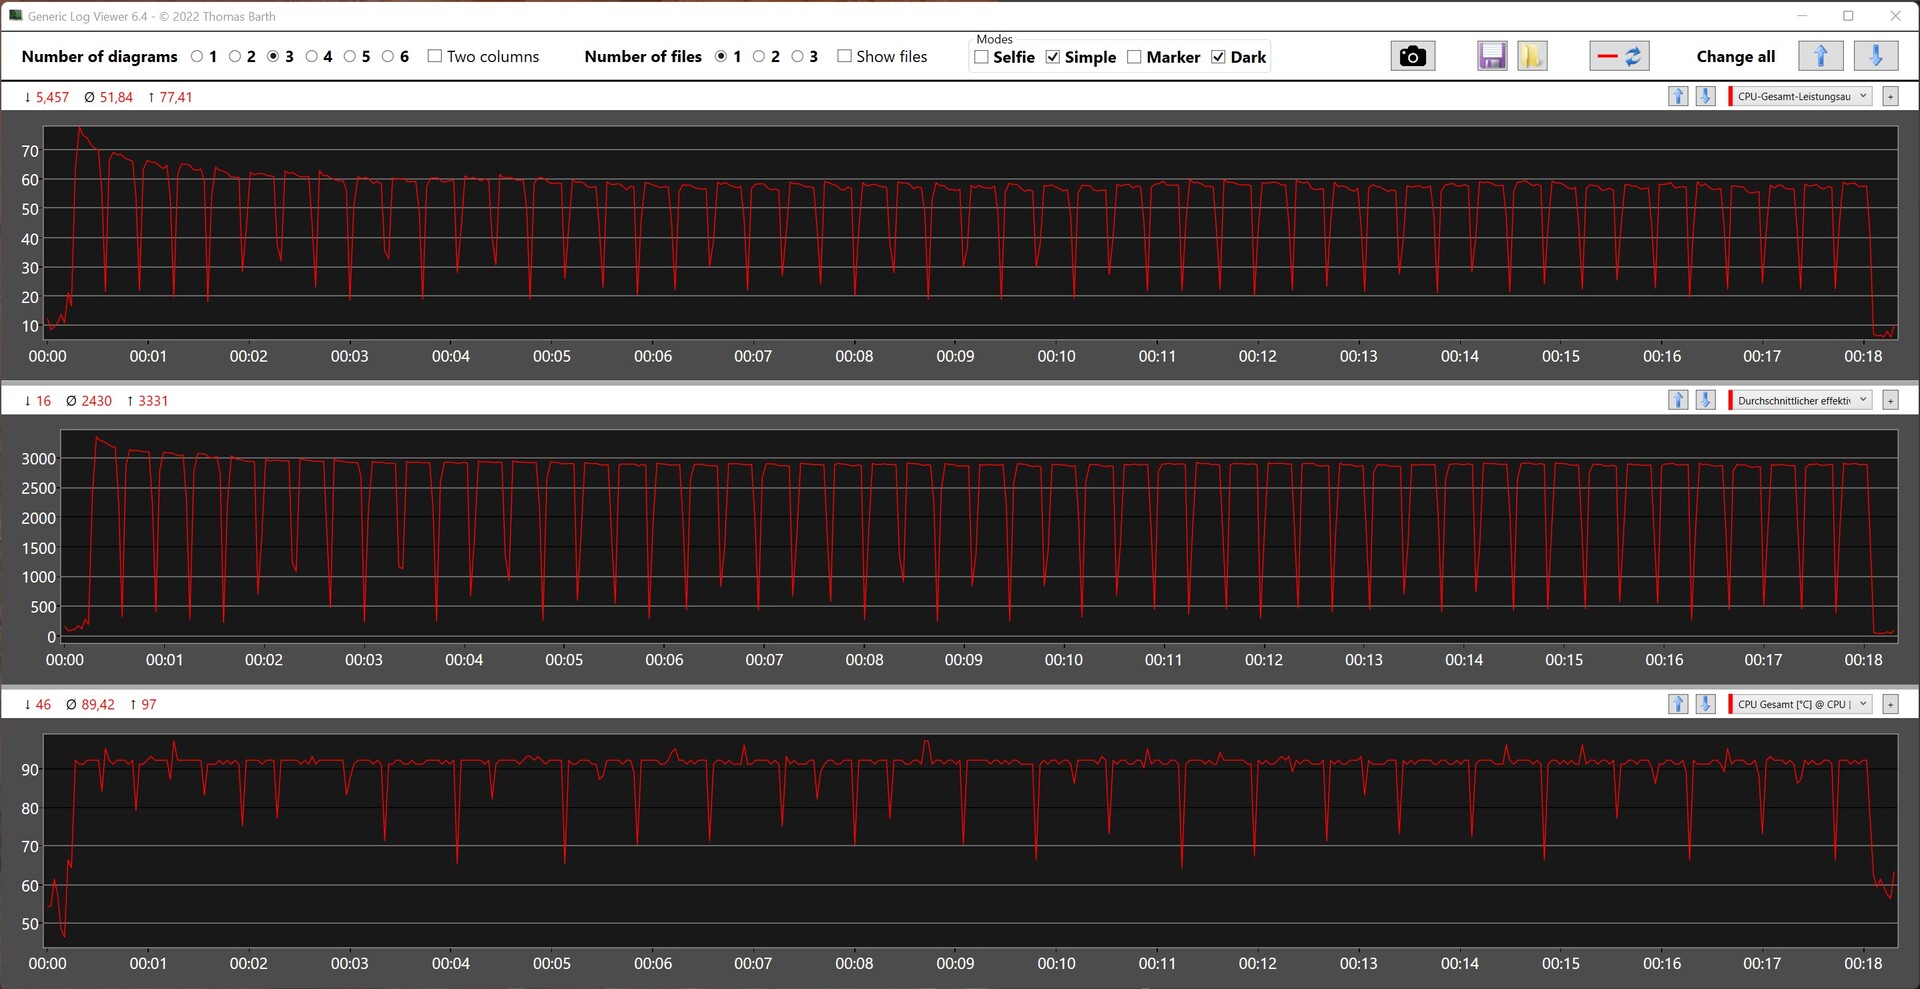
Teste de estresse
O teste de estresse foi novamente realizado no modo "Padrão". Aqui podemos ver que a unidade de resfriamento é simplesmente sobrecarregada e o SoC nunca atinge os valores PL1 e PL2 a qualquer momento, porque o limite térmico entra em ação para evitar uma ruptura. Durante o teste de estresse de uma hora com Prime95 e FurMark, o SoC cronometrou em cerca de 2 GHz e ultrapassou repetidamente os 90 °C sem problemas
Em contraste, não houve problemas com a GPU. Uma referência após o teste de estresse não apresentou um resultado pior em comparação com a partida fria.
Também testamos brevemente o dispositivo no modo "Performance": alguns segundos após o início, o SoC aqueceu até 101 °C e foi estrangulado. Isto significa essencialmente que há menos potência disponível, o que é um critério de knockout para este ajuste.
Oradores
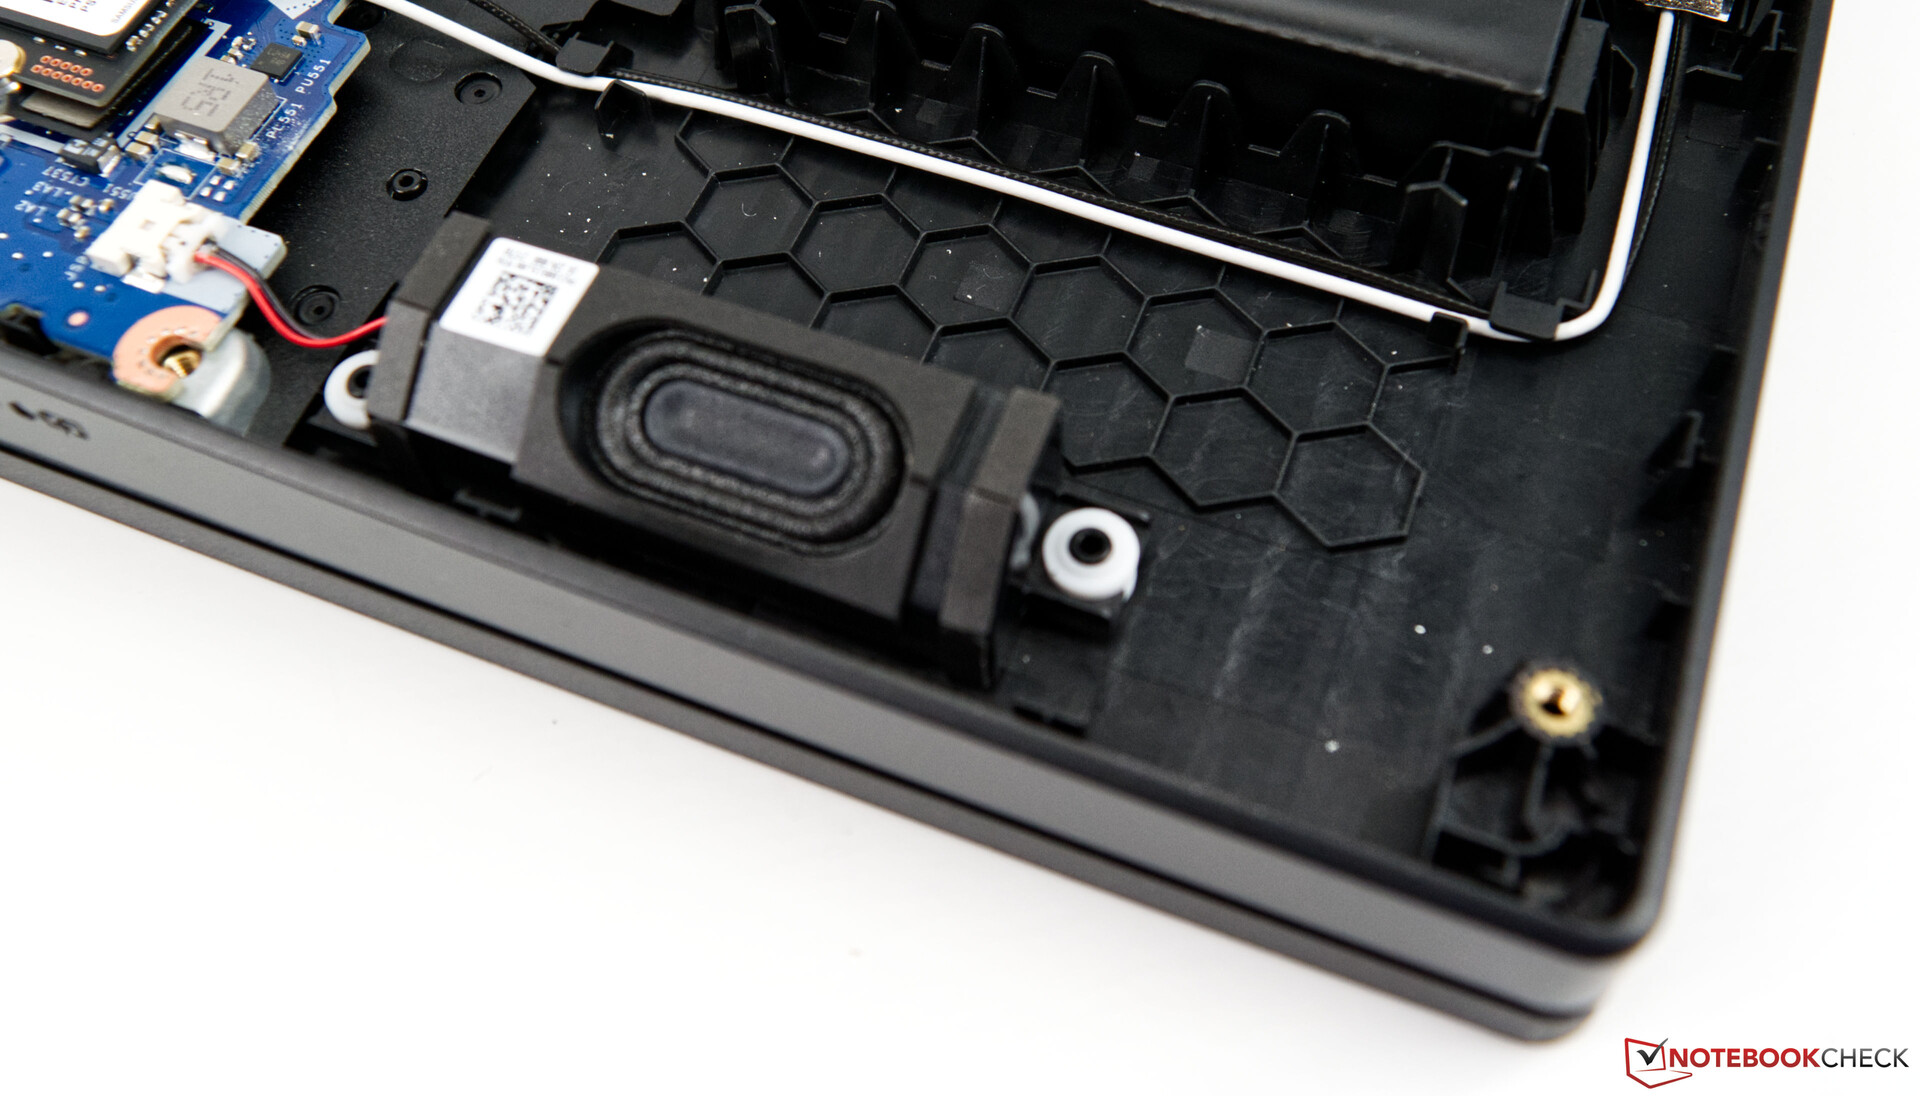
Os alto-falantes embutidos são condicionalmente adequados apenas para tocar música. Da mesma forma, o jogo não é muito divertido se você não usar dispositivos de reprodução externa. Os dois alto-falantes são direcionados para baixo e não oferecem nenhum baixo. Os altos e médios predominam claramente. O volume é simplesmente muito baixo para gerar um som melhor. Definitivamente, haveria espaço suficiente para melhores alto-falantes, como pode ser visto nesta imagem. A Acer também poderia ter integrado facilmente um pequeno subwoofer. O espaço interno é suficiente para isso também, mas, em vez disso, simplesmente permanece sem uso.
Acer Nitro 5 AN517-55-738R análise de áudio
(±) | o volume do alto-falante é médio, mas bom (###valor### dB)
Graves 100 - 315Hz
(-) | quase nenhum baixo - em média 20.7% menor que a mediana
(-) | graves não são lineares (16.5% delta para frequência anterior)
Médios 400 - 2.000 Hz
(+) | médios equilibrados - apenas 2.6% longe da mediana
(+) | médios são lineares (6.6% delta para frequência anterior)
Altos 2 - 16 kHz
(+) | agudos equilibrados - apenas 4.5% longe da mediana
(+) | os máximos são lineares (6.6% delta da frequência anterior)
Geral 100 - 16.000 Hz
(±) | a linearidade do som geral é média (17.6% diferença em relação à mediana)
Comparado com a mesma classe
» 50% de todos os dispositivos testados nesta classe foram melhores, 11% semelhantes, 39% piores
» O melhor teve um delta de 6%, a média foi 18%, o pior foi 132%
Comparado com todos os dispositivos testados
» 34% de todos os dispositivos testados foram melhores, 8% semelhantes, 57% piores
» O melhor teve um delta de 4%, a média foi 24%, o pior foi 134%
Lenovo Legion 5 17ACH6H-82JY0003GE análise de áudio
(±) | o volume do alto-falante é médio, mas bom (###valor### dB)
Graves 100 - 315Hz
(-) | quase nenhum baixo - em média 19.1% menor que a mediana
(±) | a linearidade dos graves é média (13.8% delta para a frequência anterior)
Médios 400 - 2.000 Hz
(+) | médios equilibrados - apenas 3% longe da mediana
(+) | médios são lineares (5% delta para frequência anterior)
Altos 2 - 16 kHz
(+) | agudos equilibrados - apenas 4.8% longe da mediana
(+) | os máximos são lineares (6.7% delta da frequência anterior)
Geral 100 - 16.000 Hz
(±) | a linearidade do som geral é média (15.8% diferença em relação à mediana)
Comparado com a mesma classe
» 37% de todos os dispositivos testados nesta classe foram melhores, 7% semelhantes, 56% piores
» O melhor teve um delta de 6%, a média foi 18%, o pior foi 132%
Comparado com todos os dispositivos testados
» 24% de todos os dispositivos testados foram melhores, 5% semelhantes, 71% piores
» O melhor teve um delta de 4%, a média foi 24%, o pior foi 134%
Gestão de energia
Consumo de energia
O Acer Nitro 5 AN517 não pode ser descrito como economia de energia, mesmo que os valores determinados quando ociosos sejam relativamente bons e às vezes significativamente melhores do que os da concorrência. Sob carga, porém, registramos uma média de 166 watts, que é superada por picos de até 235 watts. Nossa amostra de revisão está, portanto, claramente acima da média da classe.
| desligado | |
| Ocioso | |
| Carga |
|
Key:
min: | |
| Acer Nitro 5 AN517-55-738R i7-12700H, GeForce RTX 3060 Laptop GPU, Samsung PM9A1 MZVL2512HCJQ, IPS, 1920x1080, 17.3" | Lenovo Legion 5 17ACH6H-82JY0003GE R5 5600H, GeForce RTX 3060 Laptop GPU, Samsung PM991a MZALQ512HBLU, IPS, 1920x1080, 17.3" | Asus TUF Gaming F17 FX707Z-HX011W i7-12700H, GeForce RTX 3060 Laptop GPU, SK Hynix HFM001TD3JX013N, IPS, 1920x1080, 17.3" | Acer Nitro 5 AN517-41-R5Z7 R7 5800H, GeForce RTX 3070 Laptop GPU, SK Hynix BC711 1TB HFM001TD3JX016N, IPS, 1920x1080, 17.3" | Schenker XMG Core 17 (Early 2021) i7-10870H, GeForce RTX 3060 Laptop GPU, Samsung SSD 970 EVO Plus 1TB, IPS, 2560x1440, 17.3" | MSI Katana GF76 11UE i7-11800H, GeForce RTX 3060 Laptop GPU, Kingston OM8PCP3512F-AB, IPS, 1920x1080, 17.3" | Média NVIDIA GeForce RTX 3060 Laptop GPU | Média da turma Gaming | |
|---|---|---|---|---|---|---|---|---|
| Power Consumption | -19% | 28% | -29% | -14% | 11% | 2% | -17% | |
| Idle Minimum * (Watt) | 9.7 | 15.6 -61% | 6.6 32% | 18.7 -93% | 13 -34% | 9 7% | 10.4 ? -7% | 13.2 ? -36% |
| Idle Average * (Watt) | 14.6 | 20.7 -42% | 8.3 43% | 22 -51% | 16 -10% | 13 11% | 14.5 ? 1% | 18.9 ? -29% |
| Idle Maximum * (Watt) | 16.7 | 22.9 -37% | 11.8 29% | 25.2 -51% | 29 -74% | 20 -20% | 21.4 ? -28% | 24.3 ? -46% |
| Load Average * (Watt) | 166 | 134 19% | 119 28% | 134.7 19% | 100 40% | 102 39% | 109.3 ? 34% | 108 ? 35% |
| Load Maximum * (Watt) | 235 | 170 28% | 222 6% | 157 33% | 213 9% | 187 20% | 206 ? 12% | 254 ? -8% |
| Witcher 3 ultra * (Watt) | 135 | 169 | 135 | 173 | 149 |
* ... menor é melhor
Power consumption Witcher 3 / Stresstest
Power consumption with an external monitor
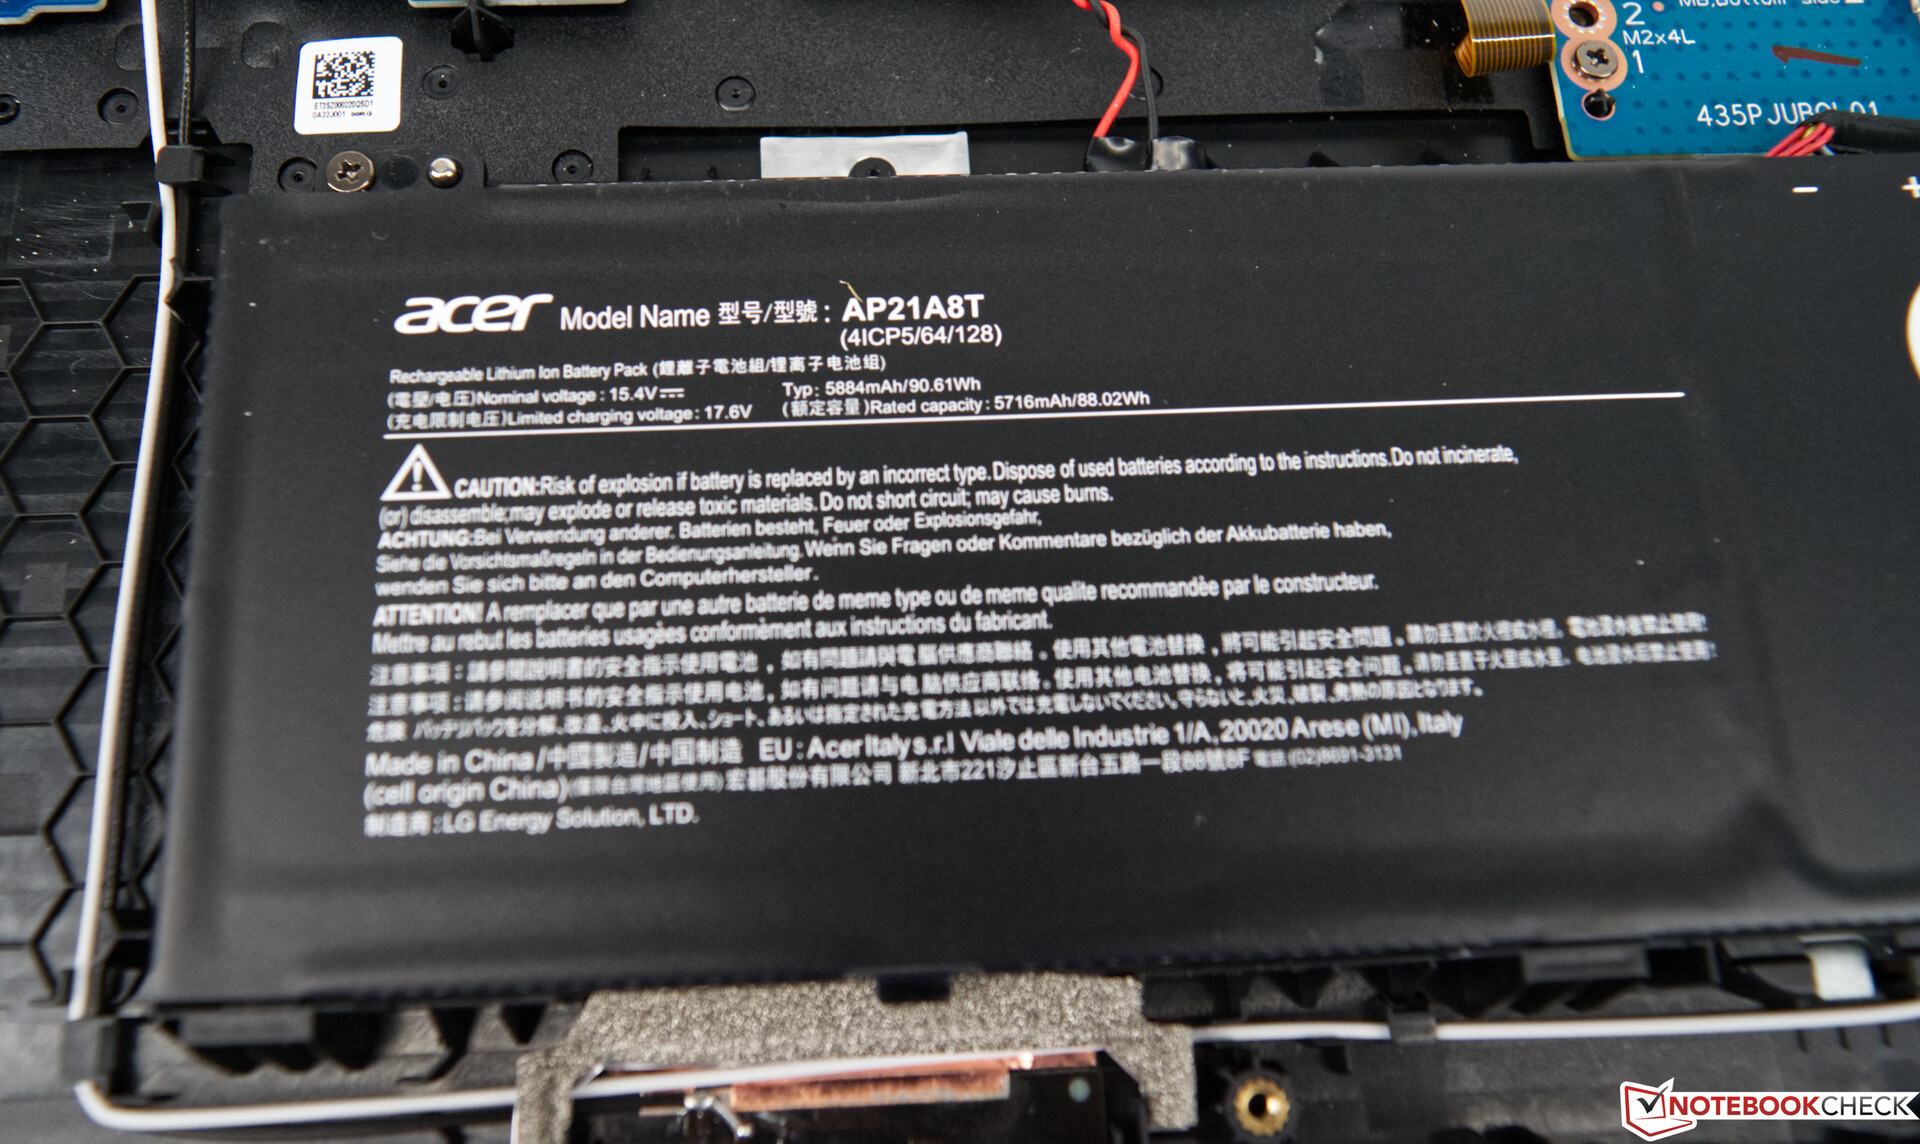
Vida útil da bateria
O Acer Nitro 5 AN517 funciona durante quase 6,5 horas no teste WLAN com uma bateria de 90 Wh instalada permanentemente. Este é um bom valor para um caderno de jogos, que só pode ser testado peloAsus TUF Gaming F17.
Também é importante notar que o desempenho da CPU e da GPU é um pouco estrangulado no modo de bateria. O Acer Nitro 5 AN517 não é o único a este respeito, já que outros fabricantes também tomaram um caminho semelhante.
| Acer Nitro 5 AN517-55-738R i7-12700H, GeForce RTX 3060 Laptop GPU, 90.61 Wh | Lenovo Legion 5 17ACH6H-82JY0003GE R5 5600H, GeForce RTX 3060 Laptop GPU, 80 Wh | Asus TUF Gaming F17 FX707Z-HX011W i7-12700H, GeForce RTX 3060 Laptop GPU, 90 Wh | Acer Nitro 5 AN517-41-R5Z7 R7 5800H, GeForce RTX 3070 Laptop GPU, 57.5 Wh | Schenker XMG Core 17 (Early 2021) i7-10870H, GeForce RTX 3060 Laptop GPU, 62 Wh | MSI Katana GF76 11UE i7-11800H, GeForce RTX 3060 Laptop GPU, 53 Wh | Média da turma Gaming | |
|---|---|---|---|---|---|---|---|
| Duração da bateria | -30% | 33% | -6% | -26% | -40% | 4% | |
| Reader / Idle (h) | 11.7 | 5.5 -53% | 10.1 -14% | 7.7 -34% | 4.8 -59% | 8.71 ? -26% | |
| H.264 (h) | 5.3 | 3.5 -34% | 7.7 45% | 7 32% | 4.7 -11% | 3.9 -26% | 8.26 ? 56% |
| WiFi v1.3 (h) | 6.5 | 4.4 -32% | 8.7 34% | 5.6 -14% | 4.9 -25% | 3.7 -43% | 7.02 ? 8% |
| Load (h) | 1.9 | 1.9 0% | 2.3 21% | 1.4 -26% | 1.3 -32% | 1.3 -32% | 1.47 ? -23% |
| Witcher 3 ultra (h) | 0.8 |
Pro
Contra
Veredicto - Início forte e final fraco
O Acer Nitro 5 AN517 é um laptop para jogos com a mais recente CPU Alder Lake e uma placa gráfica utilizável. O é o mais recente Intel Core i7-12700H é uma boa escolha e oferece muito desempenho multi-tarefa, mas vem com um preço. Portanto, não há mais limites para o SoC sob a forma de restrições de poder. Por um lado, isto é bom e ruim ao mesmo tempo porque o sistema de resfriamento atinge seus limites muito rapidamente quando o desempenho é necessário. A Acer faz um pouco melhor com a GPU para laptop Nvidia GeForce RTX 3060: Os níveis de desempenho são suficientes para rodar todos os jogos atuais sem problemas. Isto é o que importa e o Acer Nitro 5 AN517 faz exatamente isso
Caso contrário, os usuários podem realizar muito bem o trabalho diário com o dispositivo se o perfil de desempenho "Performance" na ferramenta interna Nitro Sense for simplesmente ignorado. O volume máximo sob carga atinge valores extremos que não podem ser tolerados. Mas estamos bem cientes de que dispositivos potentes podem muitas vezes ser ruidosos.
O Acer Nitro 5 AN517 é um portátil moderno para jogos com uma configuração rápida de CPU e GPU. Entretanto, os valores de emissão podem ser sua anulação.
Os pontos positivos são a tela com seus baixos tempos de resposta e os 144 Hz, o que provavelmente satisfará a maioria dos jogadores. No lado da conectividade, o Thunderbolt 4 é uma interface moderna que também é a prova de futuro. No entanto, a Acer poderia ter oferecido um pouco mais aqui, já que três portas USB convencionais não são muito para um notebook de 17 polegadas. A falta de espaço não pode ser a razão aqui. Visualmente, o dispositivo parece de alta qualidade, mas tem que lutar com o conhecido problema de leve flexão na base e na tampa da tela devido ao seu tamanho. Entretanto, este problema também existe em outros portáteis de 17 polegadas, portanto, o Acer Nitro 5 AN517 não está sozinho.
Preço e Disponibilidade
Nosso modelo revisado (AN517-55-738R) com seu layout de teclado específico da região é destinado principalmente ao mercado de língua alemã e tem um RRP atual de cerca de US$1500. Embora modelos de 15 polegadas com configurações de hardware idênticas estejam amplamente disponíveis em todo o mundo, não conseguimos encontrar nenhum modelo de 17 polegadas fora da Alemanha. Portanto, os compradores interessados são aconselhados a verificar regularmente on-line via Amazon ou um distribuidor apropriado.
Acer Nitro 5 AN517-55-738R
- 10/20/2022 v7 (old)
Sebastian Bade
Price comparison

