Análises de Portáteis com NVIDIA GeForce RTX 3050 4GB Laptop GPU Placa de vídeo
Avaliação do laptop multimídia HP Envy 17 - Cortando os cantos errados
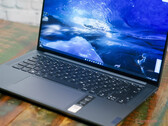
A HP atualizou seu Envy 17 e o equipou com um Intel Core Ultra 7 atualizado e uma RTX 3050. Mas essa atualização de hardware vem com um downgrade. Um que achamos difícil de aceitar. A tela desse dispositivo topo de linha foi destituída de um recurso importante.
Intel Core Ultra 7 155U, NVIDIA GeForce RTX 3050 4GB Laptop GPU, 17", 2.5 kgAnálise do laptop ultraleve LG Gram Pro 16 com chip Nvidia GeForce - Minimalismo arrojado
Os laptops Gram da LG são finos e leves. Sob o nome de LG Gram Pro, o fabricante agora está lançando um laptop para coroar tudo isso. Ele é ainda mais fino, mais leve e tem ainda mais potência à sua disposição.
Intel Core Ultra 7 155H, NVIDIA GeForce RTX 3050 4GB Laptop GPU, 16", 1.3 kgAnálise do laptop Asus VivoBook 14X OLED K3405: Laptop multimídia simples com Core i5-13500H e tela OLED 2.8K vibrante
O novo Asus VivoBook 14X OLED K3405 traz várias melhorias notáveis, incluindo o Intel Core i5-13500H e uma tela OLED de 2,8K. O VivoBook 14X OLED pretende ser procurado como um laptop multimídia capaz e consegue fazer isso na maior parte do tempo. No entanto, algumas das escolhas da Asus, como o uso da Nvidia RTX 3050 de 35 W, que já está envelhecendo, levantam uma sobrancelha.
Intel Core i5-13500H, NVIDIA GeForce RTX 3050 4GB Laptop GPU, 14", 1.4 kgRevisão do laptop Lenovo Slim 7 Pro X: A alternativa Asus VivoBook 14
A versão AMD é várias centenas de dólares mais barata do que a versão Intel, sendo apenas um pouco mais lenta. É uma compra melhor para a maioria dos usuários desde que a GPU GeForce RTX 3050 e a tela 3K ainda vêm padrão.
AMD Ryzen 9 6900HS, NVIDIA GeForce RTX 3050 4GB Laptop GPU, 14.5", 1.6 kgRevisão do laptop Lenovo Yoga Slim 7i Pro X: Elegante laptop criativo com Nvidia GeForce RTX
Nossa revisão da Lenovo Yoga Slim 7i Pro X pode ser resumida simplesmente da seguinte forma: O sub-portátil é compacto e oferece níveis de desempenho de primeira linha. Mesmo sem OLED, ele oferece uma tela muito boa que também garante longos tempos de funcionamento da bateria.
Intel Core i7-12700H, NVIDIA GeForce RTX 3050 4GB Laptop GPU, 14.5", 1.5 kgAsus VivoBook Pro 16X OLED N7600PC-L2026X: Intel Core i7-11370H, 16.00", 2 kg
ánalise » Asus Vivobook Pro 16X Laptop em revisão: Sistema Asus com um visor OLED topo de linha
Acer Swift X SFX14-51G-5876: Intel Core i5-1240P, 14.00", 1.4 kg
ánalise » Revisão do laptop Acer Swift X 14 com RTX 3050: Subdesafiada i5-1240P
Lenovo IdeaPad Gaming 3 15ARH7: AMD Ryzen 5 6600H, 15.60", 2.4 kg
ánalise » Ryzen 5 6600H estreia de desempenho: Lenovo IdeaPad Gaming 3 15ARH7 Revisão do Laptop
Dell Inspiron 14 Plus 7420: Intel Core i7-12700H, 14.00", 1.7 kg
ánalise » Revisão do laptop Dell Inspiron 14 Plus 7420: Para usuários de energia com um orçamento
Asus TUF Dash F15 FX517ZC: Intel Core i7-12650H, 15.60", 1.9 kg
ánalise » Asus TUF Dash F15 FX517ZC revisão de laptop: 1440p, 165 Hz, e cores P3 completas para menos de $1000
Acer Swift X SFX16-51G-5388: Intel Core i5-11320H, 16.10", 1.8 kg
ánalise » Revisão Acer Swift X 16: RTX 3050 brilha em laptop multimídia
Dell Inspiron 15 Plus: Intel Core i5-11400H, 15.60", 1.9 kg
ánalise » Revisão do laptop Dell Inspiron 15 Plus: Perto de ser o perfeito all-rounder
Asus Vivobook Pro 14 M3401QC-KM007T: AMD Ryzen 5 5600H, 14.00", 1.5 kg
ánalise » Asus Vivobook Pro 14 OLED em revisão: Pantone Validated laptop tem muito poder de processamento
Dell G15 5510: Intel Core i5-10500H, 15.60", 2.5 kg
ánalise » Revisão de laptop Dell G15 5510: Orçamento de laptop para jogos com o RTX 3050
Dell XPS 17 9720: Intel Core i7-12700H, 17.00", 2.5 kg
ánalise » Revisão do Dell XPS 17 9720 - O laptop multimídia premium começa a mostrar sua idade
Gigabyte G5 GD: Intel Core i5-11400H, 15.60", 2.1 kg
ánalise » Gigabyte G5 GD em revisão: Laptop para jogos de baixo custo sem Windows
Asus VivoBook 15 Pro M3500QC-L1062: AMD Ryzen 5 5600H, 15.60", 1.7 kg
ánalise » Asus VivoBook 15 Pro revisão OLED: Laptop multimídia de baixo custo com alto desempenho
Acer Nitro 5 AN517-53-54DQ: Intel Core i5-11300H, 17.30", 2.6 kg
ánalise » Acer Nitro 5 AN517-53 revisão : Laptop de jogos acessível com RTX 3050
Dell Inspiron 16 Plus 7610: Intel Core i7-11800H, 16.00", 2 kg
ánalise » Quase um XPS 16: Dell Inspiron 16 Plus 7610 revisão de laptop
MSI Cyborg 15 A13UC: Intel Core i5-13420H, 15.60", 2 kg
ánalise externa » MSI Cyborg 15 A13UC
Acer Aspire 7 A715-76G, i7-12650H RTX 3050: Intel Core i7-12650H, 15.60", 2.1 kg
ánalise externa » Acer Aspire 7 A715-76G, i7-12650H RTX 3050
Dell G15 5510: Intel Core i5-10500H, 15.60", 2.5 kg
ánalise externa » Dell G15 5510
MSI Thin 15 B13UC: Intel Core i5-13420H, 15.60", 1.9 kg
ánalise externa » MSI Thin 15 B13UC
Chuwi GTBook: Intel Core i5-12450H, 15.60", 1.5 kg
ánalise externa » Chuwi GTBook
Asus Vivobook 16X K3605ZC, i5-12500H: Intel Core i5-12500H, 16.00", 1.8 kg
ánalise externa » Asus Vivobook 16X K3605ZC, i5-12500H
MSI Thin 15 B12UX: Intel Core i5-12450H, 15.60", 1.9 kg
ánalise externa » MSI Thin 15 B12UX
Asus TUF Gaming A15 FA506NC: AMD Ryzen 5 7535HS, 15.60", 2.3 kg
ánalise externa » Asus TUF Gaming A15 FA506NC
MSI Thin A15 B7UC: AMD Ryzen 5 7535HS, 15.60", 1.9 kg
ánalise externa » MSI Thin A15 B7UC
LG gram Pro 16Z90SP: Intel Core Ultra 7 155H, 16.00", 1.3 kg
ánalise externa » LG gram Pro 16Z90SP
HP Envy 17-cw0000ng: Intel Core i7-1355U, 17.30", 2.5 kg
ánalise externa » HP Envy 17-cw0000ng
Asus TUF Gaming F15 FX507ZC, i5-12500H: Intel Core i5-12500H, 15.60", 2.7 kg
ánalise externa » Asus TUF Gaming F15 FX507ZC, i5-12500H
VAIO FH15: Intel Core i7-13700H, 15.60", 2 kg
ánalise externa » VAIO FH15
MSI Katana GF66 12UCK: Intel Core i7-12650H, 15.60", 2.3 kg
ánalise externa » MSI Katana GF66 12UCK
Acer Nitro 5 AN515-58-54UH: Intel Core i5-12450H, 15.60", 2.5 kg
ánalise externa » Acer Nitro 5 AN515-58-54UH
HP Victus 15-fa0054ns: Intel Core i5-12450H, 15.60", 2.3 kg
ánalise externa » HP Victus 15-fa0054ns
Acer Aspire 7 A715-76G, i5-12450H RTX 3050: Intel Core i5-12450H, 15.60", 2.1 kg
ánalise externa » Acer Aspire 7 A715-76G, i5-12450H RTX 3050
Asus Vivobook 16X K3605ZC: Intel Core i7-12650H, 16.00", 1.8 kg
ánalise externa » Asus Vivobook 16X K3605ZC
Medion Erazer Crawler E30: Intel Core i5-12500H, 15.60", 2 kg
ánalise externa » Medion Erazer Crawler E30
HP Victus 15-fa1000: Intel Core i5-13500H, 15.60", 2.3 kg
ánalise externa » HP Victus 15-fa1000
MSI GF63 12UC: Intel Core i5-12450H, 15.60", 1.9 kg
ánalise externa » MSI GF63 12UC
Lenovo LOQ 16IRH8, i5-13420H RTX 3050: Intel Core i5-13420H, 16.00", 2.6 kg
ánalise externa » Lenovo LOQ 16IRH8, i5-13420H RTX 3050
HP Victus 16-e0087ns: AMD Ryzen 7 5800H, 16.10", 2.5 kg
ánalise externa » HP Victus 16-e0087ns
Lenovo Legion 5 15ARH7H: AMD Ryzen 5 6600H, 15.60", 2.4 kg
ánalise externa » Lenovo Legion 5 15ARH7H
HP Victus 15-fa0000TX: Intel Core i5-12450H, 15.60", 2.3 kg
ánalise externa » HP Victus 15-fa0000TX
MSI GF63 Thin 11UC: Intel Core i7-11800H, 15.60", 1.9 kg
ánalise externa » MSI GF63 Thin 11UC
Asus Vivobook 14X K3405VC: Intel Core i9-13900H, 14.00", 1.4 kg
ánalise externa » Asus Vivobook 14X K3405VC
Asus VivoBook Pro 16 K6602ZC, i7-12650H: Intel Core i7-12650H, 16.00", 1.7 kg
ánalise externa » Asus VivoBook Pro 16 K6602ZC, i7-12650H
Asus VivoBook Pro 15 D3500QC-L1456W: AMD Ryzen 9 5900HX, 15.60", 1.9 kg
ánalise externa » Asus VivoBook Pro 15 D3500QC-L1456W
Lenovo IdeaPad Gaming 3 15IAH7, i5-12500H RXT 3050: Intel Core i5-12500H, 15.60", 2.3 kg
ánalise externa » Lenovo IdeaPad Gaming 3 15IAH7, i5-12500H. RXT 3050
Asus Vivobook Pro 15 K6502, i7-13650HX RTX 3050: Intel Core i7-13650HX, 15.60", 1.8 kg
ánalise externa » Asus Vivobook Pro 15 K6502, i7-13650HX RTX 3050
Acer Nitro 5 AN515-47: AMD Ryzen 5 7535HS, 15.60", 2.5 kg
ánalise externa » Acer Nitro 5 AN515-47
Asus Zenbook 14X UX3404VC, i7-13700H: Intel Core i7-13700H, 14.50", 1.6 kg
ánalise externa » Asus Zenbook 14X UX3404VC, i7-13700H
MSI Katana GF66 12UC: Intel Core i7-12700H, 15.60", 2.3 kg
ánalise externa » MSI Katana GF66 12UC
HP Victus 16-d1021ns: Intel Core i7-12700H, 16.10", 2.5 kg
ánalise externa » HP Victus 16-d1021ns
HP Victus 16-e1021ns: AMD Ryzen 7 6800H, 16.10", 2.5 kg
ánalise externa » HP Victus 16-e1021ns
Asus VivoBook Pro 16 K6602ZC: Intel Core i5-12450H, 16.00", 1.9 kg
ánalise externa » Asus VivoBook Pro 16 K6602ZC
Acer Nitro 5 AN515-57-79TD: Intel Core i7-11800H, 15.60", 2.3 kg
ánalise externa » Acer Nitro 5 AN515-57-79TD
Gigabyte G5 GE: Intel Core i5-12500H, 15.60", 1.9 kg
ánalise externa » Gigabyte G5 GE
Asus Vivobook Pro 15 K6502, i9-11900H RTX 3050: Intel Core i9-11900H, 15.60", 1.8 kg
ánalise externa » Asus Vivobook Pro 15 K6502, i9-11900H RTX 3050
LG Gram 17 2023 17Z90R: Intel Core i7-1360P, 17.00", 1.5 kg
ánalise externa » LG Gram 17 2023 17Z90R
Asus Zenbook 14X UX3404VC-M3145X: Intel Core i9-13900H, 14.50", 1.6 kg
ánalise externa » Asus Zenbook 14X UX3404VC-M3145X
Acer Nitro 5 AN515-47-R79X: AMD Ryzen 7 7735HS, 15.60", 2.5 kg
ánalise externa » Acer Nitro 5 AN515-47-R79X
Asus Vivobook Pro 16 K6602HC, i9-11900H RTX 3050: Intel Core i9-11900H, 16.00", 1.9 kg
ánalise externa » Asus Vivobook Pro 16 K6602HC, i9-11900H RTX 3050
Asus ROG Flow X13 GV301QC-K6001T: AMD Ryzen 7 5800HS, 13.40", 1.3 kg
ánalise externa » Asus ROG Flow X13 GV301QC-K6001T
Asus Vivobook Pro 15 K6502, i5-12450H RTX 3050: Intel Core i5-12450H, 15.60", 1.8 kg
ánalise externa » Asus Vivobook Pro 15 K6502, i5-12450H RTX 3050
Lenovo IdeaPad Gaming 3 15IAH7, i5-12450H RXT 3050: Intel Core i5-12450H, 15.60", 2.3 kg
ánalise externa » Lenovo IdeaPad Gaming 3 15IAH7, i5-12450H RXT 3050
MSI GF63 Thin 11UC-680NL: Intel Core i5-11400H, 15.60", 1.9 kg
ánalise externa » MSI GF63 Thin 11UC-680NL
Asus TUF Gaming F17 FX706HC-HX007W: Intel Core i5-11400H, 17.30", 2.6 kg
ánalise externa » Asus TUF Gaming F17 FX706HC-HX007W
Asus TUF Gaming A15 FA506ICB-HN119W: AMD Ryzen 5 4600H, 15.60", 2.3 kg
ánalise externa » Asus TUF Gaming A15 FA506ICB-HN119W
Asus Vivobook Pro 14 M6400, 6800H RTX 3050: AMD Ryzen 7 6800H, 14.00", 1.5 kg
ánalise externa » Asus Vivobook Pro 14 M6400, 6800H RTX 3050
Asus TUF Gaming F15 FX506HC-HN004: Intel Core i5-11400H, 15.60", 2.3 kg
ánalise externa » Asus TUF Gaming F15 FX506HC-HN004
Asus TUF Dash F15 FX517ZC, i5-12450H: Intel Core i5-12450H, 15.60", 2 kg
ánalise externa » Asus TUF Dash F15 FX517ZC, i5-12450H
Dell G15 5511-5100BLK: Intel Core i5-11260H, 15.60", 2.8 kg
ánalise externa » Dell G15 5511-5100BLK
Lenovo IdeaPad 5 Pro 16ARH7, R5 6600HS RTX 3050: AMD Ryzen 5 6600HS, 16.00", 2 kg
ánalise externa » Lenovo IdeaPad 5 Pro 16ARH7, R5 6600HS RTX 3050
Asus Vivobook Pro 15 K6502, i7-12700H RTX 3050: Intel Core i7-12700H, 15.60", 1.8 kg
ánalise externa » Asus Vivobook Pro 15 K6502, i7-12700H RTX 3050
Lenovo Yoga Slim 7 ProX 14IAH7, i5-12500H RTX 3050: Intel Core i5-12500H, 14.50", 1.4 kg
ánalise externa » Lenovo Yoga Slim 7 ProX 14IAH7, i5-12500H RTX 3050
Acer Nitro 5 AN515-58-521S: Intel Core i5-12500H, 15.60", 2.5 kg
ánalise externa » Acer Nitro 5 AN515-58-521S
Asus Vivobook Pro 15 K3500PC-L1293: Intel Core i5-11300H, 15.60", 1.7 kg
ánalise externa » Asus Vivobook Pro 15 K3500PC-L1293
Asus ROG Strix G15 G513IC-HN100W: AMD Ryzen 7 4800H, 15.60", 2.1 kg
ánalise externa » Asus ROG Strix G15 G513IC-HN100W
MSI Katana GF66 11UC-809NL: Intel Core i7-11800H, 15.60", 2.3 kg
ánalise externa » MSI Katana GF66 11UC-809NL
MSI Prestige 14 A12UC-006: Intel Core i7-1260P, 14.00", 1.3 kg
ánalise externa » MSI Prestige 14 A12UC-006
Asus VivoBook Pro 15 M6500QC-L1010W: AMD Ryzen 7 5800H, 15.60", 1.8 kg
ánalise externa » Asus VivoBook Pro 15 M6500QC-L1010W
Lenovo Yoga Slim 7 Pro X 14IAH7 82TK006CGE: Intel Core i7-12700H, 14.50", 1.5 kg
ánalise externa » Lenovo Yoga Slim 7 Pro X 14IAH7 82TK006CGE
Lenovo Yoga Slim 7 ProX 14IAH7-82TK0079GE: Intel Core i7-12700H, 14.50", 1.5 kg
ánalise externa » Lenovo Yoga Slim 7 ProX 14IAH7-82TK0079GE
HP Victus 16-e1007ns: AMD Ryzen 7 6800H, 16.10", 2.5 kg
ánalise externa » HP Victus 16-e1007ns
Acer Nitro 5 AN515-58-781E: Intel Core i7-12700H, 15.60", 2.5 kg
ánalise externa » Acer Nitro 5 AN515-58-781E
Acer Aspire 7 A715-51G-529E: Intel Core i5-1240P, 15.60", 2.1 kg
ánalise externa » Acer Aspire 7 A715-51G-529E
Dell Inspiron 14 Plus 7420: Intel Core i7-12700H, 14.00", 1.7 kg
ánalise externa » Dell Inspiron 14 Plus 7420
MSI Prestige 14 A12UC-228: Intel Core i5-1240P, 14.00", 1.3 kg
ánalise externa » MSI Prestige 14 A12UC-228
HP Victus 16-e0031ns: AMD Ryzen 7 5800H, 16.10", 0.5 kg
ánalise externa » HP Victus 16-e0031ns
HP Victus 15-fb0009AX: AMD Ryzen 5 5600H, 15.60", 2.9 kg
ánalise externa » HP Victus 15-fb0009AX
Lenovo Legion 5 15ACH6H-82QJ0000BR: AMD Ryzen 7 5800H, 15.60", 2.4 kg
ánalise externa » Lenovo Legion 5 15ACH6H-82QJ0000BR
HP Victus 15-fa0011TX: Intel Core i5-12500H, 15.60", 2.3 kg
ánalise externa » HP Victus 15-fa0011TX
Acer Swift X SFX14-41G-R0FB: AMD Ryzen 5 5500U, 14.00", 1.5 kg
ánalise externa » Acer Swift X SFX14-41G-R0FB
Lenovo Legion 5 17ACH6-82K0008LMH: AMD Ryzen 7 5800H, 17.30", 3 kg
ánalise externa » Lenovo Legion 5 17ACH6-82K0008LMH
Lenovo IdeaPad Gaming 3 15ARH7: AMD Ryzen 5 6600H, 15.60", 2.4 kg
ánalise externa » Lenovo IdeaPad Gaming 3 15ARH7
Asus VivoBook Pro 15 M3500QC-L1297W: AMD Ryzen 7 5800H, 15.60", 1.7 kg
ánalise externa » Asus VivoBook Pro 15 M3500QC-L1297W
Asus VivoBook Pro 16X N7600PC-L2010W: Intel Core i7-11370H, 16.10", 2 kg
ánalise externa » Asus VivoBook Pro 16X N7600PC-L2010W
MSI Katana GF66 12UC-077: Intel Core i5-12500H, 15.60", 2.3 kg
ánalise externa » MSI Katana GF66 12UC-077
Lenovo Yoga Slim 7 ProX 14ARH7-82TL000BGE: AMD Ryzen 9 6900HS, 14.50", 1.5 kg
ánalise externa » Lenovo Yoga Slim 7 ProX 14ARH7-82TL000BGE
MSI Prestige 14 A12UC, i7-1280P: Intel Core i7-1280P, 14.00", 1.3 kg
ánalise externa » MSI Prestige 14 A12UC, i7-1280P
Gigabyte G7 GD: Intel Core i5-11400H, 17.30", 2.4 kg
ánalise externa » Gigabyte G7 GD
Lenovo IdeaPad Gaming 3 15ACH6, 5800H RTX 3050: AMD Ryzen 7 5800H, 15.60", 2.2 kg
ánalise externa » Lenovo IdeaPad Gaming 3 15ACH6, 5800H RTX 3050
HP Victus 16-e0033ns: AMD Ryzen 7 5800H, 16.10", 2.5 kg
ánalise externa » HP Victus 16-e0033ns
Acer Aspire 7 A715-42G-R8BV: AMD Ryzen 5 5500U, 15.60", 2.2 kg
ánalise externa » Acer Aspire 7 A715-42G-R8BV
Asus ROG Zephyrus G14 GA401QC-K2175: AMD Ryzen 7 5800HS, 14.00", 1.6 kg
ánalise externa » Asus ROG Zephyrus G14 GA401QC-K2175
Lenovo IdeaPad 5 Pro 16ACH6-82L5009DMH: AMD Ryzen 9 5900HX, 16.00", 1.9 kg
ánalise externa » Lenovo IdeaPad 5 Pro 16ACH6-82L5009DMH
Lenovo IdeaPad Gaming 3 15IAH7-82S9006JGE: Intel Core i5-12500H, 15.60", 2.3 kg
ánalise externa » Lenovo IdeaPad Gaming 3 15IAH7-82S9006JGE
Asus Vivobook Pro 16X M7600QC-L2002T: AMD Ryzen 7 5800H, 16.00", 2 kg
ánalise externa » Asus Vivobook Pro 16X M7600QC-L2002T
Asus VivoBook Pro 15 M3500QC-L1063: AMD Ryzen 5 5600H, 15.60", 1.7 kg
ánalise externa » Asus VivoBook Pro 15 M3500QC-L1063
HP Victus 16-e0350nd: AMD Ryzen 7 5800H, 16.10", 2.5 kg
ánalise externa » HP Victus 16-e0350nd
Asus ROG Zephyrus G14 GA401QC-HZ018: AMD Ryzen 7 5800HS, 14.00", 1.6 kg
ánalise externa » Asus ROG Zephyrus G14 GA401QC-HZ018
HP Spectre x360 16-f0035: Intel Core i7-11390H, 16.00", 2 kg
ánalise externa » HP Spectre x360 16-f0035
MSI GF63 Thin 11UC-447XES: Intel Core i5-11400H, 15.60", 1.9 kg
ánalise externa » MSI GF63 Thin 11UC-447XES
MSI Prestige 15 A12UC: Intel Core i7-1280P, 15.60", 1.7 kg
ánalise externa » MSI Prestige 15 A12UC
Acer Nitro 5 AN515-58-58BN: Intel Core i5-12500H, 15.60", 2.5 kg
ánalise externa » Acer Nitro 5 AN515-58-58BN
Lenovo Yoga Slim 7 ProX 14ARH7-82TL0042GE: AMD Ryzen 7 6800HS, 14.50", 1.5 kg
ánalise externa » Lenovo Yoga Slim 7 ProX 14ARH7-82TL0042GE
MSI Creator M16 A12UC-284: Intel Core i7-12700H, 16.00", 2.3 kg
ánalise externa » MSI Creator M16 A12UC-284
Dell XPS 17 9720: Intel Core i7-12700H, 17.00", 2.5 kg
ánalise externa » Dell XPS 17 9720
HP Victus 16-e0029ns: AMD Ryzen 7 5800H, 16.10", 2.5 kg
ánalise externa » HP Victus 16-e0029ns
HP Envy 15-ep1008ns: Intel Core i5-11400H, 15.60", 2.2 kg
ánalise externa » HP Envy 15-ep1008ns
HP Victus 16-d0018ns: Intel Core i7-11800H, 15.60", 2.5 kg
ánalise externa » HP Victus 16-d0018ns
Lenovo Legion 5 15ITH6, i7-11800H RTX 3050: Intel Core i7-11800H, 15.60", 2.4 kg
ánalise externa » Lenovo Legion 5 15ITH6, i7-11800H RTX 3050
Asus VivoBook Pro 14 M3401QC-KM007W: AMD Ryzen 5 5600H, 14.00", 1.5 kg
ánalise externa » Asus VivoBook Pro 14 M3401QC-KM007W
Lenovo IdeaPad Slim 7 Pro 16: AMD Ryzen 7 5800H, 16.00", 2.1 kg
ánalise externa » Lenovo IdeaPad Slim 7 Pro 16
Lenovo IdeaPad Gaming 3 15IHU6-82K100QHGE: Intel Core i5-11300H, 15.60", 2.3 kg
ánalise externa » Lenovo IdeaPad Gaming 3 15IHU6-82K100QHGE
HP Envy 14-eb1035nr: Intel Core i7-11390H, 14.00", 1.5 kg
ánalise externa » HP Envy 14-eb1035nr
Asus TUF Gaming F15 FX506HCB-HN256T: Intel Core i5-11400H, 15.60", 2.3 kg
ánalise externa » Asus TUF Gaming F15 FX506HCB-HN256T
Asus ROG Strix G15 G513RC: AMD Ryzen 7 6800H, 15.60", 2.1 kg
ánalise externa » Asus ROG Strix G15 G513RC
Asus TUF Gaming F15 FX507ZC: Intel Core i7-12700H, 15.60", 2.2 kg
ánalise externa » Asus TUF Gaming F15 FX507ZC
Asus TUF Dash F15 FX517ZC: Intel Core i7-12650H, 15.60", 1.9 kg
ánalise externa » Asus TUF Dash F15 FX517ZC
Dell Vostro 15 7510, i5-11400H RTX 3050: Intel Core i5-11400H, 15.60", 1.9 kg
ánalise externa » Dell Vostro 15 7510, i5-11400H RTX 3050
Asus VivoBook Pro 15 M3500QC-KJ161T: AMD Ryzen 7 5800H, 15.60", 1.7 kg
ánalise externa » Asus VivoBook Pro 15 M3500QC-KJ161T
HP Victus 16-d0021ns: Intel Core i7-11800H, 16.10", 2.5 kg
ánalise externa » HP Victus 16-d0021ns
Asus Vivobook Pro 14X M7400, 5800H 3050: AMD Ryzen 7 5800H, 14.00", 1.5 kg
ánalise externa » Asus Vivobook Pro 14X M7400, 5800H 3050
Acer Aspire 7 A715-42G-R69L: AMD Ryzen 5 5500U, 15.60", 2.2 kg
ánalise externa » Acer Aspire 7 A715-42G-R69L
HP Pavilion Gaming 15-ec2010AX: AMD Ryzen 5 5600H, 15.60", 2 kg
ánalise externa » HP Pavilion Gaming 15-ec2010AX
Lenovo IdeaPad Gaming 3 15ACH6, 5600H RTX 3050: AMD Ryzen 5 5600H, 15.60", 2.2 kg
ánalise externa » Lenovo IdeaPad Gaming 3 15ACH6, 5600H RTX 3050
HP Victus 16-e0914ng: AMD Ryzen 5 5600H, 16.10", 2.5 kg
ánalise externa » HP Victus 16-e0914ng
Asus ROG Flow Z13 GZ301ZC-LD027W: Intel Core i7-12700H, 13.40", 1.2 kg
ánalise externa » Asus ROG Flow Z13 GZ301ZC-LD027W
Asus Vivobook Pro 14X M7400QC-KM018: AMD Ryzen 7 5800H, 14.00", 1.5 kg
ánalise externa » Asus Vivobook Pro 14X M7400QC-KM018
HP Victus 16-e0026ns: AMD Ryzen 7 5800H, 16.10", 2.5 kg
ánalise externa » HP Victus 16-e0026ns
MSI Katana GF66 11UC-231ES: Intel Core i7-11800H, 15.60", 2.1 kg
ánalise externa » MSI Katana GF66 11UC-231ES
Asus Vivobook Pro 16X N7600PC-L2012R: Intel Core i5-11300H, 16.10", 2 kg
ánalise externa » Asus Vivobook Pro 16X N7600PC-L2012R
Dell G15 5510-5889BLK: Intel Core i5-10500H, 15.60", 2.7 kg
ánalise externa » Dell G15 5510-5889BLK
Dell G15 5510, i5-10200H RTX 3050: Intel Core i5-10200H, 15.60", 2.7 kg
ánalise externa » Dell G15 5510, i5-10200H RTX 3050
Dell G15 5510-5964BLK: Intel Core i5-10200H, 15.60", 2.5 kg
ánalise externa » Dell G15 5510-5964BLK
Xiaomi Mi Notebook Pro X14: Intel Core i7-11370H, 14.00", 1.6 kg
ánalise externa » Xiaomi Mi Notebook Pro X14
HP Spectre x360 16-f0008ca: Intel Core i7-11390H, 16.00", 2 kg
ánalise externa » HP Spectre x360 16-f0008ca
HP Pavilion Gaming 15-dk2002TX: Intel Core i5-11300H, 15.60", 2.2 kg
ánalise externa » HP Pavilion Gaming 15-dk2002TX
Asus VivoBook Pro 14X N7400, i5-11300H RTX 3050: Intel Core i5-11300H, 14.00", 1.5 kg
ánalise externa » Asus VivoBook Pro 14X N7400, i5-11300H RTX 3050
Acer Nitro 5 AN515-57-77QK: Intel Core i7-11800H, 15.60", 2.3 kg
ánalise externa » Acer Nitro 5 AN515-57-77QK
Asus VivoBook Pro 14X N7400PC-KM012T: Intel Core i7-11370H, 14.00", 1.5 kg
ánalise externa » Asus VivoBook Pro 14X N7400PC-KM012T
MSI Katana GF76 11UC-080ES: Intel Core i7-11800H, 17.30", 2.3 kg
ánalise externa » MSI Katana GF76 11UC-080ES
Lenovo IdeaPad 5 Pro 16ACH6-82L5006TGE: AMD Ryzen 9 5900HX, 16.00", 1.9 kg
ánalise externa » Lenovo IdeaPad 5 Pro 16ACH6-82L5006TGE
Acer Swift X SFX14-41G-R0SG: AMD Ryzen 5 5600U, 14.00", 1.5 kg
ánalise externa » Acer Swift X SFX14-41G-R0SG
Asus VivoBook Pro 14X M7400QC, 5600H RTX 3050: AMD Ryzen 5 5600H, 14.00", 1.5 kg
ánalise externa » Asus VivoBook Pro 14X M7400QC, 5600H RTX 3050
MSI Katana GF66 11UC-072XES: Intel Core i7-11800H, 15.60", 2.1 kg
ánalise externa » MSI Katana GF66 11UC-072XES
Asus Vivobook Pro 16X M7600, 5800H 3050: AMD Ryzen 7 5800H, 16.00", 2 kg
ánalise externa » Asus Vivobook Pro 16X M7600, 5800H 3050
Asus VivoBook Pro 15 M3500QC-L1062: AMD Ryzen 5 5600H, 15.60", 1.7 kg
ánalise externa » Asus VivoBook Pro 15 M3500QC-L1062
Acer Swift X SFX14-41G-R5EM: AMD Ryzen 7 5800U, 14.00", 1.5 kg
ánalise externa » Acer Swift X SFX14-41G-R5EM
Lenovo Legion 5 Pro 16ITH6H, i7-11800H RTX 3050: Intel Core i7-11800H, 16.00", 2.3 kg
ánalise externa » Lenovo Legion 5 Pro 16ITH6H, i7-11800H RTX 3050
Asus VivoBook Pro 14X N7400PC-KM142W: Intel Core i7-11370H, 14.00", 1.5 kg
ánalise externa » Asus VivoBook Pro 14X N7400PC-KM142W
HP Victus 16-d0108TX: Intel Core i7-11800H, 16.10", 2.5 kg
ánalise externa » HP Victus 16-d0108TX
Asus ROG Zephyrus G14 GA401QC-K2123T: AMD Ryzen 7 5800HS, 14.00", 1.6 kg
ánalise externa » Asus ROG Zephyrus G14 GA401QC-K2123T
Asus VivoBook Pro 15 K3500PC-L1009T: Intel Core i5-11300H, 15.60", 1.7 kg
ánalise externa » Asus VivoBook Pro 15 K3500PC-L1009T
Asus VivoBook 15 Pro M3500QC-L1062: AMD Ryzen 5 5600H, 15.60", 1.7 kg
ánalise externa » Asus VivoBook 15 Pro M3500QC-L1062
MSI Summit E16 Flip Evo A11UCT-028: Intel Core i7-1195G7, 16.00", 2 kg
ánalise externa » MSI Summit E16 Flip Evo A11UCT-028
Asus VivoBook Pro 15 D3500QC-L1103T: AMD Ryzen 7 5800H, 15.60", 1.7 kg
ánalise externa » Asus VivoBook Pro 15 D3500QC-L1103T
Acer Nitro 5 AN517-54-706P: Intel Core i7-11800H, 17.30", 2.7 kg
ánalise externa » Acer Nitro 5 AN517-54-706P
Acer Nitro 5 AN515-45-NH.QCLSI.001: AMD Ryzen 5 5600H, 15.60", 2.3 kg
ánalise externa » Acer Nitro 5 AN515-45-NH.QCLSI.001
Asus VivoBook Pro 15 K3500PC, i7-11370H RTX 3050: Intel Core i7-11370H, 15.60", 1.7 kg
ánalise externa » Asus VivoBook Pro 15 K3500PC, i7-11370H RTX 3050
Gigabyte G5 GD: Intel Core i5-11400H, 15.60", 2.1 kg
ánalise externa » Gigabyte G5 GD
Lenovo IdeaPad Gaming 3 15IHU6-82K1002QGE: Intel Core i5-11300H, 15.60", 2.3 kg
ánalise externa » Lenovo IdeaPad Gaming 3 15IHU6-82K1002QGE
Asus VivoBook Pro 16X N7600PC: Intel Core i7-11370H, 16.10", 1.9 kg
ánalise externa » Asus VivoBook Pro 16X N7600PC
HP Victus 16-e0011ns: AMD Ryzen 7 5800H, 16.10", 2.5 kg
ánalise externa » HP Victus 16-e0011ns
Asus Vivobook Pro 14X M7400, 5900HX 3050: AMD Ryzen 9 5900HX, 14.00", 1.5 kg
ánalise externa » Asus Vivobook Pro 14X M7400, 5900HX 3050
Acer Nitro 5 AN515-55-53E5: Intel Core i5-10300H, 15.60", 2.3 kg
ánalise externa » Acer Nitro 5 AN515-55-53E5
Asus TUF Gaming F17 FX706HC-HX008T: Intel Core i7-11800H, 17.30", 2.6 kg
ánalise externa » Asus TUF Gaming F17 FX706HC-HX008T
Dell G15 5515, 5600H RTX 3050: AMD Ryzen 5 5600H, 15.60", 2.6 kg
ánalise externa » Dell G15 5515, 5600H RTX 3050
HP Pavilion Gaming 17-cd2023ur: Intel Core i7-11370H, 17.30", 2.8 kg
ánalise externa » HP Pavilion Gaming 17-cd2023ur
Asus Vivobook Pro 14 M3401, 5900HX: AMD Ryzen 9 5900HX, 14.00", 1.4 kg
ánalise externa » Asus Vivobook Pro 14 M3401, 5900HX
Acer Nitro 5 AN515-57-56HH: Intel Core i5-11400H, 15.60", 2.3 kg
ánalise externa » Acer Nitro 5 AN515-57-56HH
HP Victus 16-d0146ng: Intel Core i5-11400H, 16.10", 2.5 kg
ánalise externa » HP Victus 16-d0146ng
Acer Swift X SFX14-41G-R7PP: AMD Ryzen 5 5600U, 14.00", 1.5 kg
ánalise externa » Acer Swift X SFX14-41G-R7PP
Dell Inspiron 16 Plus 7610: Intel Core i7-11800H, 16.00", 2 kg
ánalise externa » Dell Inspiron 16 Plus 7610
Asus Vivobook Pro 16X-M7600QC: AMD Ryzen 5 5600H, 16.00", 2 kg
ánalise externa » Asus Vivobook Pro 16X-M7600QC
HP Victus 16-d0057ng: Intel Core i5-11400H, 16.10", 2.5 kg
ánalise externa » HP Victus 16-d0057ng
Dell G15 5510-Y4V8G: Intel Core i7-10870H, 15.60", 2.7 kg
ánalise externa » Dell G15 5510-Y4V8G
Lenovo IdeaPad 5 Pro 16ACH6, R7 5800H RTX 3050: AMD Ryzen 7 5800H, 16.00", 1.9 kg
ánalise externa » Lenovo IdeaPad 5 Pro 16ACH6, R7 5800H RTX 3050
MSI Katana GF66 11UC-011NL: Intel Core i7-11800H, 15.60", 2.1 kg
ánalise externa » MSI Katana GF66 11UC-011NL
Asus ROG Strix G17 G713QС-HX052T: AMD Ryzen 7 5800H, 17.30", 2.7 kg
ánalise externa » Asus ROG Strix G17 G713QС-HX052T
MSI Katana GF66 11UC-228: Intel Core i7-11800H, 15.60", 2.1 kg
ánalise externa » MSI Katana GF66 11UC-228
MSI Katana GF66 11UC-093: Intel Core i5-11400H, 15.60", 2.1 kg
ánalise externa » MSI Katana GF66 11UC-093
Dell XPS 17 9720: Intel Core i7-12700H, 17.00", 2.5 kg
» Dell XPS 17 9730: Laptop Premium anunciado com CPUs Intel Raptor Lake H e Nvidia GeForce Placas gráficas RTX 4000
Asus VivoBook Pro 16X OLED N7600PC-L2026X: Intel Core i7-11370H, 16.00", 2 kg
» Asus Vivobook Pro 16X em revisão: Tudo-em-um com algumas fraquezas
Lenovo IdeaPad Gaming 3 15ARH7: AMD Ryzen 5 6600H, 15.60", 2.4 kg
» O Ryzen 5 6600H é apenas 5% mais rápido que o Ryzen 5 5600H para se sentir como uma marca rebrand em muitos aspectos
Asus TUF Dash F15 FX517ZC: Intel Core i7-12650H, 15.60", 1.9 kg
» Uma das melhores configurações do Asus TUF Gaming F15 com a tela 1440p 165 Hz é muito difícil de encontrar
Asus Vivobook Pro 14 M3401QC-KM007T: AMD Ryzen 5 5600H, 14.00", 1.5 kg
» Asus Vivobook Pro 14 laptop revisado: Quase uma jóia escondida
Dell Inspiron 16 Plus 7610: Intel Core i7-11800H, 16.00", 2 kg
» Yikes, o novíssimo GeForce RTX 3050 é mais lento que o GTX 1660 Ti e RTX 2060