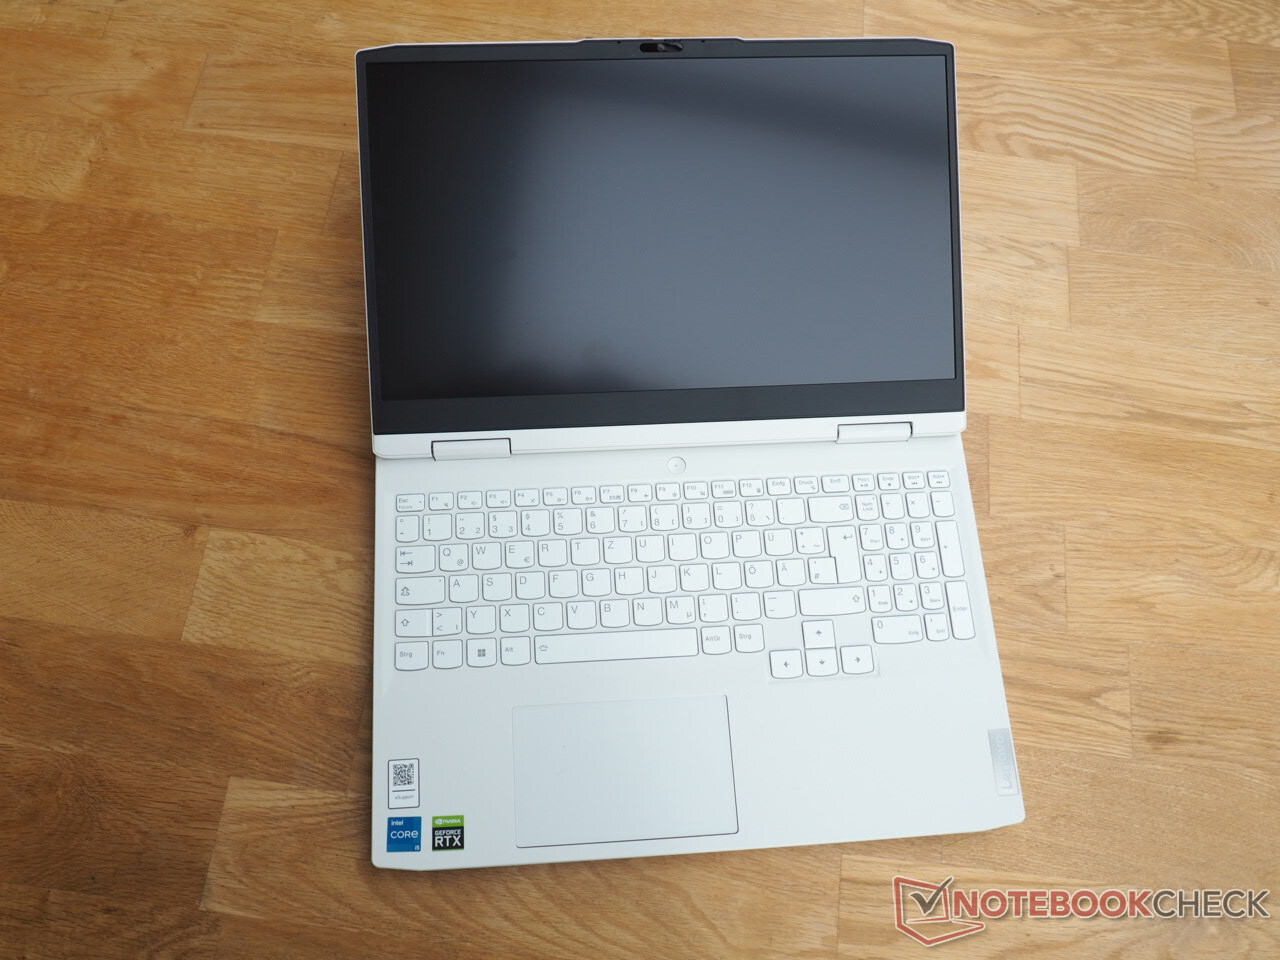
Lenovo IdeaPad Gaming 3 15IAH7 revisão: Um dos laptops RTX 3050 Ti mais potentes

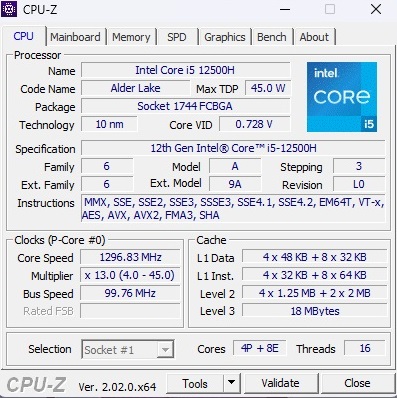
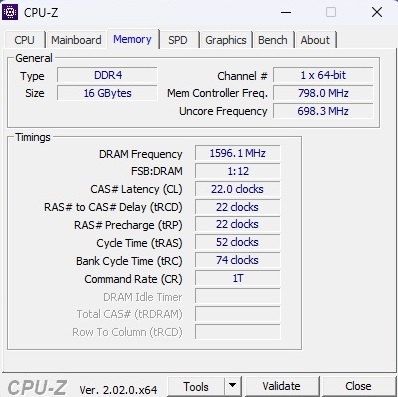
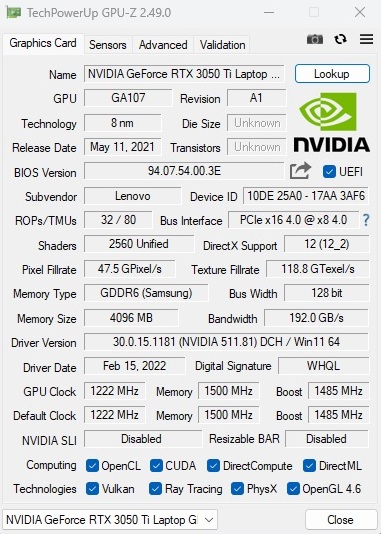
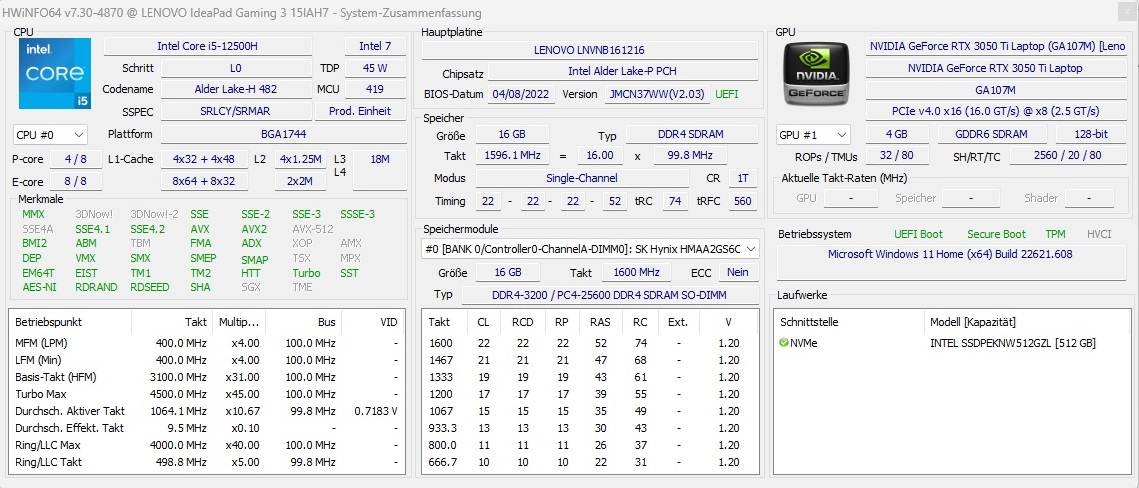
Embora vários laptops para jogos estejam disponíveis na faixa de preços em torno de 1.000 Euros (~$978), a maioria deles prescinde de um display com um brilho decente e uma sólida cobertura de espaço de cores. Entretanto, de tempos em tempos podemos encontrar uma exceção positiva, como o IdeaPad Gaming 3 15IAH7 que testamos, que oferece um Núcleo i5-12500H, aGeForce RTX 3050 Ti16 GB de RAM DDR4 (infelizmente somente em modo monocanal) e um SSD NVMe de 512 GB. A tela IPS de 15,6 polegadas tem uma taxa de atualização de 165 Hz, prometendo bons tempos de resposta, e uma resolução de 1920 x 1080 pixels.
Os concorrentes do IdeaPad Gaming 3 15IAH7 incluem outros laptops com o RTX 3050 Ti, tais como o HP Victus 16-e0145ngoDell G15 5515e o Dell Inspiron 16 Plus 7620. Também incluímos o modelo de irmãos 15ARH7 (Ryzen 5 6600H & RTX 3050) em nossos gráficos como um dispositivo de comparação.
Possíveis concorrentes em comparação
Avaliação | Data | Modelo | Peso | Altura | Size | Resolução | Preço |
|---|---|---|---|---|---|---|---|
| 82.8 % v7 (old) | 10/2022 | Lenovo IdeaPad Gaming 3 15IAH7 i5-12500H, GeForce RTX 3050 Ti Laptop GPU | 2.4 kg | 26 mm | 15.60" | 1920x1080 | |
| 80.8 % v7 (old) | 09/2022 | Lenovo IdeaPad Gaming 3 15ARH7 R5 6600H, GeForce RTX 3050 4GB Laptop GPU | 2.4 kg | 21.8 mm | 15.60" | 1920x1080 | |
| 82.7 % v7 (old) | 10/2021 | Dell G15 5515 R7 5800H, GeForce RTX 3050 Ti Laptop GPU | 2.4 kg | 24.9 mm | 15.60" | 1920x1080 | |
| 82.3 % v7 (old) | 05/2022 | HP Victus 16-e0145ng R5 5600H, GeForce RTX 3050 Ti Laptop GPU | 2.4 kg | 23.5 mm | 16.10" | 1920x1080 | |
| 87.4 % v7 (old) | 08/2022 | Dell Inspiron 16 Plus 7620 i7-12700H, GeForce RTX 3050 Ti Laptop GPU | 2.1 kg | 18.99 mm | 16.00" | 3072x1920 |
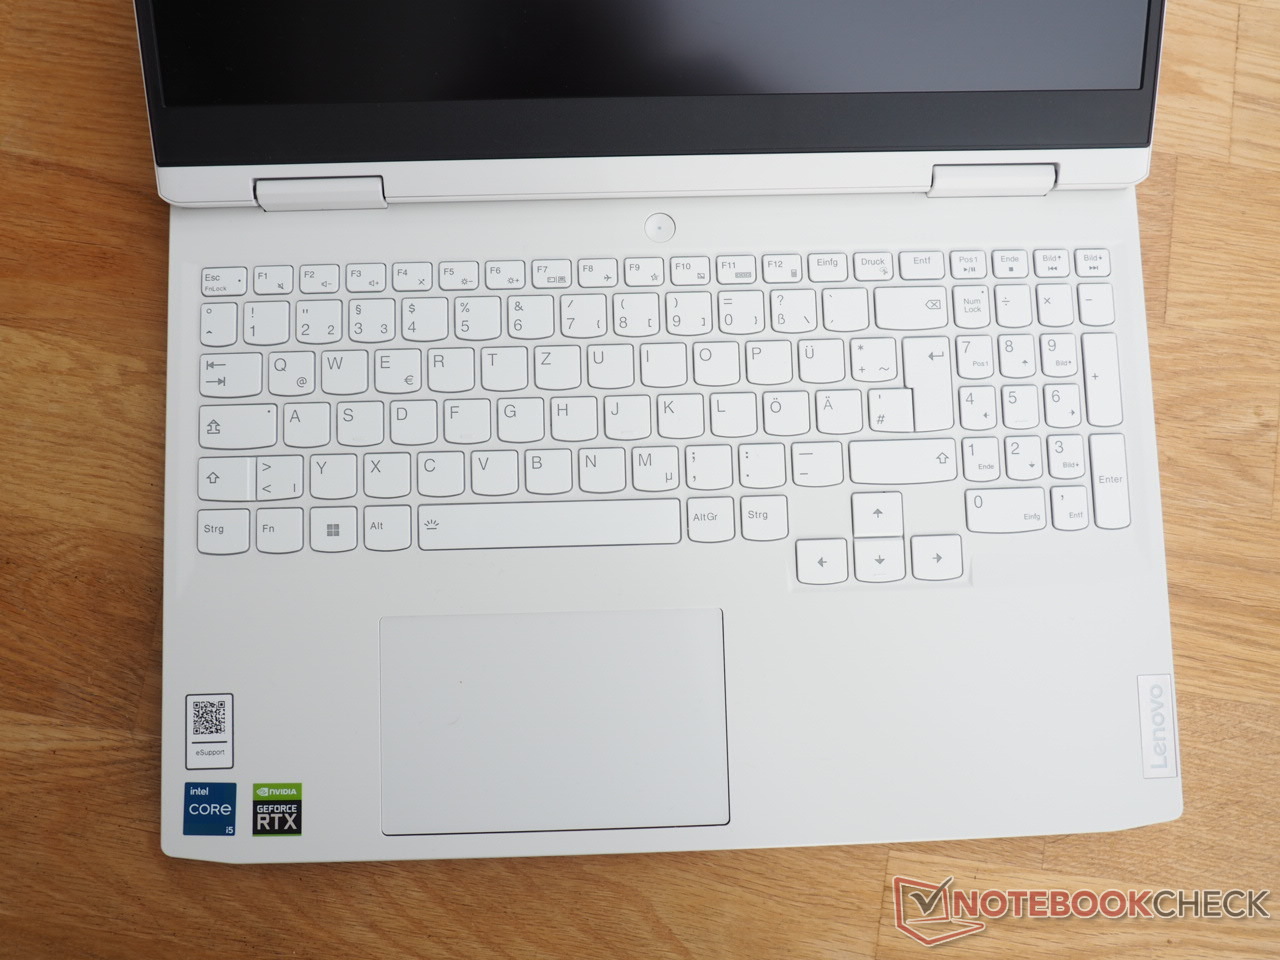
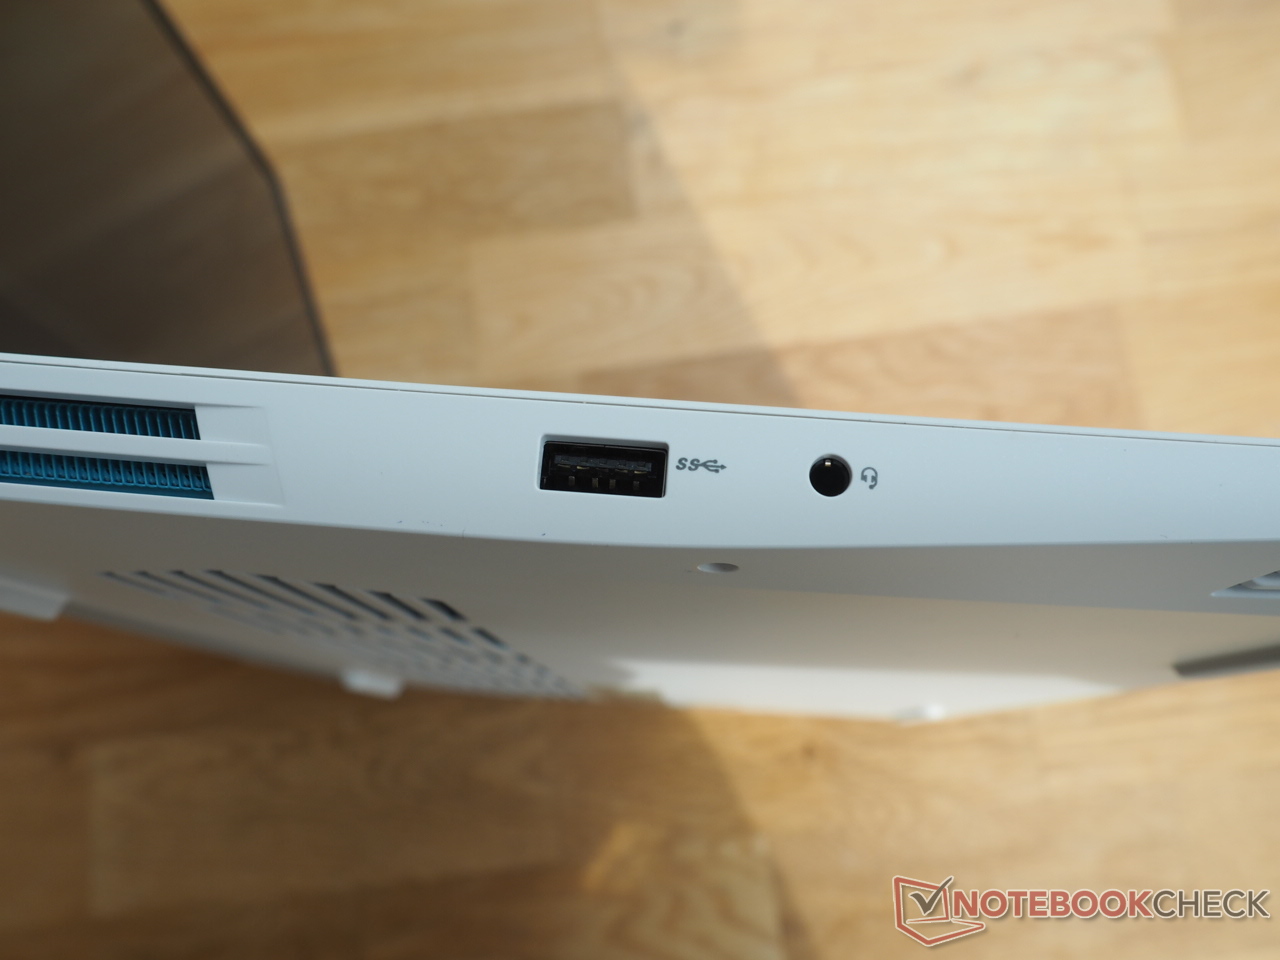
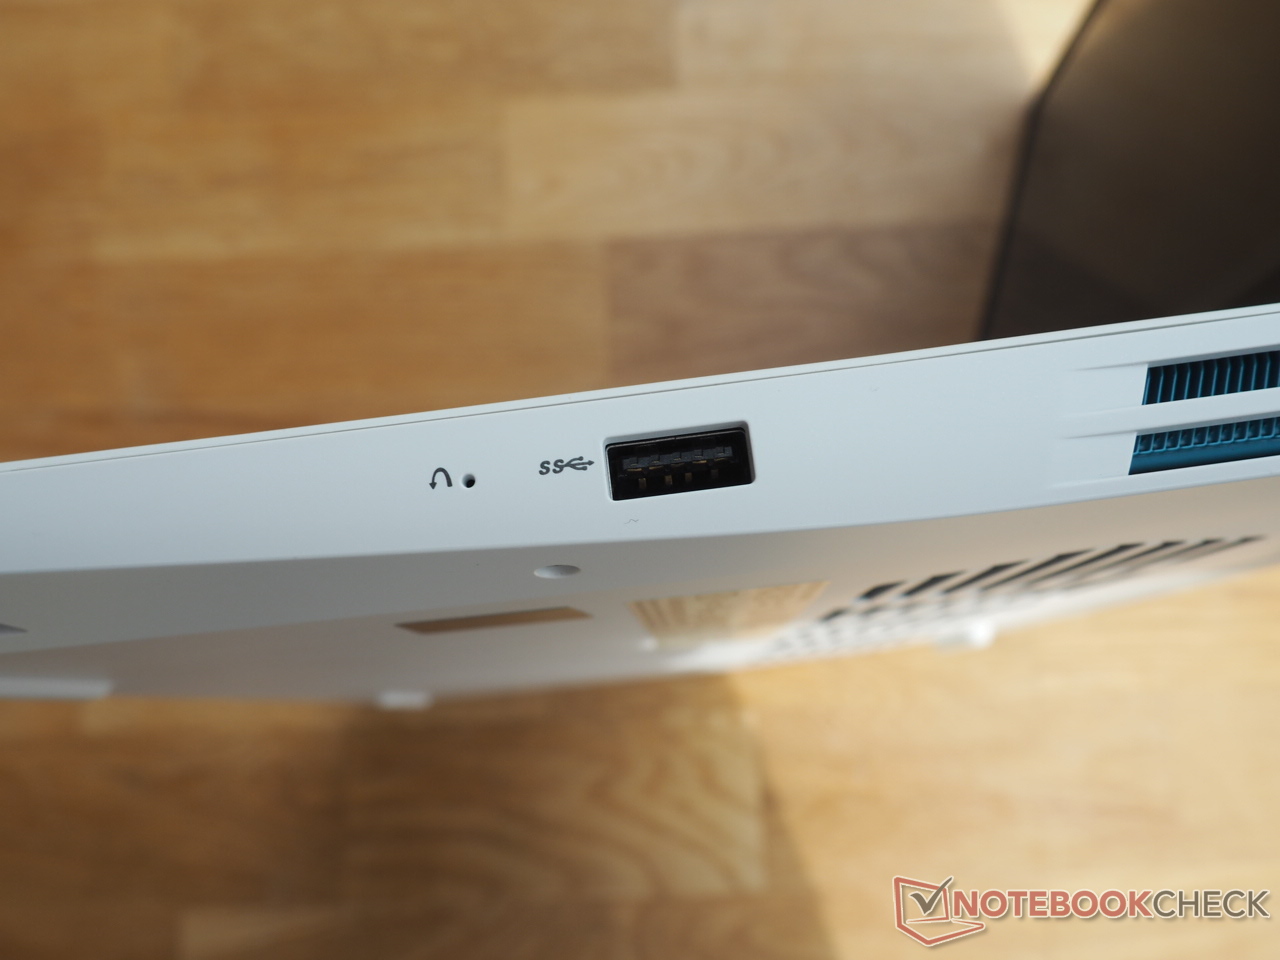
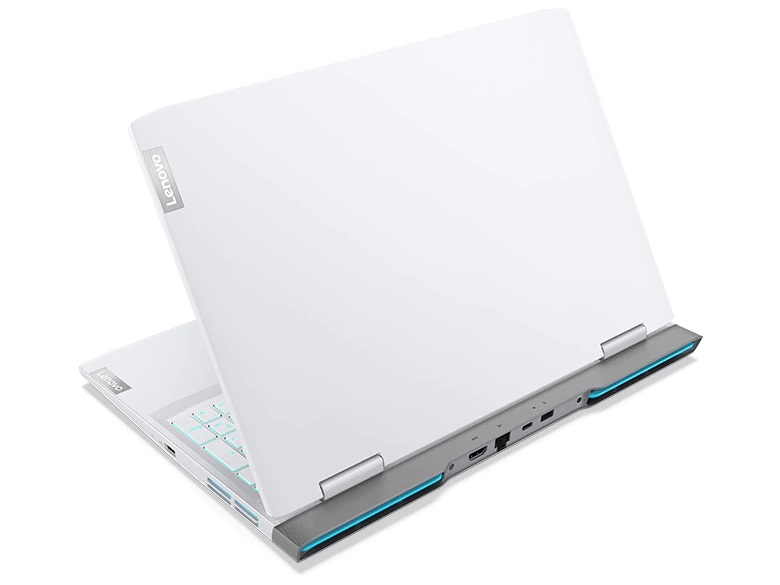
Como além da cor (Glacier White em vez de Onyx Grey) e do layout do teclado (German em vez de US), o caso é idêntico ao modelo de irmão listado acima, não discutiremos mais aqui o caso, o equipamento e os dispositivos de entrada. Você pode encontrar as informações correspondentes no revisão do modelo de irmão.

| Networking - iperf3 receive AXE11000 | |
| Média da turma Gaming (680 - 1745, n=94, últimos 2 anos) | |
| Lenovo IdeaPad Gaming 3 15IAH7 | |
| Média Realtek RTL8852BE (455 - 985, n=72) | |
| HP Victus 16-e0145ng | |
| Lenovo IdeaPad Gaming 3 15ARH7 | |
Webcam


Mostrar
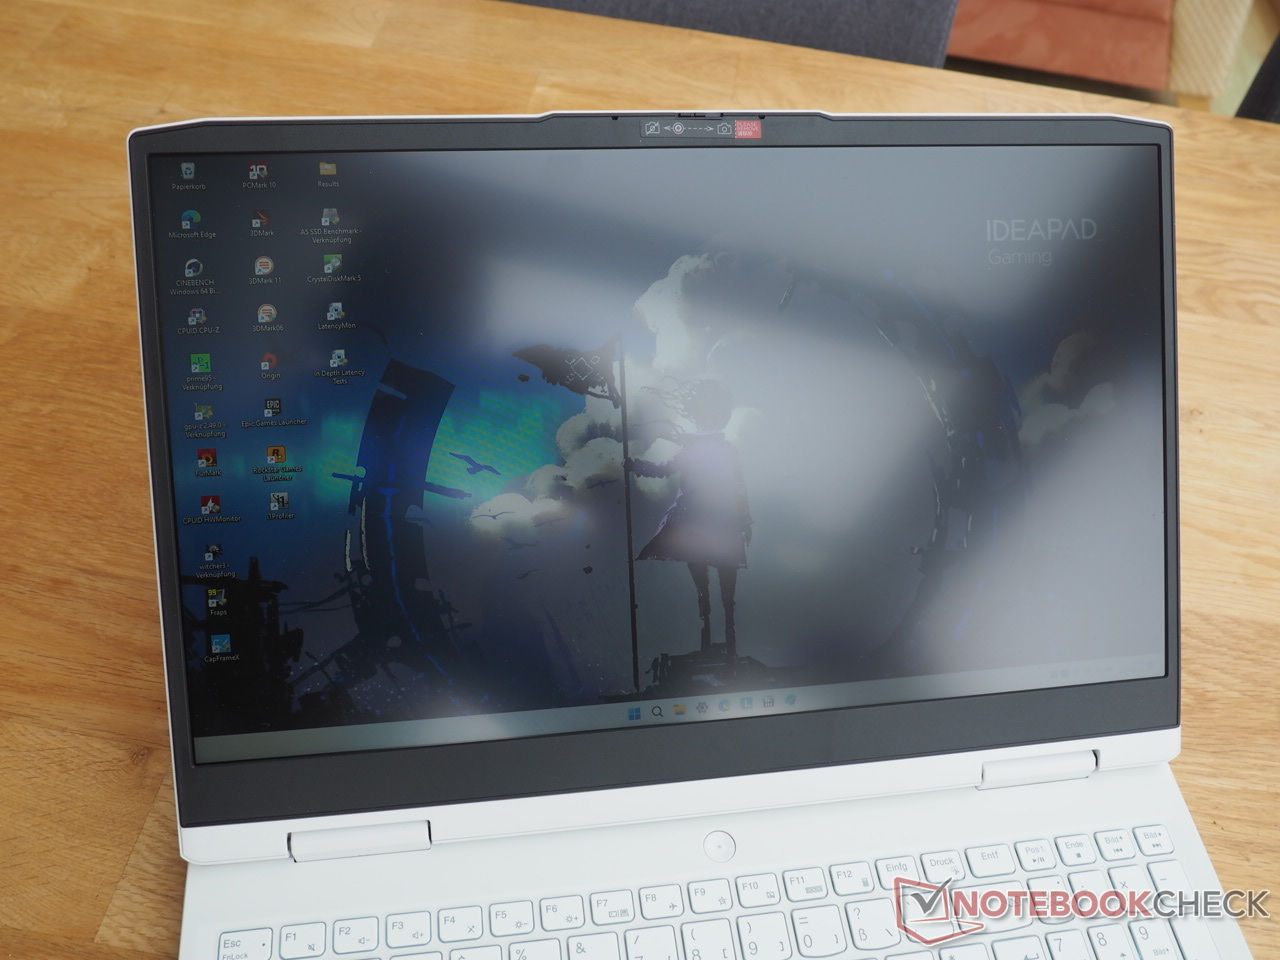
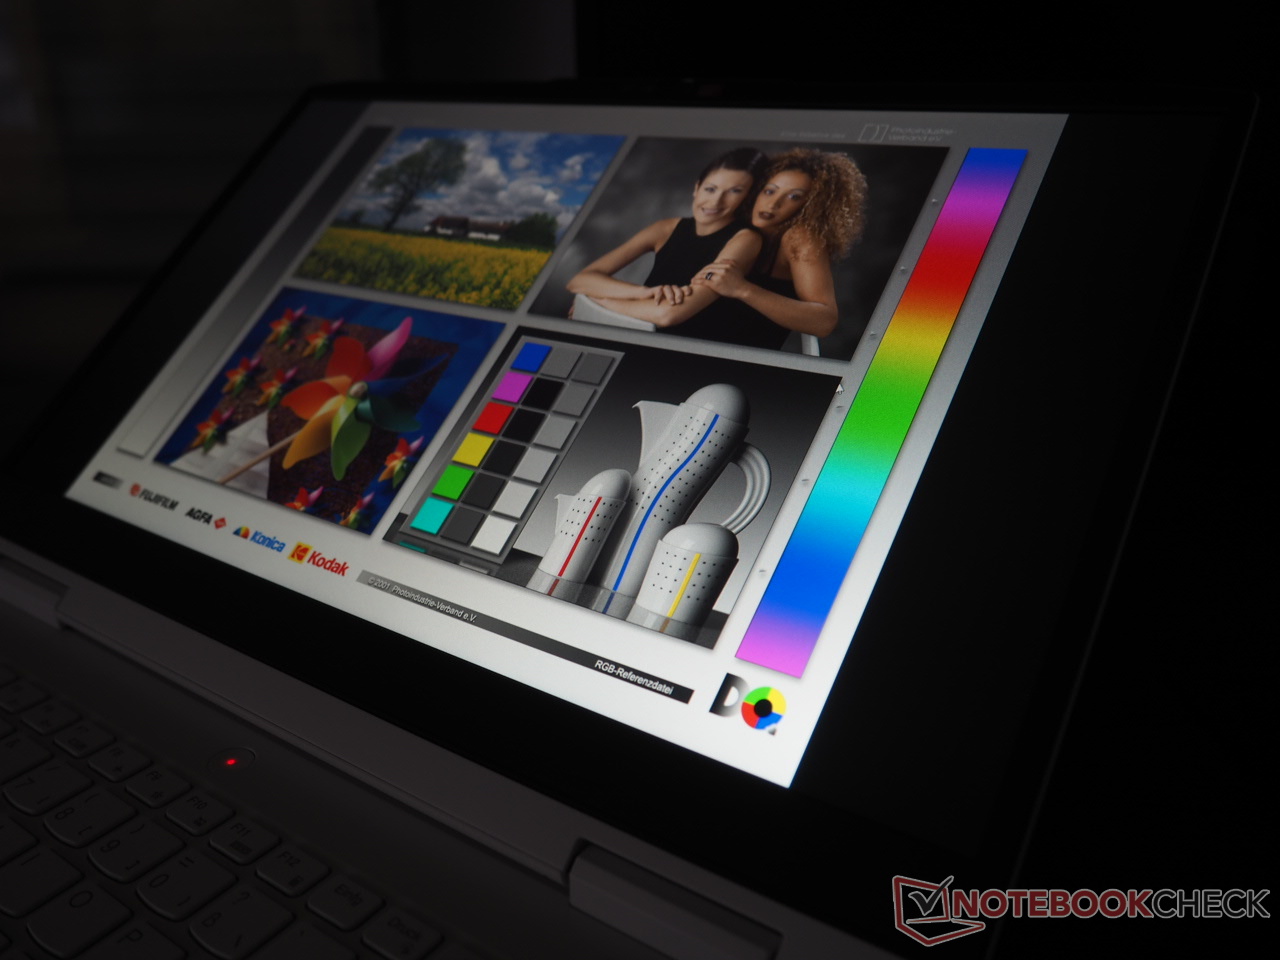
Olhando para o campo de comparação, você pode facilmente ver que os laptops para jogos a preços acessíveis muitas vezes vêm com uma tela escassa.
| |||||||||||||||||||||||||
iluminação: 92 %
iluminação com acumulador: 338 cd/m²
Contraste: 1252:1 (Preto: 0.27 cd/m²)
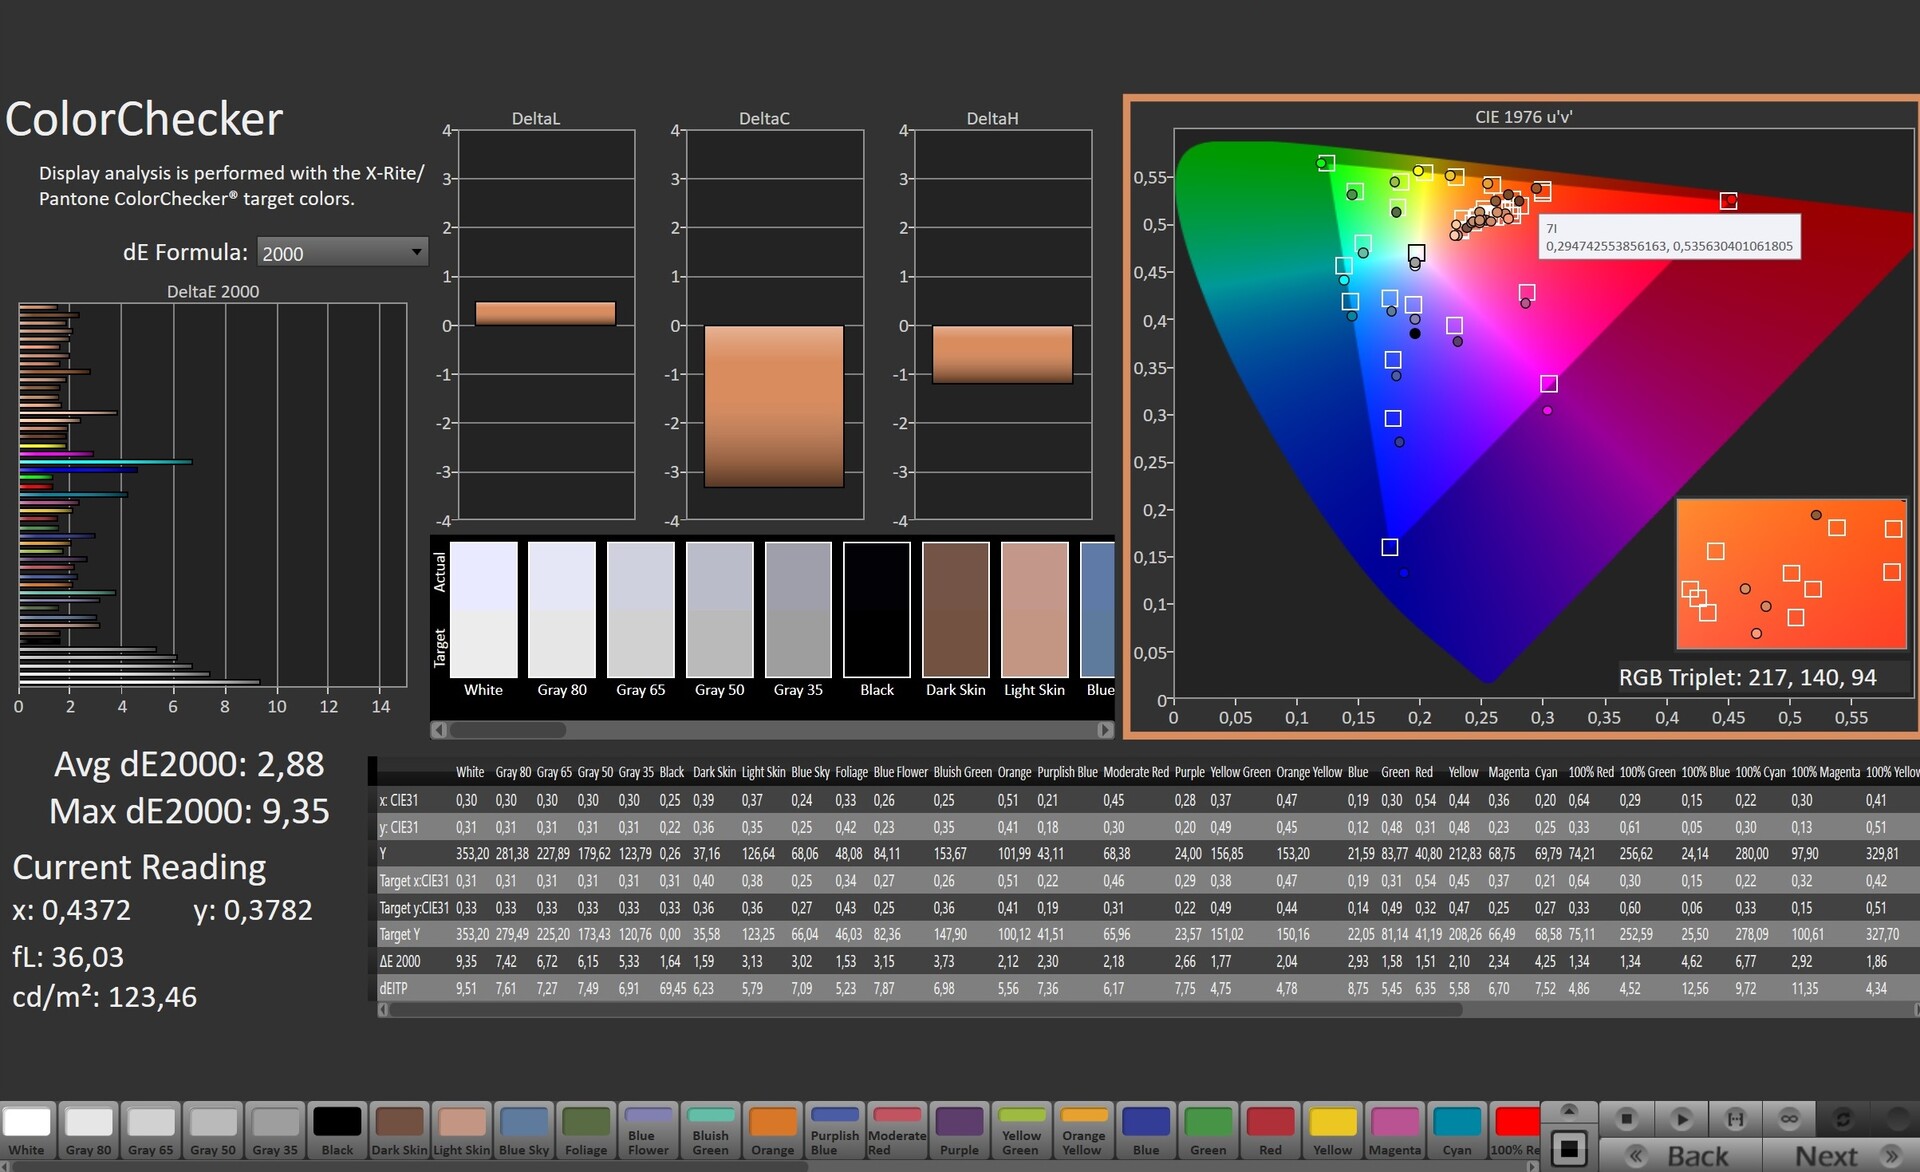
ΔE ColorChecker Calman: 2.88 | ∀{0.5-29.43 Ø4.72}
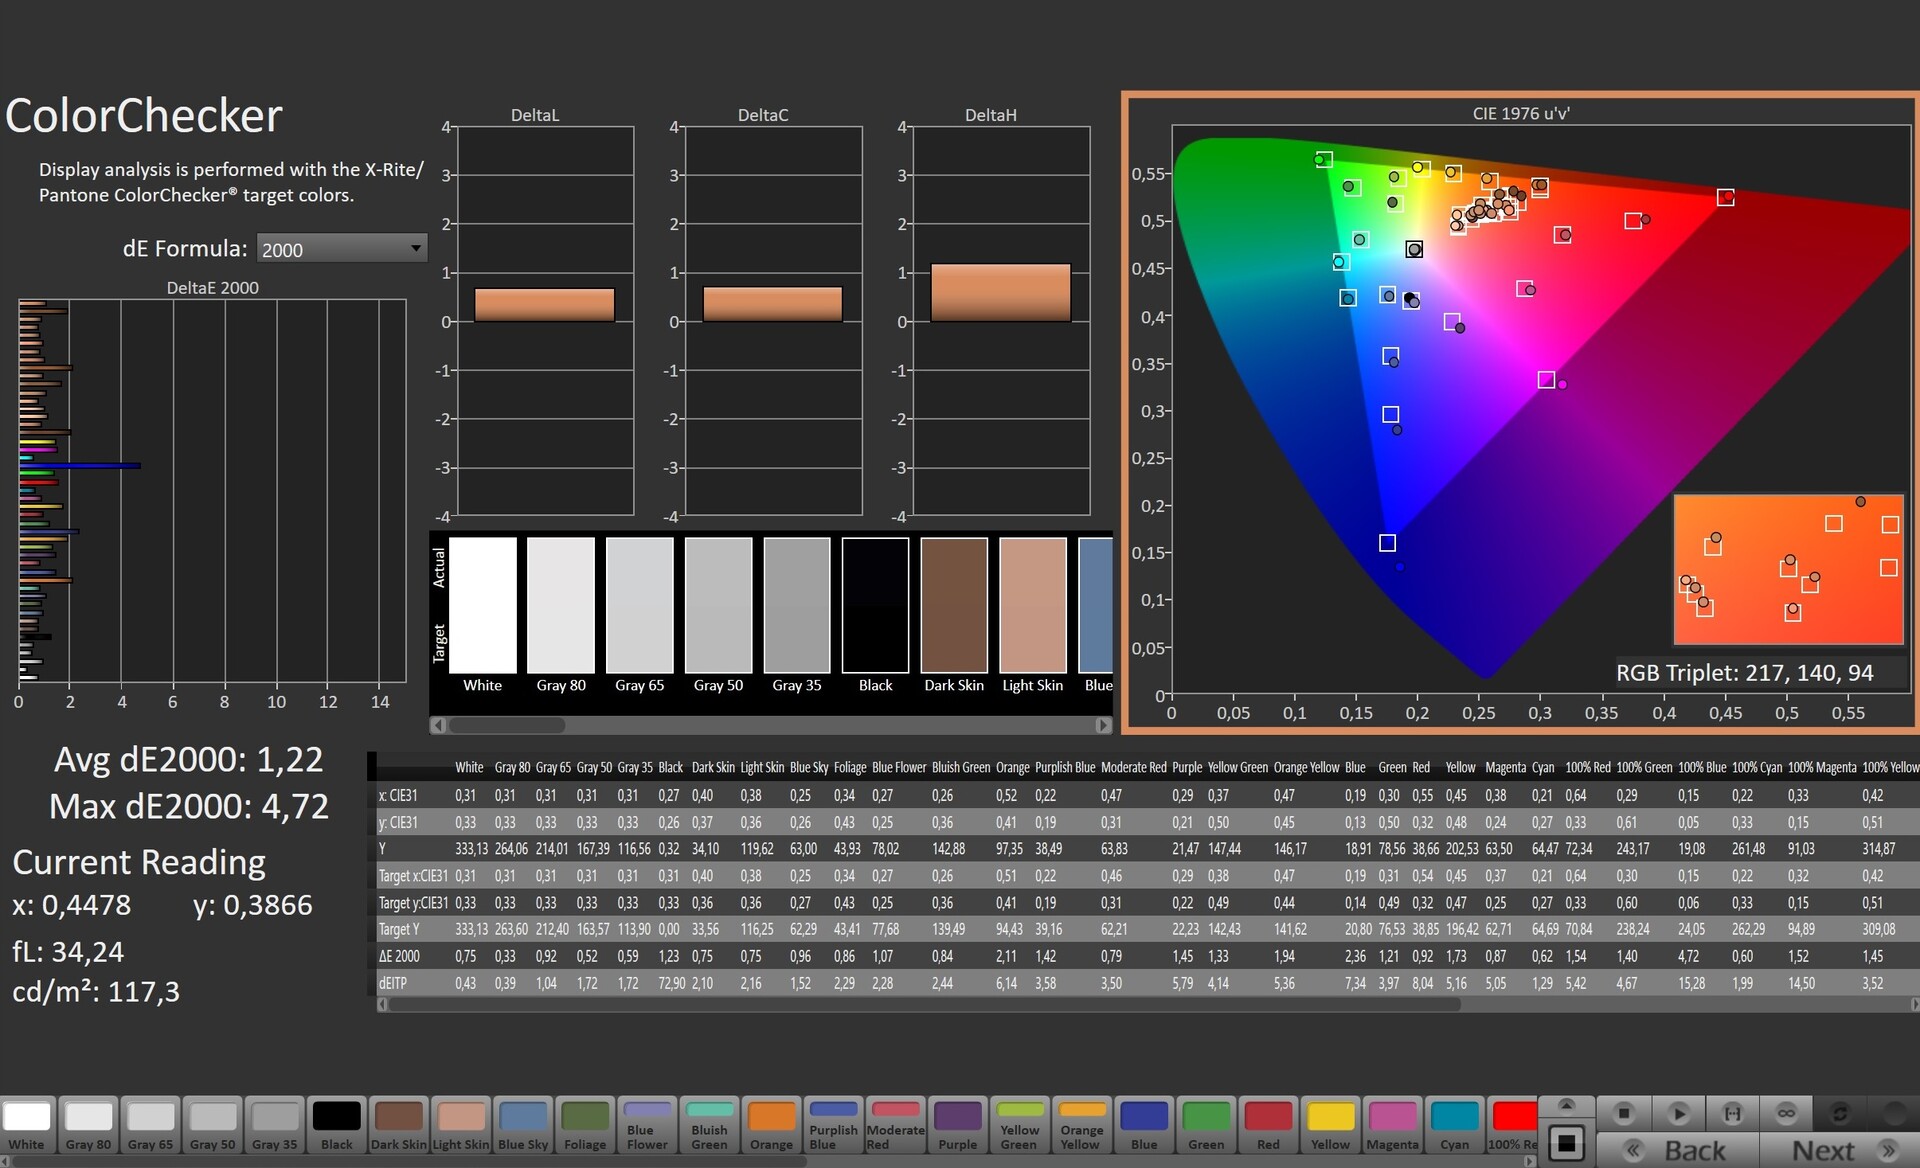
calibrated: 1.22
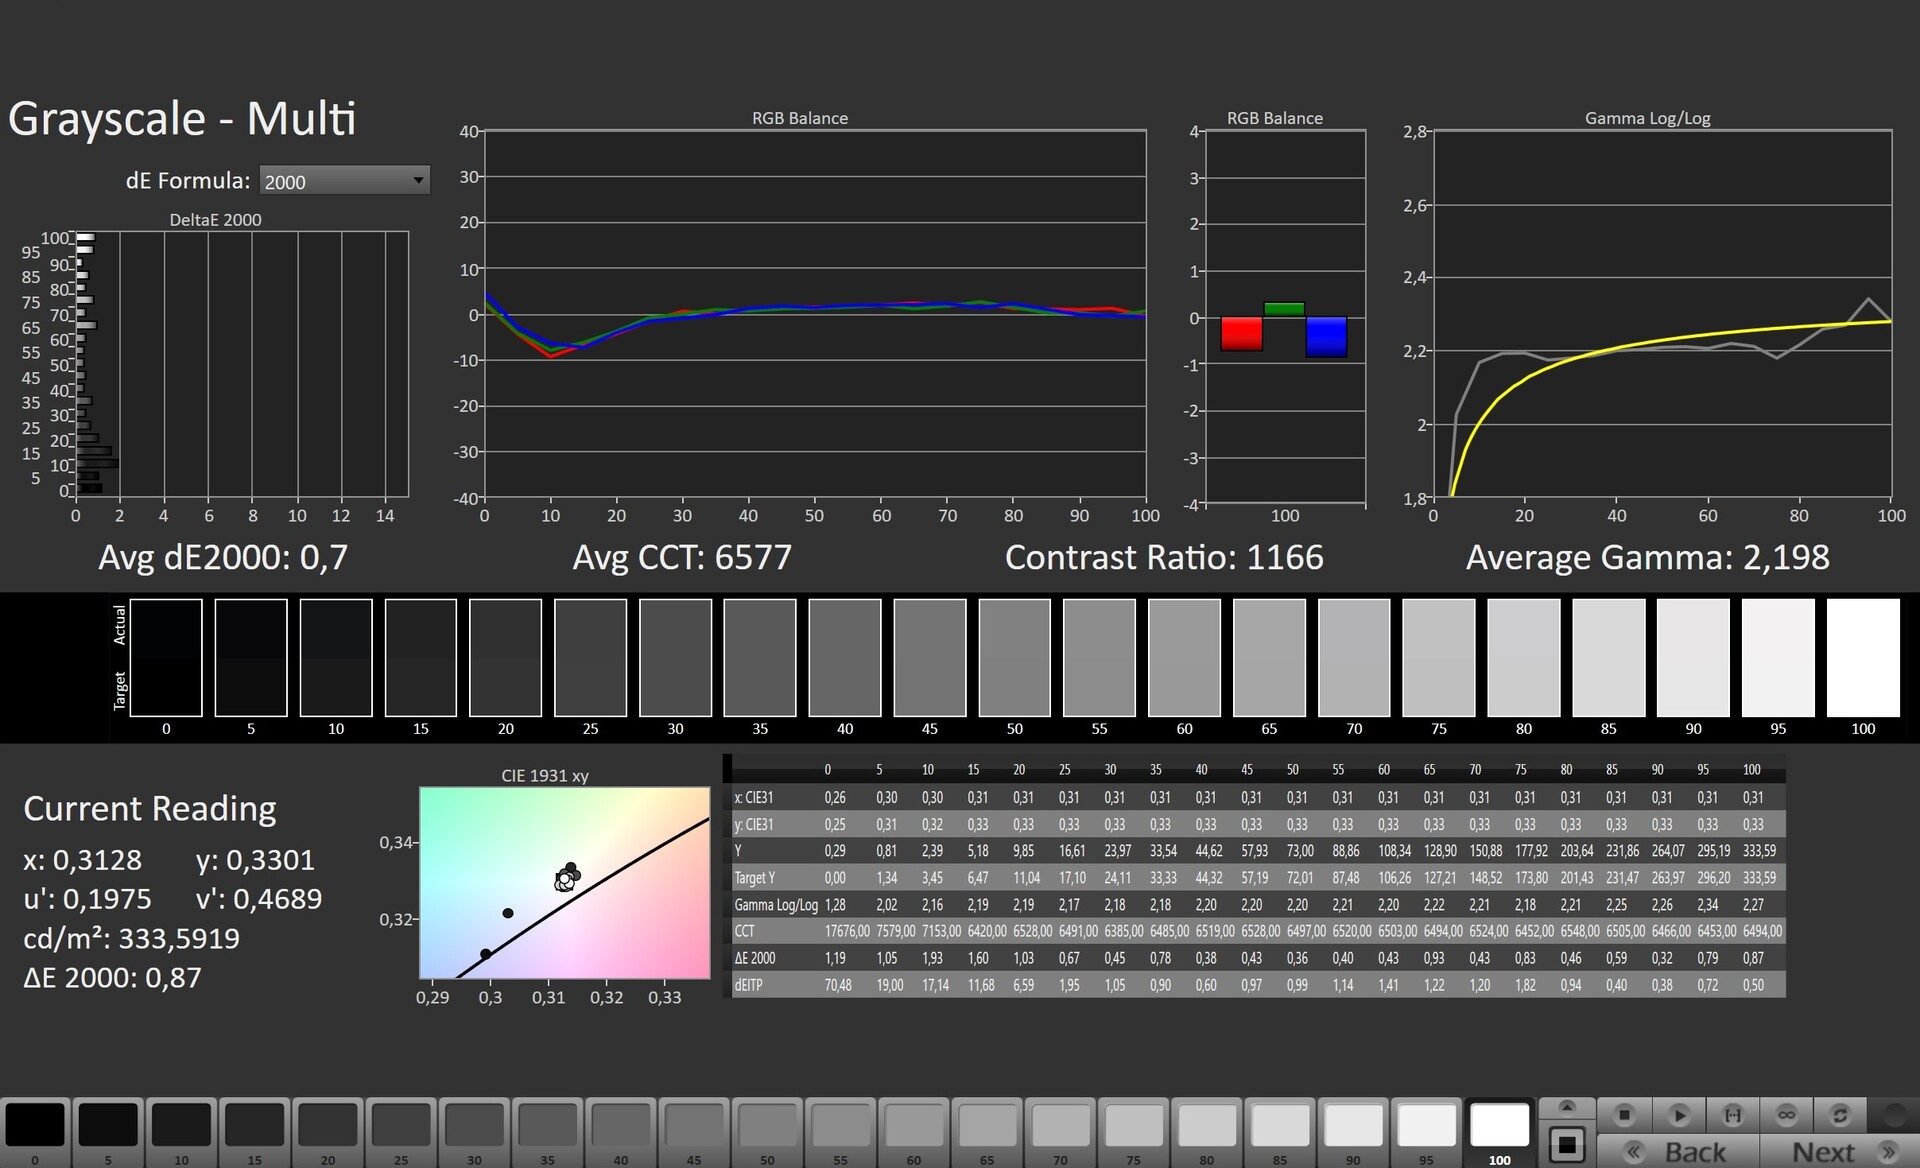
ΔE Greyscale Calman: 5 | ∀{0.09-98 Ø4.97}
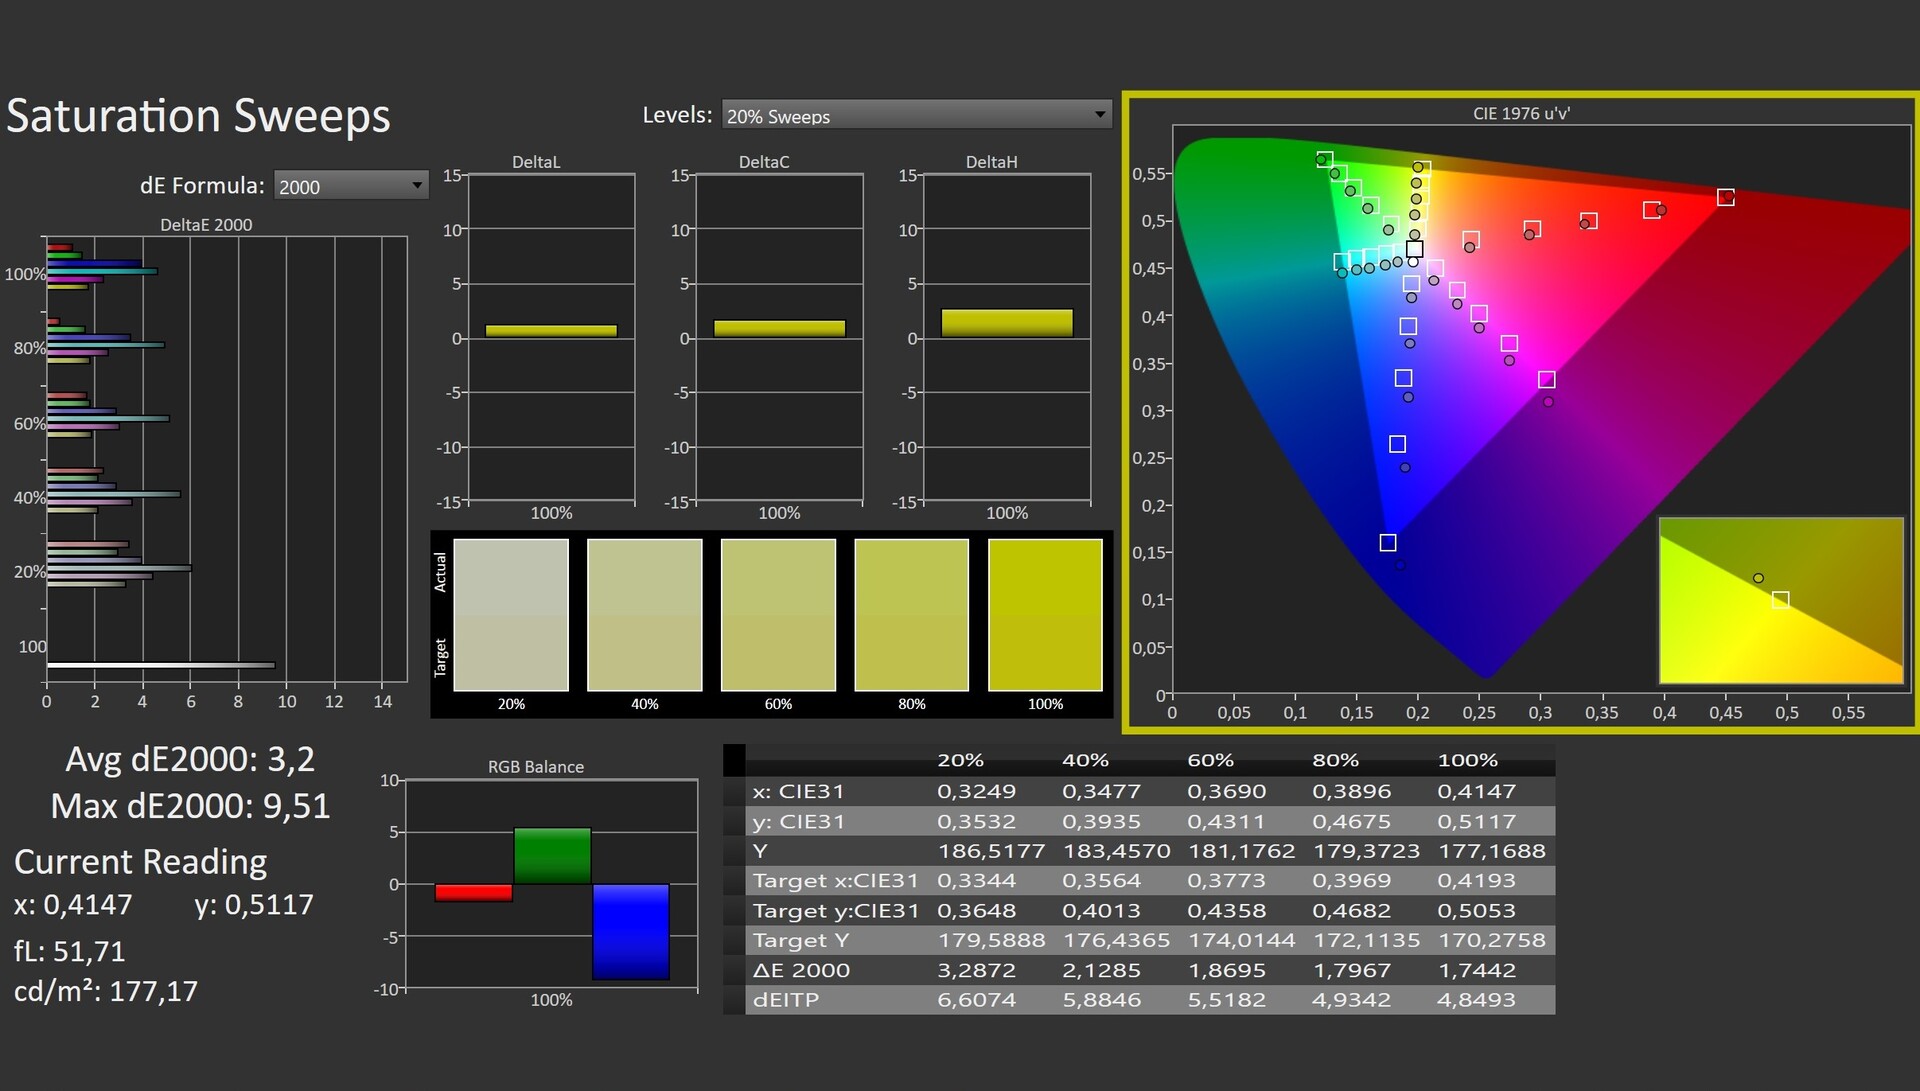
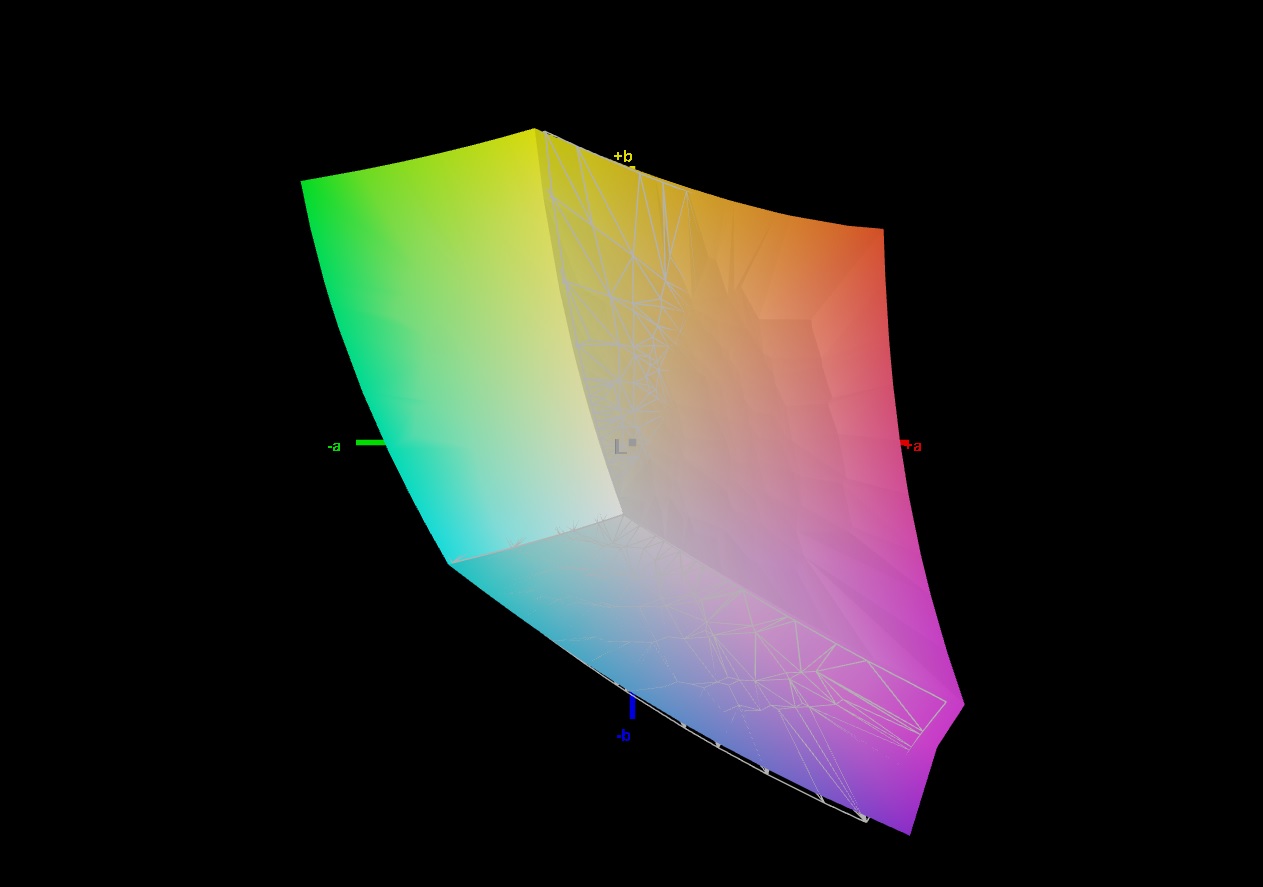
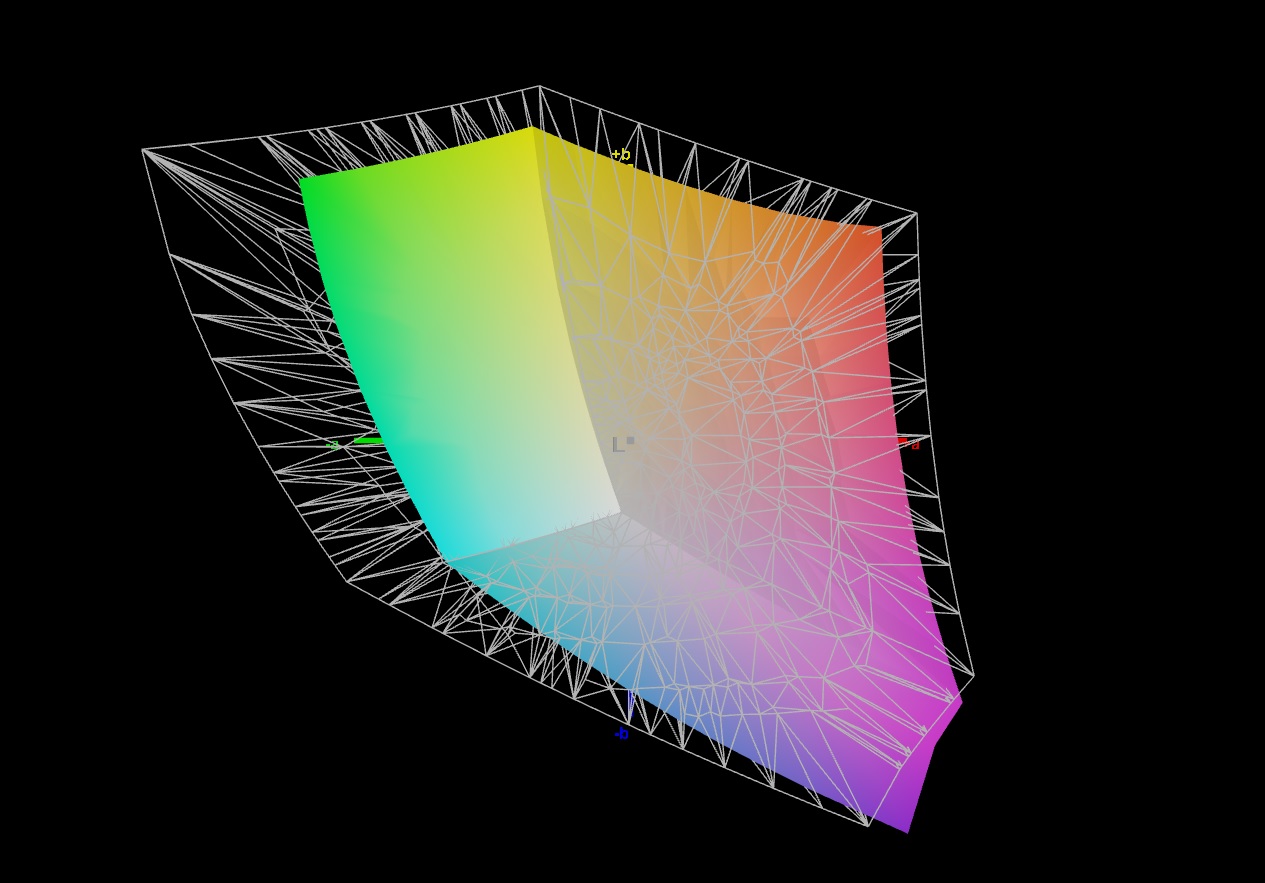
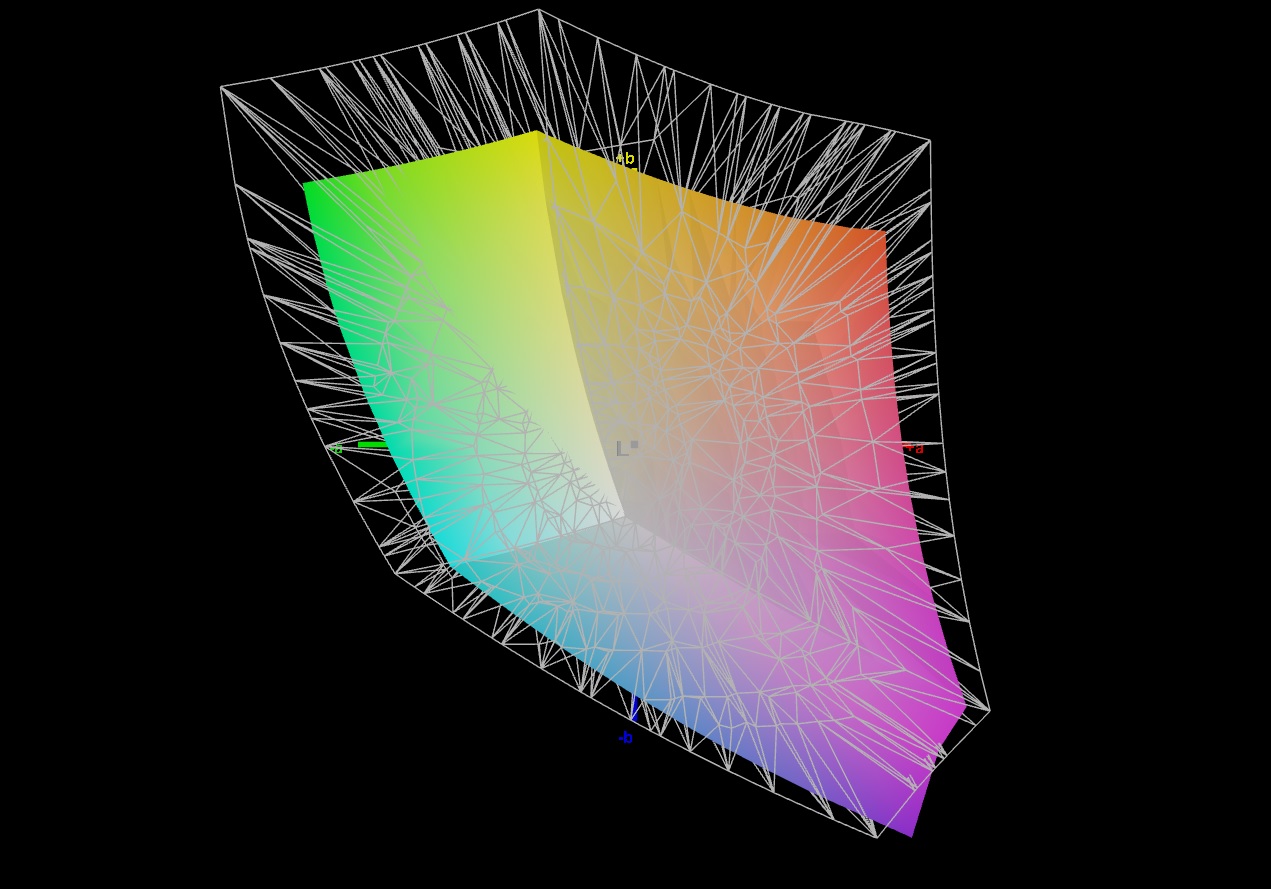
69.9% AdobeRGB 1998 (Argyll 3D)
99.2% sRGB (Argyll 3D)
69.1% Display P3 (Argyll 3D)
Gamma: 2.162
CCT: 7497 K
| Lenovo IdeaPad Gaming 3 15IAH7 Lenovo LEN156FHD, IPS, 1920x1080, 15.6" | Lenovo IdeaPad Gaming 3 15ARH7 LEN156FHD, IPS, 1920x1080, 15.6" | Dell G15 5515 BOE092A, IPS, 1920x1080, 15.6" | HP Victus 16-e0145ng CMN1609, IPS, 1920x1080, 16.1" | Dell Inspiron 16 Plus 7620 BOE NE16N41, IPS, 3072x1920, 16" | |
|---|---|---|---|---|---|
| Display | -42% | -43% | -39% | 2% | |
| Display P3 Coverage (%) | 69.1 | 39.4 -43% | 39.1 -43% | 41.6 -40% | 70.8 2% |
| sRGB Coverage (%) | 99.2 | 58 -42% | 56.9 -43% | 61.9 -38% | 99.5 0% |
| AdobeRGB 1998 Coverage (%) | 69.9 | 40.7 -42% | 40.4 -42% | 43 -38% | 73.2 5% |
| Response Times | -90% | -97% | -130% | -213% | |
| Response Time Grey 50% / Grey 80% * (ms) | 13 ? | 20.8 ? -60% | 25.2 ? -94% | 29.6 ? -128% | 38 ? -192% |
| Response Time Black / White * (ms) | 8.4 ? | 18.4 ? -119% | 16.8 ? -100% | 19.4 ? -131% | 28 ? -233% |
| PWM Frequency (Hz) | 200 ? | ||||
| Screen | -45% | -64% | -66% | 21% | |
| Brightness middle (cd/m²) | 338 | 287.8 -15% | 278 -18% | 257 -24% | 288.9 -15% |
| Brightness (cd/m²) | 329 | 268 -19% | 262 -20% | 239 -27% | 276 -16% |
| Brightness Distribution (%) | 92 | 86 -7% | 83 -10% | 88 -4% | 92 0% |
| Black Level * (cd/m²) | 0.27 | 0.3 -11% | 0.36 -33% | 0.25 7% | 0.26 4% |
| Contrast (:1) | 1252 | 959 -23% | 772 -38% | 1028 -18% | 1111 -11% |
| Colorchecker dE 2000 * | 2.88 | 6.3 -119% | 5.74 -99% | 6.91 -140% | 1.88 35% |
| Colorchecker dE 2000 max. * | 9.35 | 21.32 -128% | 19.63 -110% | 22.27 -138% | 4.37 53% |
| Colorchecker dE 2000 calibrated * | 1.22 | 2.53 -107% | 4.7 -285% | 3.61 -196% | 0.42 66% |
| Greyscale dE 2000 * | 5 | 4 20% | 3.1 38% | 7.5 -50% | 1.4 72% |
| Gamma | 2.162 102% | 2.21 100% | 2.011 109% | 2.125 104% | 2.3 96% |
| CCT | 7497 87% | 6762 96% | 6207 105% | 6025 108% | 6634 98% |
| Média Total (Programa/Configurações) | -59% /
-51% | -68% /
-64% | -78% /
-69% | -63% /
-16% |
* ... menor é melhor
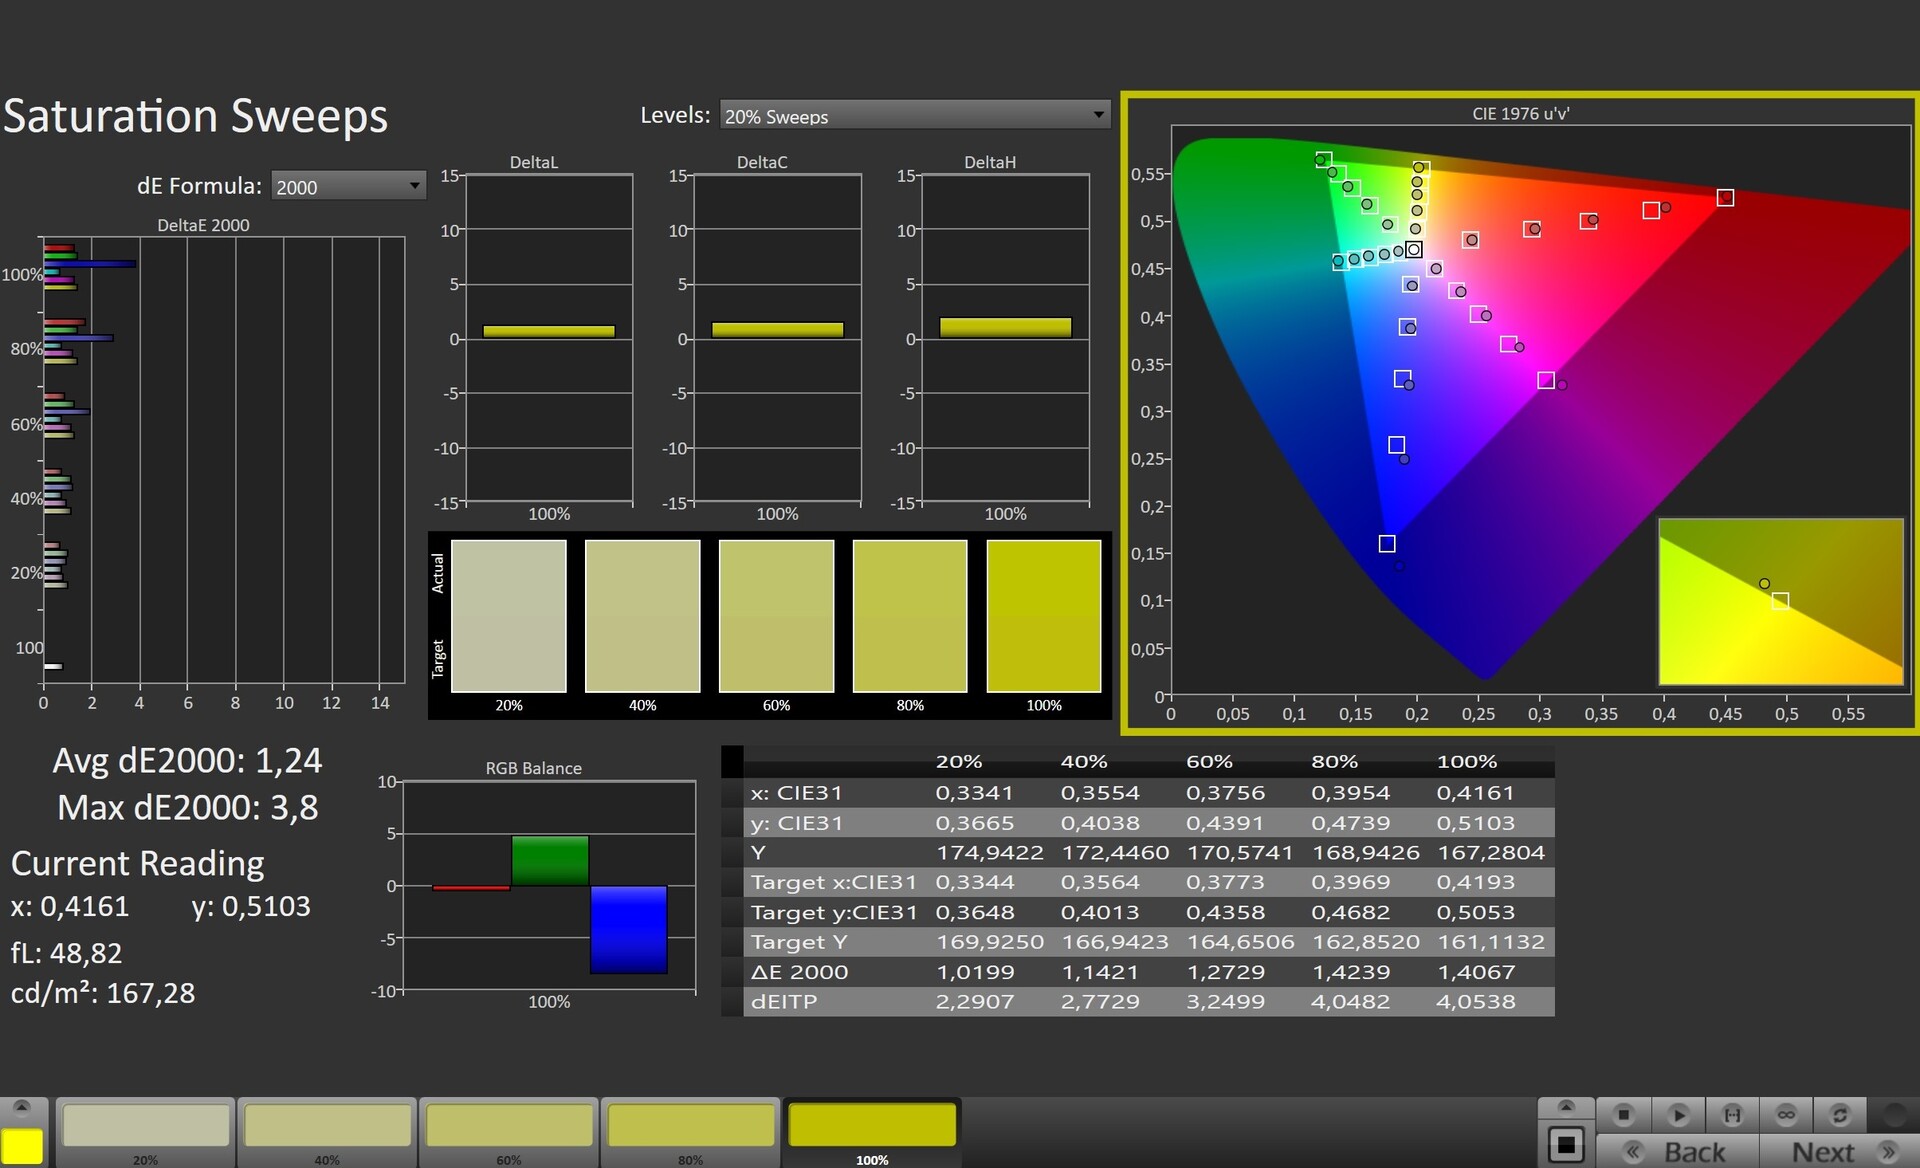
Pequenos espaços de cor e um baixo brilho são generalizados no segmento de 1.000 euros. Mas este não é o caso do IdeaPad Gaming 15 15IAH7: Cerca de 100% de cobertura sRGB e um brilho médio de 329 cd/m² fazem justiça ao preço do laptop.
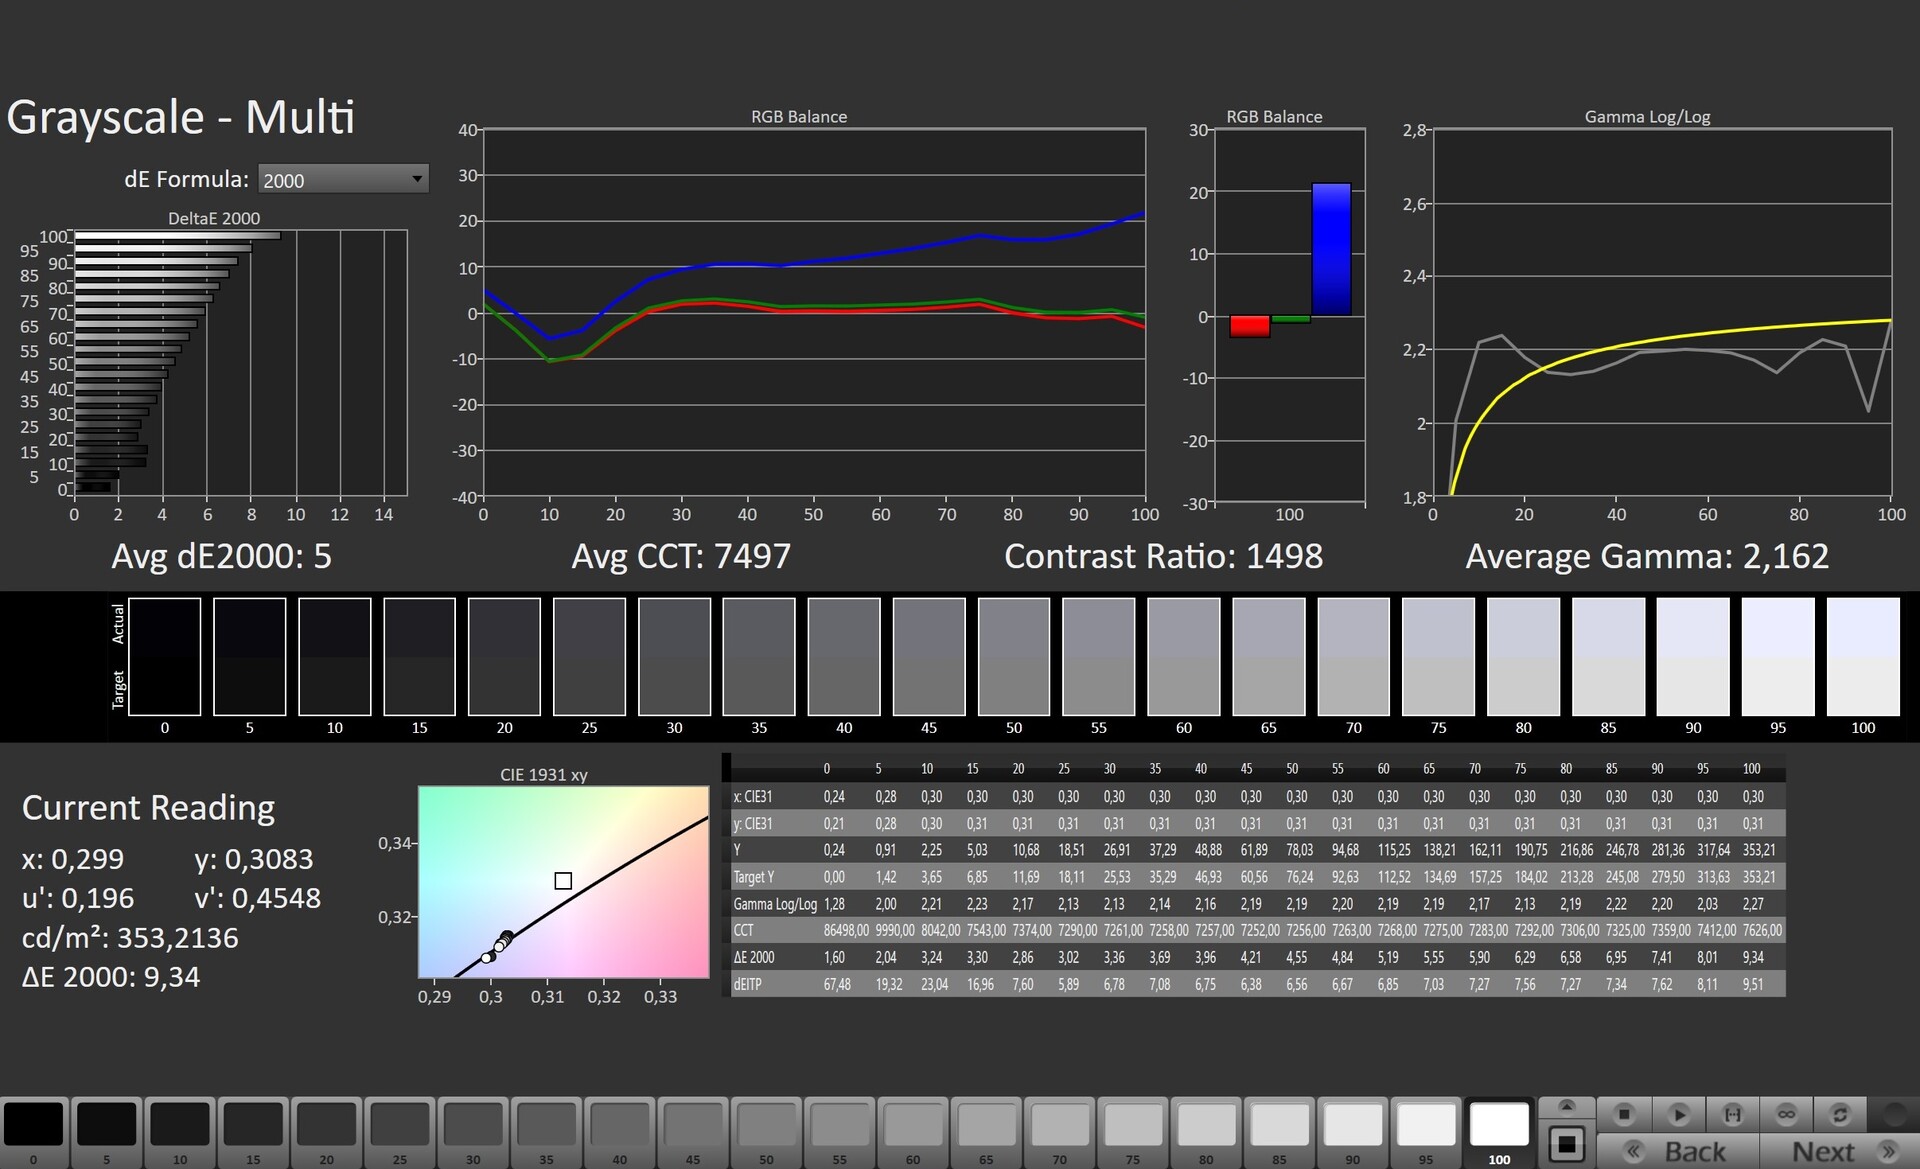
O laptop de 15 polegadas também atinge uma boa figura nas demais disciplinas. Um tempo de resposta de 8 a 13 ms é definitivamente um bom valor. O mesmo vale também para o contraste de 1252:1, que também está acima da média.
A única coisa de que você poderia reclamar é a precisão da cor. No estado de entrega, o painel 165-Hz tem uma coloração azul clara. Entretanto, isto pode ser corrigido com uma calibração (nosso arquivo ICC está vinculado para download gratuito acima à direita, ao lado do gráfico de distribuição de brilho). Nossa unidade de teste não mostra nenhum sangramento na tela ou PWM cintilando.
Exibir tempos de resposta
| ↔ Tempo de resposta preto para branco | ||
|---|---|---|
| 8.4 ms ... ascensão ↗ e queda ↘ combinadas | ↗ 4.2 ms ascensão | 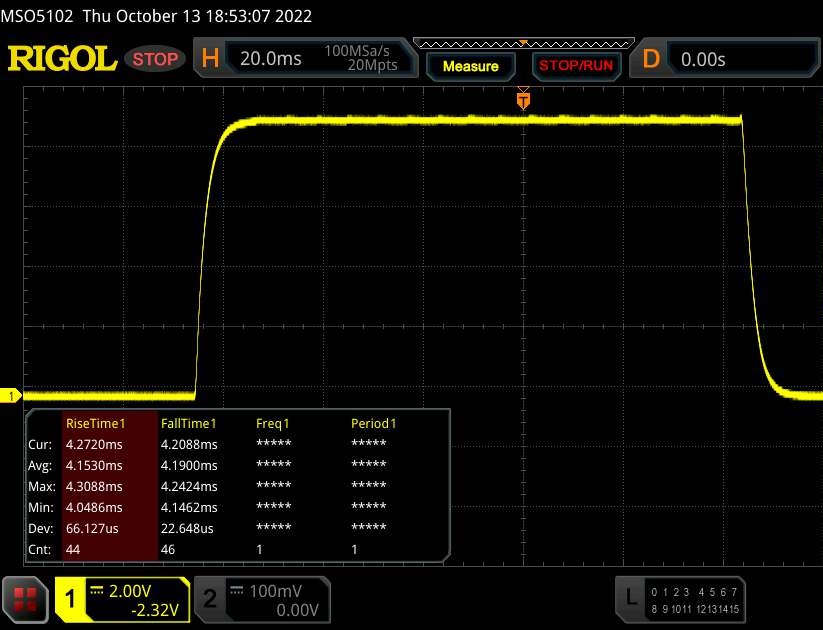 |
| ↘ 4.2 ms queda | ||
| A tela mostra taxas de resposta rápidas em nossos testes e deve ser adequada para jogos. Em comparação, todos os dispositivos testados variam de 0.1 (mínimo) a 240 (máximo) ms. » 24 % de todos os dispositivos são melhores. Isso significa que o tempo de resposta medido é melhor que a média de todos os dispositivos testados (19.8 ms). | ||
| ↔ Tempo de resposta 50% cinza a 80% cinza | ||
| 13 ms ... ascensão ↗ e queda ↘ combinadas | ↗ 6.3 ms ascensão | 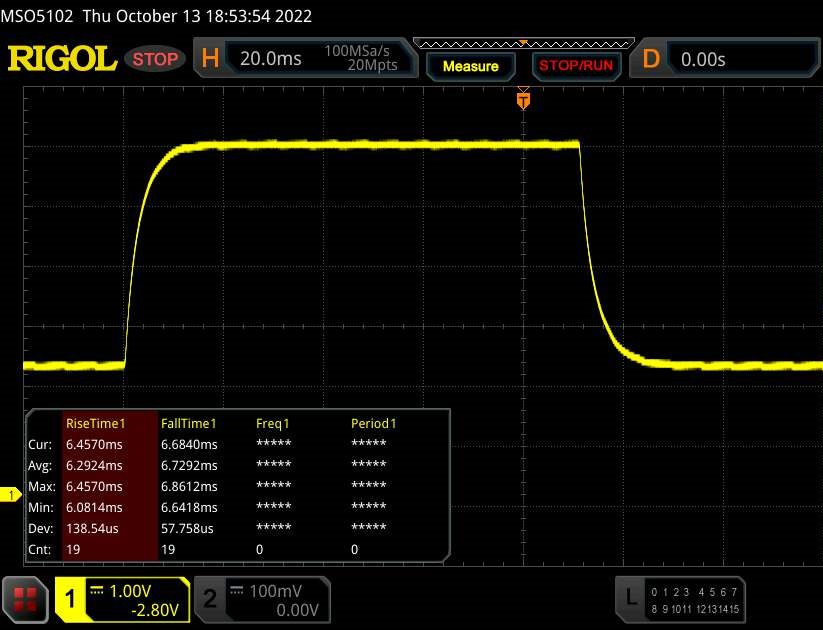 |
| ↘ 6.7 ms queda | ||
| A tela mostra boas taxas de resposta em nossos testes, mas pode ser muito lenta para jogadores competitivos. Em comparação, todos os dispositivos testados variam de 0.165 (mínimo) a 636 (máximo) ms. » 26 % de todos os dispositivos são melhores. Isso significa que o tempo de resposta medido é melhor que a média de todos os dispositivos testados (31 ms). | ||
Cintilação da tela / PWM (modulação por largura de pulso)
| Tela tremeluzindo / PWM não detectado | 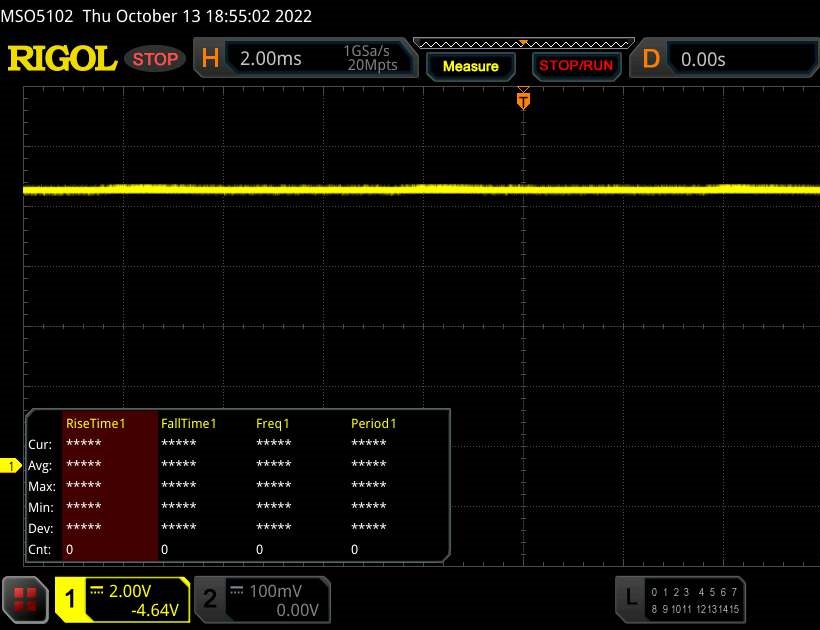 | ||
[pwm_comparison] Em comparação: 52 % de todos os dispositivos testados não usam PWM para escurecer a tela. Se PWM foi detectado, uma média de 7781 (mínimo: 5 - máximo: 343500) Hz foi medida. | |||
Desempenho
O desempenho do IdeaPad Gaming 3 15IAH7 coloca-o na faixa média. O processador com muitos núcleos e 16 GB de memória de trabalho deve oferecer reservas suficientes para anos futuros, embora, por razões de desempenho, a Lenovo deveria ter usado RAM de canal duplo ao invés de um único módulo de RAM. Embora o SSD M.2 embutido venha apenas no formato 2242, o case ainda oferece espaço para um SSD clássico 2280. A placa gráfica deixa impressões mistas. Por um lado, a RTX 3050 Ti oferece uma sólida relação preço-desempenho, mas por outro lado, 4 GB de VRAM não é muito à prova de futuro.

Condições de teste
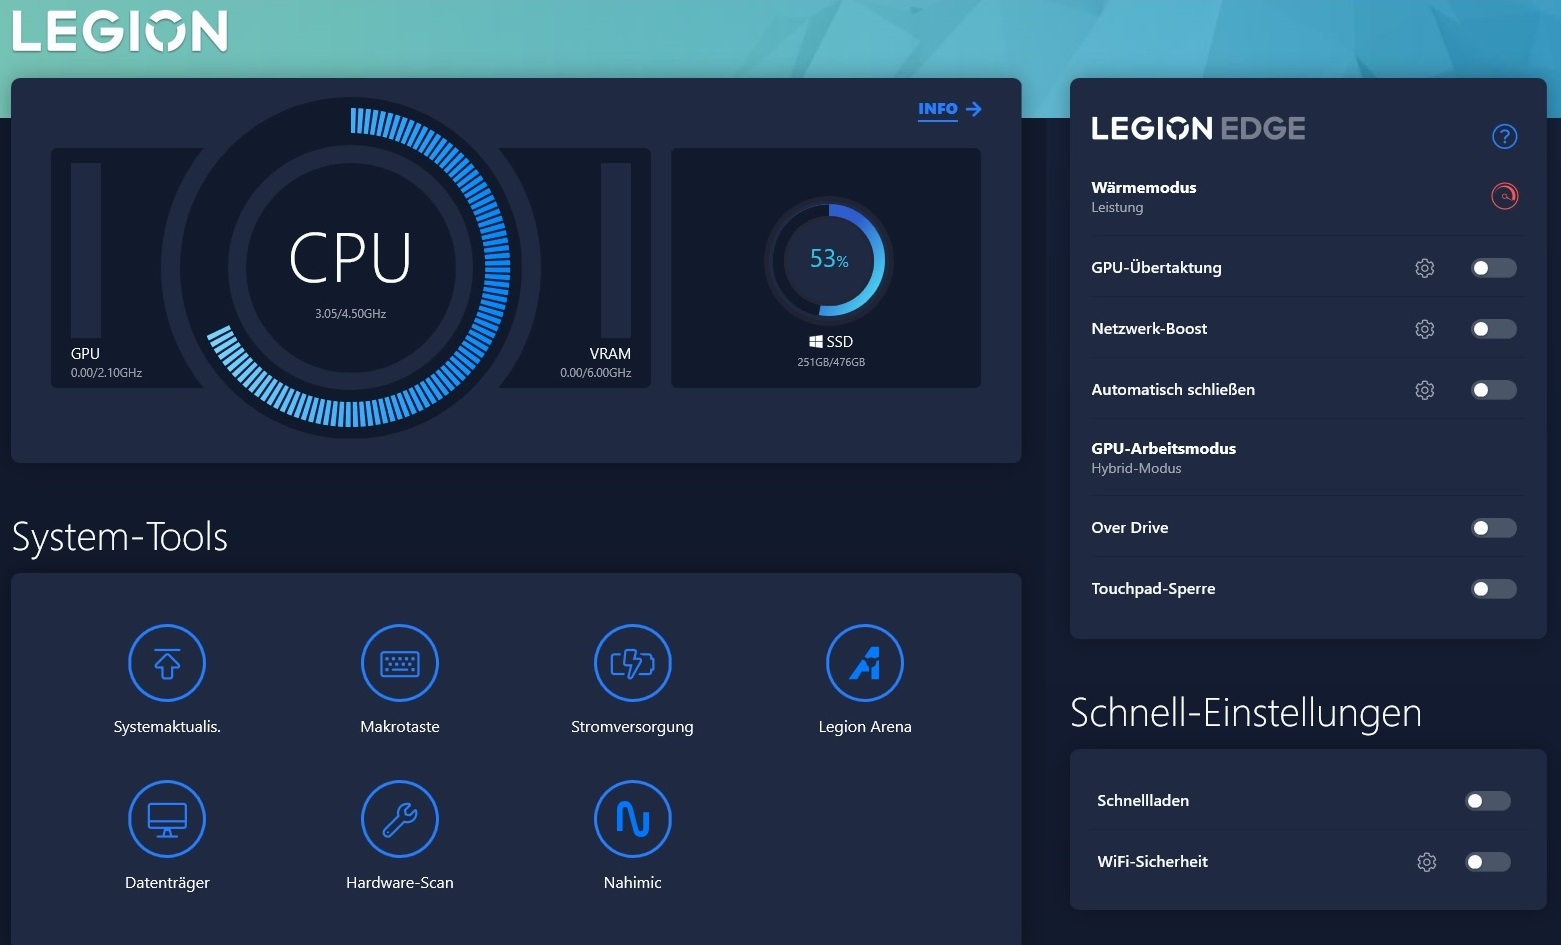
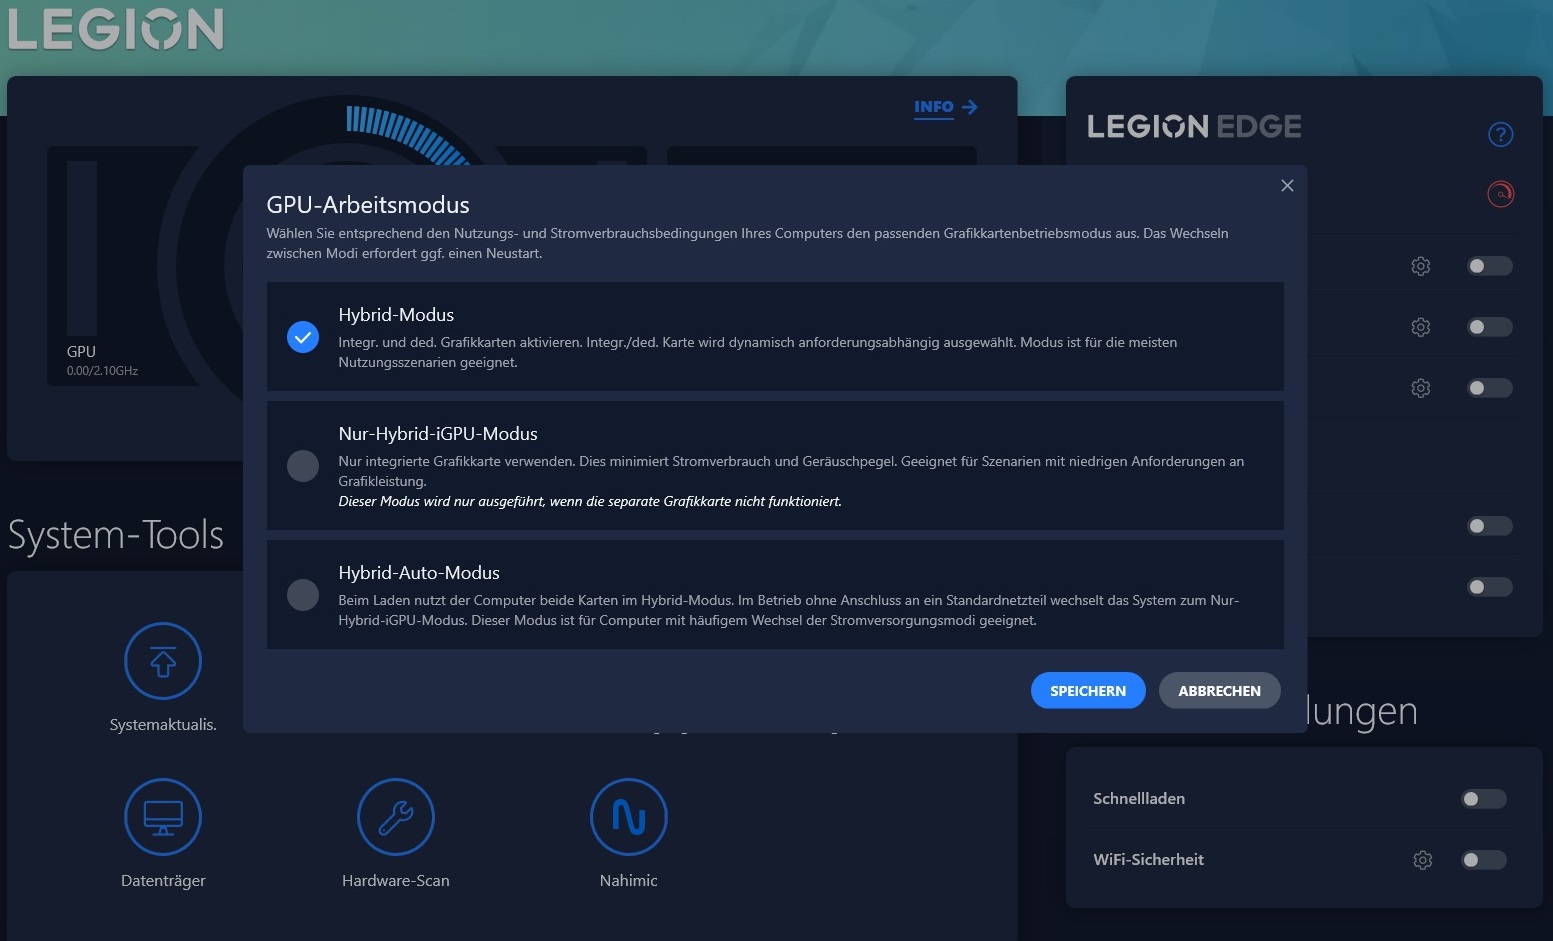
O software Lenovo Vantage pré-instalado oferece dezenas de opções de configuração, das quais o modo de potência e o modo de operação GPU são particularmente relevantes. A menos que listamos o contrário, todas as nossas medições são realizadas com o modo Performance e a comutação gráfica híbrida regular ativada. Entretanto, considerando a baixa queda de performance (ver gráfico), preferimos recomendar o uso do modo balanceado (perfil ajustado) na prática. No modo Silencioso, o funcionamento do dispositivo é novamente significativamente mais silencioso. Apesar de uma queda de cerca de 30% nas taxas de quadros, muitos jogos ainda são jogáveis.
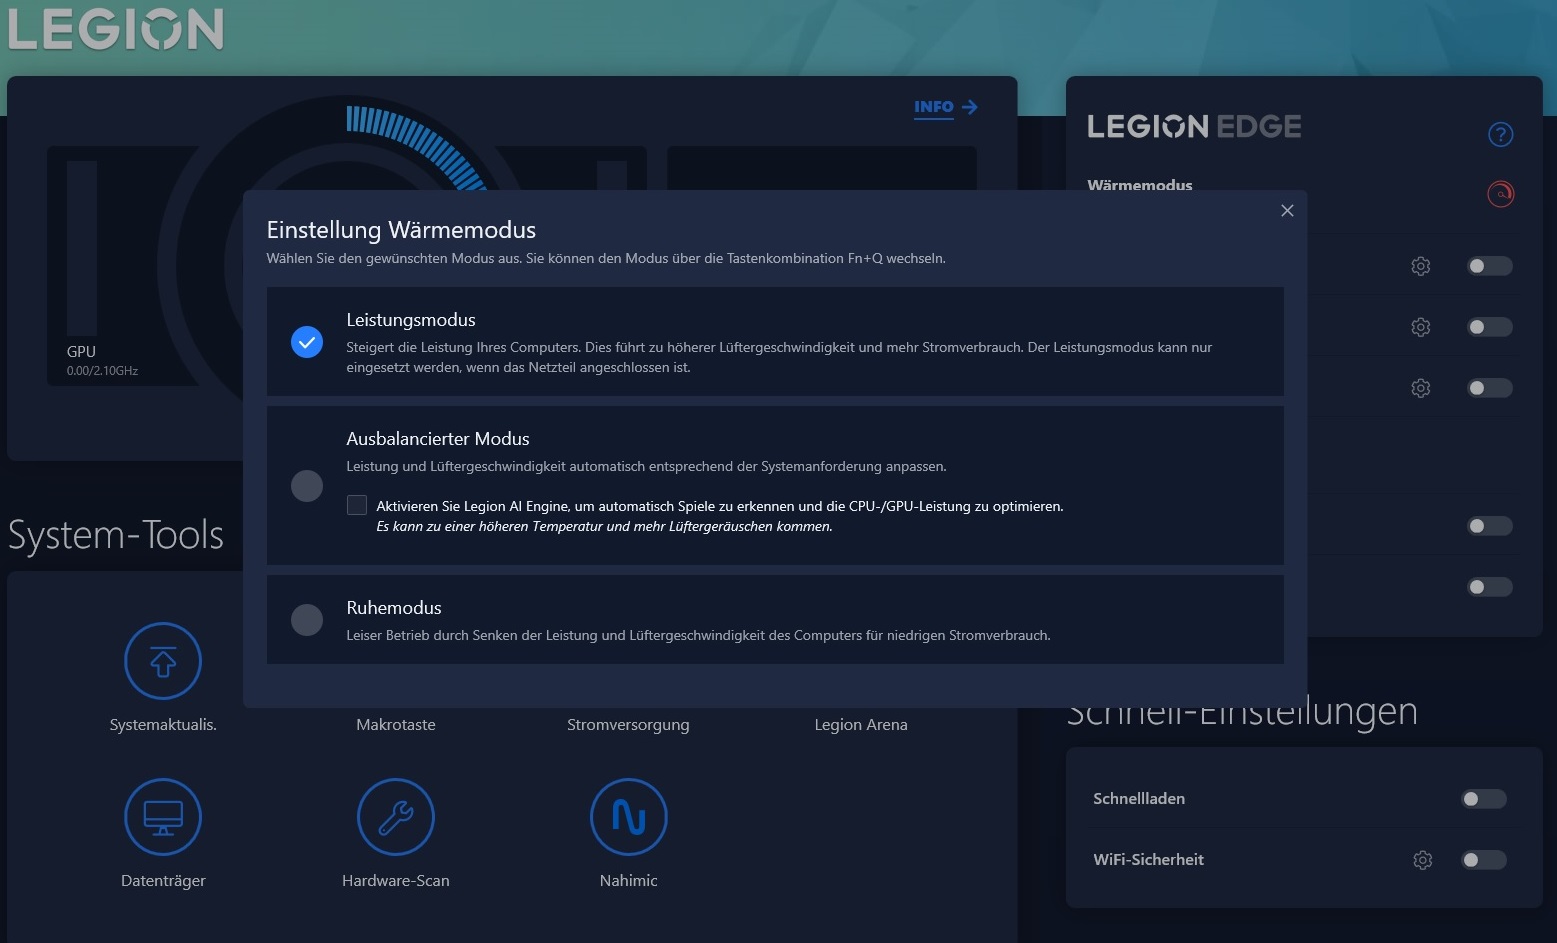
| O Witcher 3 (FHD/Ultra) | Nível de ruído | Desempenho |
| Modo de desempenho | 46 dB(A) | base (~60 FPS) |
| Modo ajustado | 43 dB(A) | -7% (~56 FPS) |
| Modo silencioso | 34 dB(A) | -30% (~42 FPS) |
Processador
O Core i5-12500H é um modelo de 12 núcleos da geração Alder Lake da Intel que inclui 4 núcleos de desempenho (incluindo hyperthreading) e 8 núcleos de eficiência (sem hyperthreading) e é especificado em um TDP de 45 Watt. Nos testes da CPU, o chip de 10 nm proporciona um desempenho muito bom. Como o desempenho também permanece estável constantemente, o IdeaPad Gaming 3 15IAH7 até se coloca à frente do Núcleo i7-12700Hda Dell Inspiron 16 Plus após um tempo no loop Cinebench, alcançando o primeiro lugar. As CPUs Ryzen dos outros concorrentes (R5 5600Hr5 6600H & R7 5800H) ficam um pouco para trás.
Cinebench R15 Multi Constant Load Test
| CPU Performance rating - Percent | |
| Média da turma Gaming | |
| Dell Inspiron 16 Plus 7620 | |
| Lenovo IdeaPad Gaming 3 15IAH7 | |
| Média Intel Core i5-12500H | |
| Dell G15 5515 | |
| Lenovo IdeaPad Gaming 3 15ARH7 | |
| HP Victus 16-e0145ng | |
* ... menor é melhor
AIDA64: FP32 Ray-Trace | FPU Julia | CPU SHA3 | CPU Queen | FPU SinJulia | FPU Mandel | CPU AES | CPU ZLib | FP64 Ray-Trace | CPU PhotoWorxx
| Performance rating | |
| Média da turma Gaming | |
| Dell G15 5515 | |
| Dell Inspiron 16 Plus 7620 | |
| Lenovo IdeaPad Gaming 3 15IAH7 | |
| Lenovo IdeaPad Gaming 3 15ARH7 | |
| Média Intel Core i5-12500H | |
| HP Victus 16-e0145ng | |
| AIDA64 / FP32 Ray-Trace | |
| Média da turma Gaming (10227 - 85542, n=107, últimos 2 anos) | |
| Dell G15 5515 | |
| Lenovo IdeaPad Gaming 3 15IAH7 | |
| Dell Inspiron 16 Plus 7620 | |
| Lenovo IdeaPad Gaming 3 15ARH7 | |
| Média Intel Core i5-12500H (6851 - 13947, n=9) | |
| HP Victus 16-e0145ng | |
| AIDA64 / FPU Julia | |
| Média da turma Gaming (51376 - 238426, n=107, últimos 2 anos) | |
| Dell G15 5515 | |
| Lenovo IdeaPad Gaming 3 15ARH7 | |
| HP Victus 16-e0145ng | |
| Lenovo IdeaPad Gaming 3 15IAH7 | |
| Dell Inspiron 16 Plus 7620 | |
| Média Intel Core i5-12500H (29874 - 68178, n=9) | |
| AIDA64 / CPU SHA3 | |
| Média da turma Gaming (2180 - 9817, n=107, últimos 2 anos) | |
| Lenovo IdeaPad Gaming 3 15IAH7 | |
| Dell G15 5515 | |
| Média Intel Core i5-12500H (2287 - 3337, n=9) | |
| Dell Inspiron 16 Plus 7620 | |
| Lenovo IdeaPad Gaming 3 15ARH7 | |
| HP Victus 16-e0145ng | |
| AIDA64 / CPU Queen | |
| Média da turma Gaming (49785 - 173351, n=98, últimos 2 anos) | |
| Dell G15 5515 | |
| Dell Inspiron 16 Plus 7620 | |
| Lenovo IdeaPad Gaming 3 15IAH7 | |
| Média Intel Core i5-12500H (77935 - 80703, n=9) | |
| Lenovo IdeaPad Gaming 3 15ARH7 | |
| HP Victus 16-e0145ng | |
| AIDA64 / FPU SinJulia | |
| Média da turma Gaming (4424 - 33636, n=107, últimos 2 anos) | |
| Dell G15 5515 | |
| Lenovo IdeaPad Gaming 3 15ARH7 | |
| HP Victus 16-e0145ng | |
| Dell Inspiron 16 Plus 7620 | |
| Lenovo IdeaPad Gaming 3 15IAH7 | |
| Média Intel Core i5-12500H (6590 - 7431, n=9) | |
| AIDA64 / FPU Mandel | |
| Média da turma Gaming (25115 - 128721, n=107, últimos 2 anos) | |
| Dell G15 5515 | |
| Lenovo IdeaPad Gaming 3 15ARH7 | |
| HP Victus 16-e0145ng | |
| Lenovo IdeaPad Gaming 3 15IAH7 | |
| Dell Inspiron 16 Plus 7620 | |
| Média Intel Core i5-12500H (18252 - 34041, n=9) | |
| AIDA64 / CPU AES | |
| Dell G15 5515 | |
| Lenovo IdeaPad Gaming 3 15IAH7 | |
| Média da turma Gaming (39258 - 247074, n=107, últimos 2 anos) | |
| Lenovo IdeaPad Gaming 3 15ARH7 | |
| Média Intel Core i5-12500H (50298 - 111567, n=9) | |
| Dell Inspiron 16 Plus 7620 | |
| HP Victus 16-e0145ng | |
| AIDA64 / CPU ZLib | |
| Média da turma Gaming (574 - 2531, n=107, últimos 2 anos) | |
| Dell Inspiron 16 Plus 7620 | |
| Lenovo IdeaPad Gaming 3 15IAH7 | |
| Média Intel Core i5-12500H (746 - 924, n=9) | |
| Dell G15 5515 | |
| Lenovo IdeaPad Gaming 3 15ARH7 | |
| HP Victus 16-e0145ng | |
| AIDA64 / FP64 Ray-Trace | |
| Média da turma Gaming (5509 - 45446, n=107, últimos 2 anos) | |
| Dell G15 5515 | |
| Lenovo IdeaPad Gaming 3 15IAH7 | |
| Dell Inspiron 16 Plus 7620 | |
| Lenovo IdeaPad Gaming 3 15ARH7 | |
| Média Intel Core i5-12500H (3848 - 7405, n=9) | |
| HP Victus 16-e0145ng | |
| AIDA64 / CPU PhotoWorxx | |
| Média da turma Gaming (12271 - 89891, n=107, últimos 2 anos) | |
| Dell Inspiron 16 Plus 7620 | |
| Média Intel Core i5-12500H (13686 - 43813, n=9) | |
| HP Victus 16-e0145ng | |
| Lenovo IdeaPad Gaming 3 15ARH7 | |
| Dell G15 5515 | |
| Lenovo IdeaPad Gaming 3 15IAH7 | |
Desempenho do sistema
De acordo com o PCMark 10, o desempenho do sistema também é respeitável. Com 6.755 pontos, ele só é vencido pelo Dell Inspiron 16 Plus. Subjetivamente, o sistema operacional responde confortavelmente rápido.
CrossMark: Overall | Productivity | Creativity | Responsiveness
| PCMark 10 / Score | |
| Média da turma Gaming (5828 - 11574, n=95, últimos 2 anos) | |
| Dell Inspiron 16 Plus 7620 | |
| Lenovo IdeaPad Gaming 3 15IAH7 | |
| Lenovo IdeaPad Gaming 3 15ARH7 | |
| Dell G15 5515 | |
| HP Victus 16-e0145ng | |
| PCMark 10 / Essentials | |
| Média da turma Gaming (8810 - 12600, n=99, últimos 2 anos) | |
| Dell Inspiron 16 Plus 7620 | |
| Lenovo IdeaPad Gaming 3 15IAH7 | |
| HP Victus 16-e0145ng | |
| Dell G15 5515 | |
| Lenovo IdeaPad Gaming 3 15ARH7 | |
| PCMark 10 / Productivity | |
| Média da turma Gaming (6845 - 18766, n=97, últimos 2 anos) | |
| Lenovo IdeaPad Gaming 3 15IAH7 | |
| Dell Inspiron 16 Plus 7620 | |
| Lenovo IdeaPad Gaming 3 15ARH7 | |
| Dell G15 5515 | |
| HP Victus 16-e0145ng | |
| PCMark 10 / Digital Content Creation | |
| Média da turma Gaming (7602 - 19657, n=97, últimos 2 anos) | |
| Dell Inspiron 16 Plus 7620 | |
| Lenovo IdeaPad Gaming 3 15IAH7 | |
| HP Victus 16-e0145ng | |
| Dell G15 5515 | |
| Lenovo IdeaPad Gaming 3 15ARH7 | |
| CrossMark / Overall | |
| Média da turma Gaming (1366 - 2409, n=96, últimos 2 anos) | |
| Dell Inspiron 16 Plus 7620 | |
| Lenovo IdeaPad Gaming 3 15ARH7 | |
| CrossMark / Productivity | |
| Média da turma Gaming (1386 - 2254, n=96, últimos 2 anos) | |
| Dell Inspiron 16 Plus 7620 | |
| Lenovo IdeaPad Gaming 3 15ARH7 | |
| CrossMark / Creativity | |
| Média da turma Gaming (1343 - 2729, n=96, últimos 2 anos) | |
| Dell Inspiron 16 Plus 7620 | |
| Lenovo IdeaPad Gaming 3 15ARH7 | |
| CrossMark / Responsiveness | |
| Média da turma Gaming (1226 - 2334, n=96, últimos 2 anos) | |
| Dell Inspiron 16 Plus 7620 | |
| Lenovo IdeaPad Gaming 3 15ARH7 | |
| PCMark 10 Score | 6755 pontos | |
Ajuda | ||
| AIDA64 / Memory Copy | |
| Média da turma Gaming (21750 - 129946, n=107, últimos 2 anos) | |
| Dell Inspiron 16 Plus 7620 | |
| Média Intel Core i5-12500H (23850 - 66598, n=9) | |
| HP Victus 16-e0145ng | |
| Dell G15 5515 | |
| Lenovo IdeaPad Gaming 3 15ARH7 | |
| Lenovo IdeaPad Gaming 3 15IAH7 | |
| AIDA64 / Memory Read | |
| Média da turma Gaming (22956 - 118858, n=107, últimos 2 anos) | |
| Dell Inspiron 16 Plus 7620 | |
| Média Intel Core i5-12500H (24879 - 68013, n=9) | |
| HP Victus 16-e0145ng | |
| Dell G15 5515 | |
| Lenovo IdeaPad Gaming 3 15ARH7 | |
| Lenovo IdeaPad Gaming 3 15IAH7 | |
| AIDA64 / Memory Write | |
| Média da turma Gaming (22297 - 135096, n=107, últimos 2 anos) | |
| Dell Inspiron 16 Plus 7620 | |
| Média Intel Core i5-12500H (23543 - 58797, n=9) | |
| HP Victus 16-e0145ng | |
| Dell G15 5515 | |
| Lenovo IdeaPad Gaming 3 15ARH7 | |
| Lenovo IdeaPad Gaming 3 15IAH7 | |
| AIDA64 / Memory Latency | |
| Média da turma Gaming (75.3 - 259, n=107, últimos 2 anos) | |
| Média Intel Core i5-12500H (83.8 - 114.7, n=9) | |
| Dell Inspiron 16 Plus 7620 | |
| Lenovo IdeaPad Gaming 3 15IAH7 | |
| Lenovo IdeaPad Gaming 3 15ARH7 | |
| Dell G15 5515 | |
| HP Victus 16-e0145ng | |
* ... menor é melhor
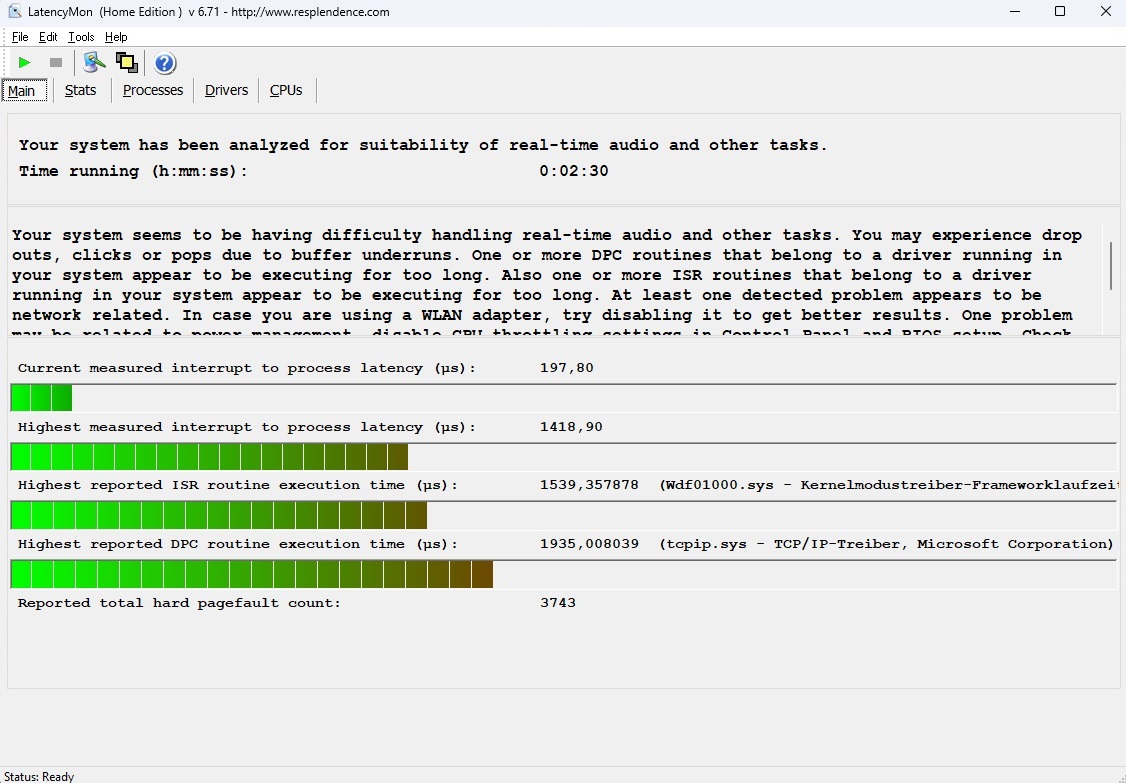
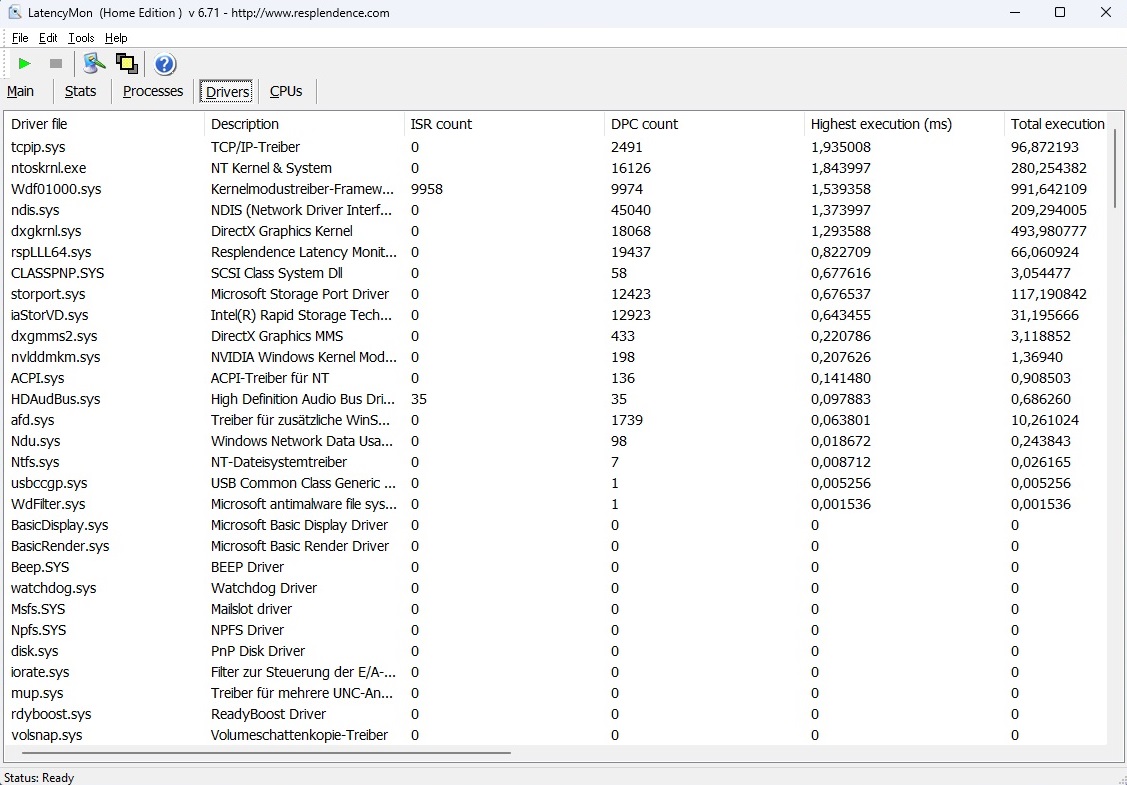
Latências DPC
No teste de latência, o laptop de 15 polegadas não faz tão bem. A ferramenta LatencyMon menciona problemas potenciais com o processamento de áudio e vídeo em tempo real. No entanto, apenas muito poucos usuários devem ser afetados por estes cenários de aplicação.
| DPC Latencies / LatencyMon - interrupt to process latency (max), Web, Youtube, Prime95 | |
| Lenovo IdeaPad Gaming 3 15IAH7 | |
| Dell Inspiron 16 Plus 7620 | |
| HP Victus 16-e0145ng | |
| Lenovo IdeaPad Gaming 3 15ARH7 | |
| Dell G15 5515 | |
* ... menor é melhor
Solução de armazenamento
O desempenho do SSD acaba no meio do nosso campo de comparação. O modelo 512-GB da Intel (660p) não é particularmente rápido nem particularmente lento para um drive NVMe. É ótimo que - como a velocidade da CPU - a velocidade do SSD também permaneça relativamente constante.

* ... menor é melhor
Constant Performance Reading: DiskSpd Read Loop, Queue Depth 8
Placa Gráfica
O desempenho das GPUs Ampere da Nvidia depende, em grande parte, do TGP ajustado. A Lenovo decidiu por um valor relativamente alto no IdeaPad Gaming 3, o que beneficia os resultados do benchmark. 85 Watts são bastante para um RTX 3050 Ti. O laptop de 15 polegadas faz correspondentemente bem nos 3DMark benchmarks. Se você adicionar todos os valores, o RTX 3050 Ti é quase 25% mais rápido do que a média atual desta placa gráfica. Em certa medida, isto compensa o fato de que você já pode obter dispositivos com o RTX 3060que inclui 6 ao invés de 4 GB VRAM, no segmento de 1000 euros.
| 3DMark 11 Performance | 19254 pontos | |
| 3DMark Cloud Gate Standard Score | 48874 pontos | |
| 3DMark Fire Strike Score | 14086 pontos | |
| 3DMark Time Spy Score | 6213 pontos | |
Ajuda | ||
* ... menor é melhor
Desempenho nos jogos
A tendência positiva dos testes gráficos sintéticos continua em nossas corridas de teste de jogos. Embora o desempenho em alguns jogos possa sofrer consideravelmente com a RAM de canal único (por isso recomendamos mudar para 2x 8 GB), jogos que não são pesados em RAM também rodam significativamente mais rápido que em um RTX 3050 Ti com um TGP mais baixo.
| The Witcher 3 | |
| 1920x1080 High Graphics & Postprocessing (Nvidia HairWorks Off) | |
| Média da turma Gaming (181 - 341, n=3, últimos 2 anos) | |
| Lenovo IdeaPad Gaming 3 15IAH7 | |
| Dell Inspiron 16 Plus 7620 | |
| Lenovo IdeaPad Gaming 3 15ARH7 | |
| HP Victus 16-e0145ng | |
| Dell G15 5515 | |
| Média NVIDIA GeForce RTX 3050 Ti Laptop GPU (30 - 110, n=26) | |
| 1920x1080 Ultra Graphics & Postprocessing (HBAO+) | |
| Média da turma Gaming (95 - 240, n=8, últimos 2 anos) | |
| Lenovo IdeaPad Gaming 3 15IAH7 | |
| Dell Inspiron 16 Plus 7620 | |
| Dell G15 5515 | |
| Lenovo IdeaPad Gaming 3 15ARH7 | |
| HP Victus 16-e0145ng | |
| Média NVIDIA GeForce RTX 3050 Ti Laptop GPU (19 - 58.5, n=29) | |
Não notamos comportamentos conspícuos que se destacaram em nosso teste constante de 60 minutos com O Witcher 3. Basicamente, o IdeaPad Gaming 3 15IAH7 é capaz de lidar com quase todos os jogos modernos em alta até o máximo de detalhes na resolução nativa de 1920 x 1080 pixels, contanto que você faça sem traçado de raio (onde o RTX 3050 Ti mostra algumas fraquezas consideráveis).
The Witcher 3 FPS Chart
| baixo | média | alto | ultra | |
|---|---|---|---|---|
| GTA V (2015) | 160.7 | 130.6 | 73.5 | |
| The Witcher 3 (2015) | 173 | 110 | 58.5 | |
| Dota 2 Reborn (2015) | 145.9 | 127.3 | 113.8 | 107.8 |
| Final Fantasy XV Benchmark (2018) | 81.5 | 58.8 | ||
| X-Plane 11.11 (2018) | 109.9 | 98.1 | 81.1 | |
| Strange Brigade (2018) | 145.5 | 117.3 | 101.3 | |
| Ghostwire Tokyo (2022) | 79.5 | 76.8 | 75.9 | |
| Tiny Tina's Wonderlands (2022) | 92.1 | 67.2 | 51.7 | |
| Vampire Bloodhunt (2022) | 111.8 | 110.9 | 106.1 | |
| F1 22 (2022) | 111 | 92 | 32 | |
| The Quarry (2022) | 69.7 | 58.3 | 45.8 |
Emissões
Emissões sonoras
No modo Performance, o laptop de 15 polegadas não é muito silencioso. Já durante a operação ociosa, você pode ouvir muito barulho do ventilador a 29 a 32 dB(A). Sob carga, o dispositivo produz um volume enorme de ruído a 42 a 54 dB(A), embora outros laptops de jogos, como o Victus 16, fiquem igualmente barulhentos. No entanto, graças aos dois outros modos de potência, o dispositivo pode ser tranqüilizado fácil e rapidamente.
Barulho
| Ocioso |
| 29 / 30 / 32 dB |
| Carga |
| 42 / 54 dB |
 | ||
30 dB silencioso 40 dB(A) audível 50 dB(A) ruidosamente alto |
||
min: | ||
| Lenovo IdeaPad Gaming 3 15IAH7 GeForce RTX 3050 Ti Laptop GPU, i5-12500H | Lenovo IdeaPad Gaming 3 15ARH7 GeForce RTX 3050 4GB Laptop GPU, R5 6600H | Dell G15 5515 GeForce RTX 3050 Ti Laptop GPU, R7 5800H | HP Victus 16-e0145ng GeForce RTX 3050 Ti Laptop GPU, R5 5600H | Dell Inspiron 16 Plus 7620 GeForce RTX 3050 Ti Laptop GPU, i7-12700H | |
|---|---|---|---|---|---|
| Noise | 11% | 7% | 0% | 4% | |
| desligado / ambiente * (dB) | 25 | 23.3 7% | 24 4% | 26 -4% | 23.3 7% |
| Idle Minimum * (dB) | 29 | 23.8 18% | 25 14% | 26 10% | 25.7 11% |
| Idle Average * (dB) | 30 | 23.8 21% | 26 13% | 28 7% | 26.1 13% |
| Idle Maximum * (dB) | 32 | 27.2 15% | 30 6% | 34 -6% | 30.6 4% |
| Load Average * (dB) | 42 | 34.8 17% | 44 -5% | 44 -5% | 46.2 -10% |
| Witcher 3 ultra * (dB) | 46 | 49.3 -7% | 44 4% | 48 -4% | 49.2 -7% |
| Load Maximum * (dB) | 54 | 49.4 9% | 48 11% | 53 2% | 49.4 9% |
* ... menor é melhor
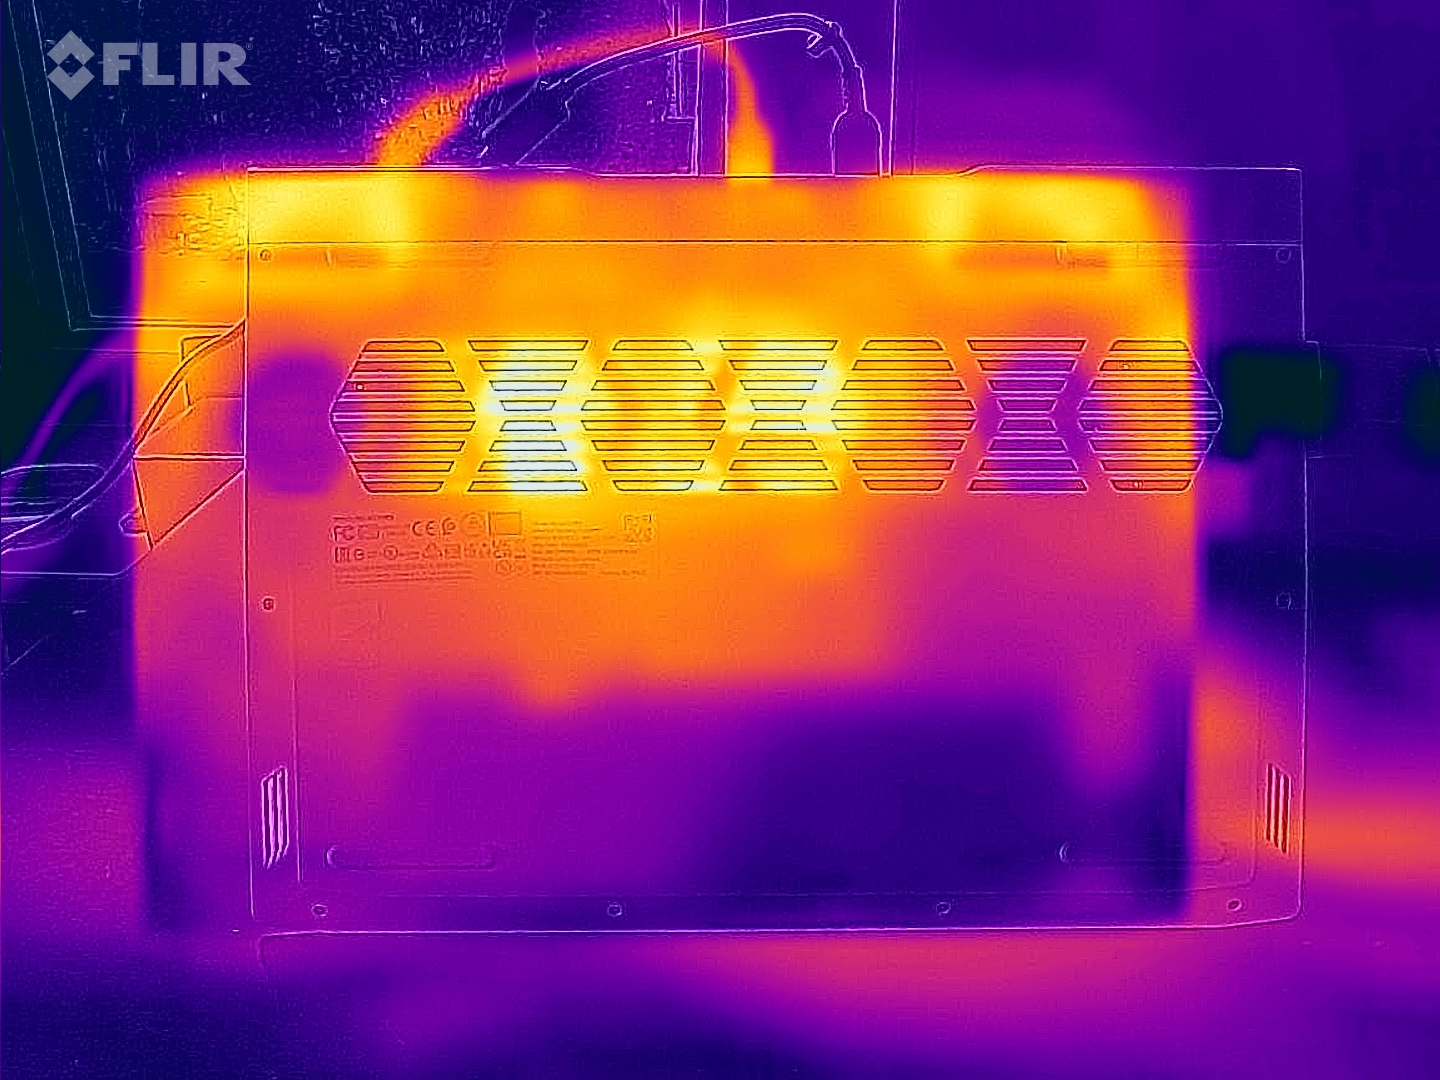
Temperaturas
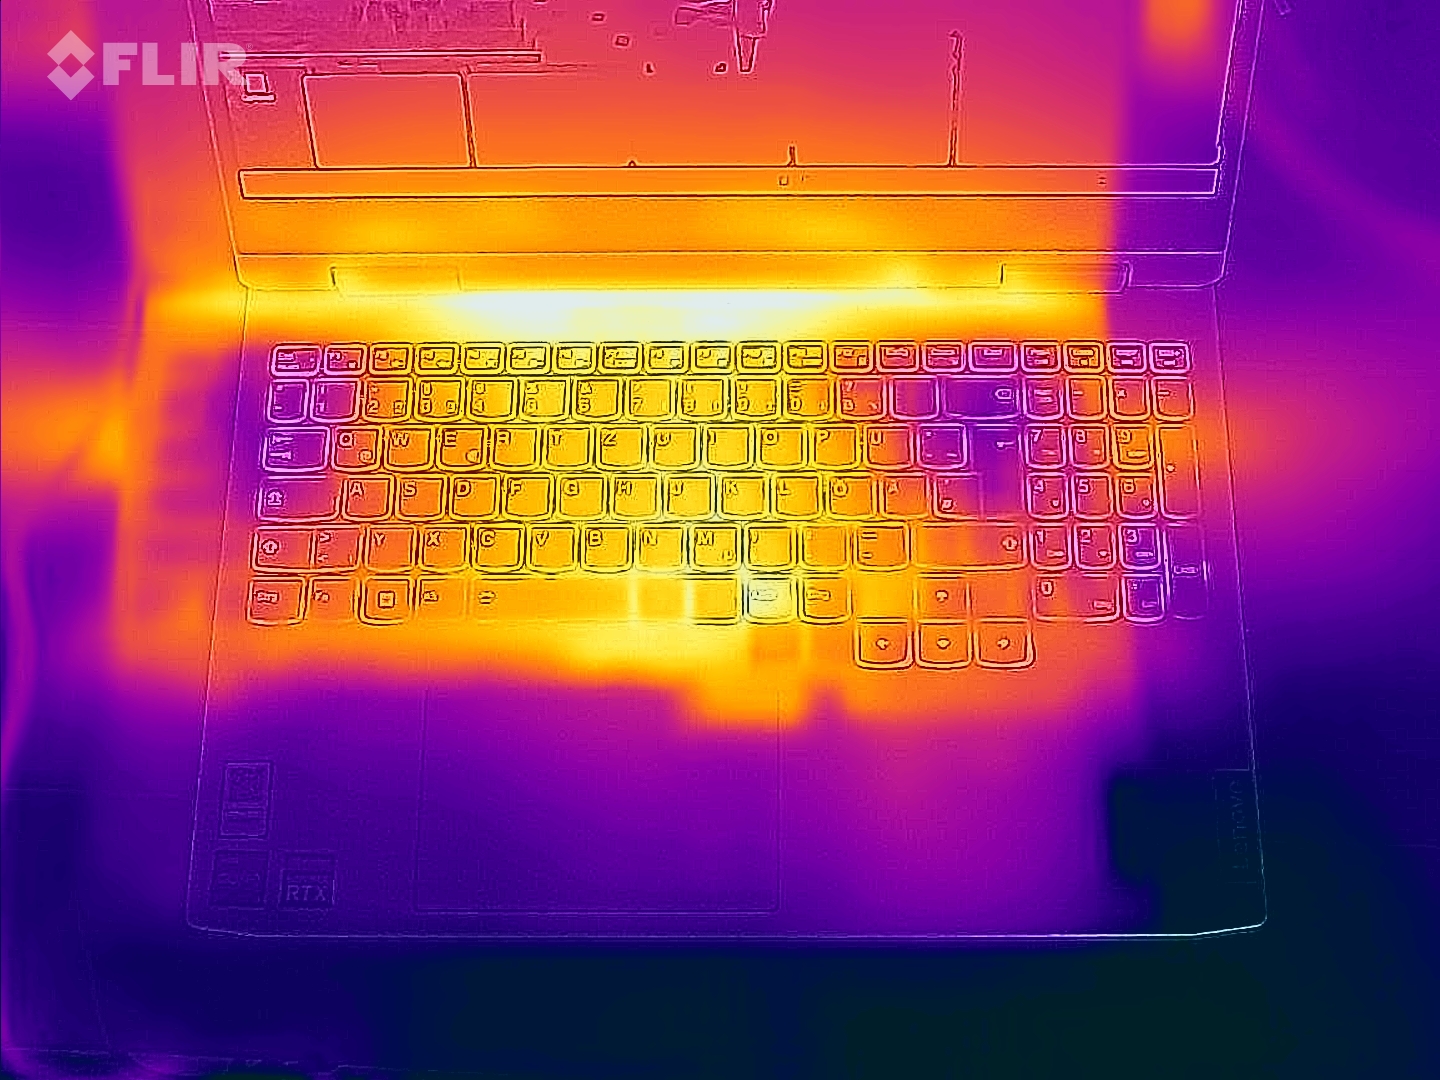
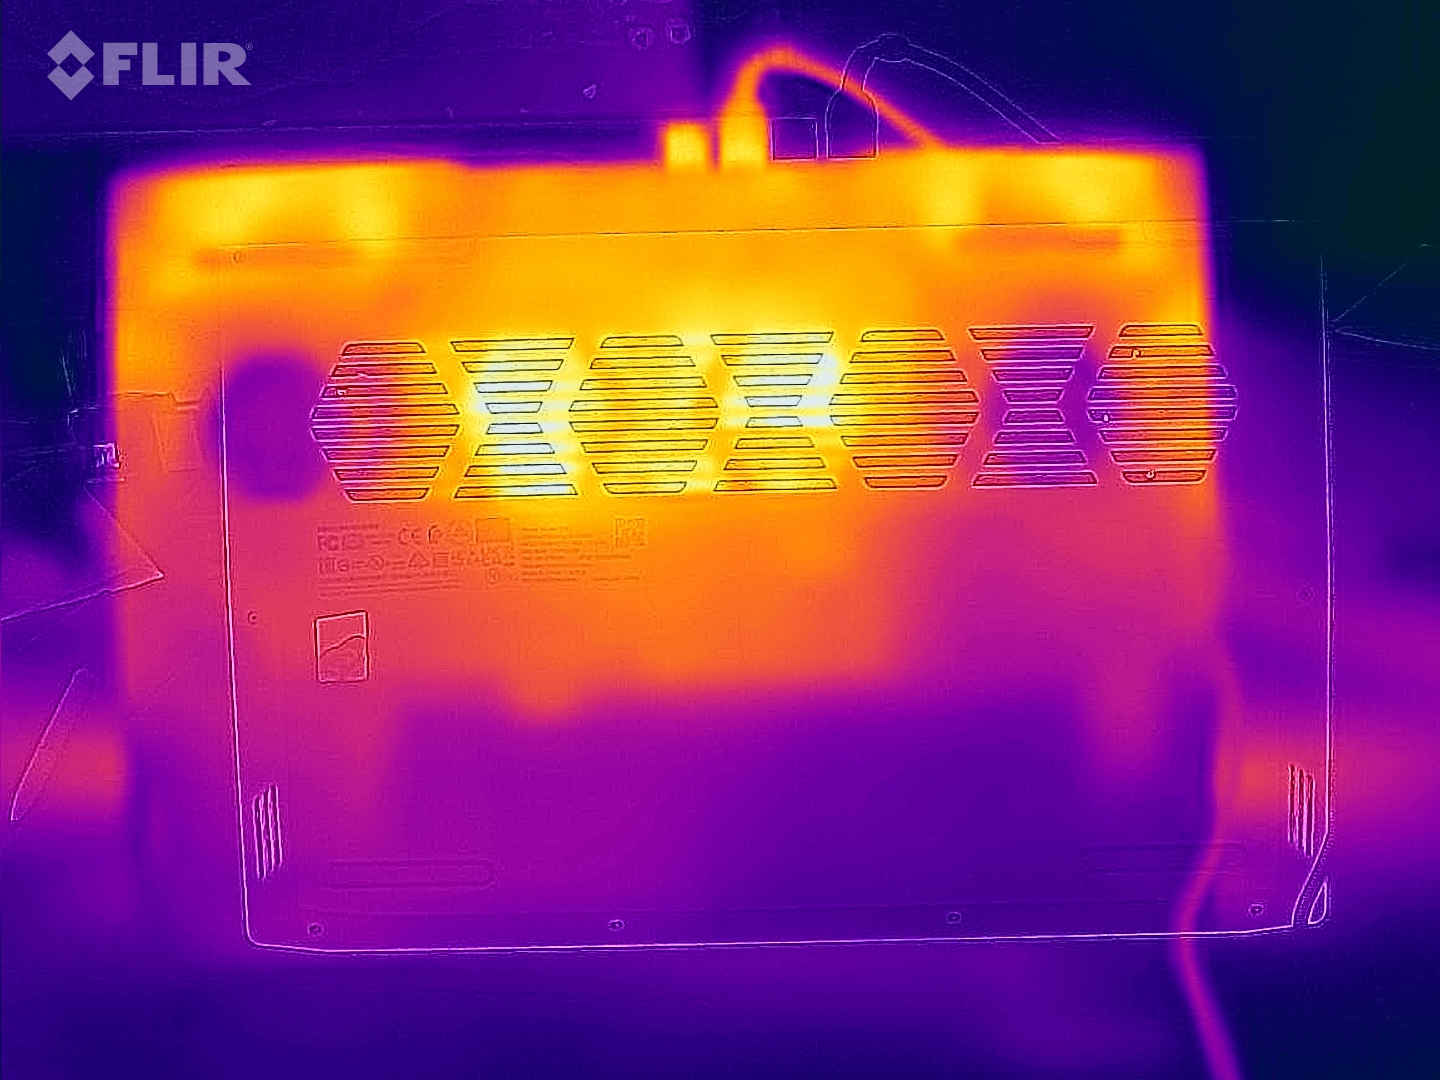
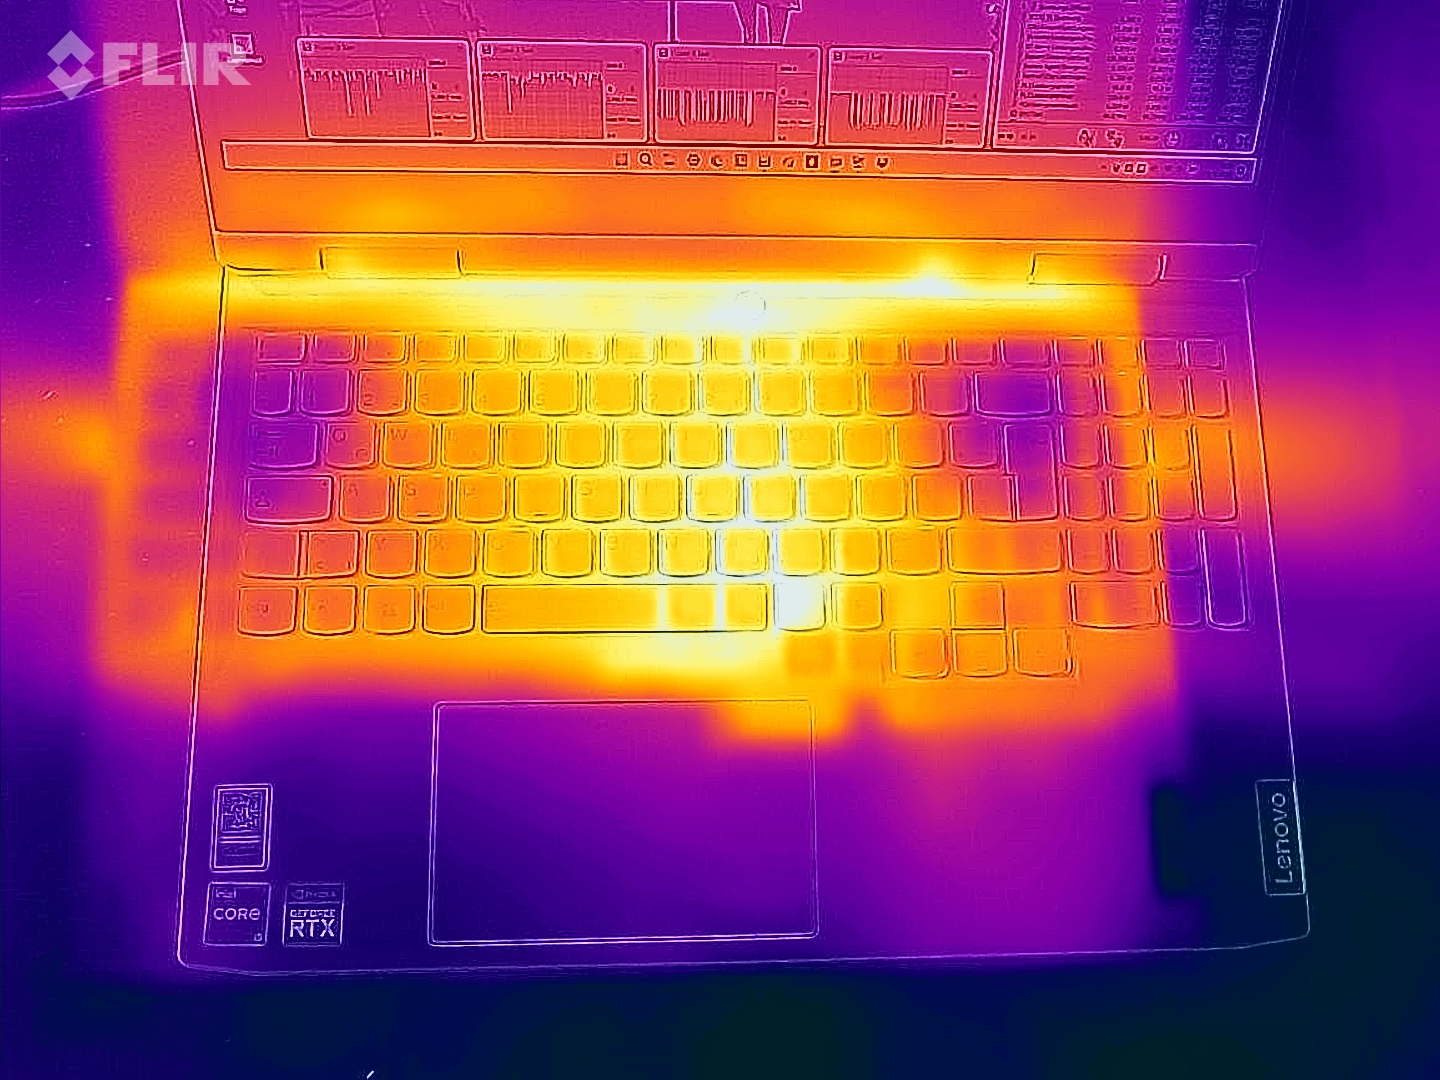
O desenvolvimento da temperatura também é típico de um laptop para jogos. Enquanto o dispositivo Lenovo permanece confortavelmente frio durante a operação ociosa, as temperaturas atingem até 47 °C (~117 °F) na parte superior e 52 °C (~126 °F) na parte inferior durante a operação 3D. Portanto, você não deve tentar jogar com o laptop em seu colo.
(-) A temperatura máxima no lado superior é 47 °C / 117 F, em comparação com a média de 40.4 °C / 105 F , variando de 21.2 a 68.8 °C para a classe Gaming.
(-) A parte inferior aquece até um máximo de 52 °C / 126 F, em comparação com a média de 43.2 °C / 110 F
(+) Em uso inativo, a temperatura média para o lado superior é 24.2 °C / 76 F, em comparação com a média do dispositivo de 33.9 °C / ### class_avg_f### F.
(-) Jogando The Witcher 3, a temperatura média para o lado superior é 39.2 °C / 103 F, em comparação com a média do dispositivo de 33.9 °C / ## #class_avg_f### F.
(±) Os apoios para as mãos e o touchpad podem ficar muito quentes ao toque, com um máximo de 37 °C / 98.6 F.
(-) A temperatura média da área do apoio para as mãos de dispositivos semelhantes foi 28.8 °C / 83.8 F (-8.2 °C / -14.8 F).
| Lenovo IdeaPad Gaming 3 15IAH7 GeForce RTX 3050 Ti Laptop GPU, i5-12500H | Lenovo IdeaPad Gaming 3 15ARH7 GeForce RTX 3050 4GB Laptop GPU, R5 6600H | Dell G15 5515 GeForce RTX 3050 Ti Laptop GPU, R7 5800H | HP Victus 16-e0145ng GeForce RTX 3050 Ti Laptop GPU, R5 5600H | Dell Inspiron 16 Plus 7620 GeForce RTX 3050 Ti Laptop GPU, i7-12700H | |
|---|---|---|---|---|---|
| Heat | -3% | -3% | -25% | -8% | |
| Maximum Upper Side * (°C) | 47 | 47.6 -1% | 50 -6% | 54 -15% | 46 2% |
| Maximum Bottom * (°C) | 52 | 46.6 10% | 49 6% | 47 10% | 45.8 12% |
| Idle Upper Side * (°C) | 25 | 27.2 -9% | 26 -4% | 41 -64% | 29.2 -17% |
| Idle Bottom * (°C) | 24 | 27.2 -13% | 26 -8% | 31 -29% | 31 -29% |
* ... menor é melhor
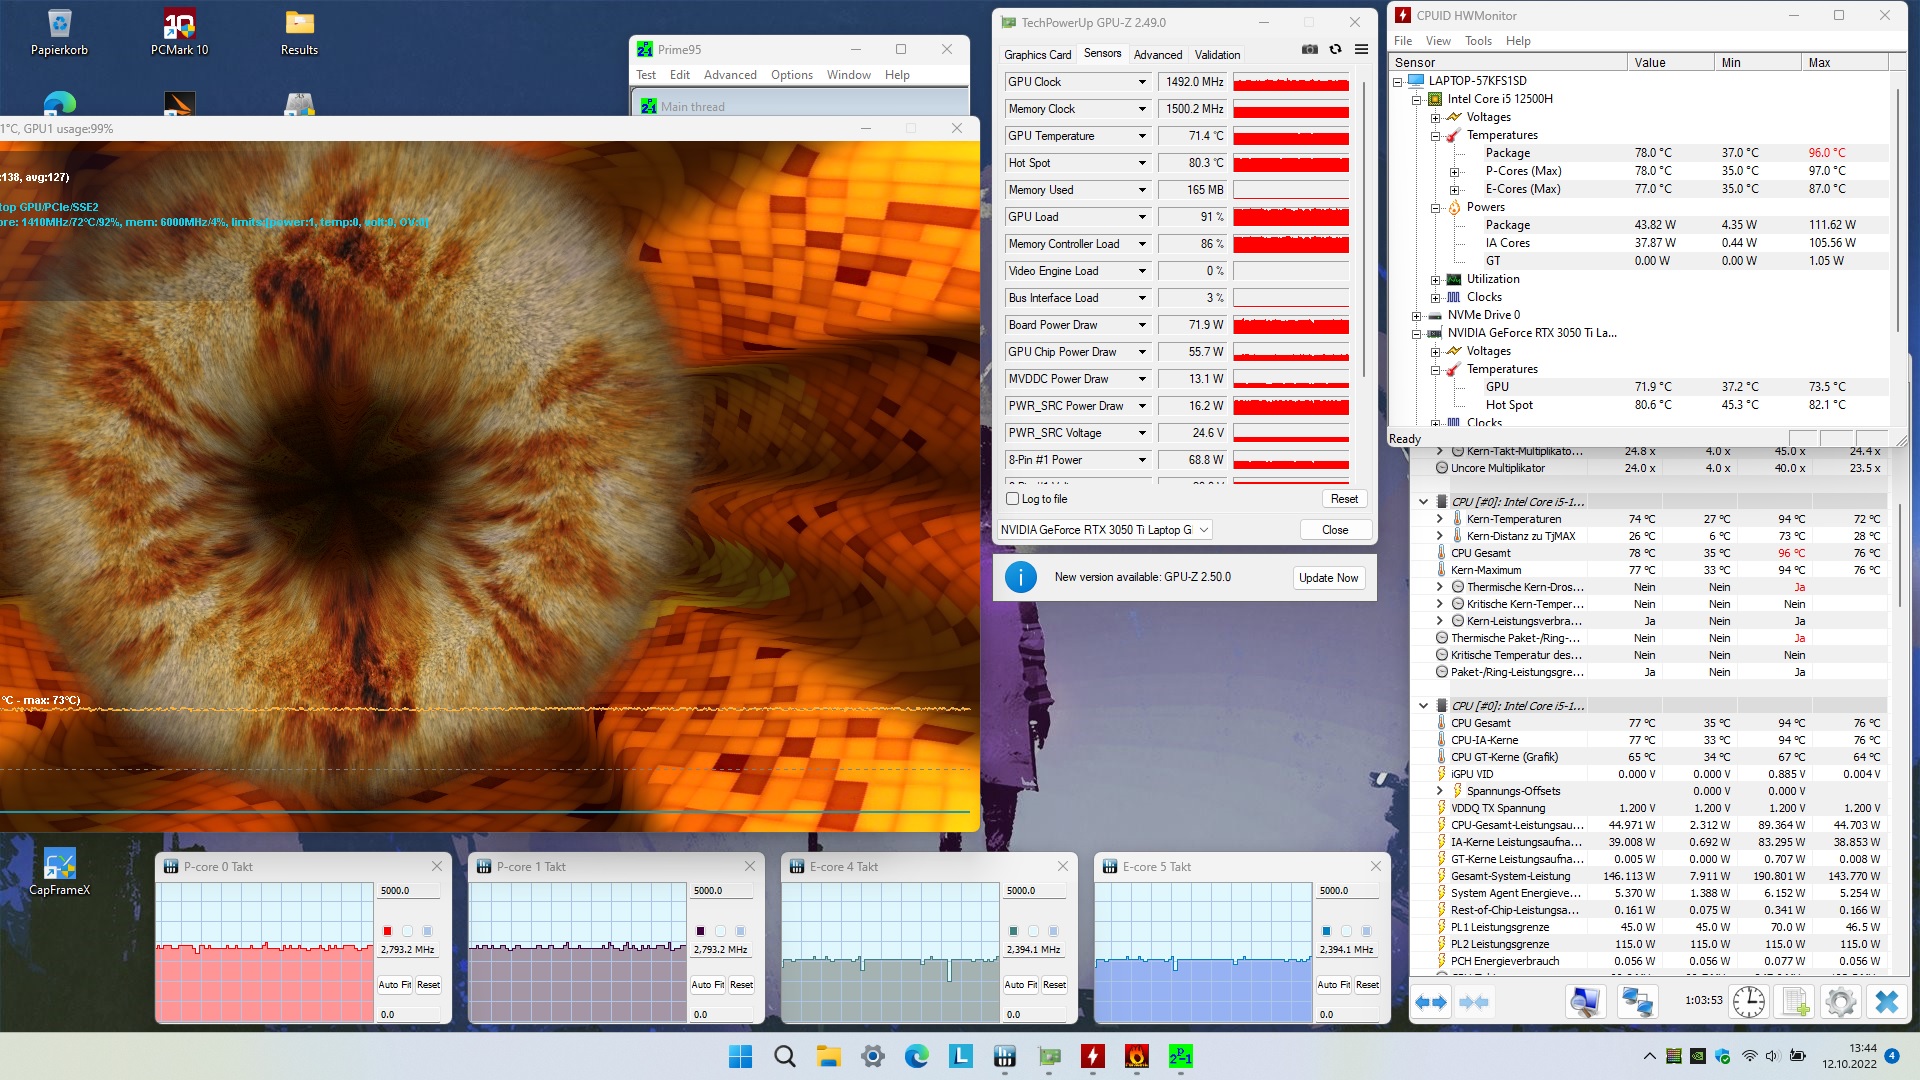
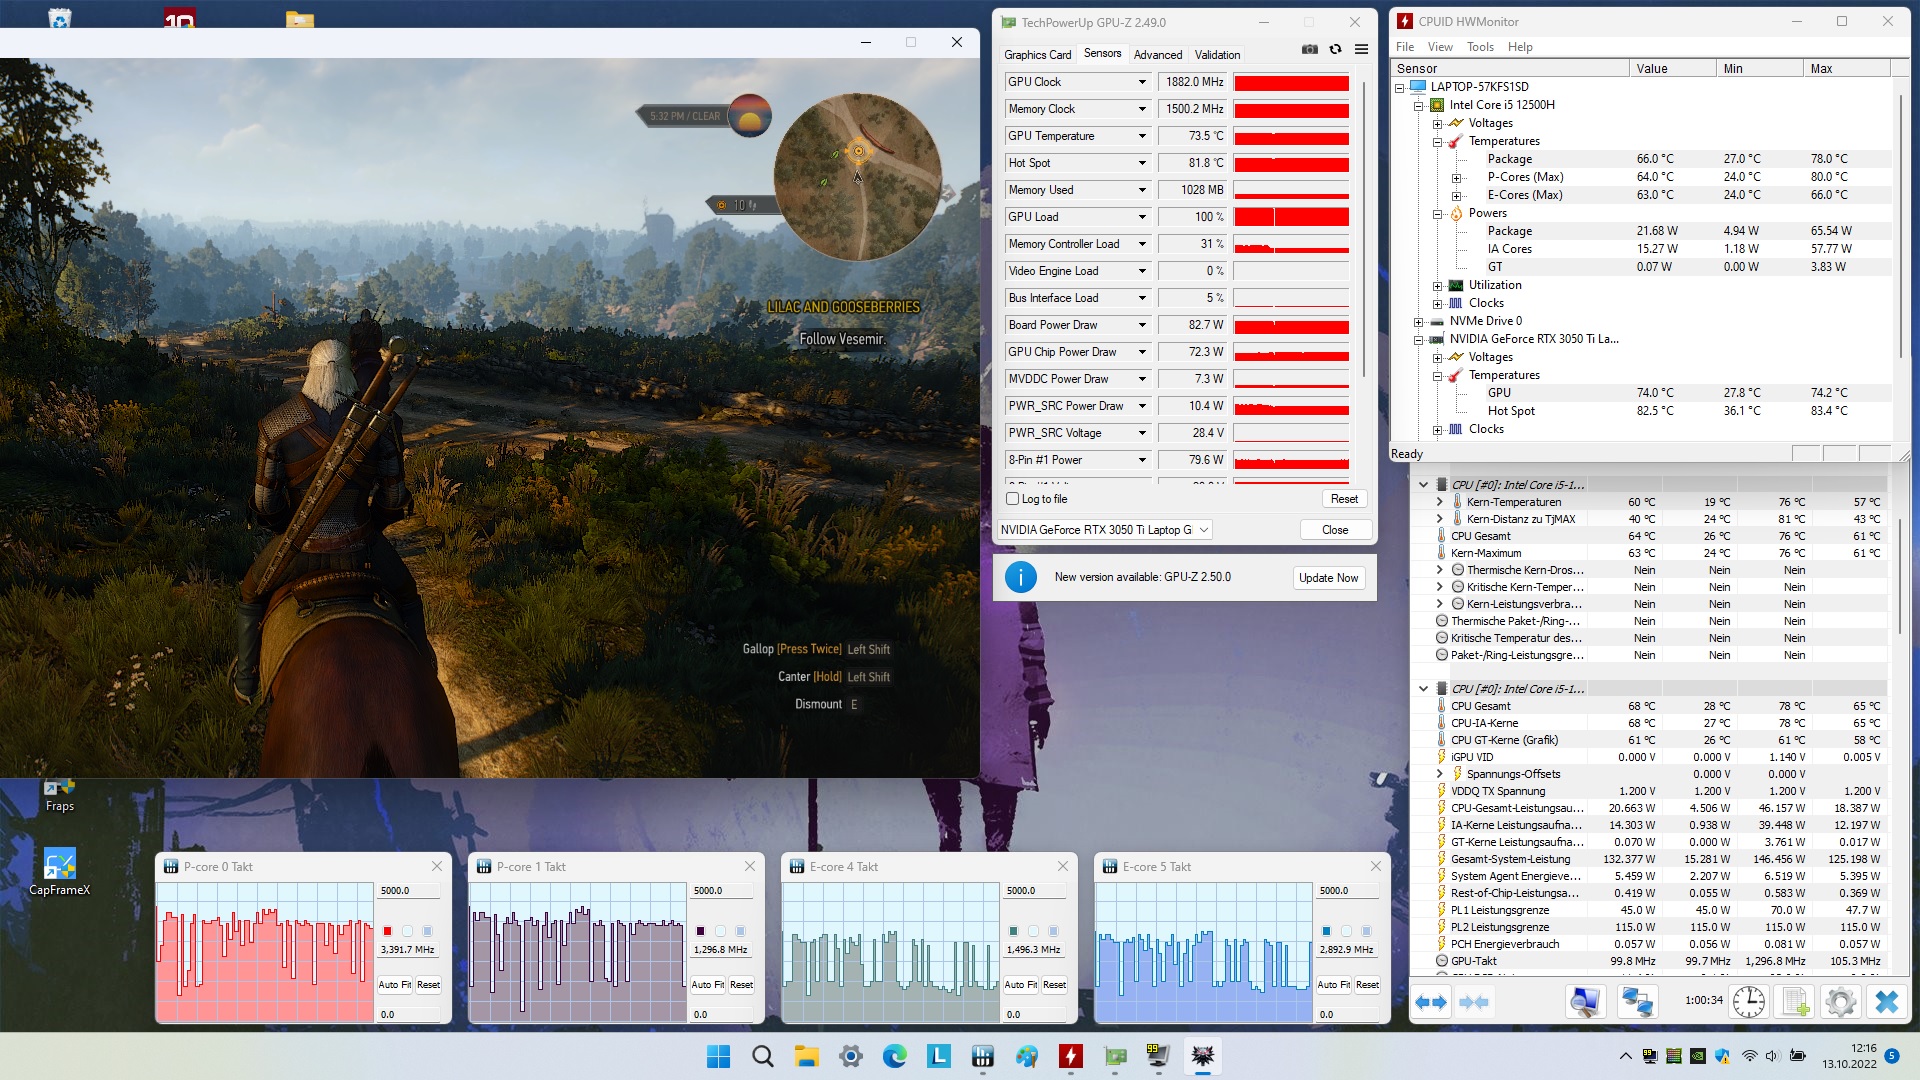
Teste de estresse
O teste de estresse com uma hora de FurMark & Prime95 não revela nada de estranho. O laptop de 15 polegadas fica longe dos valores de estrangulamento e hardware críticos. Consideraríamos cerca de 71 °C (~160 °F) para a GPU e 78 °C (~172 °F) para a CPU sob carga total como valores moderados.
Oradores
Lenovo IdeaPad Gaming 3 15IAH7 análise de áudio
(+) | os alto-falantes podem tocar relativamente alto (###valor### dB)
Graves 100 - 315Hz
(-) | quase nenhum baixo - em média 17.1% menor que a mediana
(±) | a linearidade dos graves é média (12.8% delta para a frequência anterior)
Médios 400 - 2.000 Hz
(±) | médios mais altos - em média 5.6% maior que a mediana
(+) | médios são lineares (4.5% delta para frequência anterior)
Altos 2 - 16 kHz
(+) | agudos equilibrados - apenas 2% longe da mediana
(+) | os máximos são lineares (4.6% delta da frequência anterior)
Geral 100 - 16.000 Hz
(+) | o som geral é linear (14.4% diferença em relação à mediana)
Comparado com a mesma classe
» 27% de todos os dispositivos testados nesta classe foram melhores, 7% semelhantes, 66% piores
» O melhor teve um delta de 6%, a média foi 18%, o pior foi 132%
Comparado com todos os dispositivos testados
» 18% de todos os dispositivos testados foram melhores, 4% semelhantes, 78% piores
» O melhor teve um delta de 4%, a média foi 24%, o pior foi 134%
Dell G15 5515 análise de áudio
(±) | o volume do alto-falante é médio, mas bom (###valor### dB)
Graves 100 - 315Hz
(-) | quase nenhum baixo - em média 22% menor que a mediana
(±) | a linearidade dos graves é média (14.9% delta para a frequência anterior)
Médios 400 - 2.000 Hz
(+) | médios equilibrados - apenas 2.8% longe da mediana
(+) | médios são lineares (3% delta para frequência anterior)
Altos 2 - 16 kHz
(+) | agudos equilibrados - apenas 1.4% longe da mediana
(+) | os máximos são lineares (3.7% delta da frequência anterior)
Geral 100 - 16.000 Hz
(±) | a linearidade do som geral é média (16.8% diferença em relação à mediana)
Comparado com a mesma classe
» 44% de todos os dispositivos testados nesta classe foram melhores, 11% semelhantes, 46% piores
» O melhor teve um delta de 6%, a média foi 18%, o pior foi 132%
Comparado com todos os dispositivos testados
» 29% de todos os dispositivos testados foram melhores, 8% semelhantes, 63% piores
» O melhor teve um delta de 4%, a média foi 24%, o pior foi 134%
Gerenciamento de energia
Consumo de energia
O consumo de energia também não se destaca. Embora em média, o Gaming 3 consome um pouco mais de energia do que outros laptops RTX 3050 Ti, isto se deve principalmente ao TGP mais alto.
| desligado | |
| Ocioso | |
| Carga |
|
Key:
min: | |
| Lenovo IdeaPad Gaming 3 15IAH7 GeForce RTX 3050 Ti Laptop GPU, i5-12500H | Lenovo IdeaPad Gaming 3 15ARH7 GeForce RTX 3050 4GB Laptop GPU, R5 6600H | Dell G15 5515 GeForce RTX 3050 Ti Laptop GPU, R7 5800H | HP Victus 16-e0145ng GeForce RTX 3050 Ti Laptop GPU, R5 5600H | Dell Inspiron 16 Plus 7620 GeForce RTX 3050 Ti Laptop GPU, i7-12700H | Média da turma Gaming | |
|---|---|---|---|---|---|---|
| Power Consumption | 8% | 7% | 5% | 6% | -53% | |
| Idle Minimum * (Watt) | 8 | 7.7 4% | 5 37% | 7 12% | 6.8 15% | 13.2 ? -65% |
| Idle Average * (Watt) | 10 | 9.1 9% | 9 10% | 9 10% | 9.6 4% | 18.9 ? -89% |
| Idle Maximum * (Watt) | 16 | 15.6 2% | 20 -25% | 15 6% | 17 -6% | 24.3 ? -52% |
| Load Average * (Watt) | 99 | 90.7 8% | 94 5% | 93 6% | 117.5 -19% | 108.3 ? -9% |
| Witcher 3 ultra * (Watt) | 144.6 | 122.9 15% | 123 15% | 134.5 7% | 113.1 22% | |
| Load Maximum * (Watt) | 168 | 155.2 8% | 172 -2% | 185 -10% | 137.4 18% | 254 ? -51% |
* ... menor é melhor
Power Consumption The Witcher 3 / Stress Test
Power Consumption With External Monitor
Vida útil da bateria
Dependendo do modelo, o IdeaPad oferece ou uma bateria de 45-Wh ou de 60-Wh. Em contraste com seu irmão AMD, a versão testada da Intel felizmente é capaz de pontuar com a bateria mais potente. Entretanto, devido ao maior consumo, as diferenças permanecem dentro dos limites. Com apenas 6 horas, a vida útil da bateria durante a navegação sem fio na Internet a um brilho de tela reduzido a 150 cd/m² resulta ainda um pouco menor do que a da versão AMD. Os outros concorrentes também estão à frente neste quesito.
| Lenovo IdeaPad Gaming 3 15IAH7 GeForce RTX 3050 Ti Laptop GPU, i5-12500H, 60 Wh | Lenovo IdeaPad Gaming 3 15ARH7 GeForce RTX 3050 4GB Laptop GPU, R5 6600H, 45 Wh | Dell G15 5515 GeForce RTX 3050 Ti Laptop GPU, R7 5800H, 56 Wh | HP Victus 16-e0145ng GeForce RTX 3050 Ti Laptop GPU, R5 5600H, 70 Wh | Dell Inspiron 16 Plus 7620 GeForce RTX 3050 Ti Laptop GPU, i7-12700H, 86 Wh | Média da turma Gaming | |
|---|---|---|---|---|---|---|
| Duração da bateria | 10% | 36% | 20% | 63% | 19% | |
| WiFi v1.3 (h) | 5.9 | 6.5 10% | 8 36% | 7.1 20% | 9.6 63% | 7.04 ? 19% |
| Reader / Idle (h) | 2.4 | 13.5 | 18.6 | 8.71 ? | ||
| Load (h) | 0.9 | 1.5 | 1.2 | 1.47 ? | ||
| H.264 (h) | 8.8 | 8.26 ? |
Pro
Contra
Veredicto
Se você desconsiderar a qualidade medíocre do caso em termos de material e mão-de-obra, a Lenovo criou um laptop para jogos de sucesso com o IdeaPad Gaming 3 15IAH7.
Graças aos altos TDPs e ao constante desenvolvimento de desempenho, oNúcleo i5-12500He GeForce RTX 3050 Tisão capazes de mostrar sua potência total, enquanto que, ao contrário, os concorrentes (na maioria das vezes mais lentos) proporcionam uma melhor duração da bateria. No entanto, praticamente nenhum dos laptops alternativos é capaz de atingir a qualidade de imagem do Gaming 3. A maioria dos concorrentes fica para trás em termos de espaço de cor e luminosidade. Em nosso campo de comparação, apenas o Dell Inspiron 16 Plusé capaz de se aproximar do laptop Lenovo.
Aqueles que esperam uma boa exibição, mas não querem gastar muito dinheiro com um laptop para jogos, devem dar uma olhada de perto no IdeaPad Gaming 3 15IAH7.
Preço e Disponibilidade
No momento deste teste, o IdeaPad Gaming 3 15IAH7 com um Core i5-12500H, GeForce RTX 3050 Ti, 8 GB RAM, e 512 GB SSD está disponível por $1031 da BestBuy.
Lenovo IdeaPad Gaming 3 15IAH7
- 10/14/2022 v7 (old)
Florian Glaser
Price comparison

