HP ZBook Firefly 14 G9 laptop em revisão: Intel Alder Lake-U desacelera esta estação de trabalho móvel
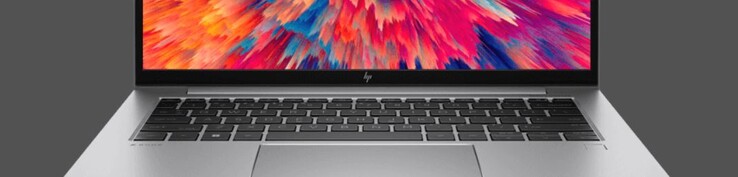
Recentemente revisamos o maior ZBook Firefly 16 G9 e agora damos uma olhada na estação de trabalho móvel da HP com um display de 14 polegadas. Similar a seu primo maior, o ZBook Firefly 14 G9 também está equipado com um processador Intel Alder Lake atual, juntamente com um processador dedicado Nvidia T550 gPU profissional e, portanto, é destinado ao setor profissional de nível básico.
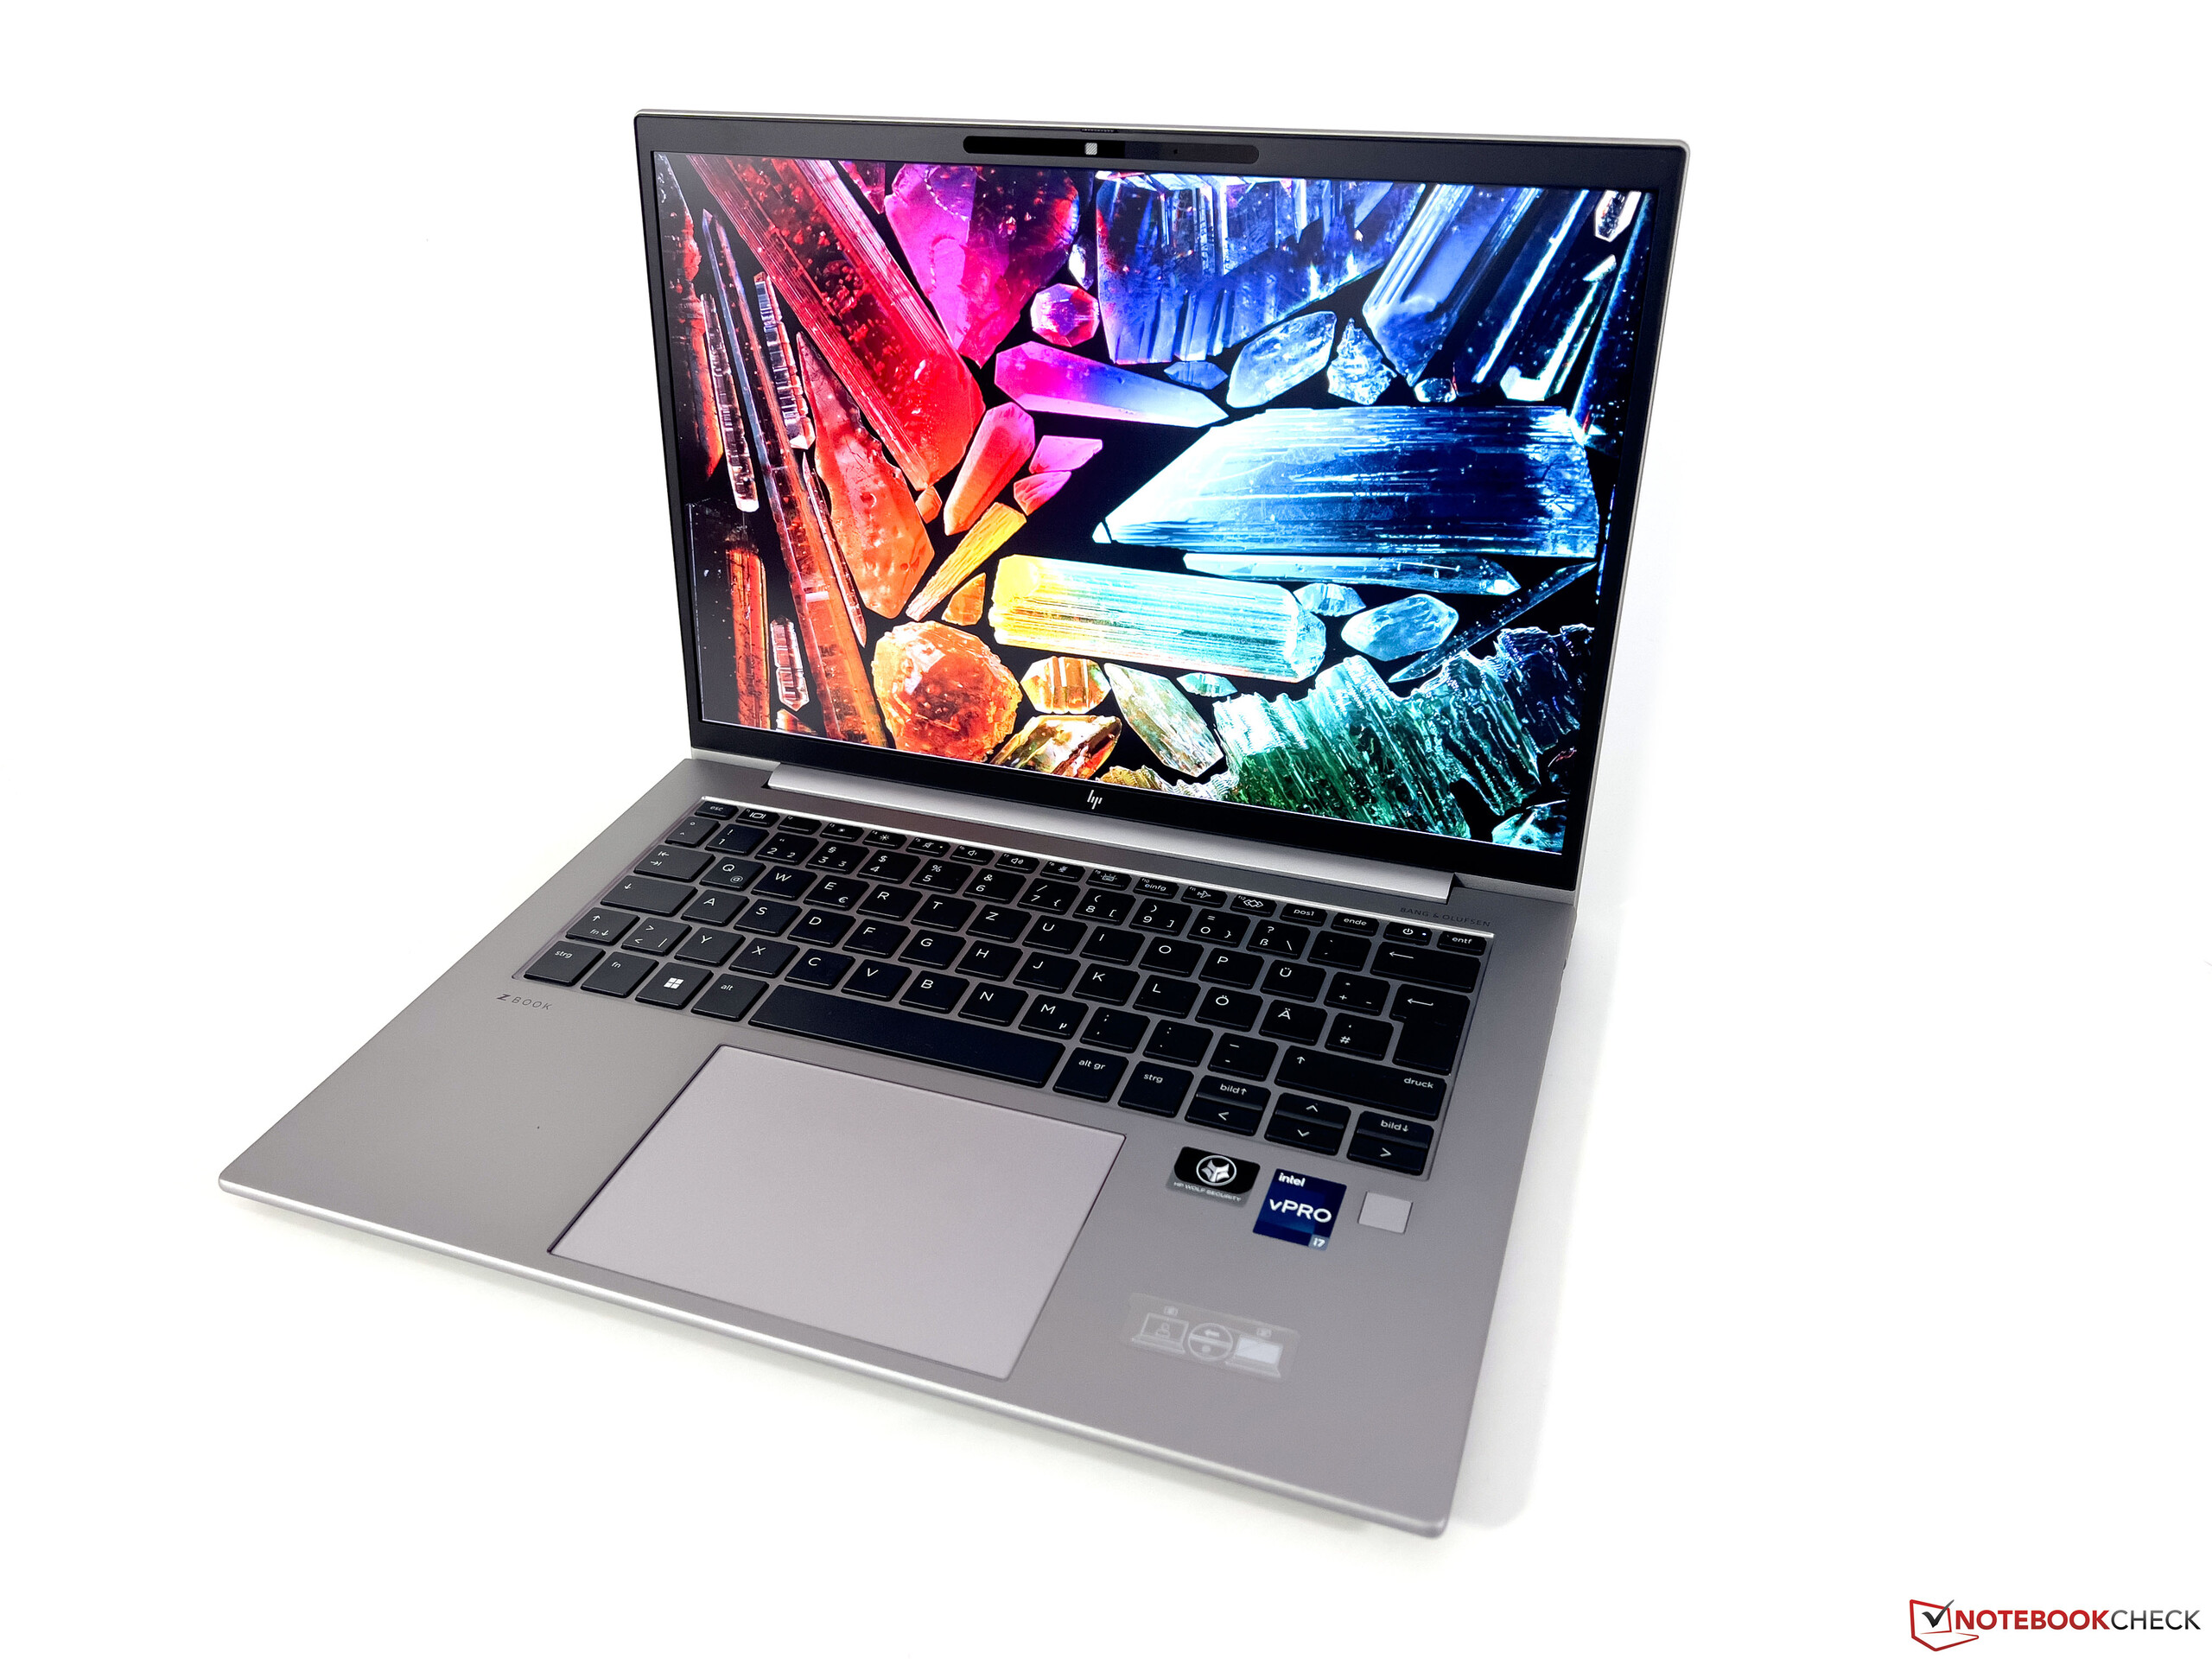
Nossa configuração com a designação 6B8A2EA utiliza oNúcleo i7-1265Uo Nvidia T550, 32 GB de RAM, um SSD de 1 TB, e um painel Full HD mate no formato 16:10. Esta configuração é atualmente comercializada por cerca de 2.100 euros (~US$2.075).
Possíveis concorrentes em comparação
Avaliação | Data | Modelo | Peso | Altura | Size | Resolução | Preço |
|---|---|---|---|---|---|---|---|
| 83.6 % v7 (old) | 10/2022 | HP ZBook Firefly 14 G9-6B8A2EA i7-1265U, T550 Laptop GPU | 1.5 kg | 19.9 mm | 14.00" | 1920x1200 | |
| 87.6 % v7 (old) | 09/2022 | Dell Precision 5000 5470 i9-12900H, RTX A1000 Laptop GPU | 1.6 kg | 18.95 mm | 14.00" | 2560x1600 | |
| 85.1 % v7 (old) | 06/2021 | Lenovo ThinkPad P14s Gen2-20VX000GGE i7-1185G7, T500 Laptop GPU | 1.5 kg | 18 mm | 14.00" | 1920x1080 | |
| 89 % v7 (old) | 03/2022 | Microsoft Surface Laptop Studio i7 RTX 3050 Ti i7-11370H, GeForce RTX 3050 Ti Laptop GPU | 1.8 kg | 19 mm | 14.40" | 2400x1600 | |
| 92.7 % v7 (old) | 11/2021 | Apple MacBook Pro 14 2021 M1 Pro Entry M1 Pro 8-Core, M1 Pro 14-Core GPU | 1.6 kg | 15.5 mm | 14.20" | 3024x1964 |
Estojo e equipamento
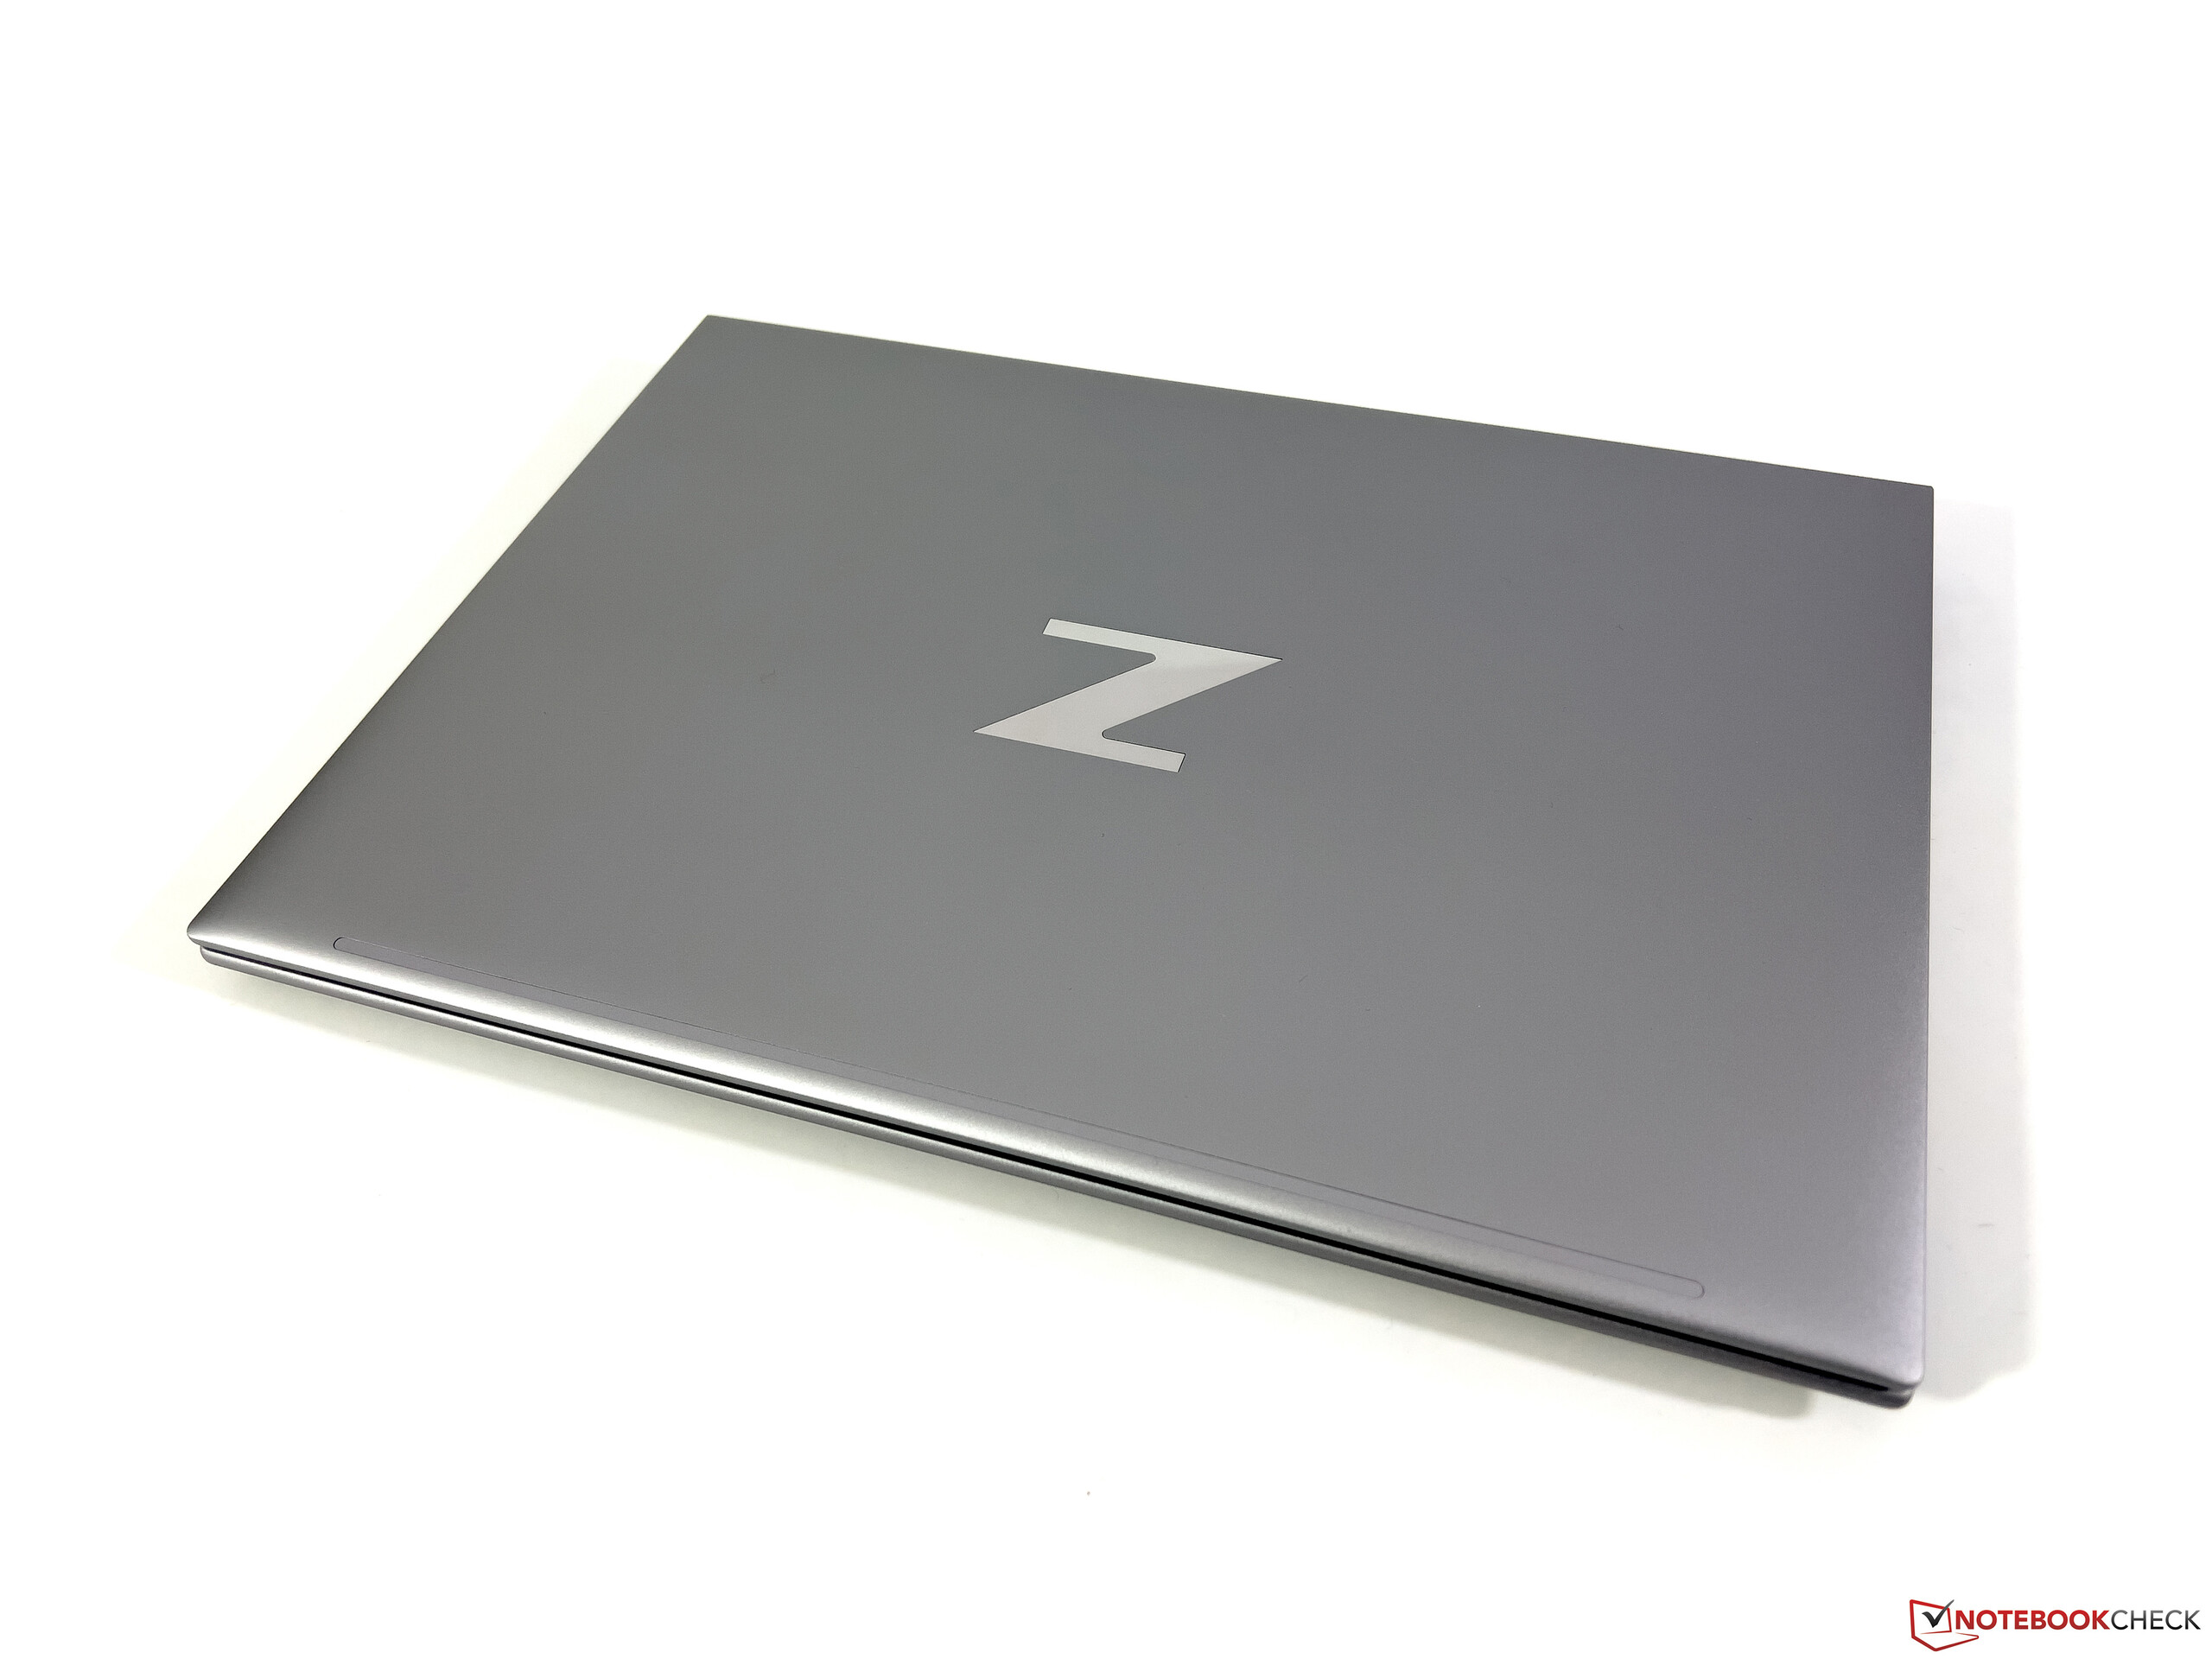
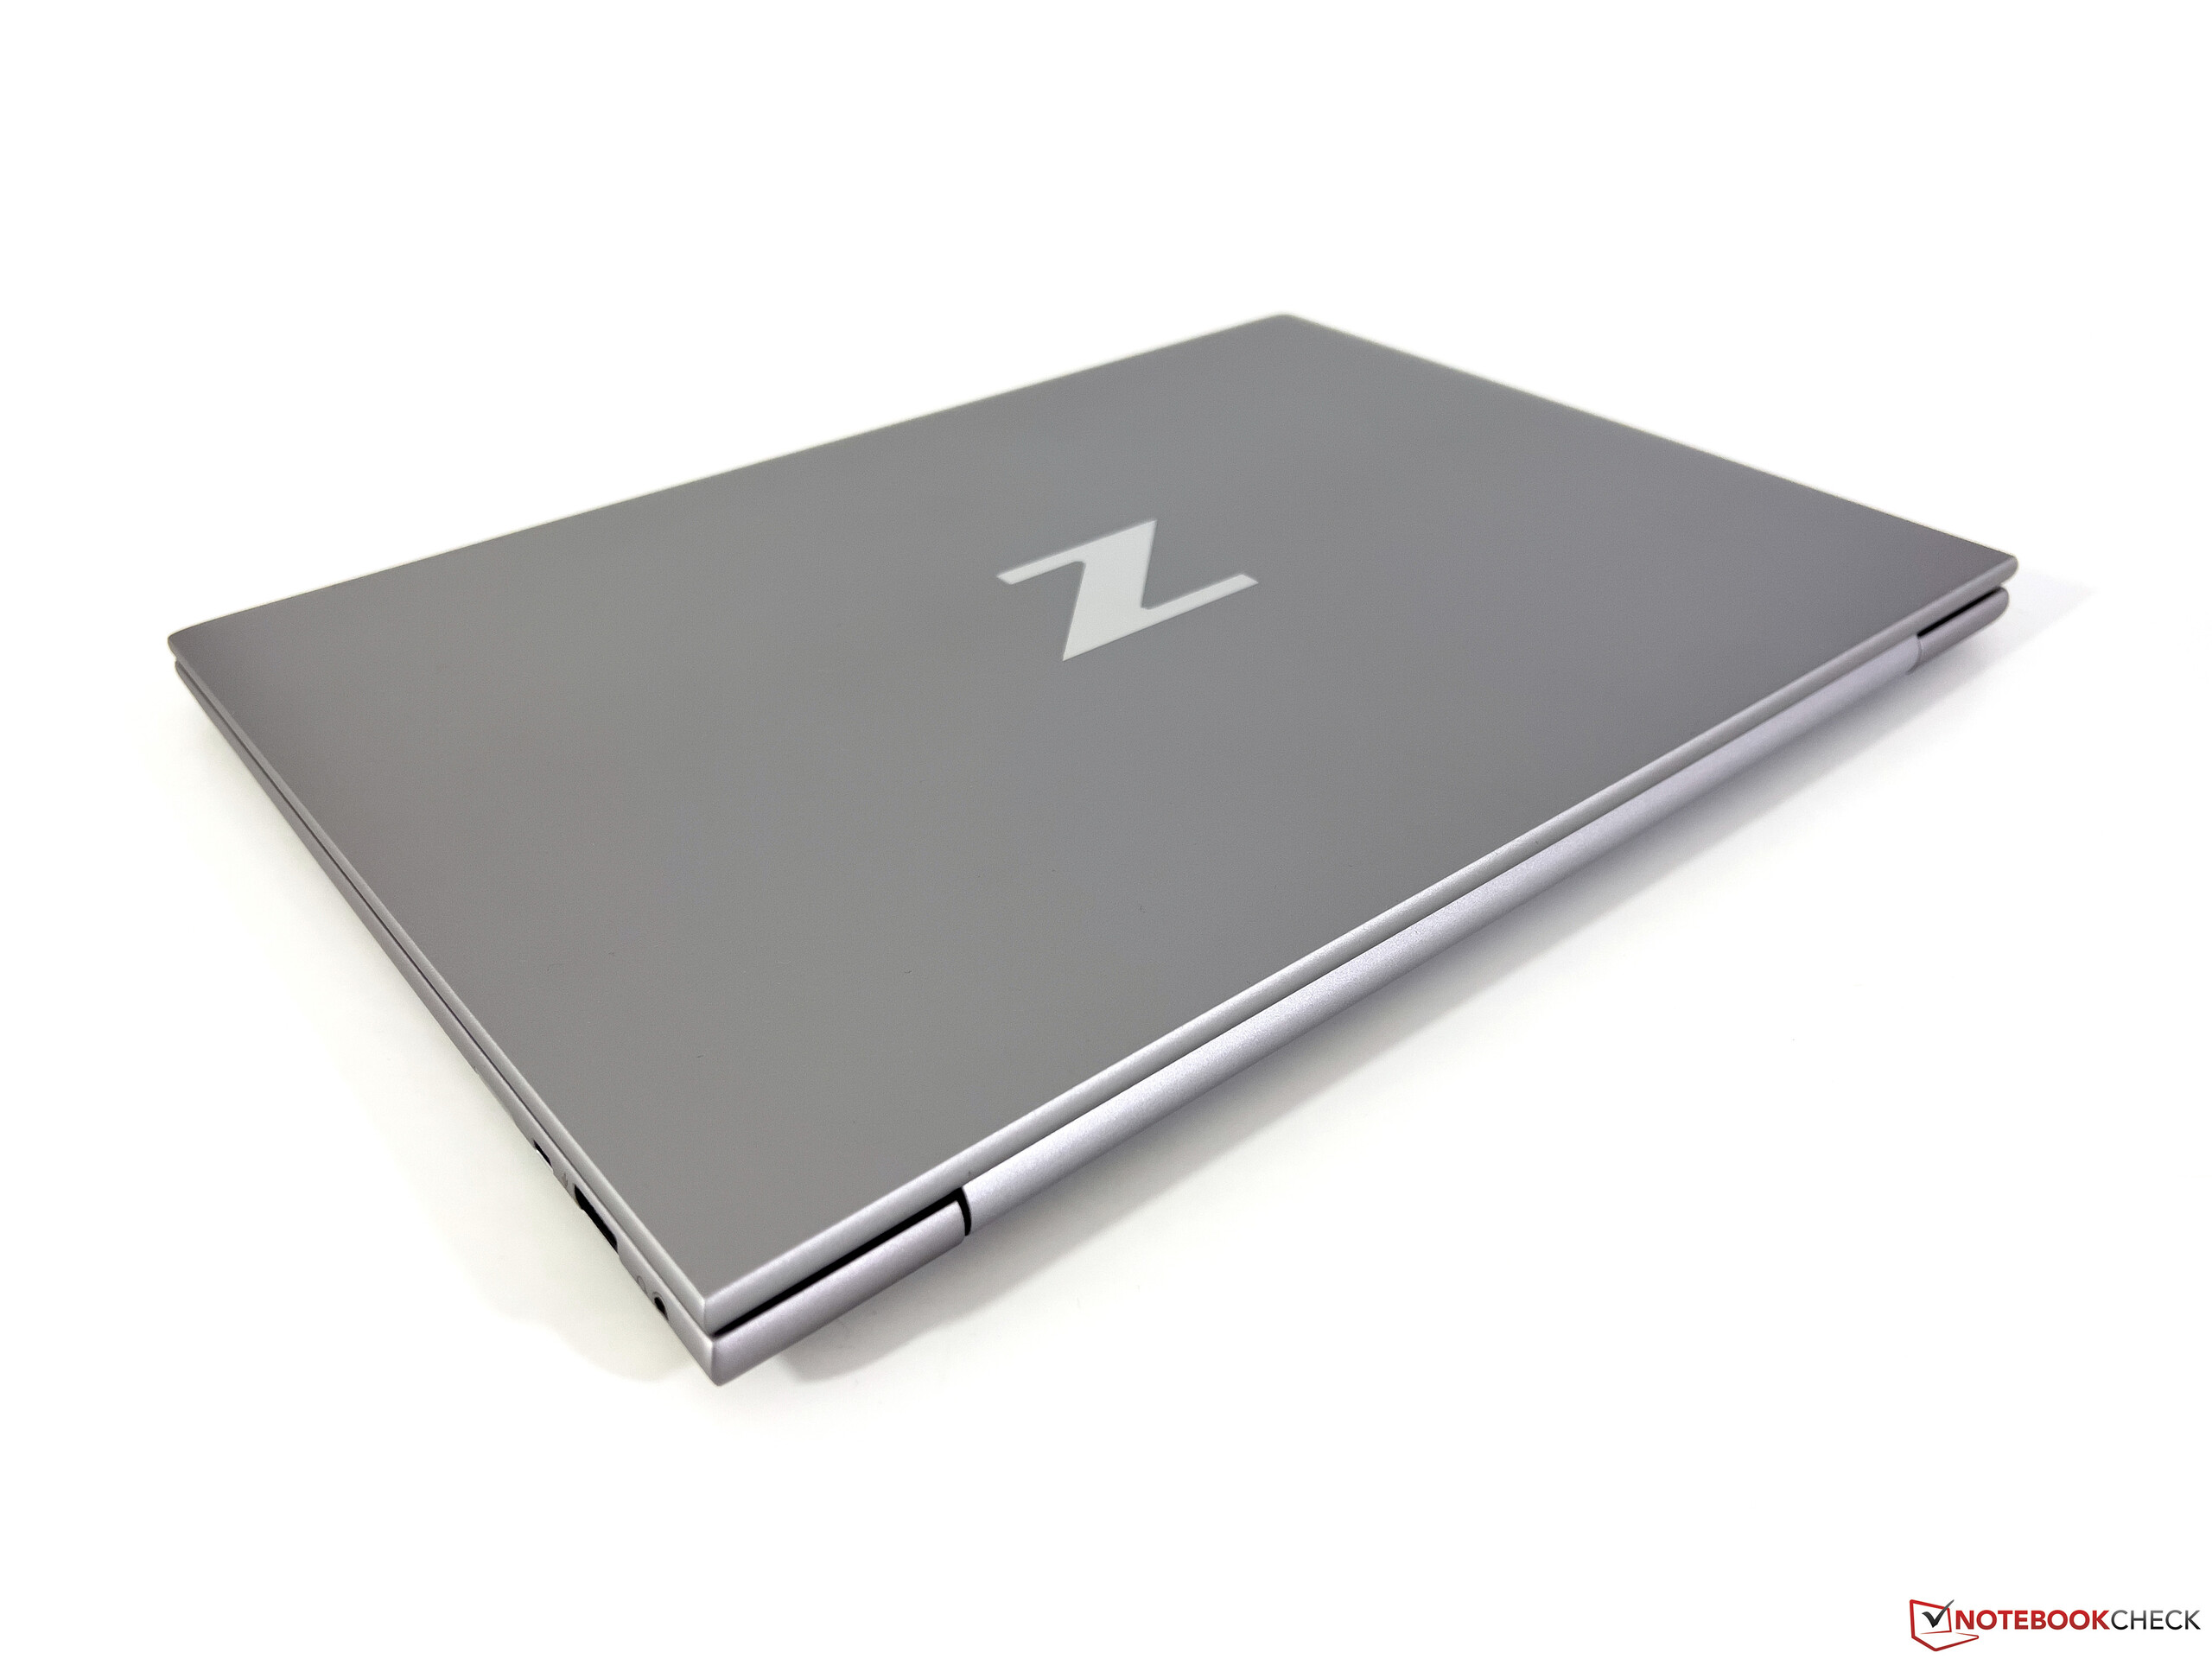
O HP ZBook Firefly G9 utiliza o mesmo chassi que o que se vê nos modelos comerciais regulares da empresa, como o EliteBook 840 G9 ou o 845 G9mas a cor prata parece um pouco mais escura nesta estação de trabalho móvel. A caixa de alumínio deixa uma impressão de alta qualidade e é também muito estável. Não enfrentamos nenhum problema como a moldura da tela que se solta (veja o revisão do EliteBook 845 G9). Graças à tela 16:10 e às bordas estreitas da tela, este equipamento compacto de 14 polegadas parece bastante moderno, mas não se destaca particularmente em um ambiente profissional com seu design bastante restrito. O ângulo máximo de abertura é de cerca de 170 graus e as dobradiças estão bem ajustadas. É possível abrir a tampa com uma mão sem qualquer problema, ao mesmo tempo em que se evita quase completamente a abertura das dobradiças.
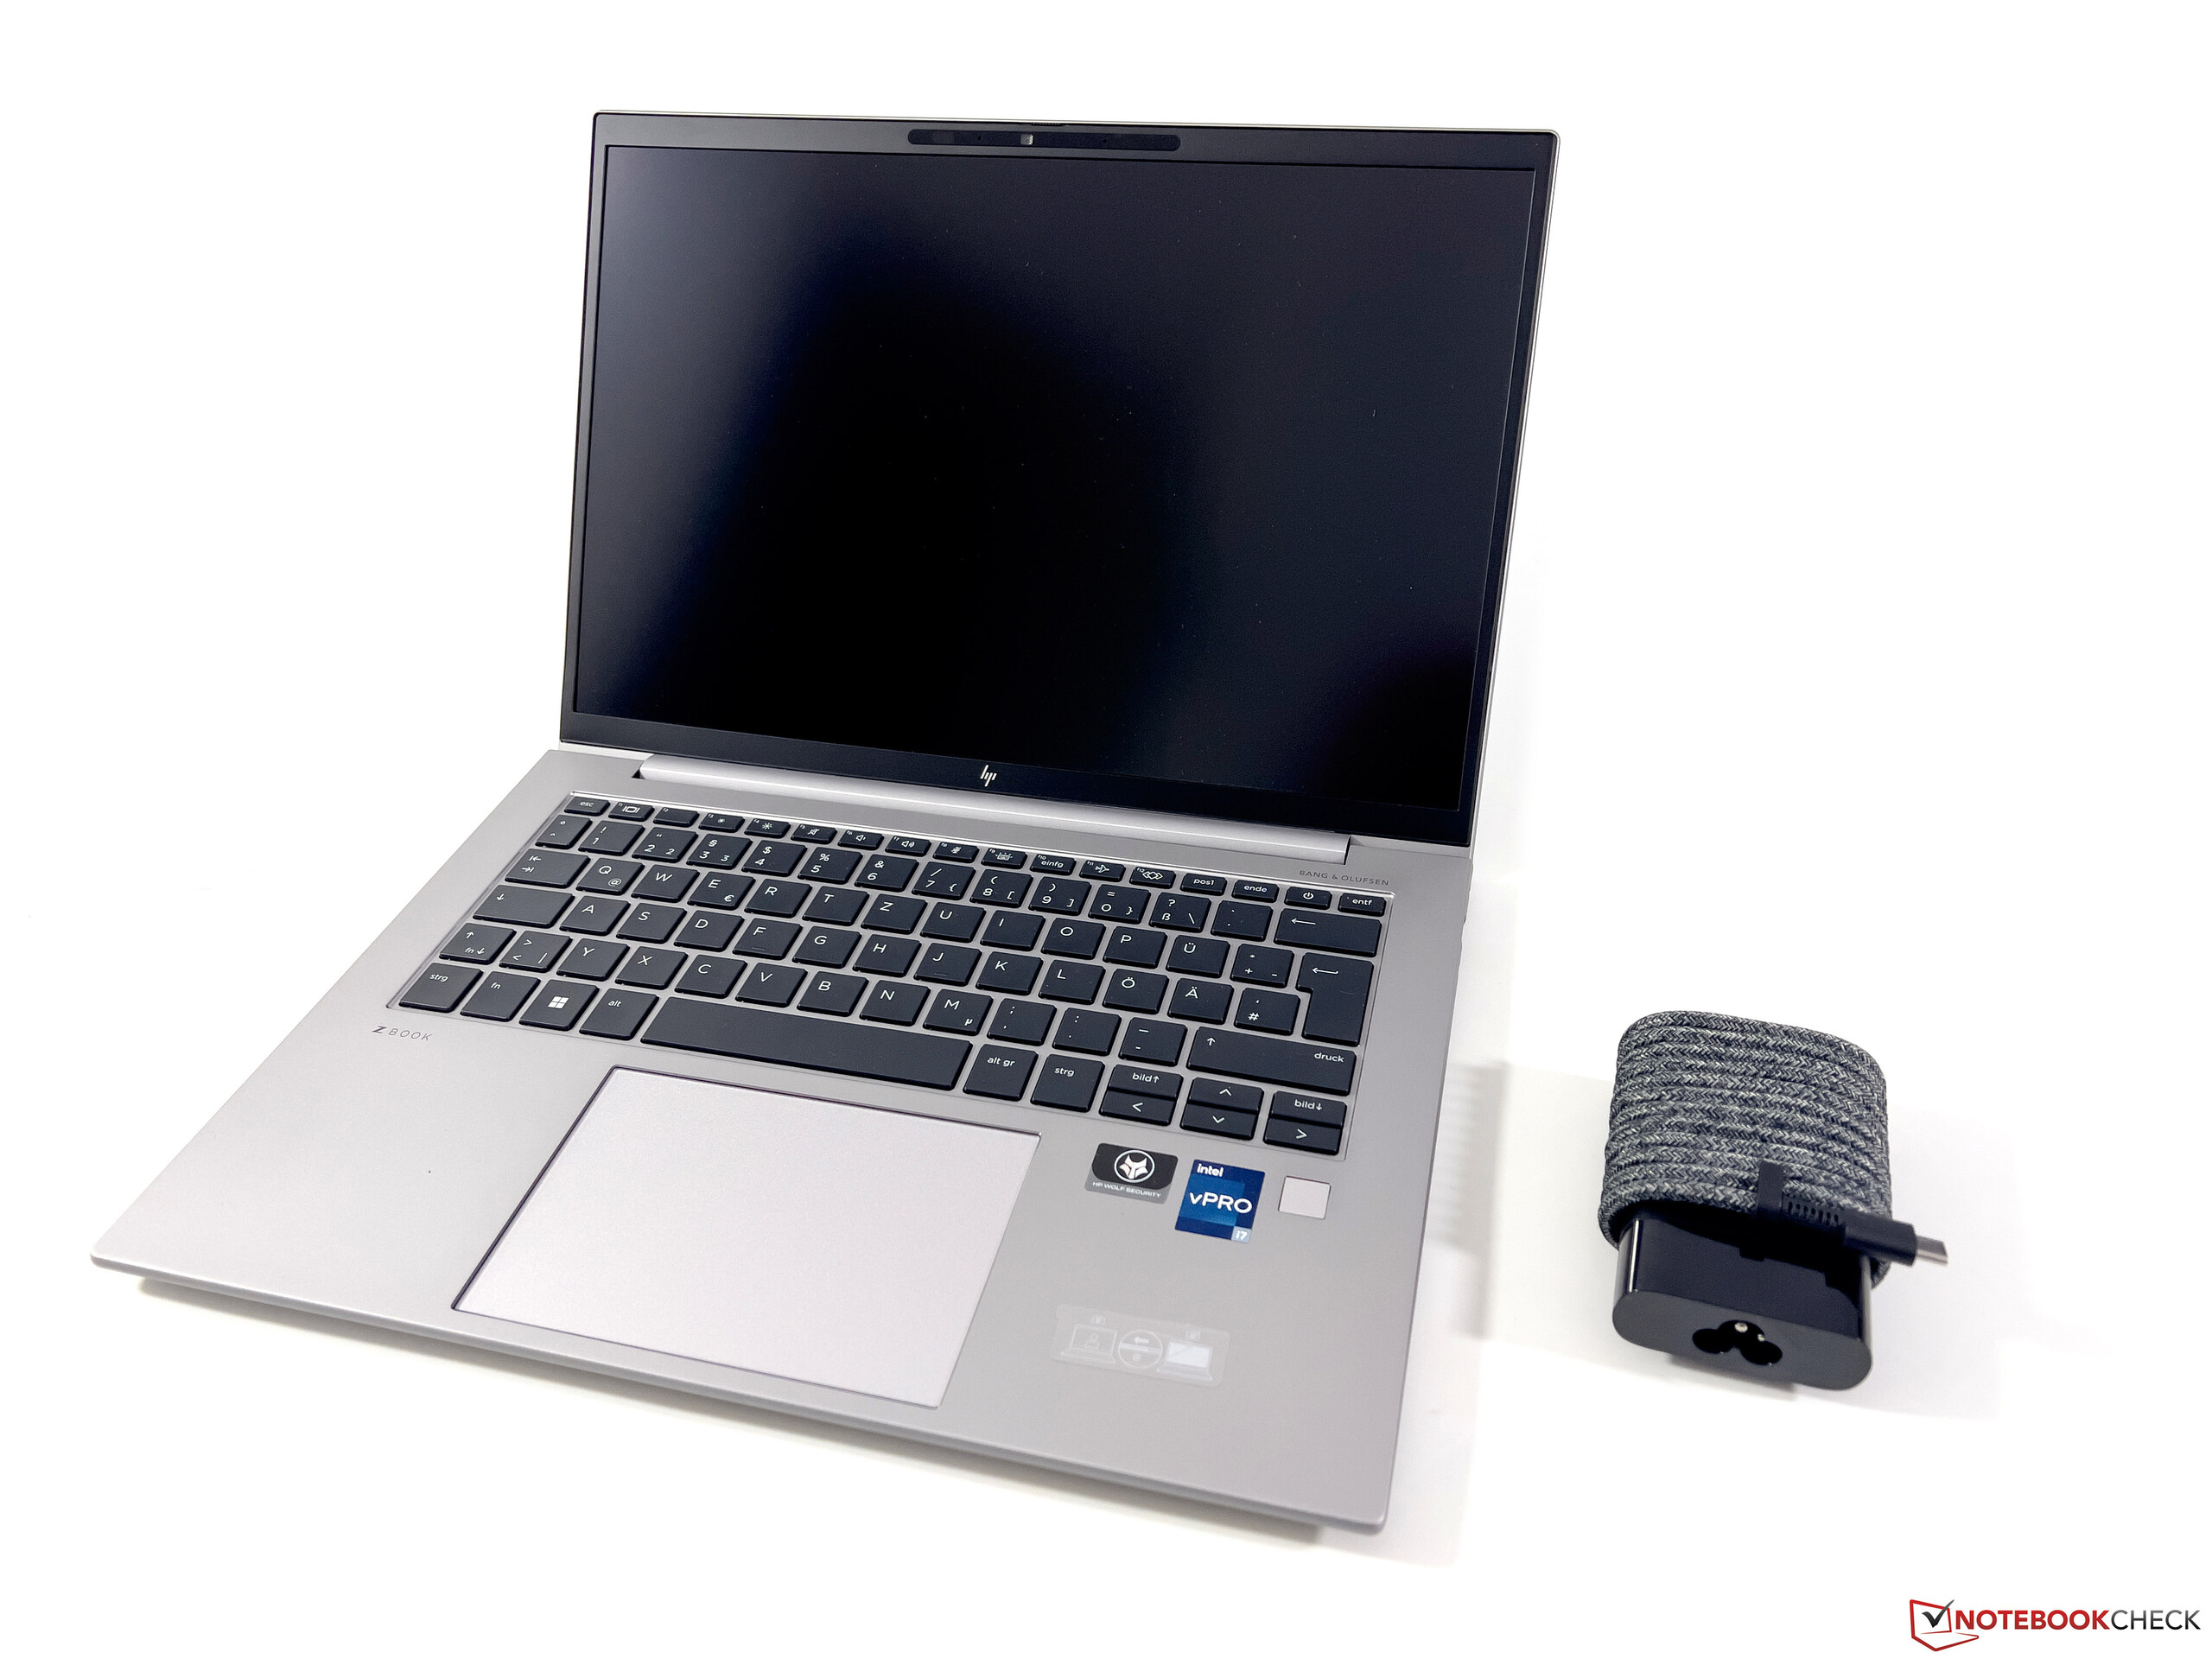
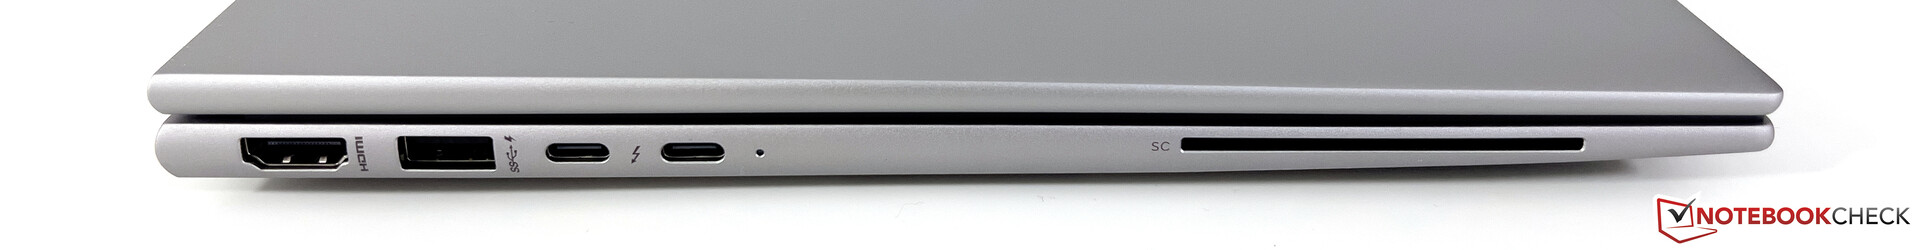
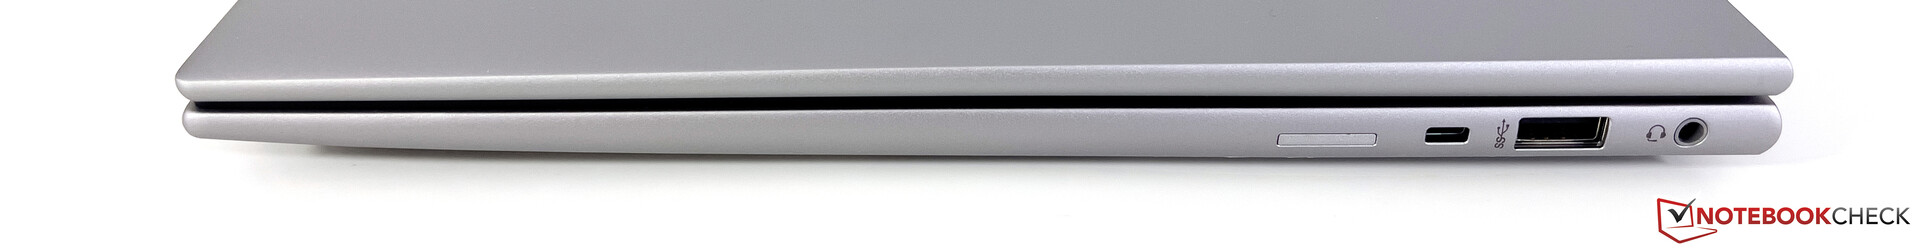
O ZBook oferece todas as portas importantes, incluindo duas portas USB-C com suporte Thunderbolt 4, que também permitem o fornecimento de energia ou a conexão a uma estação de acoplamento. Além de uma saída HDMI completa, há também um leitor SmartCard e um slot para um cartão nano-SIM nos modelos WWAN (opcionalmente com 5G). O módulo WWAN não pode ser atualizado, no entanto. A HP usa o moderno módulo AX211 WLAN da Intel, que suporta o padrão Wi-Fi 6E. Conseguimos nos conectar à rede de 6 GHz de nosso roteador de referência da Asus sem nenhum problema no teste e as taxas de transferência são muito boas. Uma porta Ethernet e um leitor de cartões não estão incluídos.
Além de uma câmera IR, a HP instalou uma webcam de 5 MP com abertura mecânica, que só grava imagens com um máximo de 2.560 x 1.440 pixels (3,7 MP). Os vídeos podem ser gravados em um máximo de 1440p a 30 quadros por segundo. A câmera deixa uma boa impressão e pode se destacar dos habituais módulos de 720p ou 1080p em termos de nitidez de imagem, bem como fidelidade de cores.


Manutenção
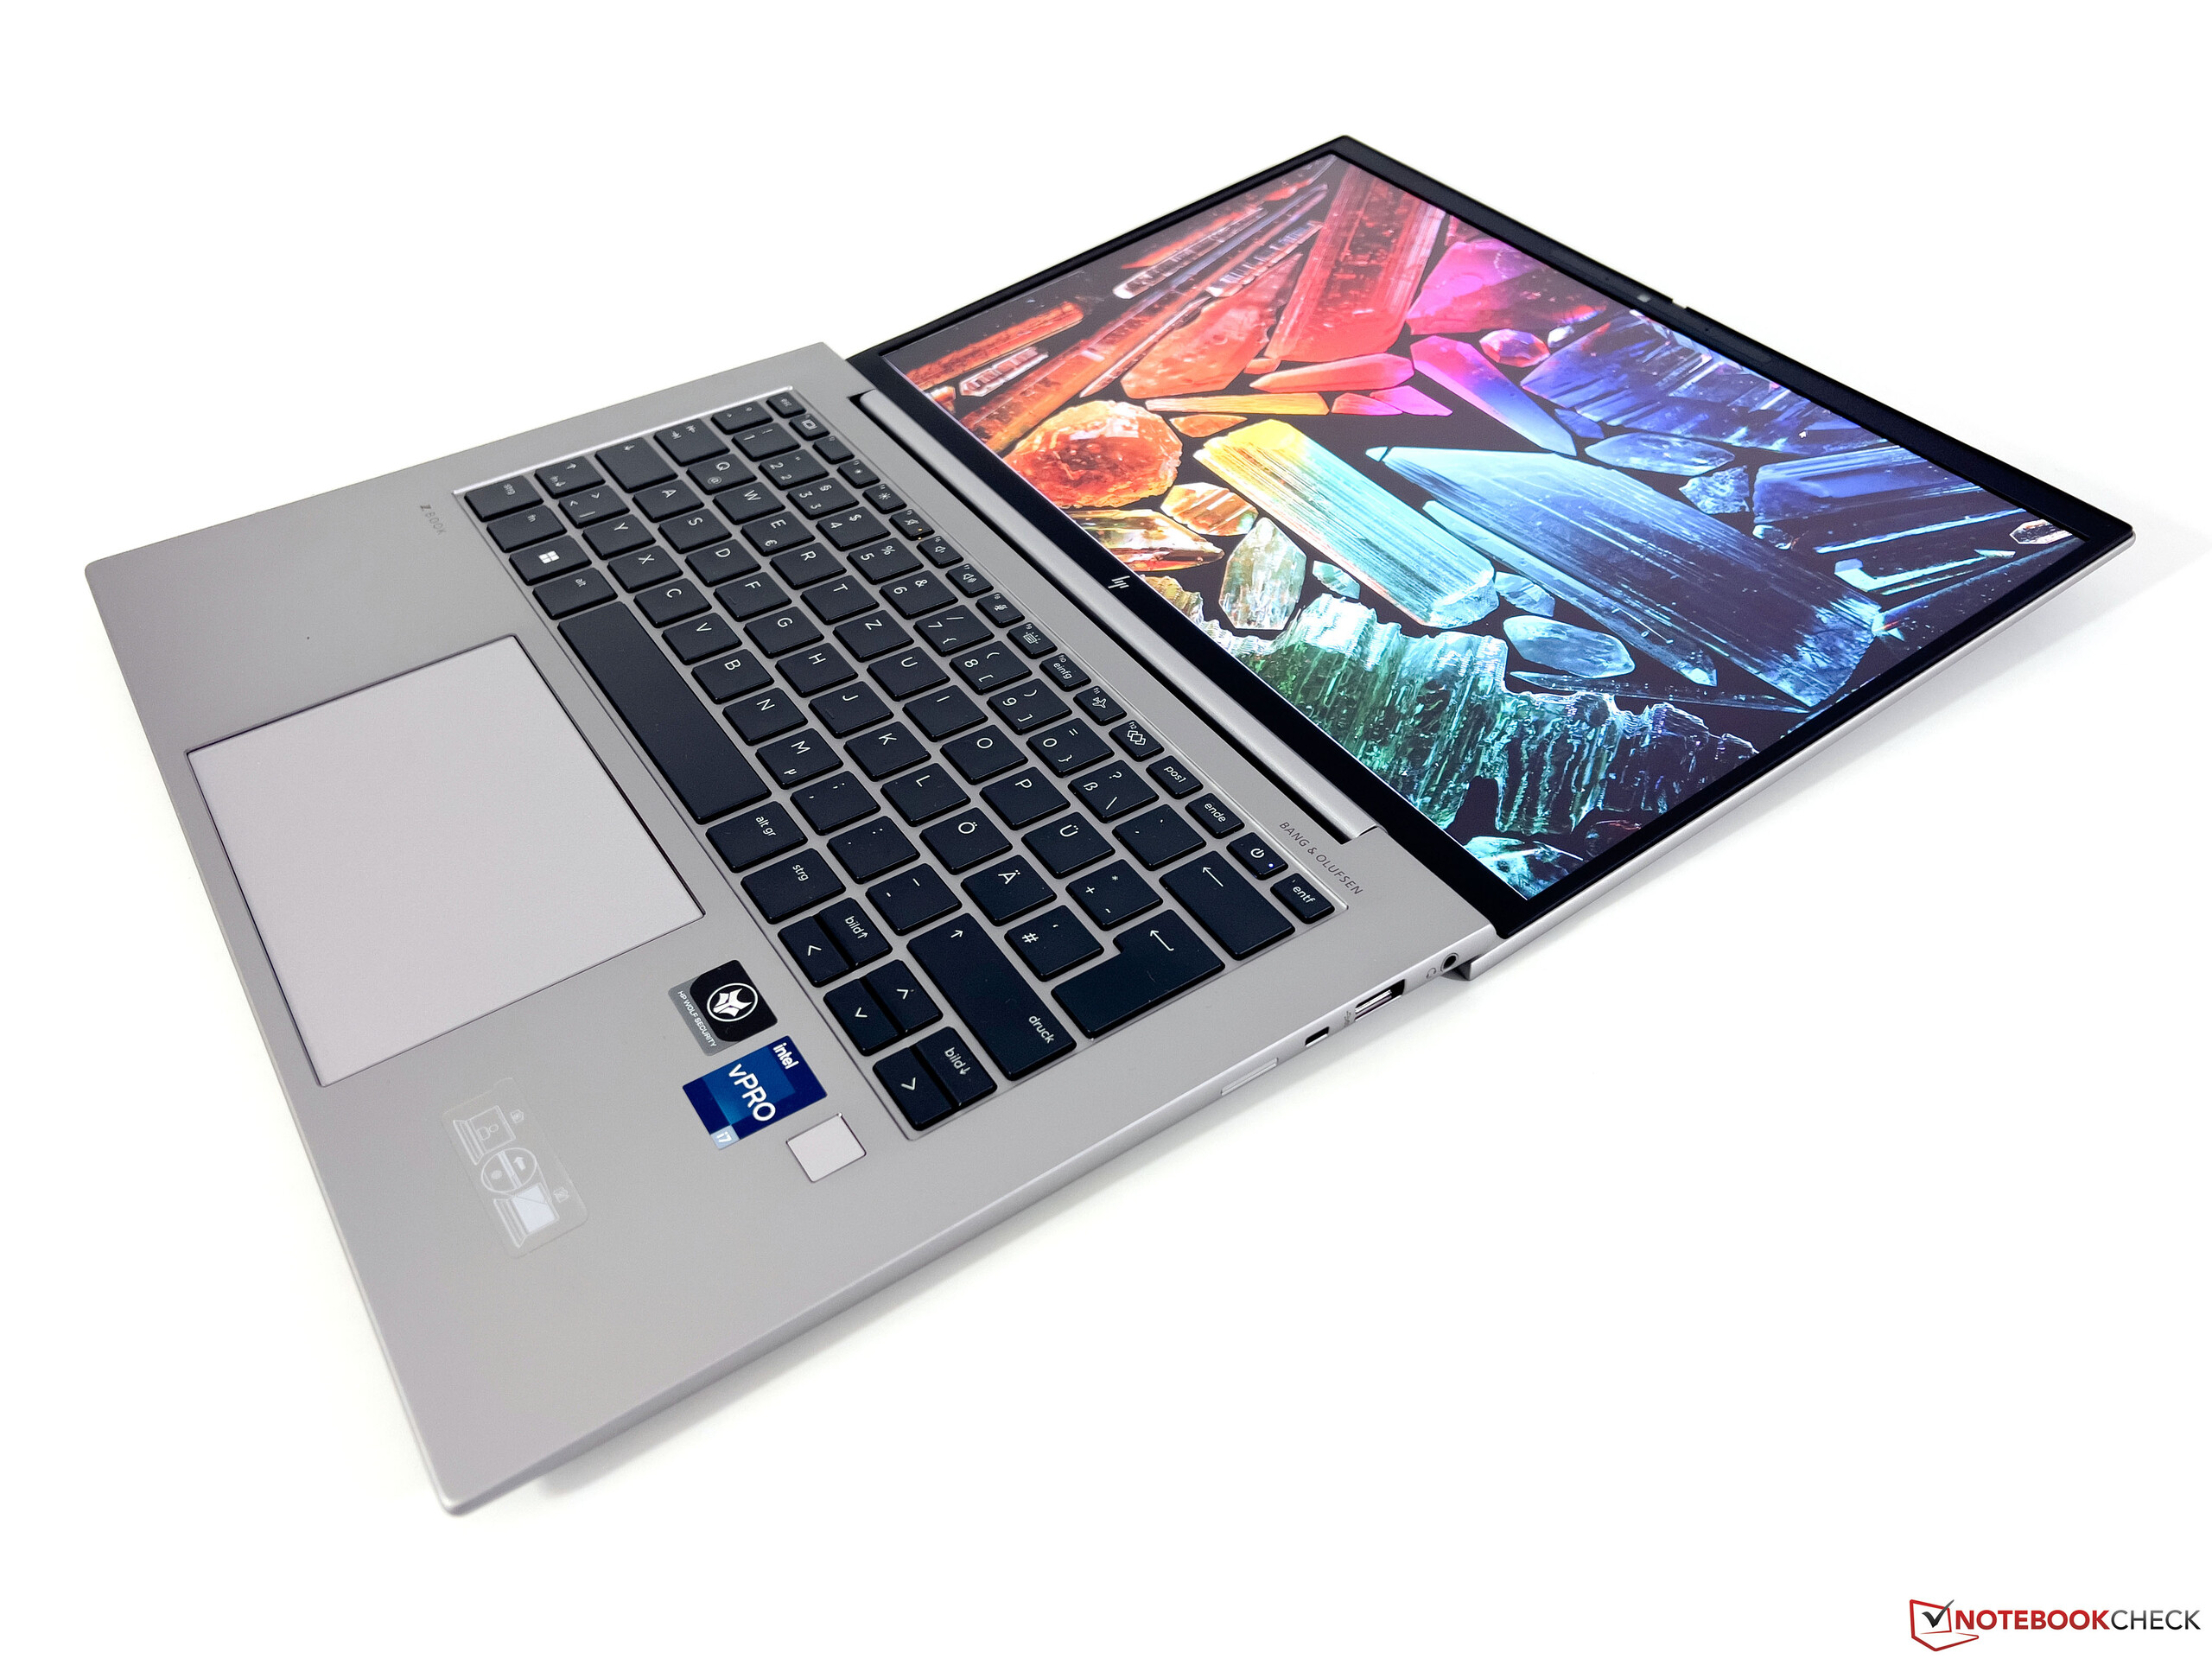
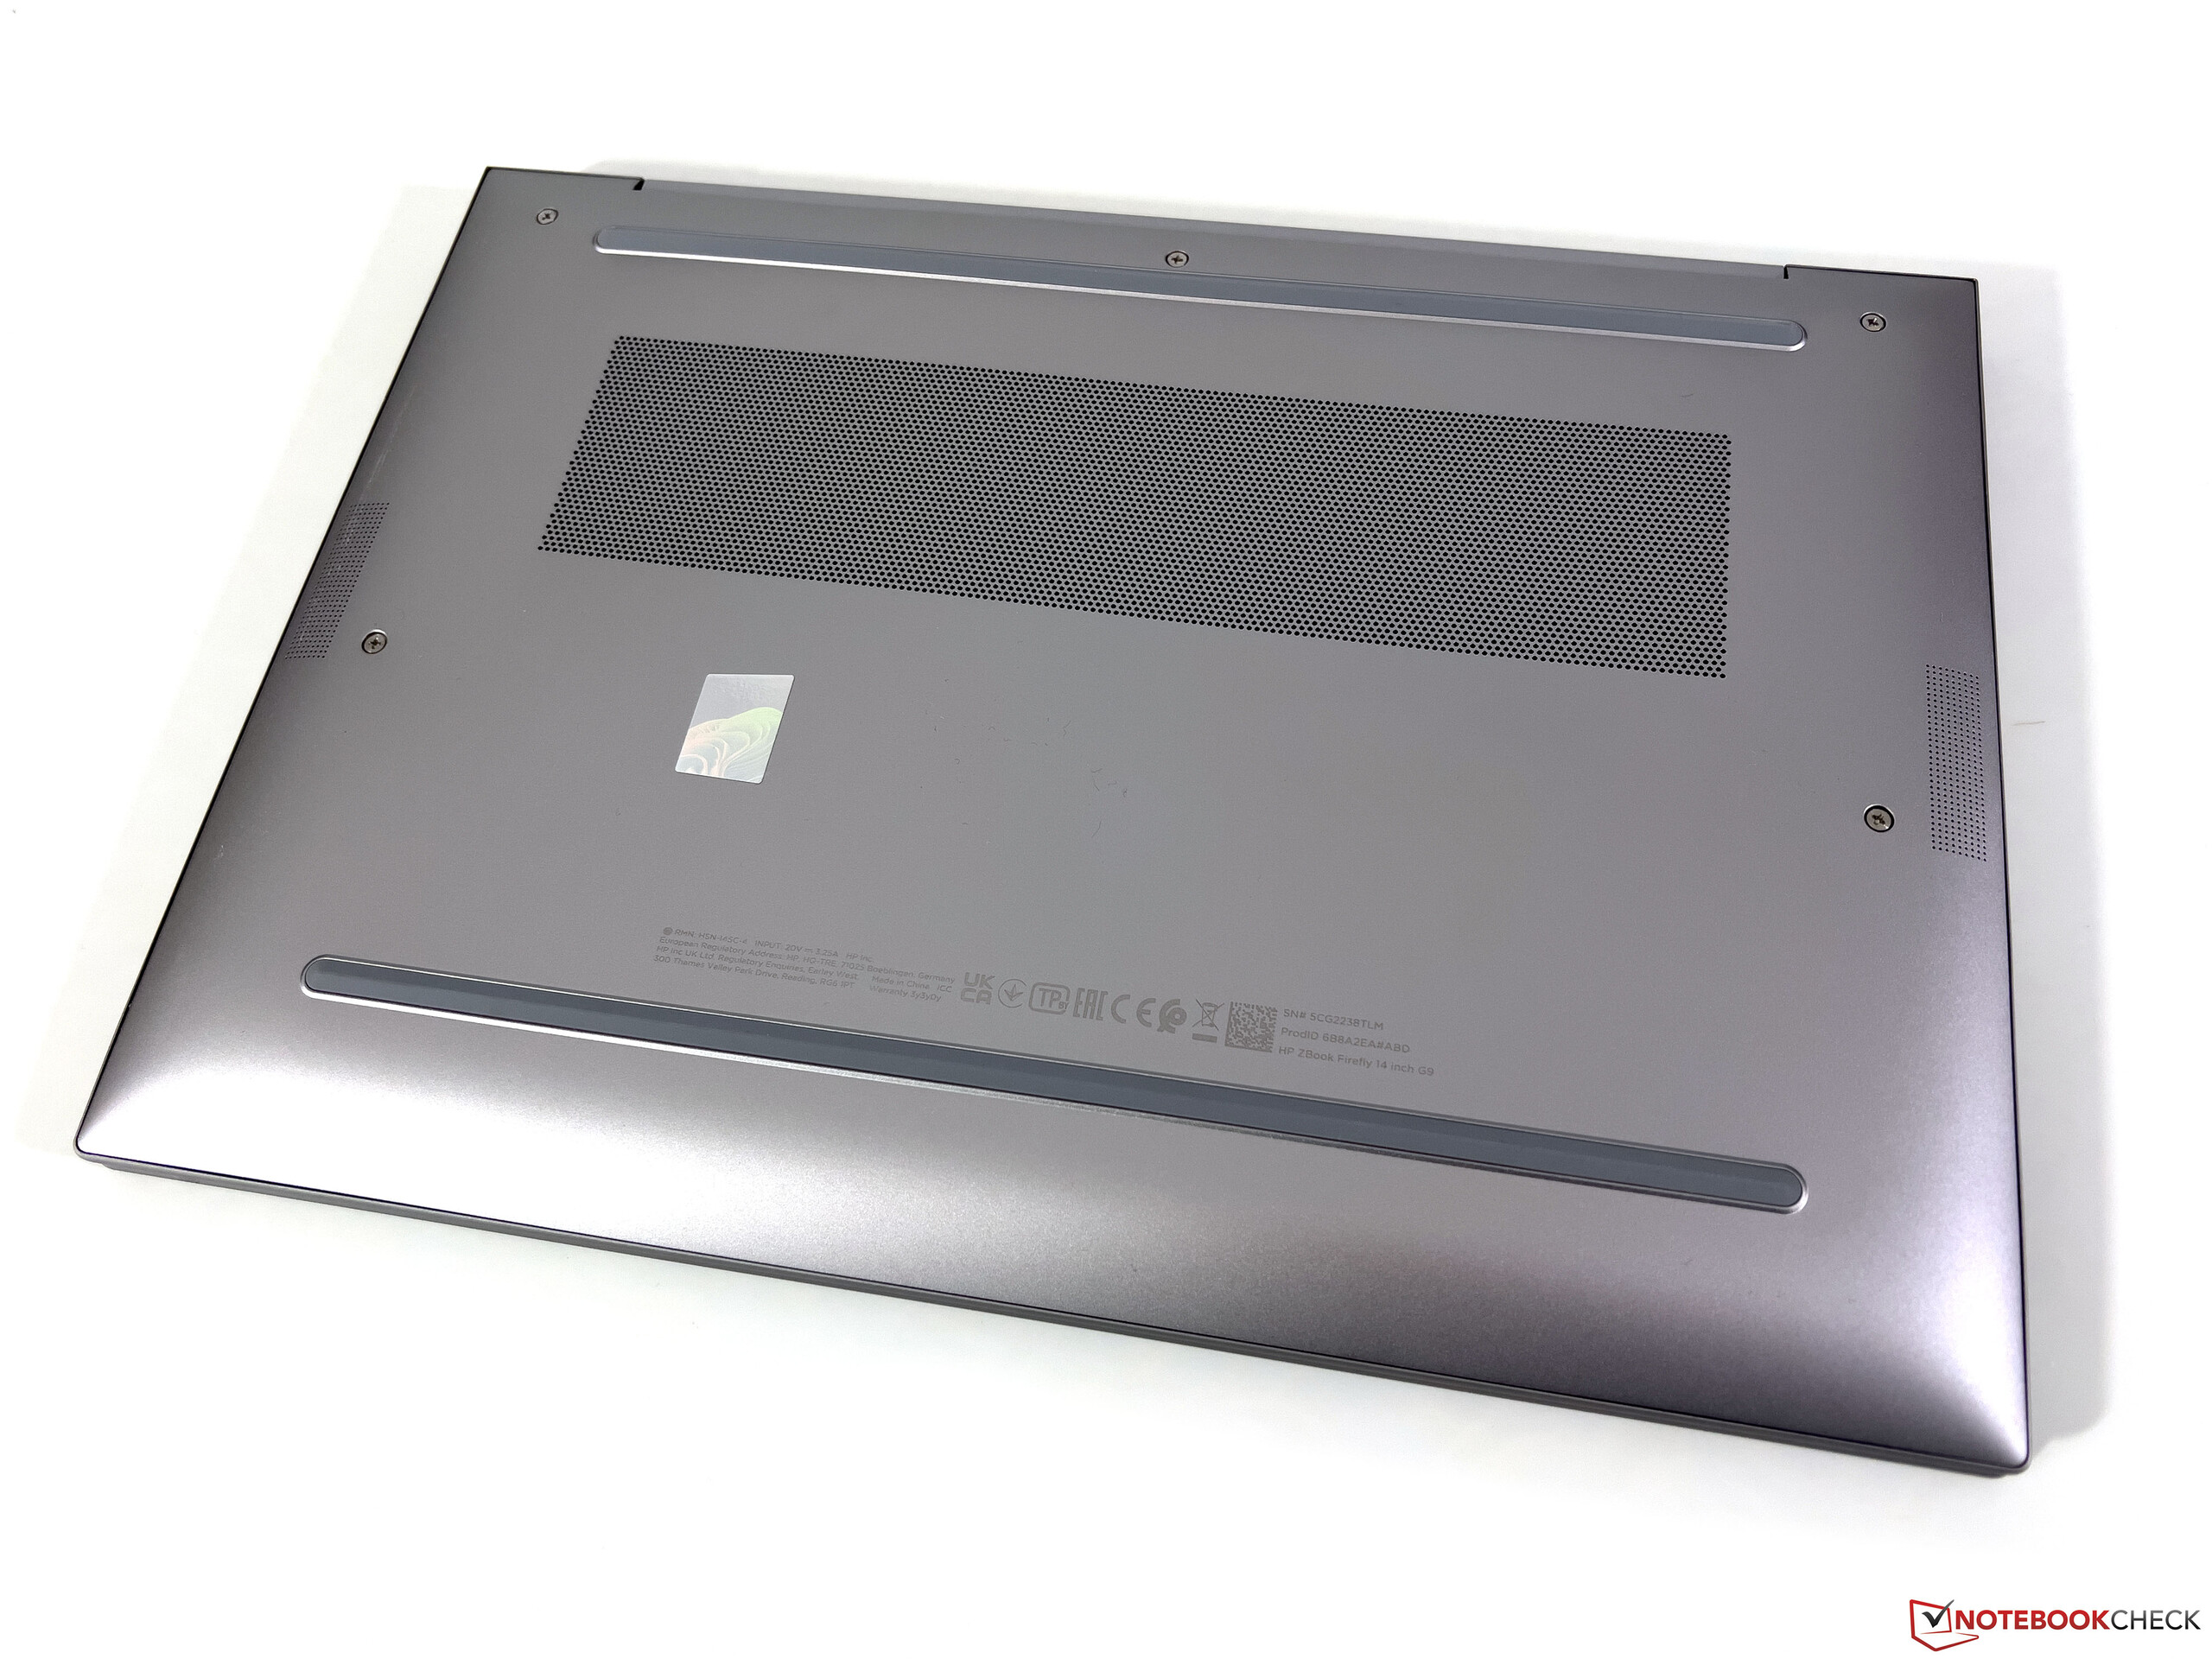
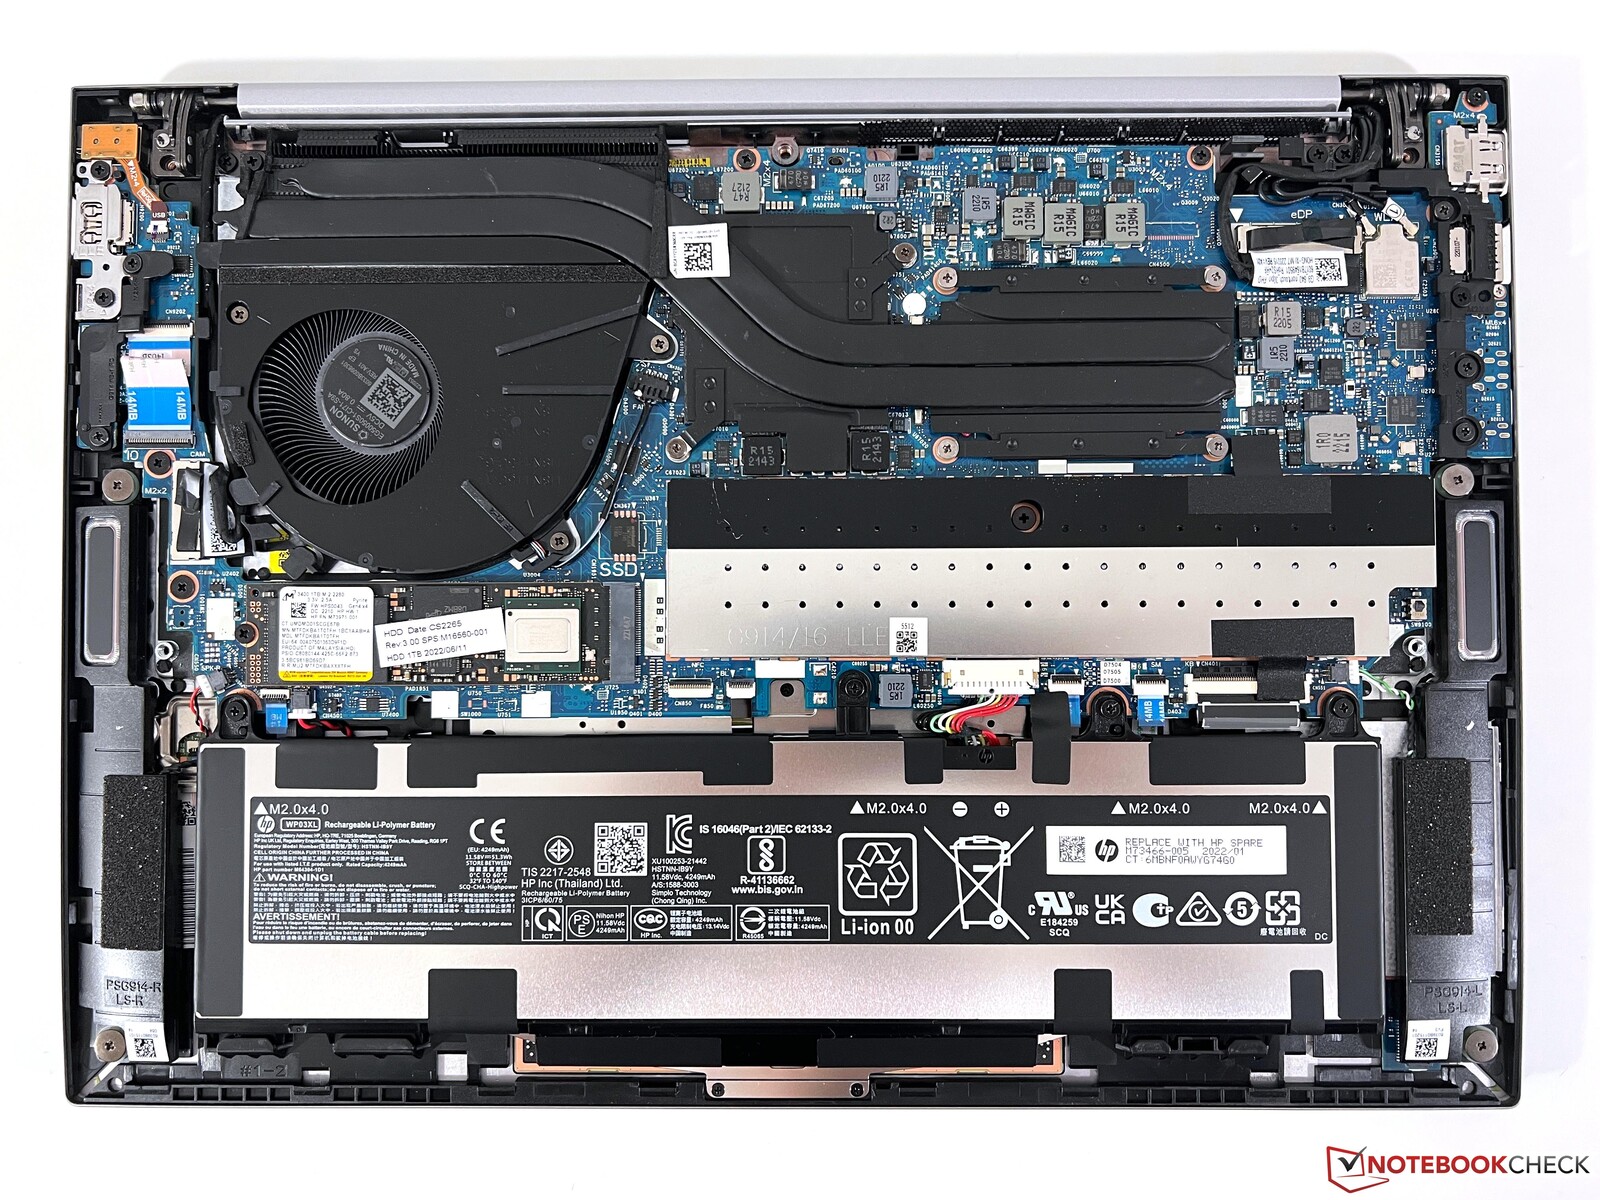
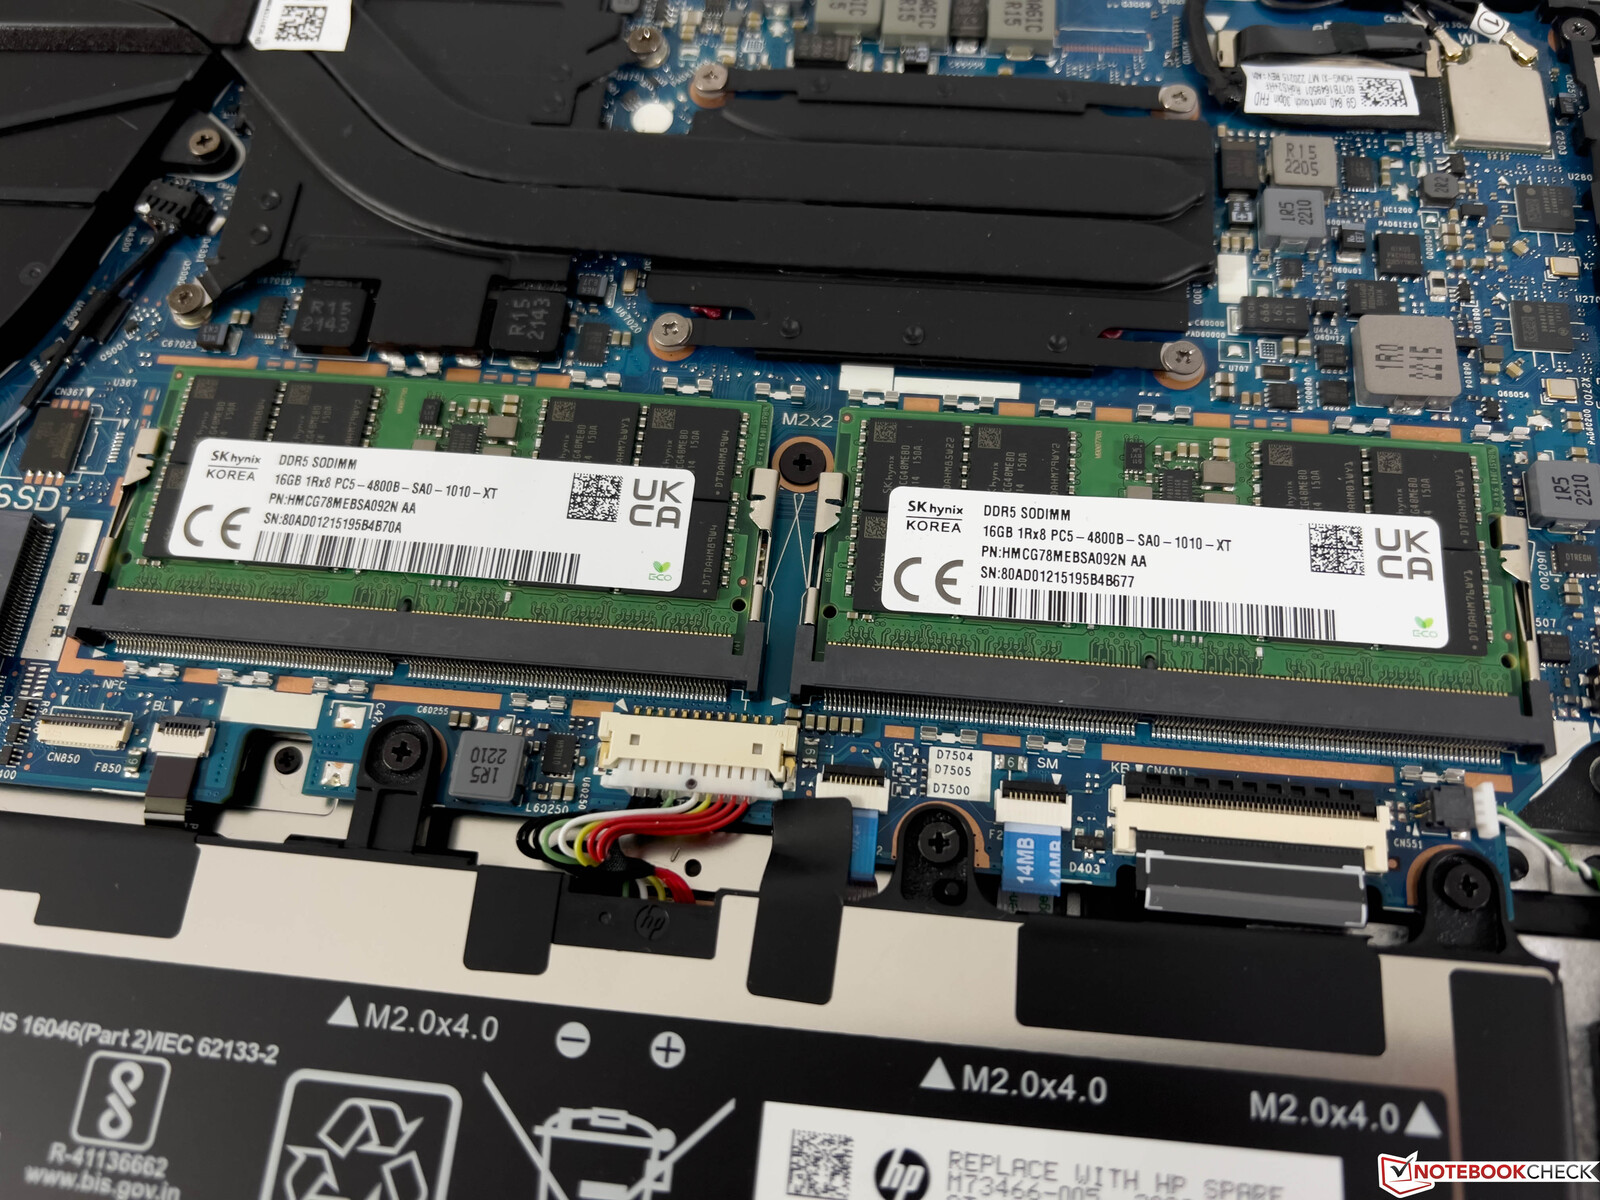
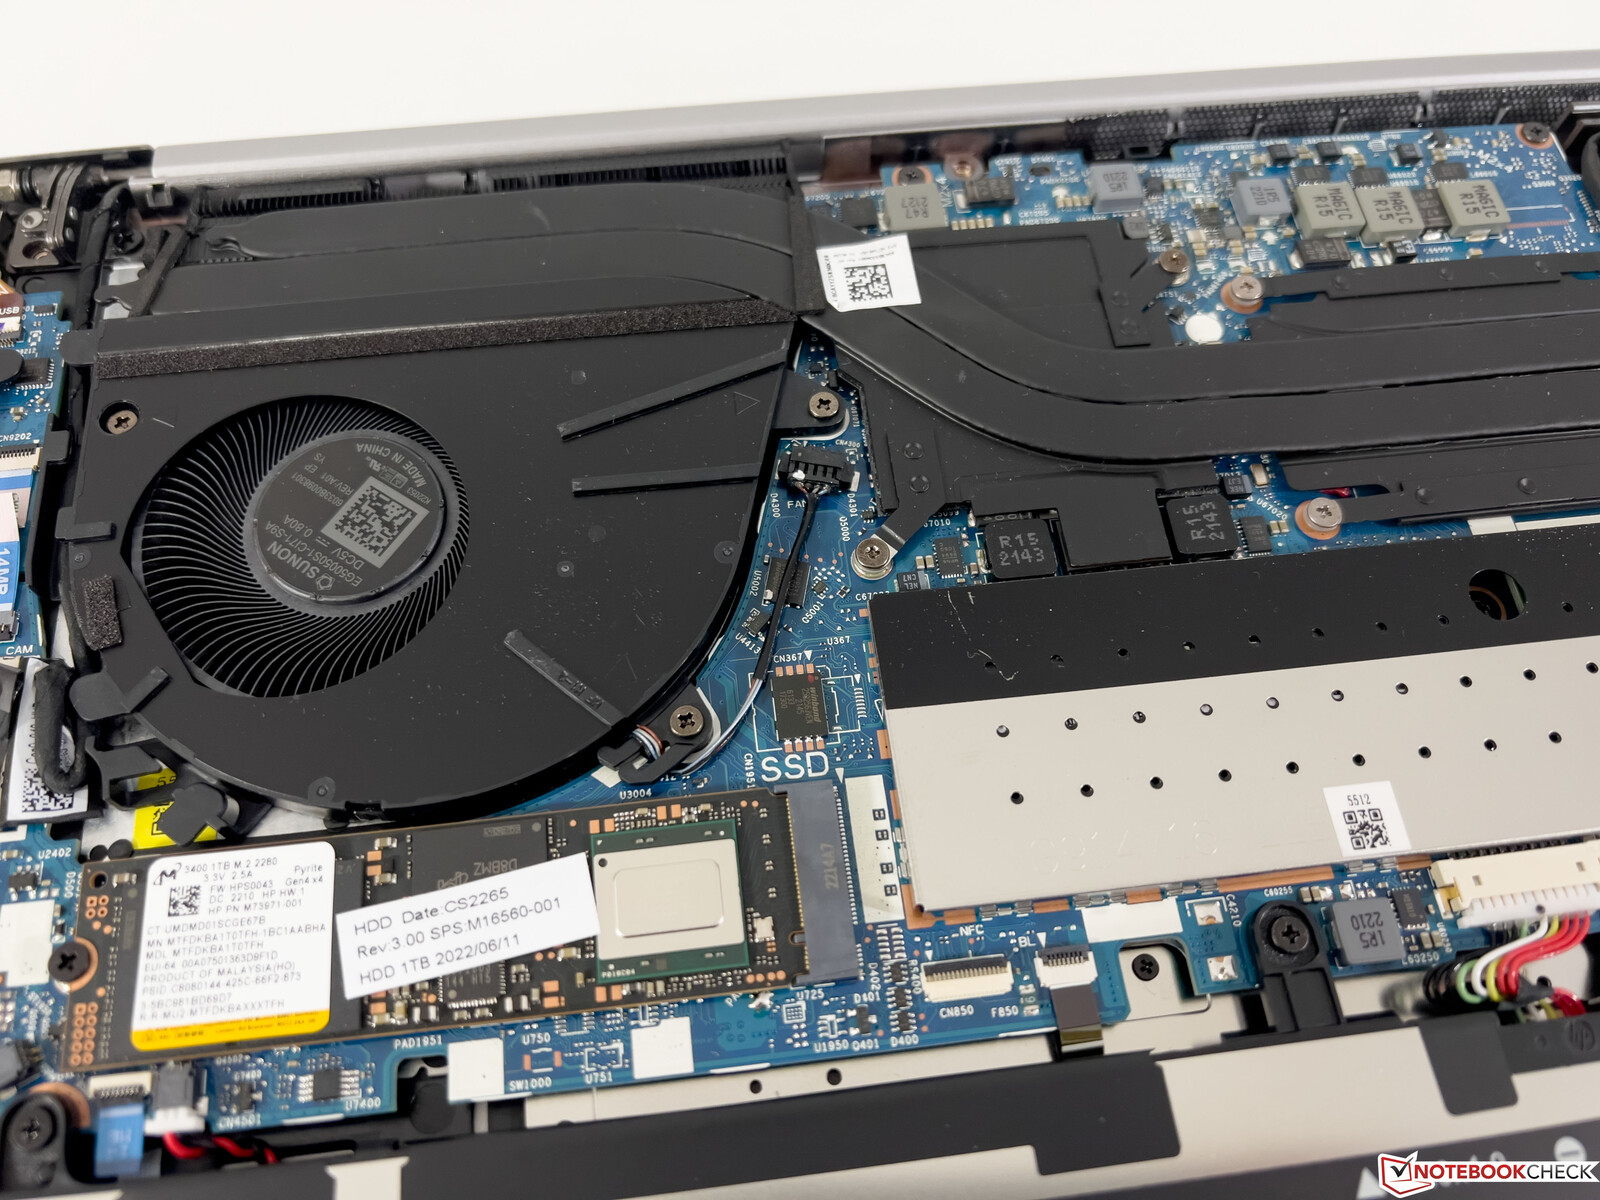
A tampa inferior da caixa é fixada com parafusos Philips convencionais (eles só soltam e não desaparafusam completamente) e podem ser facilmente removidos. Dentro, você tem acesso ao ventilador, à bateria parafusada, ao slot M.2-2280 assim como aos dois slots SO-DIMM, que estão localizados sob uma tampa adicional. Entretanto, o módulo WLAN é soldado na placa-mãe.
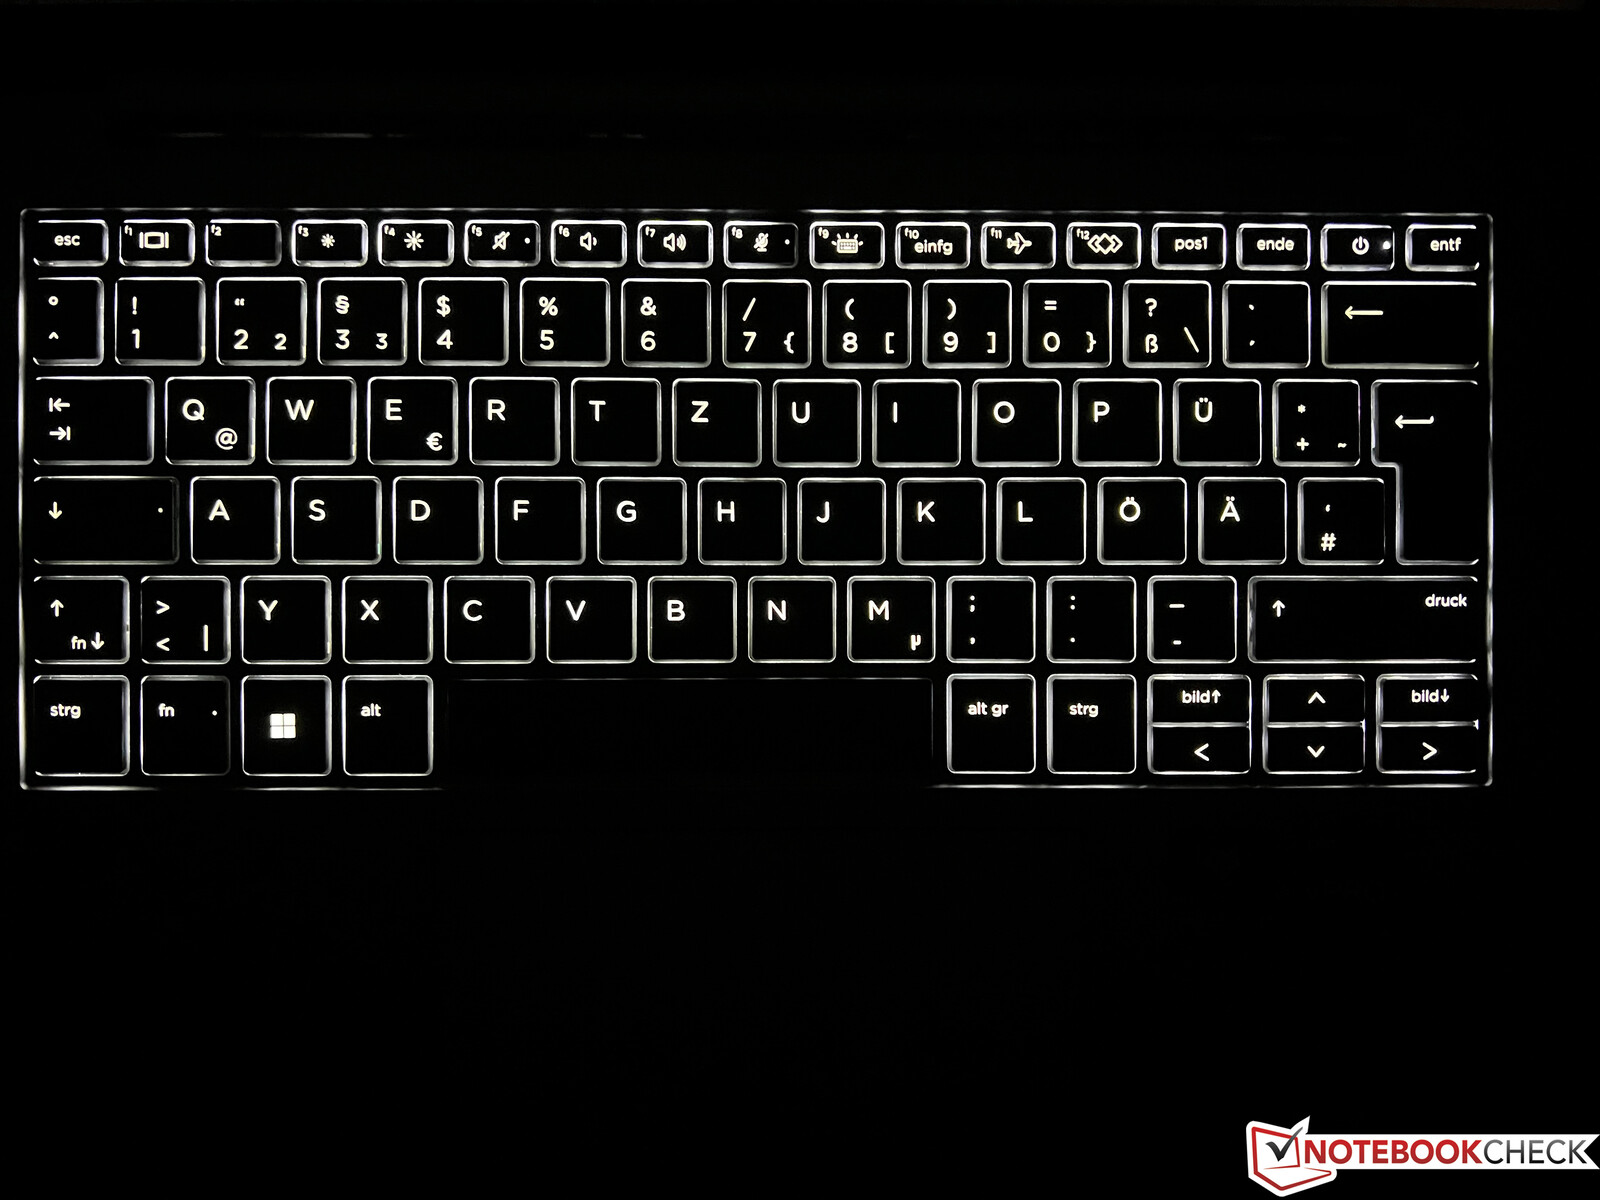
Dispositivos de entrada: Zbook com um teclado muito bom
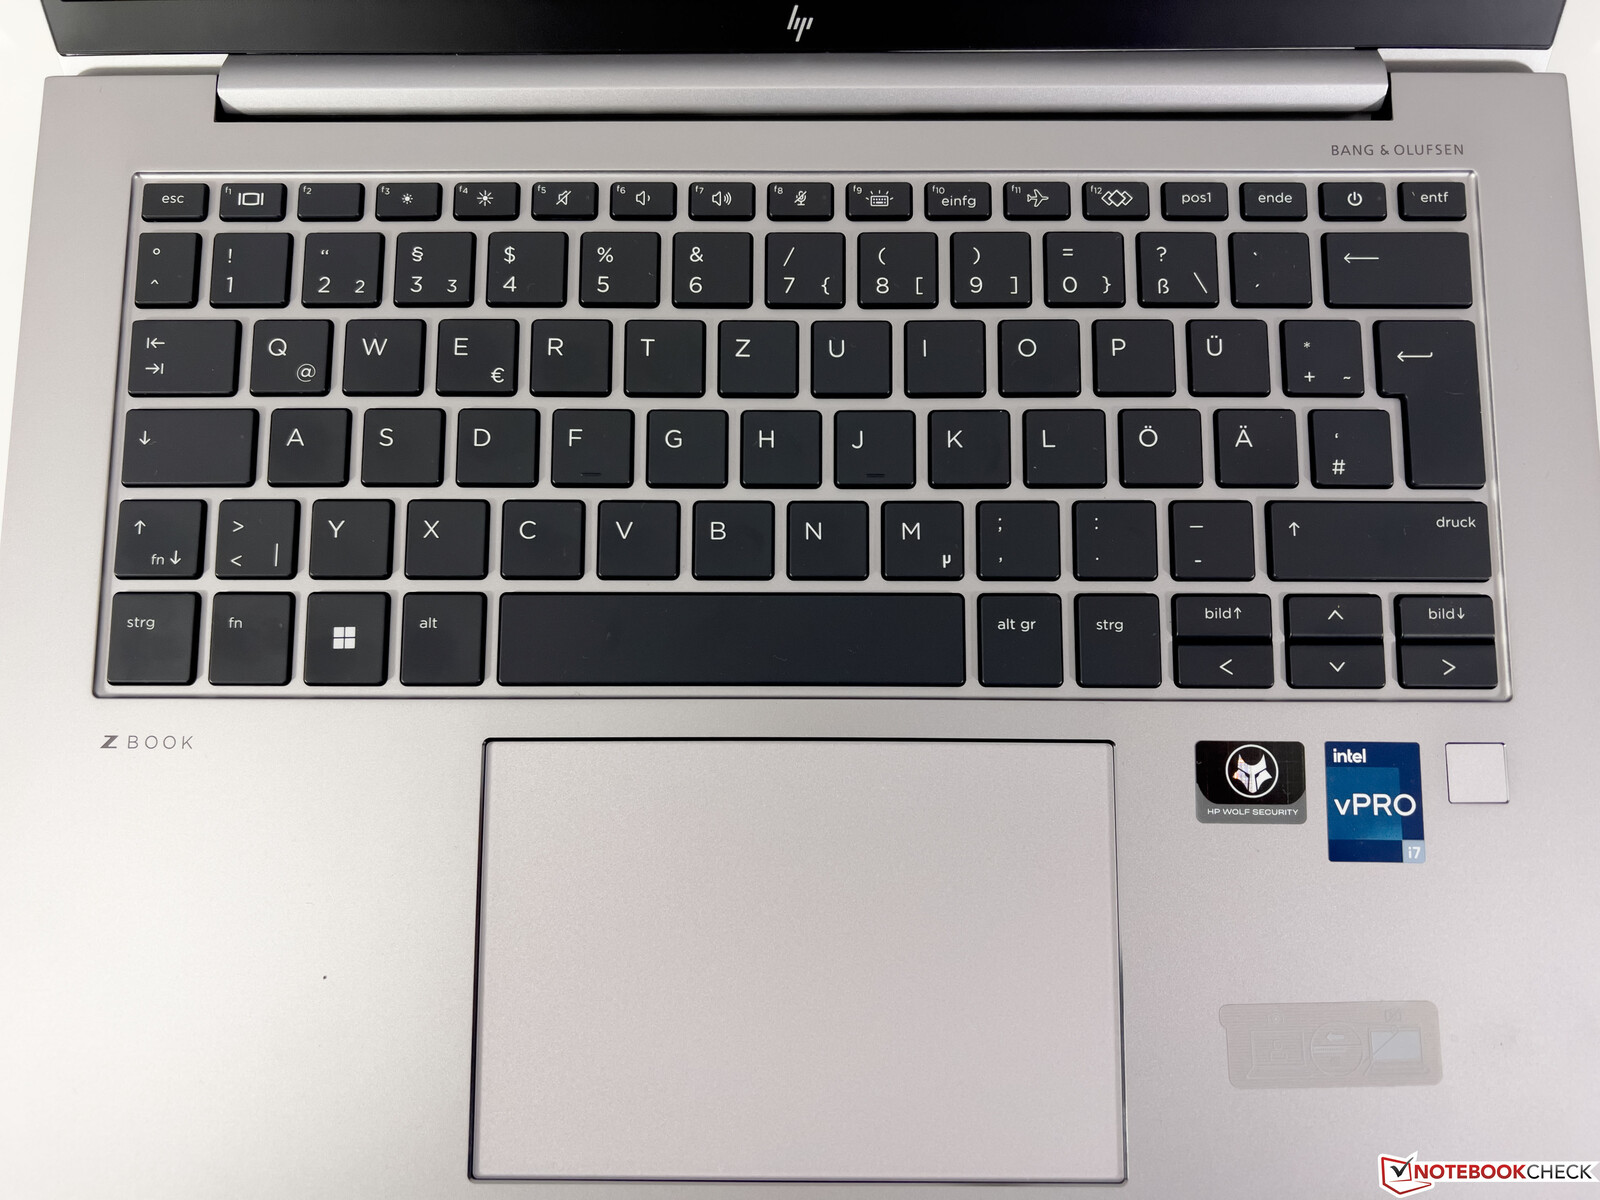
O teclado retroiluminado oferece um ponto de pressão firme e uma experiência de digitação muito confortável em geral, tornando o ZBook adequado para escrever textos muito longos. O botão de alimentação está integrado na parte superior direita do teclado e há o risco de acertar acidentalmente a tecla. Além disso, as teclas de seta são muito pequenas. O leitor de impressões digitais está localizado abaixo do teclado, do lado direito.
O grande clickpad (12 x 8 cm) oferece boas propriedades de deslizamento e funciona muito bem no uso diário. A parte inferior do tapete pode ser pressionada para baixo, o que é reconhecido com um ruído de clique agradavelmente rico e silencioso - como deveria ser.
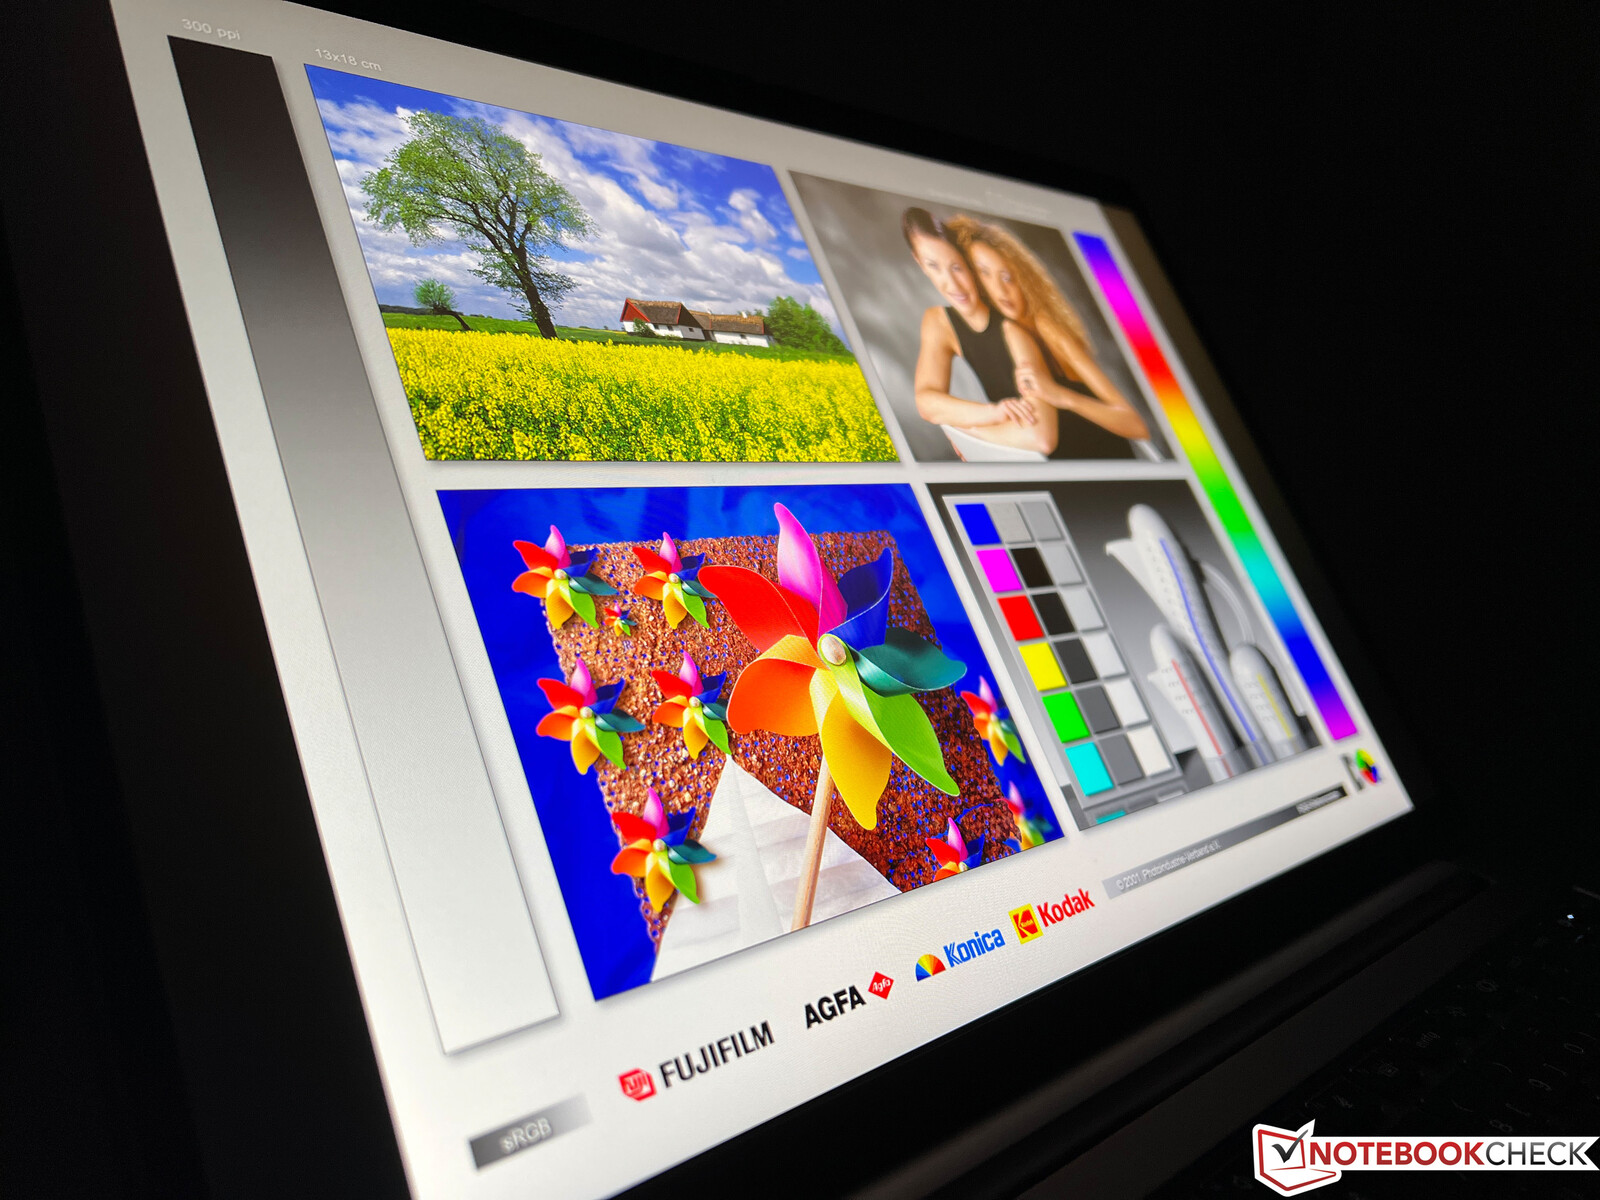
Mostrar: ZBook com painel IPS fosco
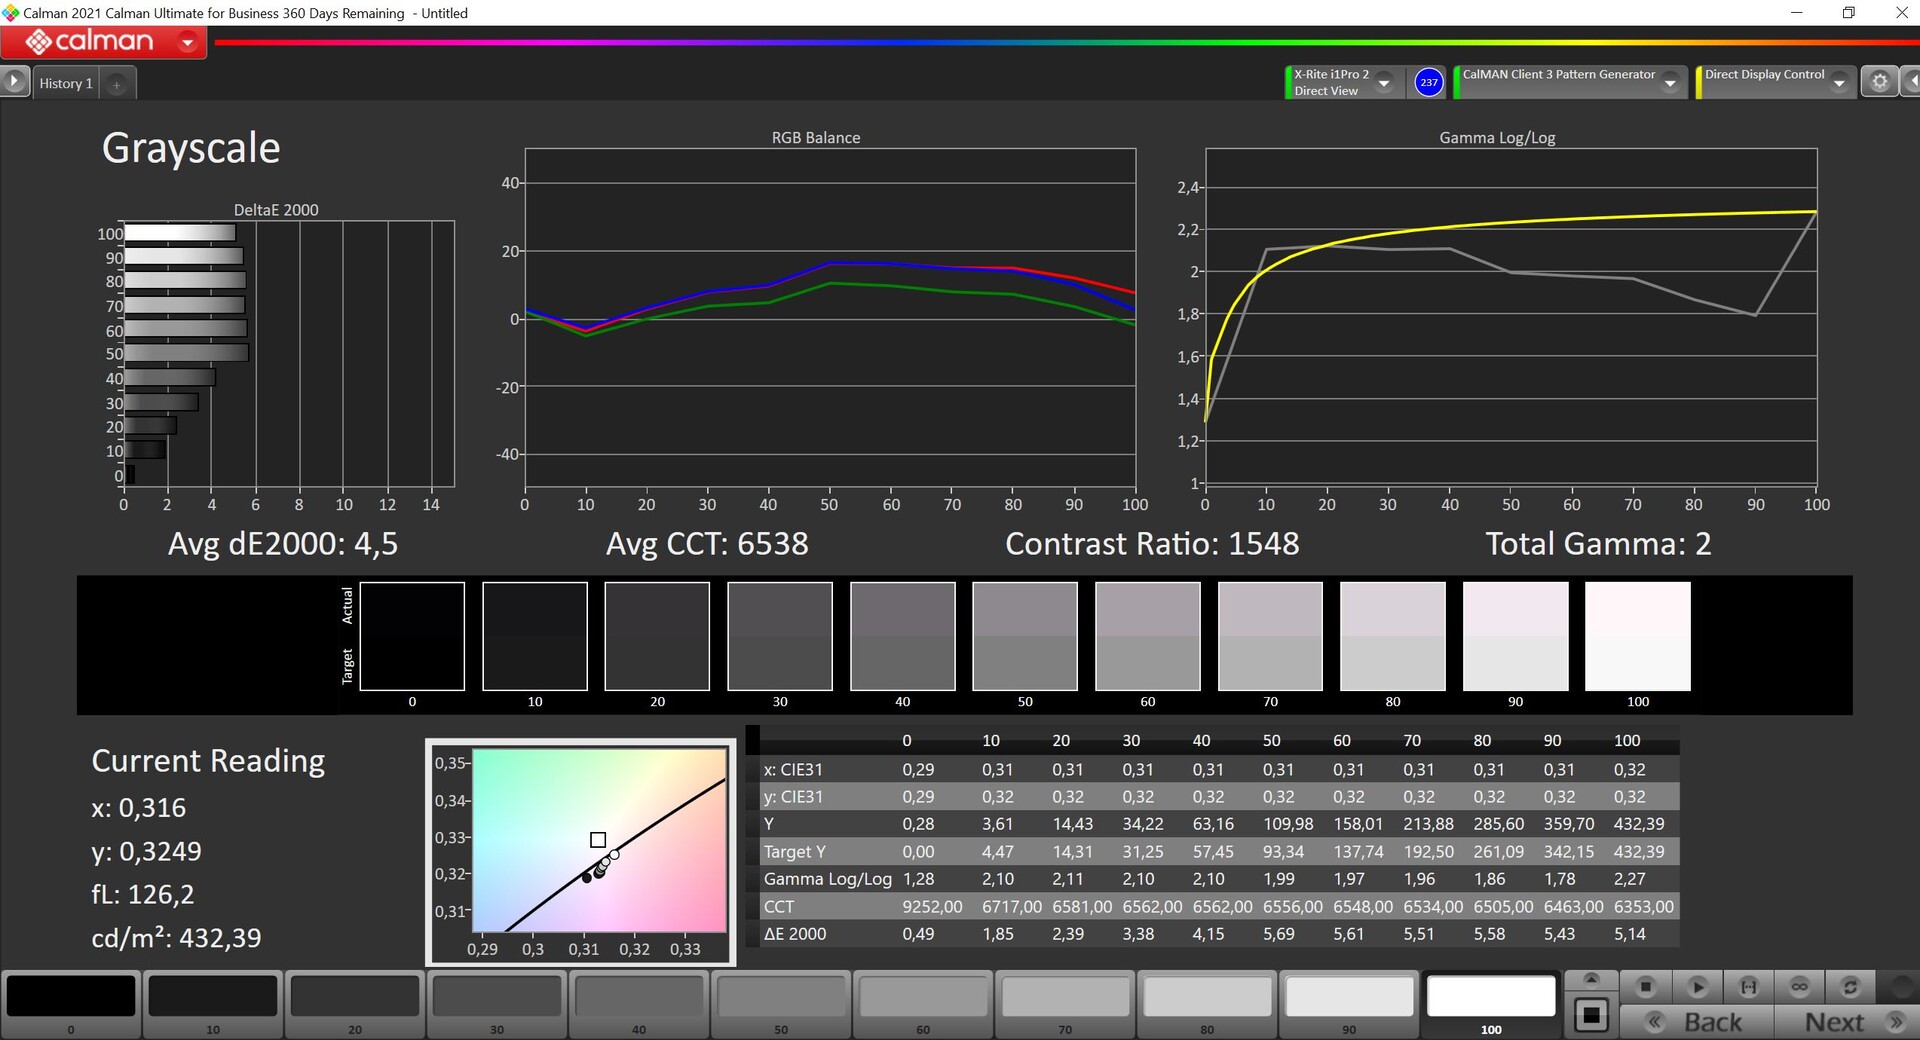
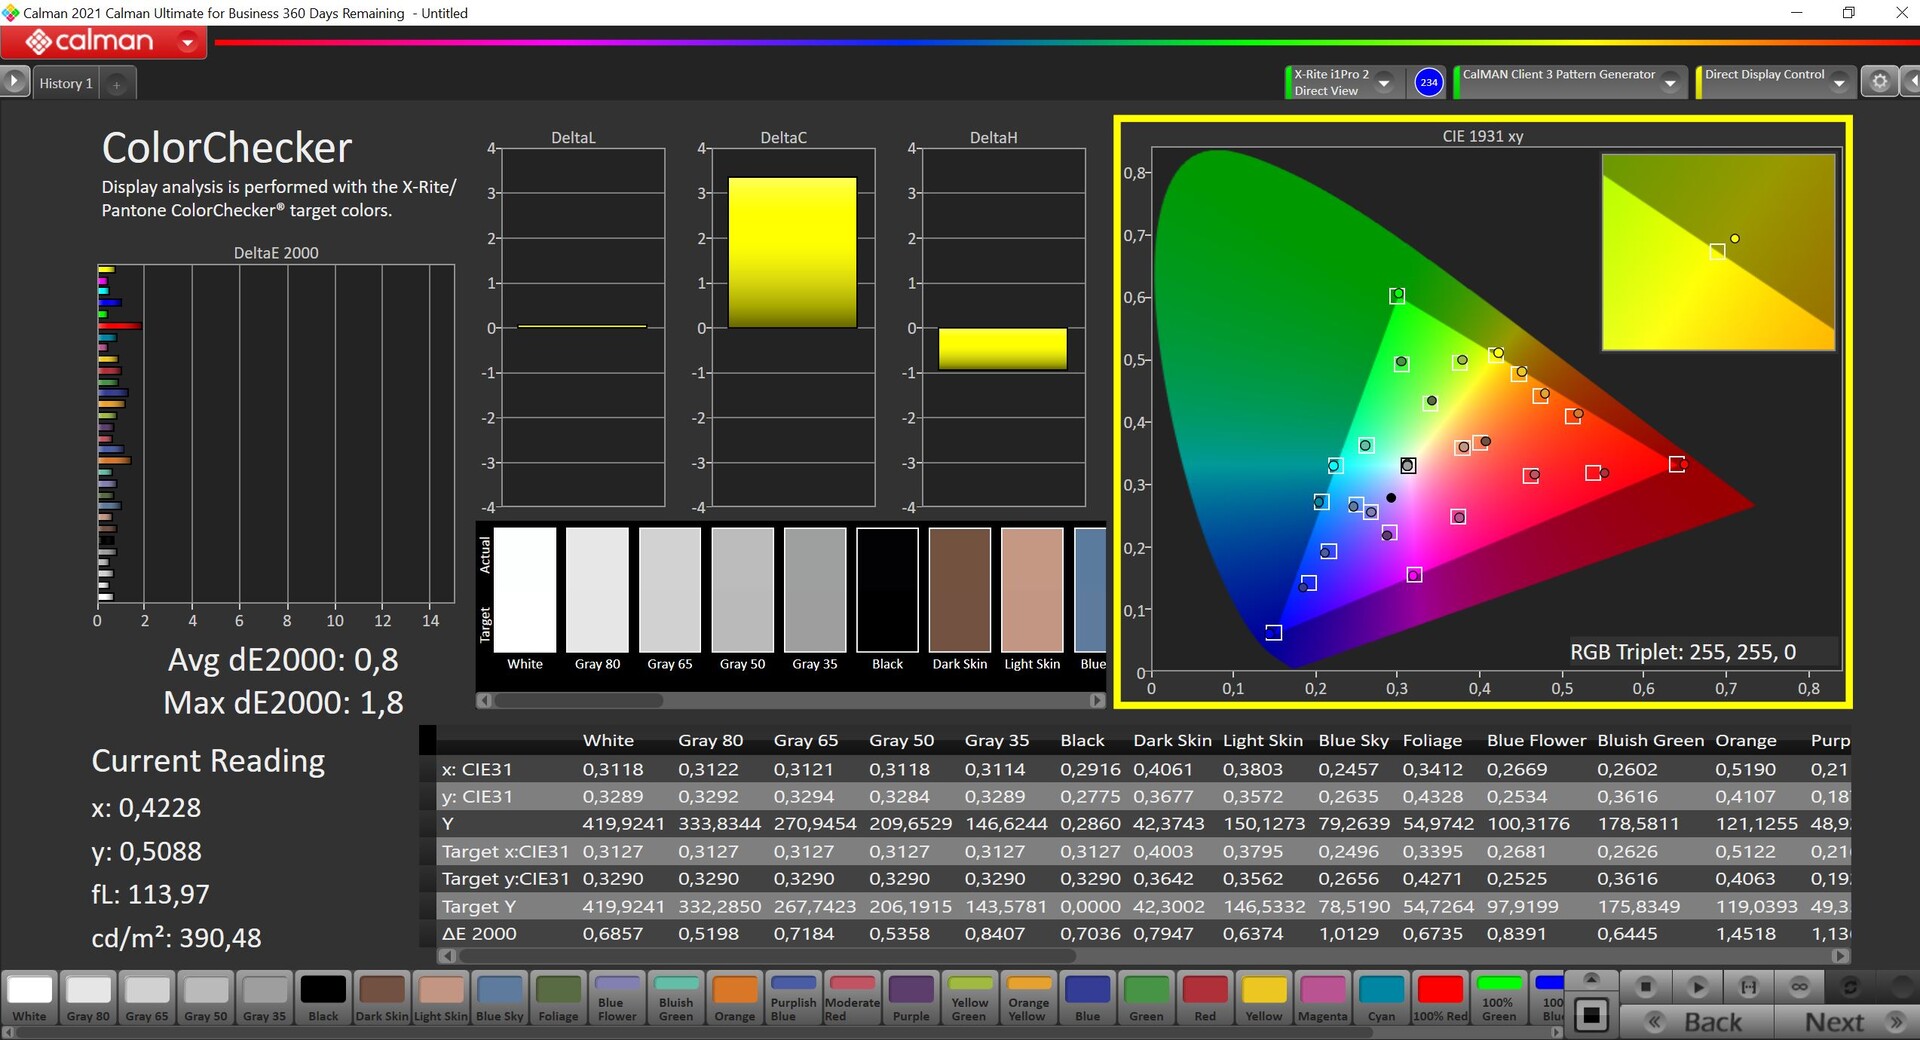
A HP oferece um total de quatro diferentes opções de painel 16:10 para o ZBook Firefly 14 G9, todos baseados na tecnologia IPS e com uma superfície fosca. Entretanto, o modelo padrão com um brilho de 250 cd/m² e tela sensível ao toque deve ser evitado, se possível. O painel SureView com um filtro de privacidade embutido também tem alguns inconvenientes, como havíamos encontrado em nossa revisão do EliteBook 845 G9. O painel de 400 lêndeas com uma resolução de 1920 x 1200 pixels (100% sRGB) está instalado em nosso dispositivo de teste, mas um painel DreamColor com cobertura de espaço de cor P3 e uma resolução de 2660 x 1600 pixels, assim como 120 Hz, está disponível opcionalmente.
Subjetivamente, o painel oferece excelente qualidade de imagem porque mesmo as superfícies brilhantes não parecem granulosas apesar do revestimento fosco. A luminosidade média é superior a 400 cd/m² e a relação de contraste é alta. Não notamos nenhuma cintilação do PWM e a estabilidade do ângulo de visão é muito boa. Somente no brilho máximo notamos leves halos nas bordas inferiores em fundos escuros.
| |||||||||||||||||||||||||
iluminação: 91 %
iluminação com acumulador: 431 cd/m²
Contraste: 1543:1 (Preto: 0.28 cd/m²)
ΔE ColorChecker Calman: 3.1 | ∀{0.5-29.43 Ø4.71}
calibrated: 0.8
ΔE Greyscale Calman: 4.5 | ∀{0.09-98 Ø4.96}
71.1% AdobeRGB 1998 (Argyll 3D)
99.9% sRGB (Argyll 3D)
69.6% Display P3 (Argyll 3D)
Gamma: 2
CCT: 6528 K
| HP ZBook Firefly 14 G9-6B8A2EA CMN1435, IPS, 1920x1200, 14" | Dell Precision 5000 5470 AU Optronics B140QAN, IPS, 2560x1600, 14" | Lenovo ThinkPad P14s Gen2-20VX000GGE B140HAN05.7, IPS, 1920x1080, 14" | Microsoft Surface Laptop Studio i7 RTX 3050 Ti LQ144P1JX01, IPS, 2400x1600, 14.4" | Apple MacBook Pro 14 2021 M1 Pro Entry Mini-LED, 3024x1964, 14.2" | HP ZBook Firefly 14 G8 2C9Q2EA AU Optronics AUO068B, IPS, 1920x1080, 14" | |
|---|---|---|---|---|---|---|
| Display | 8% | -5% | 9% | 43% | 0% | |
| Display P3 Coverage (%) | 69.6 | 79.3 14% | 65.4 -6% | 80.6 16% | 99.3 43% | 70 1% |
| sRGB Coverage (%) | 99.9 | 100 0% | 96.6 -3% | 99.9 0% | 99.5 0% | |
| AdobeRGB 1998 Coverage (%) | 71.1 | 78.7 11% | 66.5 -6% | 78.5 10% | 71.4 0% | |
| Response Times | -9% | -15% | 2% | -29% | -13% | |
| Response Time Grey 50% / Grey 80% * (ms) | 56.3 ? | 52.4 ? 7% | 58.8 ? -4% | 58.4 ? -4% | 58.4 ? -4% | 64.4 ? -14% |
| Response Time Black / White * (ms) | 26.2 ? | 32.4 ? -24% | 32.8 ? -25% | 24 ? 8% | 40.4 ? -54% | 29.2 ? -11% |
| PWM Frequency (Hz) | 5000 ? | 14880 | ||||
| Screen | 10% | -9% | 24% | 428% | 3% | |
| Brightness middle (cd/m²) | 432 | 537 24% | 350 -19% | 497 15% | 489 13% | 461 7% |
| Brightness (cd/m²) | 407 | 518 27% | 348 -14% | 491 21% | 479 18% | 439 8% |
| Brightness Distribution (%) | 91 | 94 3% | 94 3% | 92 1% | 94 3% | 89 -2% |
| Black Level * (cd/m²) | 0.28 | 0.33 -18% | 0.14 50% | 0.29 -4% | 0.01 96% | 0.24 14% |
| Contrast (:1) | 1543 | 1627 5% | 2500 62% | 1714 11% | 48900 3069% | 1921 24% |
| Colorchecker dE 2000 * | 3.1 | 2.97 4% | 4.3 -39% | 1.2 61% | 0.8 74% | 2.6 16% |
| Colorchecker dE 2000 max. * | 5.6 | 5.33 5% | 6.7 -20% | 2.8 50% | 1.3 77% | 5.8 -4% |
| Colorchecker dE 2000 calibrated * | 0.8 | 0.88 -10% | 1.5 -88% | 0.8 -0% | 1.1 -38% | |
| Greyscale dE 2000 * | 4.5 | 2.4 47% | 5.3 -18% | 1.9 58% | 1.1 76% | 4.4 2% |
| Gamma | 2 110% | 2.06 107% | 2.42 91% | 2.14 103% | 2.24 98% | 2.29 96% |
| CCT | 6528 100% | 6668 97% | 7631 85% | 6821 95% | 6478 100% | |
| Color Space (Percent of AdobeRGB 1998) (%) | 61.1 | 65.2 | ||||
| Color Space (Percent of sRGB) (%) | 96.4 | 99.4 | ||||
| Média Total (Programa/Configurações) | 3% /
7% | -10% /
-9% | 12% /
17% | 147% /
310% | -3% /
0% |
* ... menor é melhor
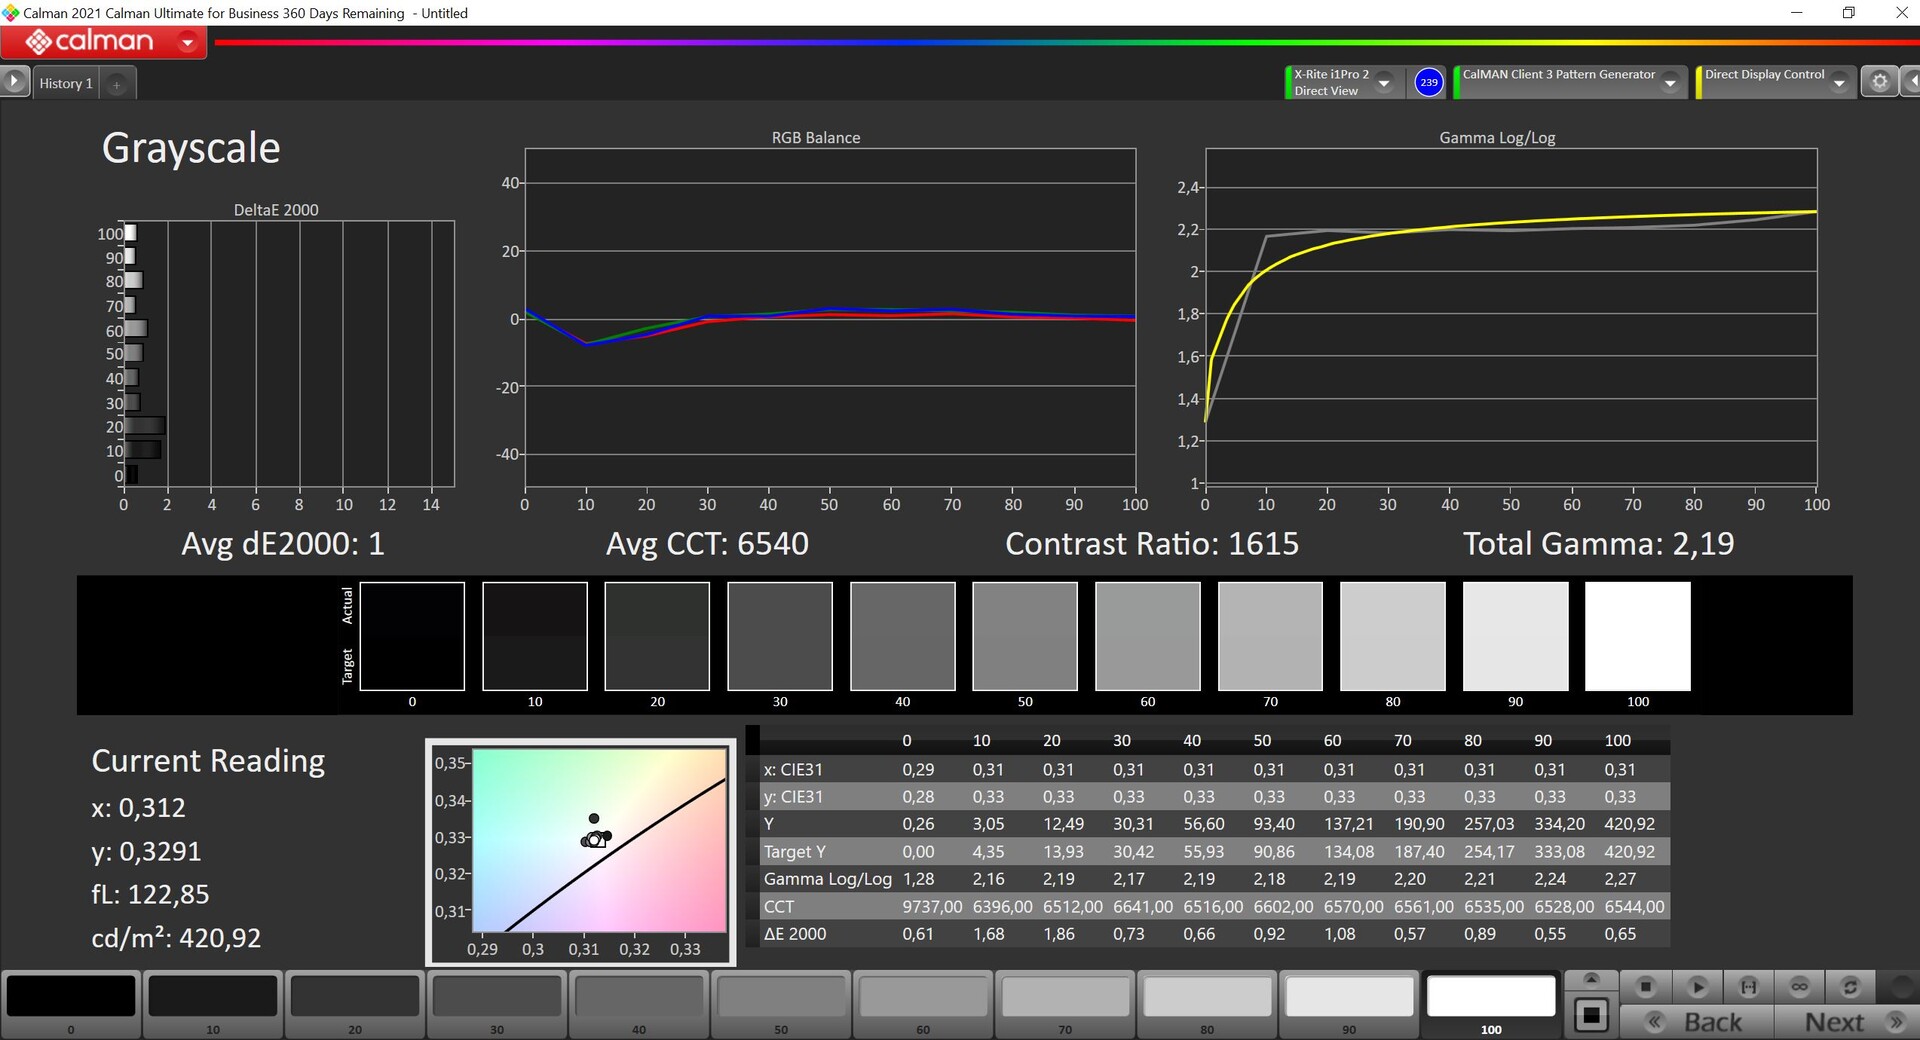
Nossa análise com o software profissional CalMAN mostra um leve elenco de cores em direção ao azul/vermelho no estado de entrega, e muitas cores também estão ligeiramente acima do desvio DeltaE 2000 de 3 em comparação com o espaço de cores de referência sRGB. Desde que você não edite as imagens, isto é perfeitamente suficiente para o uso diário
No entanto, nossa própria calibração mostra quanto potencial o painel tem. Fomos capazes de eliminar completamente o elenco de cores e o desvio médio das cores cai para apenas 0,8 (máximo 1,8), o que é um excelente desempenho.

Exibir tempos de resposta
| ↔ Tempo de resposta preto para branco | ||
|---|---|---|
| 26.2 ms ... ascensão ↗ e queda ↘ combinadas | ↗ 9.7 ms ascensão | 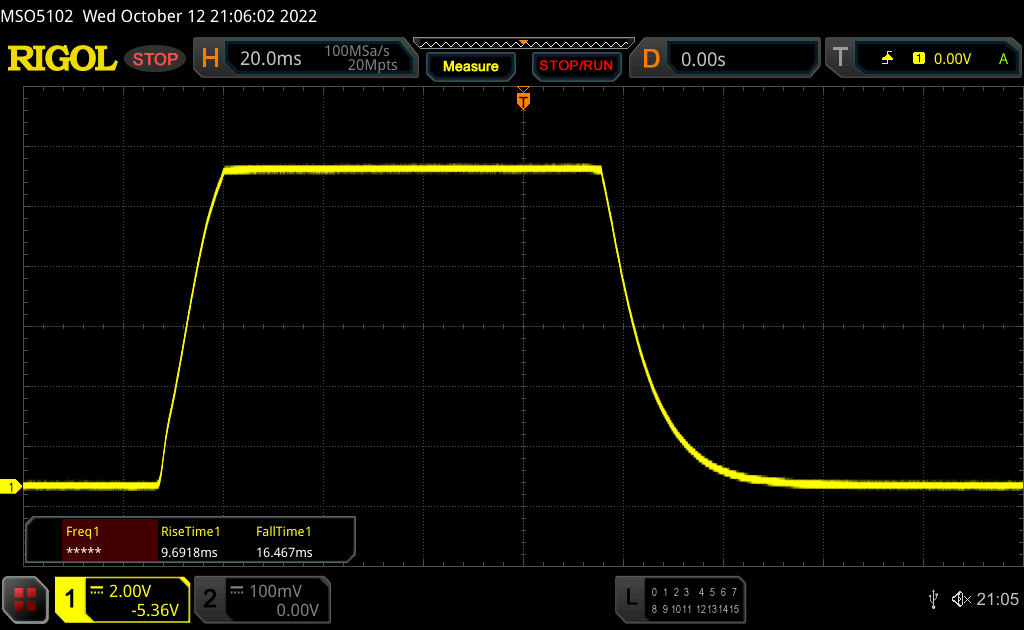 |
| ↘ 16.5 ms queda | ||
| A tela mostra taxas de resposta relativamente lentas em nossos testes e pode ser muito lenta para os jogadores. Em comparação, todos os dispositivos testados variam de 0.1 (mínimo) a 240 (máximo) ms. » 66 % de todos os dispositivos são melhores. Isso significa que o tempo de resposta medido é pior que a média de todos os dispositivos testados (19.8 ms). | ||
| ↔ Tempo de resposta 50% cinza a 80% cinza | ||
| 56.3 ms ... ascensão ↗ e queda ↘ combinadas | ↗ 25 ms ascensão | 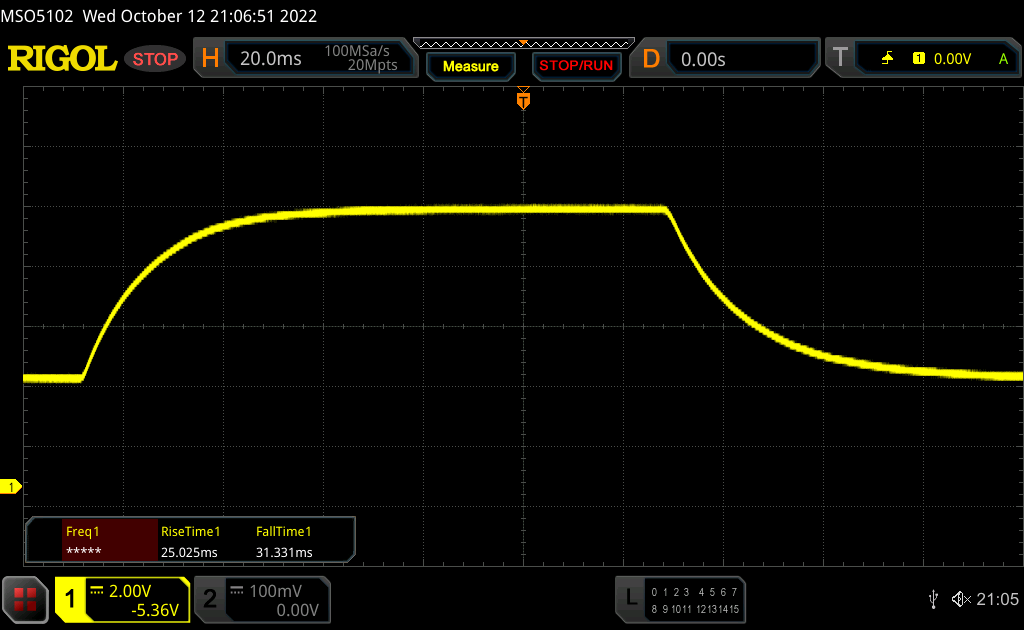 |
| ↘ 31.3 ms queda | ||
| A tela mostra taxas de resposta lentas em nossos testes e será insatisfatória para os jogadores. Em comparação, todos os dispositivos testados variam de 0.165 (mínimo) a 636 (máximo) ms. » 93 % de todos os dispositivos são melhores. Isso significa que o tempo de resposta medido é pior que a média de todos os dispositivos testados (31 ms). | ||
Cintilação da tela / PWM (modulação por largura de pulso)
| Tela tremeluzindo / PWM não detectado | 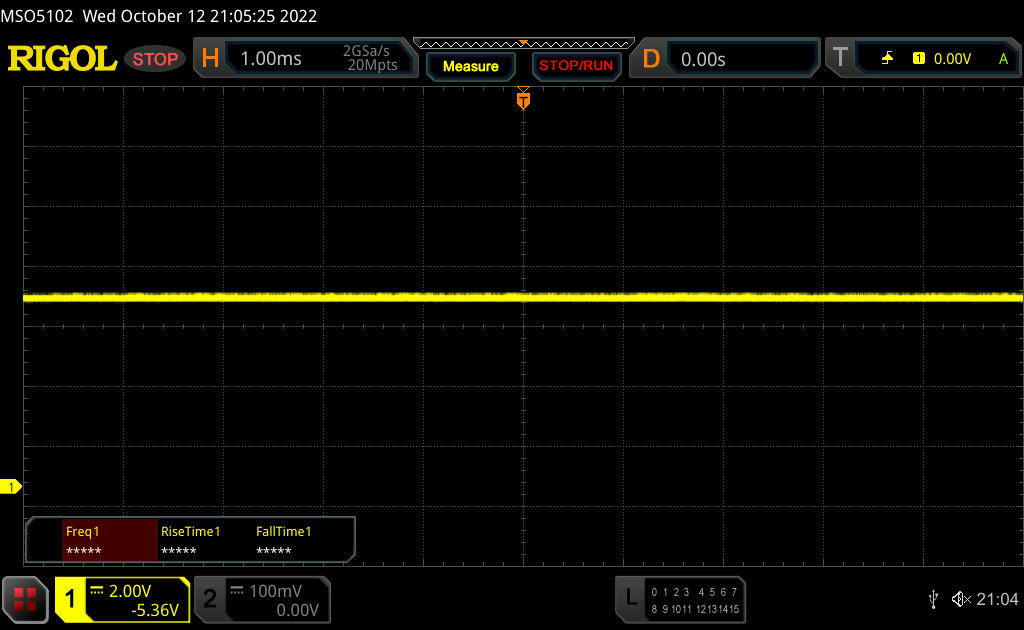 | ||
[pwm_comparison] Em comparação: 52 % de todos os dispositivos testados não usam PWM para escurecer a tela. Se PWM foi detectado, uma média de 7757 (mínimo: 5 - máximo: 343500) Hz foi medida. | |||
A tela mate tem um desempenho muito bom ao ar livre. O painel só poderia ser um pouco mais brilhante sob a luz direta do sol.
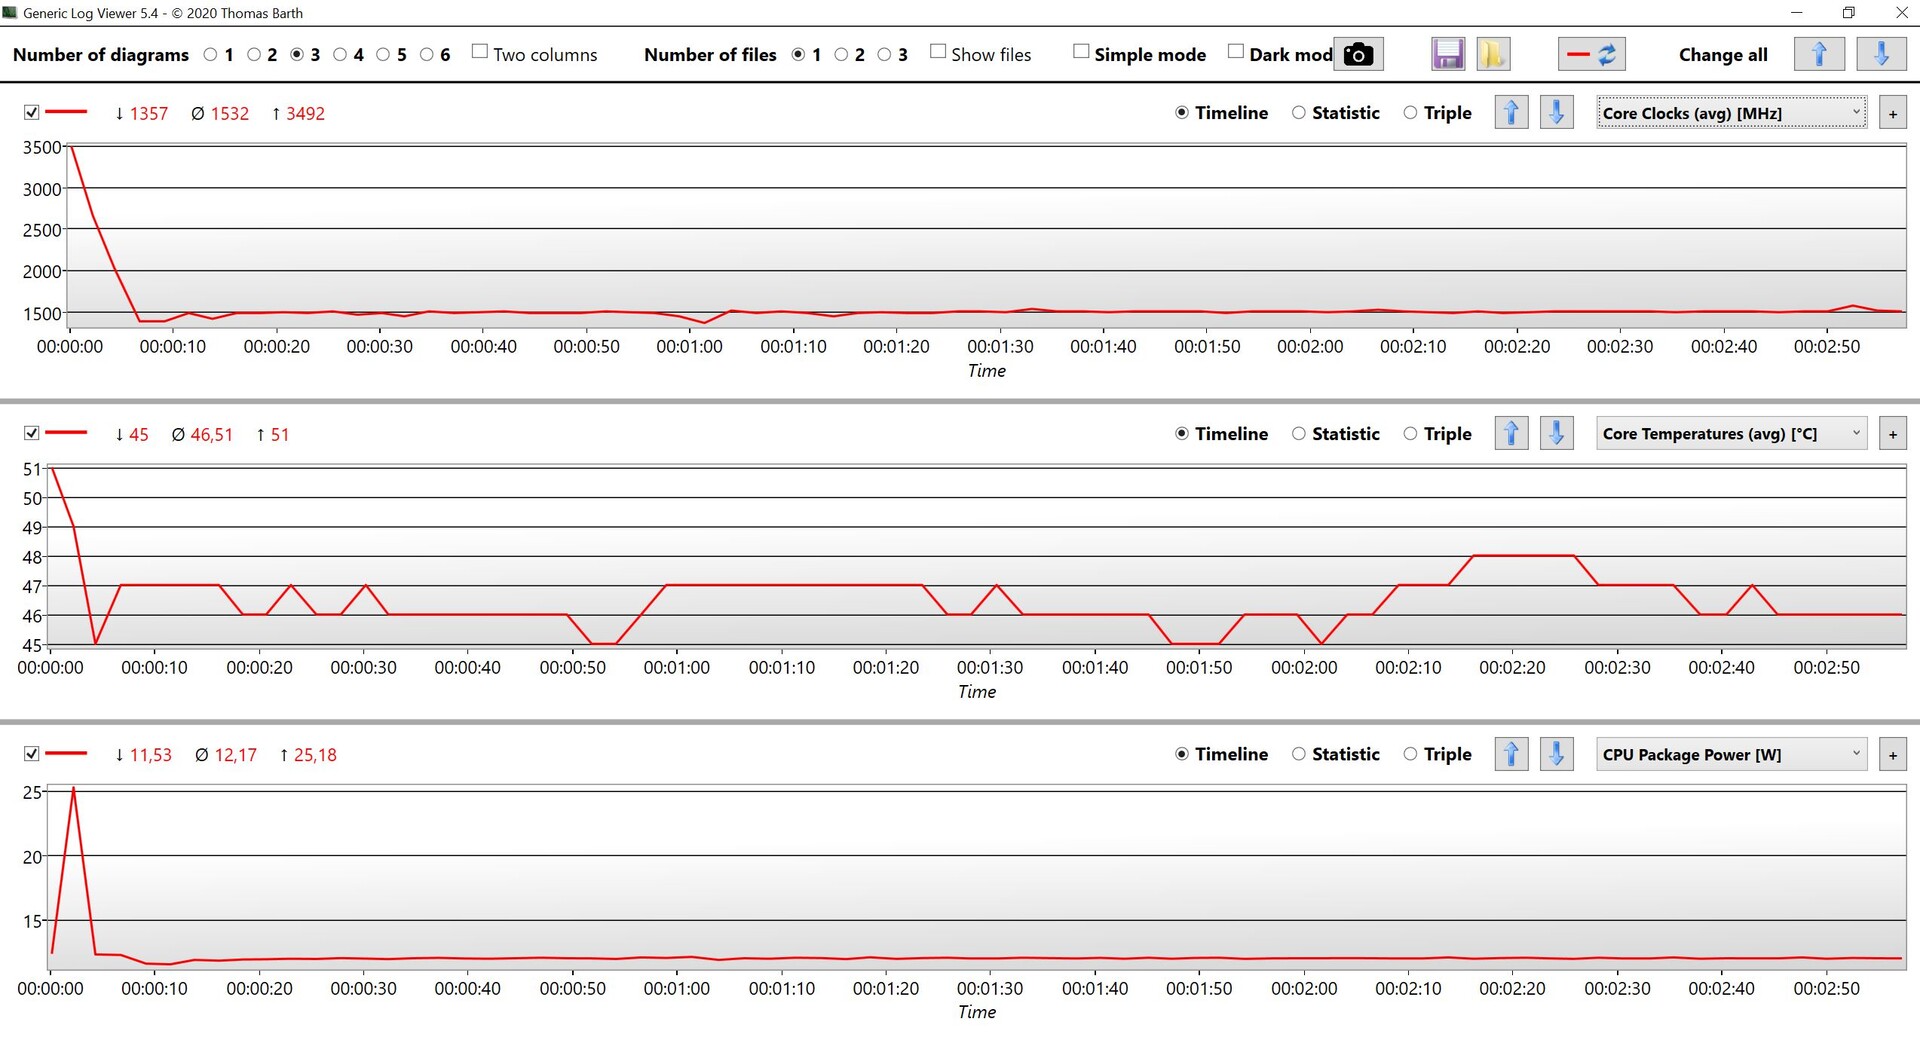
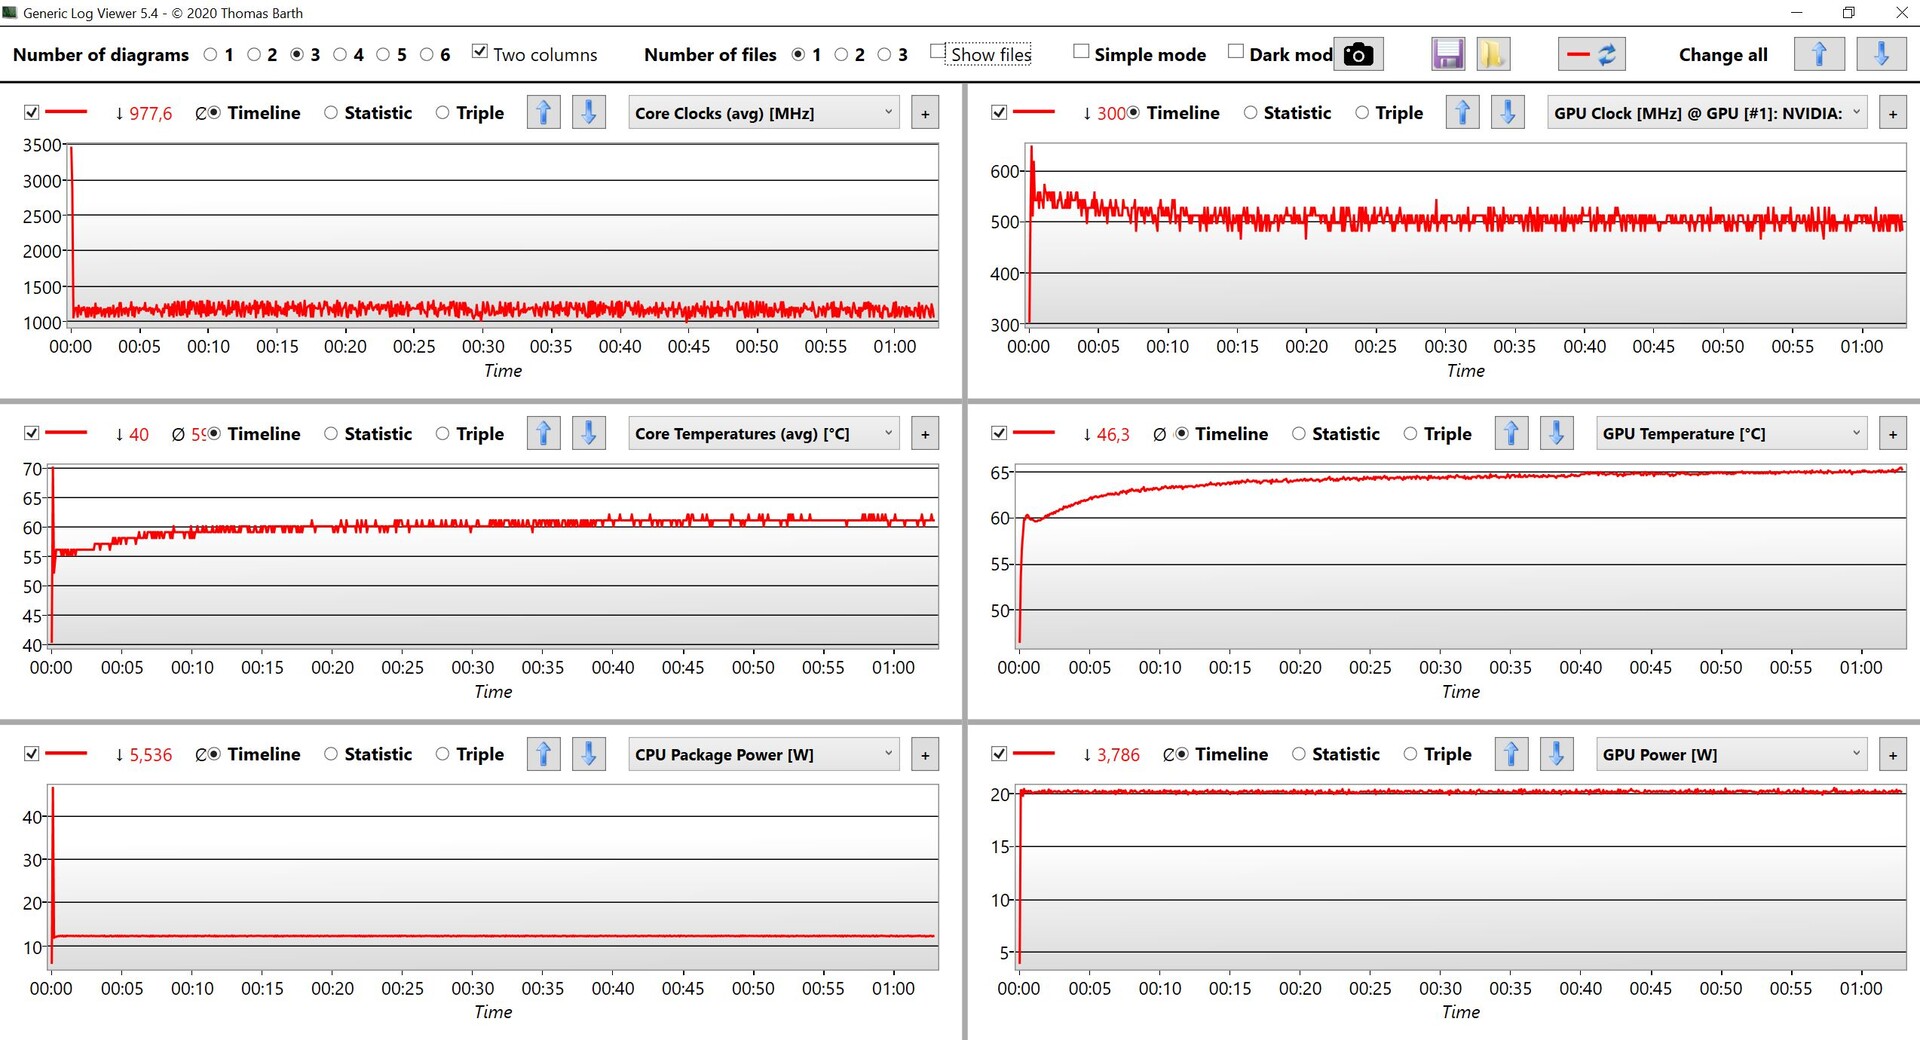
Desempenho: 12 W Alder Lake-U
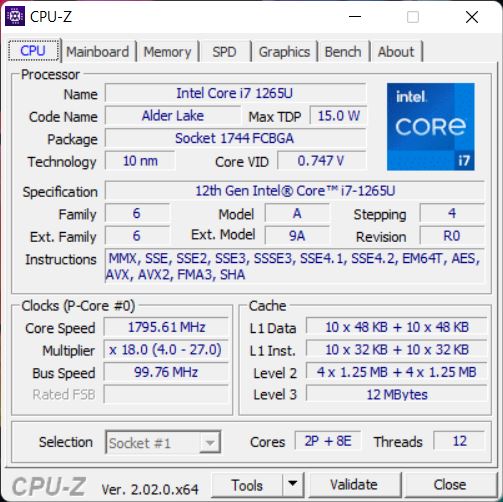
Processador: Intel Core i7-1265U
O Core i7-1265U é um chip atual do Alder Lake (12ª geração) com dois núcleos de desempenho rápido e oito núcleos de eficiência. O potencial de desempenho é teoricamente também muito alto, mas o chip no ZBook Firefly 14 G9 é desacelerado pelo limite de potência muito baixo de 12 W, que entra em ação após alguns segundos. Isto é suficiente para tarefas simples, mas o desempenho geral é um pouco inferior até mesmo a um Tiger Lake Core i7-1165G7 no modelo predecessor se todos os benchmarks de CPU forem considerados juntos
.
Também experimentamos um problema semelhante no modelo maior
Firefly 16 G9 e estão, portanto, em contato com o fabricante. O desempenho é definitivamente decepcionante para uma estação de trabalho móvel. Para comparação, a variante comercial normal EliteBook 845 G9 com o AMD Ryzen 9 Pro 6950HS oferece cerca de três vezes o desempenho multi-core.Mais referências de CPU estão disponíveis em nossa seção de tecnologia.
Cinebench R15 multi-core loop
Cinebench R23: Multi Core | Single Core
Cinebench R20: CPU (Multi Core) | CPU (Single Core)
Cinebench R15: CPU Multi 64Bit | CPU Single 64Bit
Blender: v2.79 BMW27 CPU
7-Zip 18.03: 7z b 4 | 7z b 4 -mmt1
Geekbench 5.5: Multi-Core | Single-Core
HWBOT x265 Benchmark v2.2: 4k Preset
LibreOffice : 20 Documents To PDF
R Benchmark 2.5: Overall mean
| CPU Performance rating | |
| Média da turma Workstation | |
| Dell Precision 5000 5470 | |
| Apple MacBook Pro 14 2021 M1 Pro Entry -8! | |
| HP EliteBook 845 G9 6F6H6EA | |
| Média Intel Core i7-1265U | |
| Microsoft Surface Laptop Studio i7 RTX 3050 Ti | |
| Lenovo ThinkPad P14s Gen2-20VX000GGE | |
| HP ZBook Firefly 14 G8 2C9Q2EA -2! | |
| HP ZBook Firefly 14 G9-6B8A2EA | |
| HP ZBook Firefly 16 G9-6B897EA | |
| Cinebench R23 / Multi Core | |
| Média da turma Workstation (14621 - 38520, n=23, últimos 2 anos) | |
| Dell Precision 5000 5470 | |
| HP EliteBook 845 G9 6F6H6EA | |
| Apple MacBook Pro 14 2021 M1 Pro Entry | |
| Média Intel Core i7-1265U (4332 - 9219, n=10) | |
| Microsoft Surface Laptop Studio i7 RTX 3050 Ti | |
| Lenovo ThinkPad P14s Gen2-20VX000GGE | |
| HP ZBook Firefly 16 G9-6B897EA | |
| HP ZBook Firefly 14 G9-6B8A2EA | |
| Cinebench R23 / Single Core | |
| Média da turma Workstation (1712 - 2228, n=23, últimos 2 anos) | |
| Dell Precision 5000 5470 | |
| Média Intel Core i7-1265U (1144 - 1820, n=10) | |
| Apple MacBook Pro 14 2021 M1 Pro Entry | |
| HP EliteBook 845 G9 6F6H6EA | |
| Microsoft Surface Laptop Studio i7 RTX 3050 Ti | |
| Lenovo ThinkPad P14s Gen2-20VX000GGE | |
| HP ZBook Firefly 14 G9-6B8A2EA | |
| HP ZBook Firefly 16 G9-6B897EA | |
| Cinebench R20 / CPU (Multi Core) | |
| Média da turma Workstation (5760 - 15043, n=23, últimos 2 anos) | |
| Dell Precision 5000 5470 | |
| HP EliteBook 845 G9 6F6H6EA | |
| Média Intel Core i7-1265U (1669 - 3584, n=10) | |
| Microsoft Surface Laptop Studio i7 RTX 3050 Ti | |
| Lenovo ThinkPad P14s Gen2-20VX000GGE | |
| HP ZBook Firefly 14 G8 2C9Q2EA | |
| HP ZBook Firefly 14 G9-6B8A2EA | |
| HP ZBook Firefly 16 G9-6B897EA | |
| Cinebench R20 / CPU (Single Core) | |
| Média da turma Workstation (671 - 857, n=23, últimos 2 anos) | |
| Dell Precision 5000 5470 | |
| Média Intel Core i7-1265U (528 - 701, n=10) | |
| HP EliteBook 845 G9 6F6H6EA | |
| HP ZBook Firefly 14 G8 2C9Q2EA | |
| Microsoft Surface Laptop Studio i7 RTX 3050 Ti | |
| HP ZBook Firefly 16 G9-6B897EA | |
| Lenovo ThinkPad P14s Gen2-20VX000GGE | |
| HP ZBook Firefly 14 G9-6B8A2EA | |
| Cinebench R15 / CPU Multi 64Bit | |
| Média da turma Workstation (2489 - 5810, n=23, últimos 2 anos) | |
| Dell Precision 5000 5470 | |
| HP EliteBook 845 G9 6F6H6EA | |
| Apple MacBook Pro 14 2021 M1 Pro Entry | |
| Média Intel Core i7-1265U (706 - 1572, n=10) | |
| Microsoft Surface Laptop Studio i7 RTX 3050 Ti | |
| Lenovo ThinkPad P14s Gen2-20VX000GGE | |
| HP ZBook Firefly 14 G8 2C9Q2EA | |
| HP ZBook Firefly 16 G9-6B897EA | |
| HP ZBook Firefly 14 G9-6B8A2EA | |
| Cinebench R15 / CPU Single 64Bit | |
| Média da turma Workstation (191.4 - 328, n=23, últimos 2 anos) | |
| Dell Precision 5000 5470 | |
| HP EliteBook 845 G9 6F6H6EA | |
| Média Intel Core i7-1265U (165.3 - 260, n=10) | |
| HP ZBook Firefly 14 G8 2C9Q2EA | |
| Microsoft Surface Laptop Studio i7 RTX 3050 Ti | |
| HP ZBook Firefly 14 G9-6B8A2EA | |
| Lenovo ThinkPad P14s Gen2-20VX000GGE | |
| Apple MacBook Pro 14 2021 M1 Pro Entry | |
| HP ZBook Firefly 16 G9-6B897EA | |
| Blender / v2.79 BMW27 CPU | |
| HP ZBook Firefly 16 G9-6B897EA | |
| HP ZBook Firefly 14 G9-6B8A2EA | |
| Lenovo ThinkPad P14s Gen2-20VX000GGE | |
| HP ZBook Firefly 14 G8 2C9Q2EA | |
| Microsoft Surface Laptop Studio i7 RTX 3050 Ti | |
| Média Intel Core i7-1265U (364 - 684, n=10) | |
| HP EliteBook 845 G9 6F6H6EA | |
| Dell Precision 5000 5470 | |
| Média da turma Workstation (91 - 222, n=23, últimos 2 anos) | |
| 7-Zip 18.03 / 7z b 4 | |
| Média da turma Workstation (60489 - 116969, n=23, últimos 2 anos) | |
| Dell Precision 5000 5470 | |
| HP EliteBook 845 G9 6F6H6EA | |
| Média Intel Core i7-1265U (20087 - 38715, n=10) | |
| Microsoft Surface Laptop Studio i7 RTX 3050 Ti | |
| HP ZBook Firefly 14 G8 2C9Q2EA | |
| HP ZBook Firefly 14 G9-6B8A2EA | |
| Lenovo ThinkPad P14s Gen2-20VX000GGE | |
| HP ZBook Firefly 16 G9-6B897EA | |
| 7-Zip 18.03 / 7z b 4 -mmt1 | |
| Média da turma Workstation (5126 - 6960, n=23, últimos 2 anos) | |
| HP EliteBook 845 G9 6F6H6EA | |
| Lenovo ThinkPad P14s Gen2-20VX000GGE | |
| Dell Precision 5000 5470 | |
| HP ZBook Firefly 14 G8 2C9Q2EA | |
| Média Intel Core i7-1265U (4614 - 5617, n=10) | |
| Microsoft Surface Laptop Studio i7 RTX 3050 Ti | |
| HP ZBook Firefly 16 G9-6B897EA | |
| HP ZBook Firefly 14 G9-6B8A2EA | |
| Geekbench 5.5 / Multi-Core | |
| Média da turma Workstation (11542 - 25554, n=23, últimos 2 anos) | |
| Dell Precision 5000 5470 | |
| Apple MacBook Pro 14 2021 M1 Pro Entry | |
| Média Intel Core i7-1265U (5022 - 8981, n=10) | |
| HP EliteBook 845 G9 6F6H6EA | |
| HP ZBook Firefly 14 G9-6B8A2EA | |
| Microsoft Surface Laptop Studio i7 RTX 3050 Ti | |
| Lenovo ThinkPad P14s Gen2-20VX000GGE | |
| HP ZBook Firefly 16 G9-6B897EA | |
| HP ZBook Firefly 14 G8 2C9Q2EA | |
| Geekbench 5.5 / Single-Core | |
| Média da turma Workstation (1783 - 2183, n=23, últimos 2 anos) | |
| HP ZBook Firefly 14 G9-6B8A2EA | |
| Dell Precision 5000 5470 | |
| HP ZBook Firefly 16 G9-6B897EA | |
| Apple MacBook Pro 14 2021 M1 Pro Entry | |
| Média Intel Core i7-1265U (1429 - 1806, n=10) | |
| Lenovo ThinkPad P14s Gen2-20VX000GGE | |
| HP ZBook Firefly 14 G8 2C9Q2EA | |
| Microsoft Surface Laptop Studio i7 RTX 3050 Ti | |
| HP EliteBook 845 G9 6F6H6EA | |
| HWBOT x265 Benchmark v2.2 / 4k Preset | |
| Média da turma Workstation (17.8 - 40.5, n=23, últimos 2 anos) | |
| Dell Precision 5000 5470 | |
| HP EliteBook 845 G9 6F6H6EA | |
| Média Intel Core i7-1265U (5.09 - 10.6, n=10) | |
| Microsoft Surface Laptop Studio i7 RTX 3050 Ti | |
| Lenovo ThinkPad P14s Gen2-20VX000GGE | |
| HP ZBook Firefly 14 G8 2C9Q2EA | |
| HP ZBook Firefly 14 G9-6B8A2EA | |
| HP ZBook Firefly 16 G9-6B897EA | |
| LibreOffice / 20 Documents To PDF | |
| HP EliteBook 845 G9 6F6H6EA | |
| Microsoft Surface Laptop Studio i7 RTX 3050 Ti | |
| HP ZBook Firefly 14 G8 2C9Q2EA | |
| HP ZBook Firefly 16 G9-6B897EA | |
| Média Intel Core i7-1265U (44 - 61.6, n=10) | |
| Média da turma Workstation (37.1 - 74.7, n=23, últimos 2 anos) | |
| HP ZBook Firefly 14 G9-6B8A2EA | |
| Dell Precision 5000 5470 | |
| Lenovo ThinkPad P14s Gen2-20VX000GGE | |
| R Benchmark 2.5 / Overall mean | |
| Microsoft Surface Laptop Studio i7 RTX 3050 Ti | |
| HP ZBook Firefly 14 G8 2C9Q2EA | |
| Lenovo ThinkPad P14s Gen2-20VX000GGE | |
| HP ZBook Firefly 16 G9-6B897EA | |
| HP ZBook Firefly 14 G9-6B8A2EA | |
| HP EliteBook 845 G9 6F6H6EA | |
| Média Intel Core i7-1265U (0.4666 - 0.578, n=10) | |
| Dell Precision 5000 5470 | |
| Média da turma Workstation (0.3825 - 0.603, n=23, últimos 2 anos) | |
* ... menor é melhor
AIDA64: FP32 Ray-Trace | FPU Julia | CPU SHA3 | CPU Queen | FPU SinJulia | FPU Mandel | CPU AES | CPU ZLib | FP64 Ray-Trace | CPU PhotoWorxx
| Performance rating | |
| Média da turma Workstation | |
| HP EliteBook 845 G9 6F6H6EA | |
| Dell Precision 5000 5470 | |
| Microsoft Surface Laptop Studio i7 RTX 3050 Ti | |
| Média Intel Core i7-1265U | |
| HP ZBook Firefly 14 G8 2C9Q2EA | |
| HP ZBook Firefly 14 G9-6B8A2EA | |
| HP ZBook Firefly 16 G9-6B897EA | |
| AIDA64 / FP32 Ray-Trace | |
| Média da turma Workstation (16730 - 61611, n=23, últimos 2 anos) | |
| HP EliteBook 845 G9 6F6H6EA | |
| Dell Precision 5000 5470 | |
| Microsoft Surface Laptop Studio i7 RTX 3050 Ti | |
| HP ZBook Firefly 14 G8 2C9Q2EA | |
| Média Intel Core i7-1265U (2619 - 8178, n=10) | |
| HP ZBook Firefly 14 G9-6B8A2EA | |
| HP ZBook Firefly 16 G9-6B897EA | |
| AIDA64 / FPU Julia | |
| Média da turma Workstation (89597 - 186971, n=23, últimos 2 anos) | |
| HP EliteBook 845 G9 6F6H6EA | |
| Dell Precision 5000 5470 | |
| Média Intel Core i7-1265U (12909 - 41649, n=10) | |
| Microsoft Surface Laptop Studio i7 RTX 3050 Ti | |
| HP ZBook Firefly 14 G8 2C9Q2EA | |
| HP ZBook Firefly 14 G9-6B8A2EA | |
| HP ZBook Firefly 16 G9-6B897EA | |
| AIDA64 / CPU SHA3 | |
| Média da turma Workstation (4178 - 8975, n=23, últimos 2 anos) | |
| HP EliteBook 845 G9 6F6H6EA | |
| Dell Precision 5000 5470 | |
| Microsoft Surface Laptop Studio i7 RTX 3050 Ti | |
| HP ZBook Firefly 14 G8 2C9Q2EA | |
| Média Intel Core i7-1265U (824 - 2183, n=10) | |
| HP ZBook Firefly 14 G9-6B8A2EA | |
| HP ZBook Firefly 16 G9-6B897EA | |
| AIDA64 / CPU Queen | |
| Dell Precision 5000 5470 | |
| Média da turma Workstation (60778 - 144411, n=23, últimos 2 anos) | |
| HP EliteBook 845 G9 6F6H6EA | |
| HP ZBook Firefly 14 G9-6B8A2EA | |
| Média Intel Core i7-1265U (63615 - 67065, n=10) | |
| HP ZBook Firefly 16 G9-6B897EA | |
| HP ZBook Firefly 14 G8 2C9Q2EA | |
| Microsoft Surface Laptop Studio i7 RTX 3050 Ti | |
| AIDA64 / FPU SinJulia | |
| Média da turma Workstation (8165 - 29343, n=23, últimos 2 anos) | |
| HP EliteBook 845 G9 6F6H6EA | |
| Dell Precision 5000 5470 | |
| HP ZBook Firefly 14 G8 2C9Q2EA | |
| Microsoft Surface Laptop Studio i7 RTX 3050 Ti | |
| Média Intel Core i7-1265U (3105 - 5135, n=10) | |
| HP ZBook Firefly 14 G9-6B8A2EA | |
| HP ZBook Firefly 16 G9-6B897EA | |
| AIDA64 / FPU Mandel | |
| Média da turma Workstation (44497 - 98153, n=23, últimos 2 anos) | |
| HP EliteBook 845 G9 6F6H6EA | |
| Dell Precision 5000 5470 | |
| Microsoft Surface Laptop Studio i7 RTX 3050 Ti | |
| HP ZBook Firefly 14 G8 2C9Q2EA | |
| Média Intel Core i7-1265U (6967 - 20804, n=10) | |
| HP ZBook Firefly 14 G9-6B8A2EA | |
| HP ZBook Firefly 16 G9-6B897EA | |
| AIDA64 / CPU AES | |
| Média da turma Workstation (73133 - 187841, n=23, últimos 2 anos) | |
| HP ZBook Firefly 14 G8 2C9Q2EA | |
| HP EliteBook 845 G9 6F6H6EA | |
| Microsoft Surface Laptop Studio i7 RTX 3050 Ti | |
| Dell Precision 5000 5470 | |
| Média Intel Core i7-1265U (19489 - 42966, n=10) | |
| HP ZBook Firefly 14 G9-6B8A2EA | |
| HP ZBook Firefly 16 G9-6B897EA | |
| AIDA64 / CPU ZLib | |
| Média da turma Workstation (929 - 2148, n=23, últimos 2 anos) | |
| HP EliteBook 845 G9 6F6H6EA | |
| Média Intel Core i7-1265U (314 - 632, n=10) | |
| Dell Precision 5000 5470 | |
| HP ZBook Firefly 14 G8 2C9Q2EA | |
| HP ZBook Firefly 14 G9-6B8A2EA | |
| Microsoft Surface Laptop Studio i7 RTX 3050 Ti | |
| HP ZBook Firefly 16 G9-6B897EA | |
| AIDA64 / FP64 Ray-Trace | |
| Média da turma Workstation (8545 - 32891, n=23, últimos 2 anos) | |
| Dell Precision 5000 5470 | |
| HP EliteBook 845 G9 6F6H6EA | |
| Microsoft Surface Laptop Studio i7 RTX 3050 Ti | |
| HP ZBook Firefly 14 G8 2C9Q2EA | |
| Média Intel Core i7-1265U (1473 - 4376, n=10) | |
| HP ZBook Firefly 14 G9-6B8A2EA | |
| HP ZBook Firefly 16 G9-6B897EA | |
| AIDA64 / CPU PhotoWorxx | |
| Média da turma Workstation (37151 - 93684, n=23, últimos 2 anos) | |
| Dell Precision 5000 5470 | |
| Microsoft Surface Laptop Studio i7 RTX 3050 Ti | |
| Média Intel Core i7-1265U (20213 - 47031, n=10) | |
| HP ZBook Firefly 14 G9-6B8A2EA | |
| HP ZBook Firefly 14 G8 2C9Q2EA | |
| HP ZBook Firefly 16 G9-6B897EA | |
| HP EliteBook 845 G9 6F6H6EA | |
Desempenho do sistema
O desempenho subjetivo do sistema é muito bom apesar do desempenho comparativamente baixo da CPU, que também pode ser atribuído à rápida PCIe 4.0 SSD. Também não detectamos nenhum problema durante o teste.
CrossMark: Overall | Productivity | Creativity | Responsiveness
| PCMark 10 / Score | |
| Média da turma Workstation (6563 - 10409, n=19, últimos 2 anos) | |
| Dell Precision 5000 5470 | |
| HP EliteBook 845 G9 6F6H6EA | |
| Média Intel Core i7-1265U, NVIDIA T550 Laptop GPU (5488 - 6181, n=3) | |
| Lenovo ThinkPad P14s Gen2-20VX000GGE | |
| HP ZBook Firefly 16 G9-6B897EA | |
| Microsoft Surface Laptop Studio i7 RTX 3050 Ti | |
| HP ZBook Firefly 14 G9-6B8A2EA | |
| HP ZBook Firefly 14 G8 2C9Q2EA | |
| PCMark 10 / Essentials | |
| Dell Precision 5000 5470 | |
| Média da turma Workstation (9622 - 11157, n=19, últimos 2 anos) | |
| HP ZBook Firefly 16 G9-6B897EA | |
| Média Intel Core i7-1265U, NVIDIA T550 Laptop GPU (9960 - 10250, n=3) | |
| HP ZBook Firefly 14 G9-6B8A2EA | |
| Lenovo ThinkPad P14s Gen2-20VX000GGE | |
| HP EliteBook 845 G9 6F6H6EA | |
| HP ZBook Firefly 14 G8 2C9Q2EA | |
| Microsoft Surface Laptop Studio i7 RTX 3050 Ti | |
| PCMark 10 / Productivity | |
| Média da turma Workstation (8789 - 20616, n=19, últimos 2 anos) | |
| Lenovo ThinkPad P14s Gen2-20VX000GGE | |
| Média Intel Core i7-1265U, NVIDIA T550 Laptop GPU (8315 - 9474, n=3) | |
| HP ZBook Firefly 16 G9-6B897EA | |
| Dell Precision 5000 5470 | |
| Microsoft Surface Laptop Studio i7 RTX 3050 Ti | |
| HP ZBook Firefly 14 G8 2C9Q2EA | |
| HP ZBook Firefly 14 G9-6B8A2EA | |
| HP EliteBook 845 G9 6F6H6EA | |
| PCMark 10 / Digital Content Creation | |
| Média da turma Workstation (8108 - 15631, n=19, últimos 2 anos) | |
| Dell Precision 5000 5470 | |
| HP EliteBook 845 G9 6F6H6EA | |
| Microsoft Surface Laptop Studio i7 RTX 3050 Ti | |
| Média Intel Core i7-1265U, NVIDIA T550 Laptop GPU (5399 - 6793, n=3) | |
| Lenovo ThinkPad P14s Gen2-20VX000GGE | |
| HP ZBook Firefly 16 G9-6B897EA | |
| HP ZBook Firefly 14 G8 2C9Q2EA | |
| HP ZBook Firefly 14 G9-6B8A2EA | |
| CrossMark / Overall | |
| Média da turma Workstation (1307 - 2267, n=22, últimos 2 anos) | |
| Dell Precision 5000 5470 | |
| HP ZBook Firefly 16 G9-6B897EA | |
| HP ZBook Firefly 14 G9-6B8A2EA | |
| Média Intel Core i7-1265U, NVIDIA T550 Laptop GPU (1591 - 1623, n=3) | |
| Apple MacBook Pro 14 2021 M1 Pro Entry | |
| Microsoft Surface Laptop Studio i7 RTX 3050 Ti | |
| HP EliteBook 845 G9 6F6H6EA | |
| CrossMark / Productivity | |
| Média da turma Workstation (1130 - 2122, n=22, últimos 2 anos) | |
| Dell Precision 5000 5470 | |
| HP ZBook Firefly 16 G9-6B897EA | |
| HP ZBook Firefly 14 G9-6B8A2EA | |
| Média Intel Core i7-1265U, NVIDIA T550 Laptop GPU (1553 - 1592, n=3) | |
| Microsoft Surface Laptop Studio i7 RTX 3050 Ti | |
| HP EliteBook 845 G9 6F6H6EA | |
| Apple MacBook Pro 14 2021 M1 Pro Entry | |
| CrossMark / Creativity | |
| Média da turma Workstation (1657 - 2725, n=22, últimos 2 anos) | |
| Dell Precision 5000 5470 | |
| Apple MacBook Pro 14 2021 M1 Pro Entry | |
| HP ZBook Firefly 16 G9-6B897EA | |
| HP ZBook Firefly 14 G9-6B8A2EA | |
| Média Intel Core i7-1265U, NVIDIA T550 Laptop GPU (1723 - 1751, n=3) | |
| Microsoft Surface Laptop Studio i7 RTX 3050 Ti | |
| HP EliteBook 845 G9 6F6H6EA | |
| CrossMark / Responsiveness | |
| Média da turma Workstation (993 - 2096, n=22, últimos 2 anos) | |
| Dell Precision 5000 5470 | |
| HP ZBook Firefly 14 G9-6B8A2EA | |
| HP ZBook Firefly 16 G9-6B897EA | |
| Média Intel Core i7-1265U, NVIDIA T550 Laptop GPU (1344 - 1376, n=3) | |
| Microsoft Surface Laptop Studio i7 RTX 3050 Ti | |
| HP EliteBook 845 G9 6F6H6EA | |
| Apple MacBook Pro 14 2021 M1 Pro Entry | |
| PCMark 10 Score | 5488 pontos | |
Ajuda | ||
| AIDA64 / Memory Copy | |
| Média da turma Workstation (56003 - 164795, n=23, últimos 2 anos) | |
| Dell Precision 5000 5470 | |
| Média Intel Core i7-1265U (40212 - 72204, n=10) | |
| Microsoft Surface Laptop Studio i7 RTX 3050 Ti | |
| HP ZBook Firefly 14 G9-6B8A2EA | |
| HP ZBook Firefly 14 G8 2C9Q2EA | |
| AIDA64 / Memory Read | |
| Média da turma Workstation (55795 - 121563, n=23, últimos 2 anos) | |
| Dell Precision 5000 5470 | |
| HP ZBook Firefly 14 G9-6B8A2EA | |
| Média Intel Core i7-1265U (41808 - 69493, n=10) | |
| Microsoft Surface Laptop Studio i7 RTX 3050 Ti | |
| HP ZBook Firefly 14 G8 2C9Q2EA | |
| AIDA64 / Memory Write | |
| Média da turma Workstation (55663 - 214520, n=23, últimos 2 anos) | |
| Dell Precision 5000 5470 | |
| HP ZBook Firefly 14 G9-6B8A2EA | |
| Microsoft Surface Laptop Studio i7 RTX 3050 Ti | |
| Média Intel Core i7-1265U (41382 - 76027, n=10) | |
| HP ZBook Firefly 14 G8 2C9Q2EA | |
| AIDA64 / Memory Latency | |
| Média da turma Workstation (84.5 - 165.2, n=23, últimos 2 anos) | |
| Dell Precision 5000 5470 | |
| Microsoft Surface Laptop Studio i7 RTX 3050 Ti | |
| Média Intel Core i7-1265U (74.6 - 112.4, n=10) | |
| HP ZBook Firefly 14 G9-6B8A2EA | |
| HP ZBook Firefly 14 G8 2C9Q2EA | |
* ... menor é melhor
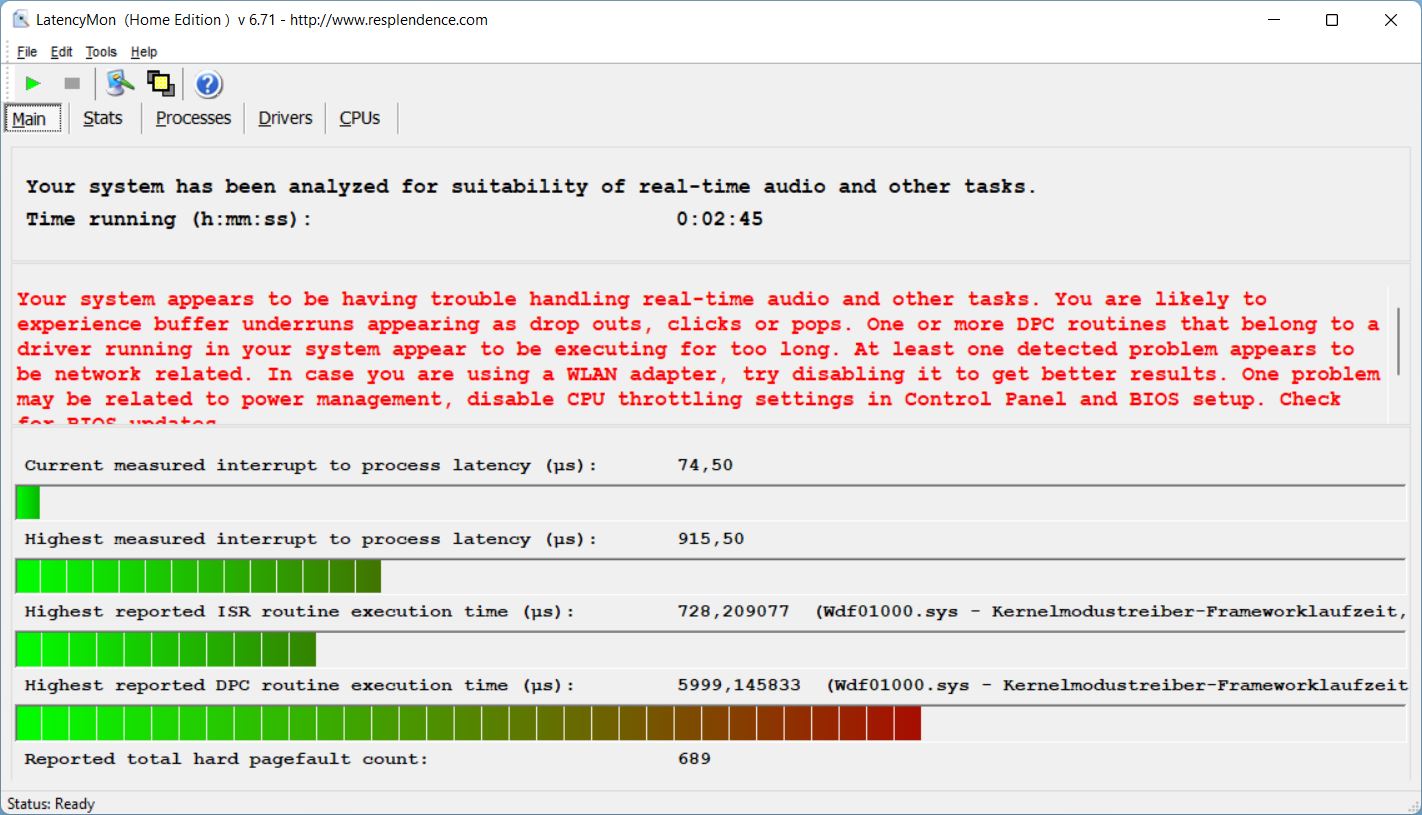
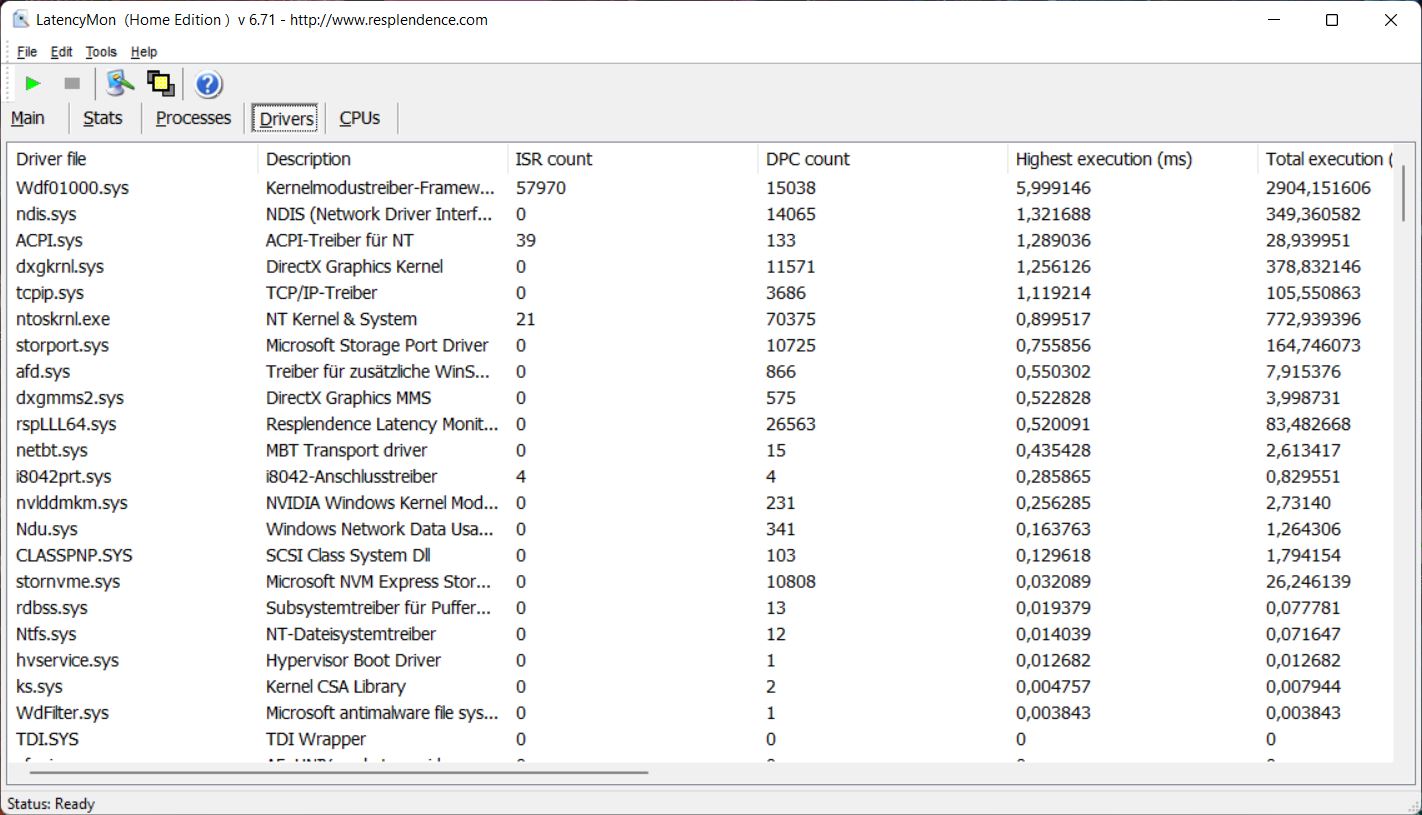
Latência do DPC
Com a versão BIOS em mãos, o ZBook mostra limitações em nosso teste de latência e, portanto, não é ideal para aplicações de áudio em tempo real.
| DPC Latencies / LatencyMon - interrupt to process latency (max), Web, Youtube, Prime95 | |
| HP ZBook Firefly 14 G8 2C9Q2EA | |
| Dell Precision 5000 5470 | |
| HP EliteBook 845 G9 6F6H6EA | |
| Lenovo ThinkPad P14s Gen2-20VX000GGE | |
| HP ZBook Firefly 16 G9-6B897EA | |
| HP ZBook Firefly 14 G9-6B8A2EA | |
| Microsoft Surface Laptop Studio i7 RTX 3050 Ti | |
* ... menor é melhor
Armazenamento em massa
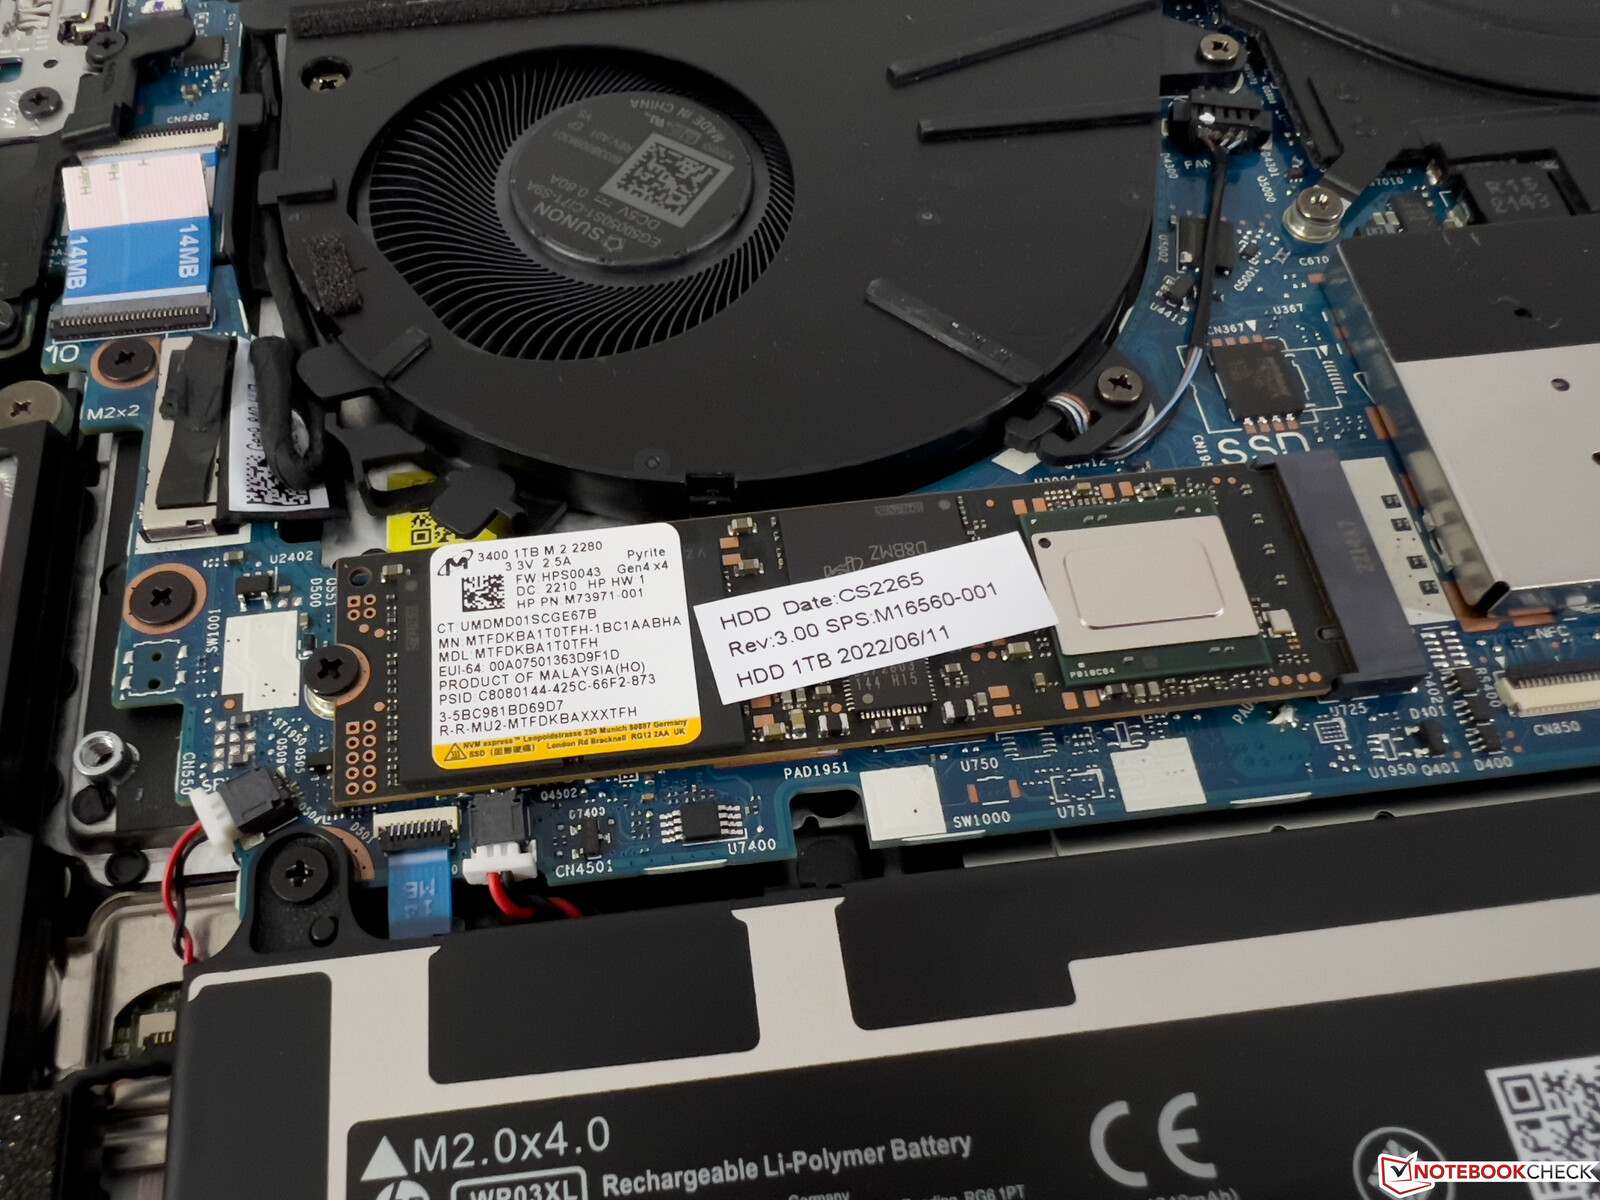
A HP instala um rápido PCIe 4.0 Micron 3400 SSD com uma capacidade de armazenamento de 1 TB, dos quais 885 GB ainda estão disponíveis após a primeira partida. As taxas de transferência de mais de 6 GB/s são boas de se ter, mas as flutuações de desempenho ocorrem após alguns minutos durante a carga permanente, devido às altas temperaturas.
Outros padrões de referência SSD estão disponíveisaqui.

* ... menor é melhor
Dauerleistung Lesen: DiskSpd Read Loop, Queue Depth 8
Placa gráfica
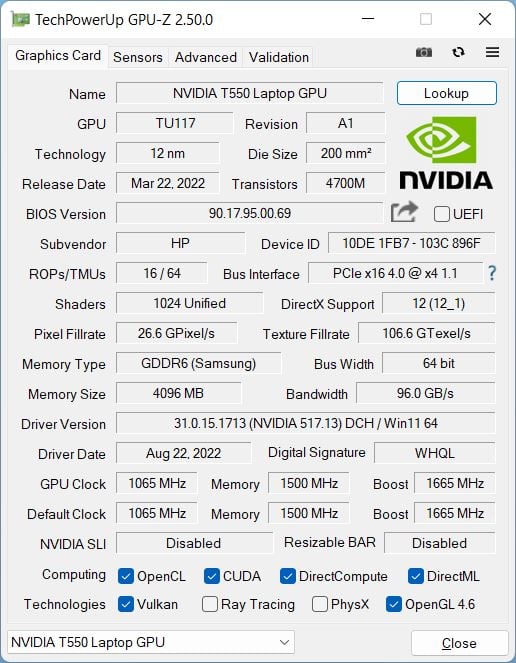
Como é o caso dos maiores Firefly 16 G9o dedicado Nvidia T550opera com um TGP de apenas 20 W, que é o valor mínimo que Nvidia especifica (20-60 W). Por ser uma GPU profissional, você obtém drivers otimizados, incluindo certificações para aplicações profissionais. Portanto, a GPU ainda faz sentido apesar da classificação de nível básico.
Em termos de desempenho puro, o novo T550 é um pouco decepcionante e está apenas marginalmente à frente do GPU T500 no antigo ZBook Firefly 14 G8. O desempenho permanece estável sob carga permanente e em modo de bateria
Mais referências de GPU podem ser encontradas em nossa seção de tecnologia.
O desempenho dos jogos também está na faixa de nível básico, mas pelo menos os títulos casuais modernos podem ser jogados razoavelmente com detalhes reduzidos, desde que os requisitos não sejam muito altos.
3DMark: 1280x720 Cloud Gate Standard Graphics | 1920x1080 Fire Strike Graphics | 2560x1440 Time Spy Graphics | Wild Life Extreme Unlimited | Wild Life Extreme
| 3DMark Performance rating | |
| Média da turma Workstation -1! | |
| Apple MacBook Pro 14 2021 M1 Pro Entry -3! | |
| Microsoft Surface Laptop Studio i7 RTX 3050 Ti | |
| Dell Precision 5000 5470 -2! | |
| HP ZBook Firefly 16 G9-6B897EA | |
| Média NVIDIA T550 Laptop GPU | |
| HP ZBook Firefly 14 G9-6B8A2EA | |
| HP ZBook Firefly 14 G8 2C9Q2EA -2! | |
| HP EliteBook 845 G9 6F6H6EA -2! | |
| Lenovo ThinkPad P14s Gen2-20VX000GGE -2! | |
| 3DMark / Cloud Gate Standard Graphics | |
| Média da turma Workstation (58392 - 152418, n=14, últimos 2 anos) | |
| Dell Precision 5000 5470 | |
| Microsoft Surface Laptop Studio i7 RTX 3050 Ti | |
| HP ZBook Firefly 16 G9-6B897EA | |
| Média NVIDIA T550 Laptop GPU (32743 - 33694, n=2) | |
| HP ZBook Firefly 14 G9-6B8A2EA | |
| HP EliteBook 845 G9 6F6H6EA | |
| HP ZBook Firefly 14 G8 2C9Q2EA | |
| Lenovo ThinkPad P14s Gen2-20VX000GGE | |
| 3DMark / Fire Strike Graphics | |
| Média da turma Workstation (8293 - 52560, n=23, últimos 2 anos) | |
| Microsoft Surface Laptop Studio i7 RTX 3050 Ti | |
| Dell Precision 5000 5470 | |
| Média NVIDIA T550 Laptop GPU (4816 - 5593, n=3) | |
| HP ZBook Firefly 16 G9-6B897EA | |
| HP ZBook Firefly 14 G9-6B8A2EA | |
| HP ZBook Firefly 14 G8 2C9Q2EA | |
| Lenovo ThinkPad P14s Gen2-20VX000GGE | |
| HP EliteBook 845 G9 6F6H6EA | |
| 3DMark / Time Spy Graphics | |
| Média da turma Workstation (2725 - 24806, n=23, últimos 2 anos) | |
| Microsoft Surface Laptop Studio i7 RTX 3050 Ti | |
| Dell Precision 5000 5470 | |
| Média NVIDIA T550 Laptop GPU (1882 - 2252, n=3) | |
| HP ZBook Firefly 14 G8 2C9Q2EA | |
| HP ZBook Firefly 16 G9-6B897EA | |
| HP ZBook Firefly 14 G9-6B8A2EA | |
| Lenovo ThinkPad P14s Gen2-20VX000GGE | |
| HP EliteBook 845 G9 6F6H6EA | |
| 3DMark / Wild Life Extreme Unlimited | |
| Microsoft Surface Laptop Studio i7 RTX 3050 Ti | |
| Apple MacBook Pro 14 2021 M1 Pro Entry | |
| HP ZBook Firefly 16 G9-6B897EA | |
| Média NVIDIA T550 Laptop GPU (3530 - 3649, n=2) | |
| HP ZBook Firefly 14 G9-6B8A2EA | |
| 3DMark / Wild Life Extreme | |
| Média da turma Workstation (5189 - 30182, n=10, últimos 2 anos) | |
| Microsoft Surface Laptop Studio i7 RTX 3050 Ti | |
| Apple MacBook Pro 14 2021 M1 Pro Entry | |
| HP ZBook Firefly 16 G9-6B897EA | |
| Média NVIDIA T550 Laptop GPU (3617 - 3739, n=2) | |
| HP ZBook Firefly 14 G9-6B8A2EA | |
| 3DMark Cloud Gate Standard Score | 17829 pontos | |
| 3DMark Fire Strike Score | 4559 pontos | |
| 3DMark Time Spy Score | 2031 pontos | |
Ajuda | ||
* ... menor é melhor
The Witcher 3 FPS chart
| baixo | média | alto | ultra | |
|---|---|---|---|---|
| GTA V (2015) | 116 | 117.2 | 61.6 | 29 |
| The Witcher 3 (2015) | 121 | 73 | 39 | 19.6 |
| Dota 2 Reborn (2015) | 113.3 | 103.8 | 92.3 | 84 |
| Final Fantasy XV Benchmark (2018) | 60.2 | 30.5 | 22 | |
| X-Plane 11.11 (2018) | 68.1 | 64.1 | 58.8 | |
| Strange Brigade (2018) | 126.1 | 47.7 | 38.7 | 33.2 |
| F1 2021 (2021) | 152.7 | 70.7 | 56.5 | 36.1 |
| F1 22 (2022) | 66.4 | 59.9 | 41.4 | 29.5 |
Emissões e energia
Emissões sonoras
No uso diário, o baixo desempenho do processador é notado positivamente no comportamento do ventilador, já que o ZBook Firefly 14 G9 permanece extremamente silencioso enquanto você não usar a GPU dedicada. Mesmo com a carga total da CPU, o ventilador está a menos de 30 dB(A) e, portanto, quase não é audível em ambientes normais
Quando o T550 também está ativo, o ventilador atinge rapidamente ~40 dB(A). Não pudemos detectar nenhum outro ruído eletrônico.
Barulho
| Ocioso |
| 24.3 / 24.3 / 24.3 dB |
| Carga |
| 35.6 / 41 dB |
 | ||
30 dB silencioso 40 dB(A) audível 50 dB(A) ruidosamente alto |
||
min: | ||
| HP ZBook Firefly 14 G9-6B8A2EA T550 Laptop GPU, i7-1265U, Micron 3400 1TB MTFDKBA1T0TFH | Dell Precision 5000 5470 RTX A1000 Laptop GPU, i9-12900H, Samsung PM9A1 MZVL21T0HCLR | Lenovo ThinkPad P14s Gen2-20VX000GGE T500 Laptop GPU, i7-1185G7, Toshiba XG6 KXG6AZNV1T02 | Microsoft Surface Laptop Studio i7 RTX 3050 Ti GeForce RTX 3050 Ti Laptop GPU, i7-11370H, SK Hynix PC711 1TB HFS001TDE9X084N | Apple MacBook Pro 14 2021 M1 Pro Entry M1 Pro 14-Core GPU, M1 Pro 8-Core, Apple SSD AP0512 | HP ZBook Firefly 14 G8 2C9Q2EA T500 Laptop GPU, i7-1165G7, Toshiba XG6 KXG60ZNV1T02 | HP EliteBook 845 G9 6F6H6EA Radeon 680M, R9 PRO 6950HS, WDC PC SN810 1TB | HP ZBook Firefly 16 G9-6B897EA T550 Laptop GPU, i7-1265U, Samsung PM9A1 MZVL21T0HCLR | |
|---|---|---|---|---|---|---|---|---|
| Noise | -10% | -1% | -4% | 3% | -10% | -6% | -1% | |
| desligado / ambiente * (dB) | 24.3 | 23 5% | 24.6 -1% | 24.7 -2% | 24.8 -2% | 28.7 -18% | 25.5 -5% | 23.8 2% |
| Idle Minimum * (dB) | 24.3 | 23.3 4% | 24.6 -1% | 24.7 -2% | 24.8 -2% | 28.7 -18% | 25.5 -5% | 23.8 2% |
| Idle Average * (dB) | 24.3 | 23.3 4% | 24.6 -1% | 24.7 -2% | 24.8 -2% | 28.7 -18% | 25.5 -5% | 23.8 2% |
| Idle Maximum * (dB) | 24.3 | 23.3 4% | 24.6 -1% | 24.7 -2% | 24.8 -2% | 28.7 -18% | 25.5 -5% | 23.8 2% |
| Load Average * (dB) | 35.6 | 48.5 -36% | 38.9 -9% | 33.2 7% | 27.8 22% | 34 4% | 38.1 -7% | 39.4 -11% |
| Witcher 3 ultra * (dB) | 38.2 | 48.6 -27% | 44.5 -16% | 27.8 27% | 40.1 -5% | 40.5 -6% | ||
| Load Maximum * (dB) | 41 | 50.4 -23% | 38.9 5% | 46.7 -14% | 49.5 -21% | 40.1 2% | 44 -7% | 41.4 -1% |
* ... menor é melhor
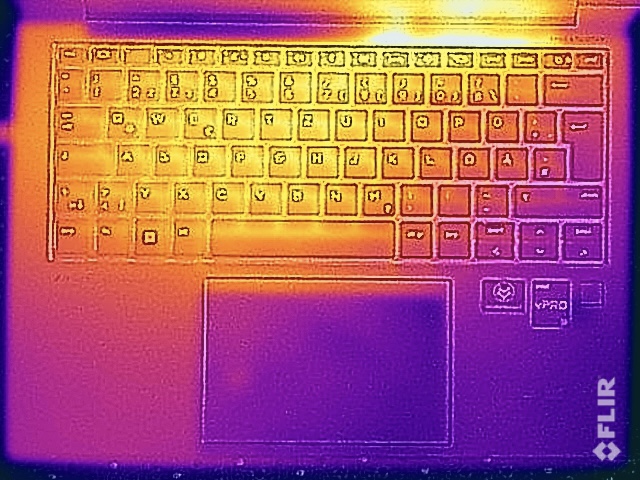
Temperatura
O ZBook Firefly 14 G9 não tem nenhum problema de temperatura em uso normal, e as superfícies permanecem agradavelmente frias. Sob carga total (especialmente com uma GPU ativa), as temperaturas não se tornam críticas, mas algumas manchas na parte inferior excedem 47 °C apesar do desempenho comparativamente baixo.
O comportamento habitual ocorre então no teste de esforço: A CPU se fixa imediatamente em 12 W e a GPU permanece estável em 20 W.
(±) A temperatura máxima no lado superior é 41.2 °C / 106 F, em comparação com a média de 38.2 °C / 101 F , variando de 22.2 a 69.8 °C para a classe Workstation.
(-) A parte inferior aquece até um máximo de 47.9 °C / 118 F, em comparação com a média de 41.1 °C / 106 F
(+) Em uso inativo, a temperatura média para o lado superior é 25.8 °C / 78 F, em comparação com a média do dispositivo de 32 °C / ### class_avg_f### F.
(±) Jogando The Witcher 3, a temperatura média para o lado superior é 32.7 °C / 91 F, em comparação com a média do dispositivo de 32 °C / ## #class_avg_f### F.
(+) Os apoios para as mãos e o touchpad estão atingindo a temperatura máxima da pele (32.1 °C / 89.8 F) e, portanto, não estão quentes.
(-) A temperatura média da área do apoio para as mãos de dispositivos semelhantes foi 27.8 °C / 82 F (-4.3 °C / -7.8 F).

| HP ZBook Firefly 14 G9-6B8A2EA Intel Core i7-1265U, NVIDIA T550 Laptop GPU | Dell Precision 5000 5470 Intel Core i9-12900H, NVIDIA RTX A1000 Laptop GPU | Lenovo ThinkPad P14s Gen2-20VX000GGE Intel Core i7-1185G7, NVIDIA T500 Laptop GPU | Microsoft Surface Laptop Studio i7 RTX 3050 Ti Intel Core i7-11370H, NVIDIA GeForce RTX 3050 Ti Laptop GPU | Apple MacBook Pro 14 2021 M1 Pro Entry Apple M1 Pro 8-Core, Apple M1 Pro 14-Core GPU | HP ZBook Firefly 14 G8 2C9Q2EA Intel Core i7-1165G7, NVIDIA T500 Laptop GPU | HP EliteBook 845 G9 6F6H6EA AMD Ryzen 9 PRO 6950HS, AMD Radeon 680M | |
|---|---|---|---|---|---|---|---|
| Heat | -8% | -12% | 11% | 5% | 3% | -13% | |
| Maximum Upper Side * (°C) | 41.2 | 41.8 -1% | 52.4 -27% | 42.3 -3% | 46.8 -14% | 42.6 -3% | 49.4 -20% |
| Maximum Bottom * (°C) | 47.9 | 36 25% | 63.7 -33% | 38.2 20% | 40.9 15% | 49.4 -3% | 48 -0% |
| Idle Upper Side * (°C) | 26.5 | 34.6 -31% | 24.6 7% | 23.4 12% | 24.2 9% | 24.2 9% | 30.8 -16% |
| Idle Bottom * (°C) | 27 | 33.6 -24% | 26 4% | 23.5 13% | 24.2 10% | 24.6 9% | 31.4 -16% |
* ... menor é melhor
Alto-falantes
Os dois alto-falantes estéreo oferecem som decente - apenas os graves são muito fracos e o som, portanto, não parece muito potente. No entanto, os alto-falantes são muito adequados para conferências e reprodução de voz.
HP ZBook Firefly 14 G9-6B8A2EA análise de áudio
(+) | os alto-falantes podem tocar relativamente alto (###valor### dB)
Graves 100 - 315Hz
(-) | quase nenhum baixo - em média 19.6% menor que a mediana
(±) | a linearidade dos graves é média (13% delta para a frequência anterior)
Médios 400 - 2.000 Hz
(+) | médios equilibrados - apenas 2.5% longe da mediana
(+) | médios são lineares (3.5% delta para frequência anterior)
Altos 2 - 16 kHz
(+) | agudos equilibrados - apenas 1.9% longe da mediana
(+) | os máximos são lineares (3.2% delta da frequência anterior)
Geral 100 - 16.000 Hz
(+) | o som geral é linear (12.7% diferença em relação à mediana)
Comparado com a mesma classe
» 21% de todos os dispositivos testados nesta classe foram melhores, 4% semelhantes, 74% piores
» O melhor teve um delta de 7%, a média foi 17%, o pior foi 35%
Comparado com todos os dispositivos testados
» 12% de todos os dispositivos testados foram melhores, 3% semelhantes, 86% piores
» O melhor teve um delta de 4%, a média foi 23%, o pior foi 134%
Apple MacBook Pro 14 2021 M1 Pro Entry análise de áudio
(+) | os alto-falantes podem tocar relativamente alto (###valor### dB)
Graves 100 - 315Hz
(+) | bons graves - apenas 4.3% longe da mediana
(+) | o baixo é linear (5.9% delta para a frequência anterior)
Médios 400 - 2.000 Hz
(+) | médios equilibrados - apenas 1.1% longe da mediana
(+) | médios são lineares (1.9% delta para frequência anterior)
Altos 2 - 16 kHz
(+) | agudos equilibrados - apenas 2.9% longe da mediana
(+) | os máximos são lineares (3% delta da frequência anterior)
Geral 100 - 16.000 Hz
(+) | o som geral é linear (5.6% diferença em relação à mediana)
Comparado com a mesma classe
» 2% de todos os dispositivos testados nesta classe foram melhores, 1% semelhantes, 97% piores
» O melhor teve um delta de 5%, a média foi 17%, o pior foi 45%
Comparado com todos os dispositivos testados
» 0% de todos os dispositivos testados foram melhores, 0% semelhantes, 100% piores
» O melhor teve um delta de 4%, a média foi 23%, o pior foi 134%
Consumo de energia
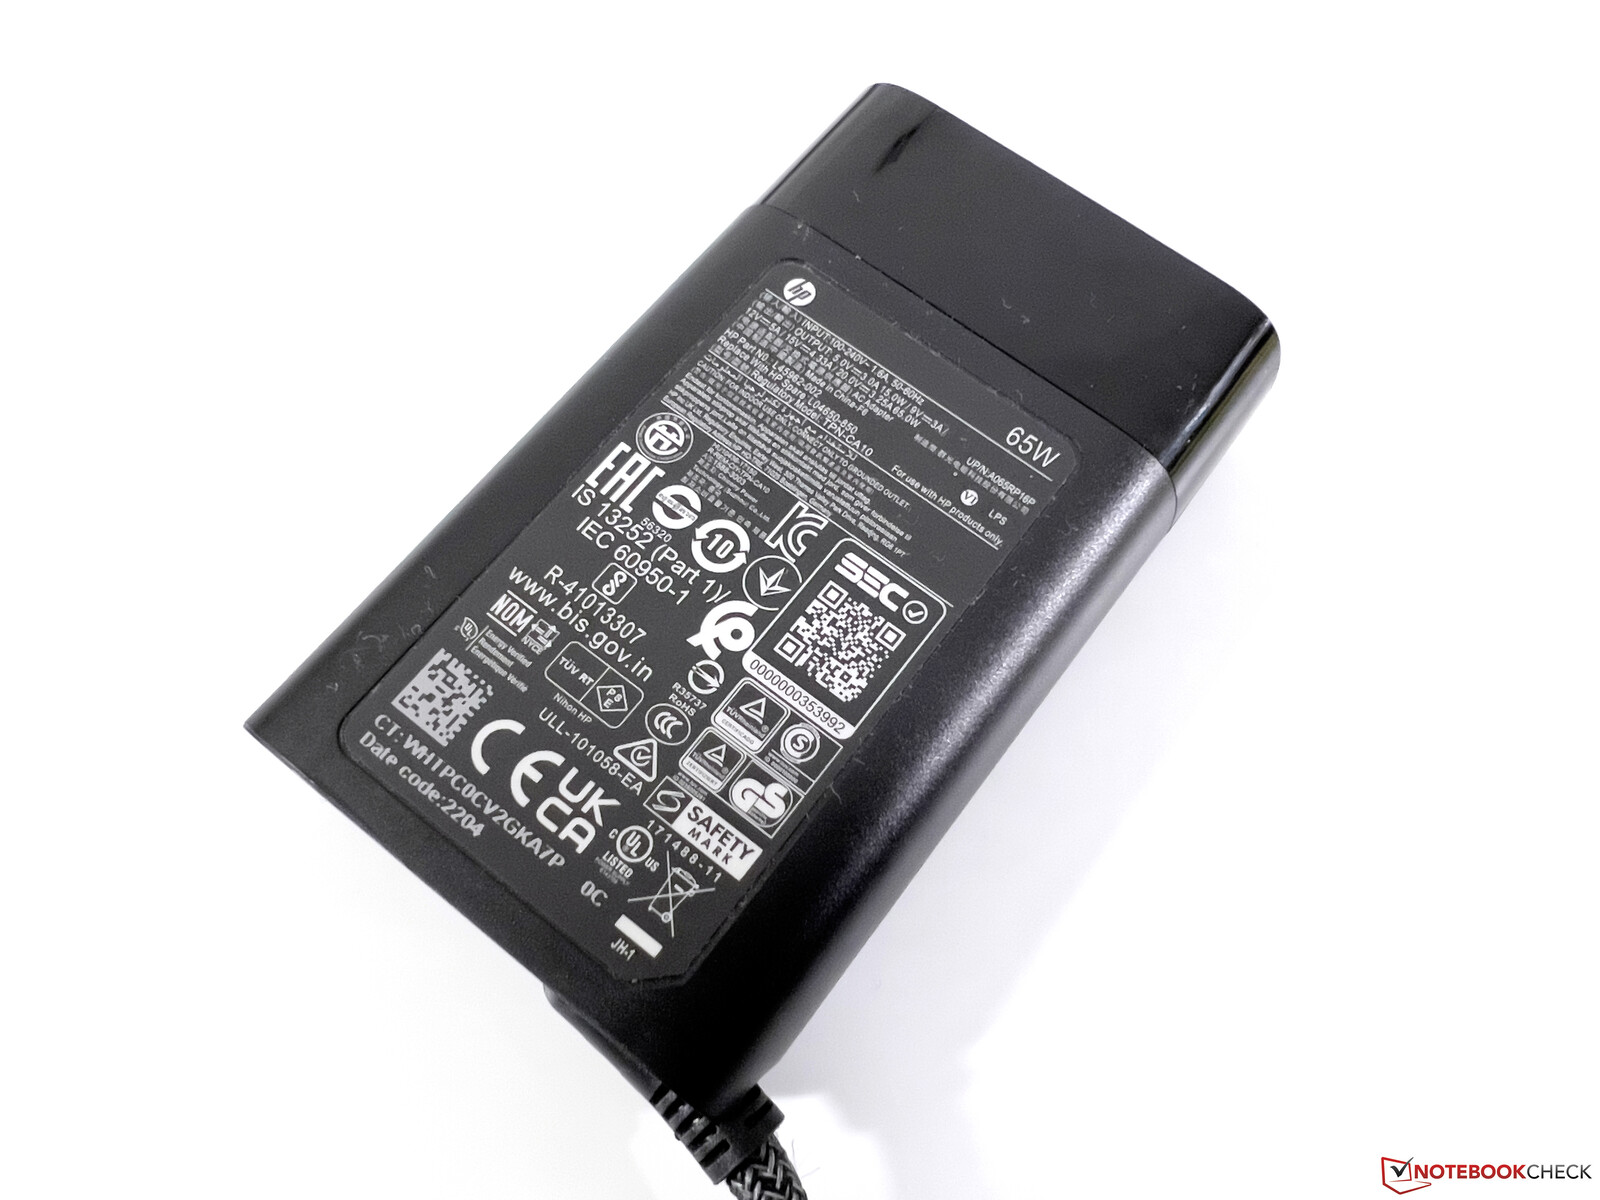
No geral, o ZBook Firefly 14 G9 é um laptop muito eficiente, embora os efeitos do baixo desempenho sejam perceptíveis sob carga. Atinge 68 W por um tempo muito curto no teste de estresse, mas o consumo se fixa imediatamente em ~45 W e se mantém neste nível. A fonte de alimentação de 65 W incluída é, portanto, suficiente.
| desligado | |
| Ocioso | |
| Carga |
|
Key:
min: | |
Power consumption - The Witcher 3 / Stress test
Power consumption - External monitor
Duração da bateria
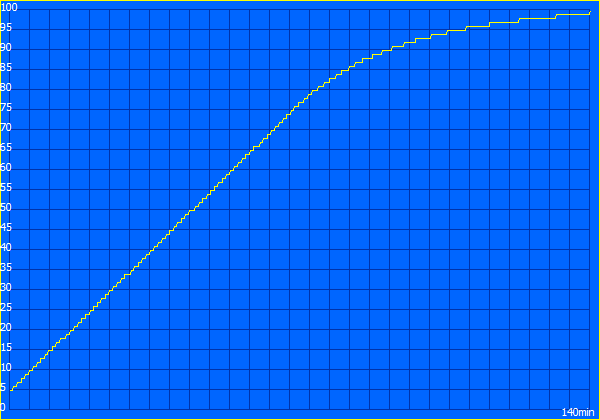
Com a bateria de 51 Whr, o ZBook Firefly 14 G9 oferece um tempo de funcionamento decente de quase 9 horas em nosso teste WLAN a 150 cd/m² (corresponde a 63% do brilho máximo); e ~7,5 horas no brilho total da tela. No entanto, os rivais oferecem mais resistência, com exceção do Surface Studio - mesmo o antigo ZBook Firefly 14 G8 durou muito mais tempo.
Uma carga completa leva 140 minutos quando o dispositivo está ligado, com 80% de carga disponível após 72 minutos. Não há função de carga rápida.
| HP ZBook Firefly 14 G9-6B8A2EA i7-1265U, T550 Laptop GPU, 51 Wh | Dell Precision 5000 5470 i9-12900H, RTX A1000 Laptop GPU, 72 Wh | Lenovo ThinkPad P14s Gen2-20VX000GGE i7-1185G7, T500 Laptop GPU, 50 Wh | Microsoft Surface Laptop Studio i7 RTX 3050 Ti i7-11370H, GeForce RTX 3050 Ti Laptop GPU, 58 Wh | Apple MacBook Pro 14 2021 M1 Pro Entry M1 Pro 8-Core, M1 Pro 14-Core GPU, 69.9 Wh | HP ZBook Firefly 14 G8 2C9Q2EA i7-1165G7, T500 Laptop GPU, 53 Wh | HP EliteBook 845 G9 6F6H6EA R9 PRO 6950HS, Radeon 680M, 51 Wh | Média da turma Workstation | |
|---|---|---|---|---|---|---|---|---|
| Duração da bateria | ||||||||
| WiFi v1.3 (h) | 8.8 | 9.6 9% | 9.2 5% | 8 -9% | 13.6 55% | 12.8 45% | 9.3 6% | 8.55 ? -3% |
Pro
Contra
Veredicto: O ZBook Firefly 14 é muito lento
Nossa conclusão sobre o ZBook Firefly 14 G9 corresponde basicamente à dos maiores Firefly 16 G9porque é um bom caderno de anotações em muitas áreas. Aspectos como a caixa, o display, o equipamento e os dispositivos de entrada são bastante convincentes, mas o desempenho é o foco de uma estação de trabalho móvel
O processador, em particular, não atende este requisito, e o novo Firefly 14 G9 também é mais lento que seu predecessor com um processador Tiger Lake. O processador dedicado Nvidia T550placa gráfica faz sentido para aplicações profissionais, mas é também a versão mais lenta com um TGP de apenas 20 W
O HP ZBook Firefly 14 G9 pode convencer em muitas áreas, mas o desempenho é simplesmente muito baixo para uma estação de trabalho móvel
Se você precisar de mais potência de CPU, você deve olhar para a variante comercial normal HP EliteBook 845 G9 que é equipado com um processador de 35 W da AMD enquanto evita o painel SureView.
Nota: Estamos atualmente em contato com a HP em relação ao baixo desempenho da CPU e atualizaremos o artigo de acordo assim que recebermos novas informações.
Preço e disponibilidade
O ZBook Firefly 14 G9 pode ser configurado diretamente na HP diretamente. Alternativamente, nossa configuração de teste também está disponível em lojas online, tais como Cyberport por cerca de 2.100 euros (~US$2.075).
HP ZBook Firefly 14 G9-6B8A2EA
- 10/19/2022 v7 (old)
Andreas Osthoff
Price comparison
