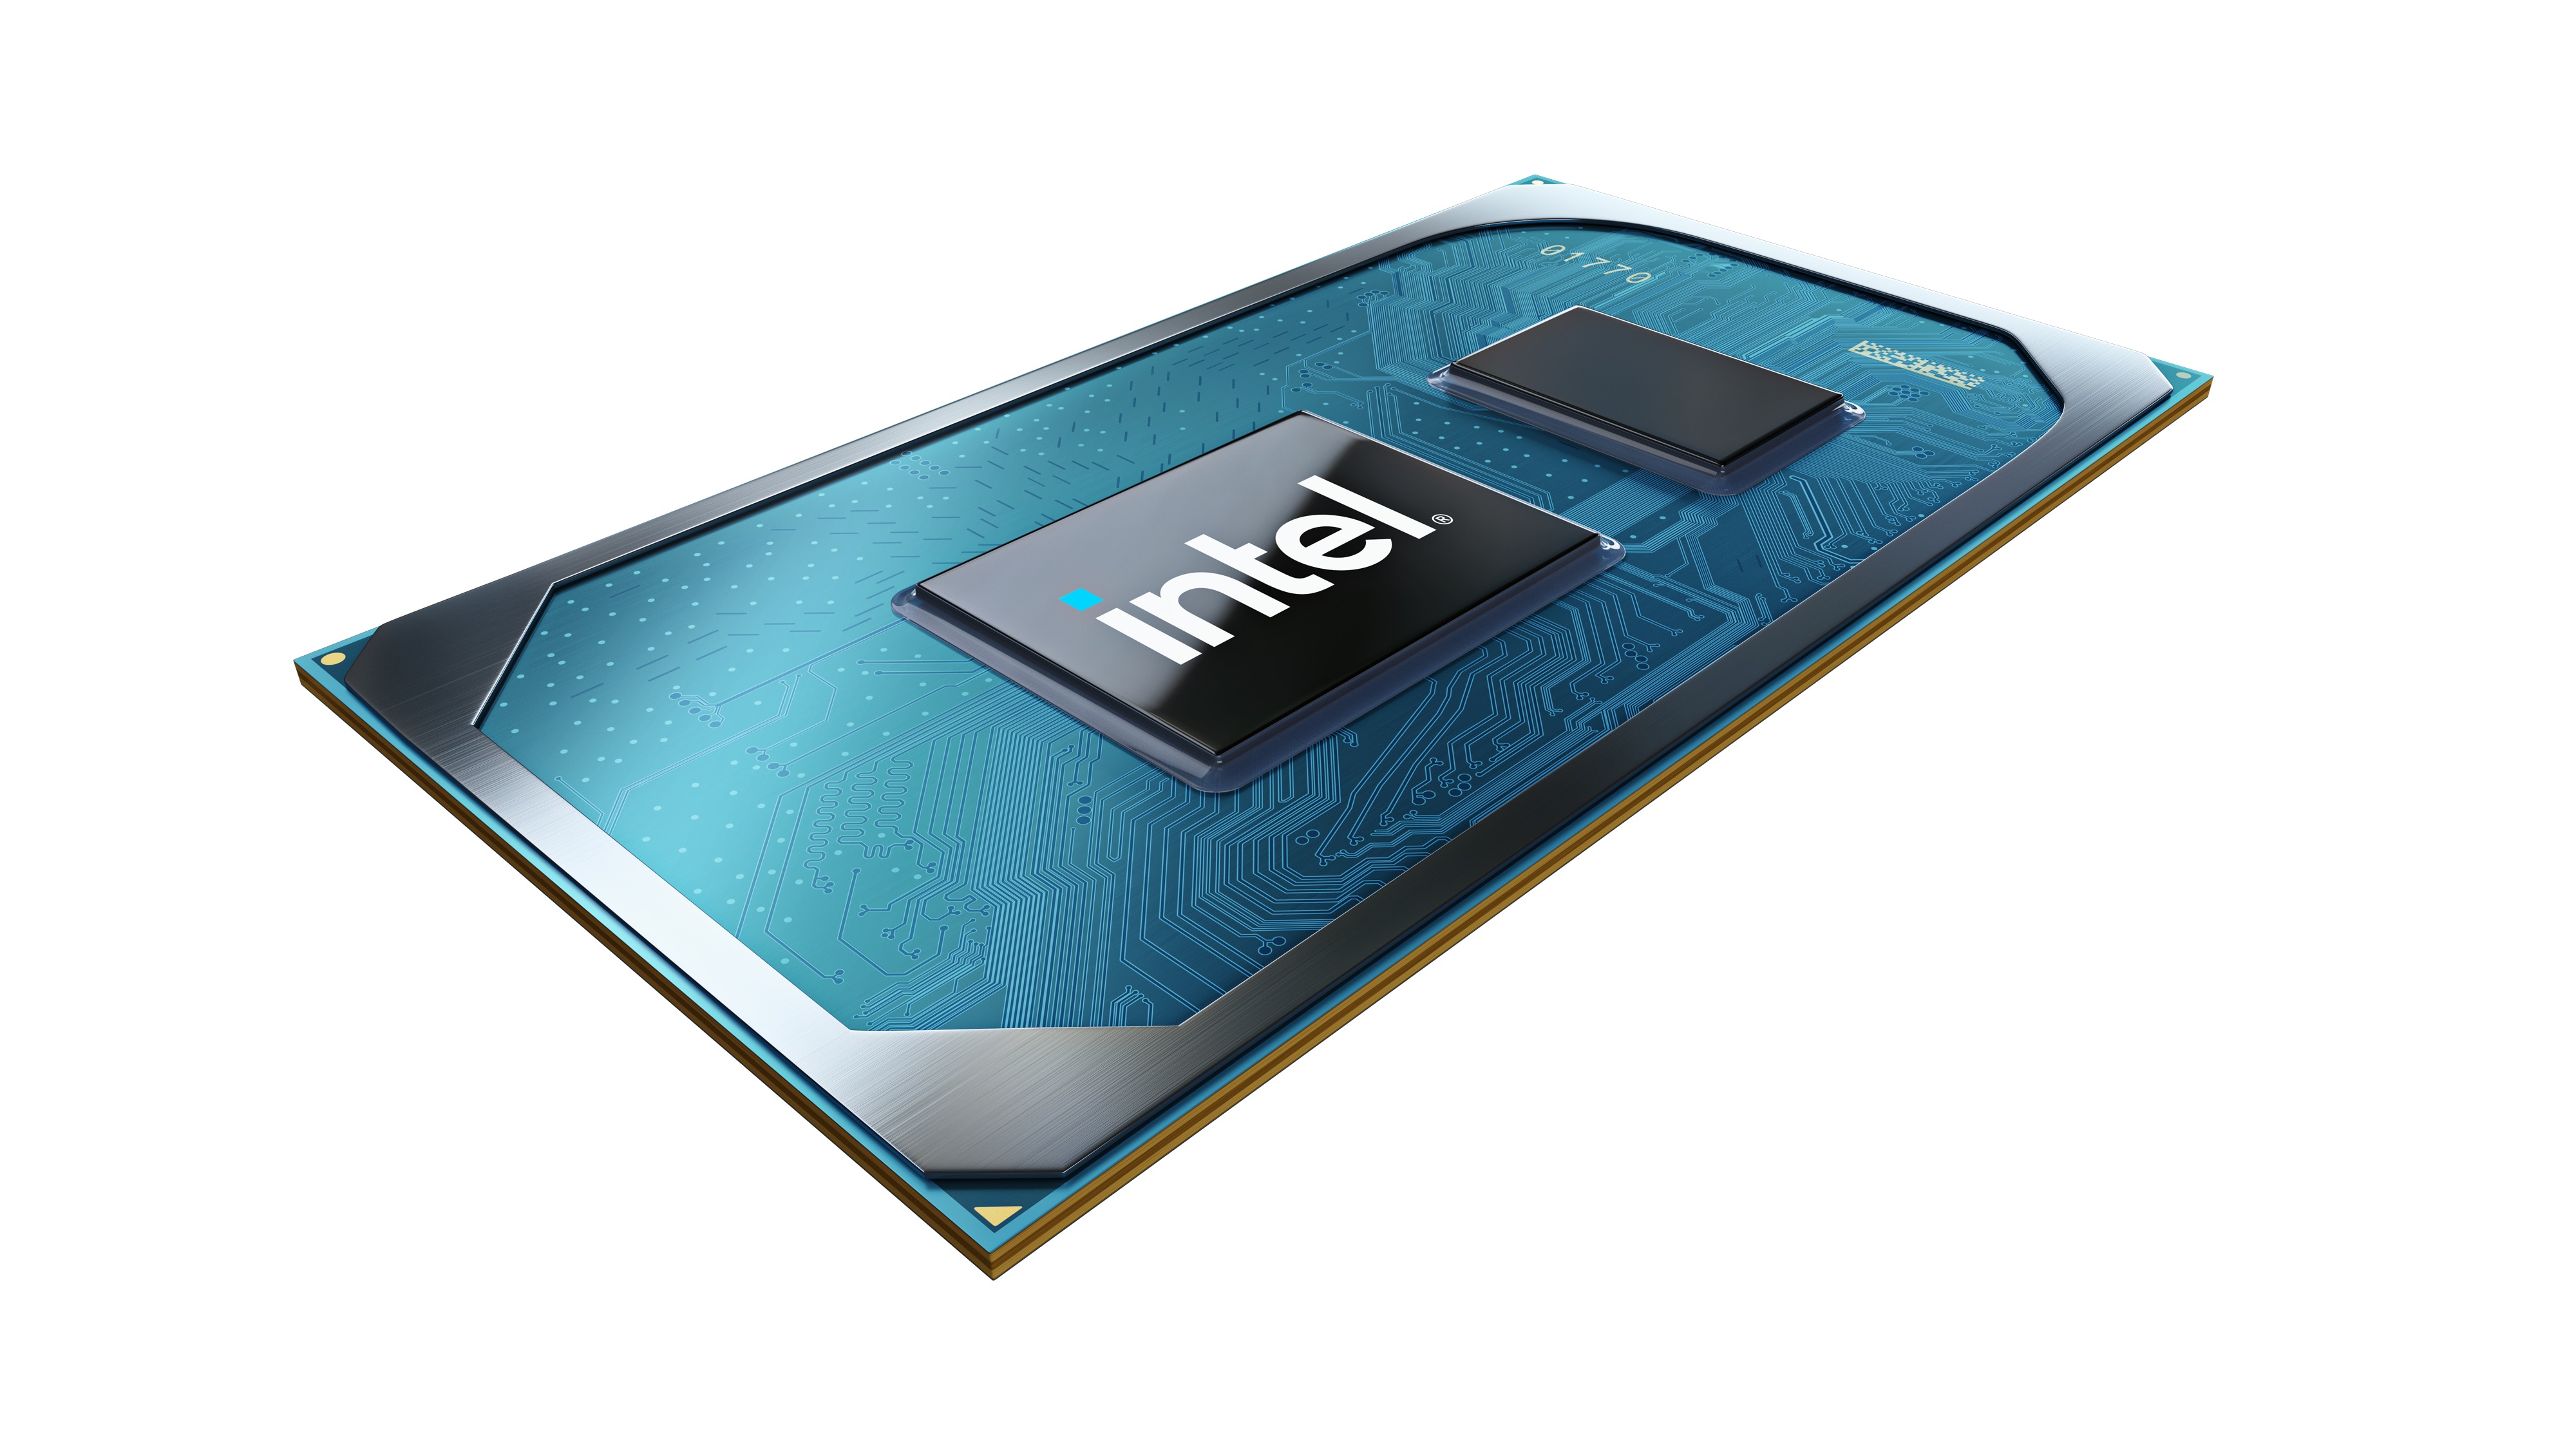
Análises para Intel Core i7-1165G7 processador
Revisão da Circular PrimeBook: Laptop modular de 14 polegadas com base na NUC
Prime Computer oferece um caderno de negócios interessante na forma da Circular PrimeBook, que emprega um design modular com o objetivo de alta sustentabilidade. Nesta revisão detalhada, descubra como o modelo interno baseado no Elemento de Cálculo NUC da Intel funciona bem sob testes.
Intel Core i7-1165G7, Iris Xe G7 96EUs, 13.9", 1.6 kgRevisão da Lenovo V17 G2: laptop de 17 polegadas com MX350 não-recompensador
Com sua tela de 17 polegadas, gráficos Nvidia e CPU Intel Core i7, o V17 G2 da Lenovo é bem adequado para tarefas de escritório e multimídia, incluindo jogos simples. Nossa análise mostra se o prêmio adicional para o equipamento de ponta vale a pena para o laptop, que de outra forma seria acessível.
Intel Core i7-1165G7, NVIDIA GeForce MX350, 17.3", 2.2 kgAsus ZenBook 14X Revisão OLED: Jogos & Cores Fortes 3K
O Asus já percorreu a milha extra: O equipamento de 14 polegadas combina o desempenho gráfico facilmente ajustável de um MX450 com um i7 Core i7 escalável Tiger Lake. Além disso, tem um OLED widescreen colorido de 3K. Isto deixa algo a desejar?
Intel Core i7-1165G7, NVIDIA GeForce MX450, 14", 1.4 kgRevisão do Huawei MateBook 14 (2021): MacBook Air com toque?
Com o MateBook 14 2021, a Huawei oferece um ultrabook de média qualidade com uma tela tátil no formato 3:2. Nosso teste mostra como ele se sai contra seus concorrentes, incluindo o MacBook Air M1 e se um processador AMD ou Intel dentro do case pode fazer um trabalho melhor.
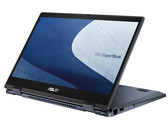
Intel Core i7-1165G7, Iris Xe G7 96EUs, 14", 1.5 kgAsus ExpertBook B3 Flip em revisão: laptop 2 em 1 com caneta digital e modem LTE
O ExpertBook B3, que oferece um modem LTE e duas portas Thunderbolt 4 em um formato de 14 polegadas, também apresenta uma tela IPS FHD. A tela tátil pode ser usada com a caneta de entrada incluída. Esta última pode ser guardada na unidade base.
Intel Core i7-1165G7, Iris Xe G7 96EUs, 14", 1.6 kgLG Gram 15Z90P-G.AA89G: Intel Iris Xe Graphics G7 96EUs, 15.60", 1.1 kg
ánalise » Revisão do LG Gram 15Z90P: 1.1-kg (~2.4-lb) laptop de 15 polegadas
Samsung Galaxy Book Pro 15 NP950XDB-KC5US: Intel Iris Xe Graphics G7 96EUs, 15.60", 1.1 kg
ánalise » Samsung Galaxy Revisão do livro Pro 15 NP950XDB para laptop: Insanamente leve
Acer Swift 3X SF314-510G-70DW: Intel Iris Xe MAX Graphics, 14.00", 1.4 kg
ánalise » Acer Swift 3X laptop em revisão: Intel Iris Xe MAX combina alta vida útil da bateria e desempenho em jogos
Dell Inspiron 14 5410-D3D7T: Intel Iris Xe Graphics G7 96EUs, 14.00", 1.5 kg
ánalise » Dell Inspiron 14 5410 2 em 1 laptop em revisão: O conversível modular oferece desempenho acessível
Acer Enduro Urban N3 EUN314: Intel Iris Xe Graphics G7 96EUs, 14.00", 1.8 kg
ánalise » Revisão do laptop Acer Enduro Urban N3 EUN314: Parte robusta, parte Ultrabook
Dell Inspiron 13 7306-6TYH5: Intel Iris Xe Graphics G7 96EUs, 13.30", 1.4 kg
ánalise » Revisão do Dell Inspiron 13 7306 Laptop: Conversível compacto para desenho e tarefas criativas
Asus Vivobook 15 K513EQ: NVIDIA GeForce MX350, 15.60", 1.6 kg
ánalise » Asus Vivobook 15 K513EQ OLED revisão de laptop: A alternativa Lenovo IdeaPad
Dynabook Portégé X30W-J-10K: Intel Iris Xe Graphics G7 96EUs, 13.30", 1 kg
ánalise » Dynabook Portégé X30W-J-10K laptop em revisão - Um portátil leve com diversidade de portas
Asus Zenbook 14X UX5400E: NVIDIA GeForce MX450, 14.00", 1.4 kg
ánalise » Revisão da unidade de pré-produção do Asus Zenbook 14X OLED: Que cores tão perfumadas!
Dell Inspiron 15 3501: Intel Iris Xe Graphics G7 96EUs, 15.60", 2 kg
ánalise » Dell Inspiron 15 3501 laptop em revisão: Laptop de escritório quieto
Dell XPS 13 9310 2-in-1: Intel Iris Xe Graphics G7 96EUs, 13.40", 1.3 kg
ánalise » Revisão 2-em-1 do Dell XPS 13 9310: Melhor que o XPS 13 7390 2 em 1 de uma forma específica
Acer TravelMate P614P-52: Intel Iris Xe Graphics G7 96EUs, 14.00", 1 kg
ánalise » Revisão Acer TravelMate P6 (2021): Bem-vindos melhoramentos em um laptop comercial já capaz, mas não sem ressalvas
Asus Chromebook Flip CX5 CX5500FEA: Intel Iris Xe Graphics G7 96EUs, 15.60", 2 kg
ánalise » Asus Chromebook Flip CX5 em revisão: 1.200 Euros por um Chromebook?
HP EliteBook 830 G8-i7-1165G7: Intel Iris Xe Graphics G7 96EUs, 13.30", 1.3 kg
ánalise » HP EliteBook 830 G8 laptop comercial em revisão: O painel SureView de 1.000-nit continua problemático
HP EliteBook 850 G8 3C7Z8EA: Intel Iris Xe Graphics G7 96EUs, 15.60", 1.8 kg
ánalise » HP EliteBook 850 G8 Review - Laptop comercial com uma tela super brilhante e muitos extras
MSI Modern 14 B11SB-085: NVIDIA GeForce MX450, 14.00", 1.3 kg
ánalise » MSI Modern 14 B11SB revisão: O allrounder de 14 polegadas sofre com o desenvolvimento do calor
Framework Laptop 13.5: Intel Iris Xe Graphics G7 96EUs, 13.50", 1.3 kg
ánalise » Revisão da Estrutura do Laptop 13.5: Se a Microsoft fizesse um notebook de superfície reparável, este seria ele
ADATA XPG Xenia 14: Intel Iris Xe Graphics G7 96EUs, 14.00", 1 kg
ánalise » ADATA XPG Xenia 14 Revisão de Laptop: Um novo favorito de 14 polegadas
Asus ZenBook Flip 13 UX363EA-HP069T: Intel Iris Xe Graphics G7 96EUs, 13.30", 1.2 kg
ánalise » Asus ZenBook Flip 13 em revisão: Conversível compacto com grande visor OLED
Lenovo ThinkPad X13 G2 20WK0024GE: Intel Iris Xe Graphics G7 96EUs, 13.30", 1.3 kg
ánalise » Revisão Lenovo ThinkPad X13 G2: O companheiro móvel perfeito?
Lenovo ThinkPad T14s G2 20WM003TGE: Intel Iris Xe Graphics G7 96EUs, 14.00", 1.3 kg
ánalise » Lenovo ThinkPad T14s G2 Revisão da Intel: Um laptop comercial muito bom, apesar do formato 16:9
MSI Modern 15 A11M-062: Intel Iris Xe Graphics G7 96EUs, 15.60", 1.6 kg
ánalise » MSI Modern 15 A11M em revisão: O portátil de escritório fino oferece uma forte retroiluminação do teclado
HP Pavilion 15-eg: NVIDIA GeForce MX450, 15.60", 1.7 kg
ánalise » HP Pavilion 15 (2021) Revisão de Laptop: 11ª geração Intel e GeForce MX450 Combo
Schenker Vision 14: Intel Iris Xe Graphics G7 96EUs, 14.00", 1 kg
ánalise » Schenker Vision 14 Laptop Review - Perfect Ultrabook com display de 1 kg e 16:10?
Lenovo ThinkPad P15s Gen2-20W6000GGE: NVIDIA T500 Laptop GPU, 15.60", 1.9 kg
ánalise » Revisão do laptop Lenovo ThinkPad P15s Gen 2: Estação de trabalho Ultrabook agora com Nvidia T500
Lenovo ThinkPad X13 Yoga G2: Intel Iris Xe Graphics G7 96EUs, 13.30", 1.2 kg
ánalise » ThinkPad X13 Yoga G2 revisão laptop: Lenovo business conversível se destaca com LCD WQXGA 16:10
LG Gram 16 (2021): Intel Iris Xe Graphics G7 96EUs, 16.00", 1.2 kg
ánalise » LG Gram 16 (2021) em revisão: 1.200 gramas, excelente duração da bateria, visor 16:10
HP Spectre x360 14-ea0378ng: Intel Iris Xe Graphics G7 96EUs, 13.50", 1.3 kg
ánalise » HP Spectre x360 14 Revisão: Visor OLED de alta resolução, bateria com pouca duração
LG Gram 14Z90P-G.AA79G: Intel Iris Xe Graphics G7 96EUs, 14.00", 1 kg
ánalise » LG Gram 14Z90P em revisão: Resistência superior e finalmente mais desempenho
Honor Magicbook 14 i7-1165G7: Intel Iris Xe Graphics G7 96EUs, 14.00", 1.4 kg
ánalise » Honor Revisão do MagicBook 14 laptop: i7 Tiger Lake no mesmo nível que o modelo Ryzen
Asus ZenBook 13 UX325EA: Intel Iris Xe Graphics G7 96EUs, 13.30", 1.2 kg
ánalise » Asus ZenBook 13 na revisão de laptops: Core i7-1165G7 versus Ryzen 7 5800U. Qual deles é o melhor ZenBook?
MSI Summit B15 A11M: Intel Iris Xe Graphics G7 96EUs, 15.60", 1.5 kg
ánalise » MSI Summit B15 A11M Revisão de Laptop: Abraçando a Iris Xe Over GeForce MX
ADATA XPG Xenia Xe: Intel Iris Xe Graphics G7 96EUs, 15.60", 1.7 kg
ánalise » ADATA XPG Xenia Xe Revisão: O Tiger Lake Laptop projetado pela Intel
Lenovo ThinkPad X1 Carbon G9-20XXS00100: Intel Iris Xe Graphics G7 96EUs, 14.00", 1.2 kg
ánalise » Revisão do Lenovo ThinkPad X1 Carbon Gen 9: Maior tempo de funcionamento da bateria com o painel Full-HD
Lenovo ThinkPad X1 Carbon G9-20XWCTO1WW: Intel Iris Xe Graphics G7 96EUs, 14.00", 1.2 kg
ánalise » Lenovo ThinkPad X1 Carbon Gen 9 Laptop Review: Grande atualização 16:10 com Intel Tiger Lake
HP ProBook 440 G8-2W1G4EA: Intel Iris Xe Graphics G7 96EUs, 14.00", 1.4 kg
ánalise » Revisão do HP ProBook 440 G8: Laptop de escritório robusto com uma CPU Tiger Lake
Lenovo ThinkPad T14 Gen2-20W1S00000: NVIDIA GeForce MX450, 14.00", 1.5 kg
ánalise » Lenovo ThinkPad T14 Gen 2 Revisão do laptop: Benefícios familiares da Intel Tiger Lake
Lenovo ThinkPad T15 Gen2-20W5S00100: NVIDIA GeForce MX450, 15.60", 1.9 kg
ánalise » Lenovo ThinkPad T15 Gen2 laptop em revisão: Negócios combinados com GPU de mídia e Tiger Lake
Lenovo ThinkPad X1 Yoga G6-20Y0S00200: Intel Iris Xe Graphics G7 96EUs, 14.00", 1.4 kg
ánalise » Revisão do ThinkPad X1 Yoga G6: O melhor conversível comercial da Lenovo
HP ZBook Firefly 15 G8 2C9R7EA: NVIDIA T500 Laptop GPU, 15.60", 1.8 kg
ánalise » HP ZBook Firefly 15 G8 laptop em revisão: Quadro T500 e Tiger Lake em um modelo de 15 polegadas
Intel NUC11PHKi7C: NVIDIA GeForce RTX 2060 Mobile, 1.4 kg
ánalise » Kaby Lake-G é história: Revisão Intel Phantom Canyon NUC11PHKi7C
Durabook S14I: Intel Iris Xe Graphics G7 96EUs, 14.00", 3 kg
ánalise » Durabook S14I Rugged Laptop Review: Durable 11th Gen Tiger Lake
HP ZBook Firefly 14 G8 2C9Q2EA: NVIDIA T500 Laptop GPU, 14.00", 1.4 kg
ánalise » HP ZBook Firefly 14 G8 laptop em revisão: Pequena estação de trabalho com portas mais rápidas
LG Gram 16 2-in-1 16T90P: Intel Iris Xe Graphics G7 96EUs, 16.00", 1.5 kg
ánalise » LG Gram 16 16T90P Revisão de conversível: Mais leve que a maioria dos notebooks de 15,6 polegadas
Lenovo Yoga Slim 7i Carbon 13 ITL: Intel Iris Xe Graphics G7 96EUs, 13.30", 1 kg
ánalise » Revisão do laptop Lenovo Yoga Slim 7i Carbon 13ITL5: Tiger Lake combinado com materiais ultraleves
Huawei MateBook X Pro 2021: Intel Iris Xe Graphics G7 96EUs, 13.90", 1.3 kg
ánalise » Revisão do Huawei MateBook X Pro 2021: Um Grande Laptop que Provavelmente Você Não Pode Comprar
Dell Inspiron 14 7400-VY8JW: NVIDIA GeForce MX350, 14.50", 1.3 kg
ánalise » Revisão do Dell Inspiron 14 7400 Laptop: Portátil portátil de escritório com uma CPU Tiger Lake
Asus ExpertBook B9 B9400CE-KC0166R: Intel Iris Xe Graphics G7 96EUs, 14.00", 1 kg
ánalise » Asus ExpertBook B9 Laptop Review: Tiger Lake oferece um aumento decente no desempenho para o peso de mosca ultra-móvel
Acer Aspire 5 A517-52G-79Z5: NVIDIA GeForce MX350, 17.30", 2.2 kg
ánalise » Revisão do laptop Acer Aspire 5 A517: Atraente equipamento de 17,3 polegadas com Tiger Lake CPU e GPU MX350
Aorus Gaming Box GeForce RTX 2080 Ti: , 3.8 kg
ánalise » A Aorus Gaming Box GeForce RTX 2080 Ti transformou nossa minúscula Intel NUC em uma casa de força 4K
Lenovo ThinkPad E15 Gen2-20TD002MGE: NVIDIA GeForce MX450, 15.60", 1.8 kg
ánalise » Lenovo ThinkPad E15 Gen 2 Revisão: Tiger Lake laptop com um Nvidia GeForce MX450
Intel NUC11PAQi7: Intel Iris Xe Graphics G7 96EUs, 0.6 kg
ánalise » Intel NUC11PAQi7 Panther Canyon Mini PC Review: Tiger Lake Feito corretamente
Lenovo ThinkPad E14 Gen2-20TA000DGE: Intel Iris Xe Graphics G7 96EUs, 14.00", 1.6 kg
ánalise » Lenovo ThinkPad E14 Gen 2 Laptop Review: O quad-core da Intel Tiger Lake bate o hexa-core da AMD
Asus ZenBook Duo 14 UX482EA: Intel Iris Xe Graphics G7 96EUs, 14.00", 1.6 kg
ánalise » Um Mini Monstro Multitarefa: Asus ZenBook Duo 14 UX482 Revisão de Laptop
Lenovo IdeaPad Slim 9i 14ITL5: Intel Iris Xe Graphics G7 96EUs, 14.00", 1.3 kg
ánalise » Revisão do Lenovo IdeaPad Slim 9i Laptop: Aparência Luxuosa, Touchpad Terrível
Lenovo ThinkBook 14s Yoga ITL 20WE0023GE: Intel Iris Xe Graphics G7 96EUs, 14.00", 1.5 kg
ánalise » Lenovo ThinkBook 14s Yoga ITL Review: Dispositivo 2-em-1 silencioso, frio e duradouro
Asus Zenbook 14 UX435EG: NVIDIA GeForce MX450, 14.00", 1.3 kg
ánalise » Asus ZenBook 14 UX435EG Revisão: Um allrounder multimídia compacto e móvel com uma tela sensível ao toque desnecessária
Dell Inspiron 15 7000 7506 2-in-1 Black Edition: Intel Iris Xe MAX Graphics, 15.60", 1.9 kg
ánalise » Dell Inspiron 15 7000 7506 2 em 1 Black Edition vs. Silver Edition: Qual é a diferença?
Asus VivoBook S15 S533EQ-BQ002T: NVIDIA GeForce MX350, 15.60", 1.8 kg
ánalise » Asus VivoBook S15 S533EQ em revisão: Elegante, versátil, com fraquezas de equipamento
HP Spectre x360 14t-ea000: Intel Iris Xe Graphics G7 96EUs, 13.50", 1.3 kg
ánalise » HP Spectre x360 14 Revisão de conversível: Um Favorito Instantâneo
Razer Book 13 FHD: Intel Iris Xe Graphics G7 96EUs, 13.40", 1.4 kg
ánalise » Razer Book 13 Core i7 Laptop Review: Como um XPS 13, mas mais rápido
HP Pavilion 13-bb0015cl: Intel Iris Xe Graphics G7 96EUs, 13.30", 1.2 kg
ánalise » 2020 HP Pavilion 13 11º gen Revisão do Core i7: É realmente muito bom
Schenker Vision 15: Intel Iris Xe Graphics G7 96EUs, 15.60", 1.7 kg
ánalise » Schenker Vision 15 (Intel NUC M15) Revisão de Laptop: A resposta da Intel ao XPS 15 e MacBook Pro?
Razer Blade Stealth i7-1165G7 GTX 1650 Ti Max-Q: NVIDIA GeForce GTX 1650 Ti Max-Q, 13.30", 1.4 kg
ánalise » Razer Blade Stealth Tiger Lake GTX 1650 Ti Max-Q Laptop Review: Um Pequeno Passo à Frente
Dell XPS 13 9310 Core i7 FHD: Intel Iris Xe Graphics G7 96EUs, 13.40", 1.3 kg
ánalise » Dell XPS 13 9310 Core i7 Revisão de Laptop: A diferença do 11º Gen Tiger Lake
Asus ZenBook 14 UX425EA: Intel Iris Xe Graphics G7 96EUs, 14.00", 1.2 kg
ánalise » Breve Análise do Asus ZenBook 14 UX425E: Debute do Core i7 "Tiger Lake" de 11a Geração
Acer SF514-55T: Intel Iris Xe Graphics G7 96EUs, 14.00", 1 kg
ánalise » Breve Análise do Acer Swift 5: A iGPU Tiger Lake ataca a GeForce de nível de entrada
Asus ZenBook Flip S UX371: Intel Iris Xe Graphics G7 96EUs, 13.30", 1.2 kg
ánalise » Breve Análise do Asus ZenBook Flip S UX371 - Conversível compacto com Tiger Lake e OLED
Dell Inspiron 15 3501: Intel Iris Xe Graphics G7 96EUs, 15.60", 2 kg
ánalise externa » Dell Inspiron 15 3501
Dell Latitude 13 7330 Rugged Extreme, i7-1165G7: Intel Iris Xe Graphics G7 96EUs, 13.30", 2.7 kg
ánalise externa » Dell Latitude 13 7330 Rugged Extreme, i7-1165G7
Asus VivoBook 15 F1500EA, i7-1165G7: Intel Iris Xe Graphics G7 96EUs, 15.60", 1.8 kg
ánalise externa » Asus VivoBook 15 F1500EA, i7-1165G7
Acer Aspire 3 A315-58, i7-1165G7: Intel Iris Xe Graphics G7 96EUs, 15.60", 1.7 kg
ánalise externa » Acer Aspire 3 A315-58, i7-1165G7
Acer TravelMate Spin P6 TMP614RN-52: Intel Iris Xe Graphics G7 96EUs, 14.00", 1 kg
ánalise externa » Acer TravelMate Spin P6 TMP614RN-52
Asus ExpertBook P1412: Intel Iris Xe Graphics G7 96EUs, 14.00", 1.5 kg
ánalise externa » Asus ExpertBook P1412
ADATA XPG Xenia 14: Intel Iris Xe Graphics G7 96EUs, 14.00", 1 kg
ánalise externa » ADATA XPG Xenia 14
Dell Inspiron 14 5410-D3D7T: Intel Iris Xe Graphics G7 96EUs, 14.00", 1.5 kg
ánalise externa » Dell Inspiron 14 5410-D3D7T
Asus Vivobook 14 F1400EA-EB1594W: Intel Iris Xe Graphics G7 96EUs, 14.00", 1.6 kg
ánalise externa » Asus Vivobook 14 F1400EA-EB1594W
Asus ZenBook Flip S UX371EA-HL753W: Intel Iris Xe Graphics G7 96EUs, 13.30", 1.2 kg
ánalise externa » Asus ZenBook Flip S UX371EA-HL753W
HP Pavilion 15-eg2025nr: Intel Iris Xe Graphics G7 96EUs, 15.60", 1.8 kg
ánalise externa » HP Pavilion 15-eg2025nr
Samsung Galaxy Book Pro 15 NP950XDB-KC5US: Intel Iris Xe Graphics G7 96EUs, 15.60", 1.1 kg
ánalise externa » Samsung Galaxy Book Pro 15 NP950XDB-KC5US
HP Envy 13-ba1006ns: Intel Iris Xe Graphics G7 96EUs, 13.30", 1.3 kg
ánalise externa » HP Envy 13-ba1006ns
Lenovo IdeaPad 3 15ITL6-82H8015MMH: Intel Iris Xe Graphics G7 96EUs, 15.60", 1.7 kg
ánalise externa » Lenovo IdeaPad 3 15ITL6-82H8015MMH
Acer Aspire 5 A515-56-758V: Intel Iris Xe Graphics G7 96EUs, 15.60", 1.7 kg
ánalise externa » Acer Aspire 5 A515-56-758V
Asus VivoBook 15 K513EA-L12236: Intel Iris Xe Graphics G7 96EUs, 15.60", 1.8 kg
ánalise externa » Asus VivoBook 15 K513EA-L12236
Asus Vivobook 15 F515EA-EJ1479W: Intel Iris Xe Graphics G7 96EUs, 15.60", 1.8 kg
ánalise externa » Asus Vivobook 15 F515EA-EJ1479W
HP Elitebook 840 G8 Aero 5Z619EA: Intel Iris Xe Graphics G7 96EUs, 14.00", 1.3 kg
ánalise externa » HP Elitebook 840 G8 Aero 5Z619EA
Dell Inspiron 15 3511, i7-1165G7: Intel Iris Xe Graphics G7 96EUs, 15.60", 1.7 kg
ánalise externa » Dell Inspiron 15 3511, i7-1165G7
Acer Aspire 5 A515-56G-78TR: NVIDIA GeForce MX350, 15.60", 1.7 kg
ánalise externa » Acer Aspire 5 A515-56G-78TR
Dynabook Portégé X30L-J-190: Intel Iris Xe Graphics G7 96EUs, 13.30", 0.9 kg
ánalise externa » Dynabook Portégé X30L-J-190
Asus ZenBook Flip 14 UP5401EA-KU030T: Intel Iris Xe Graphics G7 96EUs, 14.00", 1.4 kg
ánalise externa » Asus ZenBook Flip 14 UP5401EA-KU030T
Lenovo V17 G2 ITL-82NX00EUGE: NVIDIA GeForce MX350, 17.30", 2.2 kg
ánalise externa » Lenovo V17 G2 ITL-82NX00EUGE
Asus ZenBook Flip 13 UX363EA-AH74T: Intel Iris Xe Graphics G7 96EUs, 13.30", 1.3 kg
ánalise externa » Asus ZenBook Flip 13 UX363EA-AH74T
Lenovo Yoga Duet 7 13ITL6-82MA000RGE: Intel Iris Xe Graphics G7 96EUs, 13.00", 0.8 kg
ánalise externa » Lenovo Yoga Duet 7 13ITL6-82MA000RGE
Prime Computer PrimeBook Circular-i7-1165G7: Intel Iris Xe Graphics G7 96EUs, 13.90", 1.6 kg
ánalise externa » Prime Computer PrimeBook Circular-i7-1165G7
Acer Aspire 5 A514-54G-743J: NVIDIA GeForce MX350, 14.00", 1.7 kg
ánalise externa » Acer Aspire 5 A514-54G-743J
Asus VivoBook 14 F415EA-EB377T: Intel Iris Xe Graphics G7 96EUs, 14.00", 1.6 kg
ánalise externa » Asus VivoBook 14 F415EA-EB377T
Asus VivoBook 15 K513EA-L11141T: Intel Iris Xe Graphics G7 96EUs, 15.60", 1.8 kg
ánalise externa » Asus VivoBook 15 K513EA-L11141T
Acer Enduro Urban N3 EUN314-51W-70RF: Intel Iris Xe Graphics G7 96EUs, 14.00", 1.9 kg
ánalise externa » Acer Enduro Urban N3 EUN314-51W-70RF
MSI Modern 14 B11MOU-485XES: Intel Iris Xe Graphics G7 96EUs, 14.00", 1.3 kg
ánalise externa » MSI Modern 14 B11MOU-485XES
Durabook Z14I: Intel Iris Xe Graphics G7 96EUs, 14.00", 3.6 kg
ánalise externa » Durabook Z14I
MSI Modern 14 B11MO-074XES: Intel Iris Xe Graphics G7 96EUs, 14.00", 1.3 kg
ánalise externa » MSI Modern 14 B11MO-074XES
Asus ZenBook Flip 13 UX363EA-HP525T: Intel Iris Xe Graphics G7 96EUs, 15.60", 1.3 kg
ánalise externa » Asus ZenBook Flip 13 UX363EA-HP525T
Asus ExpertBook B1 B1500CEAE-BQ0067R: Intel Iris Xe Graphics G7 96EUs, 15.60", 1.7 kg
ánalise externa » Asus ExpertBook B1 B1500CEAE-BQ0067R
Dell Vostro 15 3510, i7-1165G7 MX350: NVIDIA GeForce MX350, 15.60", 1.7 kg
ánalise externa » Dell Vostro 15 3510, i7-1165G7 MX350
Dell XPS 13 9305-P42X4: Intel Iris Xe Graphics G7 96EUs, 13.30", 1.2 kg
ánalise externa » Dell XPS 13 9305-P42X4
Asus ExpertBook B9450CEA-XH75: Intel Iris Xe Graphics G7 96EUs, 14.00", 1 kg
ánalise externa » Asus ExpertBook B9450CEA-XH75
Asus ExpertBook B1 B1400CEAE-EB0116R: Intel Iris Xe Graphics G7 96EUs, 14.00", 1.5 kg
ánalise externa » Asus ExpertBook B1 B1400CEAE-EB0116R
VAIO SX14, i7-1165G7: Intel Iris Xe Graphics G7 96EUs, 14.00", 1.1 kg
ánalise externa » VAIO SX14, i7-1165G7
Asus VivoBook S14 S435EA-KC035T: Intel Iris Xe Graphics G7 96EUs, 14.00", 1.3 kg
ánalise externa » Asus VivoBook S14 S435EA-KC035T
Asus VivoBook 14 F415EA-EB378T: Intel Iris Xe Graphics G7 96EUs, 14.00", 1.6 kg
ánalise externa » Asus VivoBook 14 F415EA-EB378T
Asus VivoBook S14 S433EA-EB1150T: Intel Iris Xe Graphics G7 96EUs, 14.00", 1.4 kg
ánalise externa » Asus VivoBook S14 S433EA-EB1150T
Lenovo IdeaPad 5 Pro 14ITL6-82L3003NSP: Intel Iris Xe Graphics G7 96EUs, 14.00", 1.4 kg
ánalise externa » Lenovo IdeaPad 5 Pro 14ITL6-82L3003NSP
HP Spectre x360 14-ea0435no: Intel Iris Xe Graphics G7 96EUs, 13.50", 1.3 kg
ánalise externa » HP Spectre x360 14-ea0435no
Dell Precision 15 3560-HYFRK: NVIDIA T500 Laptop GPU, 15.60", 1.6 kg
ánalise externa » Dell Precision 15 3560-HYFRK
HP Envy 14-eb0021tx: NVIDIA GeForce GTX 1650 Ti Max-Q, 14.00", 1.5 kg
ánalise externa » HP Envy 14-eb0021tx
HP Envy x360 15-es0021ur: Intel Iris Xe Graphics G7 96EUs, 15.60", 1.8 kg
ánalise externa » HP Envy x360 15-es0021ur
Asus ZenBook 14 UX425EA-KI359T: Intel Iris Xe Graphics G7 96EUs, 14.00", 1.2 kg
ánalise externa » Asus ZenBook 14 UX425EA-KI359T
Asus ExpertBook B3 Flip B3402FEA: Intel Iris Xe Graphics G7 96EUs, 14.00", 1.6 kg
ánalise externa » Asus ExpertBook B3 Flip B3402FEA-EC0053R
HP Pavilion 15-eg0025nr: Intel Iris Xe Graphics G7 96EUs, 15.60", 1.8 kg
ánalise externa » HP Pavilion 15-eg0025nr
Dynabook Tecra A40-J-11J: Intel Iris Xe Graphics G7 96EUs, 14.00", 1.5 kg
ánalise externa » Dynabook Tecra A40-J-11J
HP Envy 13-ba1002ns: NVIDIA GeForce MX450, 13.30", 1.3 kg
ánalise externa » HP Envy 13-ba1002ns
Asus ZenBook Flip 13 UX363EA-HP043T: Intel Iris Xe Graphics G7 96EUs, 13.30", 1.3 kg
ánalise externa » Asus ZenBook Flip 13 UX363EA-HP043T
MSI Modern 15 A11M-045XES: Intel Iris Xe Graphics G7 96EUs, 15.60", 1.6 kg
ánalise externa » MSI Modern 15 A11M-045XES
Dynabook Tecra A50-J-13W: Intel Iris Xe Graphics G7 96EUs, 15.60", 1.6 kg
ánalise externa » Dynabook Tecra A50-J-13W
Lenovo IdeaPad 5 14ITL05-82FE005PGE: Intel Iris Xe Graphics G7 96EUs, 14.00", 1.4 kg
ánalise externa » Lenovo IdeaPad 5 14ITL05-82FE005PGE
LG UltraPC 15U70P-P.AAS8U1: NVIDIA GeForce GTX 1650 Ti Mobile, 15.60", 1.9 kg
ánalise externa » LG UltraPC 15U70P-P.AAS8U1
Acer Enduro Urban N3 EUN314-51WG-74PB: NVIDIA GeForce MX330, 14.00", 1.9 kg
ánalise externa » Acer Enduro Urban N3 EUN314-51WG-74PB
Intel NUC M15 Kit LAPBC710: Intel Iris Xe Graphics G7 96EUs, 15.60", 1.7 kg
ánalise externa » Intel NUC M15 Kit LAPBC710
Asus Vivobook 15 K513EQ: NVIDIA GeForce MX350, 15.60", 1.6 kg
ánalise externa » Asus Vivobook 15 K513EQ
Razer Blade Stealth 13 2021 OLED: NVIDIA GeForce GTX 1650 Ti Max-Q, 13.30", 1.5 kg
ánalise externa » Razer Blade Stealth 13 2021 OLED
Dell Vostro 14 3401, i7-1165G7: NVIDIA GeForce MX330, 14.00", 1.6 kg
ánalise externa » Dell Vostro 14 3401, i7-1165G7
Acer Aspire 5 A515-56-73AP: Intel Iris Xe Graphics G7 96EUs, 15.60", 1.7 kg
ánalise externa » Acer Aspire 5 A515-56-73AP
Asus ExpertBook B5 Flip B5302FEA-LG0400R: Intel Iris Xe Graphics G7 96EUs, 13.30", 1.3 kg
ánalise externa » Asus ExpertBook B5 Flip B5302FEA-LG0400R
HP Pavilion x360 14-dy0028ns: Intel Iris Xe Graphics G7 96EUs, 14.00", 1.6 kg
ánalise externa » HP Pavilion x360 14-dy0028ns
HP Pavilion x360 14-dy0034ns: Intel Iris Xe Graphics G7 96EUs, 14.00", 1.6 kg
ánalise externa » HP Pavilion x360 14-dy0034ns
Lenovo Yoga Slim 7 14ITL05-82A30024GE: Intel Iris Xe Graphics G7 96EUs, 14.00", 1.4 kg
ánalise externa » Lenovo Yoga Slim 7 14ITL05-82A30024GE
Asus Zenbook 14X UX5401EA-KN144T: Intel Iris Xe Graphics G7 96EUs, 14.00", 1.4 kg
ánalise externa » Asus Zenbook 14X UX5401EA-KN144T
HP 15s-fq2089ns: Intel Iris Xe Graphics G7 96EUs, 15.60", 1.7 kg
ánalise externa » HP 15s-fq2089ns
HP Envy x360 13-bd0350nd: Intel Iris Xe Graphics G7 96EUs, 13.30", 1.3 kg
ánalise externa » HP Envy x360 13-bd0350nd
Dynabook Portégé X30W-J-10K: Intel Iris Xe Graphics G7 96EUs, 13.30", 1 kg
ánalise externa » Dynabook Portégé X30W-J-10K
LG Gram 16 2-in-1 16T90P: Intel Iris Xe Graphics G7 96EUs, 16.00", 1.5 kg
ánalise externa » LG Gram 16 2-in-1 16T90P
Lenovo ThinkPad P15s G2-20W6005EGE: NVIDIA T500 Laptop GPU, 15.60", 1.8 kg
ánalise externa » Lenovo ThinkPad P15s G2-20W6005EGE
Dynabook Portégé X30L-J-13R: Intel Iris Xe Graphics G7 96EUs, 13.30", 0.9 kg
ánalise externa » Dynabook Portégé X30L-J-13R
Asus Expertbook B5 B5302C, i7-1165G7: Intel Iris Xe Graphics G7 96EUs, 13.30", 1.1 kg
ánalise externa » Asus Expertbook B5 B5302C, i7-1165G7
Dynabook Portégé X30L-J-13P: Intel Iris Xe Graphics G7 96EUs, 13.30", 0.9 kg
ánalise externa » Dynabook Portégé X30L-J-13P
HP Pavilion 15-eg0018ns: Intel Iris Xe Graphics G7 96EUs, 15.60", 1.8 kg
ánalise externa » HP Pavilion 15-eg0018ns
HP Pavilion x360 14-dw1023ns: Intel Iris Xe Graphics G7 96EUs, 14.00", 1.6 kg
ánalise externa » HP Pavilion x360 14-dw1023ns
Asus Zenbook 14X UX5400E: NVIDIA GeForce MX450, 14.00", 1.4 kg
ánalise externa » Asus Zenbook 14X UX5400E
Samsung Galaxy Book 15, i7-1165G7: Intel Iris Xe Graphics G7 96EUs, 15.60", 1.6 kg
ánalise externa » Samsung Galaxy Book 15, i7-1165G7
Lenovo ThinkPad X1 Yoga G6-20XY002PUS: Intel Iris Xe Graphics G7 96EUs, 14.00", 1.4 kg
ánalise externa » Lenovo ThinkPad X1 Yoga G6-20XY002PUS
Fujitsu UH-X, i7: Intel Iris Xe Graphics G7 96EUs, 13.30", 0.7 kg
ánalise externa » Fujitsu UH-X, i7
Asus ExpertBook B1 B1400C, 1165G7 MX330: NVIDIA GeForce MX330, 14.00", 1.5 kg
ánalise externa » Asus ExpertBook B1 B1400C, 1165G7 MX330
HP 15s-fq2088ns: Intel Iris Xe Graphics G7 96EUs, 15.60", 1.7 kg
ánalise externa » HP 15s-fq2088ns
HP 15s-fq2010ns: Intel Iris Xe Graphics G7 96EUs, 15.60", 1.7 kg
ánalise externa » HP 15s-fq2010ns
Asus Chromebook CX9400, i7-1165G7: Intel Iris Xe Graphics G7 96EUs, 14.00", 1.1 kg
ánalise externa » Asus Chromebook CX9400, i7-1165G7
HP Pavilion 15-eg0019ns: Intel Iris Xe Graphics G7 96EUs, 15.60", 1.8 kg
ánalise externa » HP Pavilion 15-eg0019ns
HP Envy 13-ba1012ns: NVIDIA GeForce MX450, 13.30", 1.3 kg
ánalise externa » HP Envy 13-ba1012ns
Lenovo IdeaPad Flex 5 14ITL05-82HS003QGE: Intel Iris Xe Graphics G7 96EUs, 14.00", 1.5 kg
ánalise externa » Lenovo IdeaPad Flex 5 14ITL05-82HS003QGE
Asus ExpertBook B9 B9400CE-KC0166R: Intel Iris Xe Graphics G7 96EUs, 14.00", 1 kg
ánalise externa » Asus ExpertBook B9 B9400CE-KC0166R
HP Pavilion 15-eg0504TU: Intel Iris Xe Graphics G7 96EUs, 15.60", 1.8 kg
ánalise externa » HP Pavilion 15-eg0504TU
Lenovo ThinkPad X1 Carbon G9-20XW005JGE: Intel Iris Xe Graphics G7 96EUs, 14.00", 1.1 kg
ánalise externa » Lenovo ThinkPad X1 Carbon G9-20XW005JGE
Dell XPS 13 9310 2-in-1: Intel Iris Xe Graphics G7 96EUs, 13.40", 1.3 kg
ánalise externa » Dell XPS 13 9310 2-in-1
Dell Latitude 15 7520, i7-1165G7: Intel Iris Xe Graphics G7 96EUs, 15.60", 1.8 kg
ánalise externa » Dell Latitude 15 7520, i7-1165G7
Lenovo ThinkPad T15 G2, i7-1165G7 iGPU: Intel Iris Xe Graphics G7 96EUs, 15.60", 1.8 kg
ánalise externa » Lenovo ThinkPad T15 G2, i7-1165G7 iGPU
HP ZBook Firefly 14 G8 2C9Q2EA: NVIDIA T500 Laptop GPU, 14.00", 1.4 kg
ánalise externa » HP ZBook Firefly 14 G8 2C9Q2EA
HP Pavilion 15-eg0006ns: NVIDIA GeForce MX450, 15.60", 1.8 kg
ánalise externa » HP Pavilion 15-eg0006ns
Asus VivoBook S14 S433EA-AM613T: Intel Iris Xe Graphics G7 96EUs, 14.00", 1.4 kg
ánalise externa » Asus VivoBook S14 S433EA-AM613T
HP Spectre x360 14-ea0059nw: Intel Iris Xe Graphics G7 96EUs, 13.50", 1.3 kg
ánalise externa » HP Spectre x360 14-ea0059nw
HP Envy x360 15-es0570nd: Intel Iris Xe Graphics G7 96EUs, 15.60", 1.8 kg
ánalise externa » HP Envy x360 15-es0570nd
LG Gram 16 (2021): Intel Iris Xe Graphics G7 96EUs, 16.00", 1.2 kg
ánalise externa » LG Gram 16 (2021)
Lenovo IdeaPad 3 15ITL6-82H800BHSP: Intel Iris Xe Graphics G7 96EUs, 15.60", 1.7 kg
ánalise externa » Lenovo IdeaPad 3 15ITL6-82H800BHSP
HP Pavilion 15-eg0007ns: NVIDIA GeForce MX450, 15.60", 1.8 kg
ánalise externa » HP Pavilion 15-eg0007ns
HP Envy 17-ch0000ns: NVIDIA GeForce MX450, 17.30", 2.5 kg
ánalise externa » HP Envy 17-ch0000ns
HP Pavilion x360 14-dw1003ns: Intel Iris Xe Graphics G7 96EUs, 14.00", 1.6 kg
ánalise externa » HP Pavilion x360 14-dw1003ns
HP Envy 14-eb0037no: Intel Iris Xe Graphics G7 96EUs, 14.00", 1.5 kg
ánalise externa » HP Envy 14-eb0037no
Getac S410, i7-1165G7: Intel Iris Xe Graphics G7 96EUs, 14.00", 2.4 kg
ánalise externa » Getac S410, i7-1165G7
Acer TravelMate P4 TMP414-51-75L8: Intel Iris Xe Graphics G7 96EUs, 14.00", 1.4 kg
ánalise externa » Acer TravelMate P4 TMP414-51-75L8
Asus Vivobook 14 K413EA-EB608T: Intel Iris Xe Graphics G7 96EUs, 14.00", 1.4 kg
ánalise externa » Asus Vivobook 14 K413EA-EB608T
HP 15s-fq2039ns: Intel Iris Xe Graphics G7 96EUs, 15.60", 1.7 kg
ánalise externa » HP 15s-fq2039ns
Asus ExpertBook B1 B1500C, i7-1165G7 MX330: NVIDIA GeForce MX330, 15.60", 1.7 kg
ánalise externa » Asus ExpertBook B1500C, i7-1165G7 MX330
Lenovo ThinkPad X1 Yoga G6-20Y0S00200: Intel Iris Xe Graphics G7 96EUs, 14.00", 1.4 kg
ánalise externa » Lenovo ThinkPad X1 Yoga G6-20Y0S00200
Durabook S14I: Intel Iris Xe Graphics G7 96EUs, 14.00", 3 kg
ánalise externa » Durabook S14I
Hyperbook NV4, i7-1165G7 GTX 1650 Ti: NVIDIA GeForce GTX 1650 Ti Mobile, 14.00", 1.4 kg
ánalise externa » Hyperbook NV4, i7-1165G7 GTX 1650 Ti
Acer Swift 3X SF314-510G-73NT: Intel Iris Xe Graphics G7 96EUs, 14.00", 1.4 kg
ánalise externa » Acer Swift 3X SF314-510G-73NT
Huawei MateBook D 15 2021, i7-1165G7: Intel Iris Xe Graphics G7 96EUs, 15.60", 1.6 kg
ánalise externa » Huawei MateBook D 15 2021, i7-1165G7
HP Envy x360 13-bd0032nr: Intel Iris Xe Graphics G7 96EUs, 13.30", 1.3 kg
ánalise externa » HP Envy x360 13-bd0032nr
HP EliteBook 850 G8 3C7Z8EA: Intel Iris Xe Graphics G7 96EUs, 15.60", 1.8 kg
ánalise externa » HP EliteBook 850 G8 3C7Z8EA
HP EliteBook 830 G8-i7-1165G7: Intel Iris Xe Graphics G7 96EUs, 13.30", 1.3 kg
ánalise externa » HP EliteBook 830 G8-i7-1165G7
HP Envy 14-eb0003ns: NVIDIA GeForce GTX 1650 Ti Max-Q, 14.00", 1.5 kg
ánalise externa » HP Envy 14-eb0003ns
Lenovo ThinkPad X1 Carbon G9-20XWCTO1WW: Intel Iris Xe Graphics G7 96EUs, 14.00", 1.2 kg
ánalise externa » Lenovo ThinkPad X1 Carbon G9-20XWCTO1WW
Dynabook Portégé X40-J-11C: Intel Iris Xe Graphics G7 96EUs, 14.00", 1.4 kg
ánalise externa » Dynabook Portégé X40-J-11C
Acer TravelMate P614P-52: Intel Iris Xe Graphics G7 96EUs, 14.00", 1 kg
ánalise externa » Acer TravelMate P614P-52
Dell Latitude 14 5420, i7-1165G7: Intel Iris Xe Graphics G7 96EUs, 14.00", 1.4 kg
ánalise externa » Dell Latitude 14 5420, i7-1165G7
HP EliteBook x360 1030 G8, i7-1165G7: Intel Iris Xe Graphics G7 96EUs, 13.30", 1.2 kg
ánalise externa » HP EliteBook x360 1030 G8, i7-1165G7
HP EliteBook x360 1040 G8, i7-1165G7: Intel Iris Xe Graphics G7 96EUs, 14.00", 1.3 kg
ánalise externa » HP EliteBook x360 1040 G8, i7-1165G7
Samsung Galaxy Book Pro 13 NP930XDB-KD1US: Intel Iris Xe Graphics G7 96EUs, 13.30", 0.9 kg
ánalise externa » Samsung Galaxy Book Pro 13 NP930XDB-KD1US
Huawei MateBook 14 2021, i7-1165G7: Intel Iris Xe Graphics G7 96EUs, 14.00", 1.5 kg
ánalise externa » Huawei MateBook 14 2021, i7-1165G7
Acer Swift 3 SF314-59-71YQ: Intel Iris Xe Graphics G7 96EUs, 14.00", 1.2 kg
ánalise externa » Acer Swift 3 SF314-59-71YQ
HP Pavilion 15-eg: NVIDIA GeForce MX450, 15.60", 1.7 kg
ánalise externa » HP Pavilion 15-eg0025cl
HP Pavilion 15-eg0021nr: Intel Iris Xe Graphics G7 96EUs, 15.60", 1.8 kg
ánalise externa » HP Pavilion 15-eg0021nr
HP Pavilion x360 14-dw1004ns: Intel Iris Xe Graphics G7 96EUs, 14.00", 1.6 kg
ánalise externa » HP Pavilion x360 14-dw1004ns
HP Elite Dragonfly G2, i7-1165G7: Intel Iris Xe Graphics G7 96EUs, 13.30", 1 kg
ánalise externa » HP Elite Dragonfly G2, i7-1165G7
Asus Chromebook Flip CX5 CX5500FEA: Intel Iris Xe Graphics G7 96EUs, 15.60", 2 kg
ánalise externa » Asus Chromebook Flip CX5 CX5500FEA-E60050
Dynabook Portégé X30W-J-10C: Intel Iris Xe Graphics G7 96EUs, 13.30", 1 kg
ánalise externa » Dynabook Portégé X30W-J-10C
Asus ZenBook 13 UX325EA-KG245T: Intel Iris Xe Graphics G7 96EUs, 13.30", 1.2 kg
ánalise externa » Asus ZenBook 13 UX325EA-KG245T
MSI Modern 14 B11SB-008ES: NVIDIA GeForce MX450, 14.00", 1.3 kg
ánalise externa » MSI Modern 14 B11SB-008ES
HP 15s-fq2042ns: Intel Iris Xe Graphics G7 96EUs, 15.60", 1.7 kg
ánalise externa » HP 15s-fq2042ns
Asus Vivobook 15 K513EP-EJ104T: NVIDIA GeForce MX330, 15.60", 1.8 kg
ánalise externa » Asus Vivobook 15 K513EP-EJ104T
HP Envy 14-eb0490nd: Intel Iris Xe Graphics G7 96EUs, 14.00", 1.5 kg
ánalise externa » HP Envy 14-eb0490nd
HP ProBook 440 G8-2W1G4EA: Intel Iris Xe Graphics G7 96EUs, 14.00", 1.4 kg
ánalise externa » HP ProBook 440 G8-2W1G4EA
Samsung Galaxy Book Pro 360 15 NP950QDB-KA1US: Intel Iris Xe Graphics G7 96EUs, 15.60", 1.4 kg
ánalise externa » Samsung Galaxy Book Pro 360 15 NP950QDB-KA1US
Samsung Galaxy Book Pro 15 NP950XDB-KA1US: Intel Iris Xe Graphics G7 96EUs, 15.60", 1.1 kg
ánalise externa » Samsung Galaxy Book Pro 15 NP950XDB-KA1US
Dell Latitude 13 7320 2-in-1, i7-1165G7: Intel Iris Xe Graphics G7 96EUs, 13.30", 1.4 kg
ánalise externa » Dell Latitude 13 7320 2-in-1, i7-1165G7
HP Pavilion 14-dv0058TU: Intel Iris Xe Graphics G7 96EUs, 14.00", 1.4 kg
ánalise externa » HP Pavilion 14-dv0058TU
Asus ZenBook 13 UX325EA: Intel Iris Xe Graphics G7 96EUs, 13.30", 1.2 kg
ánalise externa » Asus ZenBook 13 UX325EA
LG Gram 14Z90P-G.AA79G: Intel Iris Xe Graphics G7 96EUs, 14.00", 1 kg
ánalise externa » LG Gram 14Z90P-G.AA79G
MSI Modern 15 A11SB-011ES: NVIDIA GeForce MX450, 15.60", 1.6 kg
ánalise externa » MSI Modern 15 A11SB-011ES
HP 14s-dq2013ns: Intel Iris Xe Graphics G7 96EUs, 14.00", 1.5 kg
ánalise externa » HP 14s-dq2013ns
HP 14s-dq2005ns: Intel Iris Xe Graphics G7 96EUs, 14.00", 1.5 kg
ánalise externa » HP 14s-dq2005ns
HP Pavilion 13-bb0667ng: Intel Iris Xe Graphics G7 96EUs, 13.30", 1.2 kg
ánalise externa » HP Pavilion 13-bb0667ng
MSI Summit B15 A11M-057: Intel Iris Xe Graphics G7 96EUs, 15.60", 1.6 kg
ánalise externa » MSI Summit B15 A11M-057
Acer TravelMate P4 TMP414-51-74K7: Intel Iris Xe Graphics G7 96EUs, 14.00", 1.4 kg
ánalise externa » Acer TravelMate P4 TMP414-51-74K7
Asus VivoBook S14 S435EA-HM004T: Intel Iris Xe Graphics G7 96EUs, 14.00", 1.3 kg
ánalise externa » Asus VivoBook S14 S435EA-HM004T
Honor Magicbook 14 i7-1165G7: Intel Iris Xe Graphics G7 96EUs, 14.00", 1.4 kg
ánalise externa » Honor Magicbook 14 i7-1165G7
Lenovo ThinkPad X1 Carbon G9-20XXS00100: Intel Iris Xe Graphics G7 96EUs, 14.00", 1.2 kg
ánalise externa » Lenovo ThinkPad X1 Carbon G9-20XXS00100
Lenovo Yoga Slim 7i Carbon 13 ITL: Intel Iris Xe Graphics G7 96EUs, 13.30", 1 kg
ánalise externa » Lenovo Yoga Slim 7i Carbon 13 ITL
HP 15s-fq2011ns: Intel Iris Xe Graphics G7 96EUs, 15.60", 1.7 kg
ánalise externa » HP 15s-fq2011ns
HP Envy 17-cg1000ns: NVIDIA GeForce MX450, 17.30", 2.7 kg
ánalise externa » HP Envy 17-cg1000ns
Asus ZenBook Flip 13 UX363EA-HP165T: Intel Iris Xe Graphics G7 96EUs, 13.30", 1.3 kg
ánalise externa » Asus ZenBook Flip 13 UX363EA-HP165T
Asus VivoBook 15 K513EA-BQ684: Intel Iris Xe Graphics G7 96EUs, 15.60", 1.8 kg
ánalise externa » Asus VivoBook 15 K513EA-BQ684
Asus VivoBook Ultra 14 K413EQ-EK115T: NVIDIA GeForce MX350, 14.00"
ánalise externa » Asus VivoBook Ultra 14 K413EQ-EK115T
LG Gram 15Z95N-G.AA78B: Intel Iris Xe Graphics G7 96EUs, 15.60"
ánalise externa » LG Gram 15Z95N-G.AA78B
LG Gram 17Z95N-G.AA78B: Intel Iris Xe Graphics G7 96EUs, 17.00", 1.4 kg
ánalise externa » LG Gram 17Z95N-G.AA78B
Lenovo Yoga Slim 9 14ITL5-82D1002HGE: Intel Iris Xe Graphics G7 96EUs, 14.00", 1.2 kg
ánalise externa » Lenovo Yoga Slim 9 14ITL5-82D1002HGE
Xiaomi RedmiBook Pro 14 2021, i7-1165G7 MX450: NVIDIA GeForce MX450, 14.00", 1.5 kg
ánalise externa » Xiaomi RedmiBook Pro 14 2021, i7-1165G7 MX450
LG Gram 16Z90P-K.AAB6U1: Intel Iris Xe Graphics G7 96EUs, 16.00", 1.2 kg
ánalise externa » LG Gram 16Z90P-K.AAB6U1
HP Pavilion 13-bb0015cl: Intel Iris Xe Graphics G7 96EUs, 13.30", 1.2 kg
ánalise externa » HP Pavilion 13-bb0015cl
Lenovo ThinkBook 14s Yoga ITL 20WE0023GE: Intel Iris Xe Graphics G7 96EUs, 14.00", 1.5 kg
ánalise externa » Lenovo ThinkBook 14s Yoga ITL 20WE0023GE
HP Envy 14-eb0775ng: NVIDIA GeForce GTX 1650 Ti Max-Q, 14.00", 1.5 kg
ánalise externa » HP Envy 14-eb0775ng
Acer Swift 3X SF314-510G-70DW: Intel Iris Xe MAX Graphics, 14.00", 1.4 kg
ánalise externa » Acer Swift 3X SF314-510G-70DW
Acer Swift 5 SF514-55GT-72L0: NVIDIA GeForce MX350, 14.00", 1.1 kg
ánalise externa » Acer Swift 5 SF514-55GT-72L0
Samsung Galaxy Book Flex2 NP930QCA-KA2DE: Intel Iris Xe Graphics G7 96EUs, 13.30", 1.3 kg
ánalise externa » Samsung Galaxy Book Flex2 NP930QCA-KA2DE
Acer Swift 5 SF514-55T-70LG: Intel Iris Xe Graphics G7 96EUs, 14.00", 1.1 kg
ánalise externa » Acer Swift 5 SF514-55T-70LG
Razer Blade Stealth i7-1165G7 GTX 1650 Ti Max-Q: NVIDIA GeForce GTX 1650 Ti Max-Q, 13.30", 1.4 kg
ánalise externa » Razer Blade Stealth i7-1165G7 GTX 1650 Ti Max-Q
Lenovo Yoga 7 14ITL5, i7-1165G7: Intel Iris Xe Graphics G7 96EUs, 14.00", 1.4 kg
ánalise externa » Lenovo Yoga 7 14ITL5, i7-1165G7
LG Gram 17Z90P-K.AAB8U1: Intel Iris Xe Graphics G7 96EUs, 17.00", 1.4 kg
ánalise externa » LG Gram 17Z90P-K.AAB8U1
Lenovo ThinkBook 15 G2 ITL, i7-1165G7: Intel Iris Xe Graphics G7 96EUs, 15.60", 1.7 kg
ánalise externa » Lenovo ThinkBook 15 G2 ITL, i7-1165G7
HP Spectre x360 13-aw2002ng: Intel Iris Xe Graphics G7 96EUs, 13.30", 1.3 kg
ánalise externa » HP Spectre x360 13-aw2002ng
HP Spectre x360 14-ea0004ns: Intel Iris Xe Graphics G7 96EUs, 13.50", 1.4 kg
ánalise externa » HP Spectre x360 14-ea0004ns
HP Pavilion 14-dv0005ns: NVIDIA GeForce MX450, 14.00", 1.4 kg
ánalise externa » HP Pavilion 14-dv0005ns
Asus ZenBook 14 UX425EA-HM165T: Intel Iris Xe Graphics G7 96EUs, 14.00", 1.2 kg
ánalise externa » Asus ZenBook 14 UX425EA-HM165T
Acer Swift 3 Air 3 SF313-53-79G3: Intel Iris Xe Graphics G7 96EUs, 13.50", 1.2 kg
ánalise externa » Acer Swift 3 Air 3 SF313-53-79G3
Lenovo IdeaPad Slim 9i 14ITL5: Intel Iris Xe Graphics G7 96EUs, 14.00", 1.3 kg
ánalise externa » Lenovo IdeaPad Slim 9i 14ITL5
Huawei MateBook X Pro 2021: Intel Iris Xe Graphics G7 96EUs, 13.90", 1.3 kg
ánalise externa » Huawei MateBook X Pro 2021
Asus ZenBook 13 UX325EA-EG247: Intel Iris Xe Graphics G7 96EUs, 13.30", 1.1 kg
ánalise externa » Asus ZenBook 13 UX325EA-EG247
HP Spectre x360 13-aw2006ng: Intel Iris Xe Graphics G7 96EUs, 13.30", 1.3 kg
ánalise externa » HP Spectre x360 13-aw2006ng
HP Elite x2 G8: Intel Iris Xe Graphics G7 96EUs, 13.00"
ánalise externa » HP Elite x2 G8
Lenovo IdeaPad 5 14ITL05-82FE005QGE: NVIDIA GeForce MX450, 14.00"
ánalise externa » Lenovo IdeaPad 5 14ITL05-82FE005QGE
MSI Modern 14 B11SB-009XES: NVIDIA GeForce MX450, 14.00", 1.3 kg
ánalise externa » MSI Modern 14 B11SB-009XES
HP Spectre x360 13t-aw200: Intel Iris Xe Graphics G7 96EUs, 13.30", 1.3 kg
ánalise externa » HP Spectre x360 13t-aw200
Acer Swift 5 SF514-55T-71NL: Intel Iris Xe Graphics G7 96EUs, 14.00", 1.1 kg
ánalise externa » Acer Swift 5 SF514-55T-71NL
HP Envy 13-ba1033tx: NVIDIA GeForce MX450, 13.30", 1.3 kg
ánalise externa » HP Envy 13-ba1033tx
Acer Swift 5 SF514-55TA-7494: Intel Iris Xe Graphics G7 96EUs, 14.00", 1.1 kg
ánalise externa » Acer Swift 5 SF514-55TA-7494
HP Envy x360 15-ed1550nd: Intel Iris Xe Graphics G7 96EUs, 15.60", 1.9 kg
ánalise externa » HP Envy x360 15-ed1550nd
Dell Inspiron 13 7306 2-in-1, i7-1165G7: Intel Iris Xe Graphics G7 96EUs, 13.30", 1.4 kg
ánalise externa » Dell Inspiron 13 7306 2-in-1, i7-1165G7
HP Pavilion 14-dv0067tx: NVIDIA GeForce MX450, 14.00", 1.5 kg
ánalise externa » HP Pavilion 14-dv0067tx
Lenovo Yoga Slim 7i Pro: NVIDIA GeForce MX450, 14.00", 1.5 kg
ánalise externa » Lenovo Yoga Slim 7i Pro
HP Envy 17-cg1490nd : NVIDIA GeForce MX450, 17.30", 2.8 kg
ánalise externa » HP Envy 17-cg1490nd
Dell Inspiron 15 7000 7506 2-in-1 Black Edition: Intel Iris Xe MAX Graphics, 15.60", 1.9 kg
ánalise externa » Dell Inspiron 15 7000 7506 2-in-1 Black Edition
Asus ZenBook Duo 14 UX482EA: Intel Iris Xe Graphics G7 96EUs, 14.00", 1.6 kg
ánalise externa » Asus ZenBook Duo 14 UX482EA
MSI Modern 14 B11M-028: Intel Iris Xe Graphics G7 96EUs, 14.00", 1.3 kg
ánalise externa » MSI Modern 14 B11M-028
Asus VivoBook S14 S433EQ-EB044T: Intel Iris Xe Graphics G7 96EUs, 14.00", 1.4 kg
ánalise externa » Asus VivoBook S14 S433EQ-EB044T
HP Spectre x360 14t-ea000: Intel Iris Xe Graphics G7 96EUs, 13.50", 1.3 kg
ánalise externa » HP Spectre x360 14t-ea000
Asus Zenbook 14 UX435EG: NVIDIA GeForce MX450, 14.00", 1.3 kg
ánalise externa » Asus Zenbook 14 UX435EG
Acer Swift 5 SF514-55TA-74EC: Intel Iris Xe Graphics G7 96EUs, 14.00", 1.1 kg
ánalise externa » Acer Swift 5 SF514-55TA-74EC
Lenovo Yoga 7 15ITL5-82BJ0031GE: Intel Iris Xe Graphics G7 96EUs, 15.60", 1.9 kg
ánalise externa » Lenovo Yoga 7 15ITL5-82BJ0031GE
Razer Blade Stealth 13 2021, i7-1165G7: Intel Iris Xe Graphics G7 96EUs, 13.30", 1.4 kg
ánalise externa » Razer Blade Stealth 13 2021, i7-1165G7
HP Spectre x360 14-ea0030tu: Intel Iris Xe Graphics G7 96EUs, 13.50", 1.4 kg
ánalise externa » HP Spectre x360 14-ea0030tu
Asus ZenBook Flip S UX371EA-HL135T: Intel Iris Xe Graphics G7 96EUs, 13.30", 1.2 kg
ánalise externa » Asus ZenBook Flip S UX371EA-HL135T
Asus ZenBook S UX393EA-HK003T: Intel Iris Xe Graphics G7 96EUs, 13.90", 1.4 kg
ánalise externa » Asus ZenBook S UX393EA-HK003T
Dell XPS 13 9310 cn93214sc: Intel Iris Xe Graphics G7 96EUs, 13.40", 1.3 kg
ánalise externa » Dell XPS 13 9310 cn93214sc
MSI Modern 15 A11SB-039RU: NVIDIA GeForce MX450, 15.60", 1.6 kg
ánalise externa » MSI Modern 15 A11SB-039RU
Asus ZenBook 14 Ultralight UX435EGL: Intel Iris Xe Graphics G7 96EUs, 14.00", 1 kg
ánalise externa » Asus ZenBook 14 Ultralight UX435EGL
HP Envy 17-cg1279ng: NVIDIA GeForce MX450, 17.30", 2.7 kg
ánalise externa » HP Envy 17-cg1279ng
Schenker Vision 15: Intel Iris Xe Graphics G7 96EUs, 15.60", 1.7 kg
ánalise externa » Schenker Vision 15
Asus ZenBook Flip S UX371EA-HL003T: Intel Iris Xe Graphics G7 96EUs, 13.30", 1.3 kg
ánalise externa » Asus ZenBook Flip S UX371EA-HL003T
Lenovo Yoga Slim 7i Carbon: NVIDIA GeForce MX330, 13.30", 1 kg
ánalise externa » Lenovo Yoga Slim 7i Carbon
Dell XPS 13 cn93214sc: Intel Iris Xe Graphics G7 96EUs, 13.40", 1.2 kg
ánalise externa » Dell XPS 13 cn93214sc
Dell XPS 13 9310 2-in-1, i7-1165G7: Intel Iris Xe Graphics G7 96EUs, 13.40", 1.3 kg
ánalise externa » Dell XPS 13 9310 2-in-1, i7-1165G7
Acer Swift 5 SF514-55GT-79BM: NVIDIA GeForce MX350, 14.00", 1 kg
ánalise externa » Acer Swift 5 SF514-55GT-79BM
Asus ZenBook 13 UX325EA-AH77: Intel Iris Xe Graphics G7 96EUs, 13.30", 1.1 kg
ánalise externa » Asus ZenBook 13 UX325EA-AH77
Asus VivoBook S15 S533EA-BQ003T: Intel Iris Xe Graphics G7 96EUs, 15.60", 1.8 kg
ánalise externa » Asus VivoBook S15 S533EA-BQ003T
Asus ZenBook 14 Ultralight UX435, i7: Intel Iris Xe Graphics G7 96EUs, 14.00", 1 kg
ánalise externa » Asus ZenBook 14 Ultralight UX435, i7
Razer Book 13 FHD: Intel Iris Xe Graphics G7 96EUs, 13.40", 1.4 kg
ánalise externa » Razer Book 13 FHD
Asus VivoBook S15 S533EQ-BQ002T: NVIDIA GeForce MX350, 15.60", 1.8 kg
ánalise externa » Asus VivoBook S15 S533EQ-BQ002T
Acer TravelMate Spin P4 TMP414RN-51-71V7: Intel Iris Xe Graphics G7 96EUs, 14.00", 1.5 kg
ánalise externa » Acer TravelMate Spin P4 TMP414RN-51-71V7
Acer Book RS Porsche Design AP714-51GT-71A4: NVIDIA GeForce MX350, 14.00", 1.3 kg
ánalise externa » Acer Book RS Porsche Design AP714-51GT-71A4
Acer Swift 3X: Intel Iris Xe MAX Graphics, 14.00"
ánalise externa » Acer Swift 3X
Asus ZenBook Flip 13 UX363EA-EM045R: Intel Iris Xe Graphics G7 96EUs, 13.30", 1.3 kg
ánalise externa » Asus ZenBook Flip 13 UX363EA-EM045R
Acer Swift 3X SF314-510G-761J: Intel Iris Xe Graphics G7 96EUs, 14.00", 1.4 kg
ánalise externa » Acer Swift 3X SF314-510G-761J
HP Envy 13-ba1097nr: Intel Iris Xe Graphics G7 96EUs, 13.30", 1.3 kg
ánalise externa » HP Envy 13-ba1097nr
Fujitsu LifeBook U9311: Intel Iris Xe Graphics G7 96EUs, 13.30", 0.9 kg
ánalise externa » Fujitsu LifeBook U9311
Acer Swift 3 SF313-53-78UG: Intel Iris Xe Graphics G7 96EUs, 13.50", 1.2 kg
ánalise externa » Acer Swift 3 SF313-53-78UG
Asus ZenBook 13 UX325EA, i7-1165G7: Intel Iris Xe Graphics G7 96EUs, 13.30", 1.1 kg
ánalise externa » Asus ZenBook 13 UX325EA, i7-1165G7
Asus ExpertBook B9 B9400CEA-KC0167R: Intel Iris Xe Graphics G7 96EUs, 14.00", 1 kg
ánalise externa » Asus ExpertBook B9400CEA-KC0167R
Dell XPS 13 9310, i7-1165G7 4K: Intel Iris Xe Graphics G7 96EUs, 13.40", 1.3 kg
ánalise externa » Dell XPS 13 9310, i7-1165G7 4K
Dell XPS 13 9310 Core i7 FHD: Intel Iris Xe Graphics G7 96EUs, 13.40", 1.3 kg
ánalise externa » Dell XPS 13 9310 Core i7 FHD
Asus ZenBook S UX393EA-HK001T: Intel Iris Xe Graphics G7 96EUs, 13.90", 1.4 kg
ánalise externa » Asus ZenBook S UX393EA-HK001T
Asus Vivobook S14 S433EA-EB160T: Intel Iris Xe Graphics G7 96EUs, 14.00", 1.4 kg
ánalise externa » Asus Vivobook S14 S433EA-EB160T
Asus ZenBook 14 UX425EA: Intel Iris Xe Graphics G7 96EUs, 14.00", 1.2 kg
ánalise externa » Asus ZenBook 14 UX425EA
Asus ZenBook Flip S UX371: Intel Iris Xe Graphics G7 96EUs, 13.30", 1.2 kg
ánalise externa » Asus ZenBook Flip S UX371
Acer Swift 5 (2021): Intel Iris Xe Graphics G7 96EUs, 14.00", 1 kg
ánalise externa » Acer Swift 5 (2021)
Samsung Galaxy Book Pro 15 NP950XDB-KC5US: Intel Iris Xe Graphics G7 96EUs, 15.60", 1.1 kg
» Samsung Galaxy Book Pro 15 sacrifica a rigidez do chassi para ser o mais fino e leve possível
Framework Laptop 13.5: Intel Iris Xe Graphics G7 96EUs, 13.50", 1.3 kg
» A Framework duplica a reparabilidade, agora vende peças de reposição para laptop diretamente a seus clientes
ADATA XPG Xenia 14: Intel Iris Xe Graphics G7 96EUs, 14.00", 1 kg
» O surpreendentemente bom ADATA XPG Xenia 14 é agora enviado a partir de $1099 USD
Lenovo ThinkPad X13 G2 20WK0024GE: Intel Iris Xe Graphics G7 96EUs, 13.30", 1.3 kg
» A Lenovo equipa o novo ThinkPad X13 G2 com visor 16:10 e conectividade 5G
MSI Modern 15 A11M-062: Intel Iris Xe Graphics G7 96EUs, 15.60", 1.6 kg
» MSI Modern 15 A11M: Laptop de escritório atualizado
Schenker Vision 14: Intel Iris Xe Graphics G7 96EUs, 14.00", 1 kg
» O Schenker Vision 14 mostra, como deve ser um Ultrabook moderno
HP Pavilion 15-eg: NVIDIA GeForce MX450, 15.60", 1.7 kg
» Nvidia deu aos fabricantes de laptop uma pontuação inútil e exagerada GeForce MX450 3DMark que se mostrou impossível de alcançar
Asus ZenBook 13 UX325EA: Intel Iris Xe Graphics G7 96EUs, 13.30", 1.2 kg
» ZenBook 13 em revisão: É melhor ir com a Ryzen ou com a Intel Core? Há bons argumentos para ambos.
ADATA XPG Xenia Xe: Intel Iris Xe Graphics G7 96EUs, 15.60", 1.7 kg
» Executamos o 3DMark em mais de 40 computadores portáteis Core i7 Iris Xe da 11ª geração diferentes: Estes são os modelos mais lentos e rápidos que você pode comprar
Lenovo ThinkPad X1 Carbon G9-20XWCTO1WW: Intel Iris Xe Graphics G7 96EUs, 14.00", 1.2 kg
» X1 Carbon Gen 9: A Lenovo tem que ter cuidado com o teclado ThinkPad
Intel NUC11PHKi7C: NVIDIA GeForce RTX 2060 Mobile, 1.4 kg
» 100 W Core i7-8809G vs. 28 W Core i7-1165G7: Pode Tiger Lake superar o exótico chipset Intel-AMD?
LG Gram 16 2-in-1 16T90P: Intel Iris Xe Graphics G7 96EUs, 16.00", 1.5 kg
» LG Gram 16 2 em 1 é maior e mais leve que o HP Spectre x360 15, mas há um senão
Huawei MateBook X Pro 2021: Intel Iris Xe Graphics G7 96EUs, 13.90", 1.3 kg
» Chegou a hora de a Huawei largar aquela problemática webcam de teclado de seus laptops MateBook e MagicBook
Aorus Gaming Box GeForce RTX 2080 Ti: , 3.8 kg
» Aorus Gaming Box eGPU faz um forte argumento a favor da Thunderbolt sobre a alternativa proprietária Asus ROG XG Mobile
Intel NUC11PAQi7: Intel Iris Xe Graphics G7 96EUs, 0.6 kg
» O PC Core i7-1165G7 mais rápido disponível agora é mais de duas vezes mais rápido que o portátil Core i7-1165G7 mais lento
Asus ZenBook Duo 14 UX482EA: Intel Iris Xe Graphics G7 96EUs, 14.00", 1.6 kg
» O exclusivo ZenBook Duo ScreenPad da Asus está melhorando, mas ainda não está totalmente lá
Lenovo IdeaPad Slim 9i 14ITL5: Intel Iris Xe Graphics G7 96EUs, 14.00", 1.3 kg
» Lenovo IdeaPad Slim 9i Core i7-1165G7 tem desempenho de CPU mais lento que o do Yoga 9i Core i5-1135G7
Lenovo ThinkBook 14s Yoga ITL 20WE0023GE: Intel Iris Xe Graphics G7 96EUs, 14.00", 1.5 kg
» DDR4-3200 RAM limita o desempenho gráfico Tiger Lake - uma revisão do Lenovo ThinkBook 14s Yoga ITL
Asus Zenbook 14 UX435EG: NVIDIA GeForce MX450, 14.00", 1.3 kg
» 12-Watt GeForce MX450 bate os 25-Watt GeForce-MX350 - Testando o Asus ZenBook 14 UX435EG
Asus VivoBook S15 S533EQ-BQ002T: NVIDIA GeForce MX350, 15.60", 1.8 kg
» O Asus VivoBook S15 S533EQ vem com uma porta Thunderbolt 4
HP Spectre x360 14t-ea000: Intel Iris Xe Graphics G7 96EUs, 13.50", 1.3 kg
» HP Spectre x360 14 torna o Spectre x360 13 quase obsoleto, abre caminho para potenciais 3:2 EliteBooks
Dell XPS 13 9310 Core i7 FHD: Intel Iris Xe Graphics G7 96EUs, 13.40", 1.3 kg
» Razer Book 13 vs. Dell XPS 13 9310: Mesma CPU, Mesma tela, Grandes diferenças
HP Pavilion 13-bb0015cl: Intel Iris Xe Graphics G7 96EUs, 13.30", 1.2 kg
» O barato HP Pavilion não é mais tão ruim assim
Schenker Vision 15: Intel Iris Xe Graphics G7 96EUs, 15.60", 1.7 kg
» O Schenker Vision 15 (Intel NUC M15) é a melhor implementação até agora em Tiger Lake
Dell XPS 13 9310 Core i7 FHD: Intel Iris Xe Graphics G7 96EUs, 13.40", 1.3 kg
» Tiger Lake Dell XPS 13 9310 vs. Asus ZenBook 14 UX425EA: a diferença da Política de Energia Dinâmica
Asus ZenBook Flip S UX371: Intel Iris Xe Graphics G7 96EUs, 13.30", 1.2 kg
» O Asus ZenBook UX371 com o Painel OLED precisa de alguns aperfeiçoamentos
Asus ExpertBook B9 B9400CE-KC0166R: Intel Iris Xe Graphics G7 96EUs, 14.00", 1 kg
» Caros fabricantes, os usuários querem câmeras web melhores!