Dell Precision 5470 revisão da estação de trabalho: Nvidia RTX A1000 debut
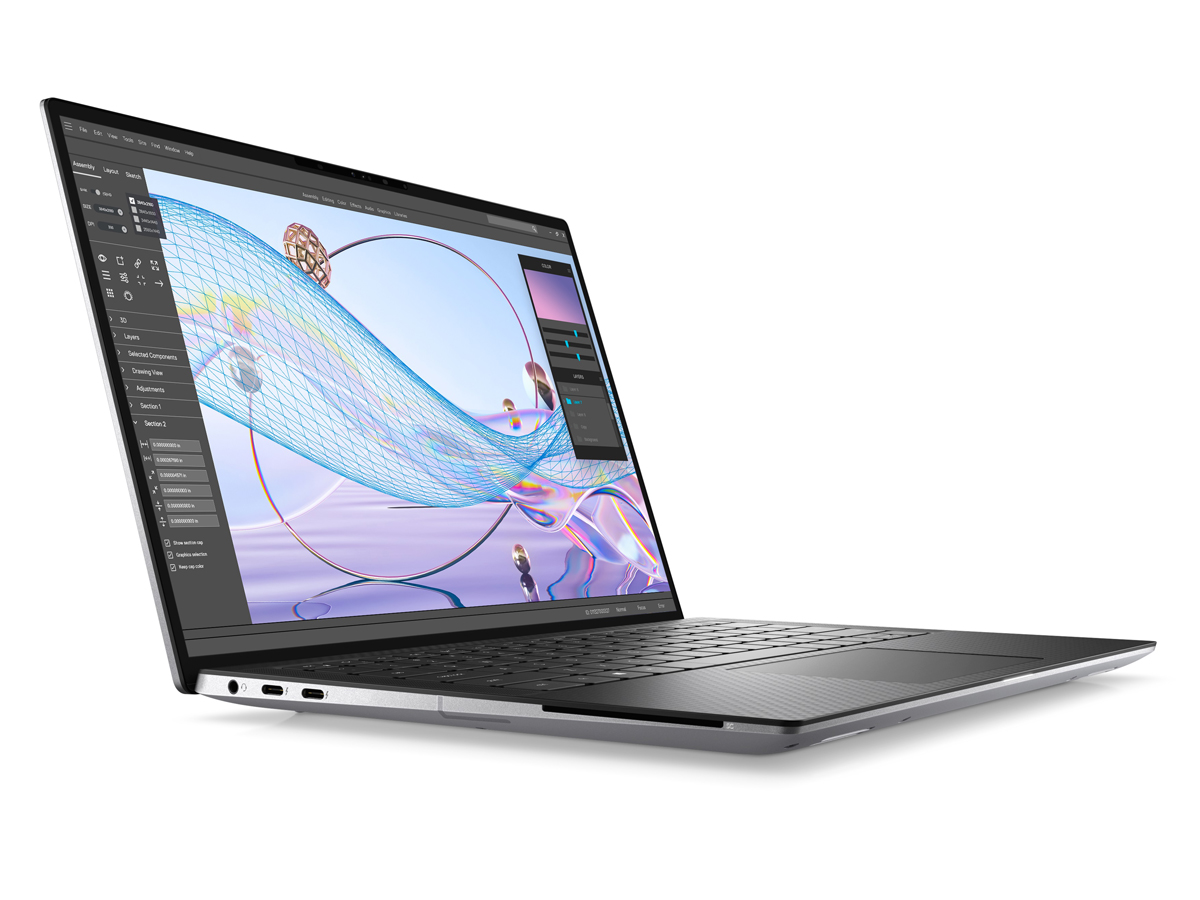
O Precision 5470 é a menor estação de trabalho móvel da Dell até agora. Muito parecido com o XPS 17-inspirado Precision 5750 e XPS 15-inspirados Precision 5560o XPS 13 9300/9310, de 14 polegadas Precision 5470 é inspirado pelo XPS 13 9300/9310 em termos de aparência e design. Se você já brincou com um sistema XPS no passado, então o Precision 5470 deve parecer e se sentir muito familiarizado.
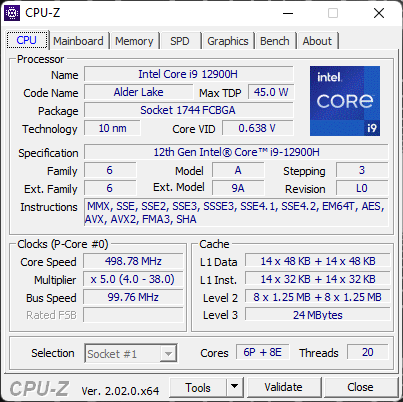
Os dois fatores distintivos do Precision 5470 estão relacionados com sua CPU da série H do 12º gen Core e GPU opcional Nvidia RTX A1000 para uma imensa quantidade de poder de processamento considerando o fator de forma de 14 polegadas. Nossa unidade de revisão particular vem com a CPU Core i9-12900H, GPU A1000 e tela sensível ao toque brilhante de 1600p por aproximadamente $3000 USD no varejo. Outras SKUs com a i5-12500H a i7-12800H, somente gráficos Iris Xe integrados, e tela mate 1200p também estão disponíveis para preços iniciais mais baixos.
Os concorrentes diretos incluem outras estações de trabalho móveis high-end de 14 polegadas, como o HP ZBook Firefly 14 ou Lenovo ThinkPad P14s. Esta categoria de tamanho ainda é nova quando se trata de estações de trabalho e, portanto, também estaremos comparando o Precision 5470 com alguns modelos maiores, em vez disso, como o PensePad P15 G2 ou da própria Dell Precision 5560.
Mais críticas da Dell:
Possíveis concorrentes em comparação
Avaliação | Data | Modelo | Peso | Altura | Size | Resolução | Preço |
|---|---|---|---|---|---|---|---|
| 87.6 % v7 (old) | 09/2022 | Dell Precision 5000 5470 i9-12900H, RTX A1000 Laptop GPU | 1.6 kg | 18.95 mm | 14.00" | 2560x1600 | |
| 86.2 % v7 (old) | 06/2022 | Lenovo ThinkPad P15v G2 21A9000XGE i7-11800H, T1200 Laptop GPU | 2.3 kg | 22.7 mm | 15.60" | 1920x1080 | |
| 88.3 % v7 (old) | 10/2021 | Dell Precision 5000 5560 i7-11850H, RTX A2000 Laptop GPU | 2 kg | 18 mm | 15.60" | 3840x2400 | |
| 85.2 % v7 (old) | 09/2021 | Lenovo ThinkPad P14s G2 AMD R7 PRO 5850U, Vega 8 | 1.5 kg | 17.9 mm | 14.00" | 3840x2160 | |
| 85.2 % v7 (old) | 04/2021 | HP ZBook Firefly 14 G8 2C9Q2EA i7-1165G7, T500 Laptop GPU | 1.4 kg | 17.9 mm | 14.00" | 1920x1080 | |
| 82.4 % v7 (old) | 01/2021 | HP ZBook Firefly 14 G7 i7-10610U, Quadro P520 | 1.4 kg | 17.9 mm | 14.00" | 1920x1080 |
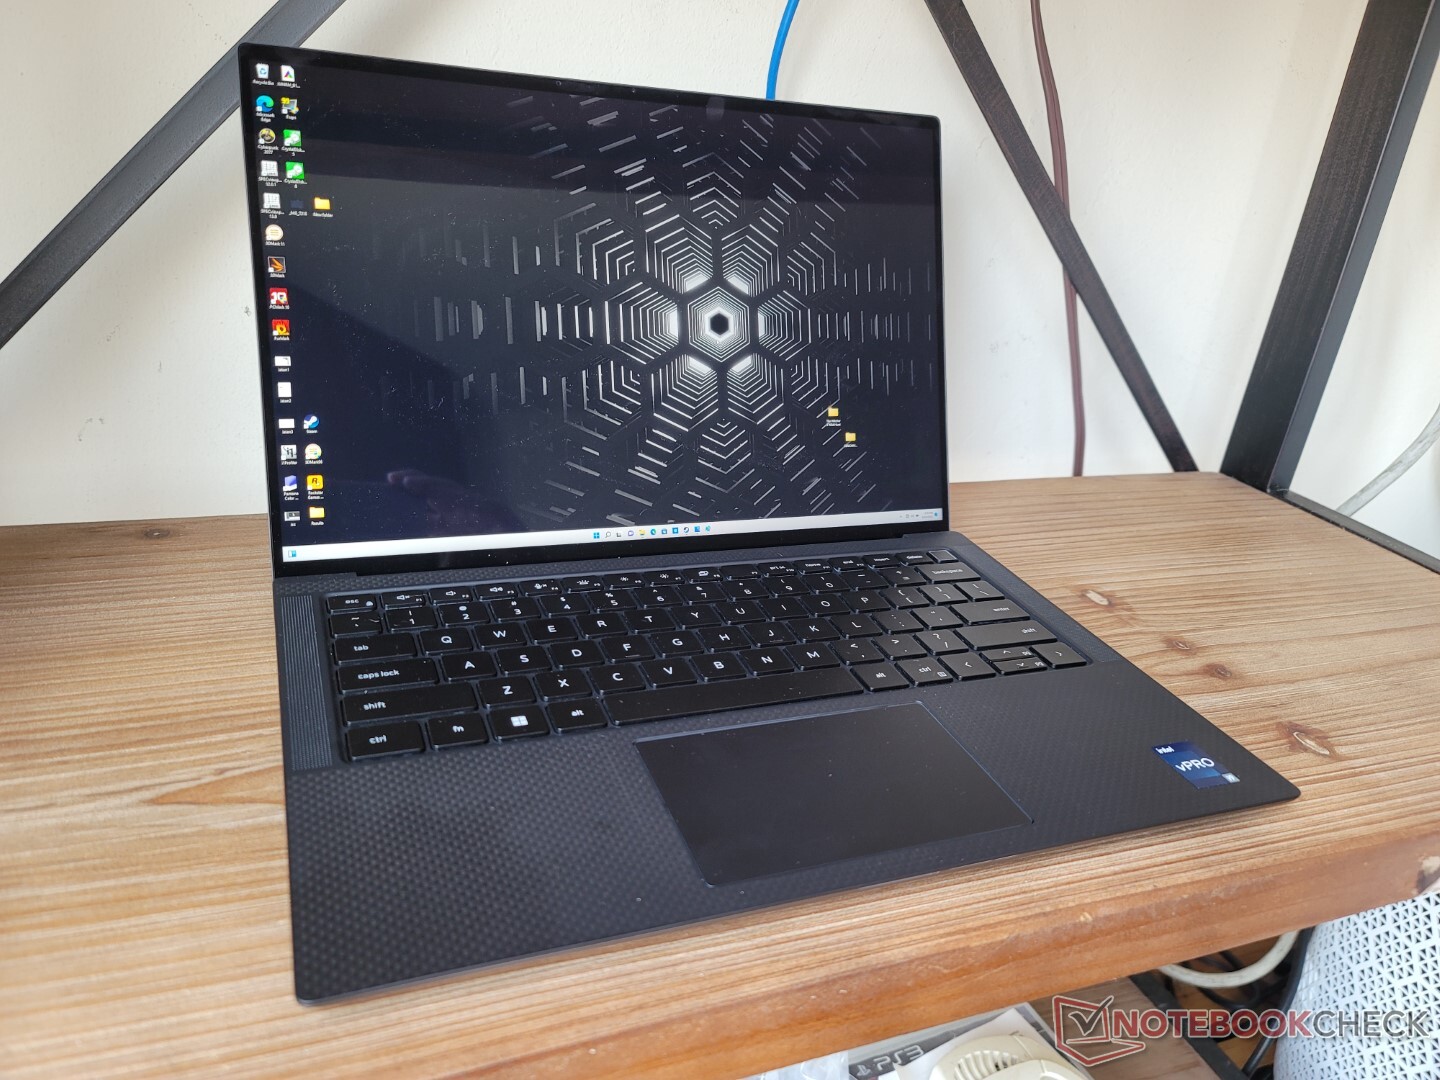
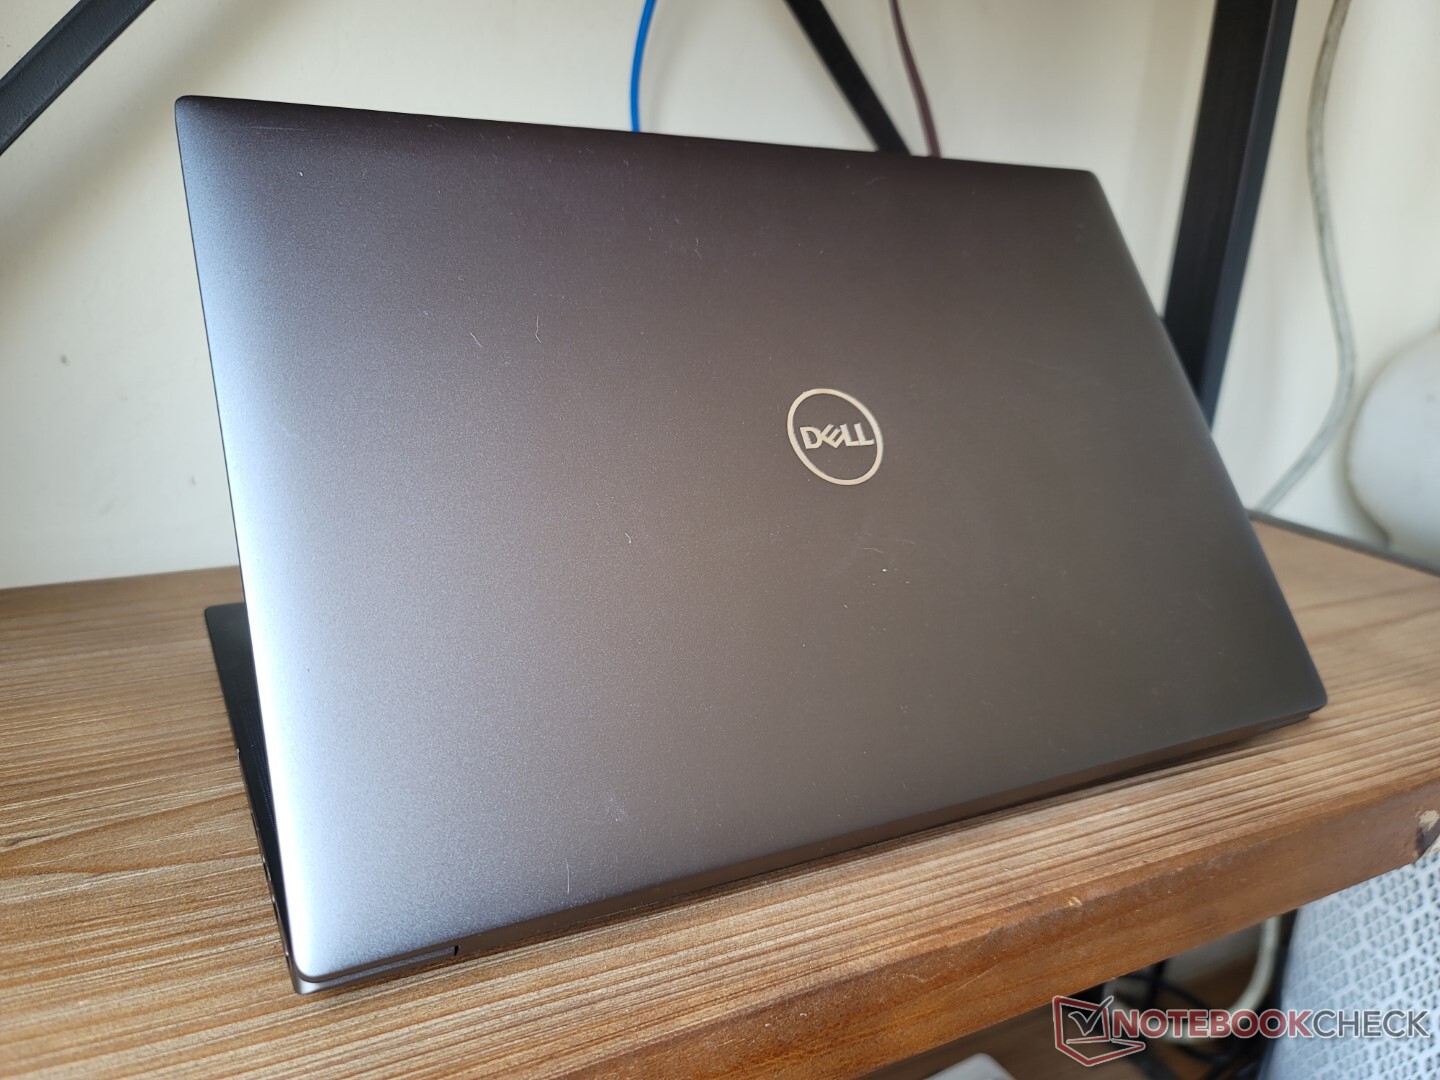
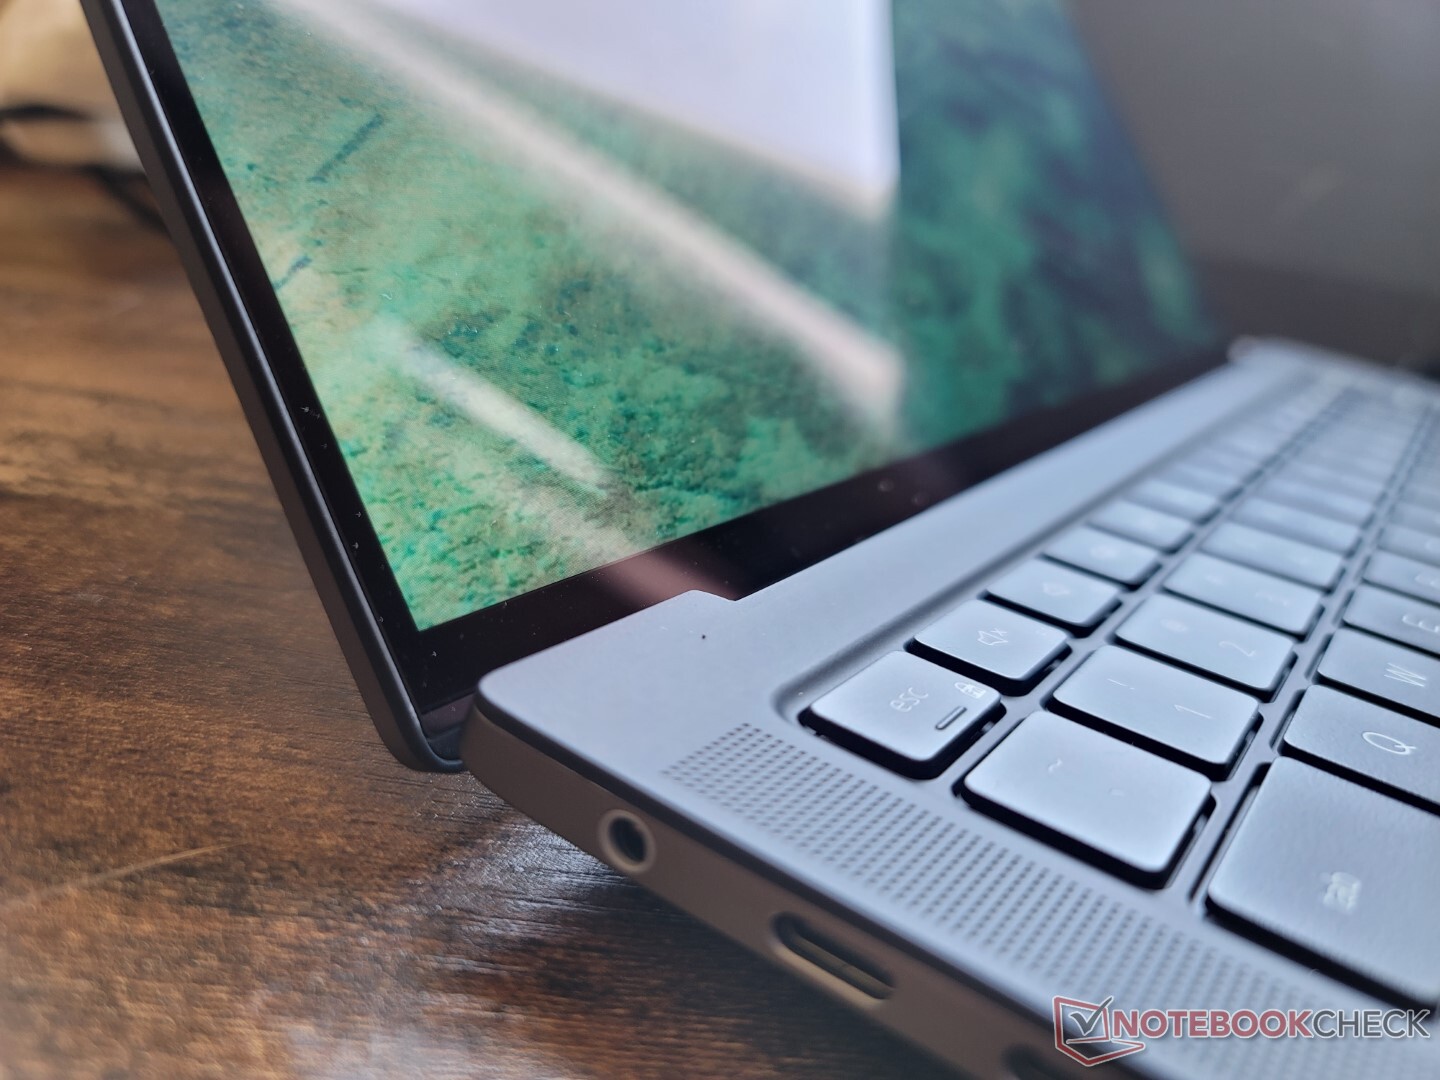
Estojo - XPS Look And Feel
Não há nenhum XPS 14 no momento da redação, mas o Precision 5470 é essencialmente o precursor de um. Ele se situa confortavelmente entre o clássico XPS 13 e 15 polegadas XPS 15 enquanto utiliza o mesmo invólucro de liga de magnésio cinza e deck de fibra de carbono que se tornaram padrão nos modelos XPS.
A qualidade do chassi é excelente apenas com pequenos rangidos ou deformações quando se tenta torcer ou dobrar suas superfícies. Certamente se sente mais forte e mais profissional do que o novo XPS 13 9320 projeto. No entanto, as dobradiças poderiam ter sido mais rígidas ou mais rígidas para uma melhor sensação de longevidade.
O 14 polegadas Precision 5470 é maior e mais pesado que o XPS 13 9300 de 13 polegadas por margens perceptíveis. É ainda um pouco mais espesso que o XPS 15, estando mais próximo do XPS 15 em peso do que do XPS 13. Ainda assim, é muito compacto para sua classe, especialmente em termos de pegada quando comparado ao HP Firefly 14 G8 ou ThinkPad P14s.
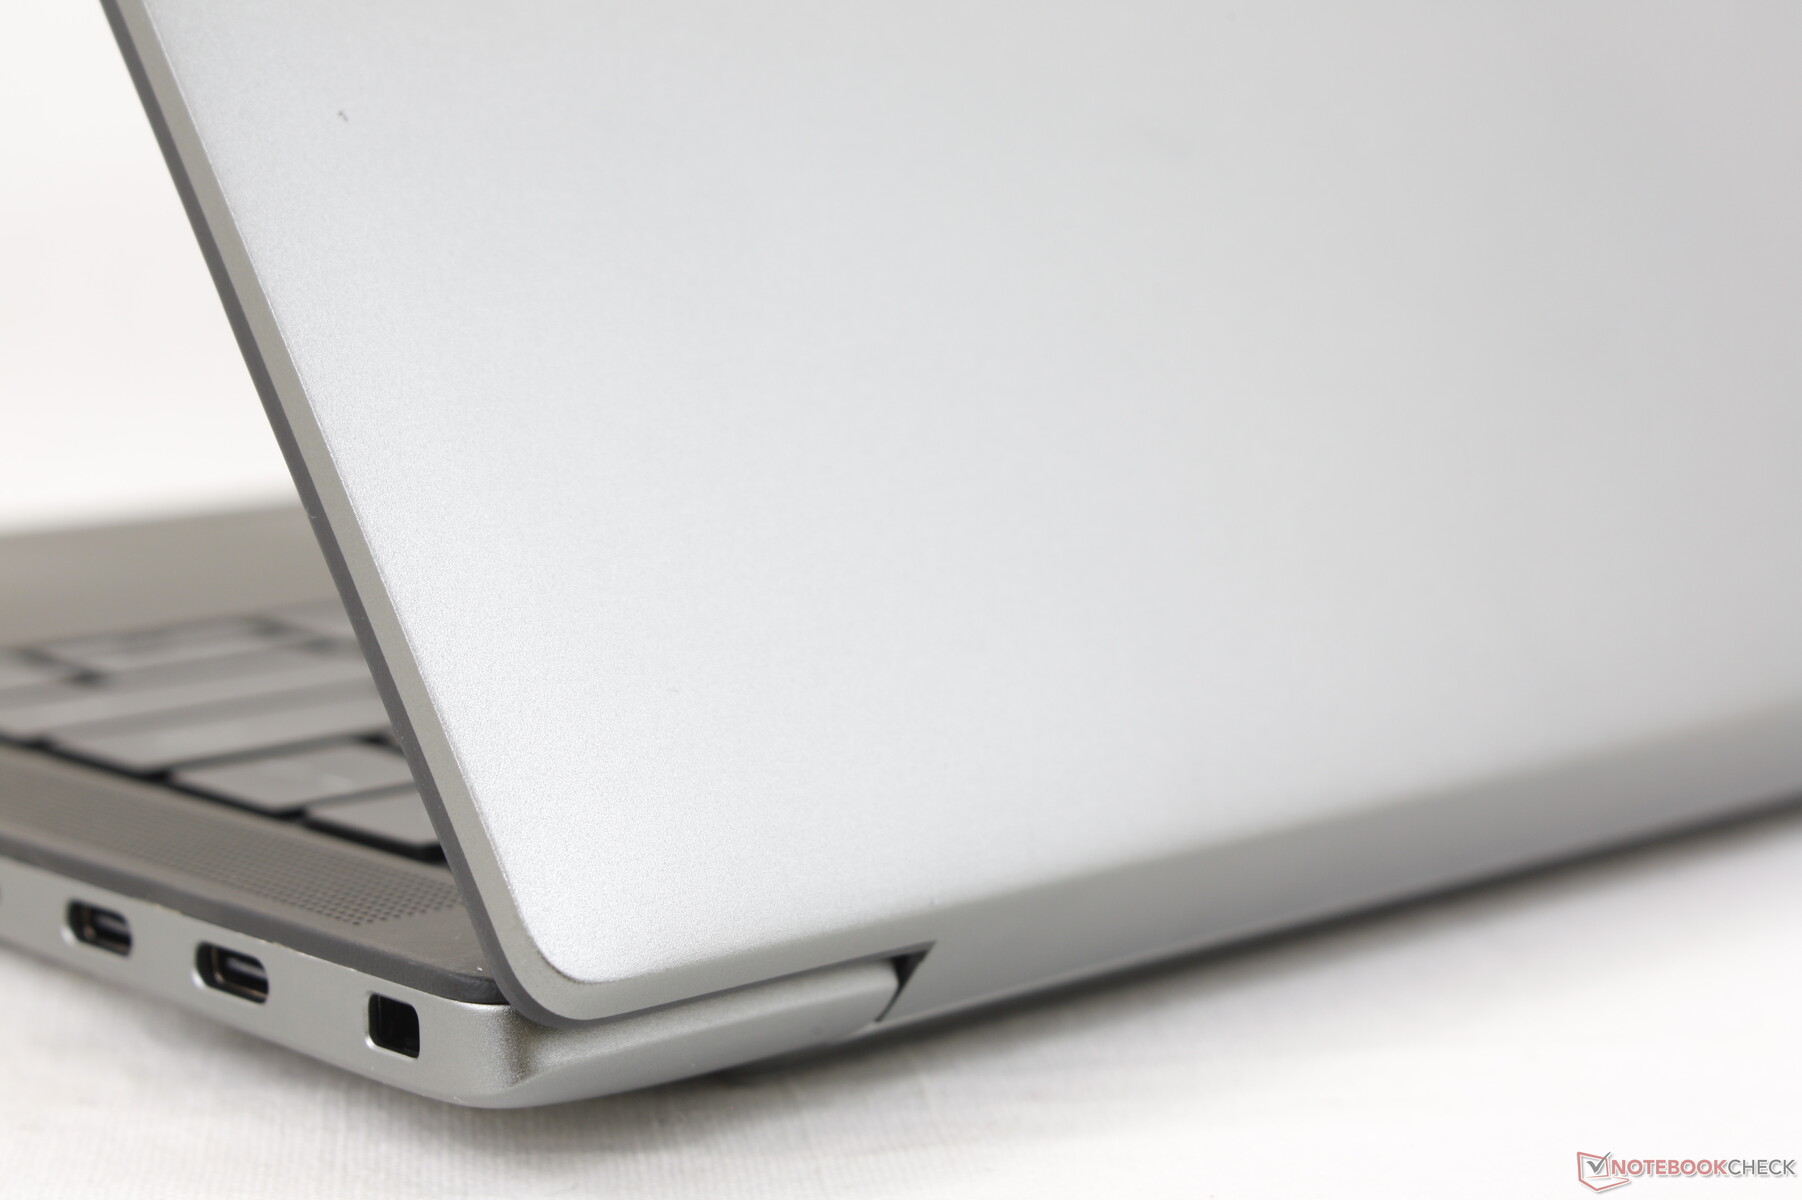
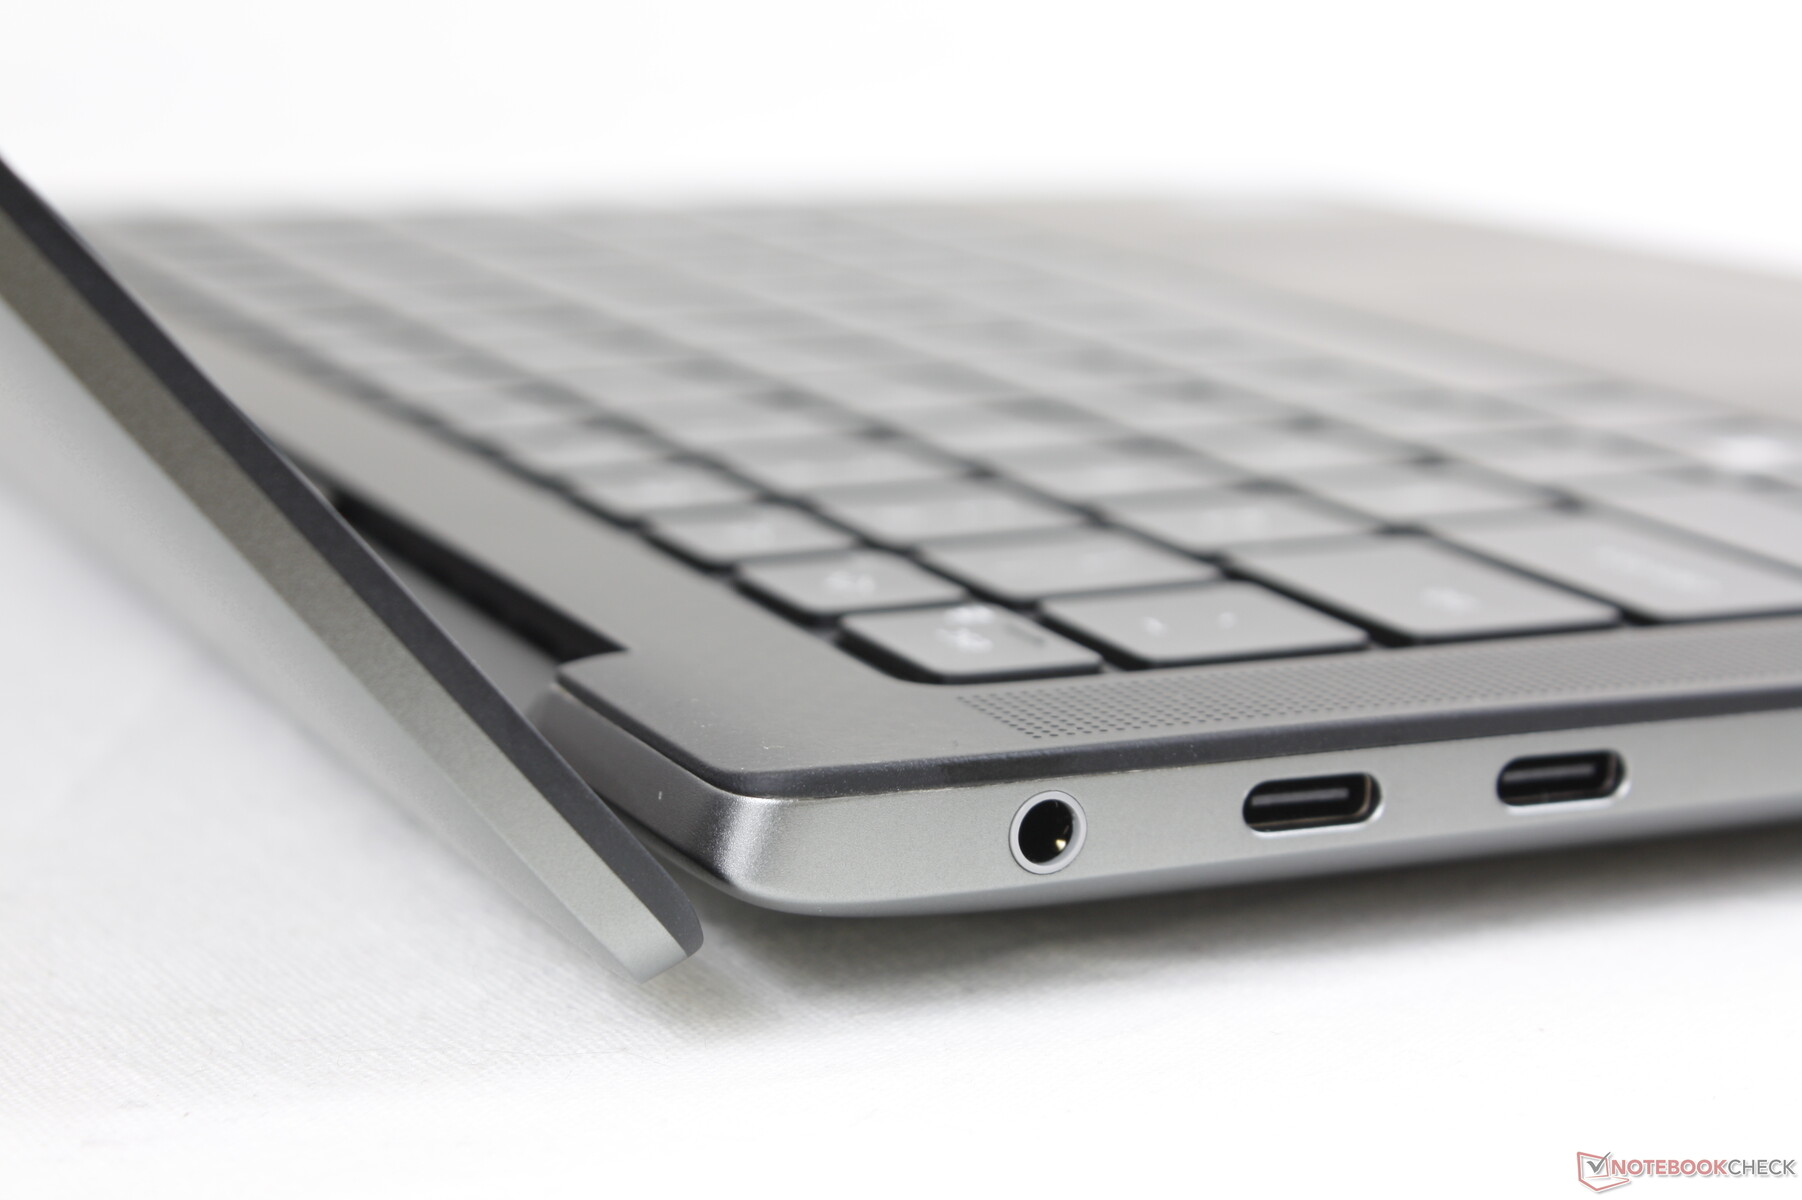
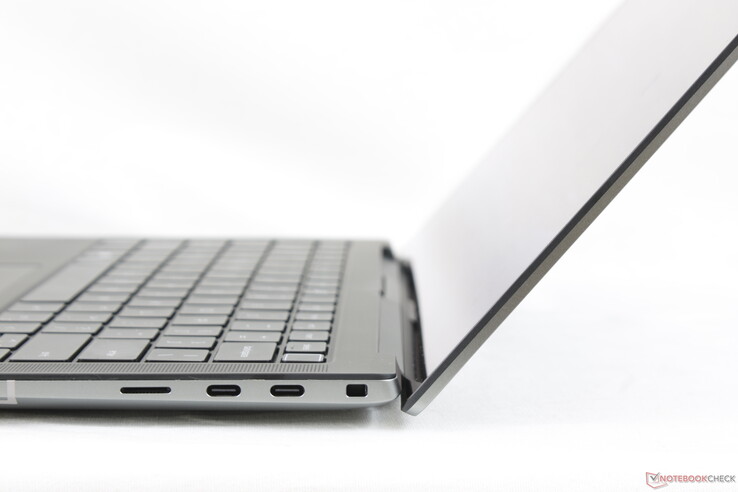
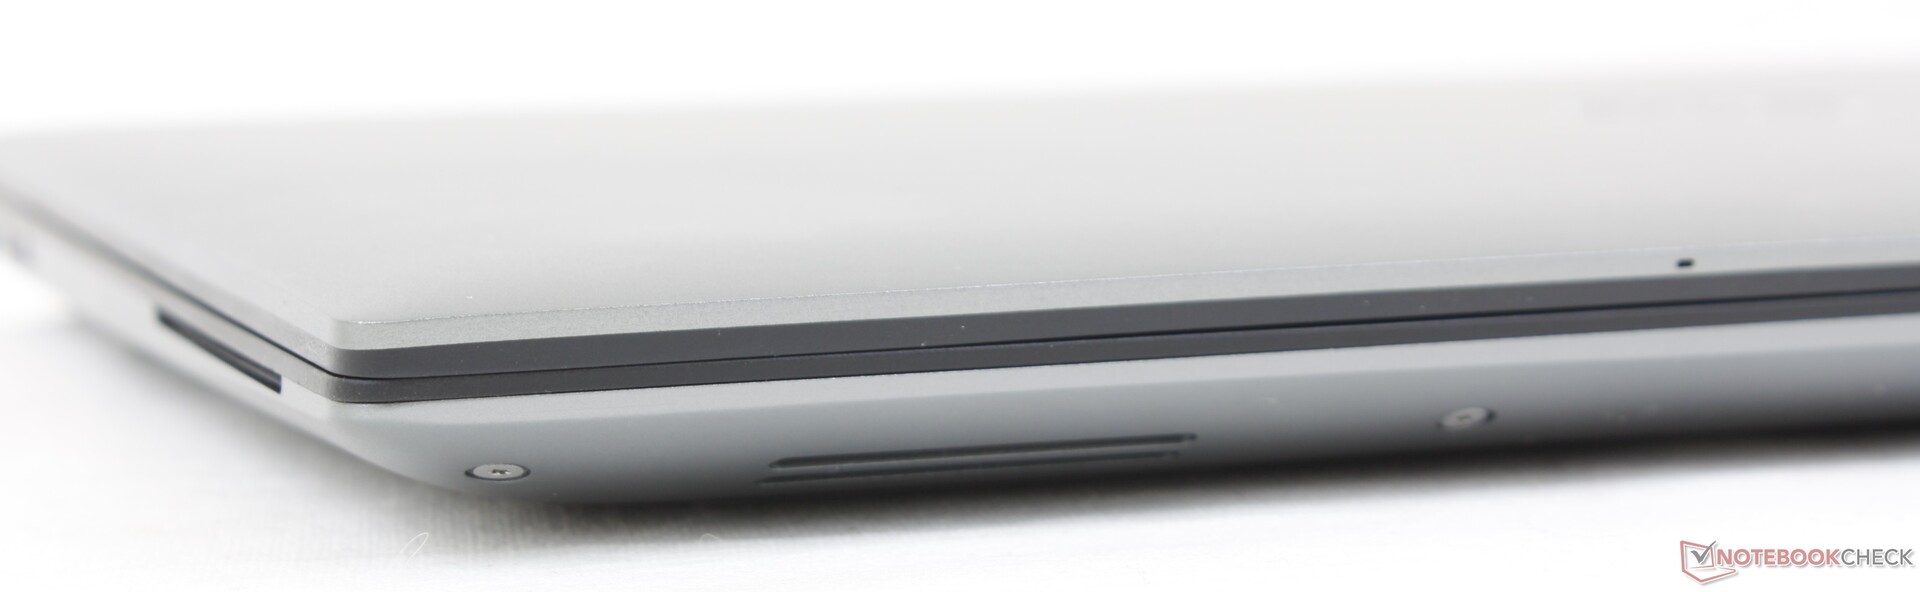
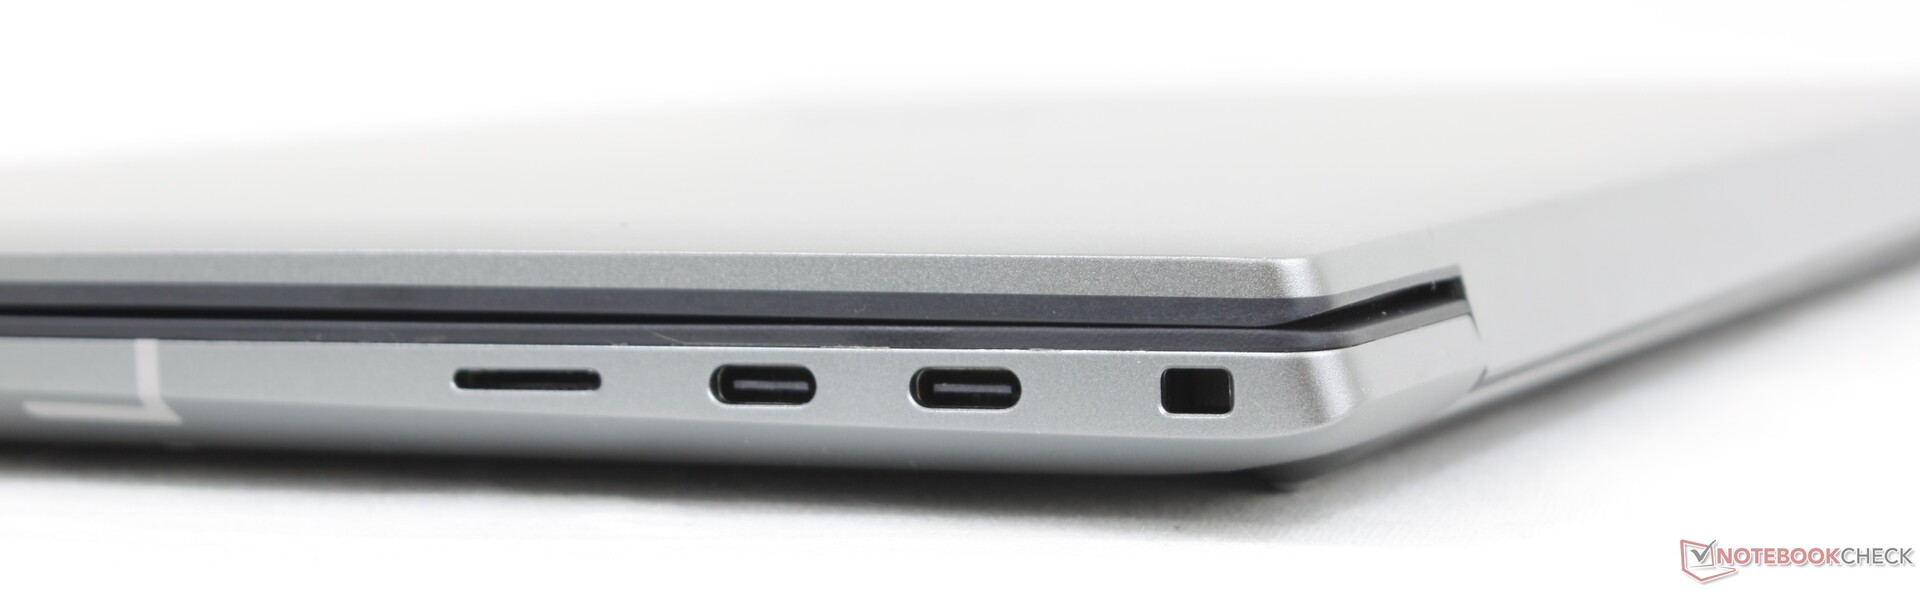
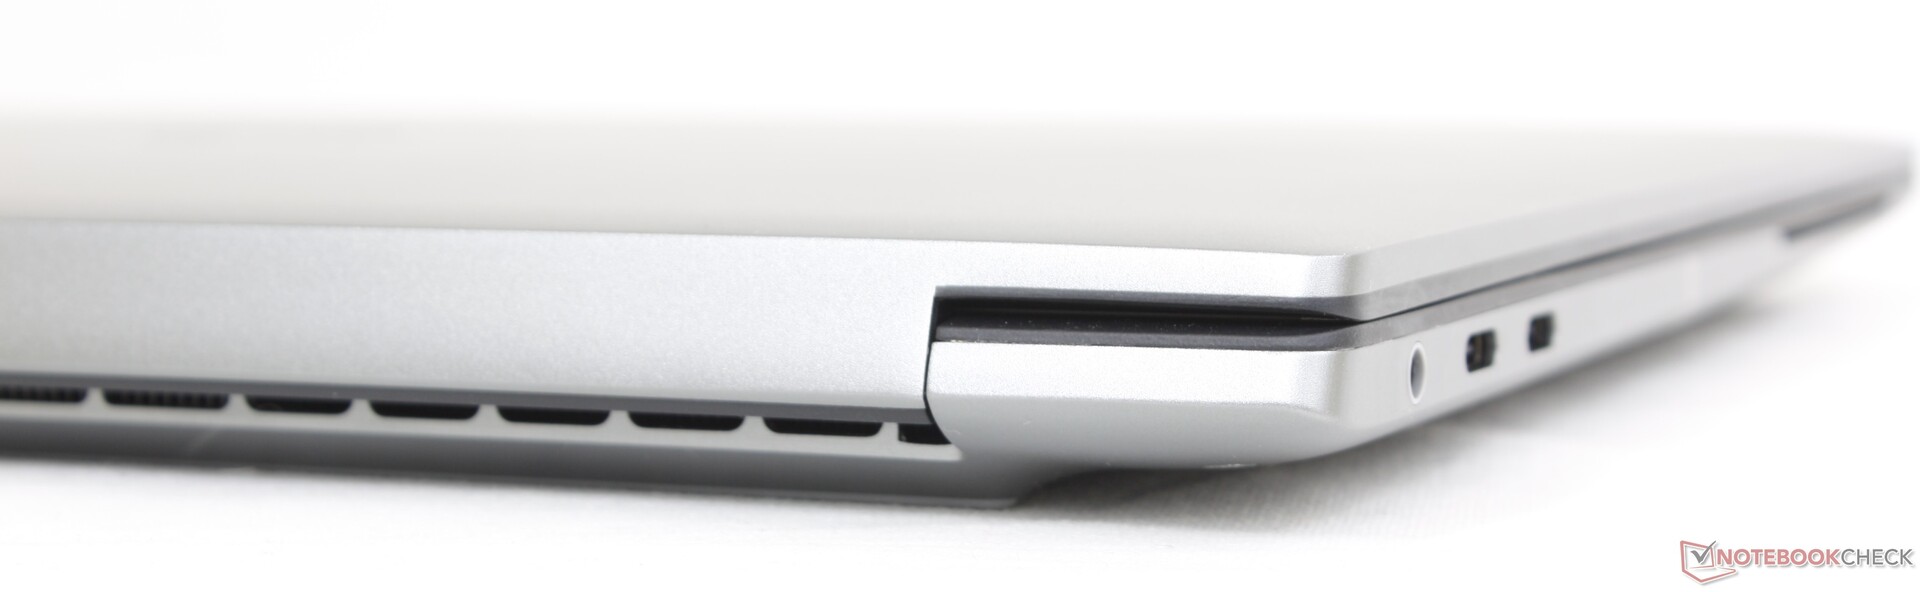
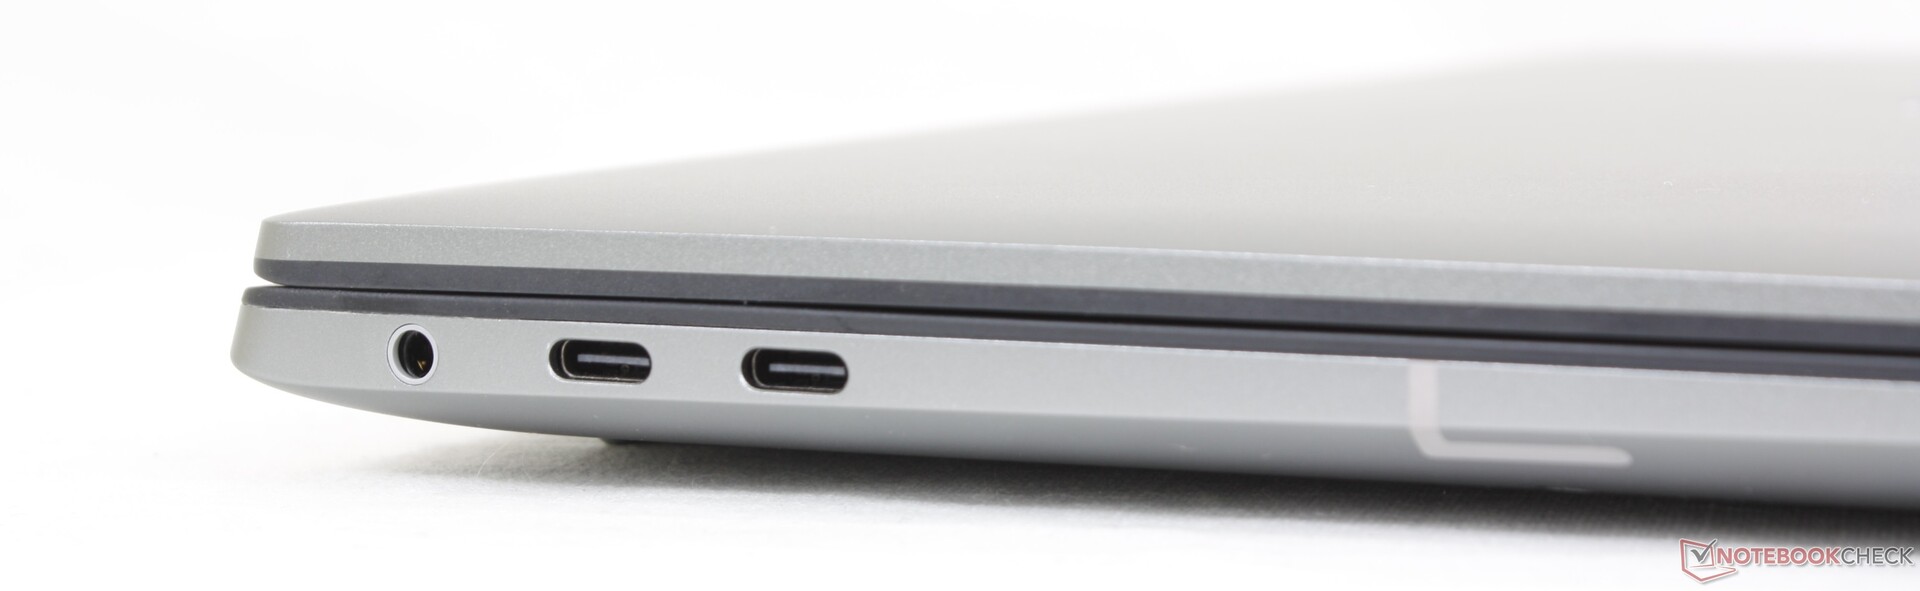
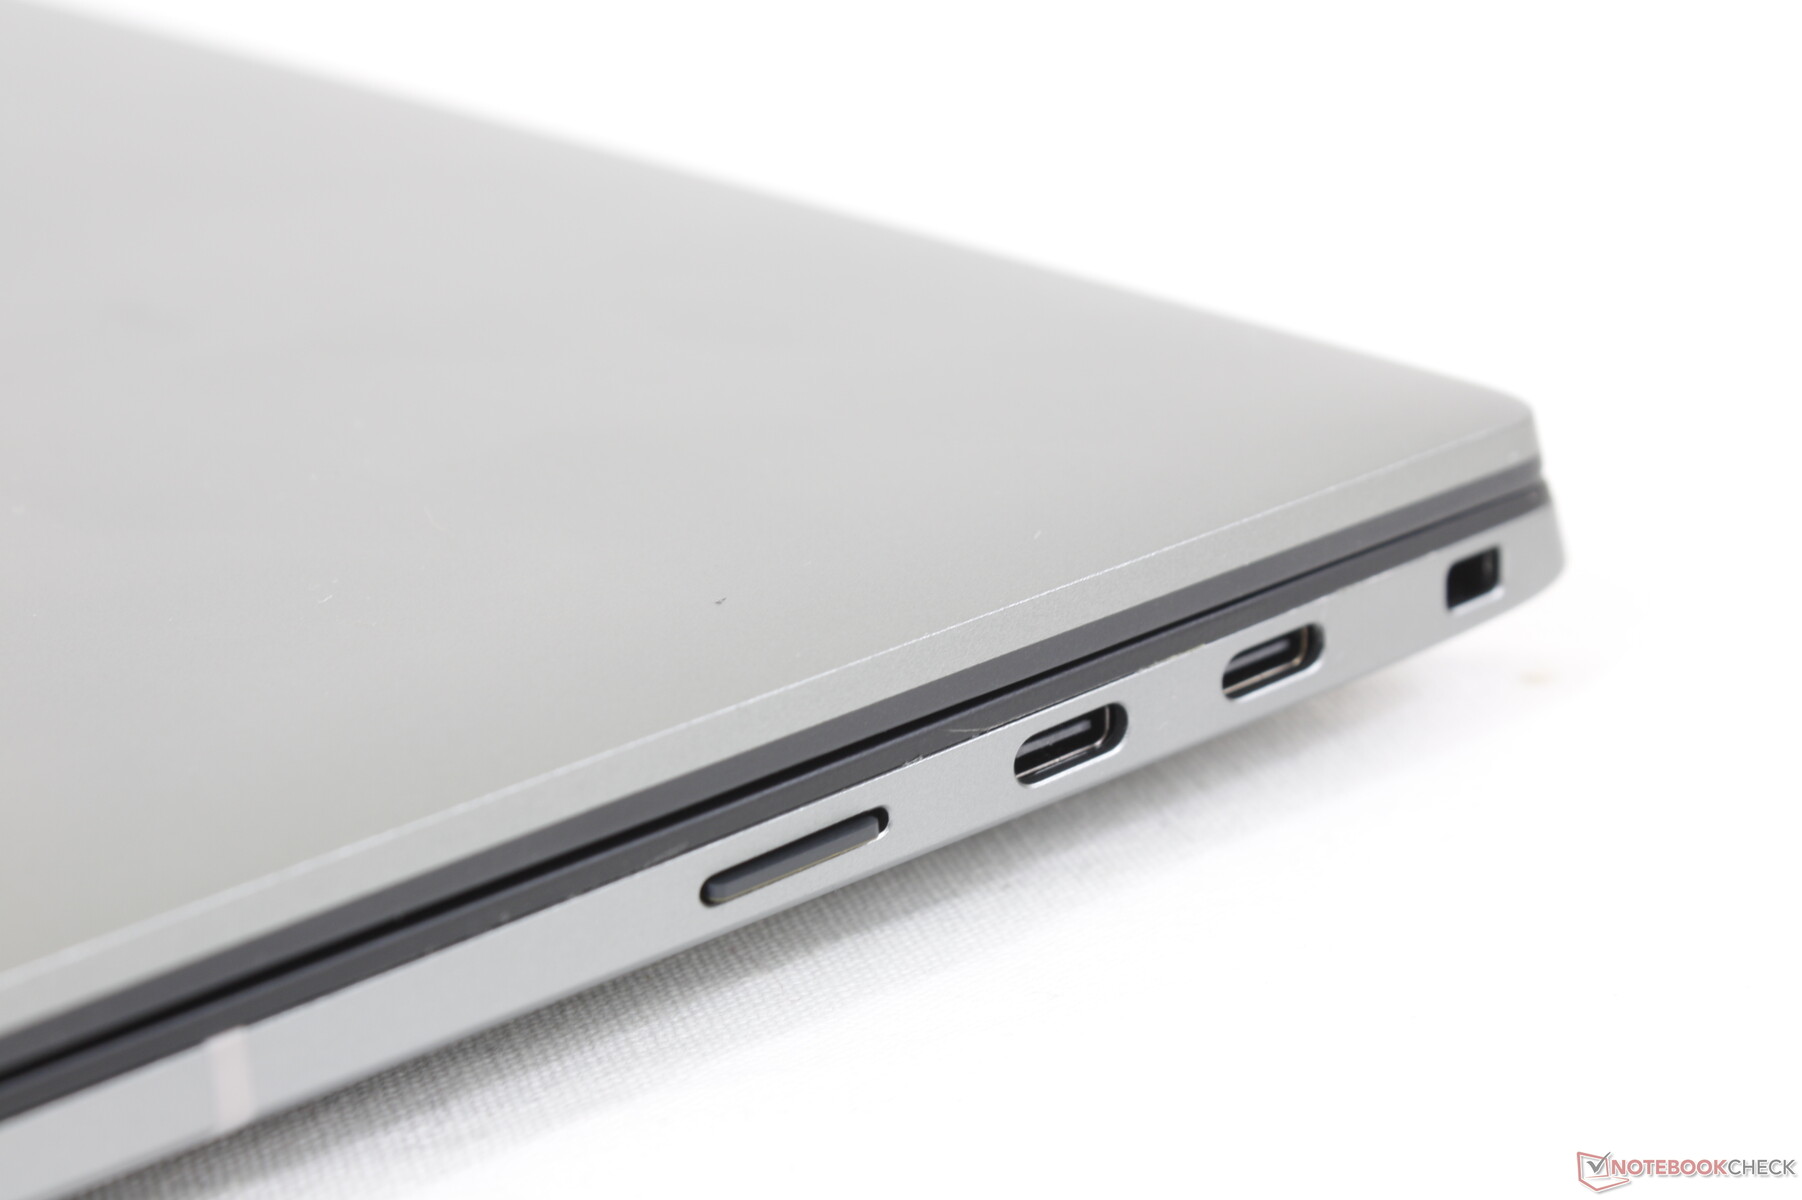
Conectividade - Somente USB-C
As opções de porta são limitadas apenas ao USB-C, enquanto a maioria das estações de trabalho tem uma variedade muito maior. Precision espera-se, portanto, que 5470 proprietários confiem em adaptadores ou estações de acoplamento para conectar a maioria dos dispositivos.
Leitor de cartões SD
As taxas de transferência do leitor de cartões integrado são muito rápidas a quase 230 MB/s de nosso cartão de teste UHS-II. Dependendo do tamanho do arquivo envolvido, entretanto, as taxas de transferência reais podem ser mais baixas. A movimentação de 1 GB de imagens (~4 MB cada) é mais lenta e leva cerca de 13 segundos.
| SD Card Reader | |
| average JPG Copy Test (av. of 3 runs) | |
| Dell Precision 5000 5560 (AV Pro V60) | |
| Lenovo ThinkPad P15v G2 21A9000XGE | |
| Dell Precision 5000 5470 (AV Pro V60) | |
| Lenovo ThinkPad P14s G2 AMD (AV PRO V60) | |
| maximum AS SSD Seq Read Test (1GB) | |
| Lenovo ThinkPad P15v G2 21A9000XGE | |
| Dell Precision 5000 5470 (AV Pro V60) | |
| Dell Precision 5000 5560 (AV Pro V60) | |
| Lenovo ThinkPad P14s G2 AMD (AV PRO V60) | |
Comunicação
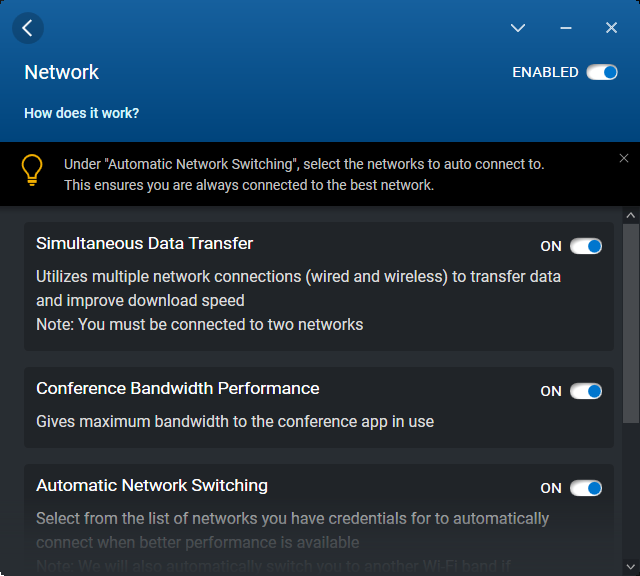
Um Intel AX211 vem como padrão para conectividade Wi-Fi 6E e Bluetooth 5.2. Embora não tenhamos tido problemas perceptíveis, as taxas de transmissão seriam mais lentas e variáveis do que o esperado.
| Networking | |
| iperf3 transmit AX12 | |
| Lenovo ThinkPad P15v G2 21A9000XGE | |
| HP ZBook Firefly 14 G8 2C9Q2EA | |
| HP ZBook Firefly 14 G7 | |
| Dell Precision 5000 5560 | |
| Lenovo ThinkPad P14s G2 AMD | |
| iperf3 receive AX12 | |
| HP ZBook Firefly 14 G8 2C9Q2EA | |
| Lenovo ThinkPad P15v G2 21A9000XGE | |
| Dell Precision 5000 5560 | |
| HP ZBook Firefly 14 G7 | |
| Lenovo ThinkPad P14s G2 AMD | |
| iperf3 receive AXE11000 6GHz | |
| Dell Precision 5000 5470 | |
| iperf3 transmit AXE11000 6GHz | |
| Dell Precision 5000 5470 | |
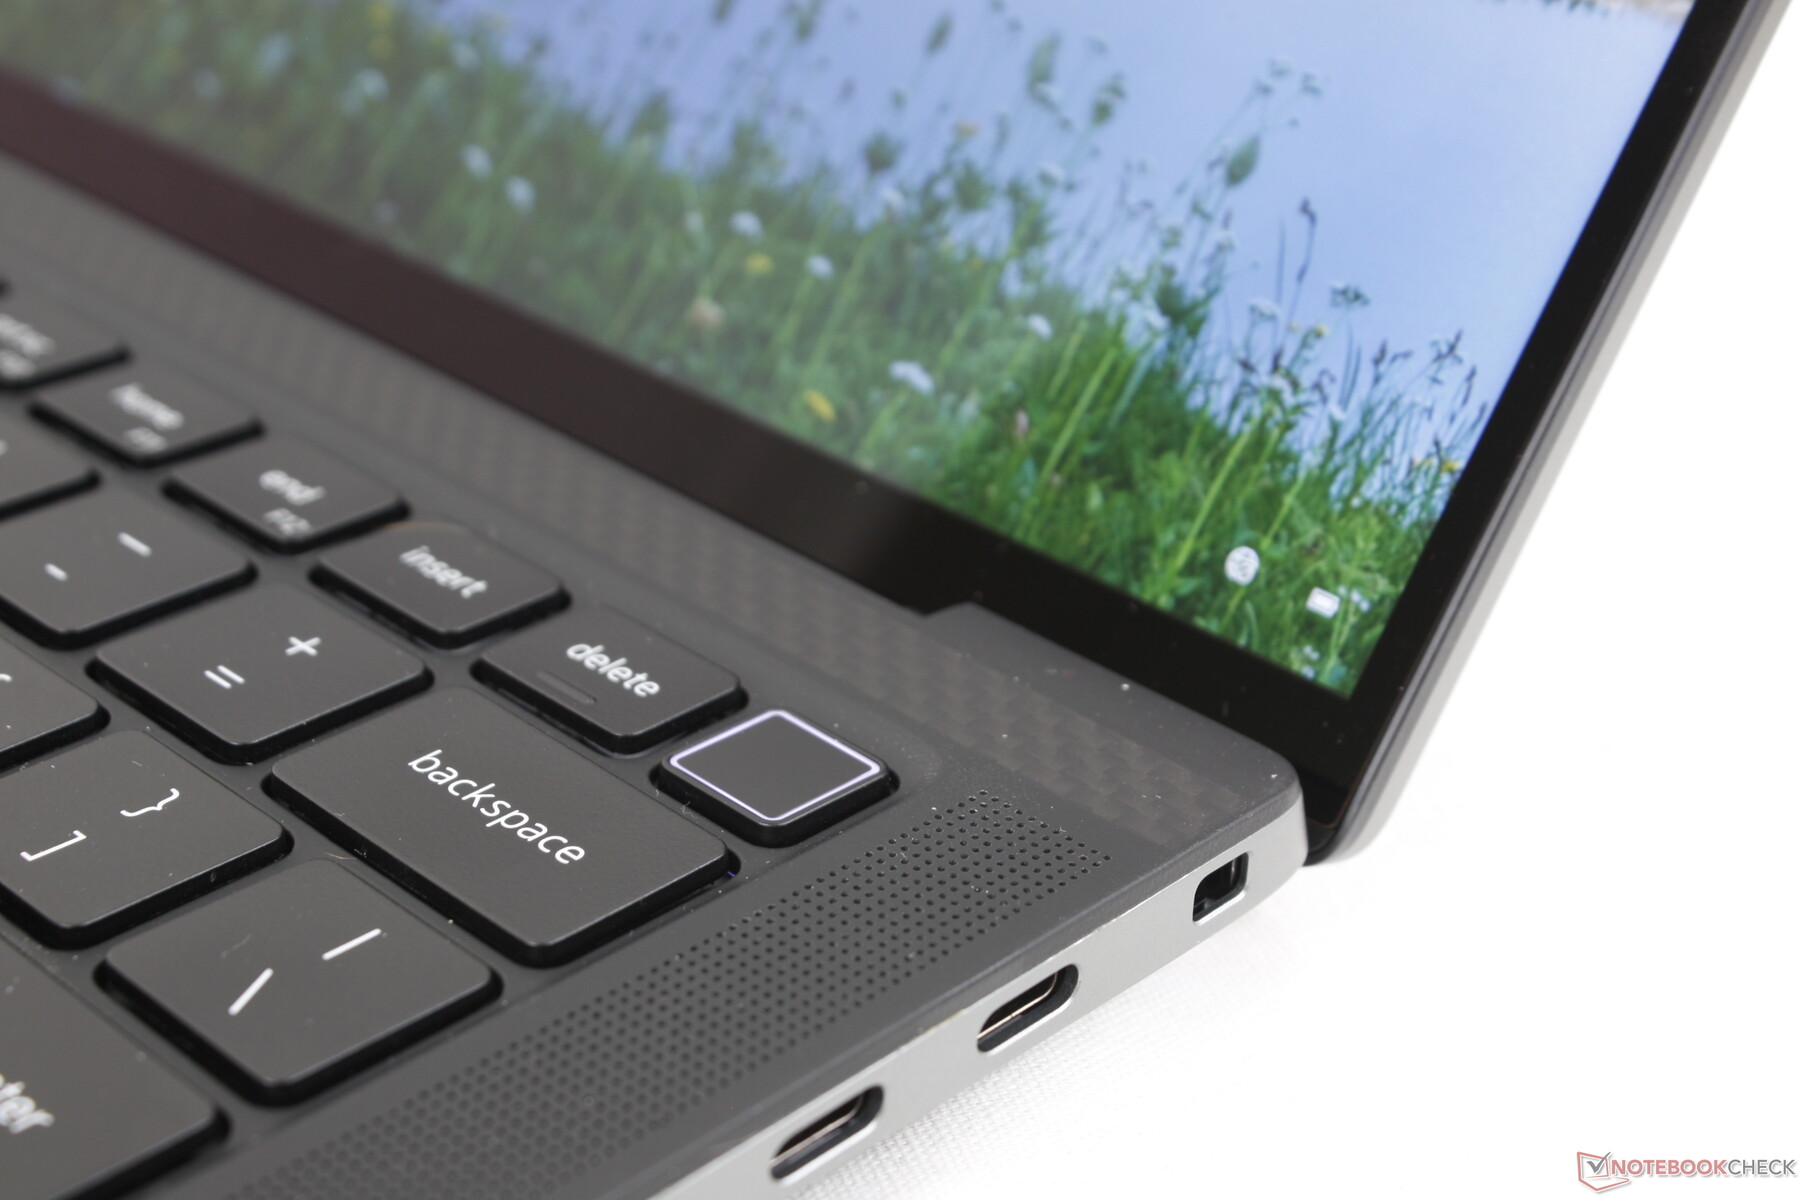
Webcam
A webcam é limitada a apenas 1 MP ou 720p, enquanto a maioria dos outros laptops já passou para 2 MP ou mesmo 5 MP, como é o caso de muitos laptops HP high-end. A qualidade da imagem é muito parecida com a da webcam da série XPS 13
IR está presente para suporte do Hello, mas não há obturador da webcam para privacidade.


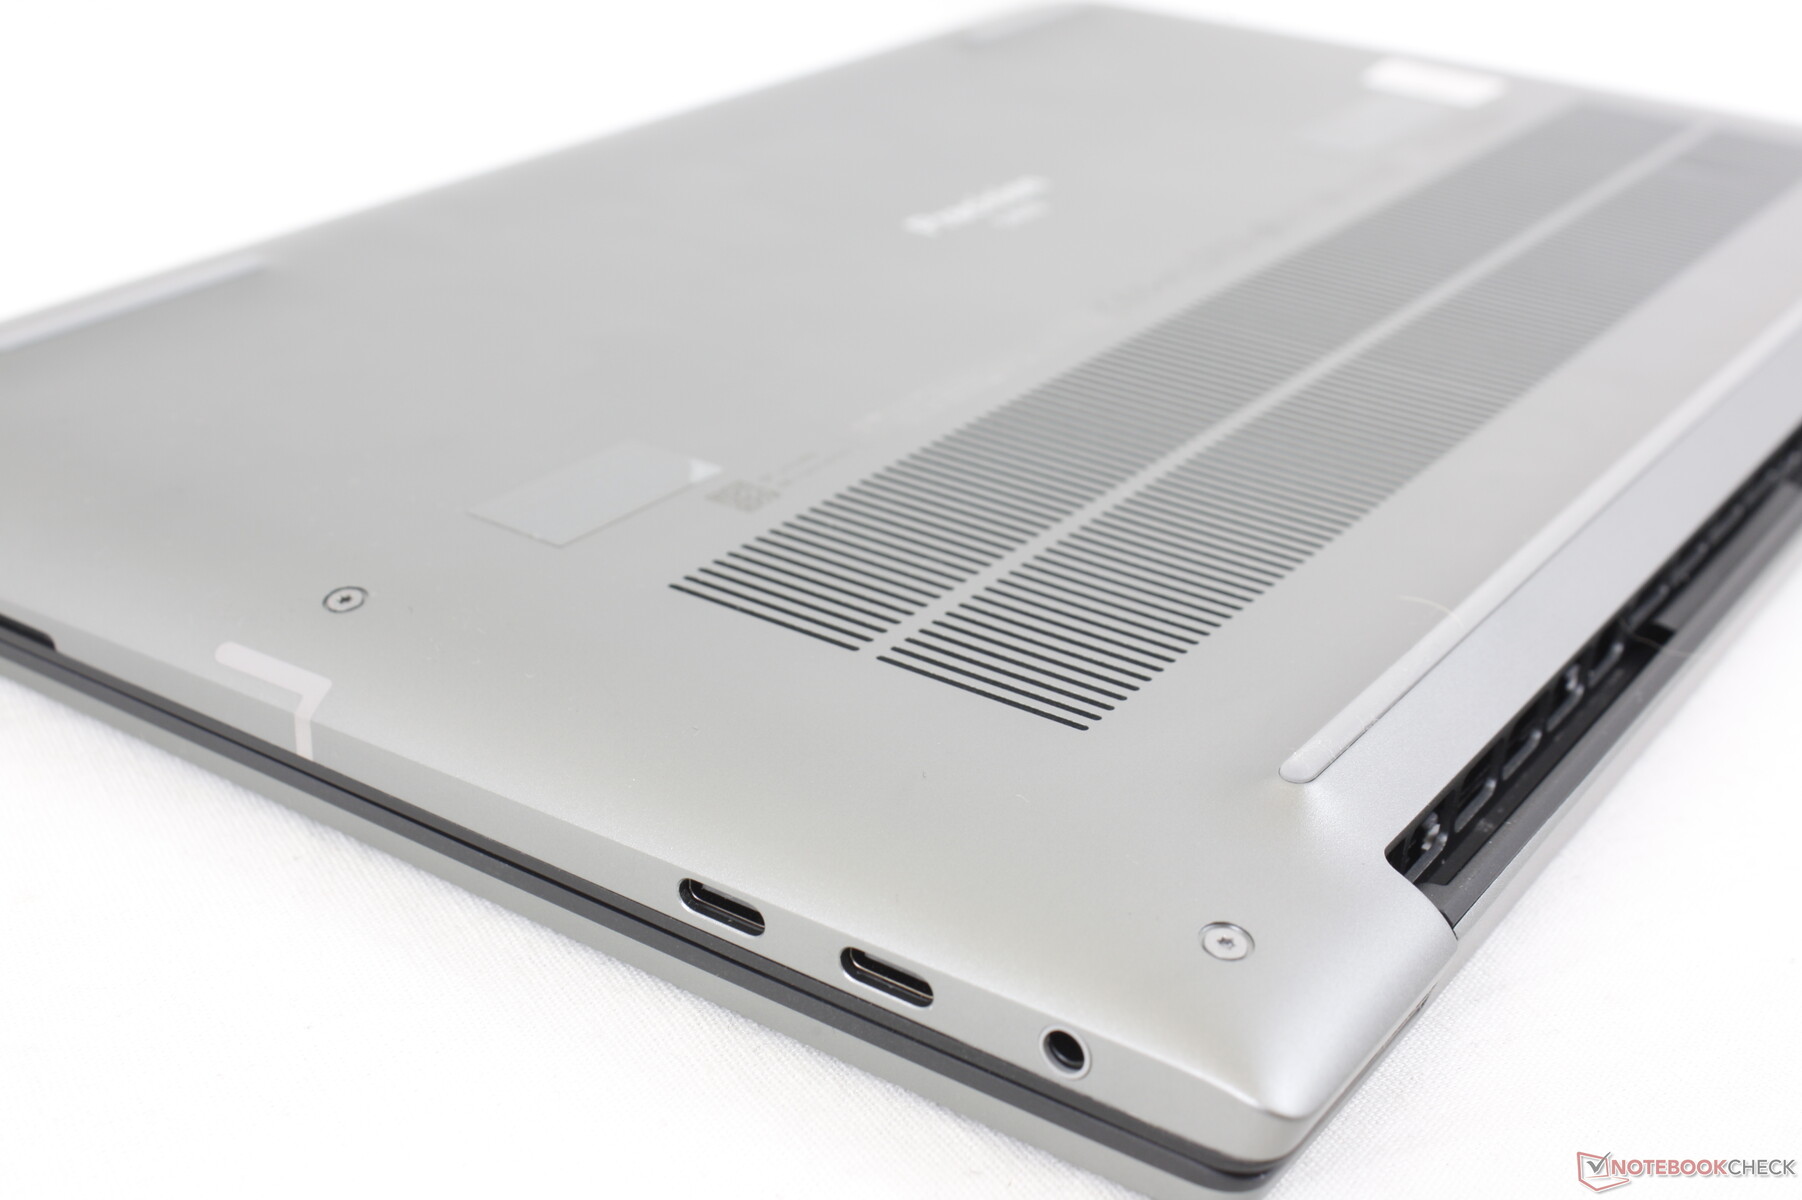
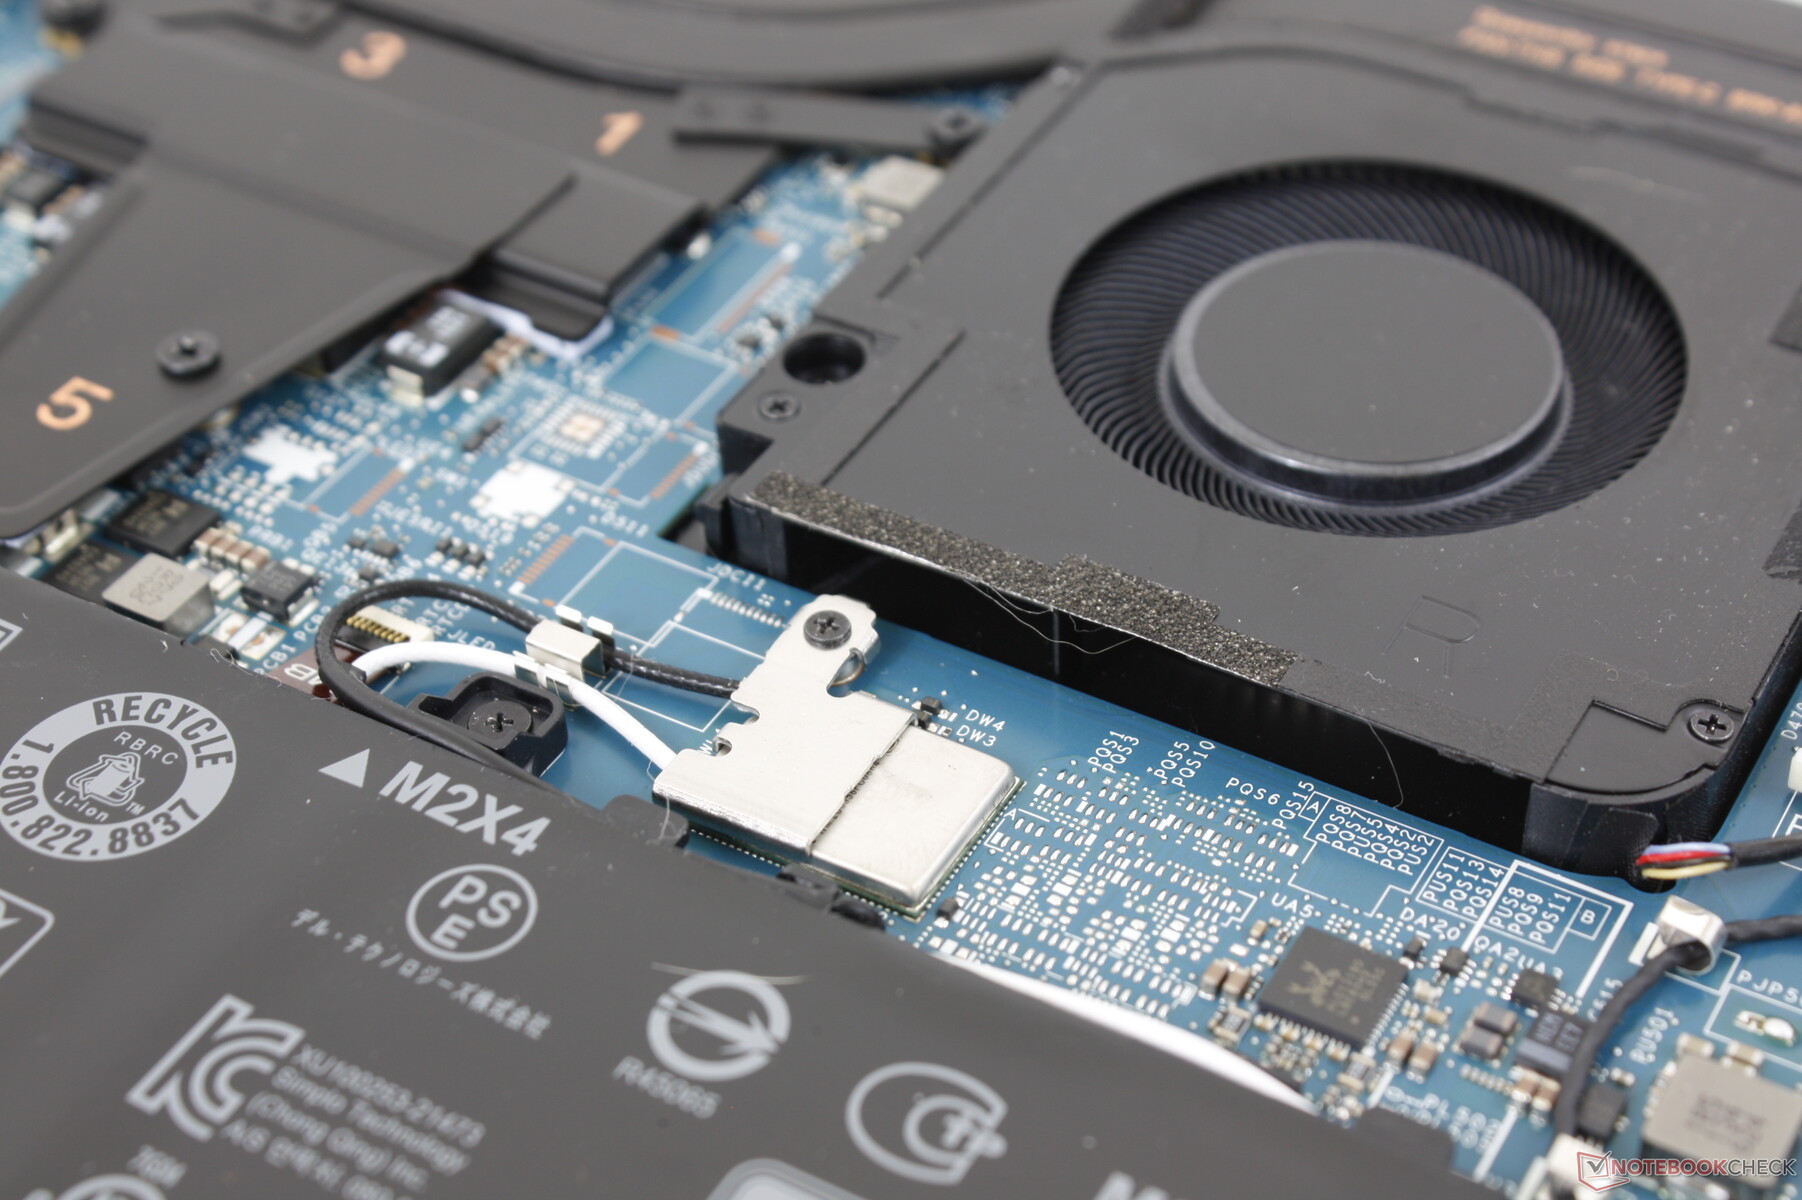
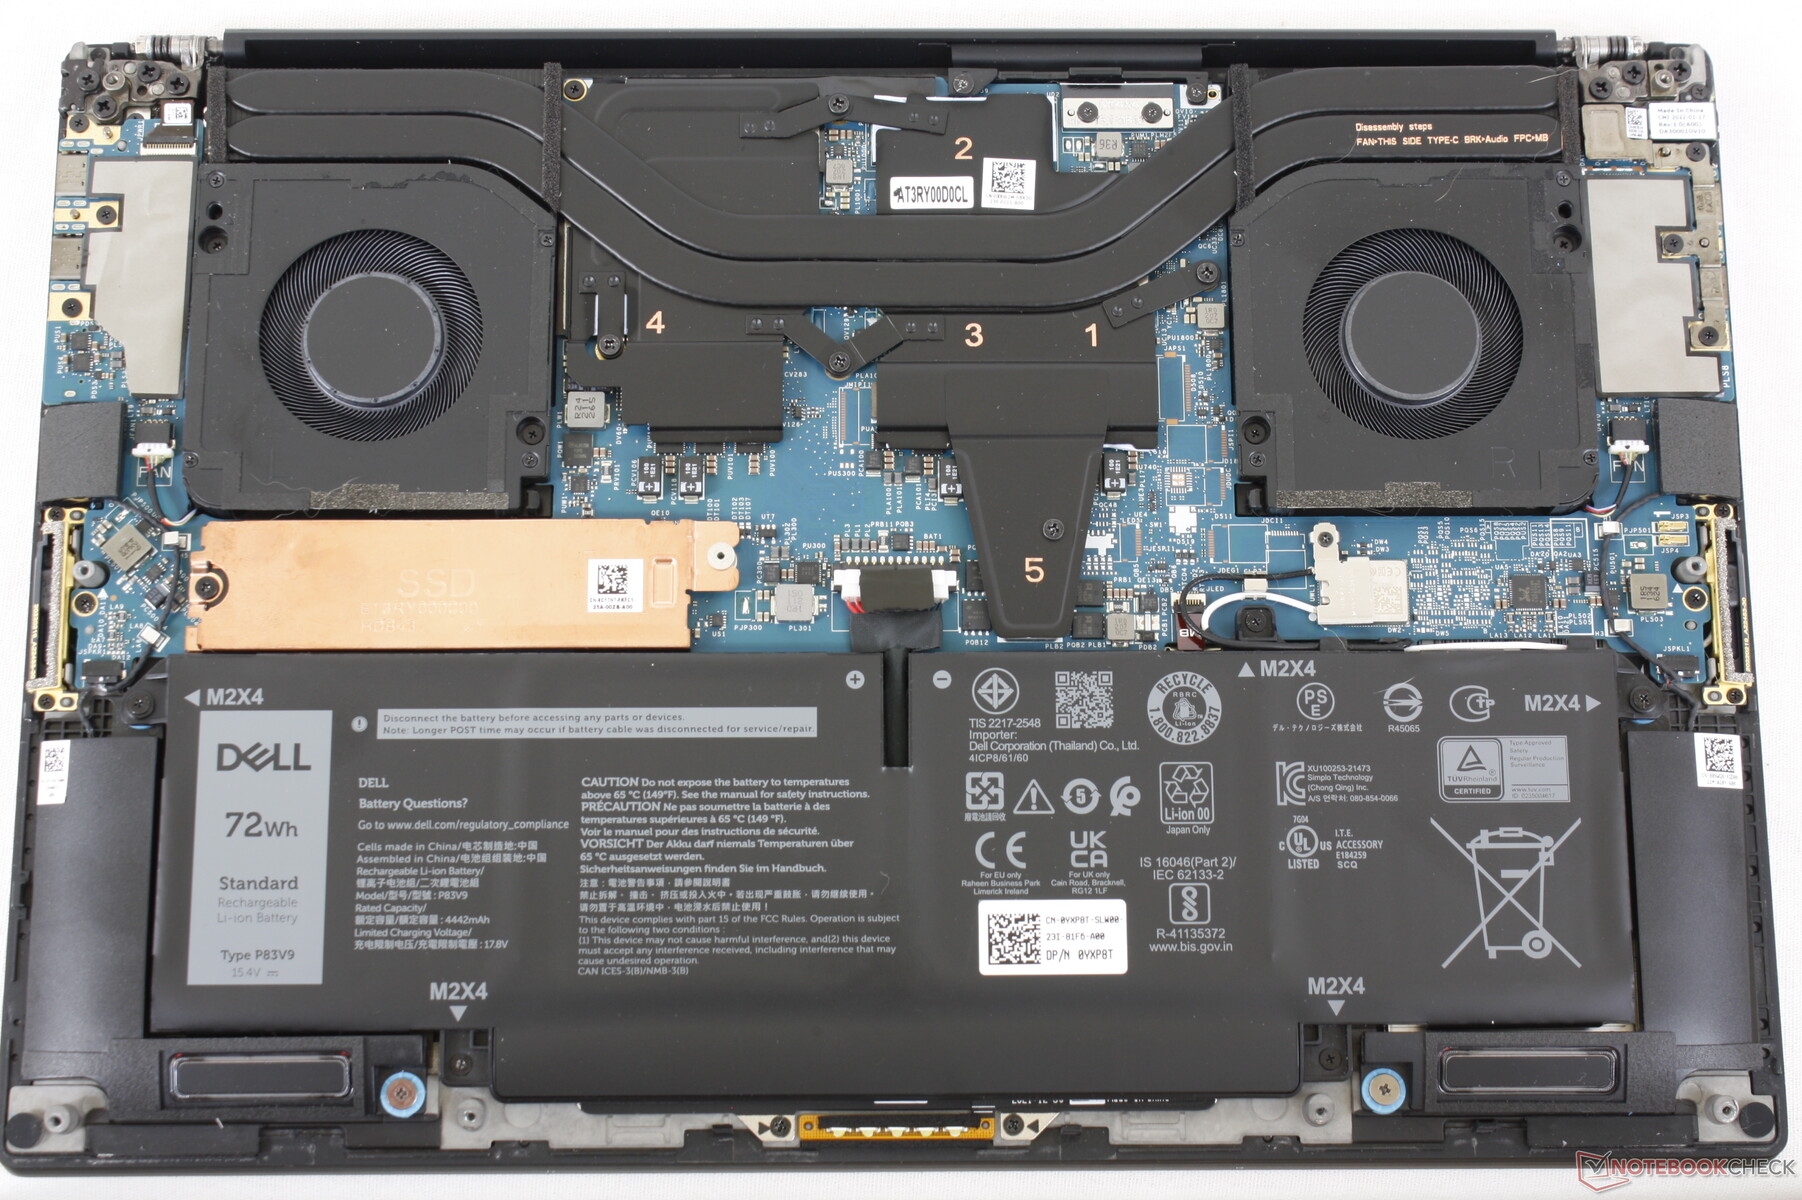
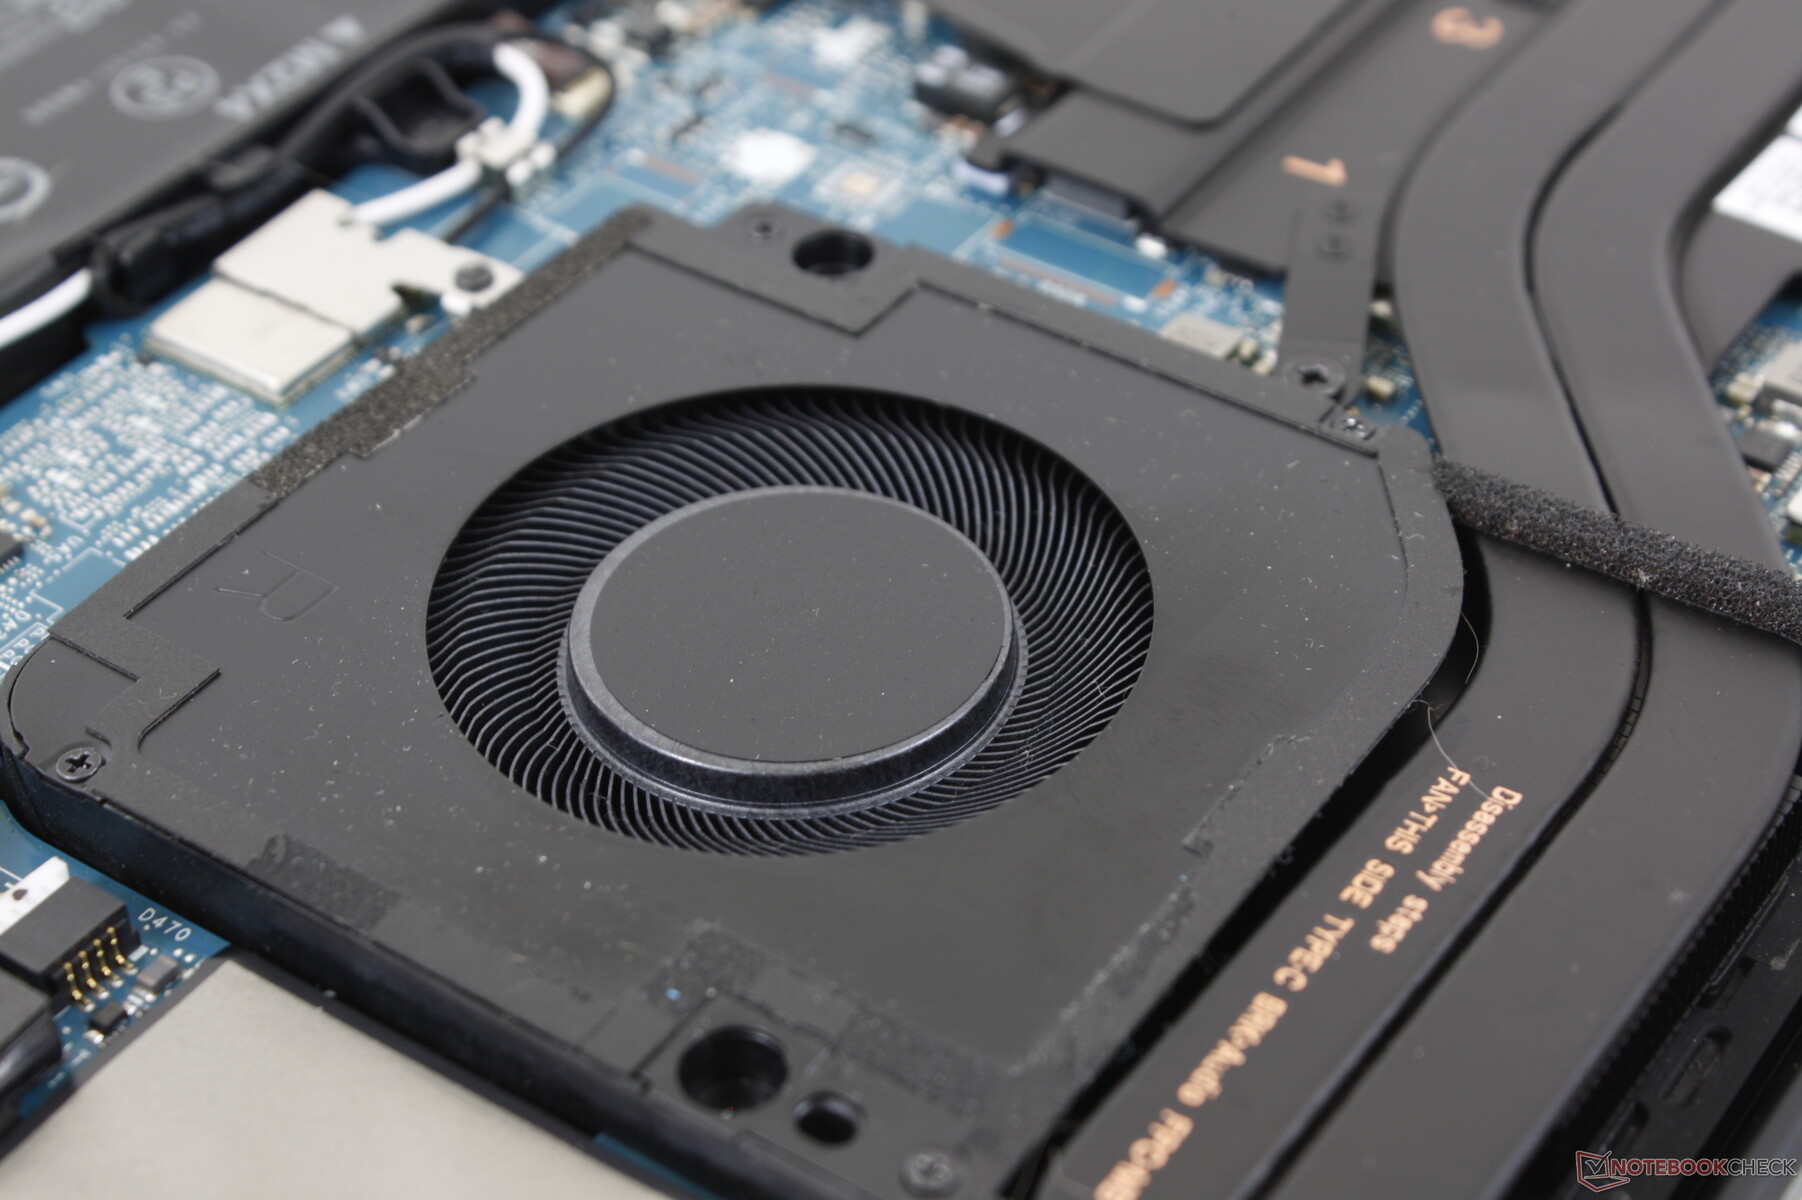
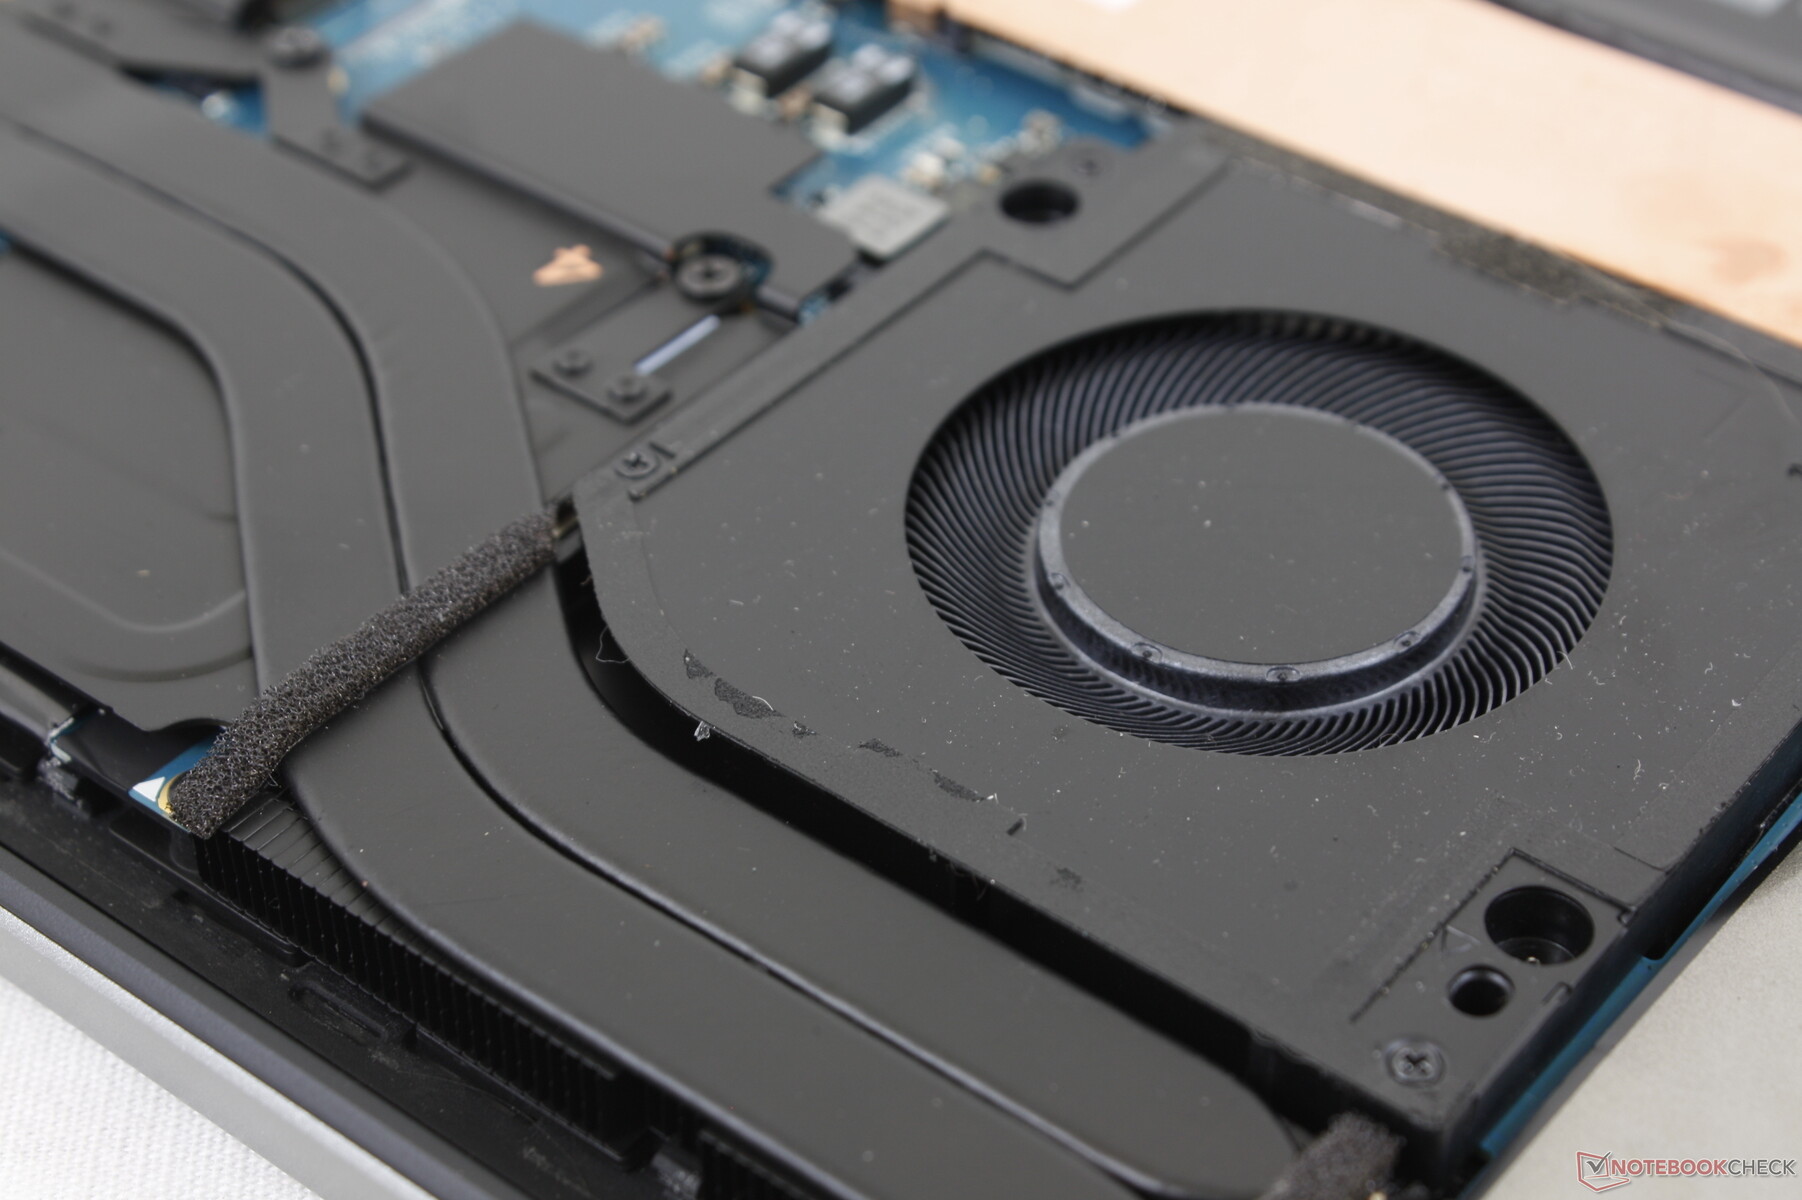
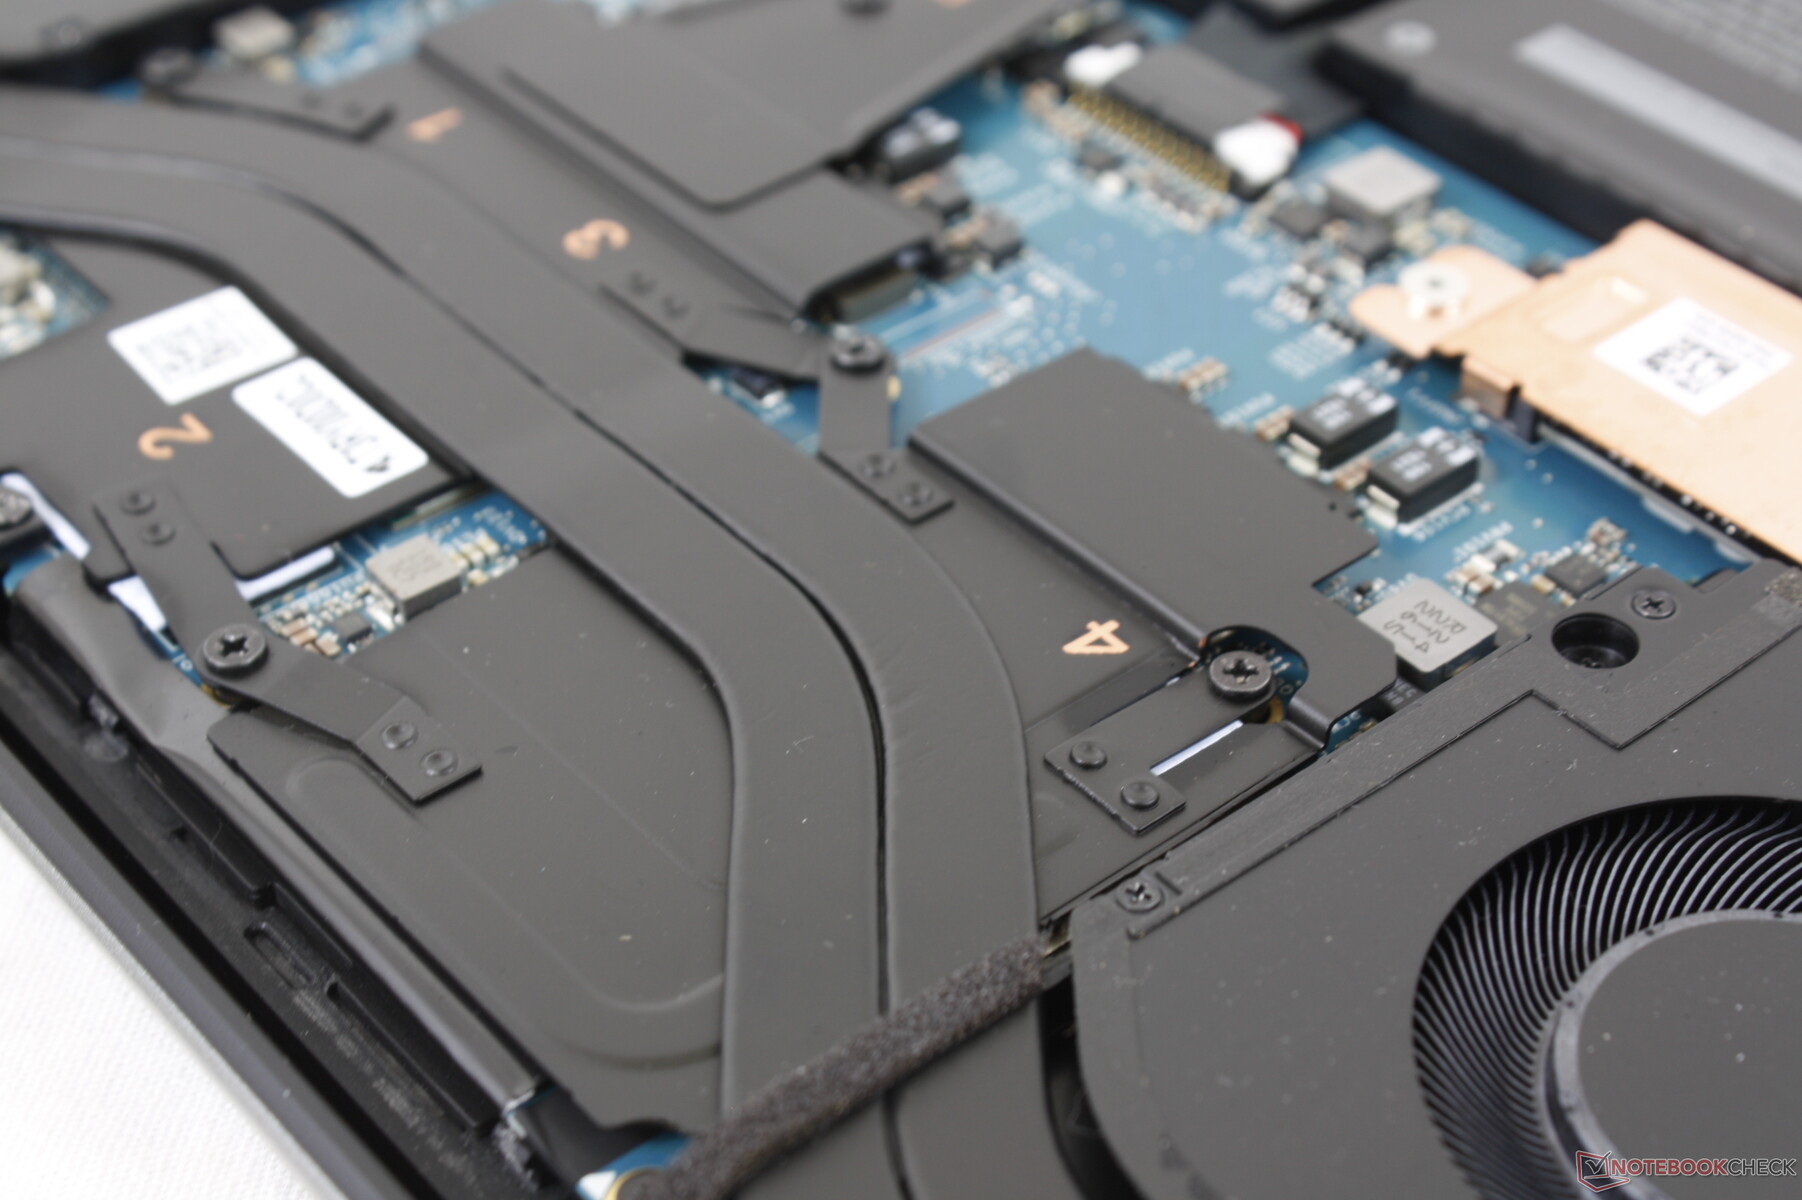
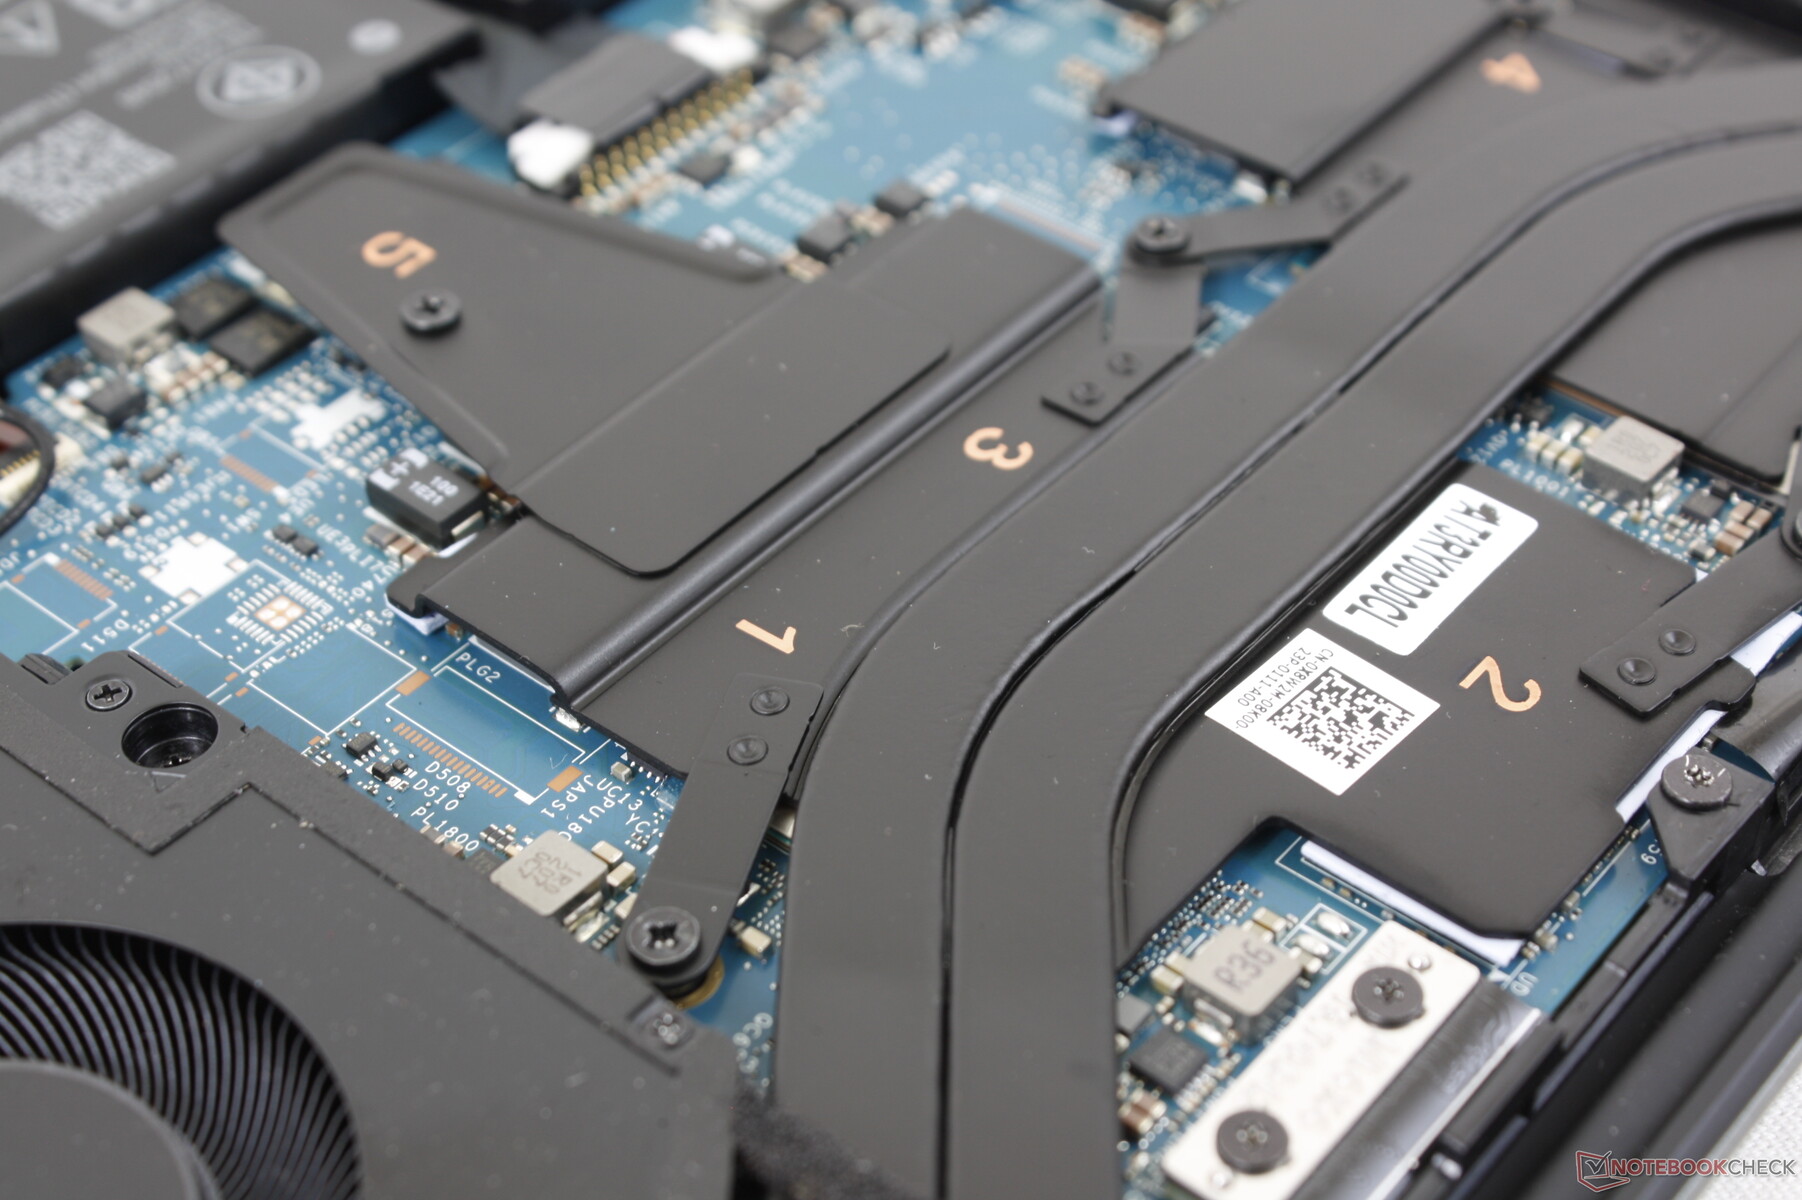
Manutenção
O painel inferior é fixado por oito parafusos Torx T5 para fácil remoção. Não há muito a ser melhorado, porém, pois os módulos RAM e WLAN são soldados.
Garantia
A garantia de base é de apenas 12 meses nos EUA, em vez do período de 36 meses que já esperávamos da maioria das estações de trabalho móveis e laptops profissionais de alto nível.
Dispositivos de entrada
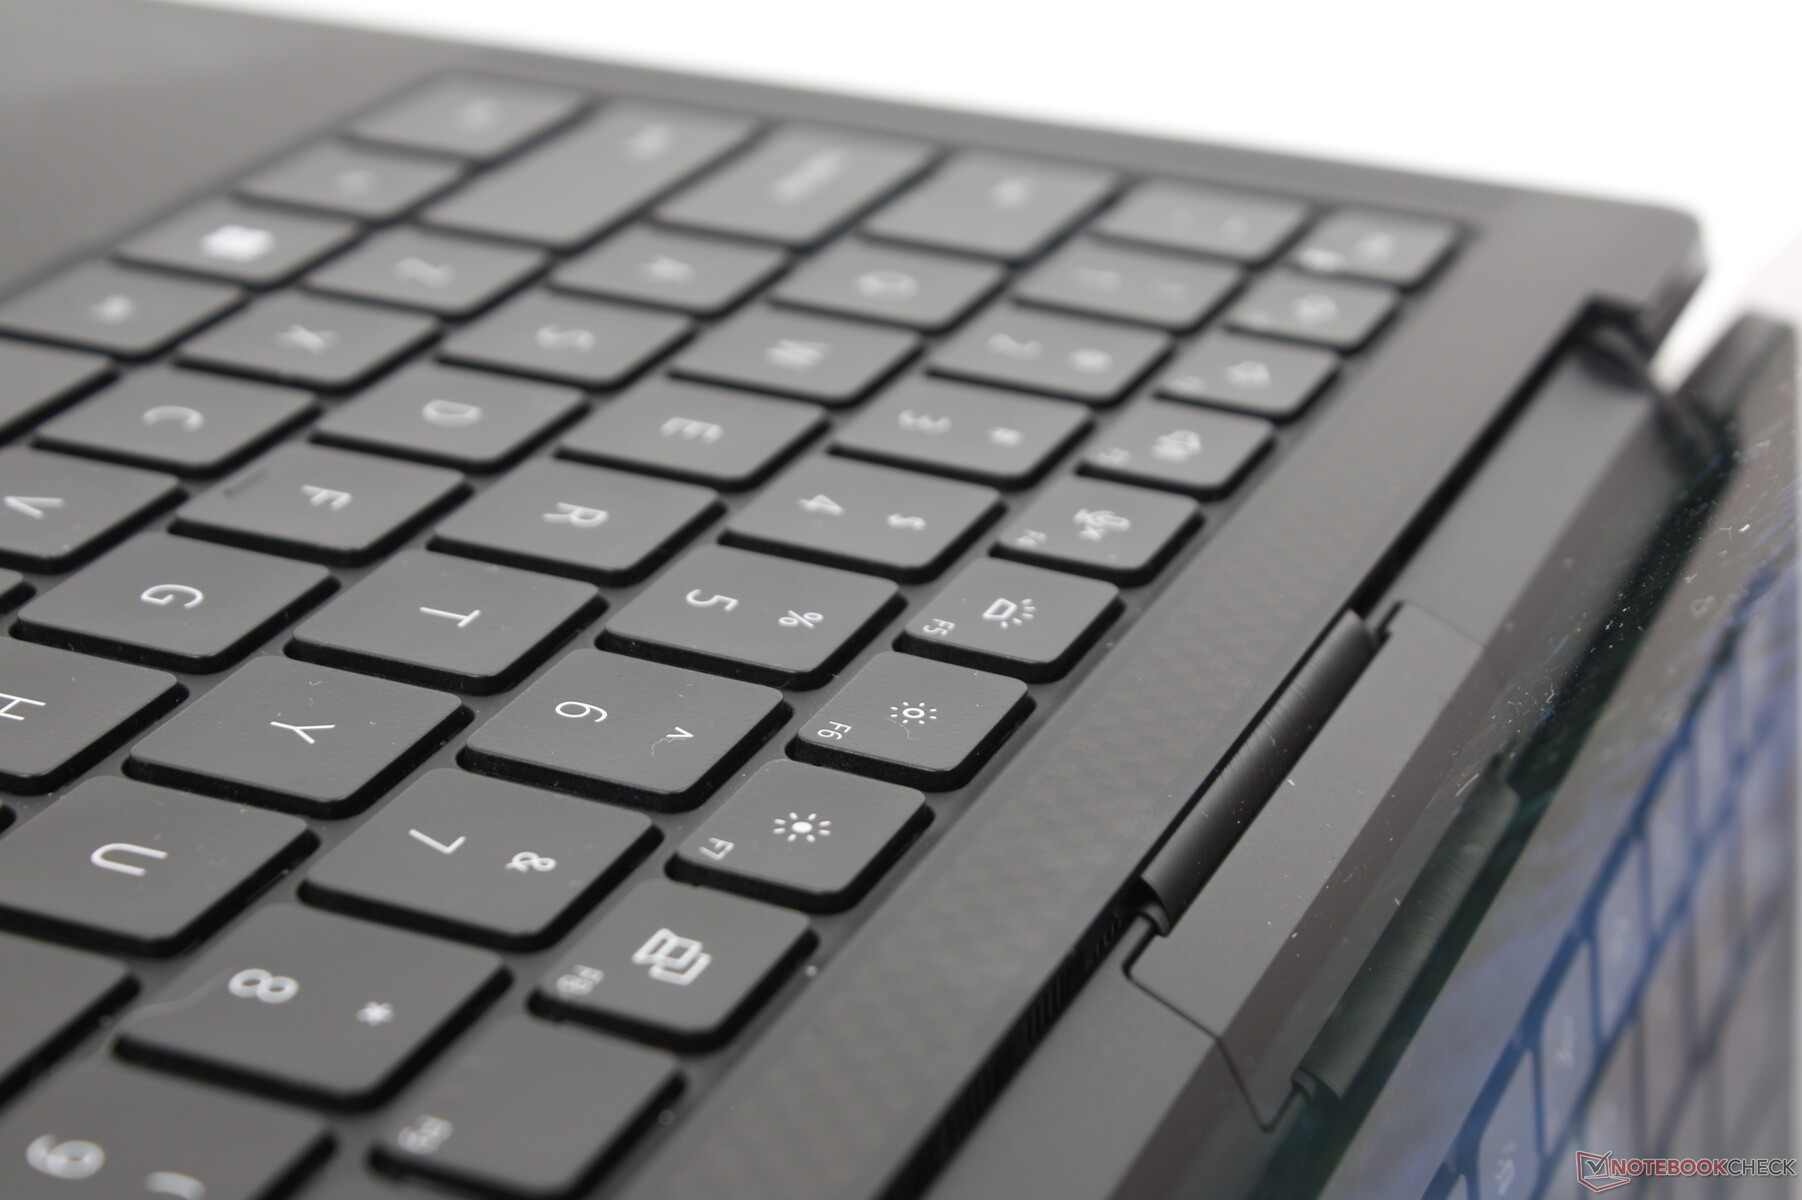
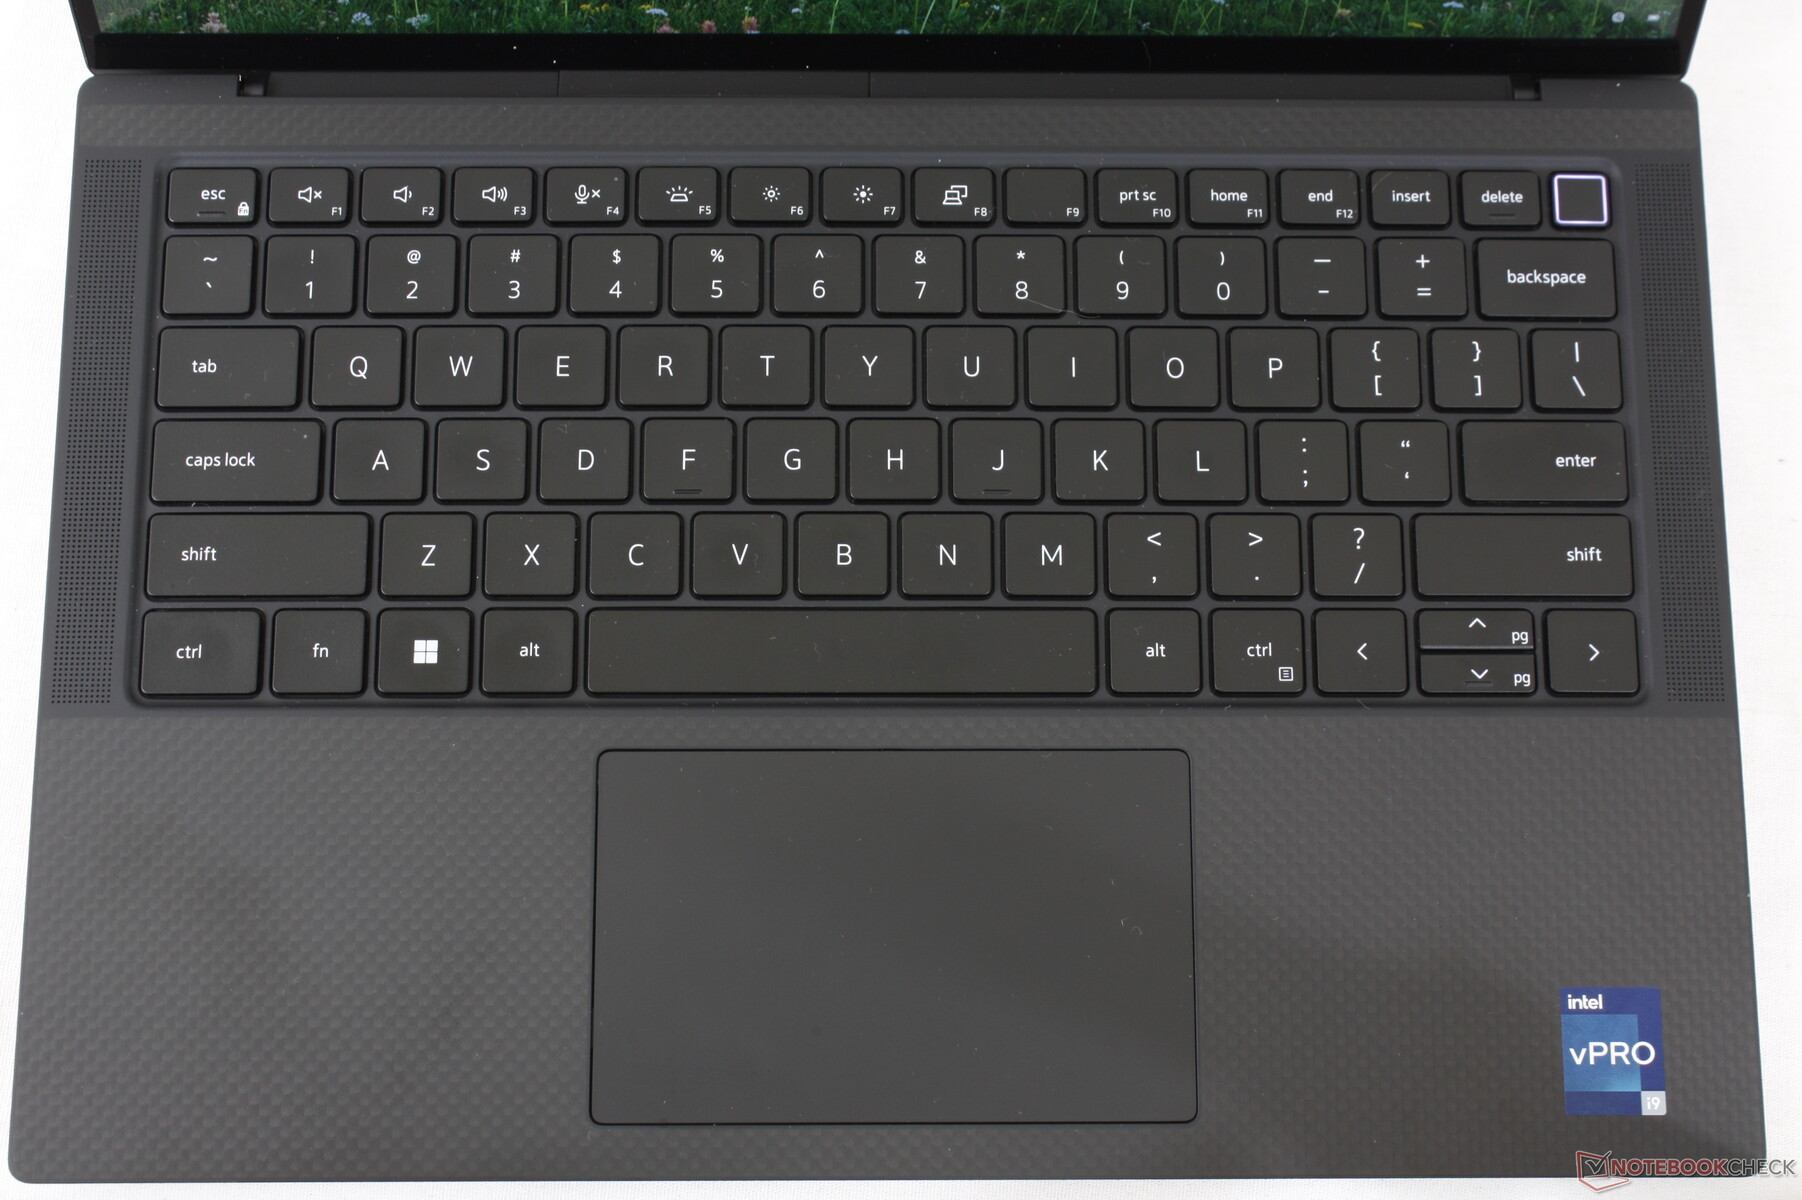
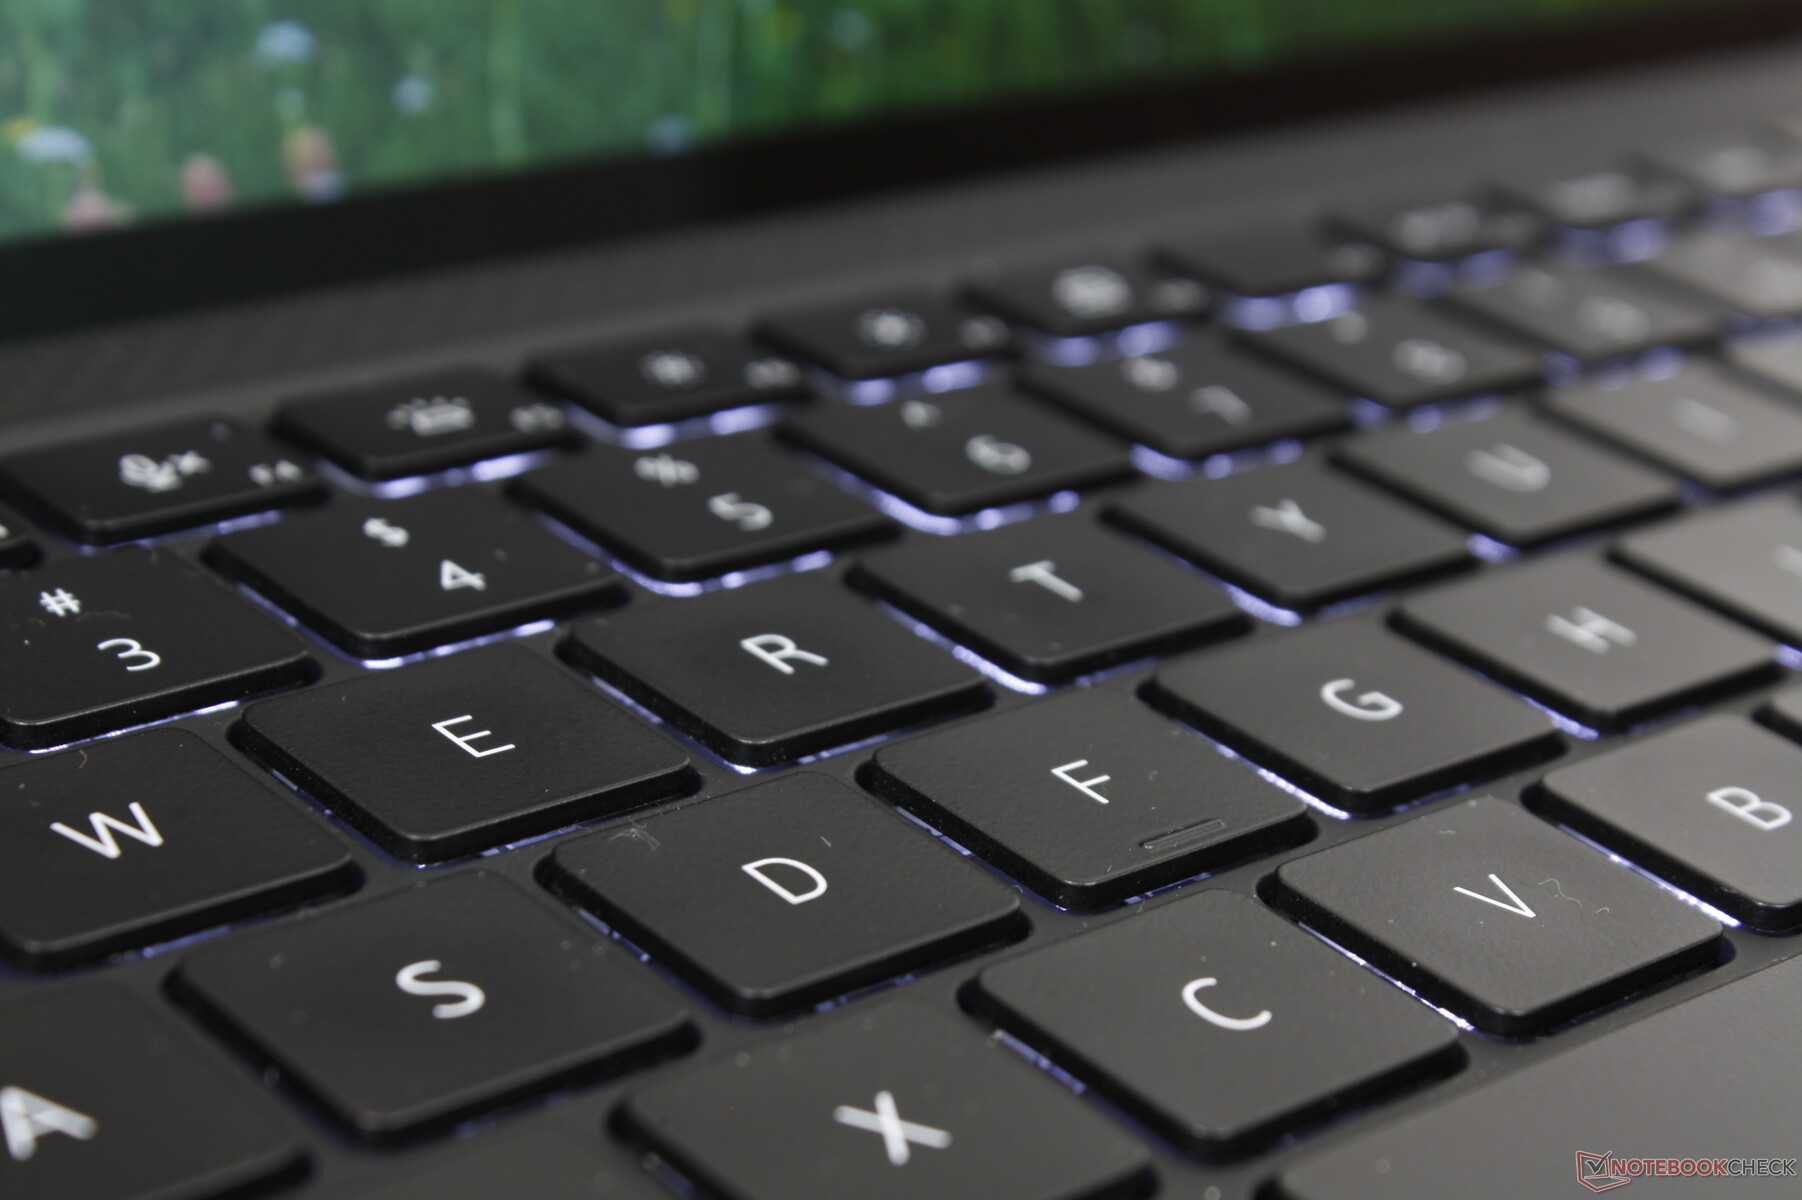
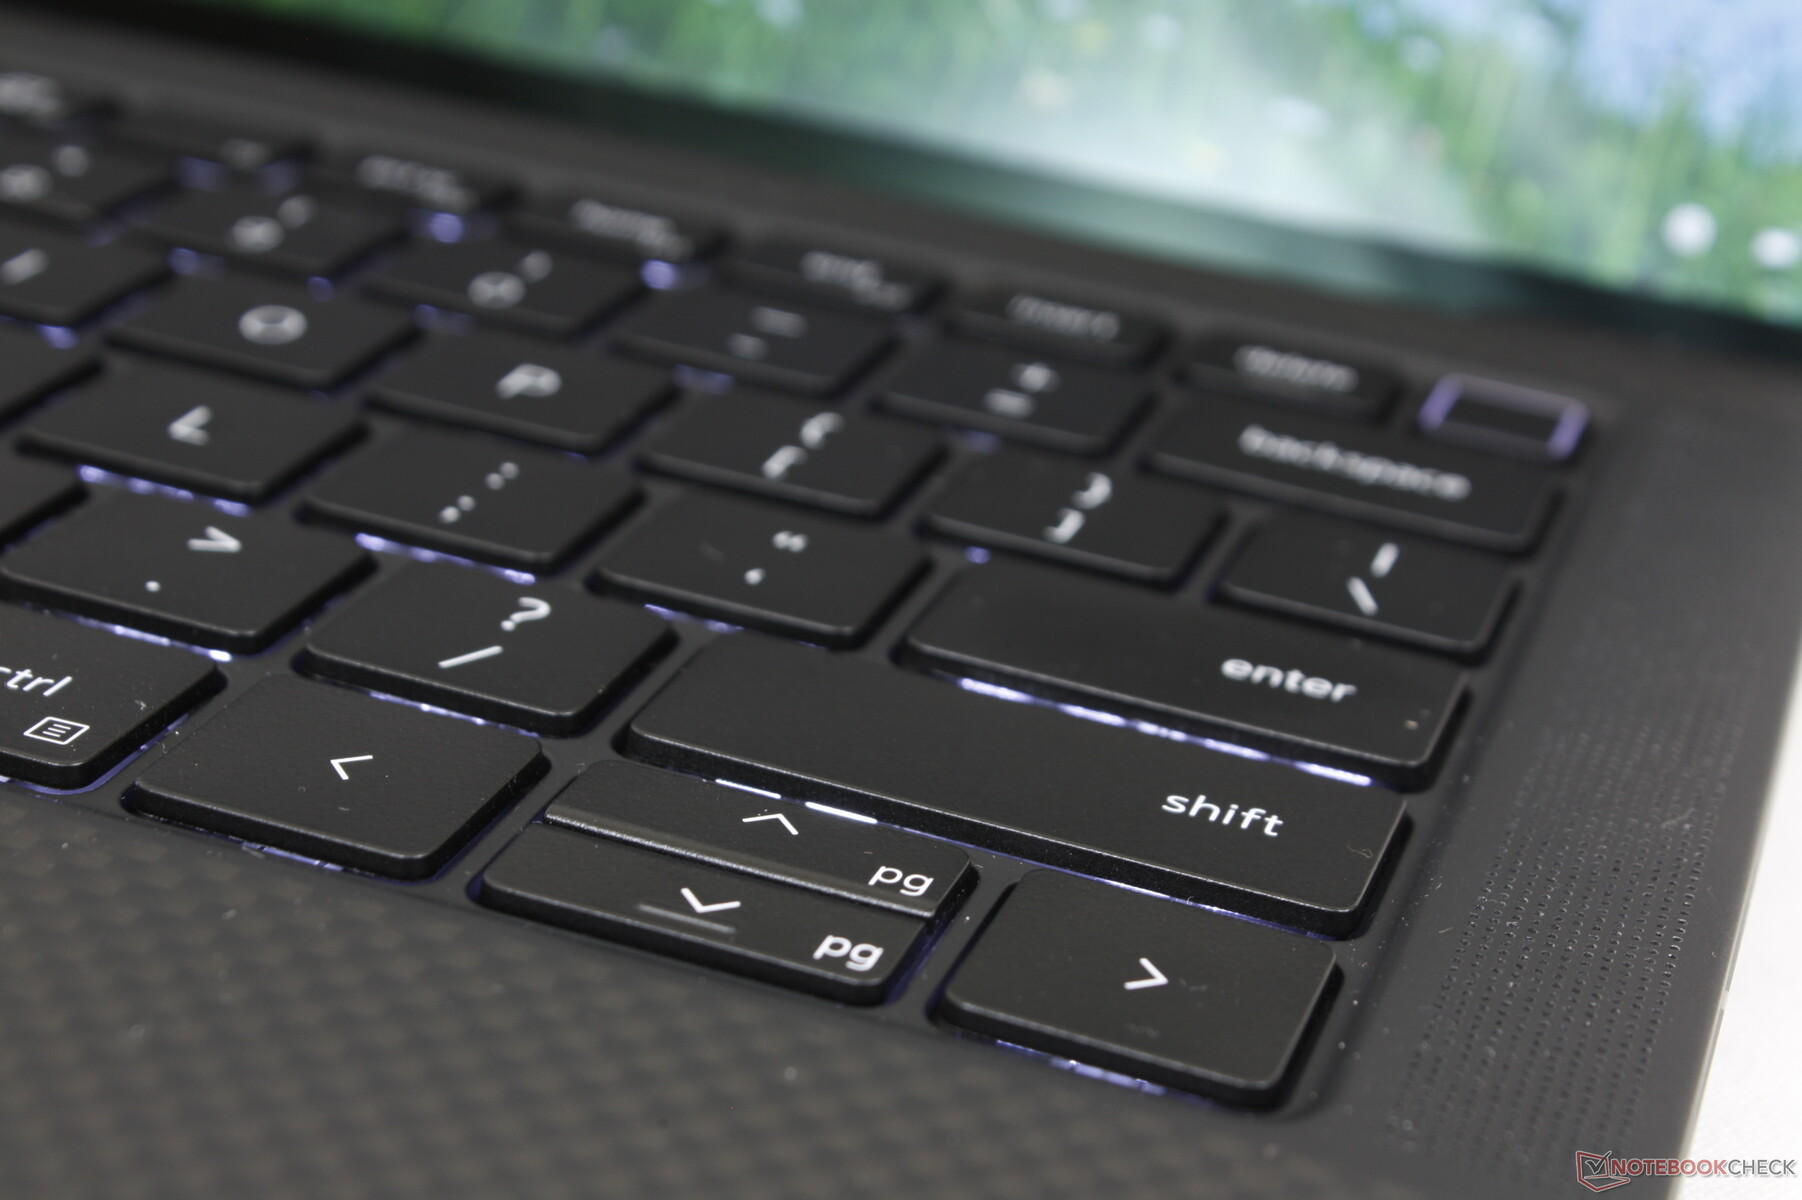
Teclado
O modelo herda o teclado como encontrado no modelo mais antigo XPS 13 9300 ou desenho 9310. Se você já digitou um XPS 13 antes, então você saberá o que esperar no Precision 5470. O feedback das teclas é uniforme com viagens moderadas, mas as teclas da série HP EliteBook ou Firefly tendem a ser mais nítidas ou mais nítidas quando pressionadas.
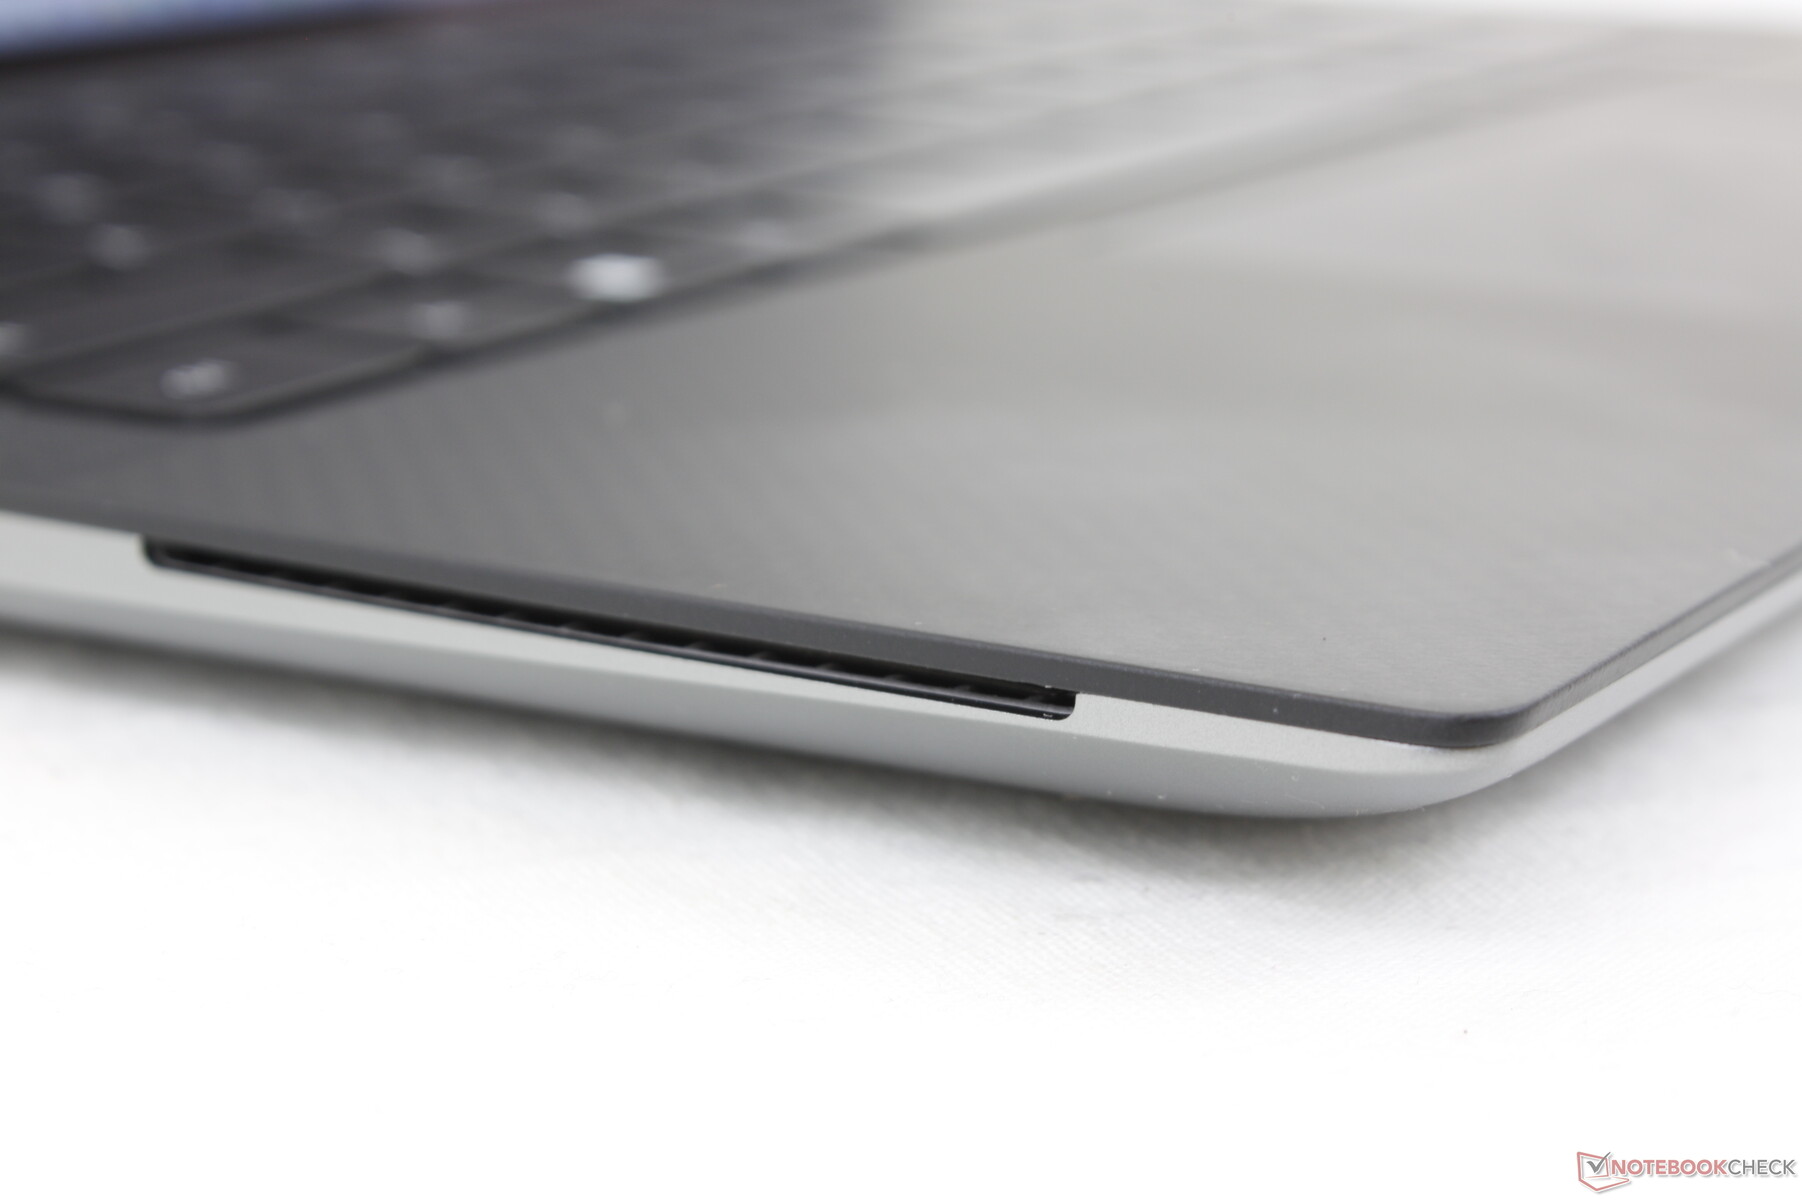
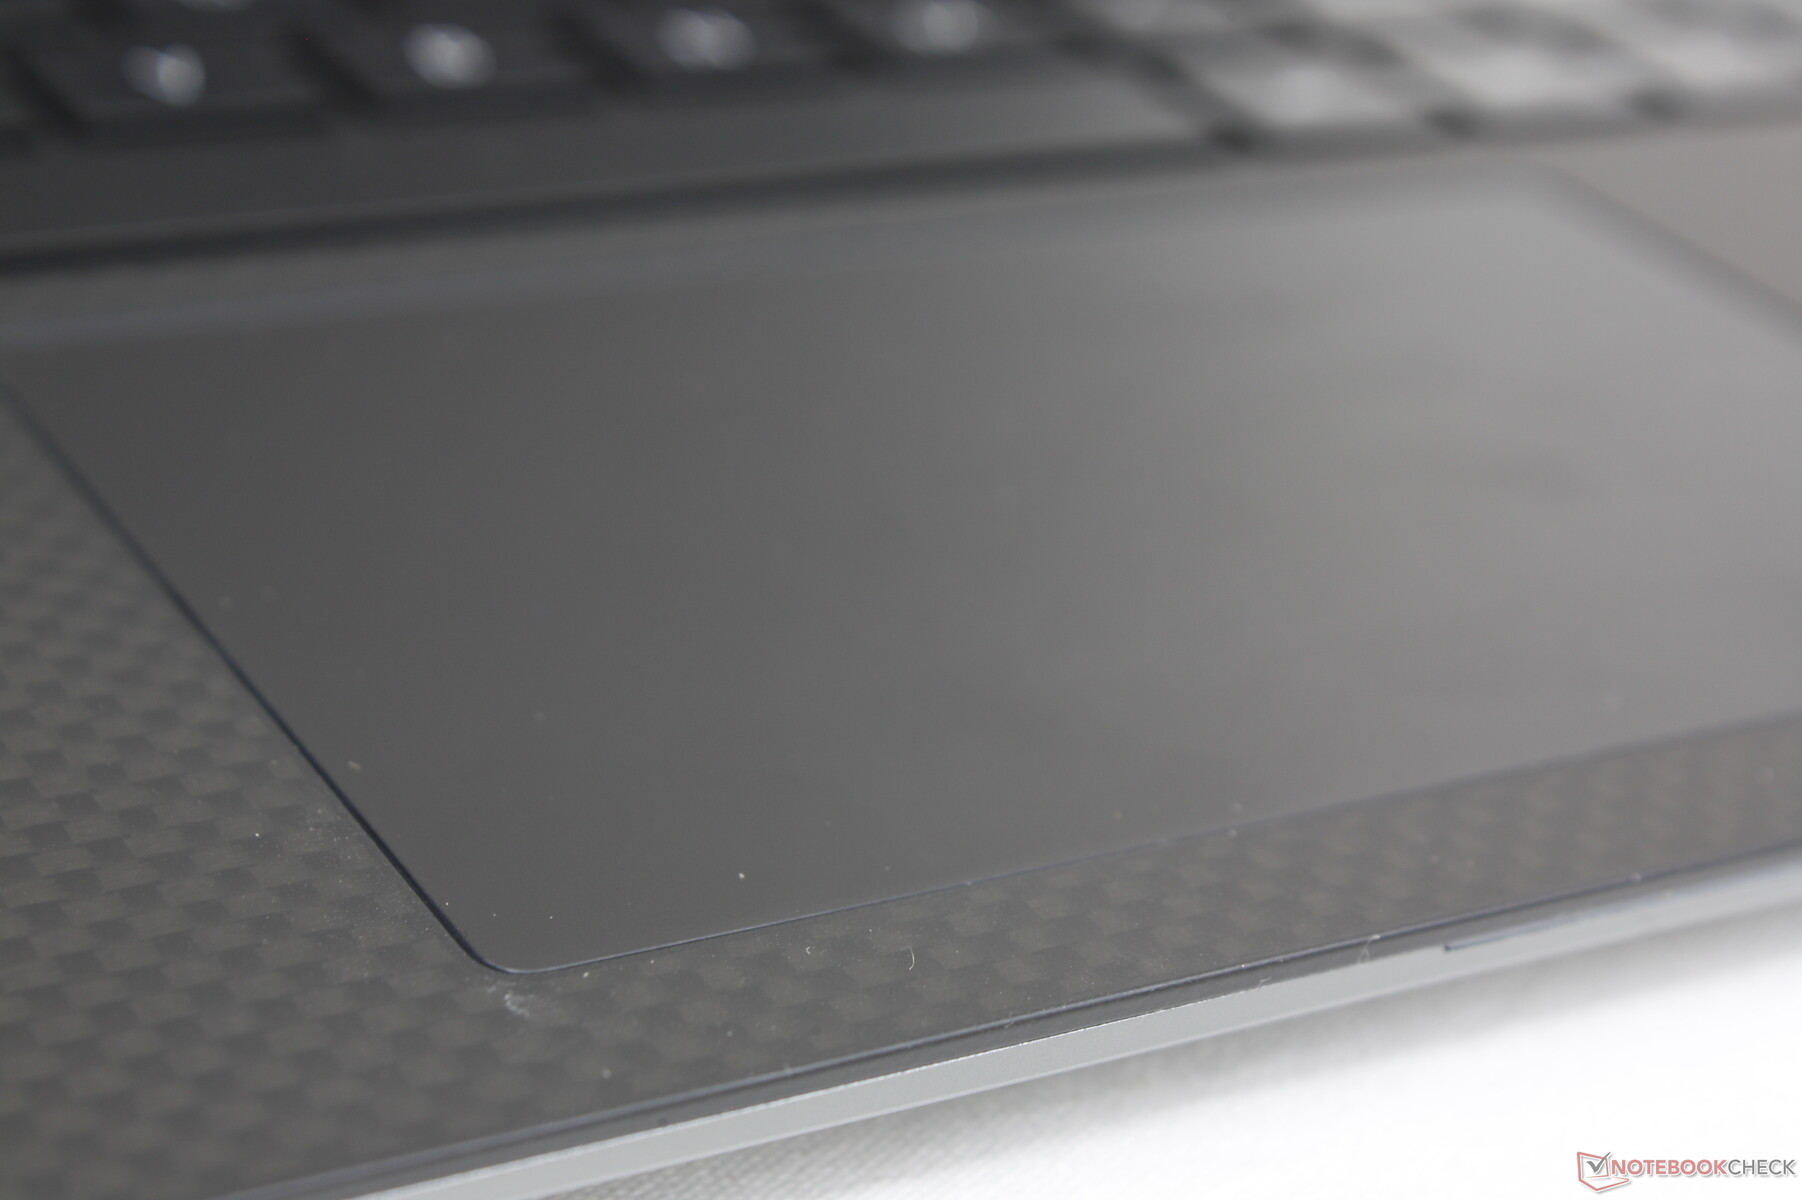
Touchpad
A superfície do Clickpad tem aproximadamente o mesmo tamanho que a do XPS 13 9300 (10,8 x 6,7 cm vs. 11,2 x 6,5 cm). A tração é suave e apenas ligeiramente pegajosa em velocidades mais lentas para melhor precisão quando necessário. O feedback ao clicar no clickpad é relativamente suave e raso, mas com um ruído muito mais silencioso quando na maioria dos outros laptops.
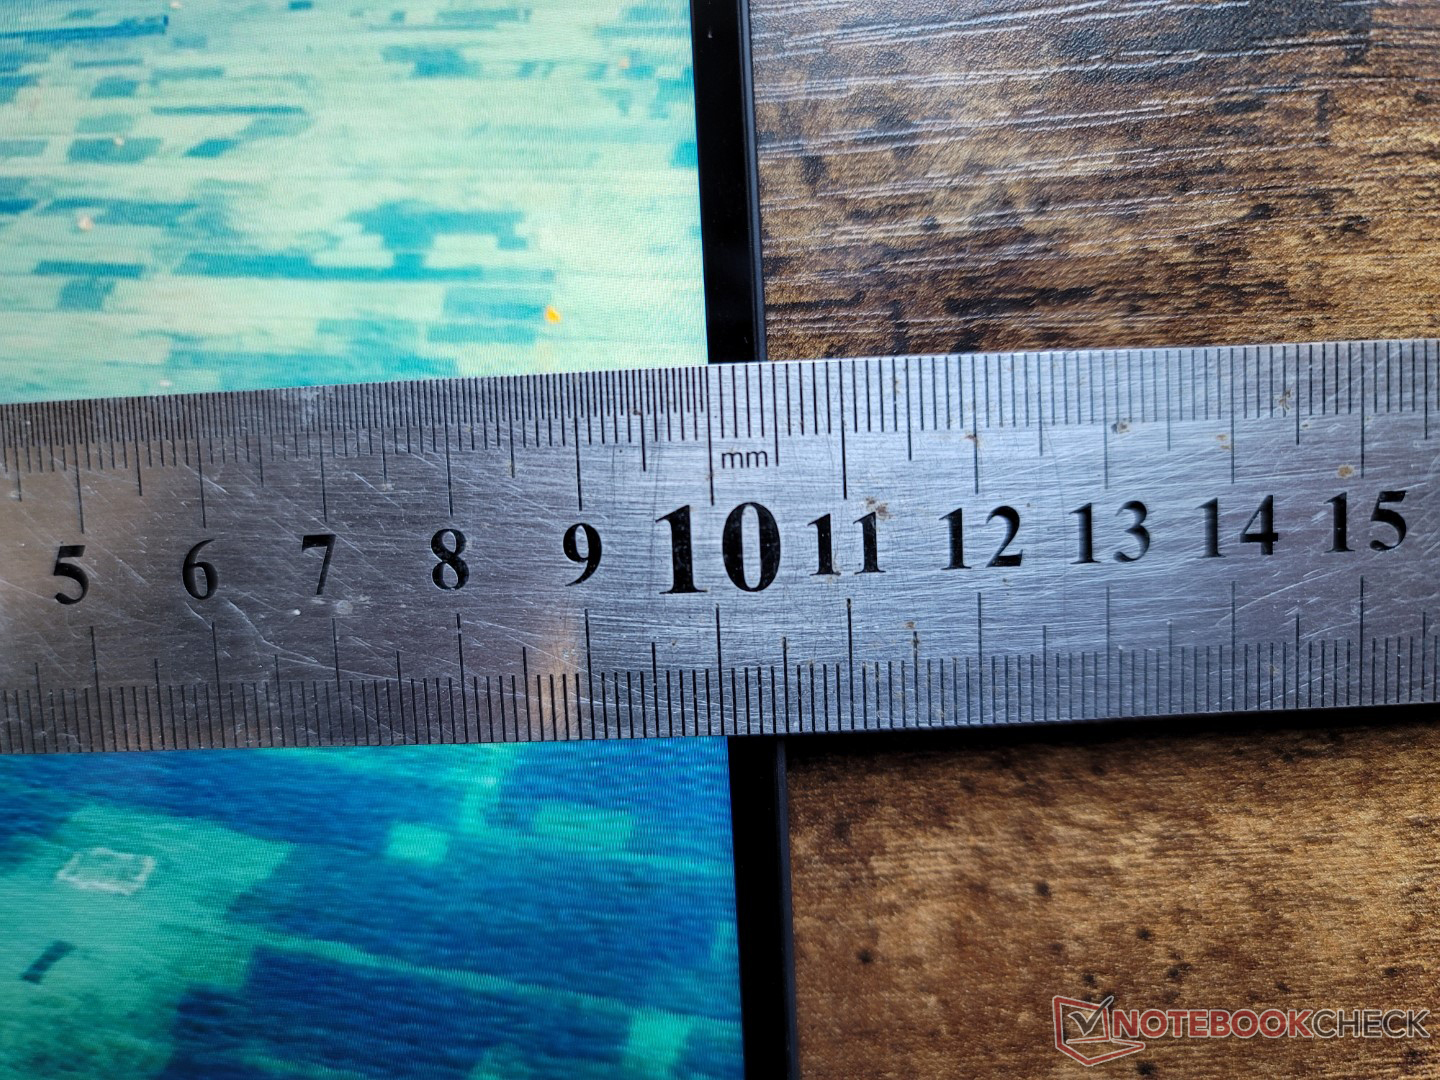
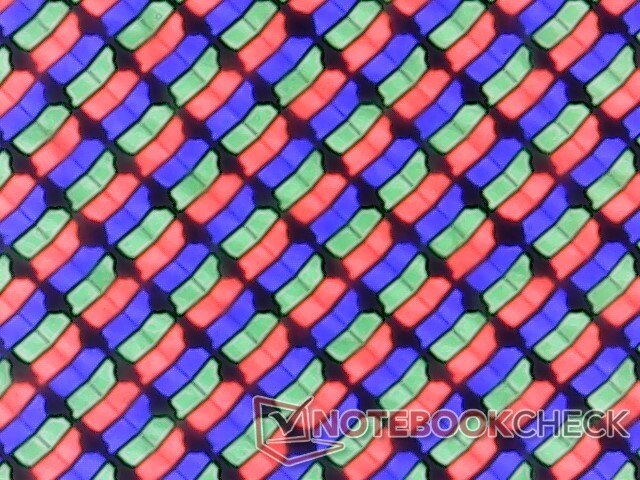
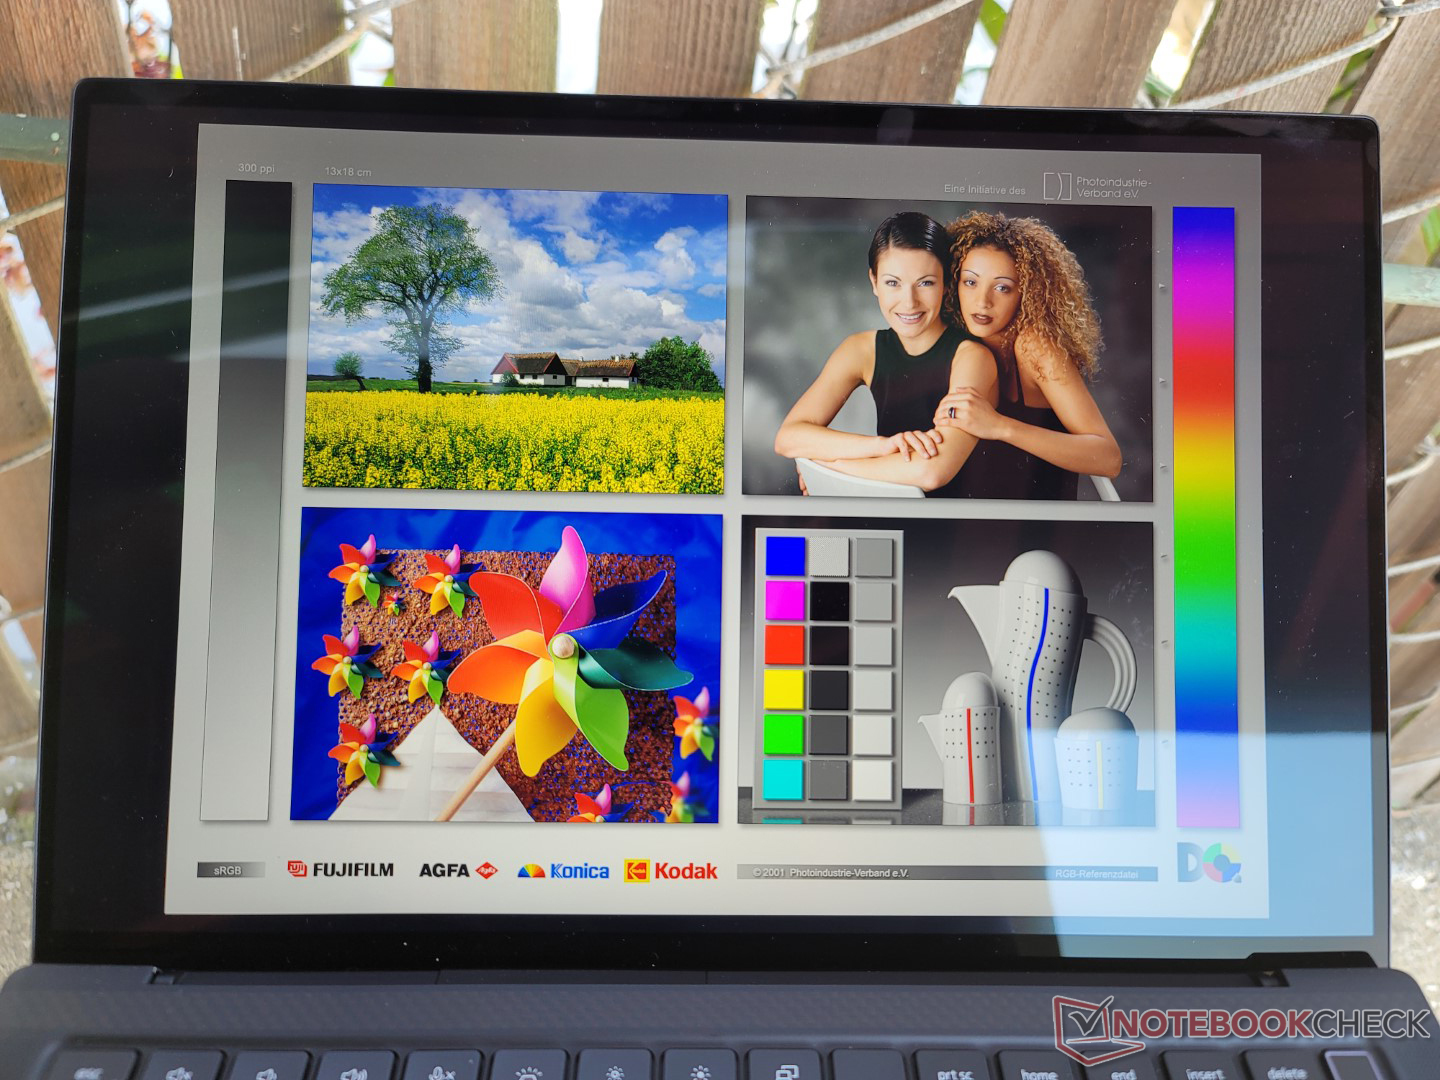
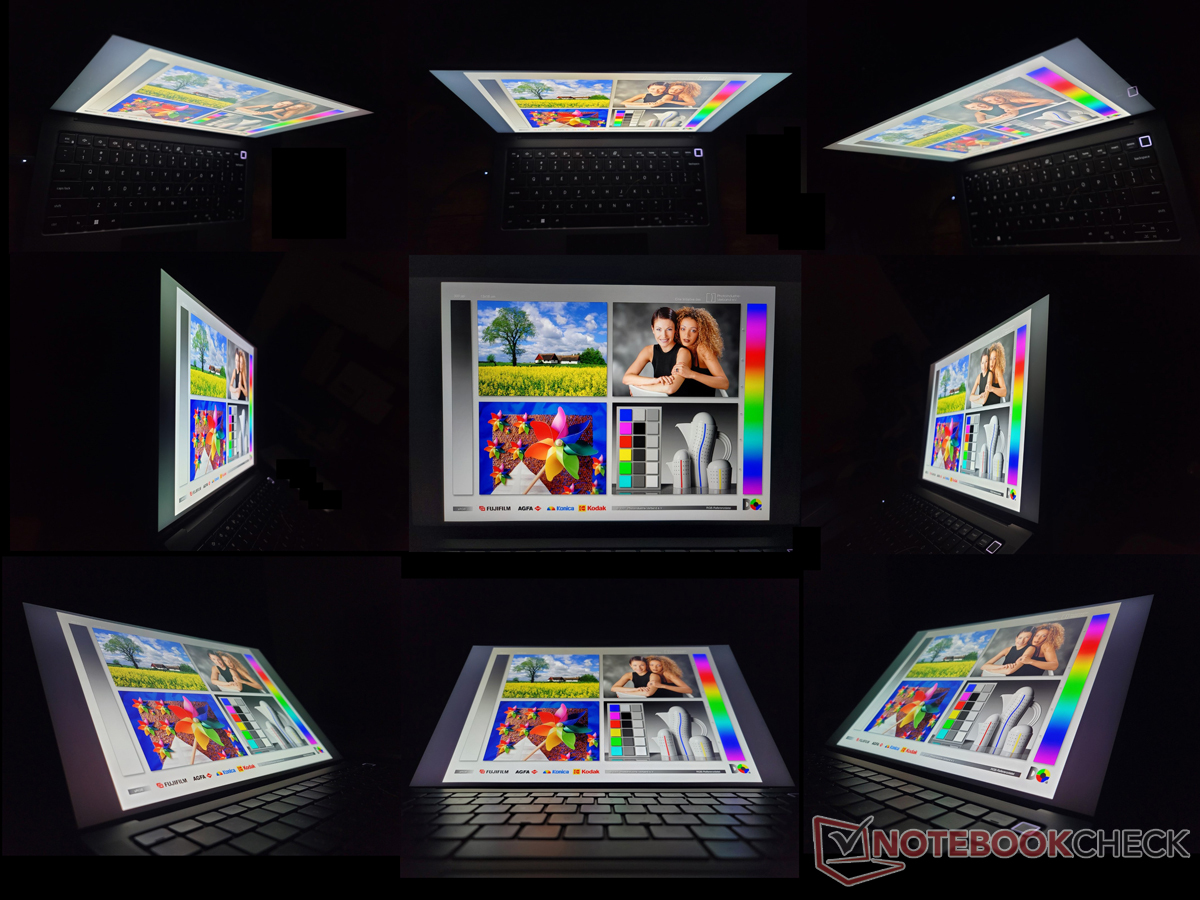
Mostrador - Idêntico a Latitude 9430 2 em 1
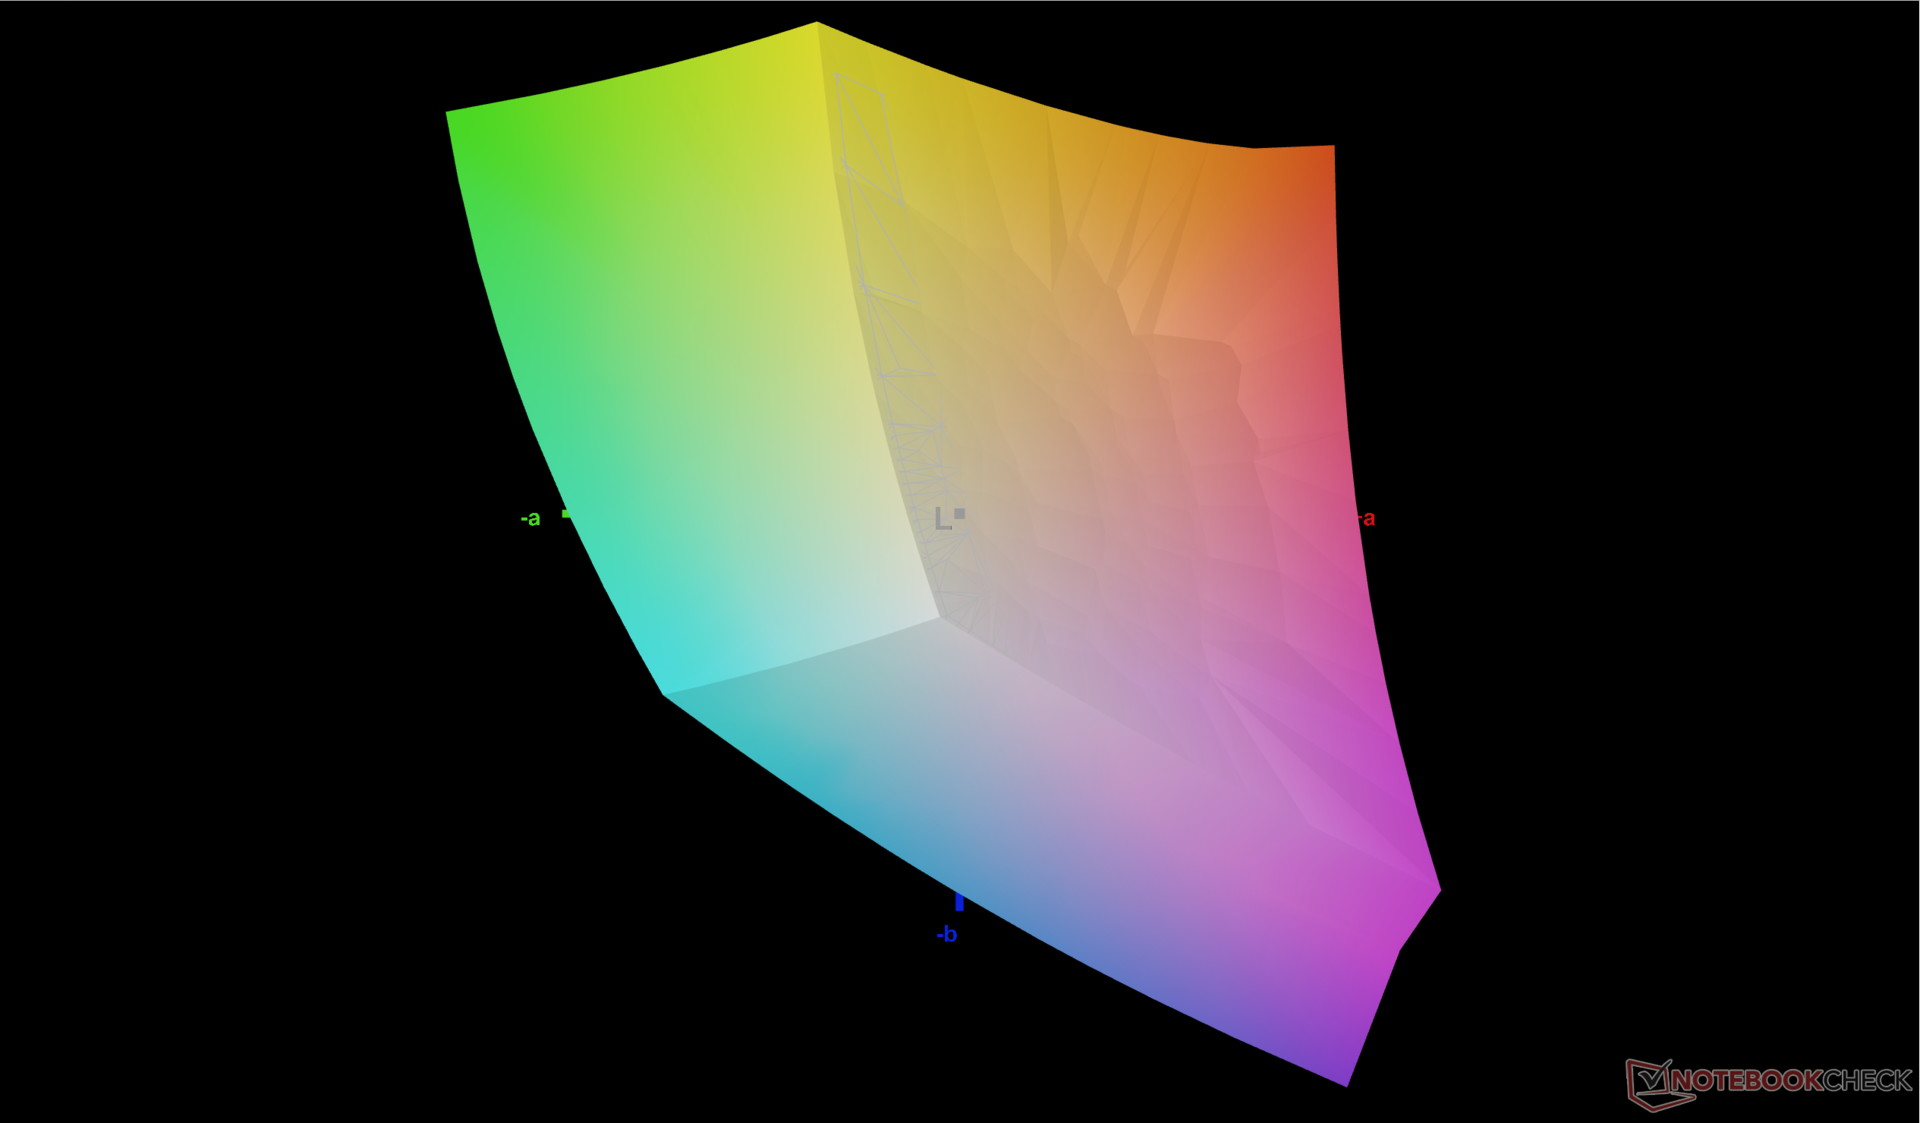
O Precision 5470 compartilha a mesma alta qualidade da tela táctil do IPS Optronics B140QAN de alta qualidade encontrada na Latitude 9430 2 em 1. Assim, ambos os modelos compartilham tempos de resposta preto-branco semelhantes, gama, relação de contraste e até mesmo brilho geral. Esta tela é excelente para usuários que desejam uma cobertura completa de sRGB e níveis relativamente profundos de preto, mas infelizmente sofre de fantasmas perceptíveis que podem ser um problema se lidar com aplicações que envolvem gráficos ou vídeos de movimento rápido.
Não há cores OLED, AdobeRGB ou P3, ou opções superiores de taxa de atualização para escolher, o que significa que os usuários estão limitados ao IPS e 60 Hz em todas as configurações atuais.
| |||||||||||||||||||||||||
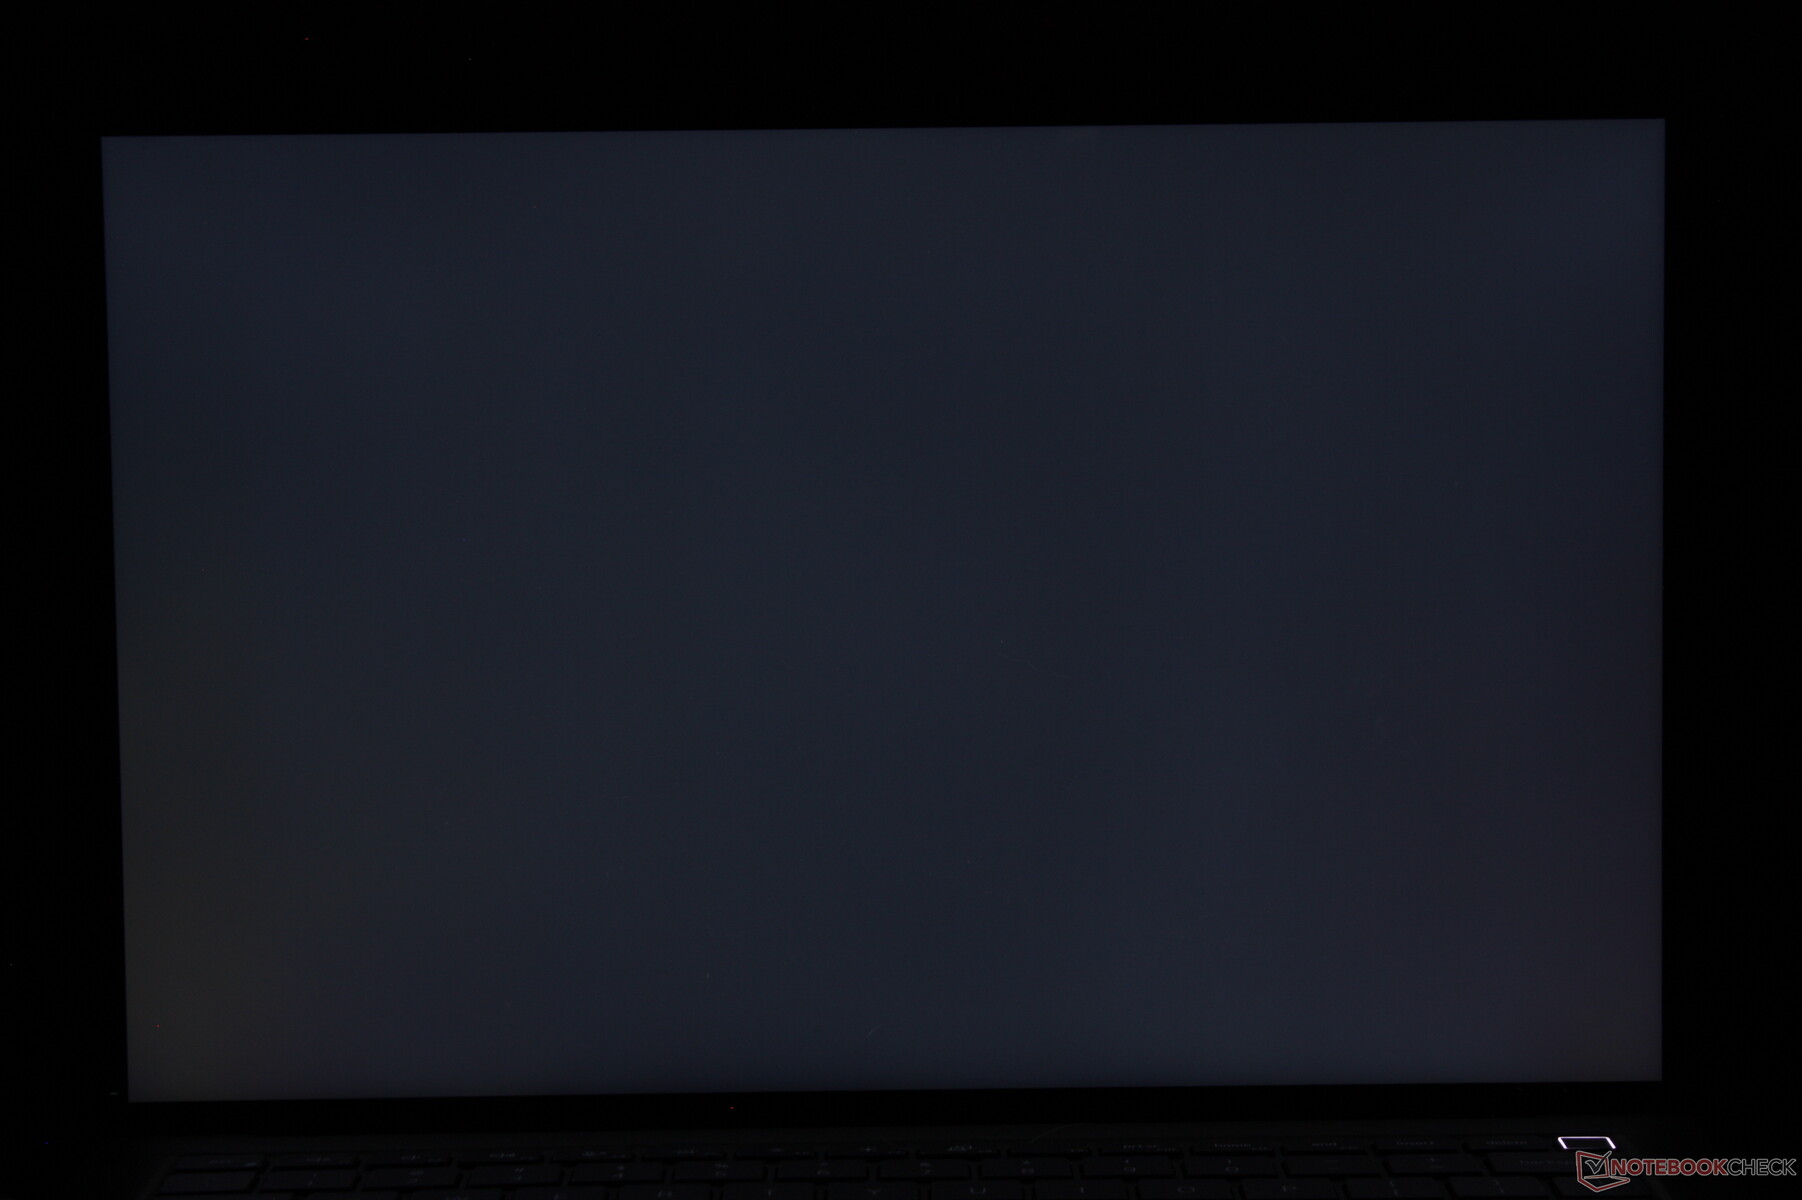
iluminação: 94 %
iluminação com acumulador: 537 cd/m²
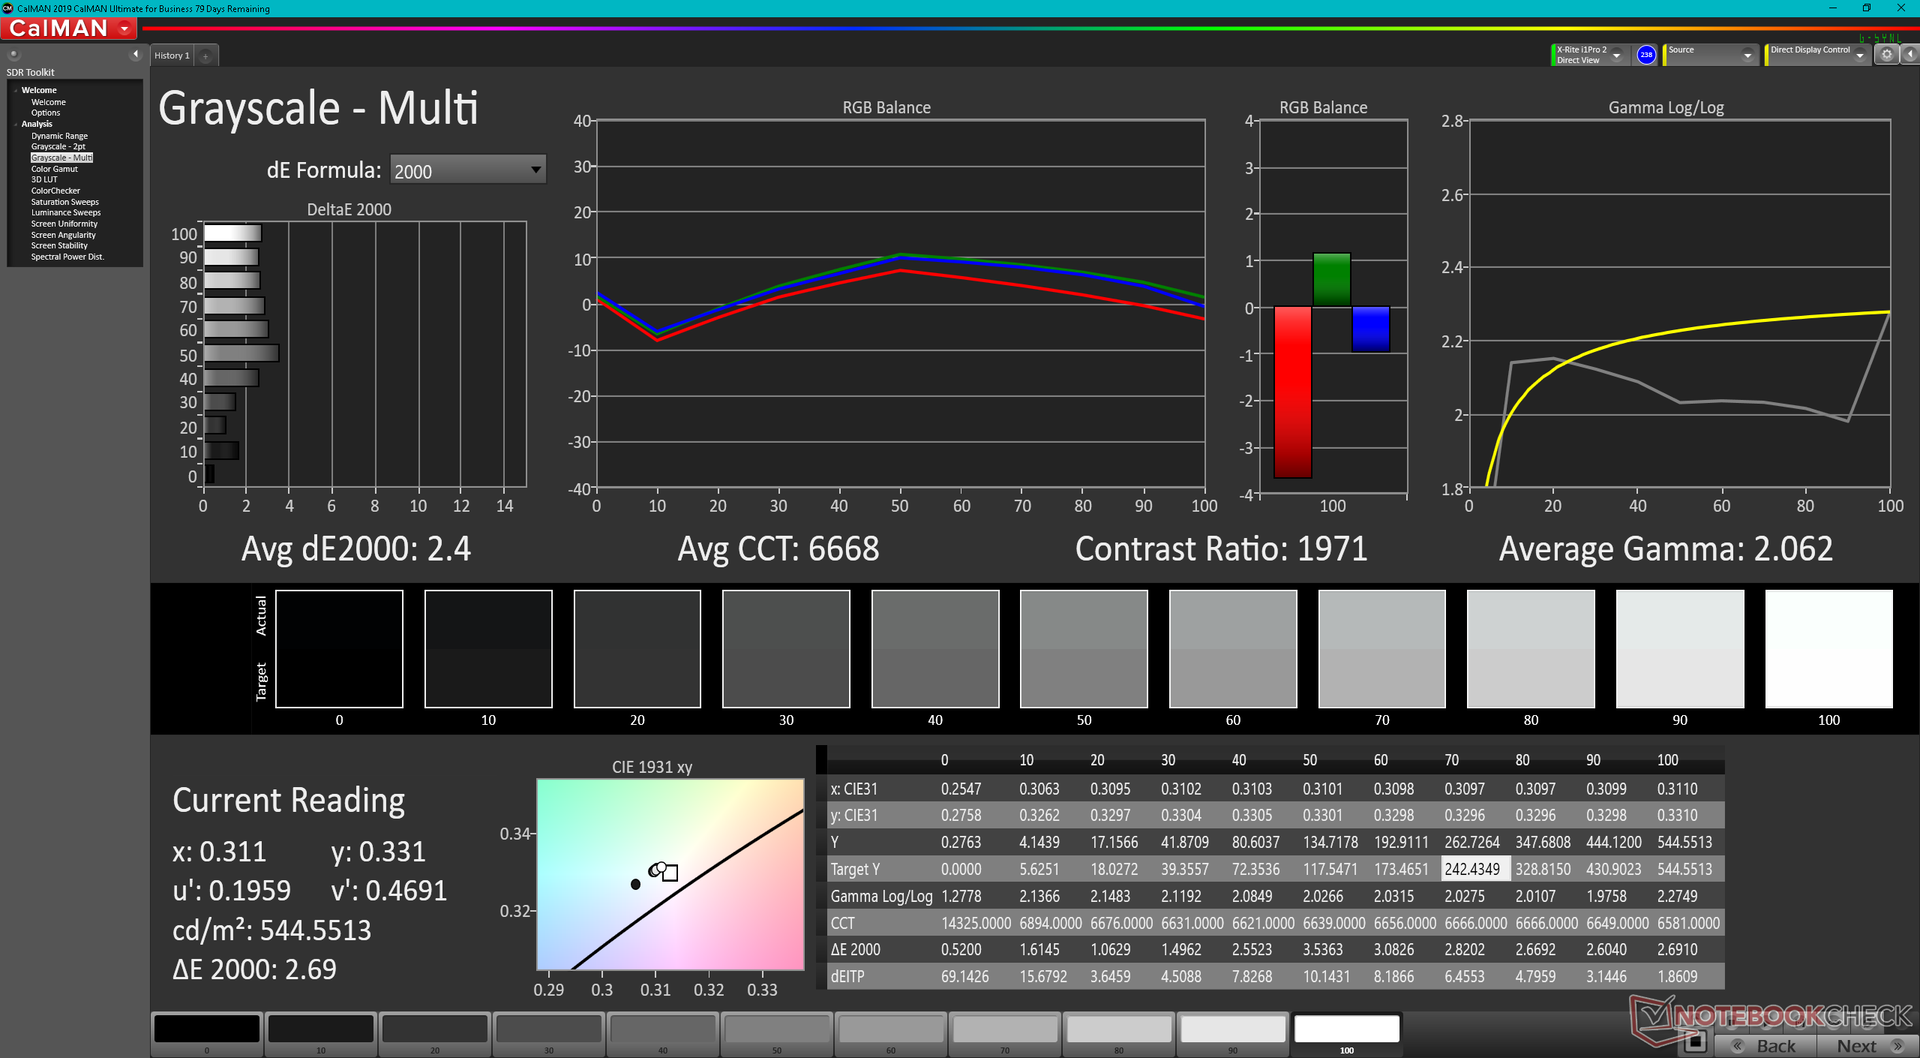
Contraste: 1627:1 (Preto: 0.33 cd/m²)
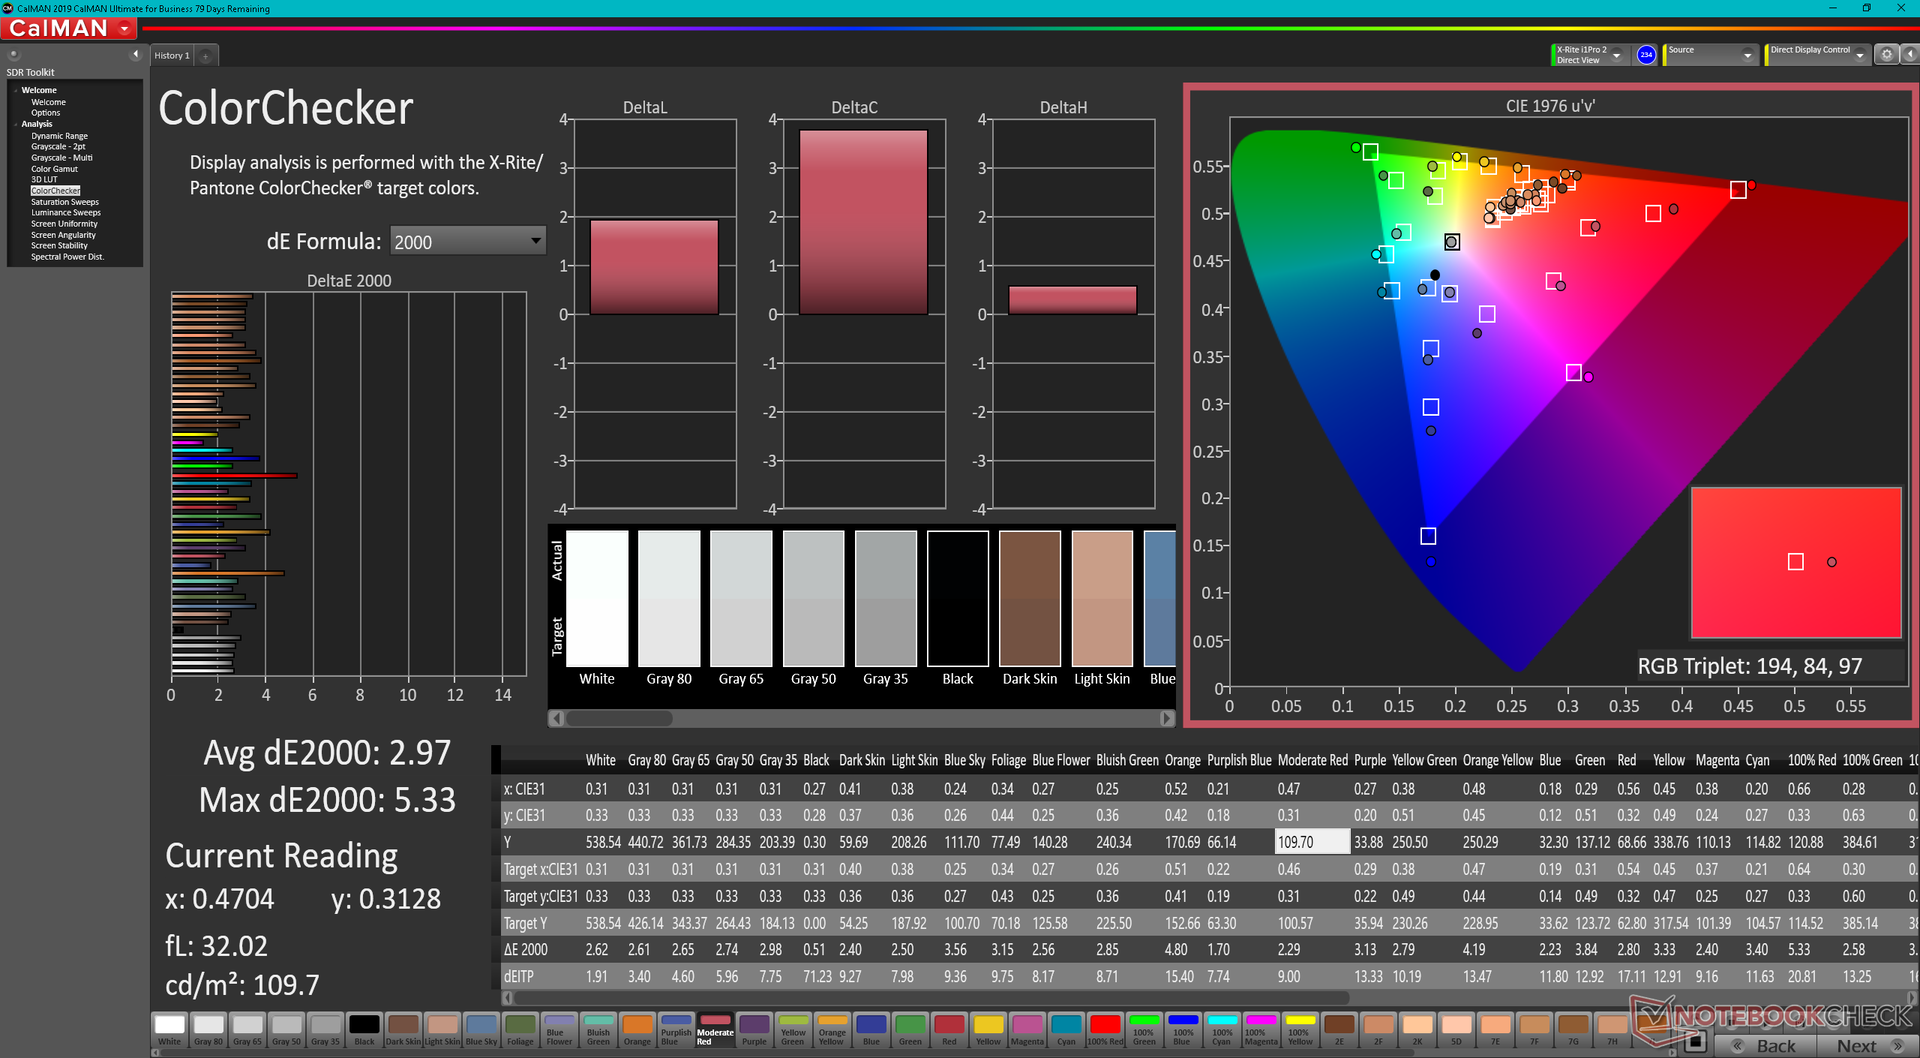
ΔE ColorChecker Calman: 2.97 | ∀{0.5-29.43 Ø4.72}
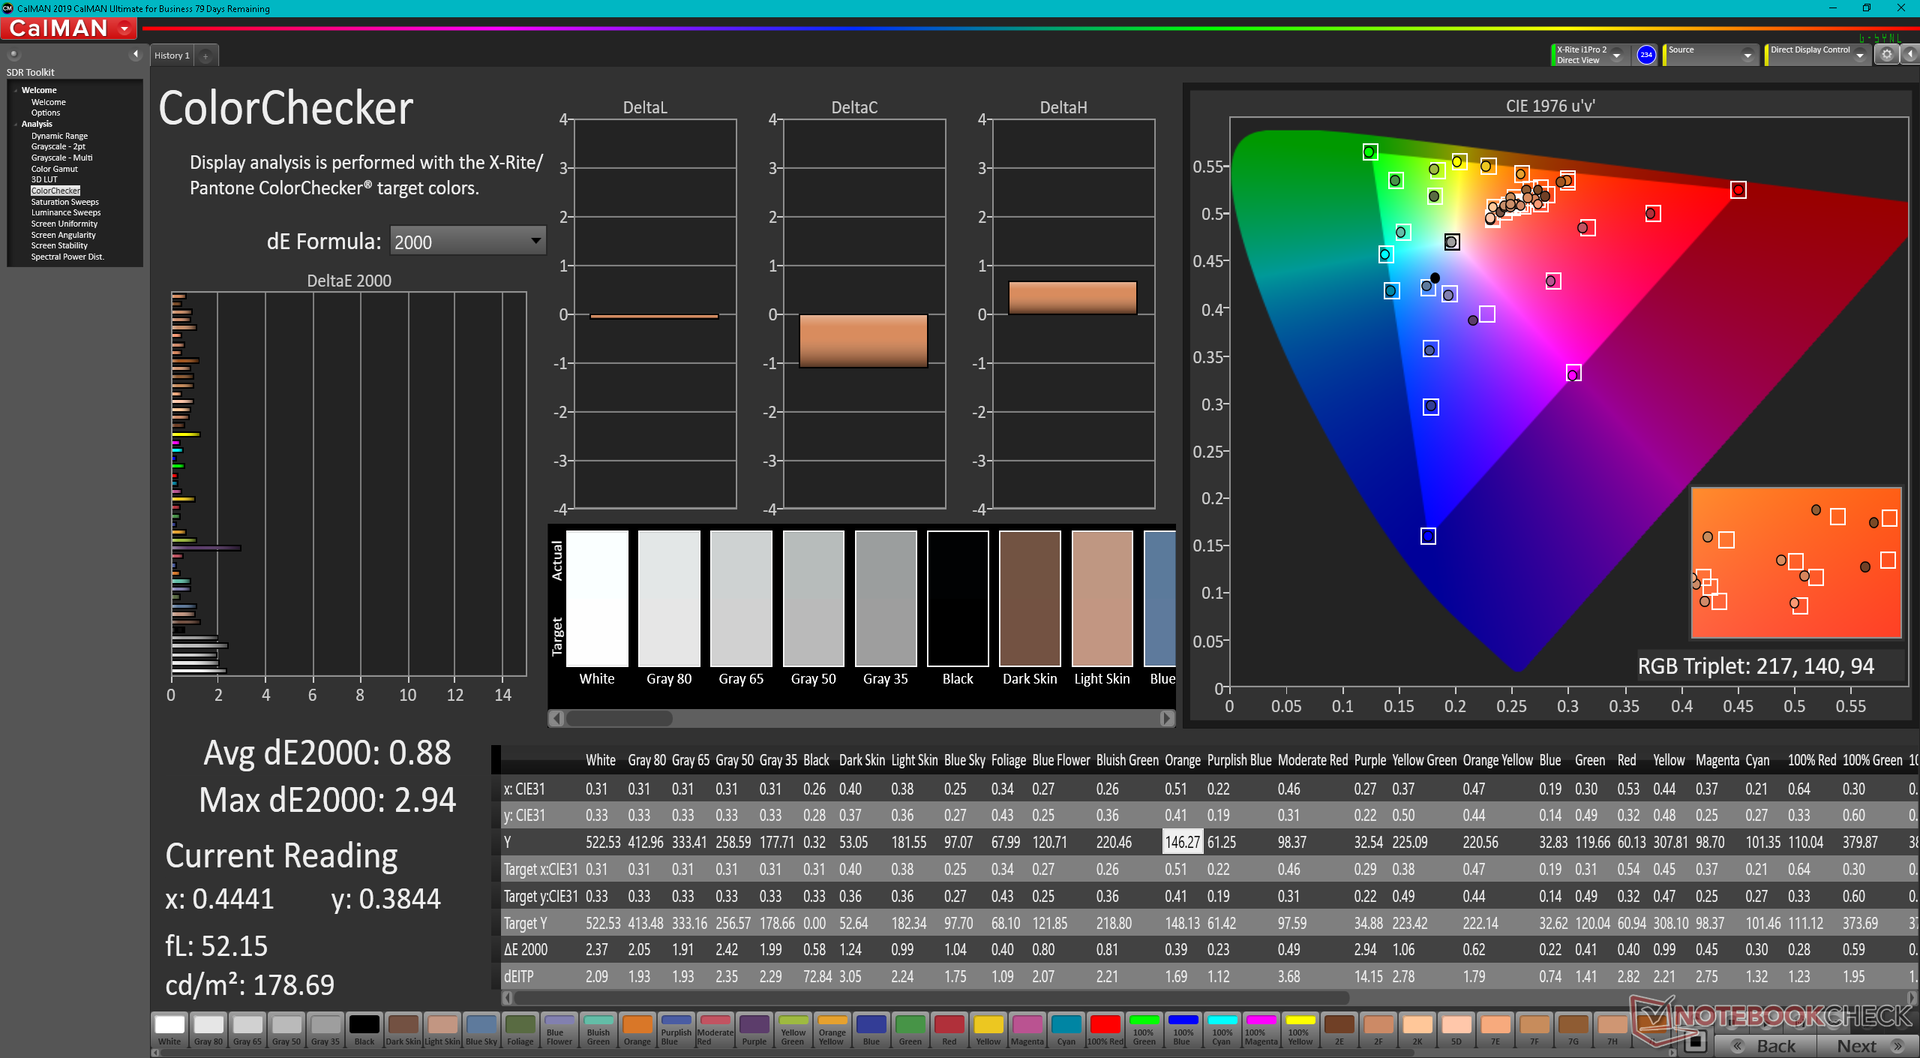
calibrated: 0.88
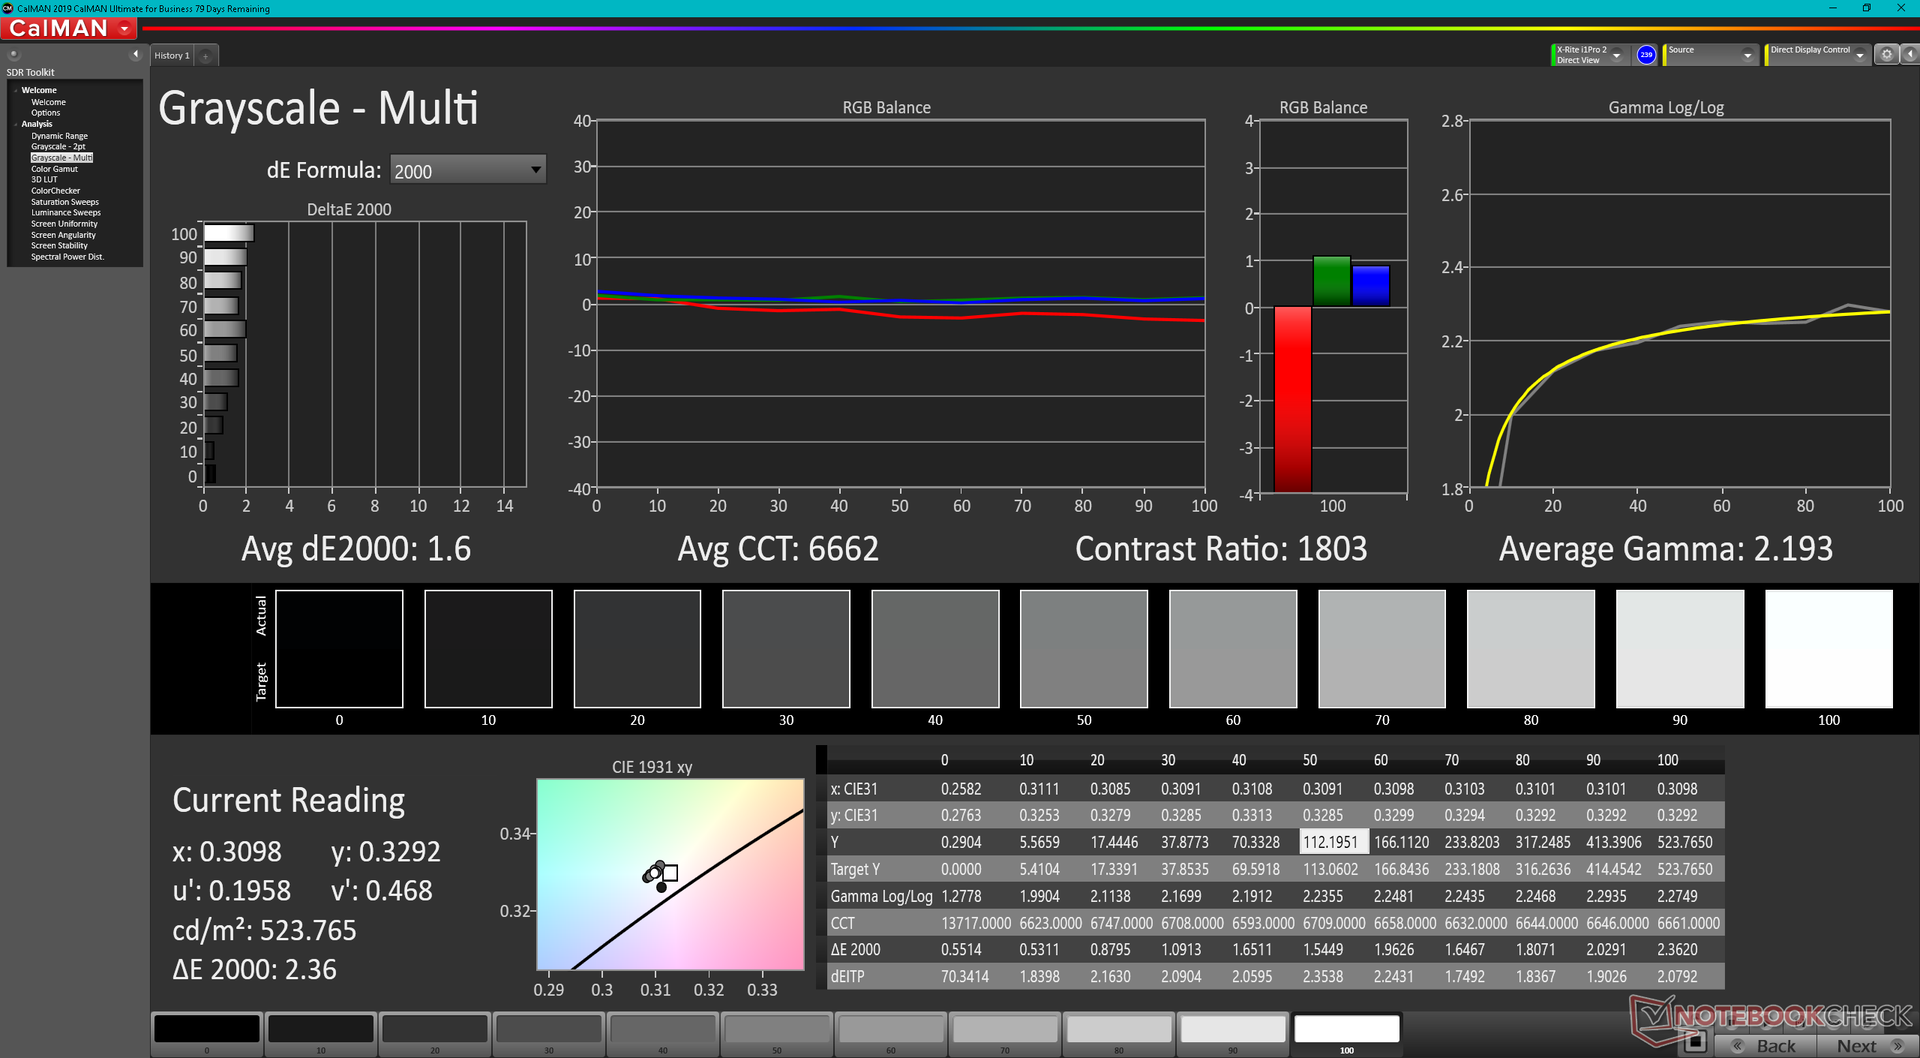
ΔE Greyscale Calman: 2.4 | ∀{0.09-98 Ø4.97}
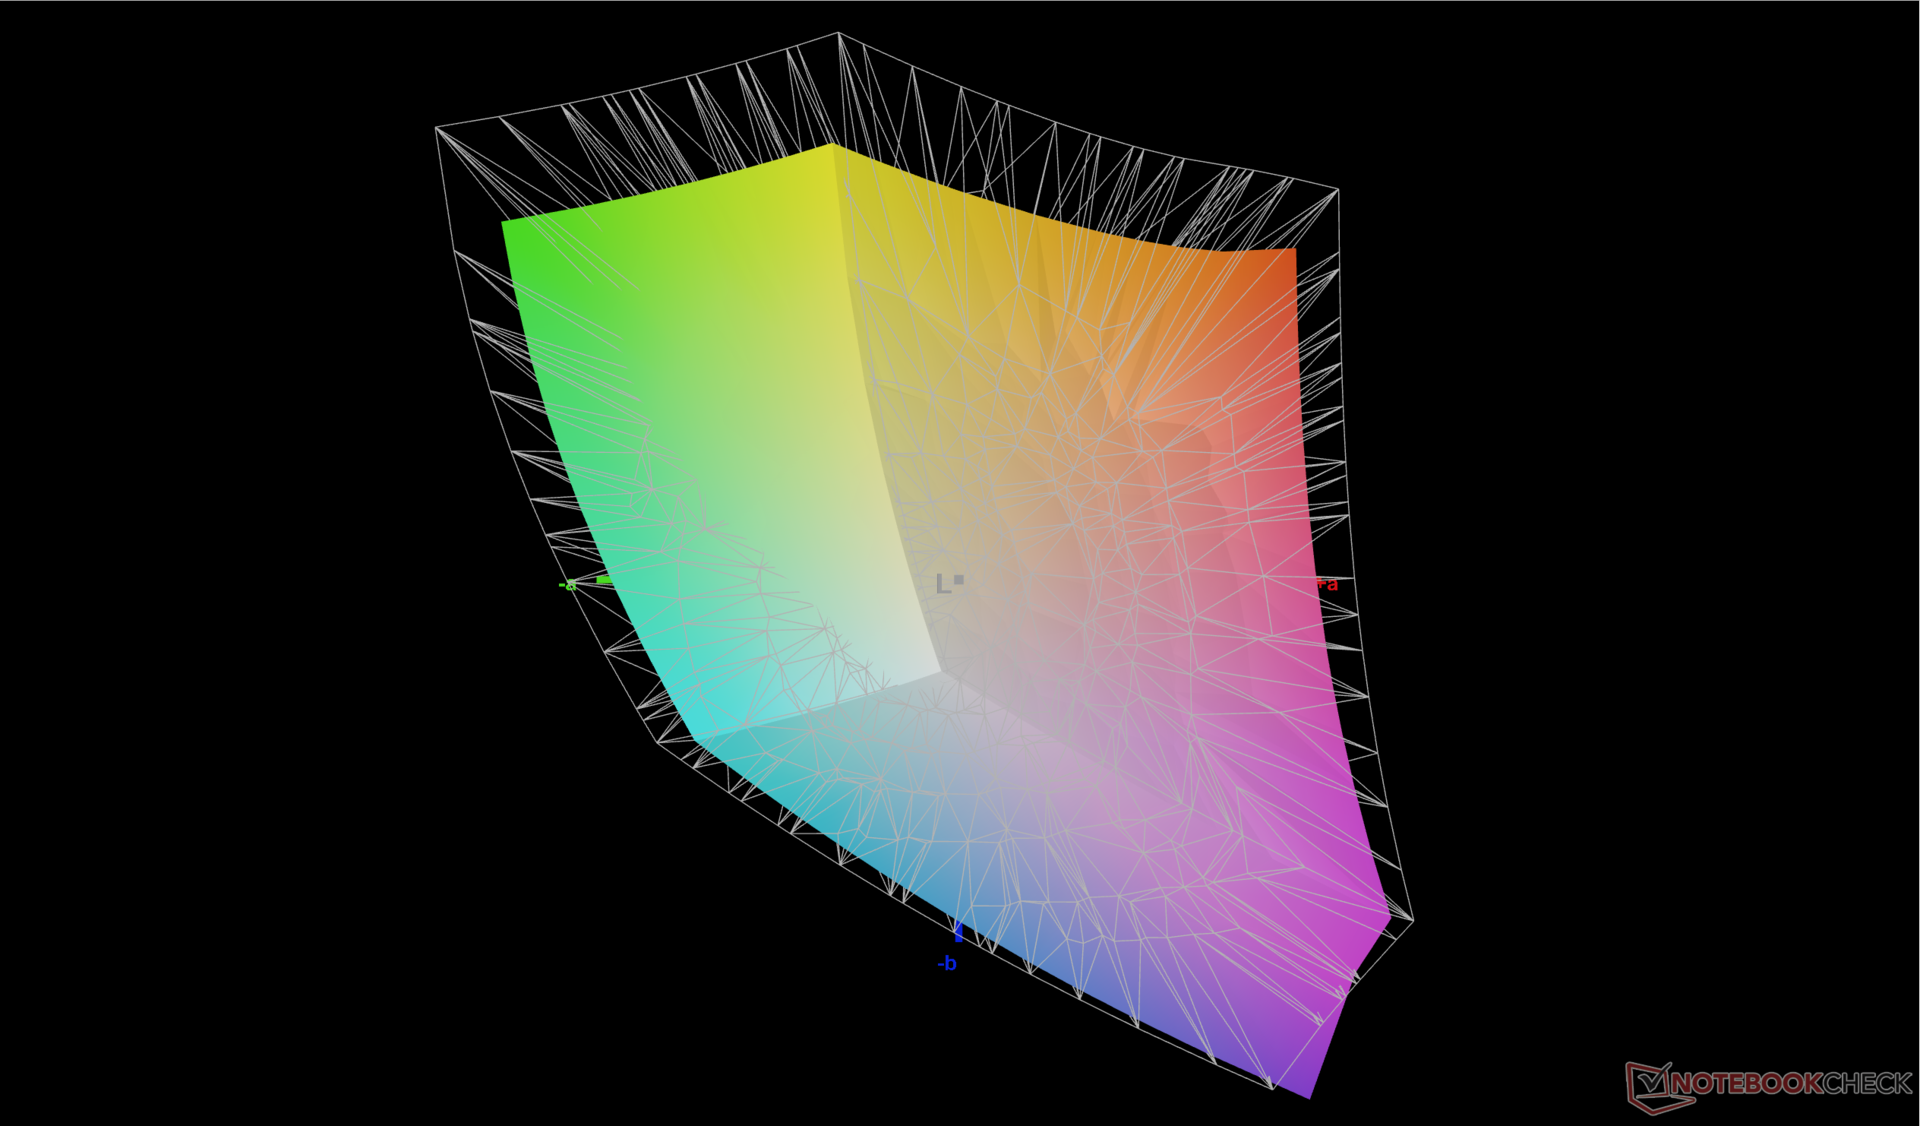
78.7% AdobeRGB 1998 (Argyll 3D)
100% sRGB (Argyll 3D)
79.3% Display P3 (Argyll 3D)
Gamma: 2.06
CCT: 6668 K
| Dell Precision 5000 5470 AU Optronics B140QAN, IPS, 2560x1600, 14" | Lenovo ThinkPad P15v G2 21A9000XGE N156HCA-EAC, IPS LED, 1920x1080, 15.6" | Dell Precision 5000 5560 Sharp LQ156R1, IPS, 3840x2400, 15.6" | Lenovo ThinkPad P14s G2 AMD MNE001EA1-5, IPS LED, 3840x2160, 14" | HP ZBook Firefly 14 G8 2C9Q2EA AU Optronics AUO068B, IPS, 1920x1080, 14" | HP ZBook Firefly 14 G7 InfoVision IVO8C78 (X140NVFC R0), IPS, 1920x1080, 14" | |
|---|---|---|---|---|---|---|
| Display | -41% | 16% | 10% | -7% | -4% | |
| Display P3 Coverage (%) | 79.3 | 43.7 -45% | 94.9 20% | 96.8 22% | 70 -12% | 73.8 -7% |
| sRGB Coverage (%) | 100 | 65.1 -35% | 100 0% | 99.9 0% | 99.5 0% | 99 -1% |
| AdobeRGB 1998 Coverage (%) | 78.7 | 45.3 -42% | 100 27% | 85.8 9% | 71.4 -9% | 75.5 -4% |
| Response Times | 11% | 8% | 8% | -7% | -19% | |
| Response Time Grey 50% / Grey 80% * (ms) | 52.4 ? | 48 ? 8% | 47.2 ? 10% | 52 ? 1% | 64.4 ? -23% | 54.8 ? -5% |
| Response Time Black / White * (ms) | 32.4 ? | 28 ? 14% | 30.4 ? 6% | 28 ? 14% | 29.2 ? 10% | 43.2 ? -33% |
| PWM Frequency (Hz) | 284.1 ? | |||||
| Screen | -116% | -24% | -19% | -10% | -27% | |
| Brightness middle (cd/m²) | 537 | 305 -43% | 501.5 -7% | 512 -5% | 461 -14% | 934 74% |
| Brightness (cd/m²) | 518 | 281 -46% | 467 -10% | 487 -6% | 439 -15% | 937 81% |
| Brightness Distribution (%) | 94 | 88 -6% | 83 -12% | 90 -4% | 89 -5% | 87 -7% |
| Black Level * (cd/m²) | 0.33 | 0.32 3% | 0.44 -33% | 0.35 -6% | 0.24 27% | 0.37 -12% |
| Contrast (:1) | 1627 | 953 -41% | 1140 -30% | 1463 -10% | 1921 18% | 2524 55% |
| Colorchecker dE 2000 * | 2.97 | 5.9 -99% | 4.73 -59% | 3.1 -4% | 2.6 12% | 4.7 -58% |
| Colorchecker dE 2000 max. * | 5.33 | 20.1 -277% | 8.45 -59% | 8.4 -58% | 5.8 -9% | 10.5 -97% |
| Colorchecker dE 2000 calibrated * | 0.88 | 4.5 -411% | 0.51 42% | 0.4 55% | 1.1 -25% | 1.6 -82% |
| Greyscale dE 2000 * | 2.4 | 5.3 -121% | 3.6 -50% | 5.5 -129% | 4.4 -83% | 7.1 -196% |
| Gamma | 2.06 107% | 2.1 105% | 2.08 106% | 2.22 99% | 2.29 96% | 2.31 95% |
| CCT | 6668 97% | 6307 103% | 6447 101% | 6373 102% | 6478 100% | 6348 102% |
| Color Space (Percent of AdobeRGB 1998) (%) | 65.2 | 68.5 | ||||
| Color Space (Percent of sRGB) (%) | 99.4 | 98.9 | ||||
| Média Total (Programa/Configurações) | -49% /
-82% | 0% /
-11% | -0% /
-9% | -8% /
-9% | -17% /
-21% |
* ... menor é melhor
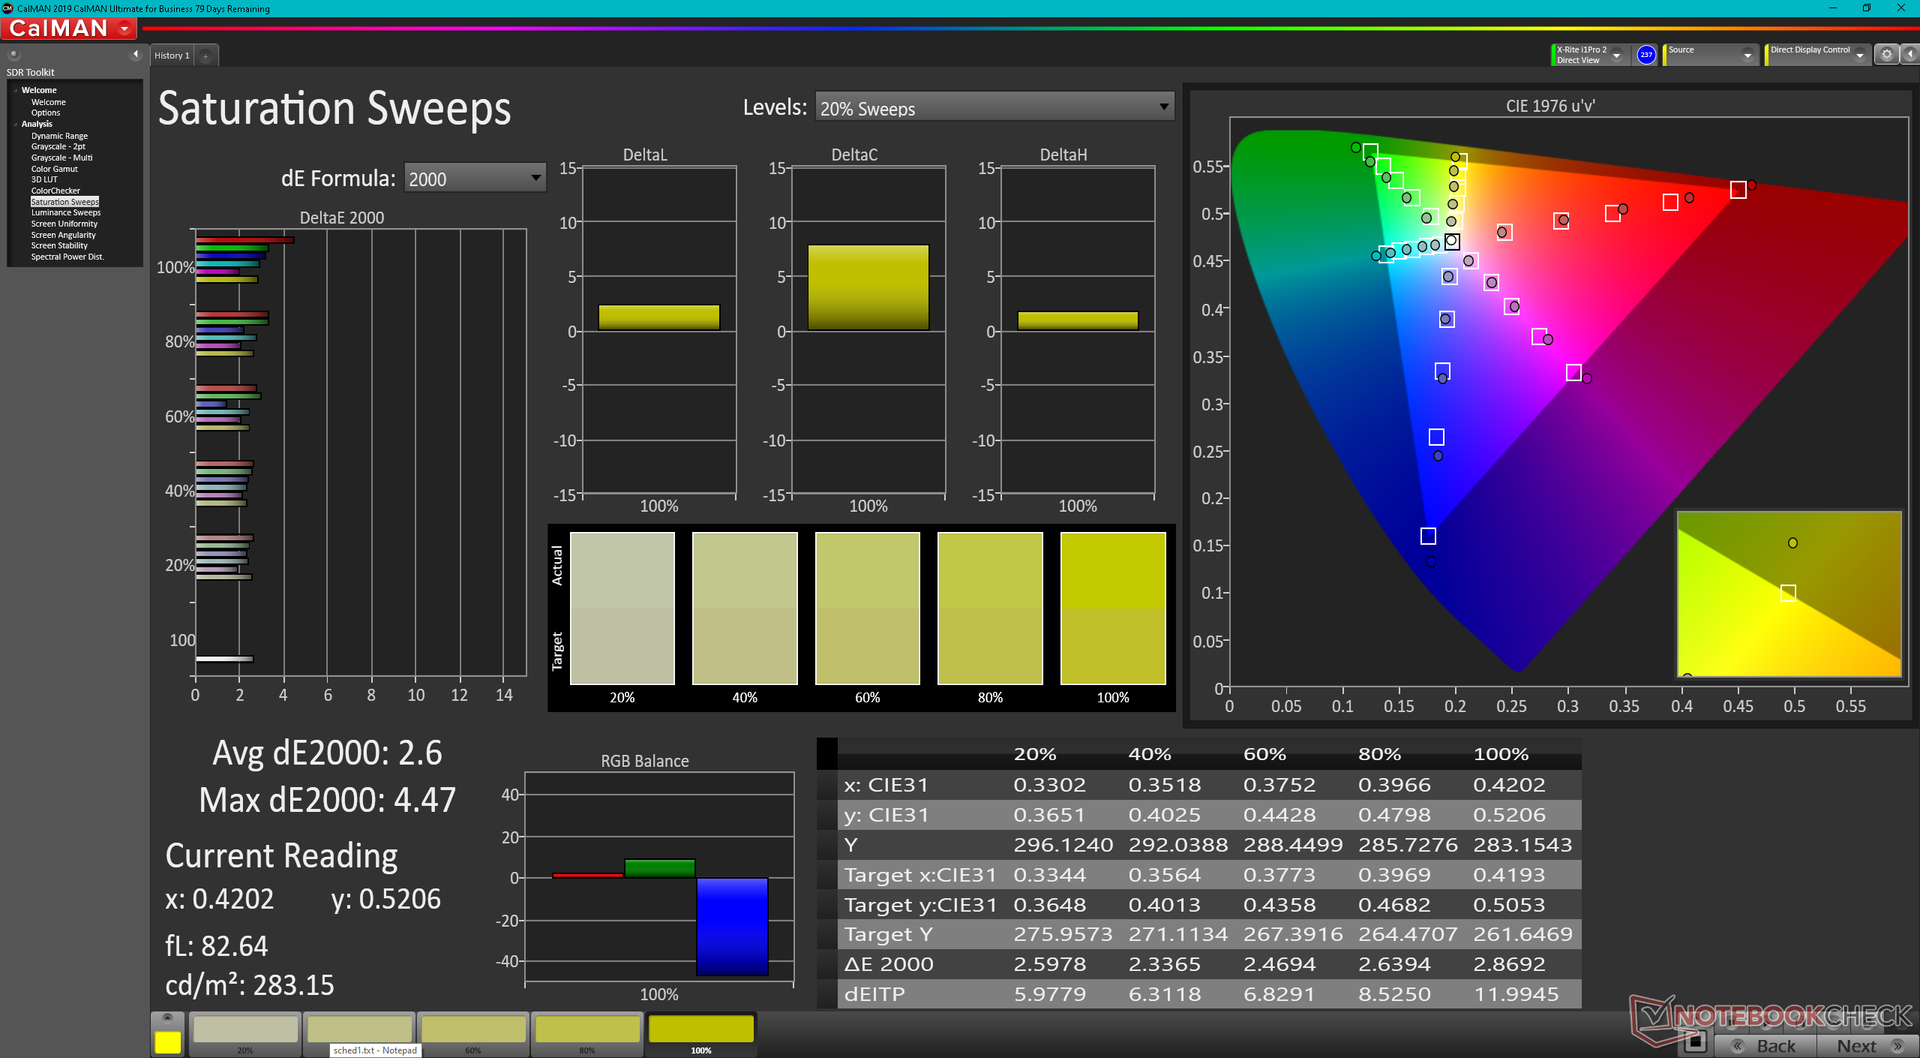
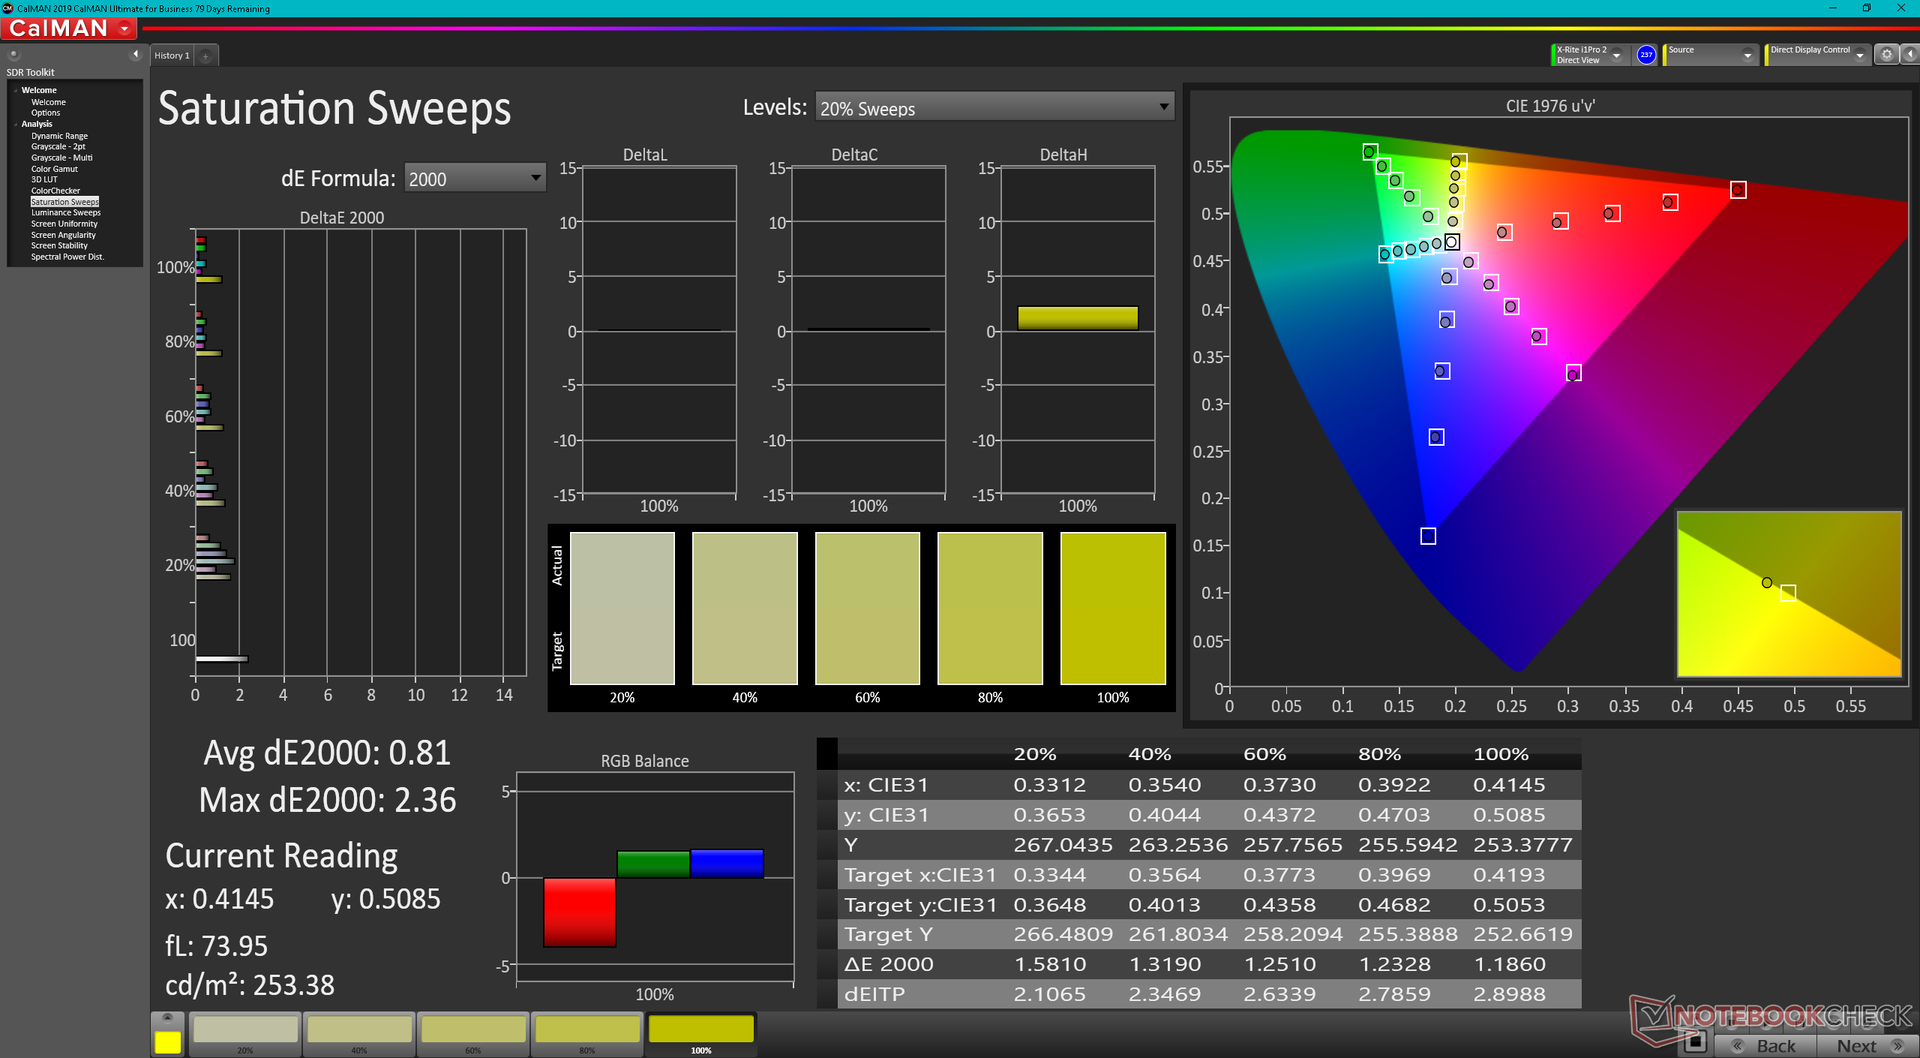
O display é bem calibrado fora da caixa em relação ao padrão sRGB com valores médios de escala de cinza e DeltaE de apenas 2,4 e 2,97, respectivamente. Podemos melhorar ainda mais estes valores com nosso colorímetro X-Rite para <2 cada um, como mostram os resultados do nosso CalMan abaixo.
Exibir tempos de resposta
| ↔ Tempo de resposta preto para branco | ||
|---|---|---|
| 32.4 ms ... ascensão ↗ e queda ↘ combinadas | ↗ 15.6 ms ascensão | 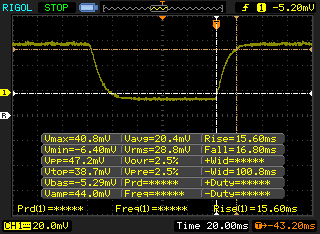 |
| ↘ 16.8 ms queda | ||
| A tela mostra taxas de resposta lentas em nossos testes e será insatisfatória para os jogadores. Em comparação, todos os dispositivos testados variam de 0.1 (mínimo) a 240 (máximo) ms. » 88 % de todos os dispositivos são melhores. Isso significa que o tempo de resposta medido é pior que a média de todos os dispositivos testados (19.8 ms). | ||
| ↔ Tempo de resposta 50% cinza a 80% cinza | ||
| 52.4 ms ... ascensão ↗ e queda ↘ combinadas | ↗ 24.4 ms ascensão | 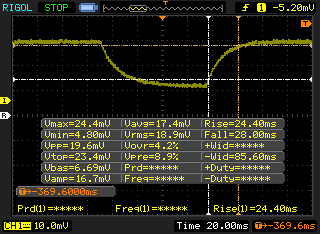 |
| ↘ 28 ms queda | ||
| A tela mostra taxas de resposta lentas em nossos testes e será insatisfatória para os jogadores. Em comparação, todos os dispositivos testados variam de 0.165 (mínimo) a 636 (máximo) ms. » 89 % de todos os dispositivos são melhores. Isso significa que o tempo de resposta medido é pior que a média de todos os dispositivos testados (31 ms). | ||
Cintilação da tela / PWM (modulação por largura de pulso)
| Tela tremeluzindo / PWM não detectado | 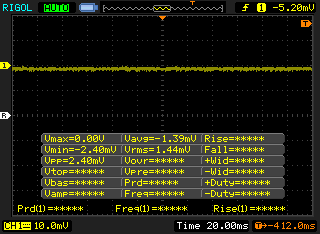 | ||
[pwm_comparison] Em comparação: 52 % de todos os dispositivos testados não usam PWM para escurecer a tela. Se PWM foi detectado, uma média de 7763 (mínimo: 5 - máximo: 343500) Hz foi medida. | |||
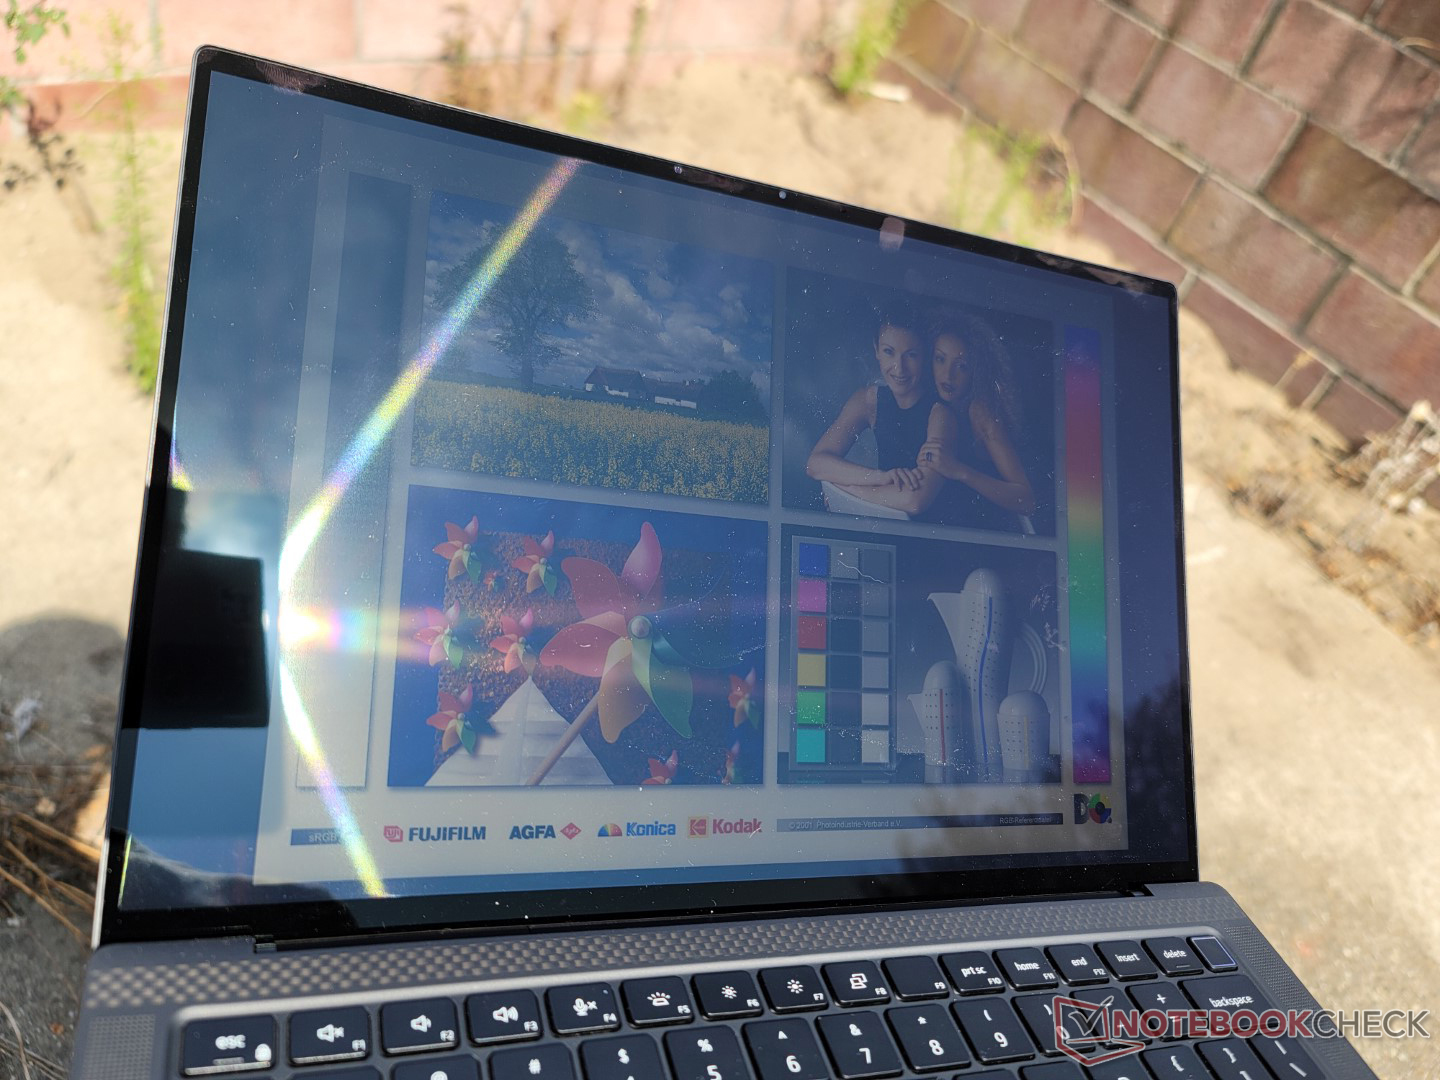
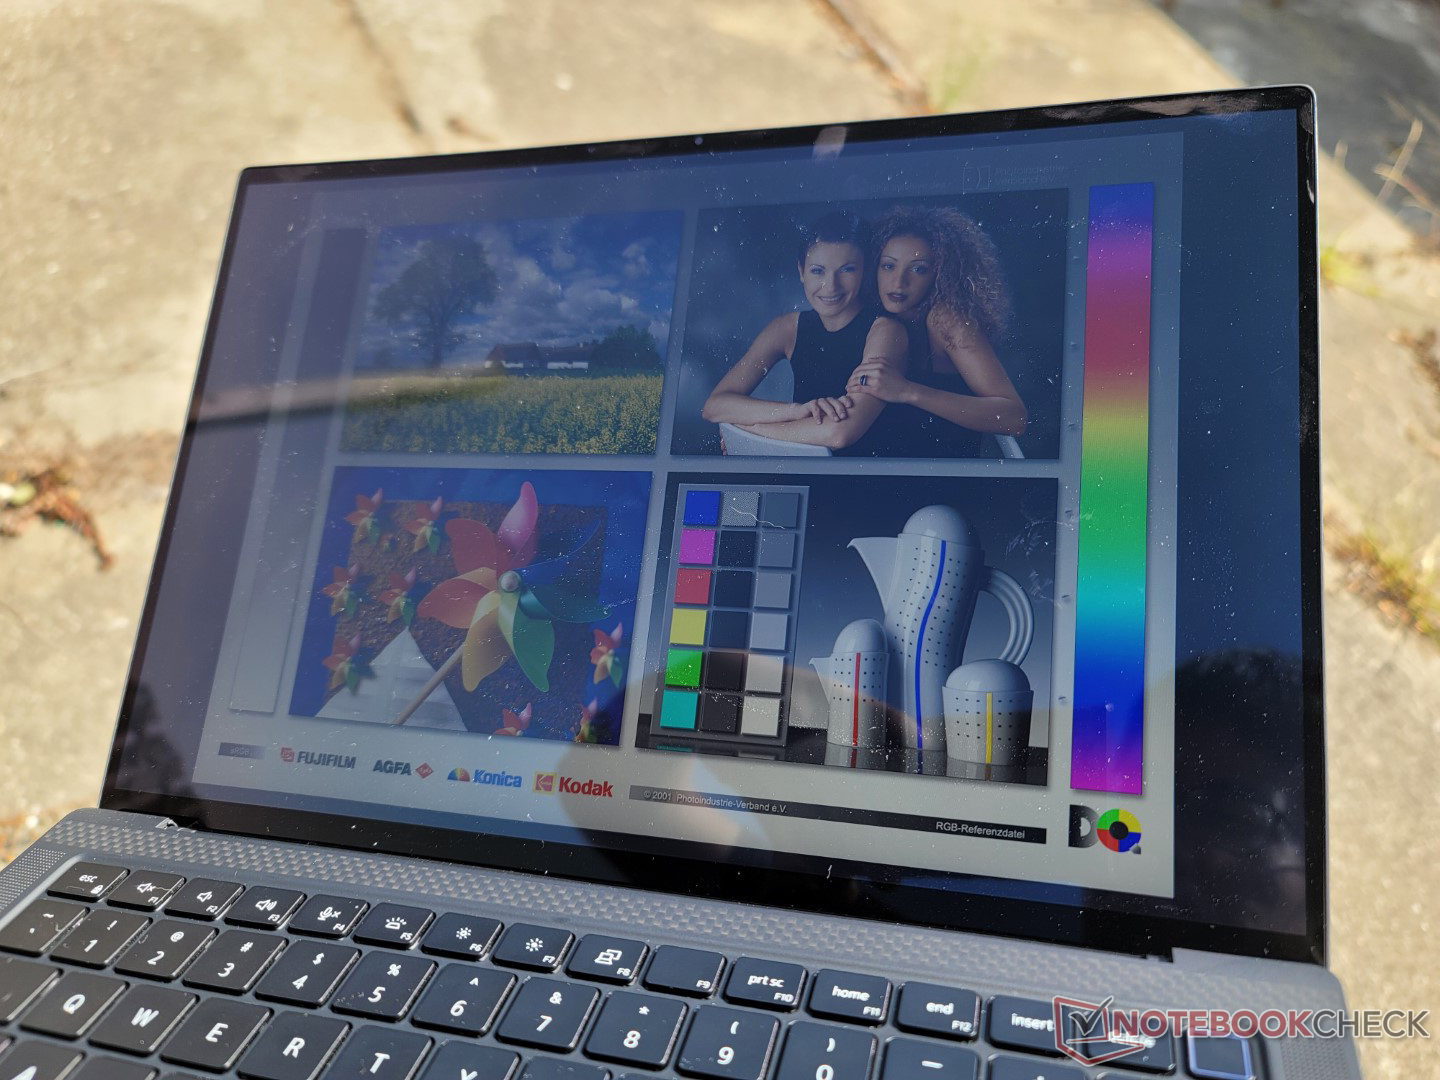
A tela é mais brilhante do que na maioria dos Ultrabooks baseados no consumidor para melhor visibilidade externa. No entanto, muitos HP EliteBook ou Modelos de ZBook oferecem opções de painel de 1000-nit para um tempo significativamente mais fácil ao ar livre. A Dell ainda tem que oferecer opções de brilho semelhantes para sua série Precision.
Desempenho - CPU Core i9 série H e GPU Discreta
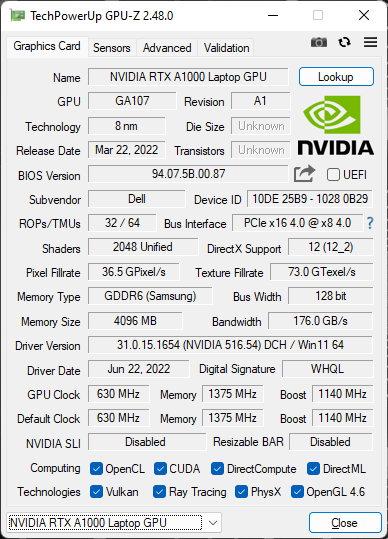
Condições de teste
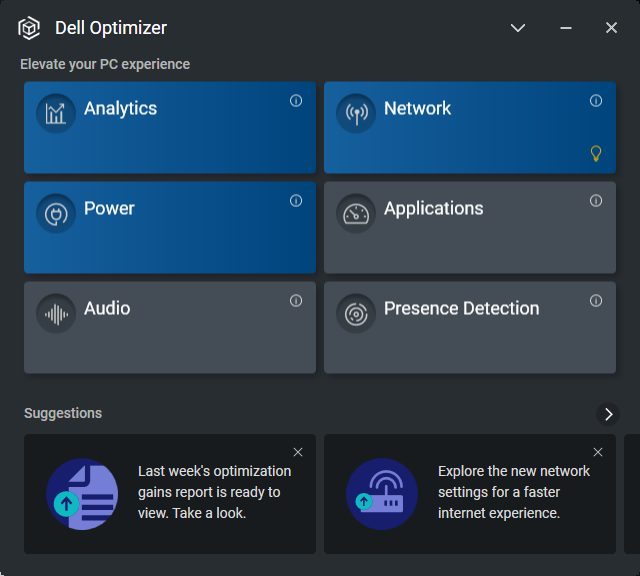
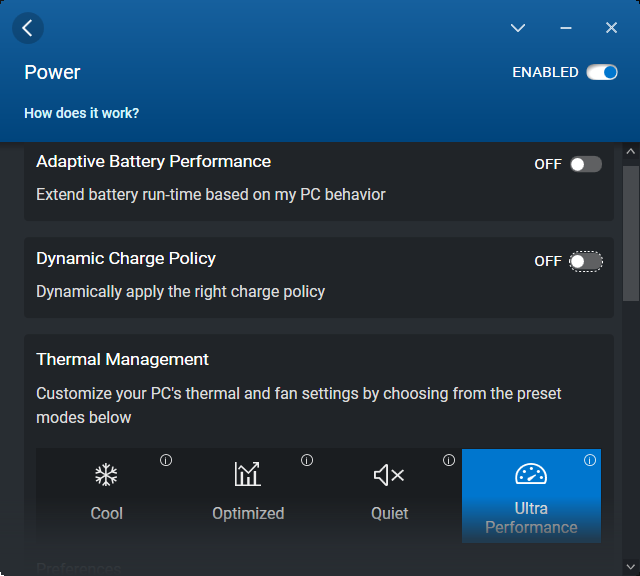
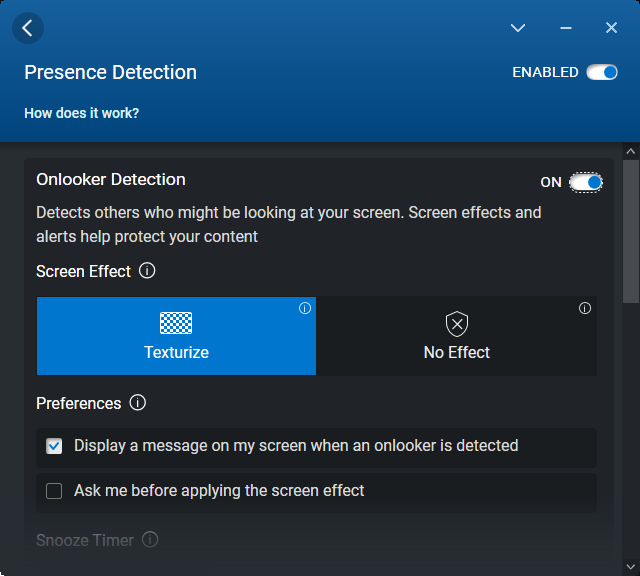
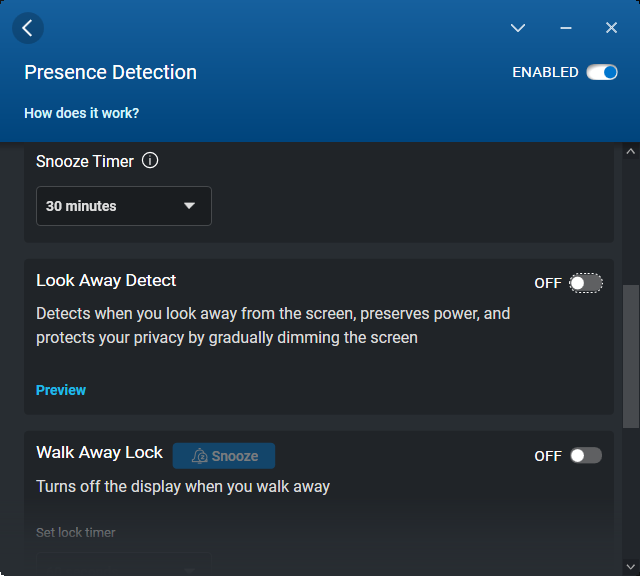
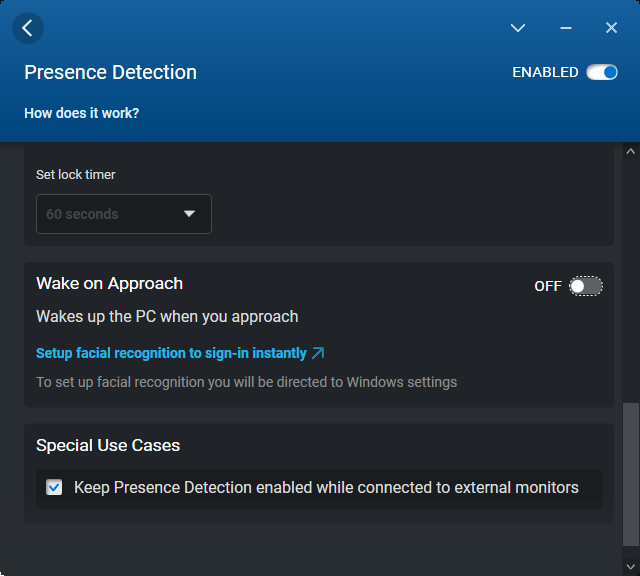
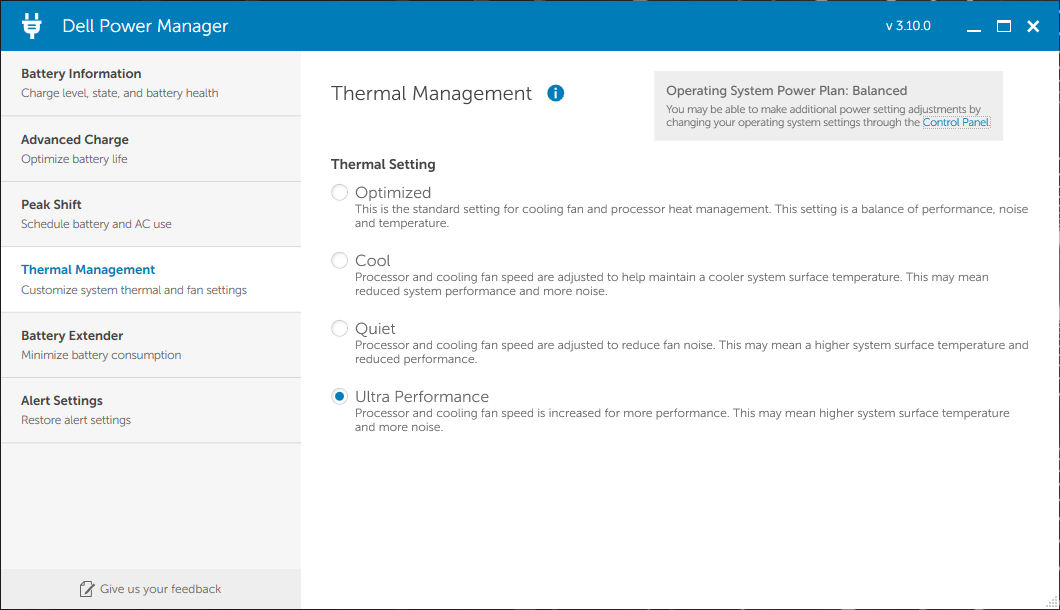
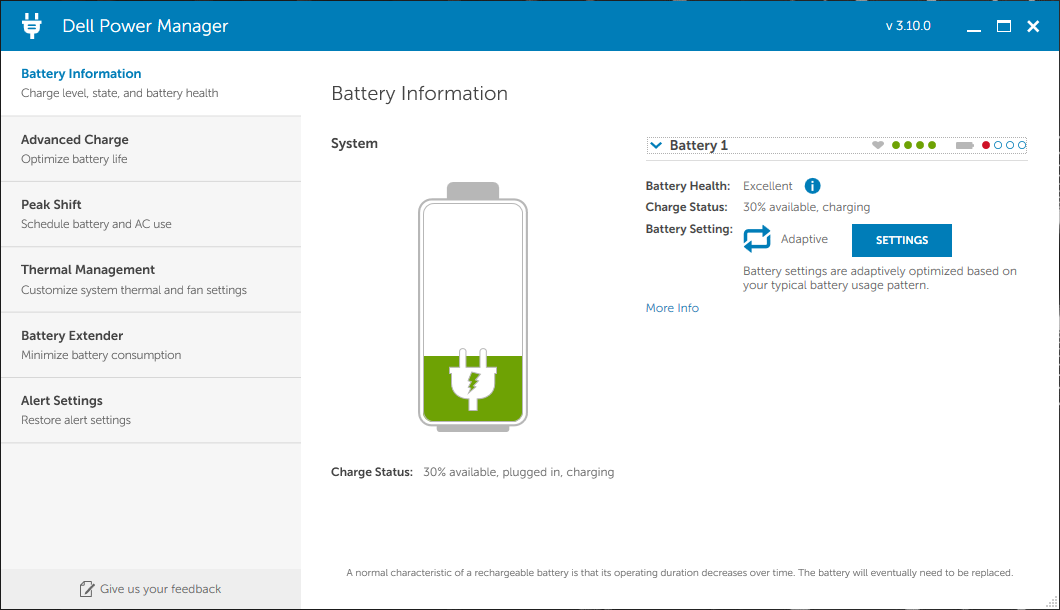
Ajustamos nossa unidade para o modo Ultra Performance através do software Dell Optimizer antes de executar quaisquer benchmarks abaixo. Também ativamos a GPU Nvidia discreta via Nvidia Control Panel. Note que as mesmas configurações de potência podem ser configuradas através do Dell Power Manager ou do Dell Optimizer. Felizmente, fazer mudanças de perfil de potência em um programa irá alterar automaticamente as configurações no outro.
Processador
O desempenho da CPU é um saco misto. Quando comparado a outros laptops ou estações de trabalho comerciais de 14 polegadas, o Precision 5470 oferece um desempenho significativamente mais rápido para estar ao mesmo nível de estações de trabalho ainda maiores, como a MSI WE76 ou HP ZBook Fury 17 G8. Trata-se essencialmente de uma CPU projetada para laptops mais grossos espremidos em um fator de forma de 14 polegadas. Quando comparada a outros laptops com o mesmo Núcleo i9-12900H CPU, entretanto, o processador em nosso Precision é mais lento em cerca de 15 a 20% em média.
Outro inconveniente para a CPU é sua taxa de relógio instável. Ao executar o CineBench R15 xT em loop, por exemplo, a pontuação flutuaria entre 1500 e 2100 pontos, como mostra nosso gráfico abaixo para sugerir taxas de relógio flutuantes. Em comparação, tal flutuação não ocorreria ao executar o mesmo teste no HP ZBook Fury 17 G8 ou MSI Creator Z17 cada um com CPUs Core classe i9.
Cinebench R15 Multi Loop
Cinebench R23: Multi Core | Single Core
Cinebench R15: CPU Multi 64Bit | CPU Single 64Bit
Blender: v2.79 BMW27 CPU
7-Zip 18.03: 7z b 4 | 7z b 4 -mmt1
Geekbench 5.5: Multi-Core | Single-Core
HWBOT x265 Benchmark v2.2: 4k Preset
LibreOffice : 20 Documents To PDF
R Benchmark 2.5: Overall mean
Cinebench R23: Multi Core | Single Core
Cinebench R15: CPU Multi 64Bit | CPU Single 64Bit
Blender: v2.79 BMW27 CPU
7-Zip 18.03: 7z b 4 | 7z b 4 -mmt1
Geekbench 5.5: Multi-Core | Single-Core
HWBOT x265 Benchmark v2.2: 4k Preset
LibreOffice : 20 Documents To PDF
R Benchmark 2.5: Overall mean
* ... menor é melhor
AIDA64: FP32 Ray-Trace | FPU Julia | CPU SHA3 | CPU Queen | FPU SinJulia | FPU Mandel | CPU AES | CPU ZLib | FP64 Ray-Trace | CPU PhotoWorxx
| Performance rating | |
| Média Intel Core i9-12900H | |
| Dell Precision 5000 5470 | |
| Lenovo ThinkPad P14s G2 AMD | |
| Lenovo ThinkPad P15v G2 21A9000XGE | |
| HP ZBook Firefly 14 G8 2C9Q2EA | |
| HP ZBook Firefly 14 G7 | |
| AIDA64 / FP32 Ray-Trace | |
| Dell Precision 5000 5470 | |
| Lenovo ThinkPad P15v G2 21A9000XGE | |
| Média Intel Core i9-12900H (4074 - 18289, n=29) | |
| Lenovo ThinkPad P14s G2 AMD | |
| HP ZBook Firefly 14 G8 2C9Q2EA | |
| HP ZBook Firefly 14 G7 | |
| AIDA64 / FPU Julia | |
| Lenovo ThinkPad P14s G2 AMD | |
| Dell Precision 5000 5470 | |
| Média Intel Core i9-12900H (22307 - 93236, n=29) | |
| Lenovo ThinkPad P15v G2 21A9000XGE | |
| HP ZBook Firefly 14 G8 2C9Q2EA | |
| HP ZBook Firefly 14 G7 | |
| AIDA64 / CPU SHA3 | |
| Lenovo ThinkPad P15v G2 21A9000XGE | |
| Média Intel Core i9-12900H (1378 - 4215, n=29) | |
| Dell Precision 5000 5470 | |
| Lenovo ThinkPad P14s G2 AMD | |
| HP ZBook Firefly 14 G8 2C9Q2EA | |
| HP ZBook Firefly 14 G7 | |
| AIDA64 / CPU Queen | |
| Dell Precision 5000 5470 | |
| Média Intel Core i9-12900H (78172 - 111241, n=28) | |
| Lenovo ThinkPad P15v G2 21A9000XGE | |
| Lenovo ThinkPad P14s G2 AMD | |
| HP ZBook Firefly 14 G7 | |
| HP ZBook Firefly 14 G8 2C9Q2EA | |
| AIDA64 / FPU SinJulia | |
| Lenovo ThinkPad P14s G2 AMD | |
| Média Intel Core i9-12900H (5709 - 10410, n=29) | |
| Lenovo ThinkPad P15v G2 21A9000XGE | |
| Dell Precision 5000 5470 | |
| HP ZBook Firefly 14 G8 2C9Q2EA | |
| HP ZBook Firefly 14 G7 | |
| AIDA64 / FPU Mandel | |
| Lenovo ThinkPad P14s G2 AMD | |
| Dell Precision 5000 5470 | |
| Lenovo ThinkPad P15v G2 21A9000XGE | |
| Média Intel Core i9-12900H (11257 - 45581, n=29) | |
| HP ZBook Firefly 14 G8 2C9Q2EA | |
| HP ZBook Firefly 14 G7 | |
| AIDA64 / CPU AES | |
| Lenovo ThinkPad P14s G2 AMD | |
| Média Intel Core i9-12900H (31935 - 151546, n=29) | |
| Lenovo ThinkPad P15v G2 21A9000XGE | |
| HP ZBook Firefly 14 G8 2C9Q2EA | |
| Dell Precision 5000 5470 | |
| HP ZBook Firefly 14 G7 | |
| AIDA64 / CPU ZLib | |
| Média Intel Core i9-12900H (449 - 1193, n=29) | |
| Lenovo ThinkPad P15v G2 21A9000XGE | |
| Lenovo ThinkPad P14s G2 AMD | |
| Dell Precision 5000 5470 | |
| HP ZBook Firefly 14 G8 2C9Q2EA | |
| HP ZBook Firefly 14 G7 | |
| AIDA64 / FP64 Ray-Trace | |
| Dell Precision 5000 5470 | |
| Lenovo ThinkPad P15v G2 21A9000XGE | |
| Média Intel Core i9-12900H (2235 - 10511, n=29) | |
| Lenovo ThinkPad P14s G2 AMD | |
| HP ZBook Firefly 14 G8 2C9Q2EA | |
| HP ZBook Firefly 14 G7 | |
| AIDA64 / CPU PhotoWorxx | |
| Dell Precision 5000 5470 | |
| Média Intel Core i9-12900H (20960 - 48269, n=30) | |
| HP ZBook Firefly 14 G8 2C9Q2EA | |
| HP ZBook Firefly 14 G7 | |
| Lenovo ThinkPad P14s G2 AMD | |
| Lenovo ThinkPad P15v G2 21A9000XGE | |
Desempenho do sistema
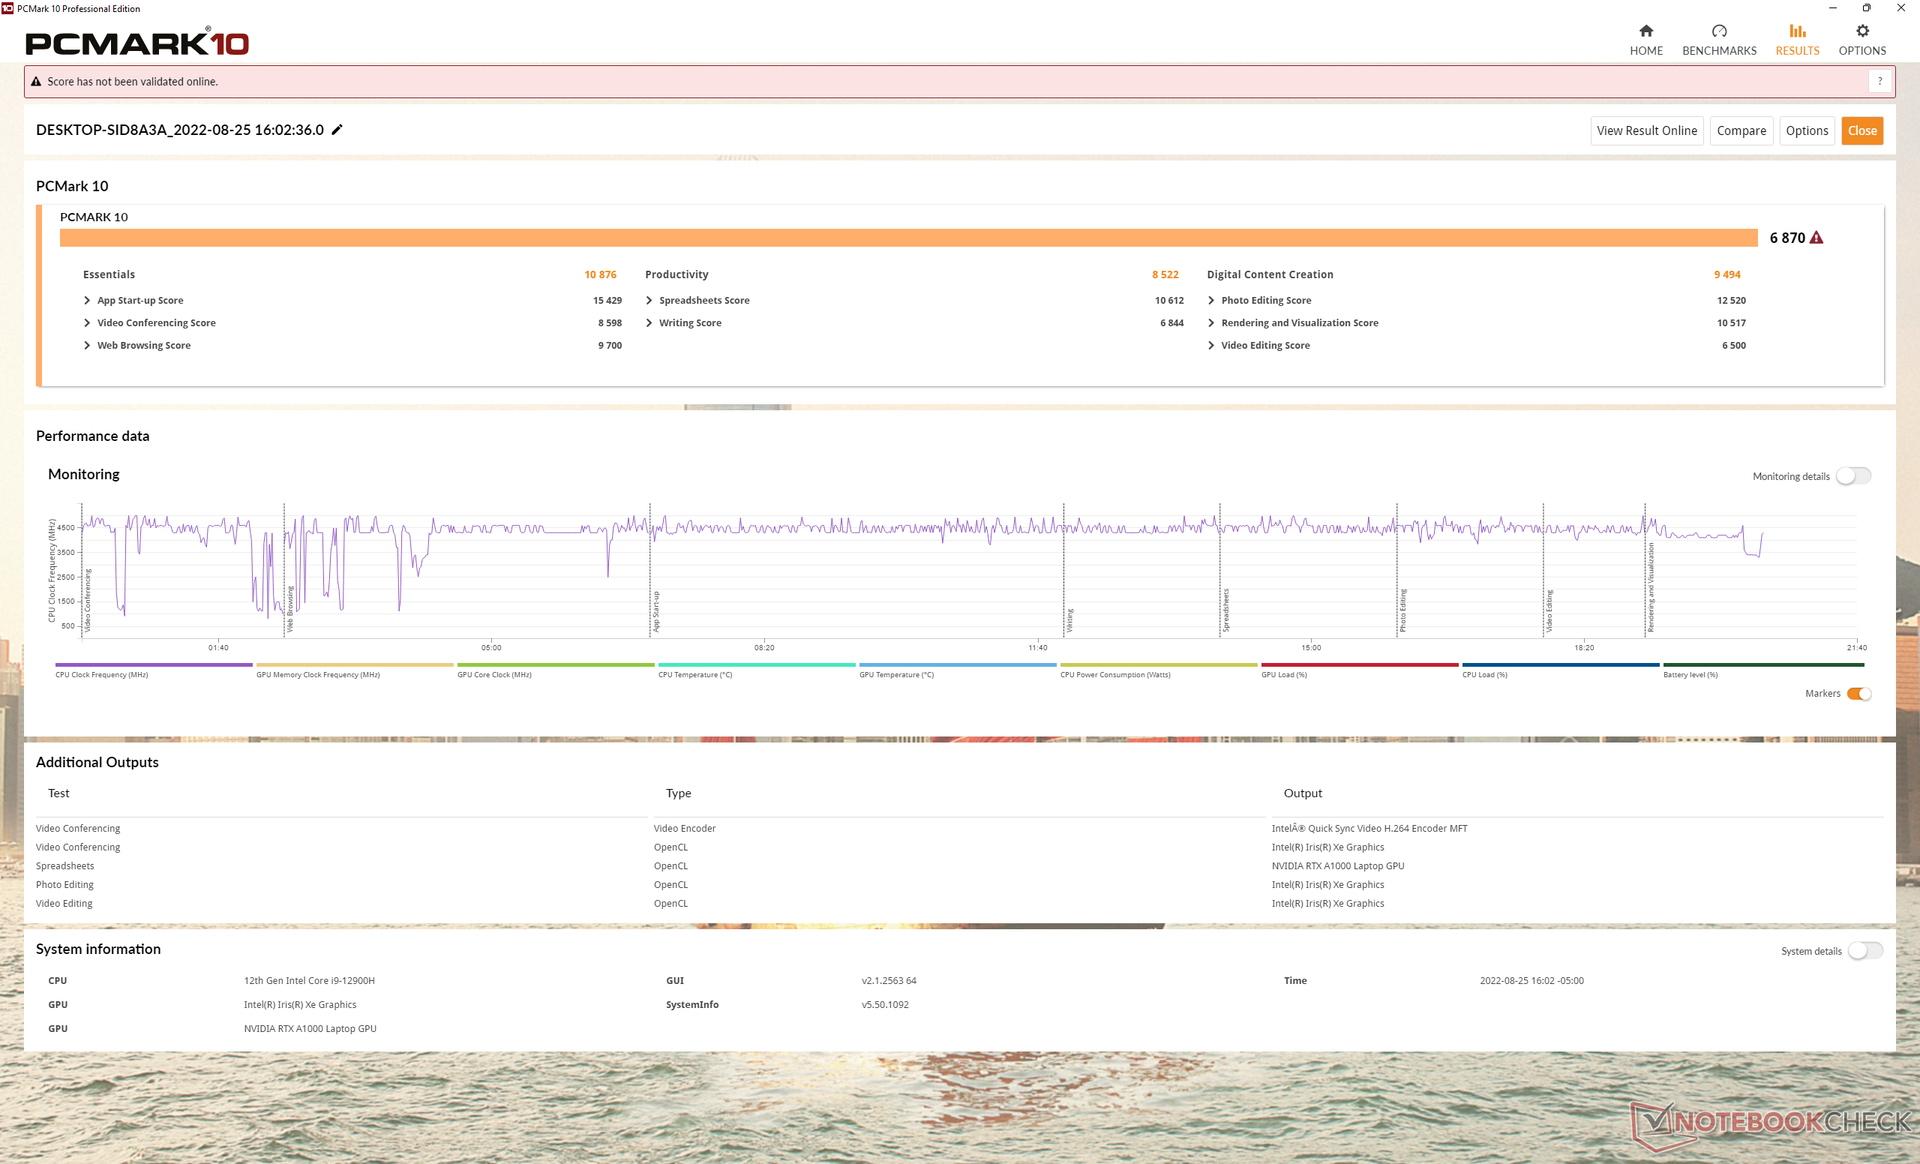
Os resultados do PCMark 10 são mais altos do que o esperado quando comparados a outras estações de trabalho móveis. Atribuímos isto à CPU Core i9 série H da 12ª geração e SSD PCIe4 x4, que são opções relativamente incomuns para uma estação de trabalho de 14 polegadas.
CrossMark: Overall | Productivity | Creativity | Responsiveness
| PCMark 10 / Score | |
| Dell Precision 5000 5470 | |
| Média Intel Core i9-12900H, NVIDIA RTX A1000 Laptop GPU (n=1) | |
| Dell Precision 5000 5560 | |
| Lenovo ThinkPad P15v G2 21A9000XGE | |
| Lenovo ThinkPad P14s G2 AMD | |
| HP ZBook Firefly 14 G8 2C9Q2EA | |
| HP ZBook Firefly 14 G7 | |
| PCMark 10 / Essentials | |
| Dell Precision 5000 5470 | |
| Média Intel Core i9-12900H, NVIDIA RTX A1000 Laptop GPU (n=1) | |
| Dell Precision 5000 5560 | |
| Lenovo ThinkPad P15v G2 21A9000XGE | |
| Lenovo ThinkPad P14s G2 AMD | |
| HP ZBook Firefly 14 G8 2C9Q2EA | |
| HP ZBook Firefly 14 G7 | |
| PCMark 10 / Productivity | |
| Dell Precision 5000 5560 | |
| Lenovo ThinkPad P14s G2 AMD | |
| Dell Precision 5000 5470 | |
| Média Intel Core i9-12900H, NVIDIA RTX A1000 Laptop GPU (n=1) | |
| HP ZBook Firefly 14 G8 2C9Q2EA | |
| Lenovo ThinkPad P15v G2 21A9000XGE | |
| HP ZBook Firefly 14 G7 | |
| PCMark 10 / Digital Content Creation | |
| Dell Precision 5000 5470 | |
| Média Intel Core i9-12900H, NVIDIA RTX A1000 Laptop GPU (n=1) | |
| Dell Precision 5000 5560 | |
| Lenovo ThinkPad P15v G2 21A9000XGE | |
| Lenovo ThinkPad P14s G2 AMD | |
| HP ZBook Firefly 14 G8 2C9Q2EA | |
| HP ZBook Firefly 14 G7 | |
| CrossMark / Overall | |
| Dell Precision 5000 5470 | |
| Média Intel Core i9-12900H, NVIDIA RTX A1000 Laptop GPU (n=1) | |
| Lenovo ThinkPad P15v G2 21A9000XGE | |
| CrossMark / Productivity | |
| Dell Precision 5000 5470 | |
| Média Intel Core i9-12900H, NVIDIA RTX A1000 Laptop GPU (n=1) | |
| Lenovo ThinkPad P15v G2 21A9000XGE | |
| CrossMark / Creativity | |
| Dell Precision 5000 5470 | |
| Média Intel Core i9-12900H, NVIDIA RTX A1000 Laptop GPU (n=1) | |
| Lenovo ThinkPad P15v G2 21A9000XGE | |
| CrossMark / Responsiveness | |
| Dell Precision 5000 5470 | |
| Média Intel Core i9-12900H, NVIDIA RTX A1000 Laptop GPU (n=1) | |
| Lenovo ThinkPad P15v G2 21A9000XGE | |
| PCMark 10 Score | 6870 pontos | |
Ajuda | ||
| AIDA64 / Memory Copy | |
| Dell Precision 5000 5470 | |
| Média Intel Core i9-12900H (34438 - 74264, n=29) | |
| Lenovo ThinkPad P14s G2 AMD | |
| HP ZBook Firefly 14 G8 2C9Q2EA | |
| HP ZBook Firefly 14 G7 | |
| Lenovo ThinkPad P15v G2 21A9000XGE | |
| AIDA64 / Memory Read | |
| Dell Precision 5000 5470 | |
| Média Intel Core i9-12900H (36365 - 74642, n=29) | |
| Lenovo ThinkPad P14s G2 AMD | |
| HP ZBook Firefly 14 G8 2C9Q2EA | |
| HP ZBook Firefly 14 G7 | |
| Lenovo ThinkPad P15v G2 21A9000XGE | |
| AIDA64 / Memory Write | |
| Dell Precision 5000 5470 | |
| Média Intel Core i9-12900H (32276 - 67858, n=29) | |
| HP ZBook Firefly 14 G8 2C9Q2EA | |
| Lenovo ThinkPad P14s G2 AMD | |
| HP ZBook Firefly 14 G7 | |
| Lenovo ThinkPad P15v G2 21A9000XGE | |
| AIDA64 / Memory Latency | |
| Dell Precision 5000 5470 | |
| Lenovo ThinkPad P14s G2 AMD | |
| Lenovo ThinkPad P15v G2 21A9000XGE | |
| Média Intel Core i9-12900H (74.7 - 118.1, n=28) | |
| HP ZBook Firefly 14 G7 | |
| HP ZBook Firefly 14 G8 2C9Q2EA | |
* ... menor é melhor
Latência do DPC
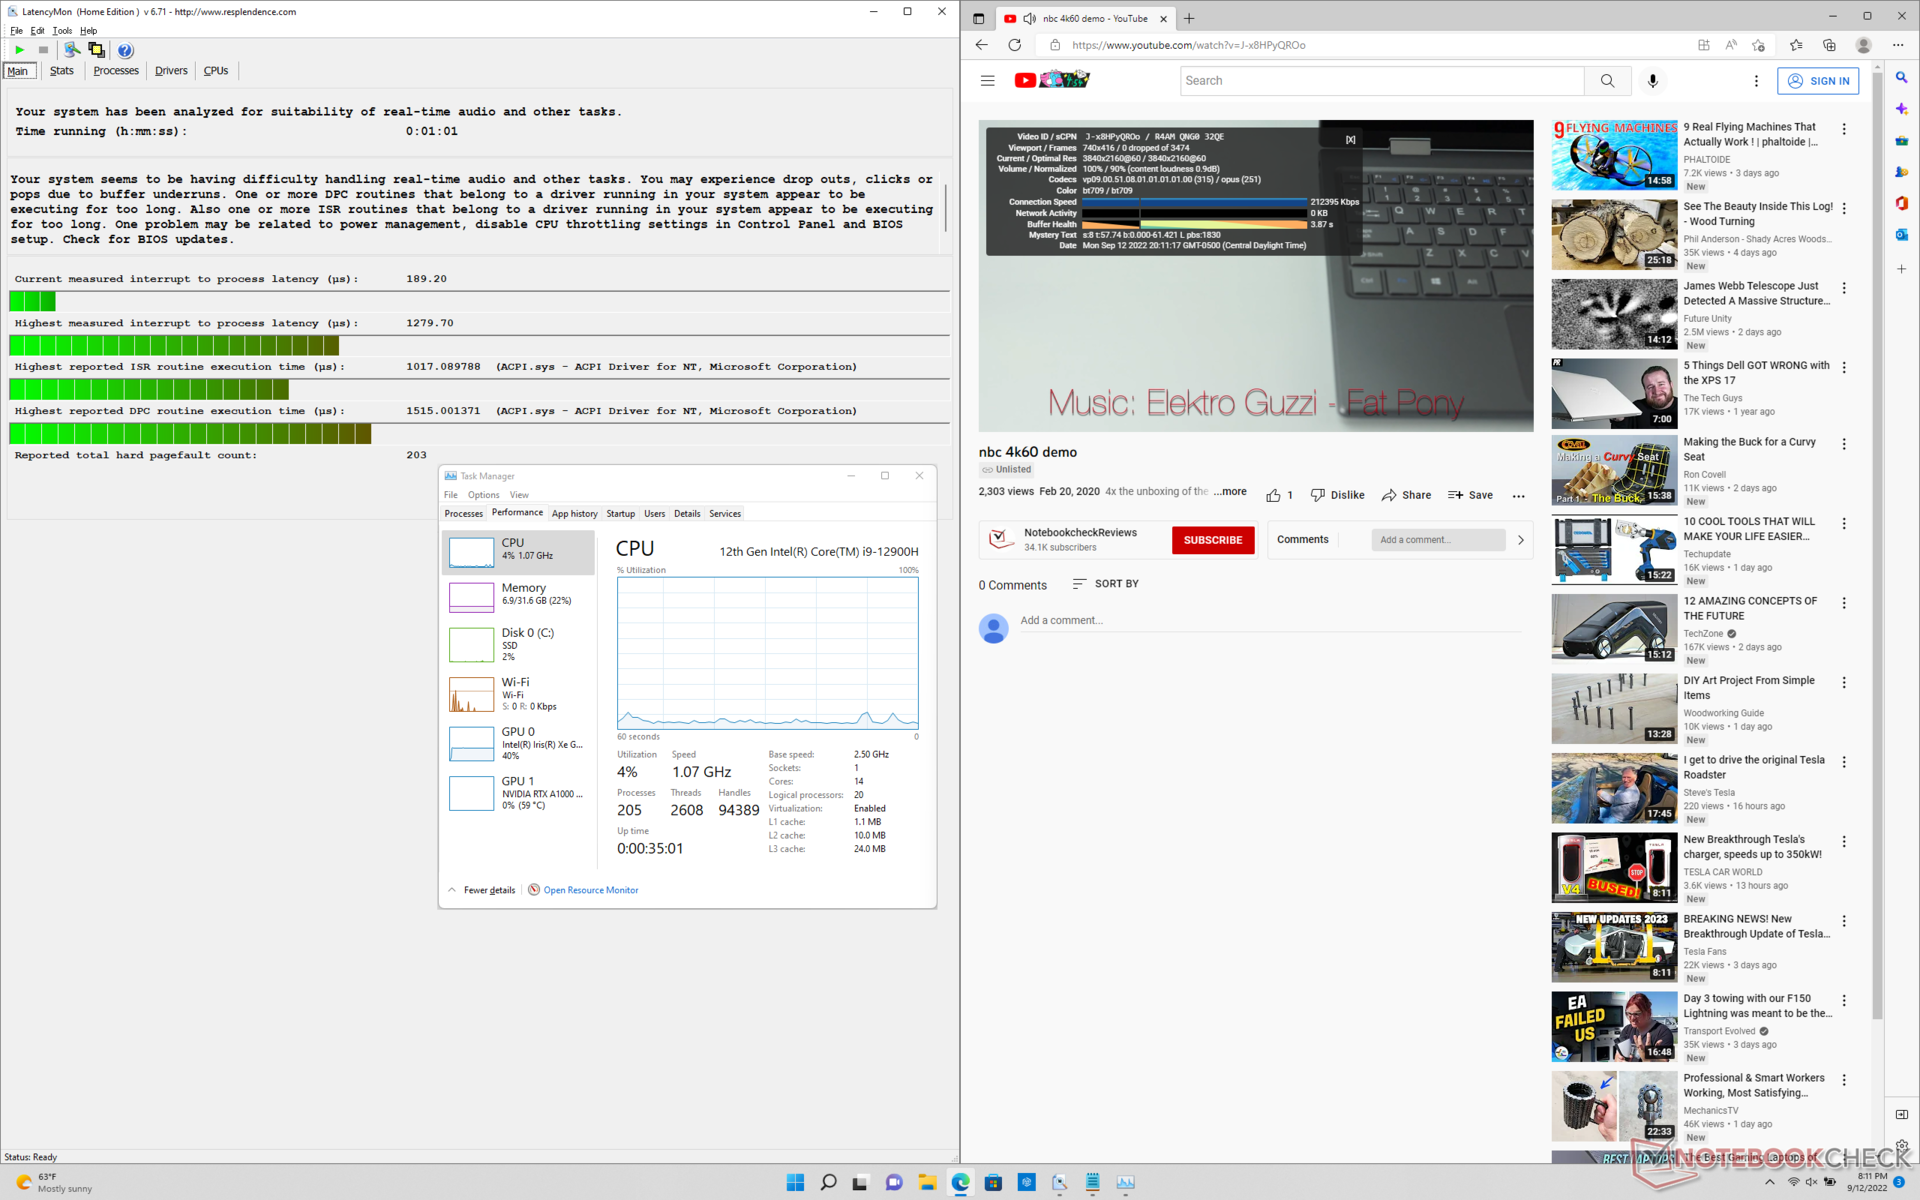
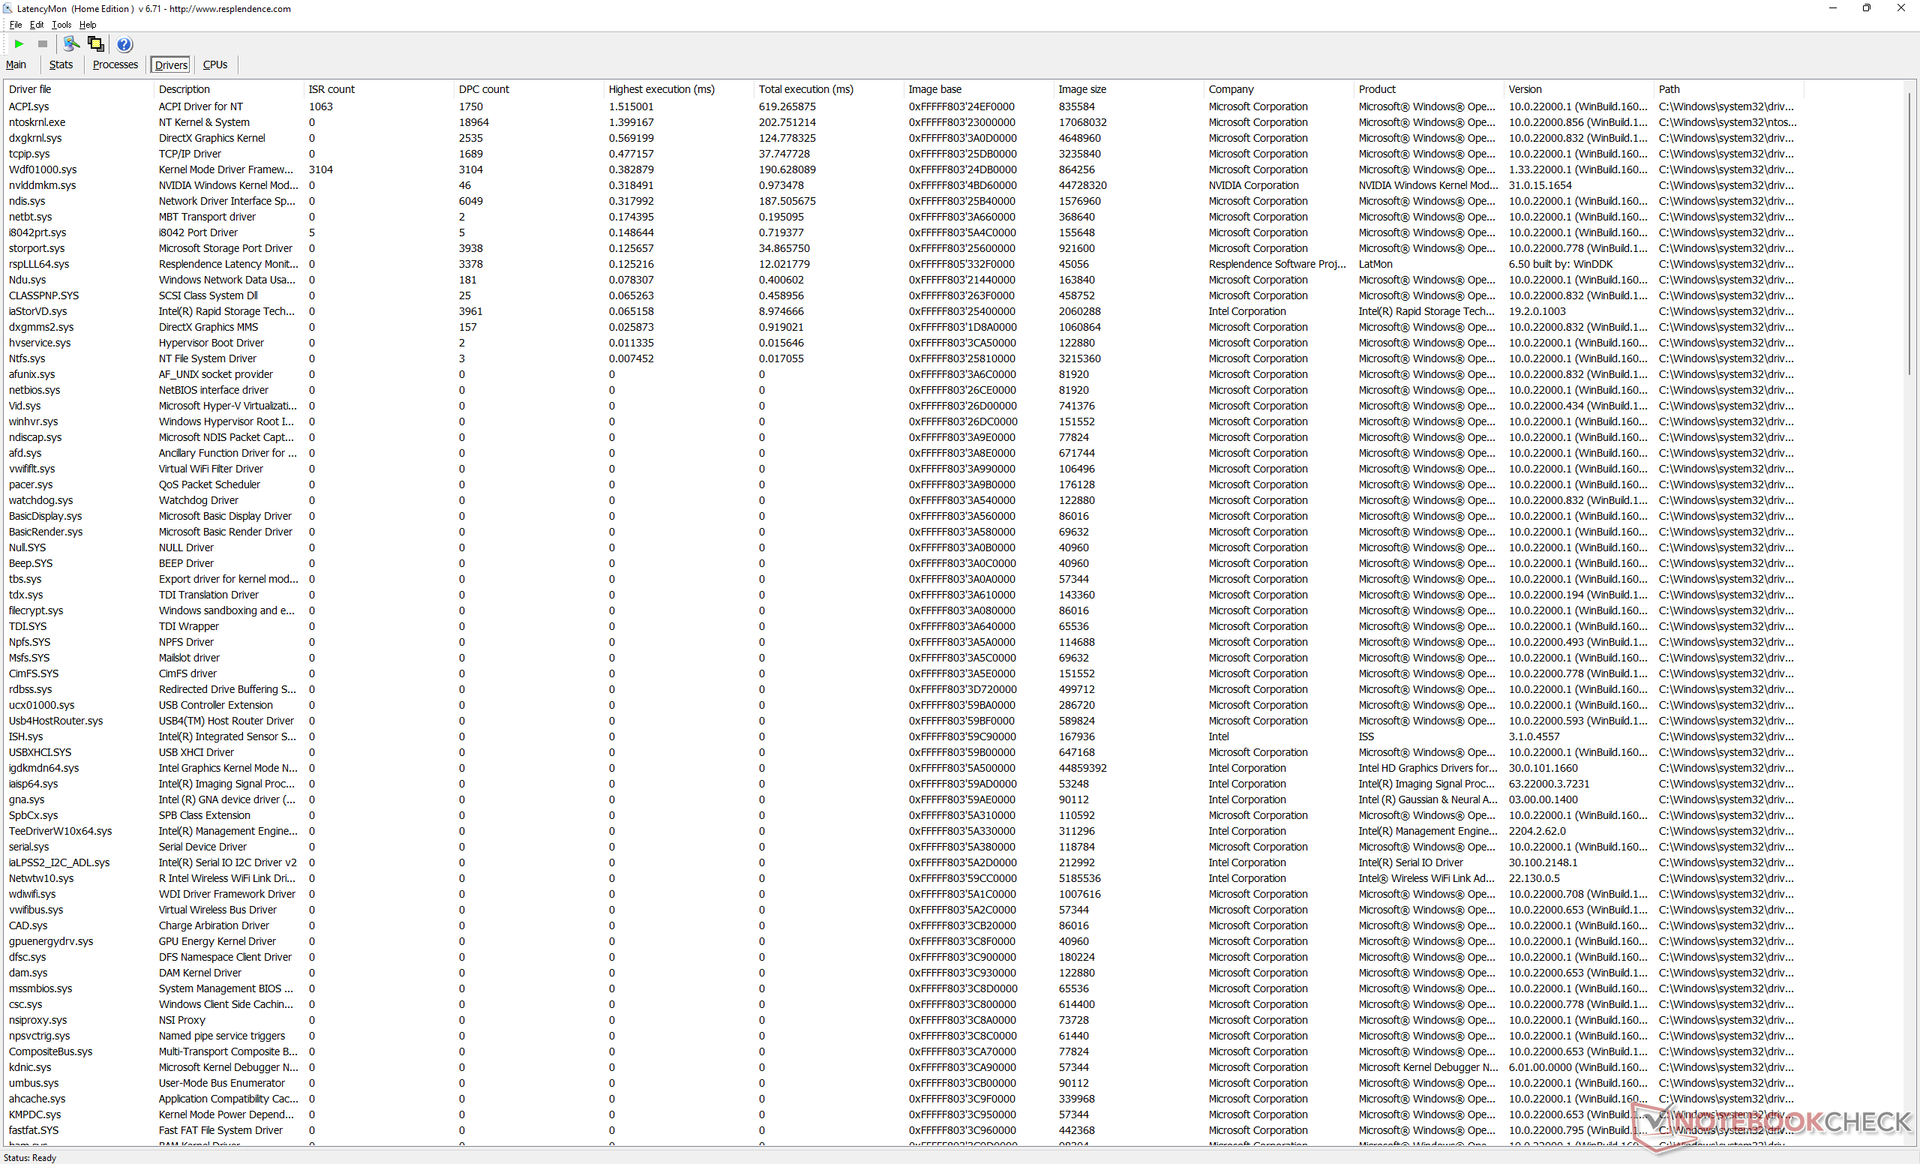
LatencyMon revela pequenos problemas de DPC ao abrir várias abas do navegador em nossa página inicial, o que é um pouco decepcionante de se ver em uma estação de trabalho. a reprodução de 4K a 60 FPS é perfeita, sem queda de quadros durante nosso teste de vídeo de minutos.
| DPC Latencies / LatencyMon - interrupt to process latency (max), Web, Youtube, Prime95 | |
| Lenovo ThinkPad P15v G2 21A9000XGE | |
| HP ZBook Firefly 14 G8 2C9Q2EA | |
| Lenovo ThinkPad P14s G2 AMD | |
| HP ZBook Firefly 14 G7 | |
| Dell Precision 5000 5470 | |
| Dell Precision 5000 5560 | |
* ... menor é melhor
Dispositivos de armazenamento
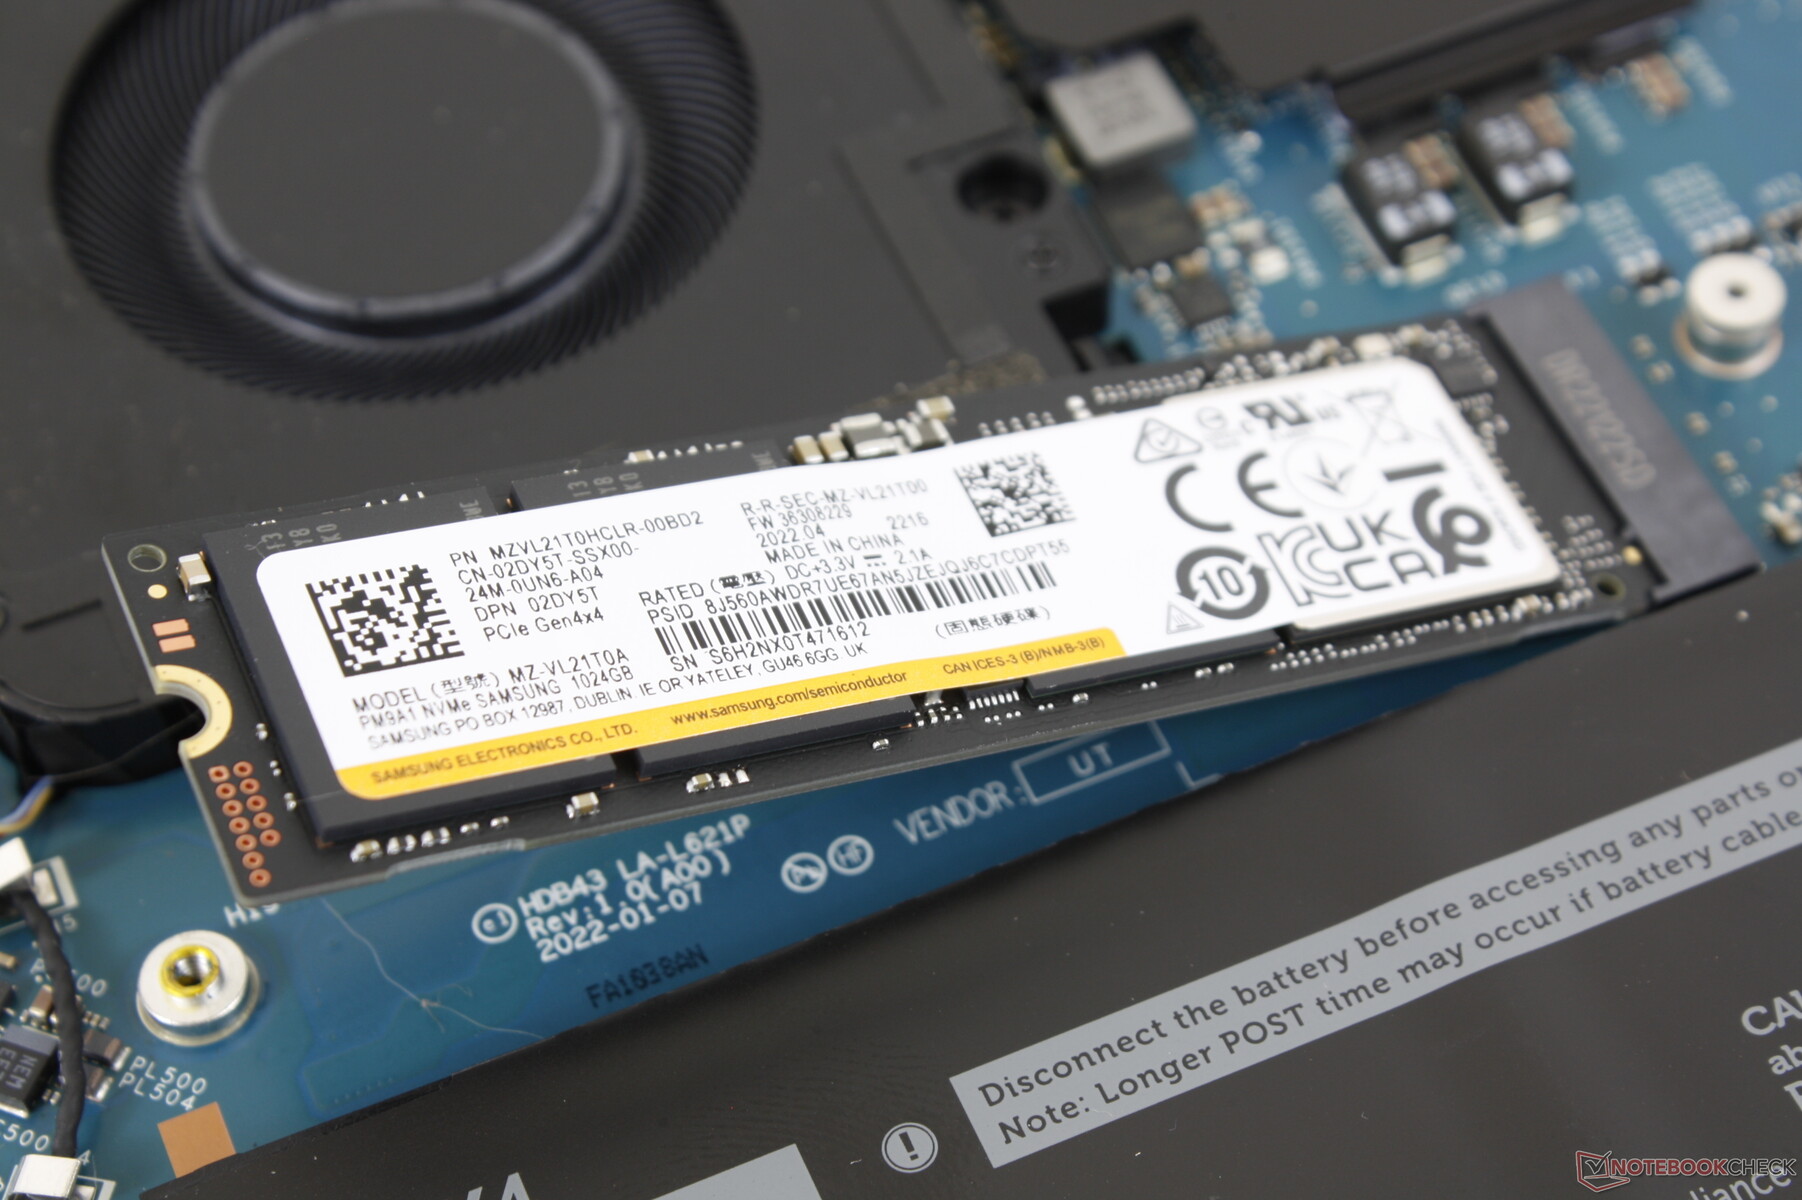
A Dell oferece opções de armazenamento de 256 GB a 4 TB PCIe3 ou PCIe4 com autoencriptação opcional. A PCIe4 Samsung PM9A1 em nossa unidade de teste inclui seu próprio espalhador de calor de cobre para um desempenho melhor sustentado do que em laptops sem um espalhador de calor SSD, como o Latitude 7330.

| Drive Performance rating - Percent | |
| Dell Precision 5000 5560 | |
| Dell Precision 5000 5470 | |
| Lenovo ThinkPad P14s G2 AMD | |
| HP ZBook Firefly 14 G8 2C9Q2EA | |
| HP ZBook Firefly 14 G7 | |
| Lenovo ThinkPad P15v G2 21A9000XGE | |
* ... menor é melhor
Disk Throttling: DiskSpd Read Loop, Queue Depth 8
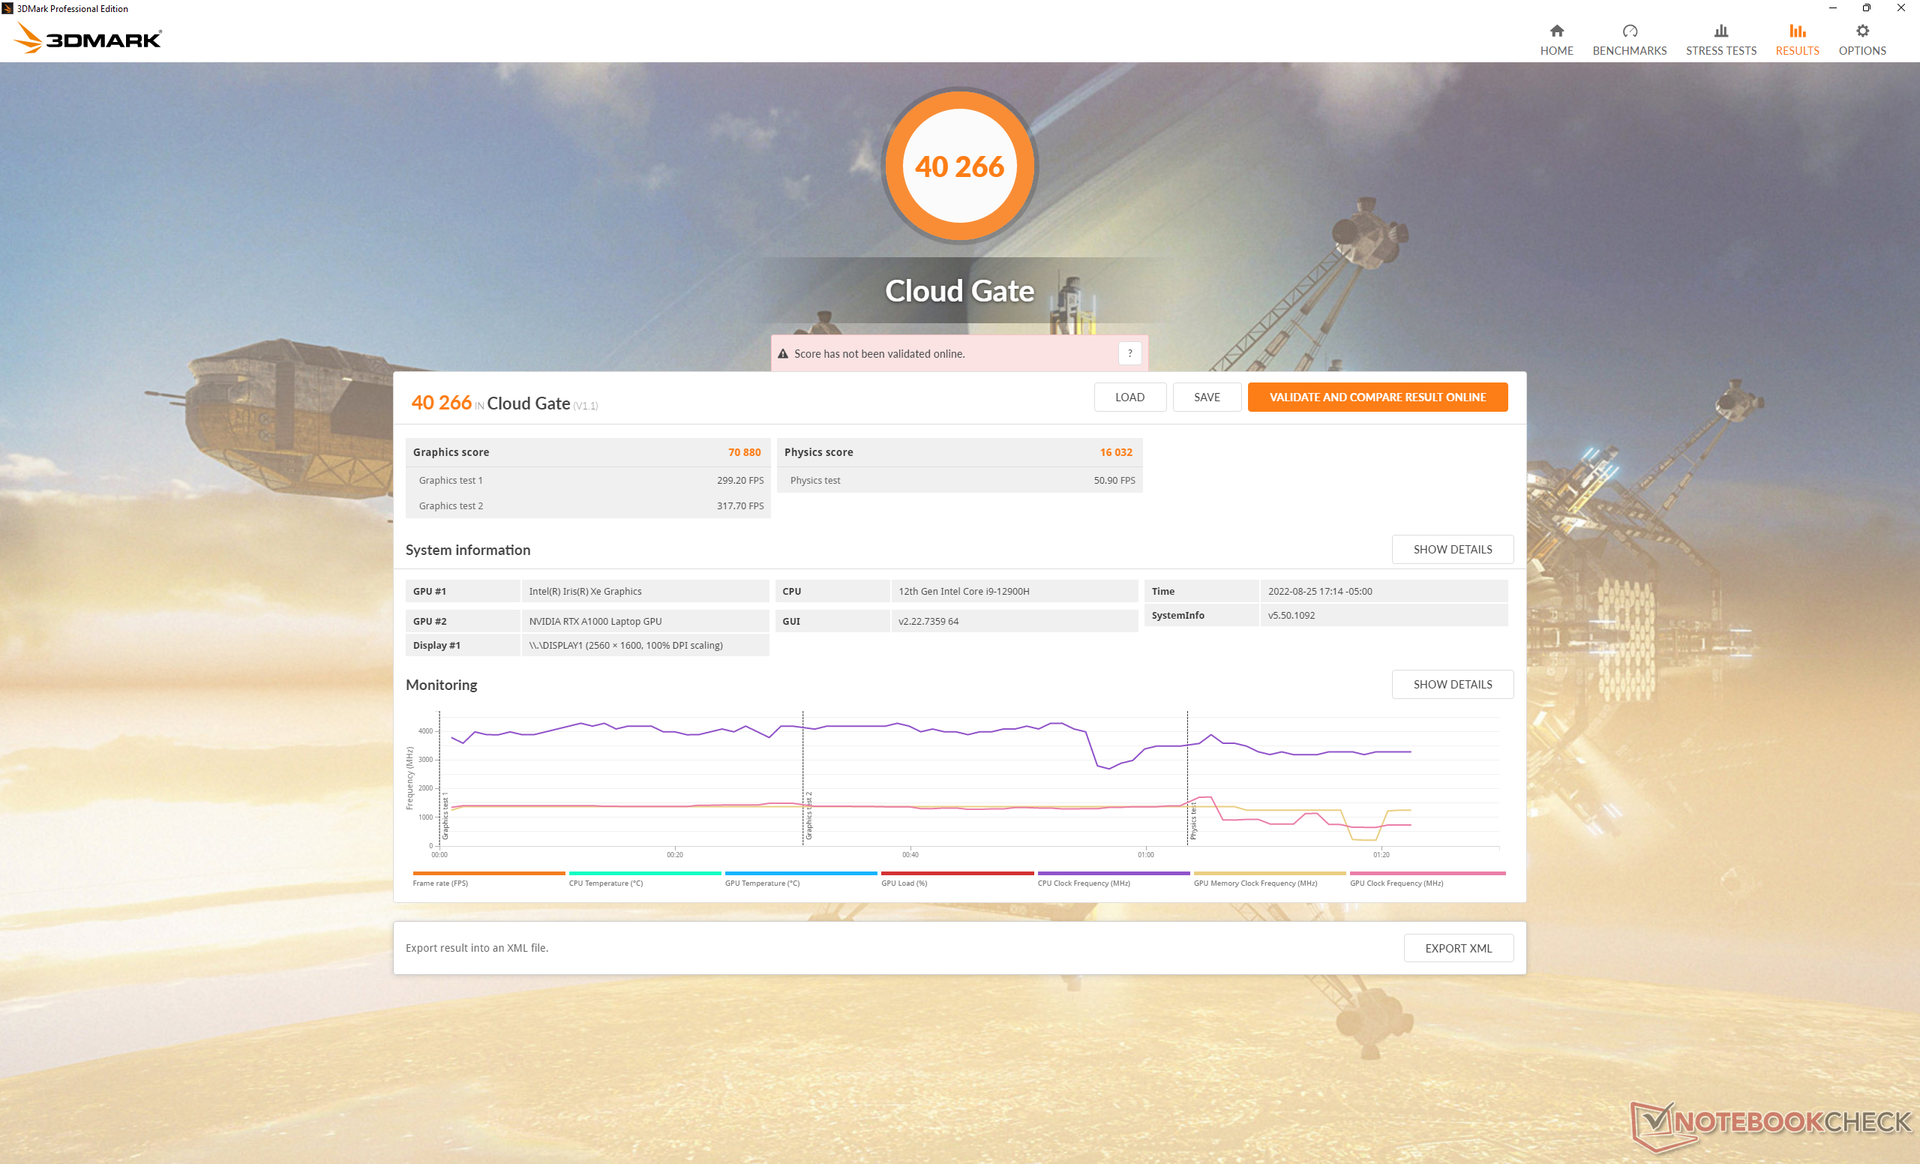
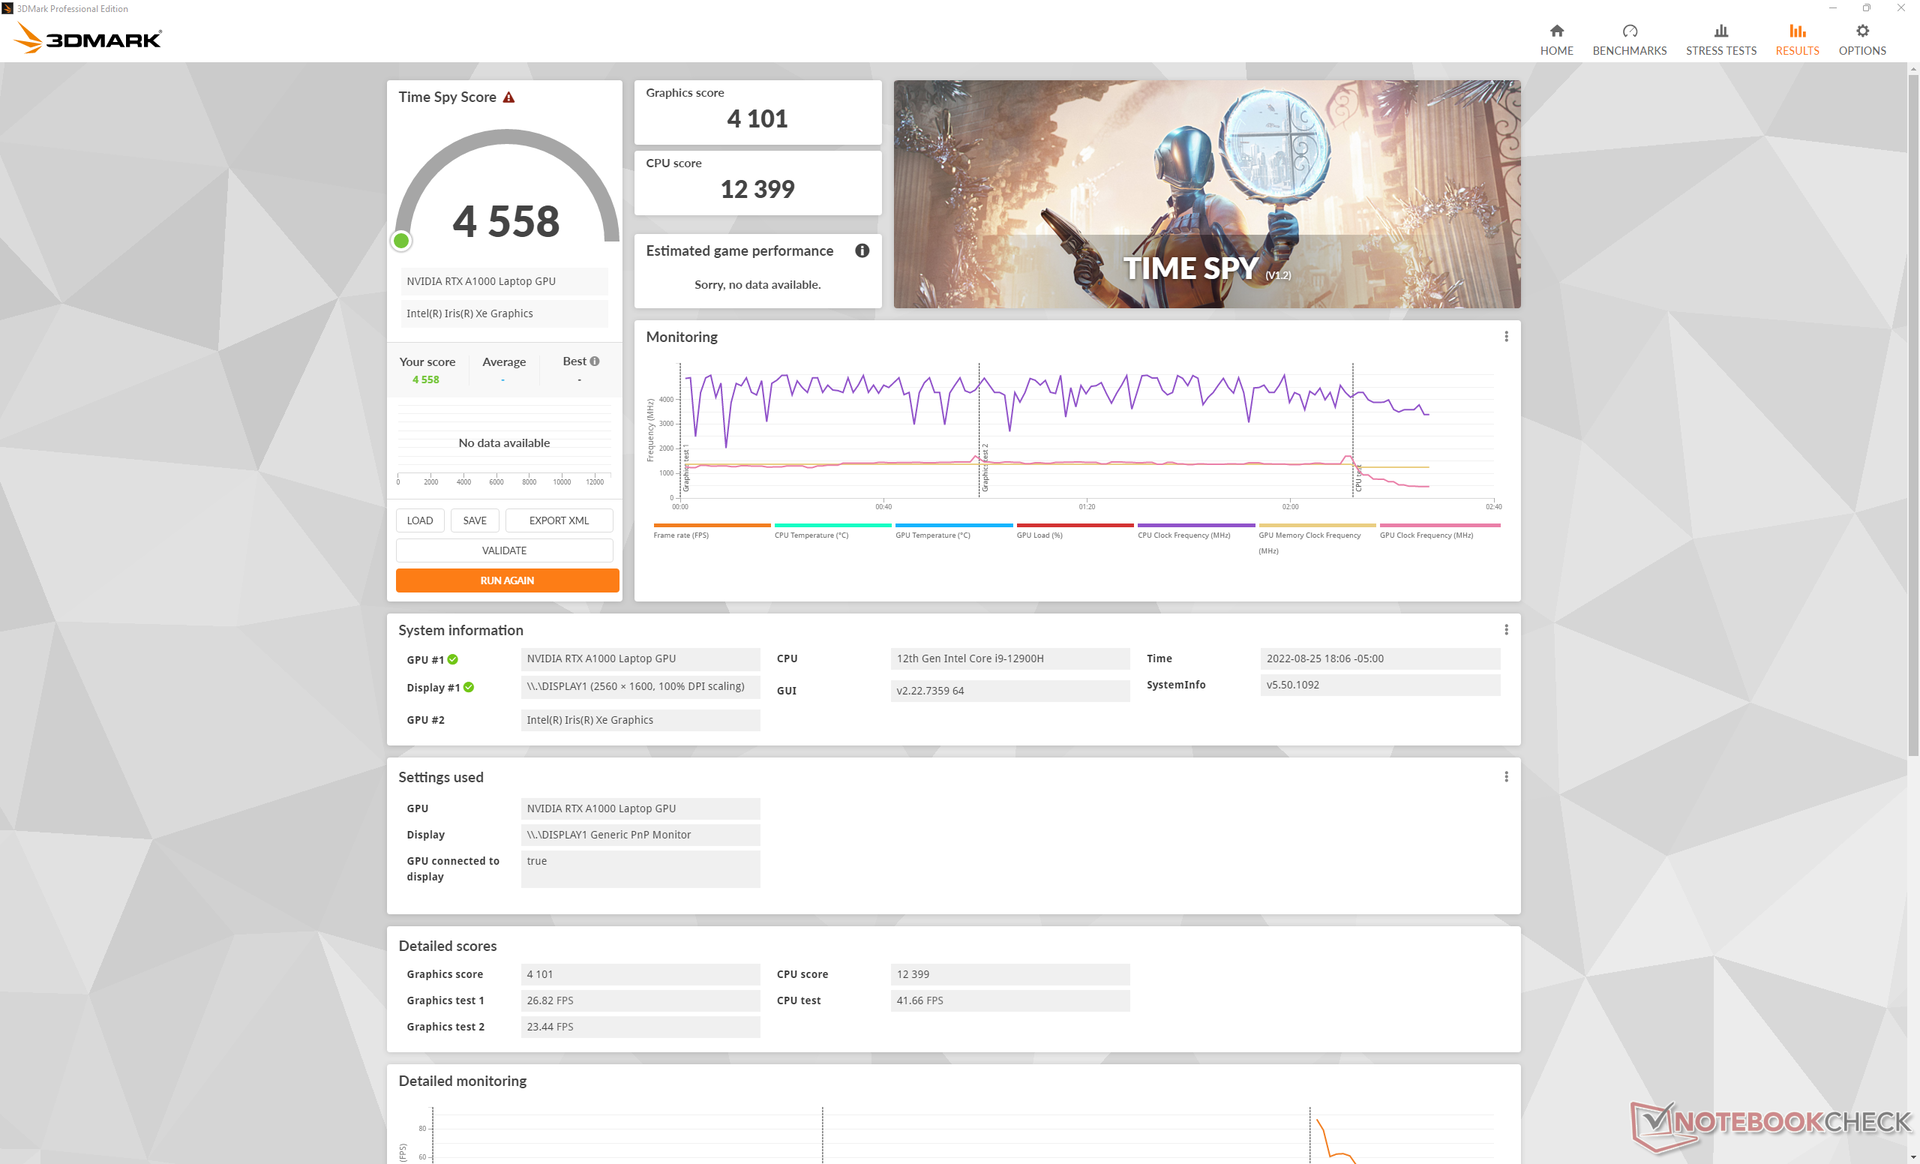
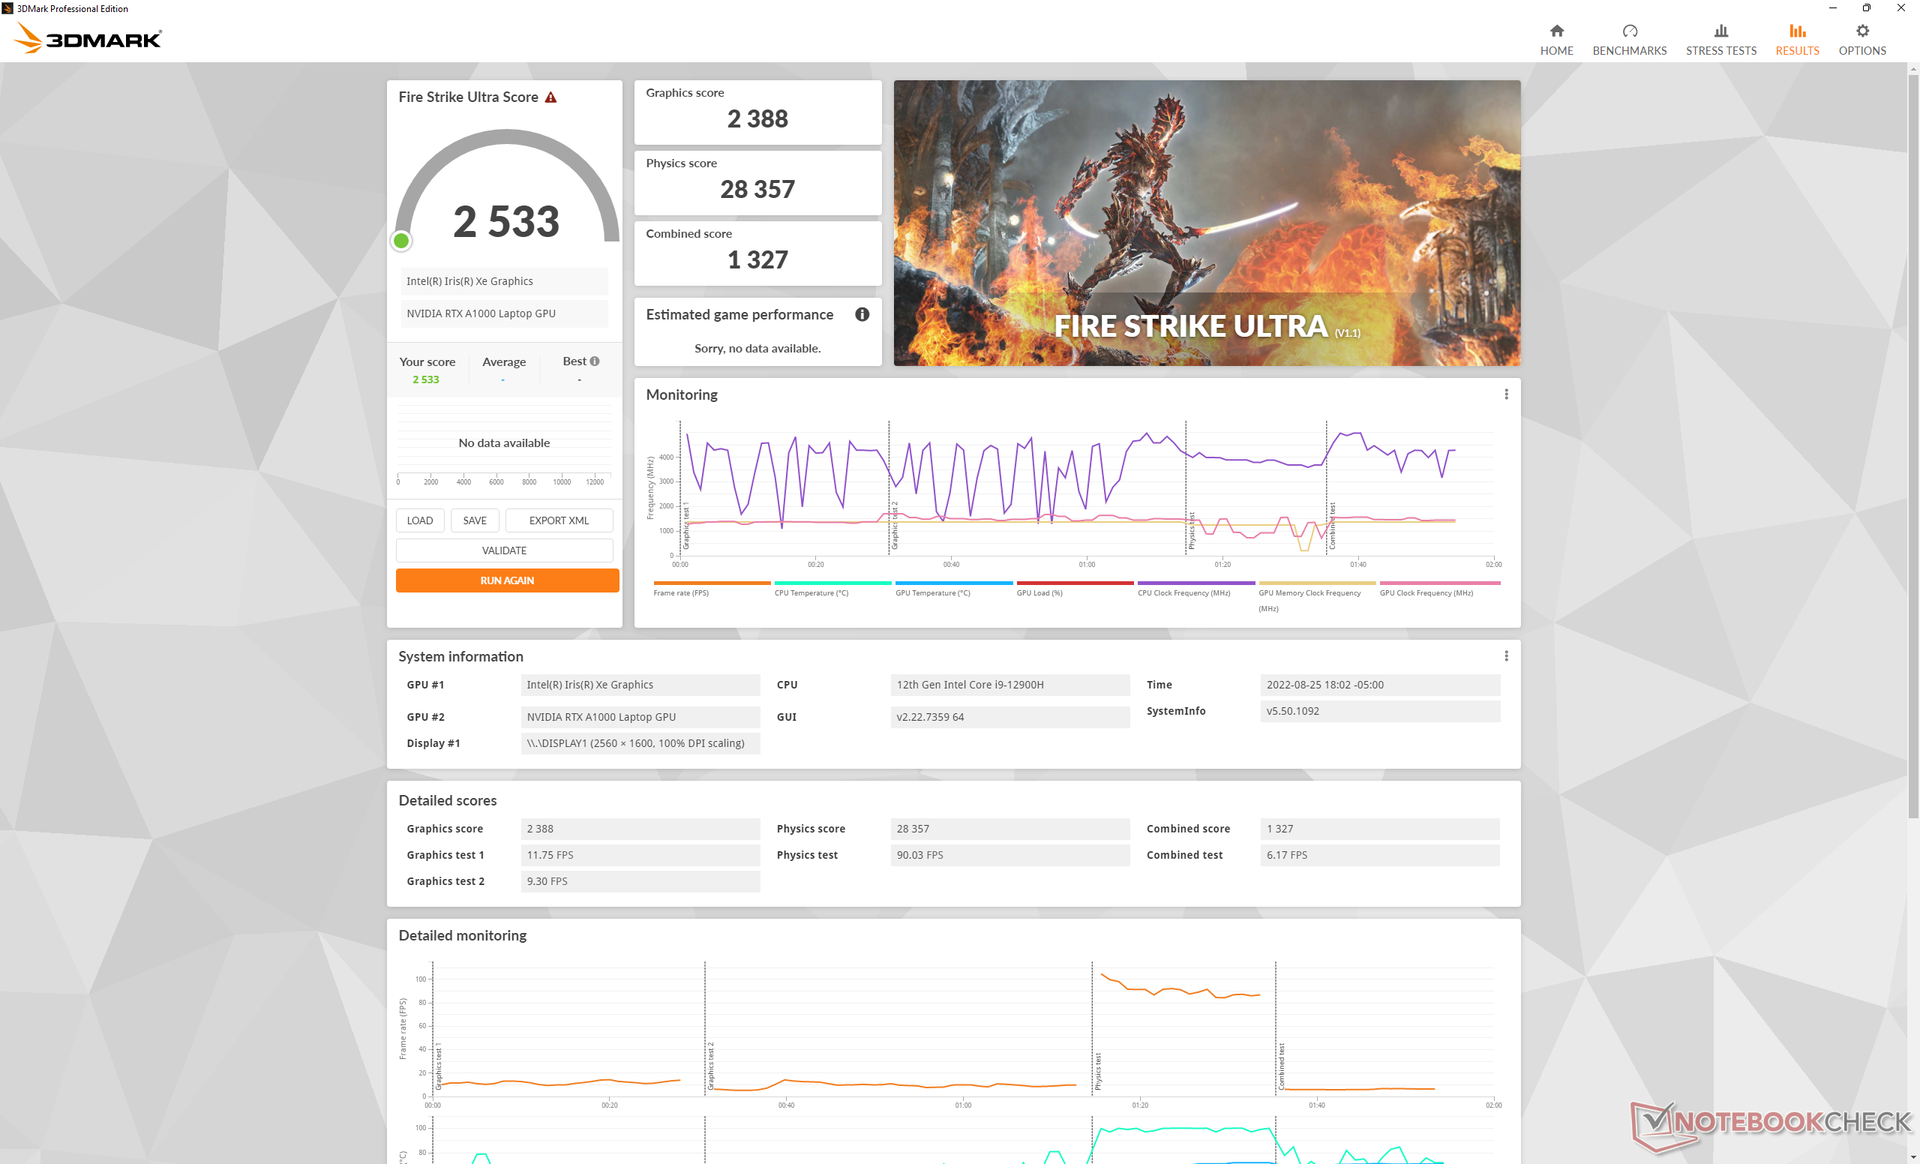
GPU Performance - 40 W RTX A1000 Graphics
O desempenho gráfico geral é cerca de 10 a 20% mais rápido do que o do ano passado.NVIDIA T1200. Mais notavelmente, no entanto, o RTX A1000 é apenas cerca de 10% a 15% mais lento do que o RTX A2000 no Precision 5560, exceto quando se trata de aplicações de traçado de raio onde o A2000 pode ser mais de 2x mais rápido. Se suas cargas de trabalho envolverem efeitos de traçado de raio, então o RTX A1000 é o que deve ser evitado.
A execução no modo Balanceado ao invés do modo Ultra Performance reduz a performance da CPU em cerca de 33% enquanto a performance da GPU é menos impactada.
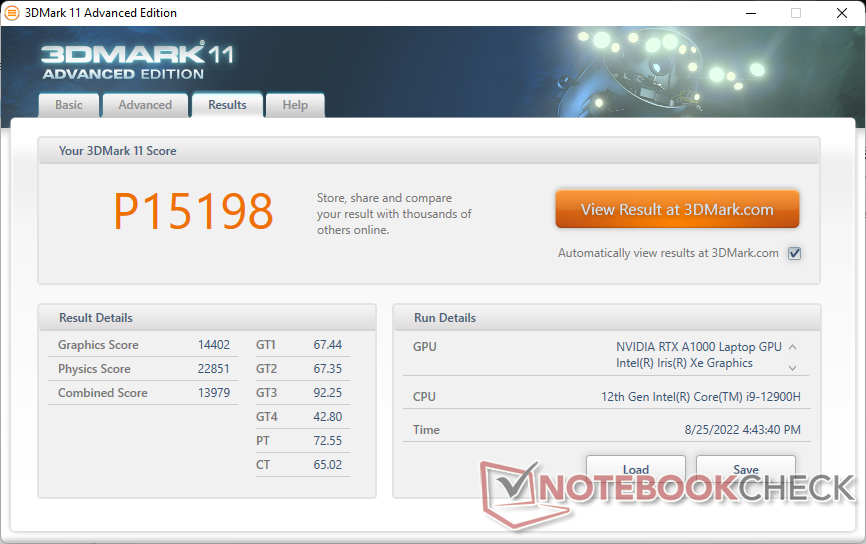

| 3DMark 11 Performance | 15198 pontos | |
| 3DMark Cloud Gate Standard Score | 40266 pontos | |
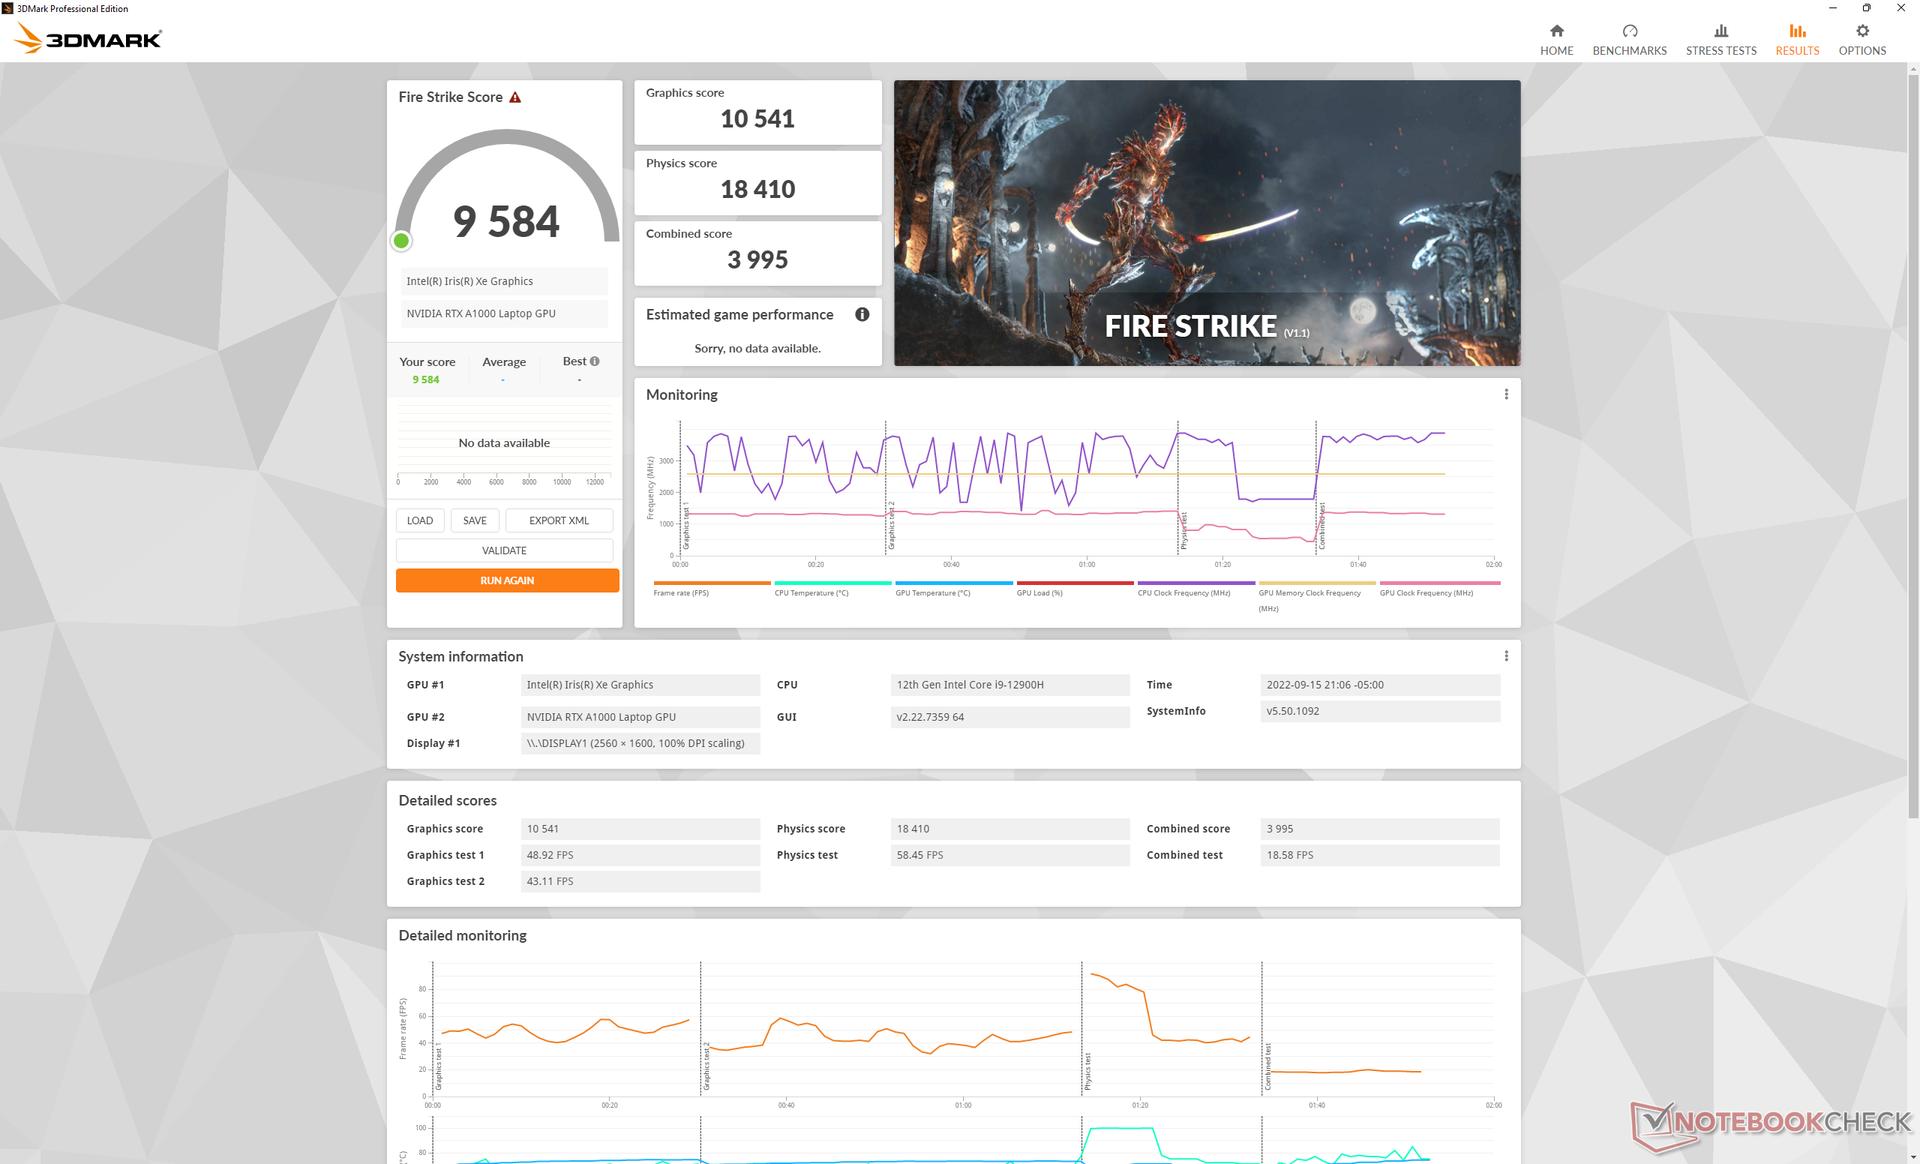
| 3DMark Fire Strike Score | 10123 pontos | |
| 3DMark Time Spy Score | 4558 pontos | |
Ajuda | ||
| Final Fantasy XV Benchmark | |
| 1280x720 Lite Quality | |
| HP ZBook Fury 17 G8-4A6A9EA | |
| HP ZBook Fury 17 G7 119W5EA | |
| Média NVIDIA RTX A1000 Laptop GPU (105.3 - 129.2, n=2) | |
| Dell Precision 5000 5470 | |
| Lenovo ThinkPad P1 G4-20Y4Z9DVUS | |
| Lenovo ThinkPad P15v G2 21A9000XGE | |
| Dell Precision 5000 5560 | |
| HP ZBook Power 15 G8 313S5EA | |
| Dell Precision 3000 3551 | |
| 1920x1080 Standard Quality | |
| HP ZBook Fury 17 G8-4A6A9EA | |
| HP ZBook Fury 17 G7 119W5EA | |
| Média NVIDIA RTX A1000 Laptop GPU (59.1 - 67.9, n=2) | |
| Dell Precision 5000 5560 | |
| Dell Precision 5000 5470 | |
| Lenovo ThinkPad P1 G4-20Y4Z9DVUS | |
| Lenovo ThinkPad P15v G2 21A9000XGE | |
| HP ZBook Power 15 G8 313S5EA | |
| Dell Precision 3000 3551 | |
| 1920x1080 High Quality | |
| HP ZBook Fury 17 G7 119W5EA | |
| HP ZBook Fury 17 G8-4A6A9EA | |
| Dell Precision 5000 5560 | |
| Média NVIDIA RTX A1000 Laptop GPU (43 - 48.3, n=2) | |
| Dell Precision 5000 5470 | |
| Lenovo ThinkPad P1 G4-20Y4Z9DVUS | |
| Lenovo ThinkPad P15v G2 21A9000XGE | |
| HP ZBook Power 15 G8 313S5EA | |
| Dell Precision 3000 3551 | |
| Cyberpunk 2077 1.6 | |
| 1920x1080 Low Preset | |
| Dell Precision 5000 5470 | |
| Média NVIDIA RTX A1000 Laptop GPU (n=1) | |
| 1920x1080 Medium Preset | |
| Dell Precision 5000 5470 | |
| Média NVIDIA RTX A1000 Laptop GPU (n=1) | |
| 1920x1080 High Preset | |
| Dell Precision 5000 5470 | |
| Média NVIDIA RTX A1000 Laptop GPU (n=1) | |
| 1920x1080 Ultra Preset | |
| Dell Precision 5000 5470 | |
| Média NVIDIA RTX A1000 Laptop GPU (n=1) | |
Witcher 3 FPS Chart
| baixo | média | alto | ultra | QHD | |
|---|---|---|---|---|---|
| GTA V (2015) | 168 | 159.8 | 113.7 | 58.9 | |
| The Witcher 3 (2015) | 244.1 | 147.5 | 82.1 | 42.7 | |
| Dota 2 Reborn (2015) | 160.8 | 147.9 | 112.3 | 132.1 | |
| Final Fantasy XV Benchmark (2018) | 105.3 | 59.1 | 43 | ||
| X-Plane 11.11 (2018) | 118.7 | 94.8 | 76.3 | ||
| Strange Brigade (2018) | 242 | 106.2 | 84.7 | 72.8 | |
| Metro Exodus (2019) | 111 | 53.3 | 39.3 | 31.2 | 23.6 |
| Borderlands 3 (2019) | 110.4 | 68.4 | 42.6 | 31.3 | 18.8 |
| Gears Tactics (2020) | 161.5 | 106.5 | 63.9 | 46.8 | 31.1 |
| Horizon Zero Dawn (2020) | 82 | 68 | 58 | 48 | 38 |
| Watch Dogs Legion (2020) | 75 | 62 | 54 | 26 | 17 |
| Dirt 5 (2020) | 135 | 62.4 | 48.5 | 37.2 | 25.8 |
| Assassin´s Creed Valhalla (2020) | 103 | 50 | 33 | 25 | 22 |
| Hitman 3 (2021) | 171.9 | 83.7 | 71.3 | 66.1 | 41 |
| F1 2021 (2021) | 195 | 127 | 103 | 54 | 34 |
| Far Cry 6 (2021) | 103 | 64 | 54 | ||
| Guardians of the Galaxy (2021) | 92 | 64 | 64 | 61 | 37 |
| God of War (2022) | 60.2 | 49.1 | 40.9 | 25.8 | 20.5 |
| Cyberpunk 2077 1.6 (2022) | 61.3 | 50.4 | 36.7 | 29 | |
| F1 22 (2022) | 112 | 107 | 76 | 22 | 13 |
Emissões
Ruído do sistema - Alto sob carga
O Precision 5470 funciona mais alto que o maior Precision 5560 quando sob carga. Rodando Witcher 3 no modo Ultra Performance, por exemplo, resultaria em um ruído do ventilador de pouco menos de 49 dB(A) em comparação com apenas 40 dB(A) em 15,6 polegadas Precision. De fato, a Precision 5470 é facilmente uma das estações de trabalho mais barulhentas em sua pequena categoria de 14 polegadas.
O sistema se torna mais silencioso a 40,3 dB(A) quando se executa cargas pesadas no modo Equilibrado ao invés do modo Ultra Performance. Você perderá algum desempenho da CPU como observado acima, mas os ventiladores mais silenciosos podem valer a pena, dependendo do ambiente.
Os ventiladores internos pulsarão periodicamente por razões aparentemente inúteis se estiverem no modo Ultra Performance, mesmo quando simplesmente ociosos na área de trabalho. O modo balanceado ou o modo silencioso são recomendados se estiver executando aplicações não exigentes.
Barulho
| Ocioso |
| 23.3 / 23.3 / 23.3 dB |
| Carga |
| 48.5 / 50.4 dB |
 | ||
30 dB silencioso 40 dB(A) audível 50 dB(A) ruidosamente alto |
||
min: | ||
| Dell Precision 5000 5470 RTX A1000 Laptop GPU, i9-12900H, Samsung PM9A1 MZVL21T0HCLR | Lenovo ThinkPad P15v G2 21A9000XGE T1200 Laptop GPU, i7-11800H, Toshiba XG6 KXG6AZNV512G | Dell Precision 5000 5560 RTX A2000 Laptop GPU, i7-11850H, Samsung PM9A1 MZVL22T0HBLB | Lenovo ThinkPad P14s G2 AMD Vega 8, R7 PRO 5850U, SK Hynix PC711 1TB HFS001TDE9X081N | HP ZBook Firefly 14 G8 2C9Q2EA T500 Laptop GPU, i7-1165G7, Toshiba XG6 KXG60ZNV1T02 | HP ZBook Firefly 14 G7 Quadro P520, i7-10610U, Toshiba XG6 KXG60ZNV512G | |
|---|---|---|---|---|---|---|
| Noise | 3% | 11% | 8% | -4% | -4% | |
| desligado / ambiente * (dB) | 23 | 25.21 -10% | 23.4 -2% | 24.04 -5% | 28.7 -25% | 29.7 -29% |
| Idle Minimum * (dB) | 23.3 | 25.21 -8% | 23.6 -1% | 24.04 -3% | 28.7 -23% | 29.7 -27% |
| Idle Average * (dB) | 23.3 | 25.21 -8% | 23.6 -1% | 24.04 -3% | 28.7 -23% | 29.7 -27% |
| Idle Maximum * (dB) | 23.3 | 25.21 -8% | 23.6 -1% | 24.04 -3% | 28.7 -23% | 30.4 -30% |
| Load Average * (dB) | 48.5 | 39.09 19% | 25.8 47% | 28.19 42% | 34 30% | 33.1 32% |
| Witcher 3 ultra * (dB) | 48.6 | 36.6 25% | 40.1 17% | 40.1 17% | 35.3 27% | |
| Load Maximum * (dB) | 50.4 | 43.53 14% | 41.4 18% | 40.77 19% | 40.1 20% | 37.9 25% |
* ... menor é melhor
Temperatura
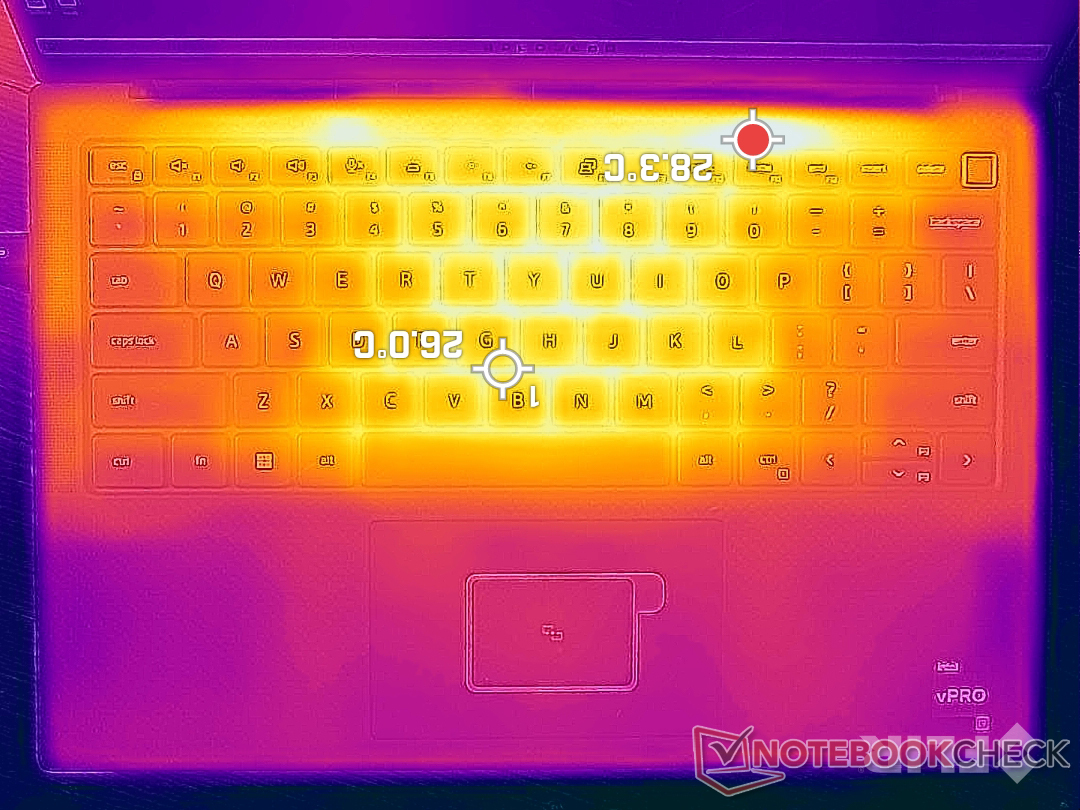
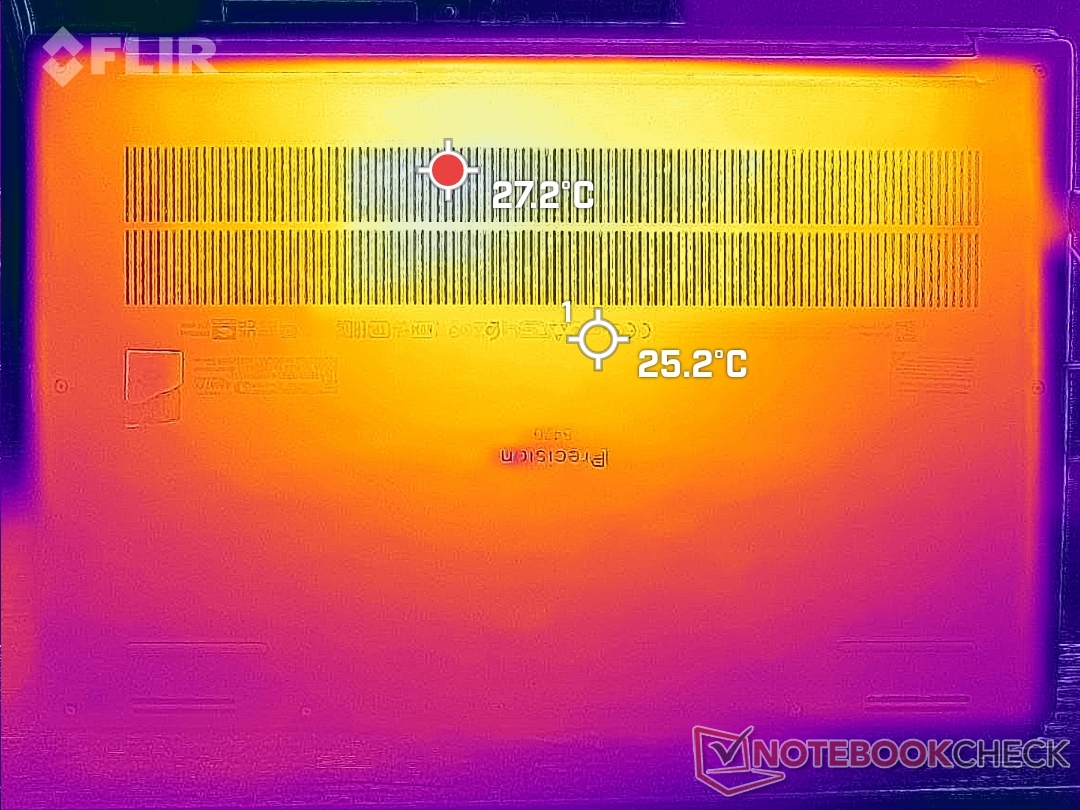
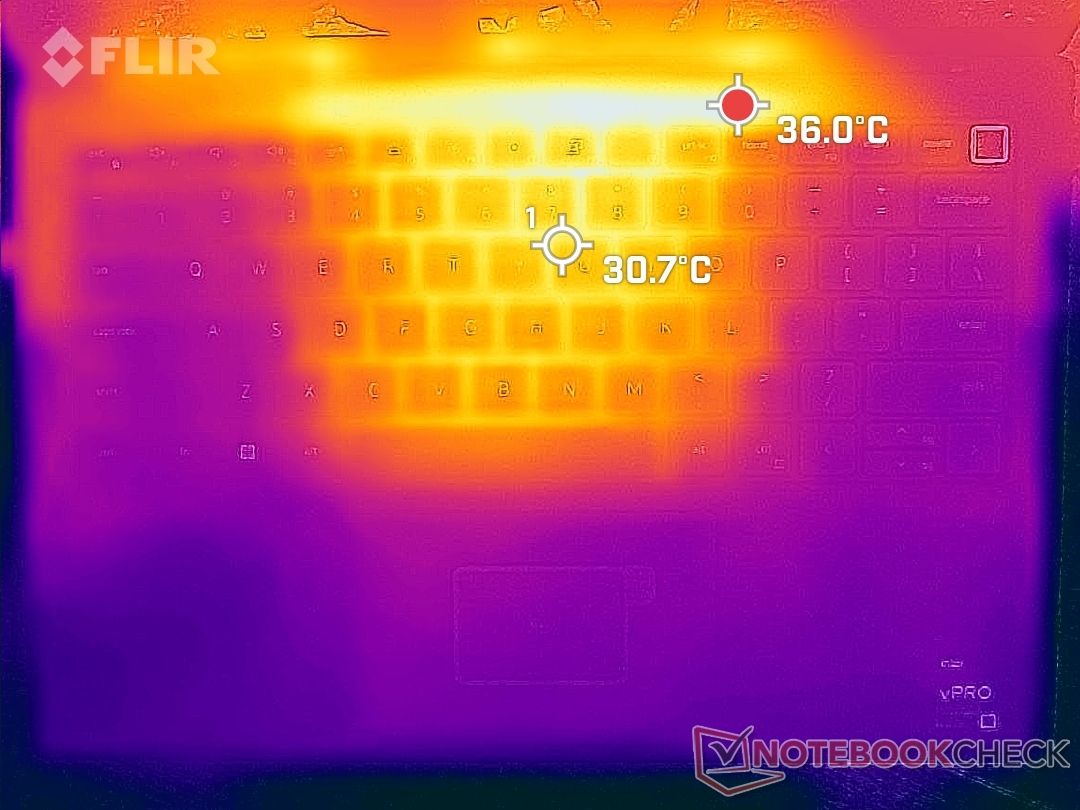
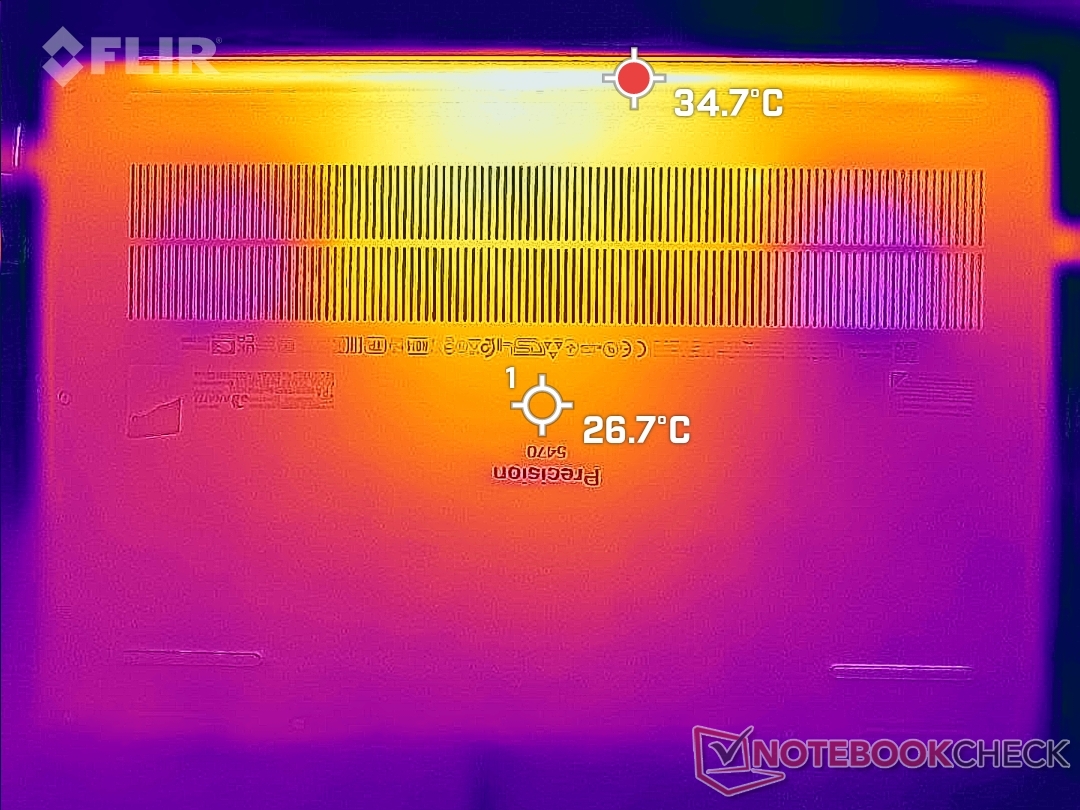
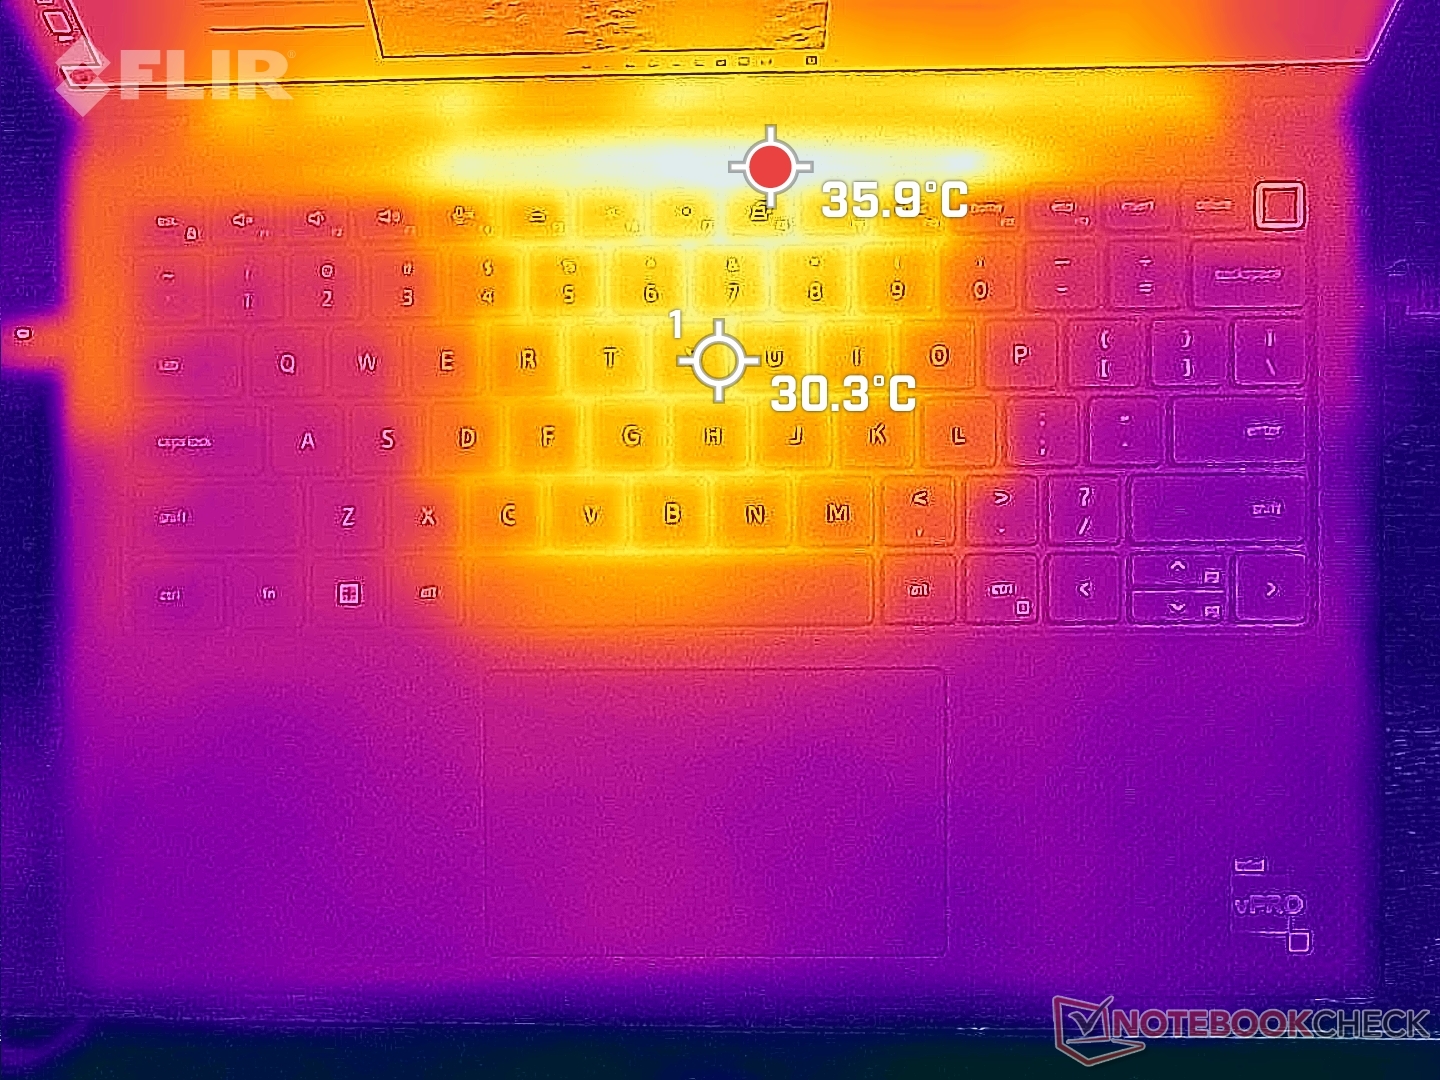
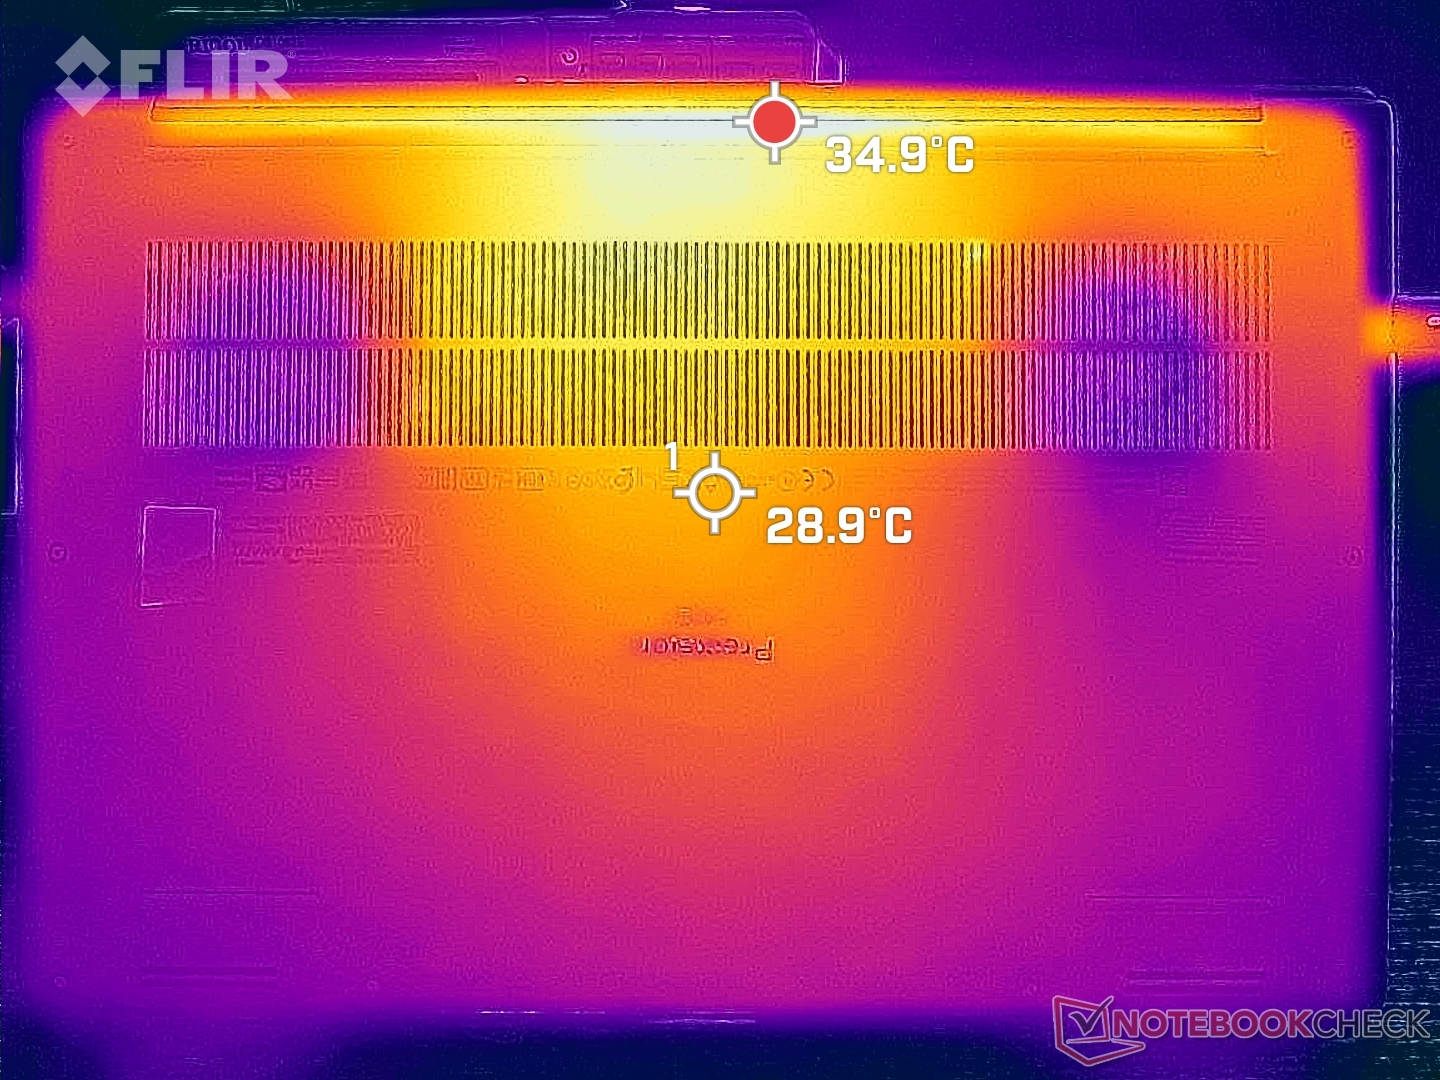
As temperaturas de superfície são mais frias do que o esperado considerando a CPU de classe H Core, a GPU Nvidia discreta, e o tamanho do chassi pequeno. Estações de trabalho alternativas de 14 polegadas como a ZBook Firefly 14 G8 ou ThinkPad P14s G2 vêm cada uma com CPUs mais lentas e ainda assim podem se tornar muito mais quentes com pontos quentes chegando a 49 C em comparação com apenas 42 C em nosso Precision. No entanto, o centro do teclado ainda pode ficar bem quente a 42 C.
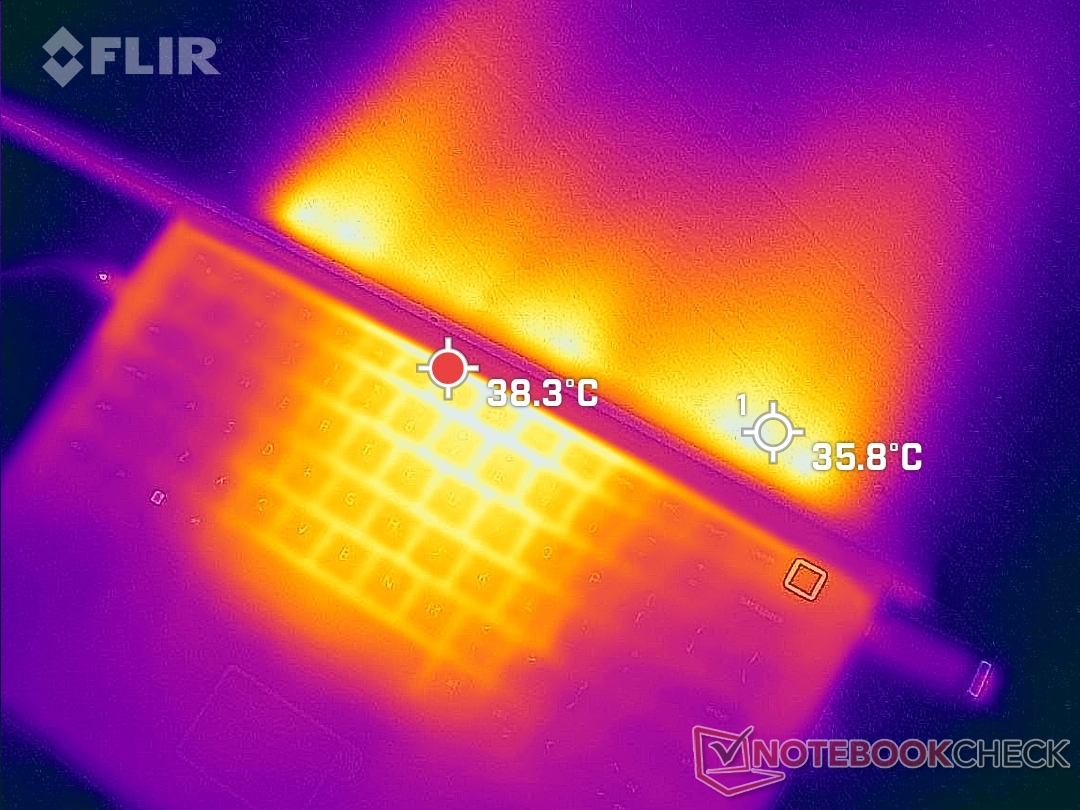
(±) A temperatura máxima no lado superior é 41.8 °C / 107 F, em comparação com a média de 38.2 °C / 101 F , variando de 22.2 a 69.8 °C para a classe Workstation.
(+) A parte inferior aquece até um máximo de 36 °C / 97 F, em comparação com a média de 41.1 °C / 106 F
(+) Em uso inativo, a temperatura média para o lado superior é 31 °C / 88 F, em comparação com a média do dispositivo de 32 °C / ### class_avg_f### F.
(±) Jogando The Witcher 3, a temperatura média para o lado superior é 32.2 °C / 90 F, em comparação com a média do dispositivo de 32 °C / ## #class_avg_f### F.
(+) Os apoios para as mãos e o touchpad são mais frios que a temperatura da pele, com um máximo de 27.6 °C / 81.7 F e, portanto, são frios ao toque.
(±) A temperatura média da área do apoio para as mãos de dispositivos semelhantes foi 27.8 °C / 82 F (+0.2 °C / 0.3 F).
| Dell Precision 5000 5470 Intel Core i9-12900H, NVIDIA RTX A1000 Laptop GPU | Lenovo ThinkPad P15v G2 21A9000XGE Intel Core i7-11800H, NVIDIA T1200 Laptop GPU | Dell Precision 5000 5560 Intel Core i7-11850H, NVIDIA RTX A2000 Laptop GPU | Lenovo ThinkPad P14s G2 AMD AMD Ryzen 7 PRO 5850U, AMD Radeon RX Vega 8 (Ryzen 4000/5000) | HP ZBook Firefly 14 G8 2C9Q2EA Intel Core i7-1165G7, NVIDIA T500 Laptop GPU | HP ZBook Firefly 14 G7 Intel Core i7-10610U, NVIDIA Quadro P520 | |
|---|---|---|---|---|---|---|
| Heat | -9% | -10% | 1% | 5% | -7% | |
| Maximum Upper Side * (°C) | 41.8 | 53.8 -29% | 48.2 -15% | 42.8 -2% | 42.6 -2% | 52.3 -25% |
| Maximum Bottom * (°C) | 36 | 52.1 -45% | 42.6 -18% | 47.5 -32% | 49.4 -37% | 60.9 -69% |
| Idle Upper Side * (°C) | 34.6 | 27.6 20% | 34.8 -1% | 27 22% | 24.2 30% | 23.1 33% |
| Idle Bottom * (°C) | 33.6 | 27.7 18% | 35.2 -5% | 28.3 16% | 24.6 27% | 23 32% |
* ... menor é melhor
Teste de Estresse - Taxas de Relógio de CPU Cycling
Iniciar Prime95 faz com que as taxas de relógio da CPU, o consumo de energia da placa e a temperatura central atinjam 3,6 GHz, 91 W, e 101 C, respectivamente. Após alguns segundos, entretanto, as taxas de clock, consumo de energia e temperatura começariam a pedalar entre 1,0 e 2,4 GHz, 20 a 50 W, e 61 a 82 C, respectivamente. Este comportamento de ciclismo corresponde aos resultados de nosso teste de loop de ciclismo CineBency R15 xT acima para mostrar que o Precision 5470 é incapaz de manter as constantes taxas de relógios Turbo Boost por períodos prolongados. Executando uma CPU Core i9-12900H até seu máximo potencial em um chassi este pequeno continua sendo um sonho de tubulação.
Quando em funcionamento Witcher 3 para representar altas cargas de processamento, a CPU e a GPU se estabilizariam em 82 C e 71 C, respectivamente, em comparação com 69 C e 75 C no Precision 5560.
O funcionamento com bateria limita o desempenho da CPU. Um teste Fire Strike em baterias retornaria pontuações de Física e Gráficos de 21067 e 10542 pontos, respectivamente, em comparação com 27514 e 10914 pontos quando em rede elétrica.
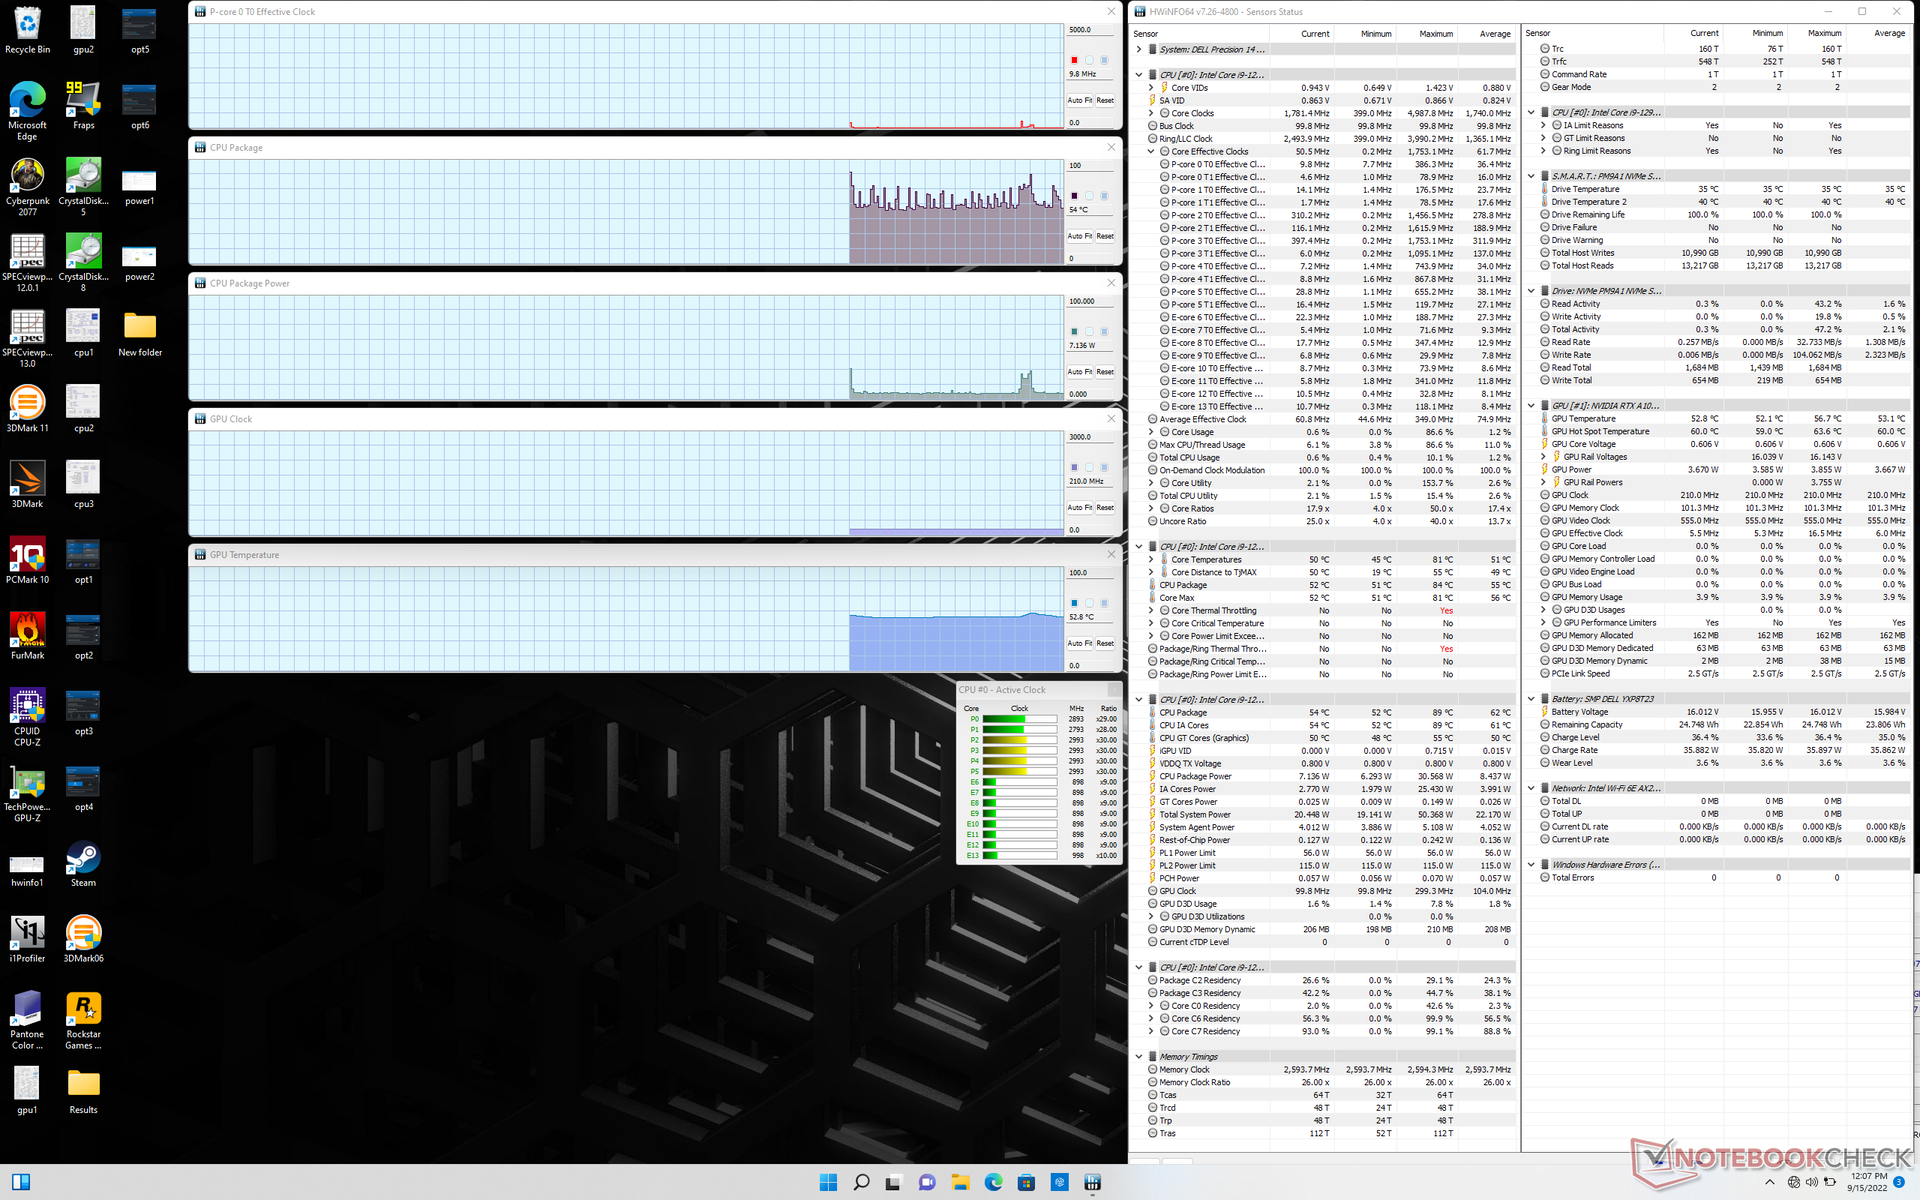
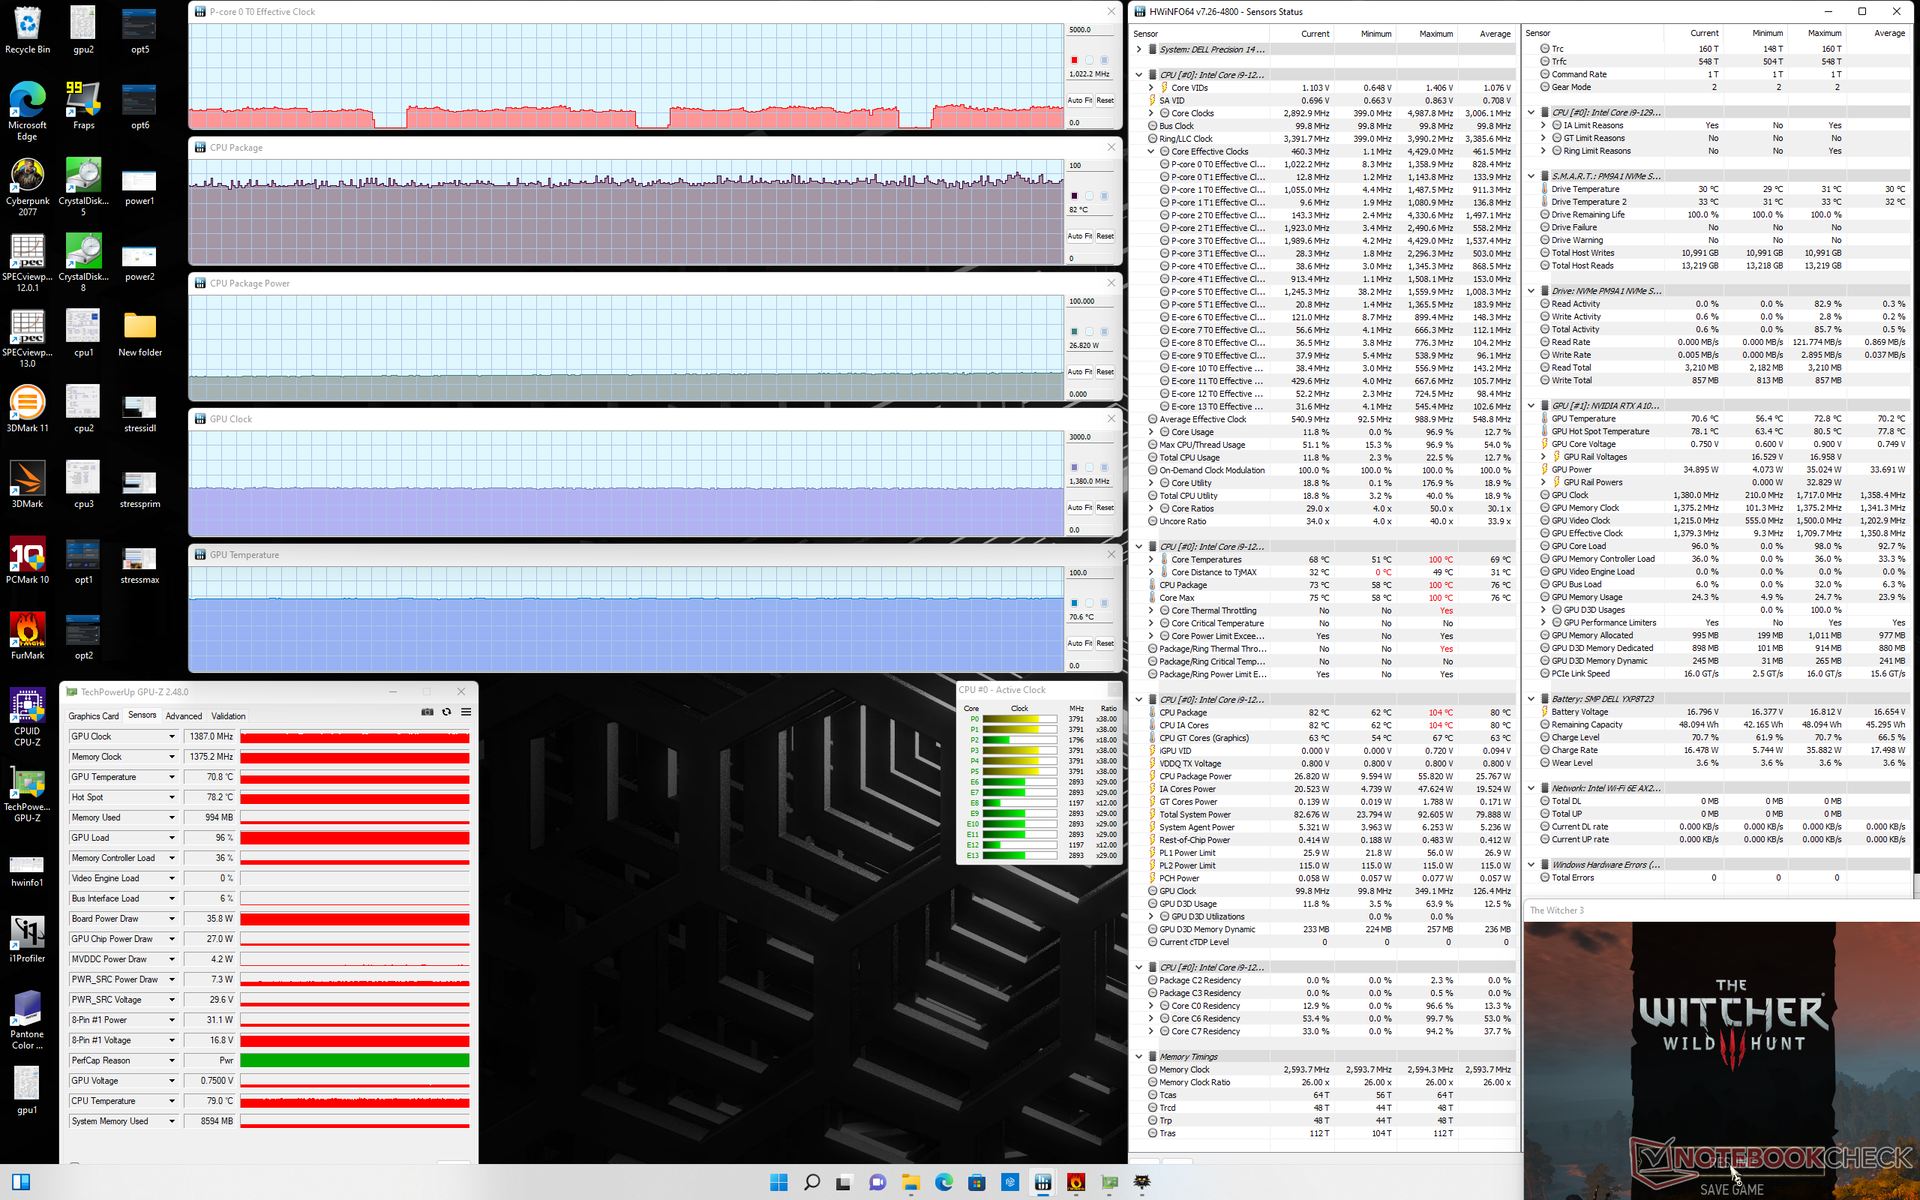
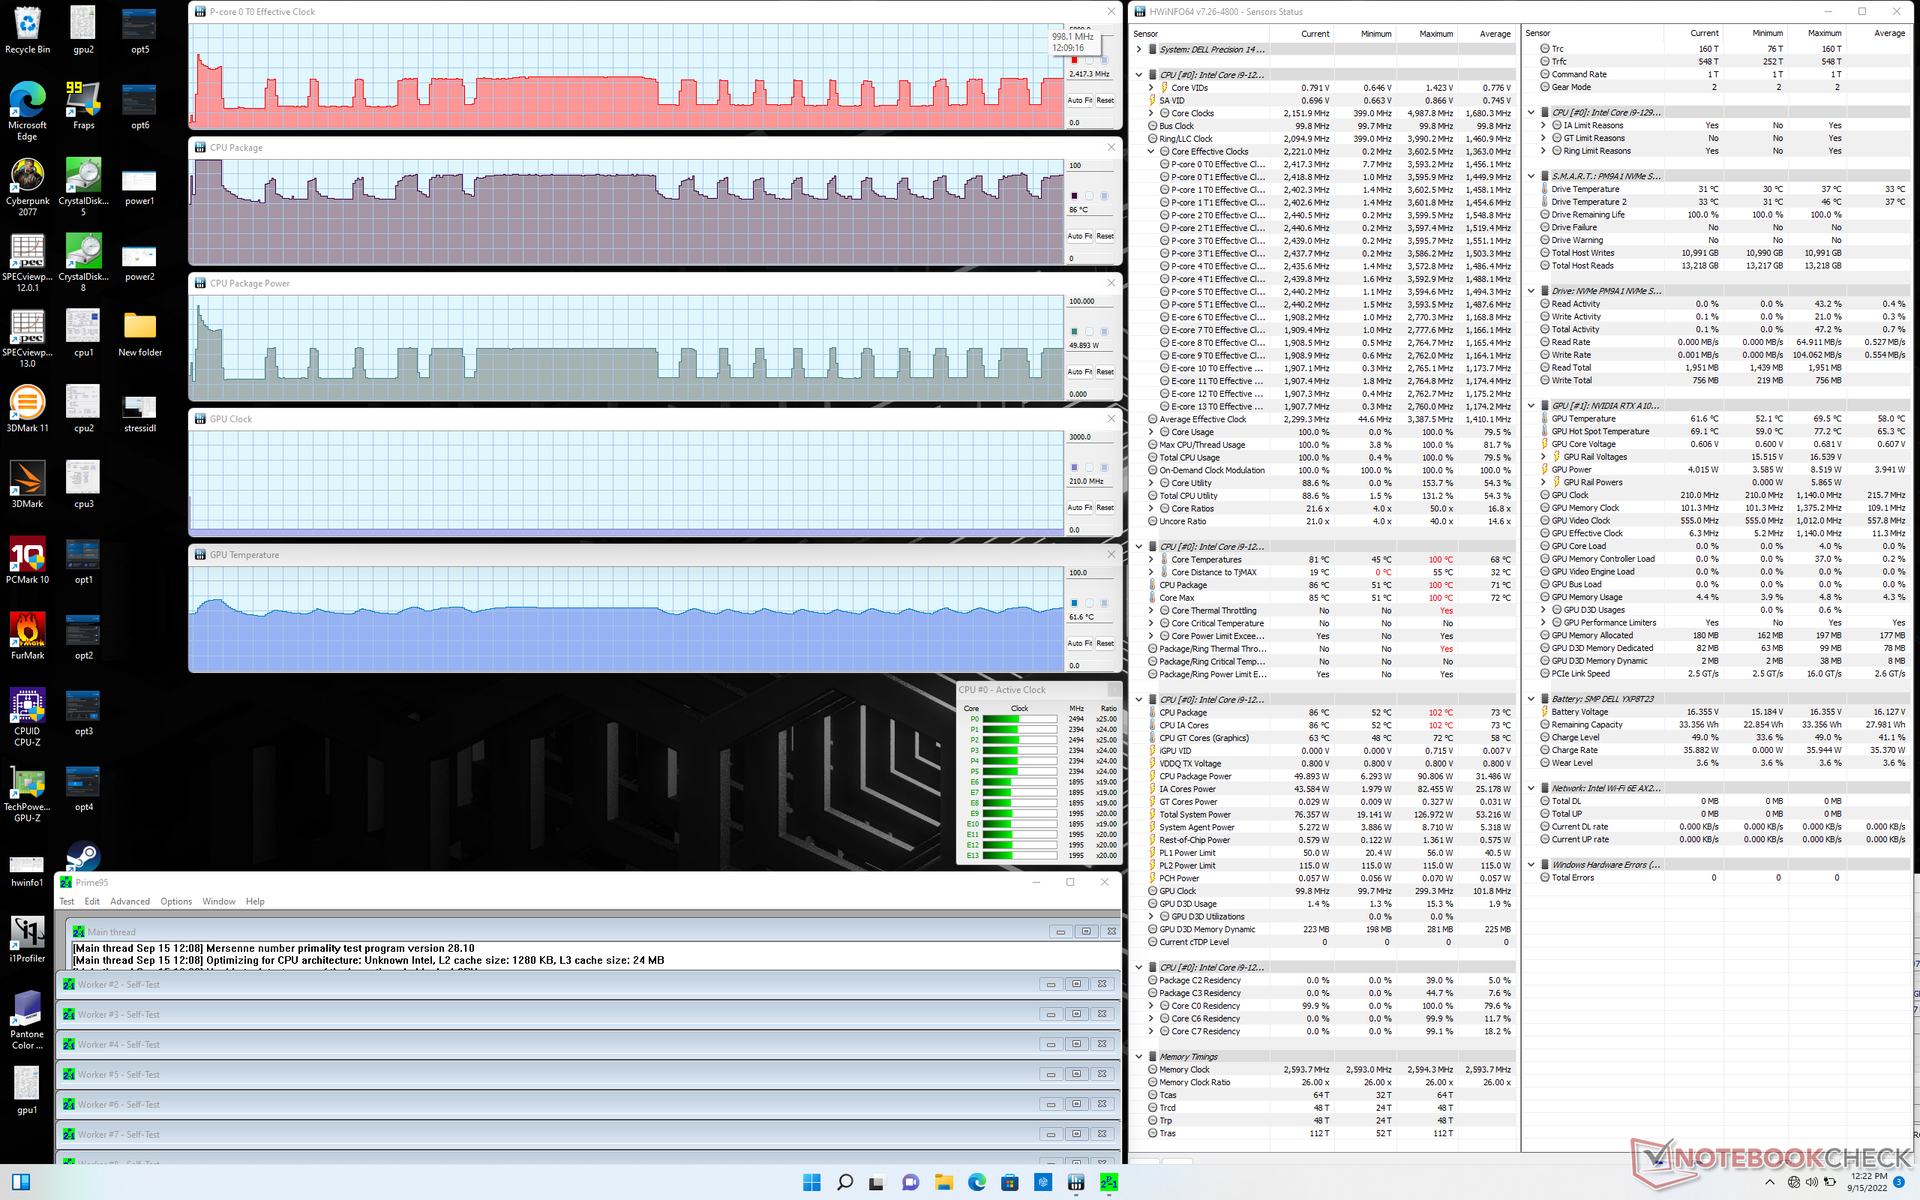
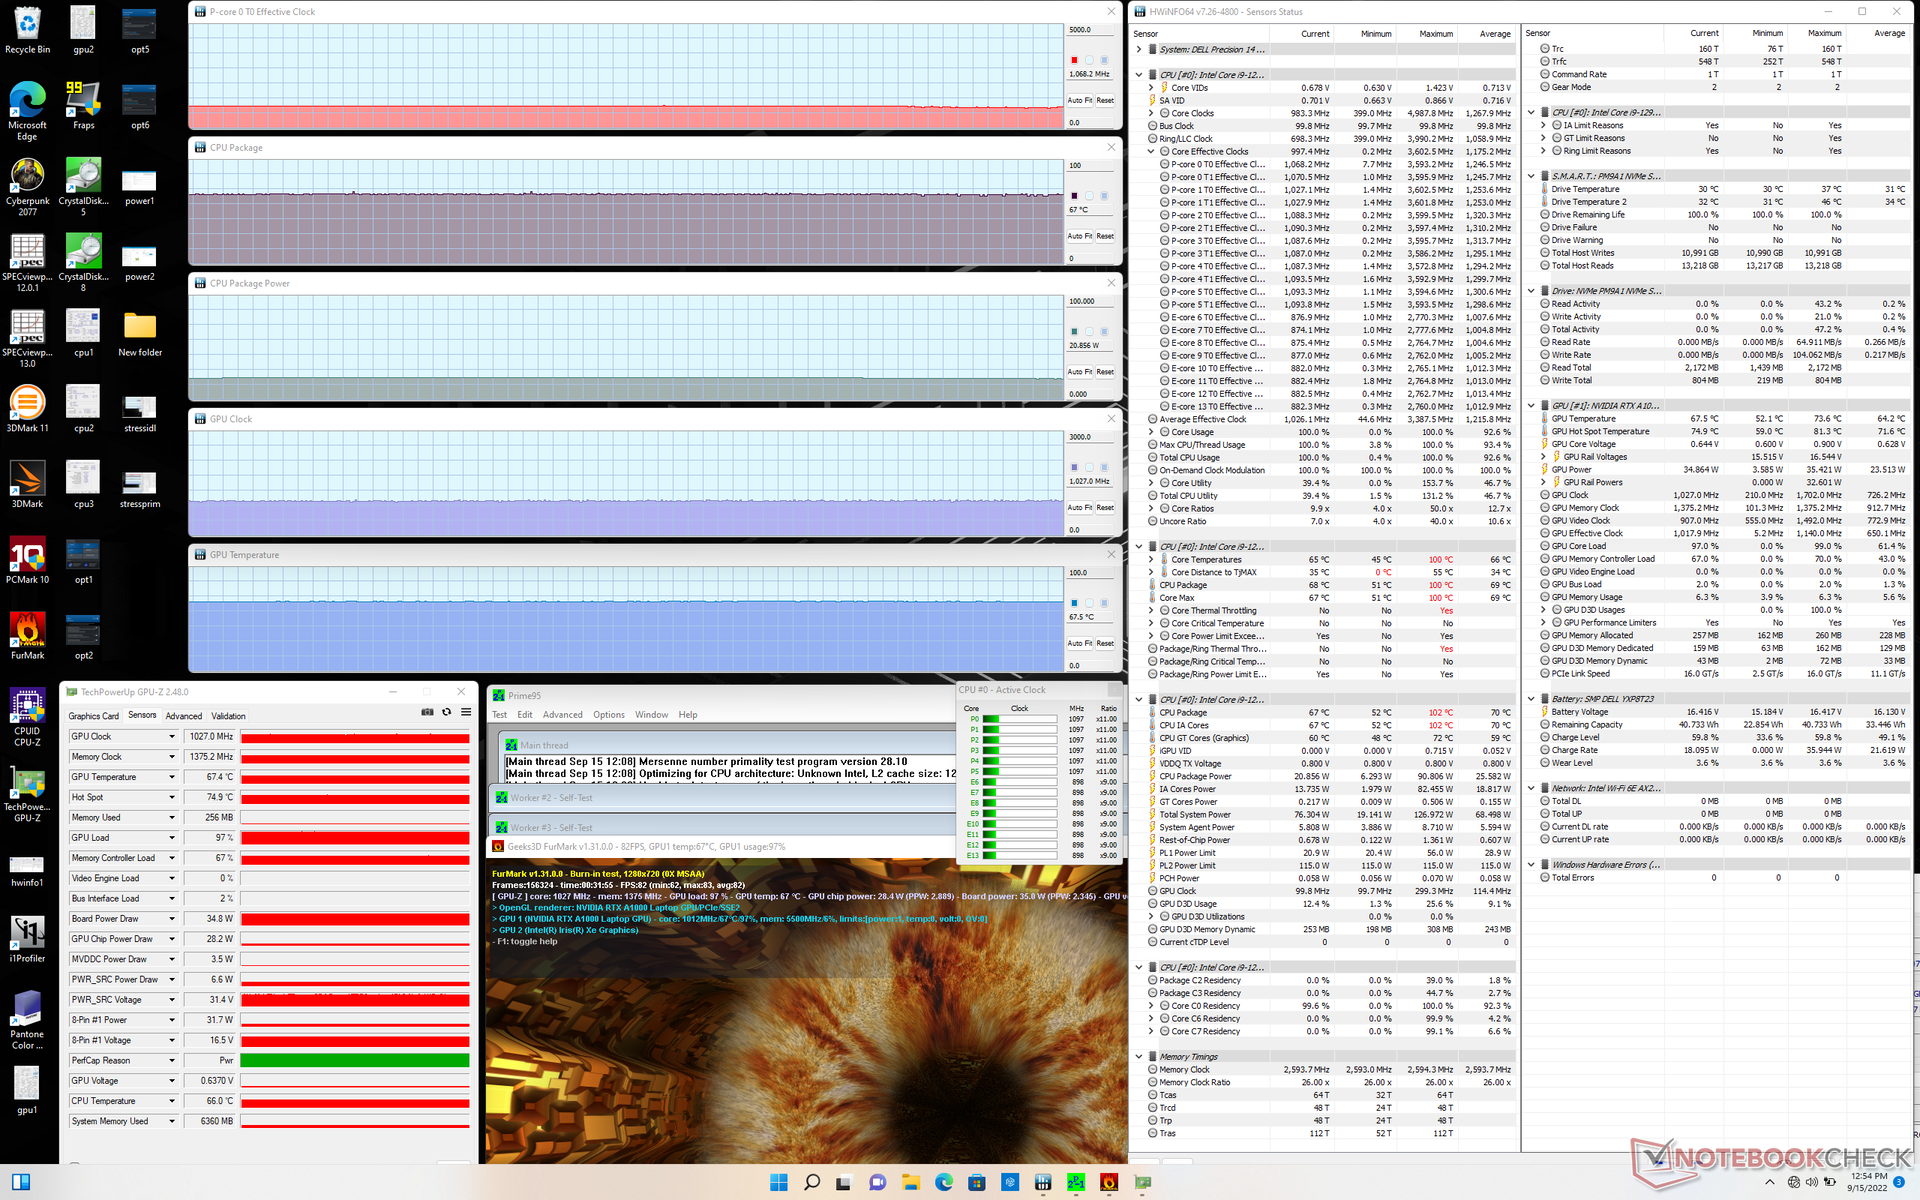
| Relógio CPU (GHz) | Relógio GPU (MHz) | Temperatura média da CPU (°C) | Temperatura média da GPU (°C) | |
| System Idle | -- | -- | 54 | 53 |
| Prime95 Stress | 1.0 - 2.4 | -- | 61 - 80 | ~61 |
| Prime95 + FurMark Stress | 1.1 | 1027 | 67 | 68 |
| Witcher 3 Stress | 1.0 | 1387 | 82 | 71 |
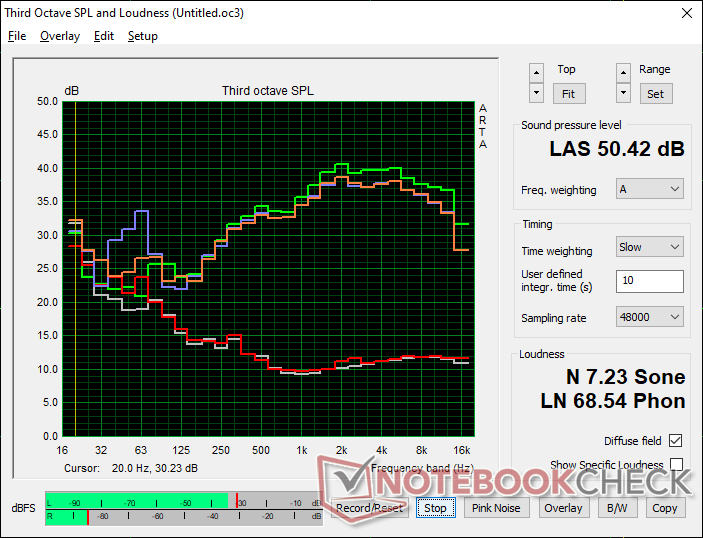
Oradores
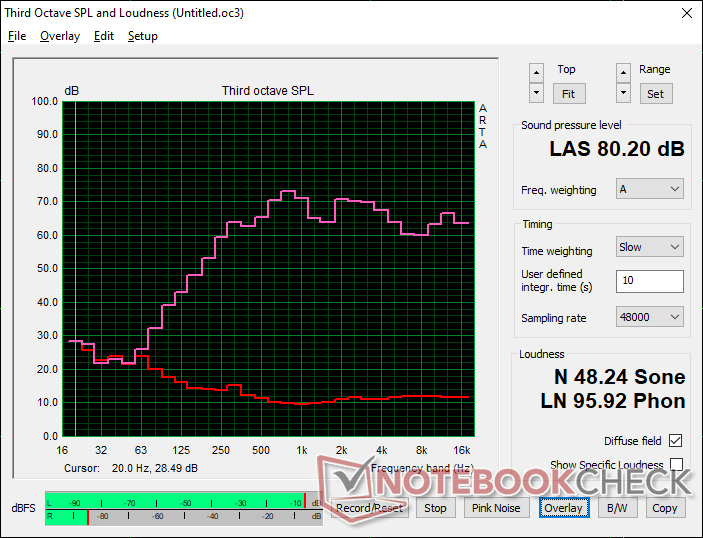
Dell Precision 5000 5470 análise de áudio
(±) | o volume do alto-falante é médio, mas bom (###valor### dB)
Graves 100 - 315Hz
(±) | graves reduzidos - em média 12.9% menor que a mediana
(±) | a linearidade dos graves é média (10.1% delta para a frequência anterior)
Médios 400 - 2.000 Hz
(+) | médios equilibrados - apenas 4.2% longe da mediana
(+) | médios são lineares (6.5% delta para frequência anterior)
Altos 2 - 16 kHz
(+) | agudos equilibrados - apenas 3.4% longe da mediana
(+) | os máximos são lineares (3.9% delta da frequência anterior)
Geral 100 - 16.000 Hz
(+) | o som geral é linear (12.9% diferença em relação à mediana)
Comparado com a mesma classe
» 21% de todos os dispositivos testados nesta classe foram melhores, 6% semelhantes, 72% piores
» O melhor teve um delta de 7%, a média foi 17%, o pior foi 35%
Comparado com todos os dispositivos testados
» 12% de todos os dispositivos testados foram melhores, 3% semelhantes, 85% piores
» O melhor teve um delta de 4%, a média foi 23%, o pior foi 134%
Apple MacBook Pro 16 2021 M1 Pro análise de áudio
(+) | os alto-falantes podem tocar relativamente alto (###valor### dB)
Graves 100 - 315Hz
(+) | bons graves - apenas 3.8% longe da mediana
(+) | o baixo é linear (5.2% delta para a frequência anterior)
Médios 400 - 2.000 Hz
(+) | médios equilibrados - apenas 1.3% longe da mediana
(+) | médios são lineares (2.1% delta para frequência anterior)
Altos 2 - 16 kHz
(+) | agudos equilibrados - apenas 1.9% longe da mediana
(+) | os máximos são lineares (2.7% delta da frequência anterior)
Geral 100 - 16.000 Hz
(+) | o som geral é linear (4.6% diferença em relação à mediana)
Comparado com a mesma classe
» 0% de todos os dispositivos testados nesta classe foram melhores, 0% semelhantes, 100% piores
» O melhor teve um delta de 5%, a média foi 17%, o pior foi 45%
Comparado com todos os dispositivos testados
» 0% de todos os dispositivos testados foram melhores, 0% semelhantes, 100% piores
» O melhor teve um delta de 4%, a média foi 23%, o pior foi 134%
Gestão de energia
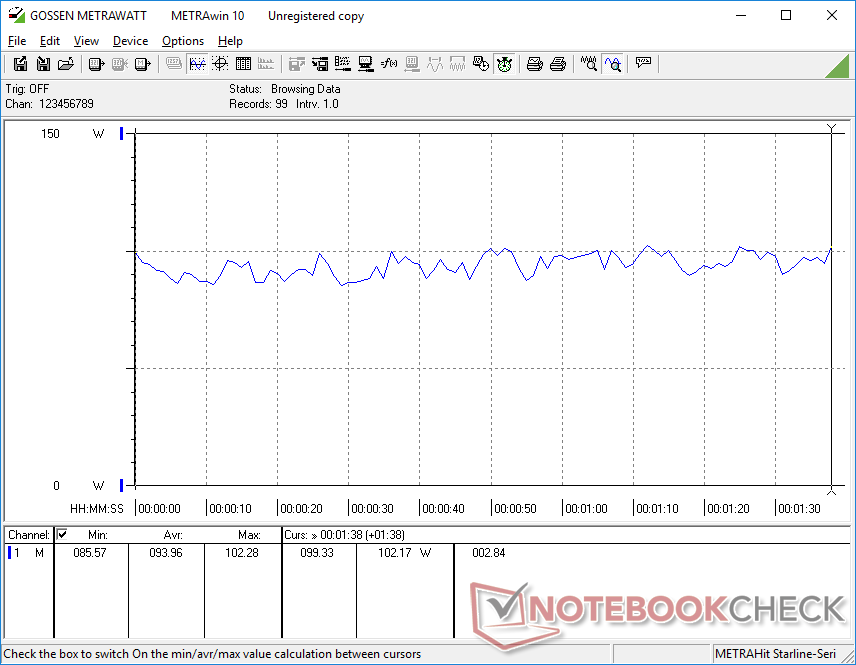
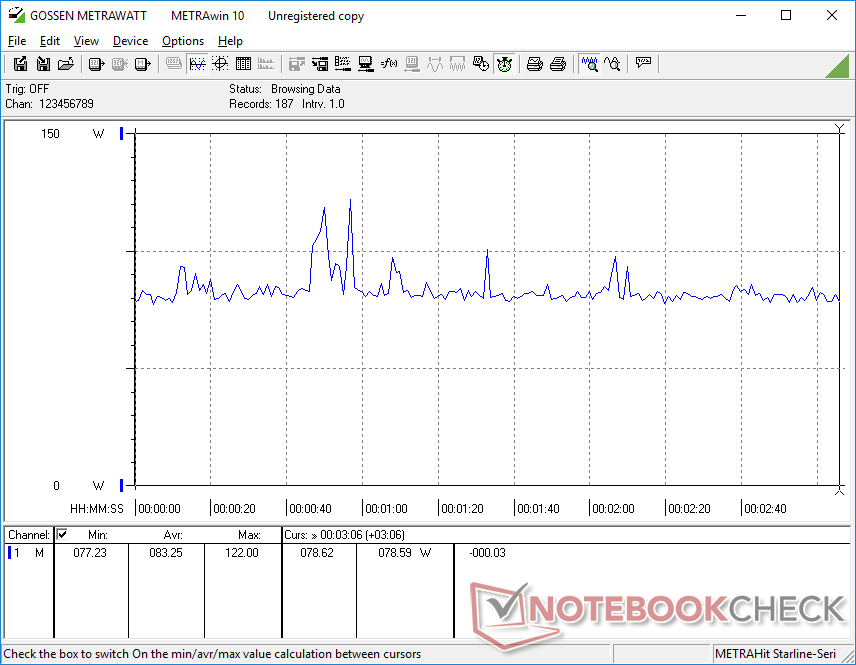
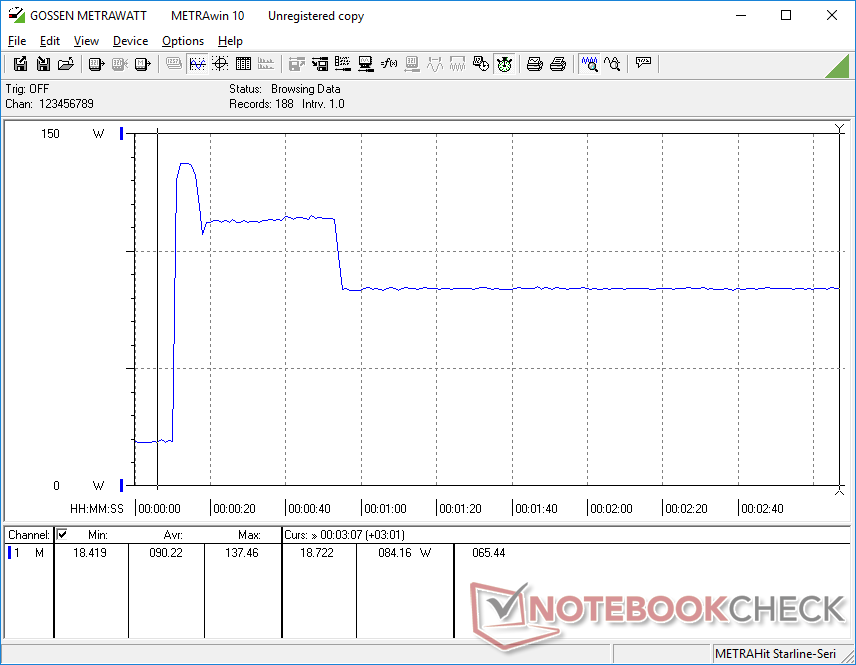
Consumo de energia - Uma pequena máquina exigente
A movimentação na área de trabalho na configuração de brilho e perfil de potência mais baixos exige apenas 4,3 W enquanto a configuração de brilho e perfil de potência máxima com o dGPU ativo exige quase 19 W. Ao executar cargas mais exigentes equivalentes a jogos, no entanto, o sistema torna-se tão exigente quanto o maior Precision 5560 com a GPU RTX A2000 mais rápida, mas mais lenta CPU i7-11850H. O sistema é geralmente mais exigente do que outras estações de trabalho de 14 polegadas como seria de se esperar de seu hardware interno mais rápido
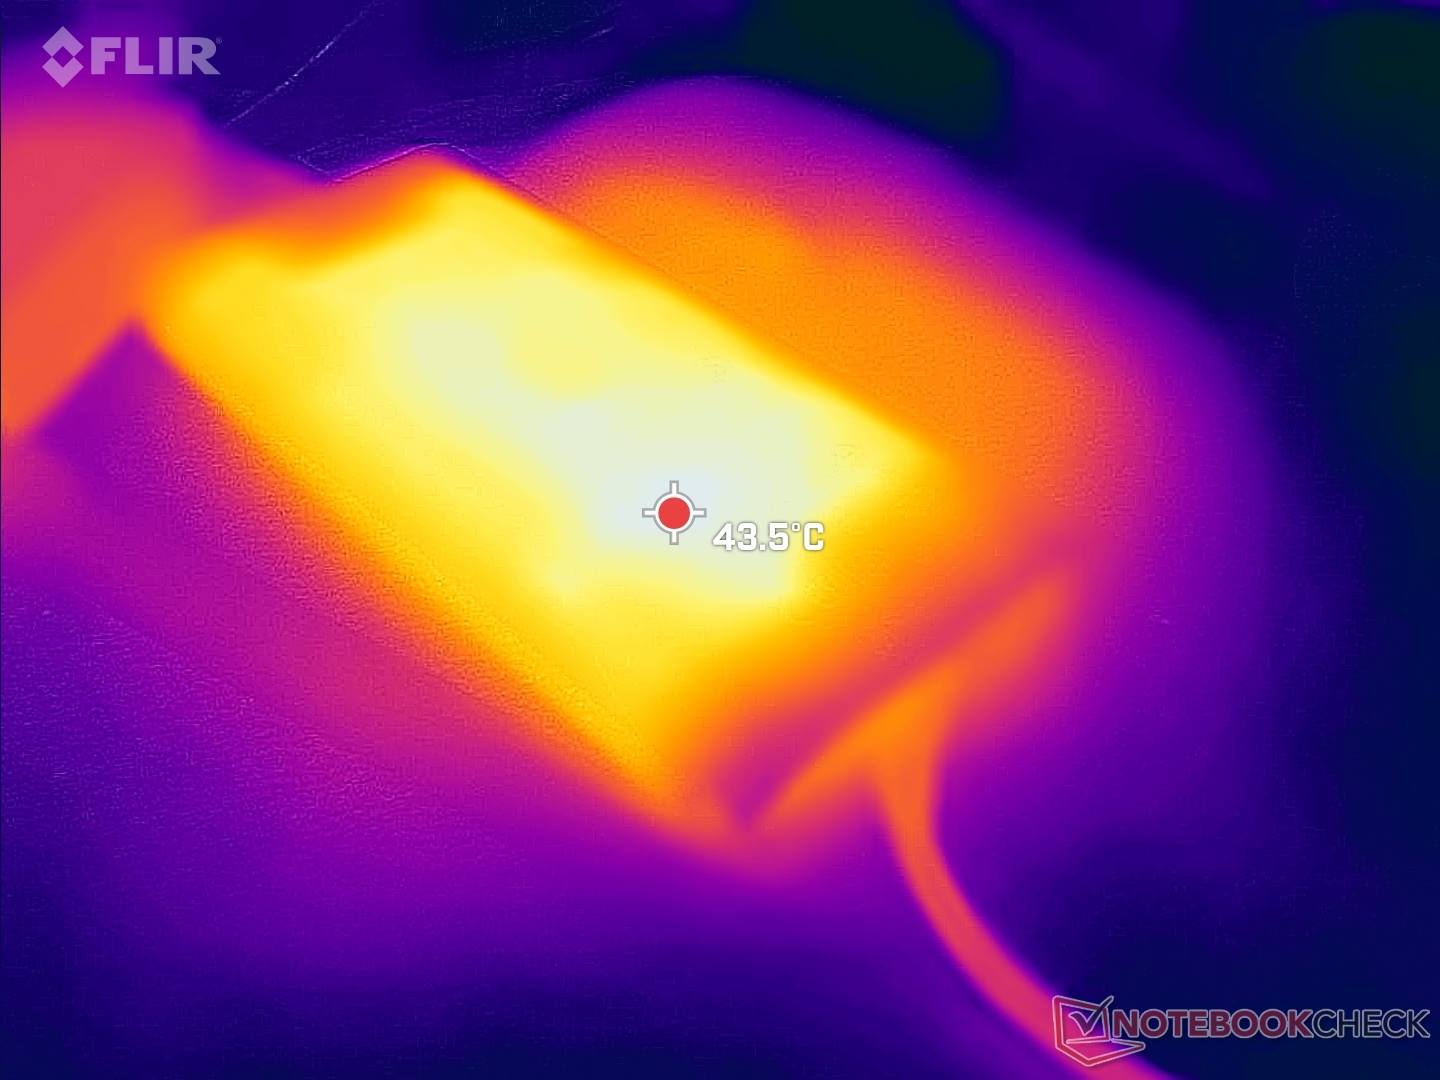
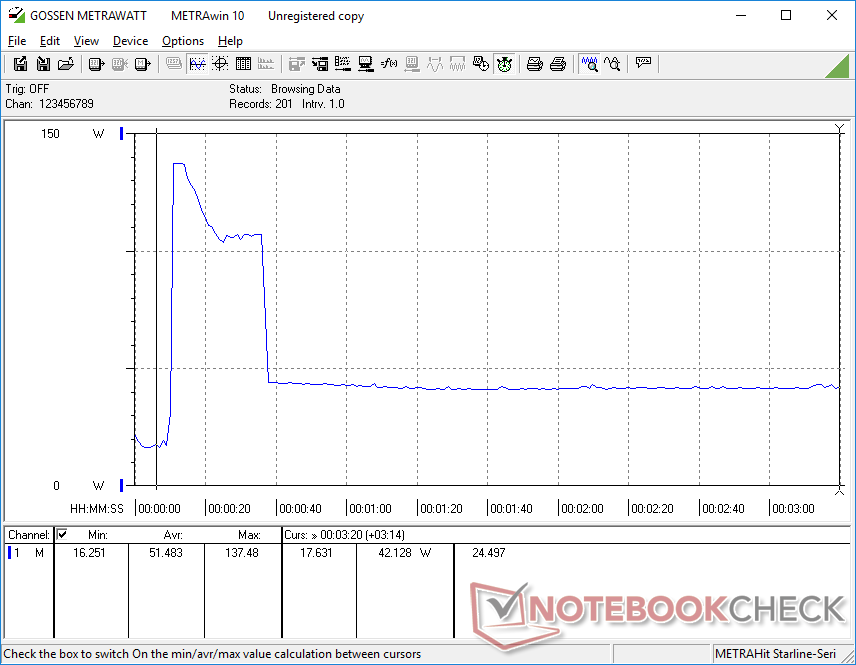
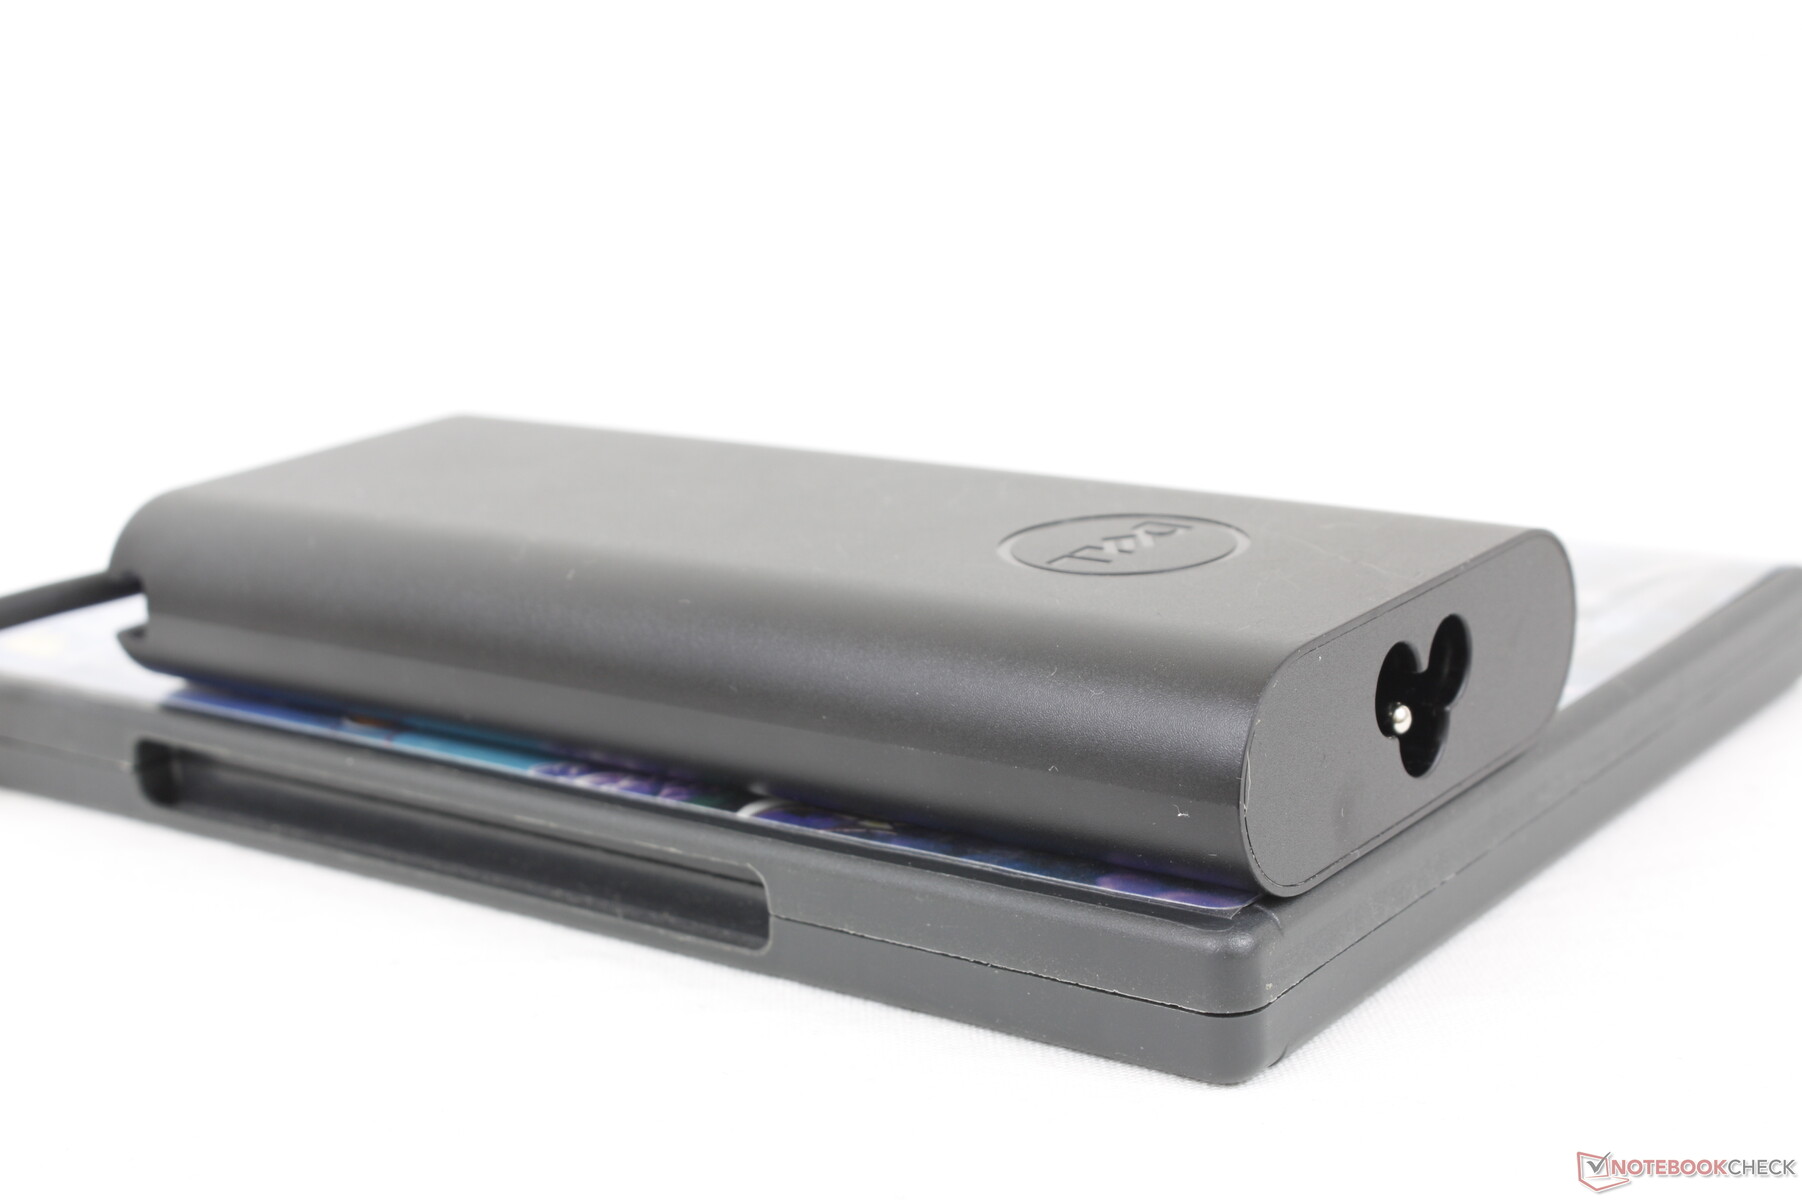
Somos capazes de registrar um consumo máximo de quase 138 W a partir do pequeno-médio (~14,3 x 6,5 x 2,2 cm) adaptador USB-C AC de 130 W ao executar Prim95. Esta taxa é apenas temporária, como mostram as telas abaixo, devido às limitações térmicas da solução de resfriamento. A forma da curva de consumo de energia corresponde de perto a nossa taxa de clock e as observações de consumo de energia da placa de cima.
Note que as SKUs sem a discreta GPU RTX A1000 serão enviadas com um adaptador USB-C AC menor de 90 W em vez de um maior de 130 W.
| desligado | |
| Ocioso | |
| Carga |
|
Key:
min: | |
| Dell Precision 5000 5470 i9-12900H, RTX A1000 Laptop GPU, Samsung PM9A1 MZVL21T0HCLR, IPS, 2560x1600, 14" | Lenovo ThinkPad P15v G2 21A9000XGE i7-11800H, T1200 Laptop GPU, Toshiba XG6 KXG6AZNV512G, IPS LED, 1920x1080, 15.6" | Dell Precision 5000 5560 i7-11850H, RTX A2000 Laptop GPU, Samsung PM9A1 MZVL22T0HBLB, IPS, 3840x2400, 15.6" | Lenovo ThinkPad P14s G2 AMD R7 PRO 5850U, Vega 8, SK Hynix PC711 1TB HFS001TDE9X081N, IPS LED, 3840x2160, 14" | HP ZBook Firefly 14 G8 2C9Q2EA i7-1165G7, T500 Laptop GPU, Toshiba XG6 KXG60ZNV1T02, IPS, 1920x1080, 14" | HP ZBook Firefly 14 G7 i7-10610U, Quadro P520, Toshiba XG6 KXG60ZNV512G, IPS, 1920x1080, 14" | |
|---|---|---|---|---|---|---|
| Power Consumption | 1% | -22% | 35% | 40% | 30% | |
| Idle Minimum * (Watt) | 4.3 | 5.96 -39% | 6.2 -44% | 4.49 -4% | 3.1 28% | 3.3 23% |
| Idle Average * (Watt) | 8.9 | 8.37 6% | 13.9 -56% | 9.62 -8% | 4.7 47% | 9.3 -4% |
| Idle Maximum * (Watt) | 18.9 | 9.05 52% | 23.8 -26% | 10.24 46% | 8.6 54% | 12.1 36% |
| Load Average * (Watt) | 94 | 91.82 2% | 95.7 -2% | 31.56 66% | 64.8 31% | 59.4 37% |
| Witcher 3 ultra * (Watt) | 83.2 | 102 -23% | 87 -5% | 43.7 47% | 59.6 28% | 52.7 37% |
| Load Maximum * (Watt) | 137.5 | 126.38 8% | 132.6 4% | 52.37 62% | 68.5 50% | 69.4 50% |
* ... menor é melhor
Power Consumption Witcher 3 / Stresstest
Power Consumption external Monitor
Vida útil da bateria
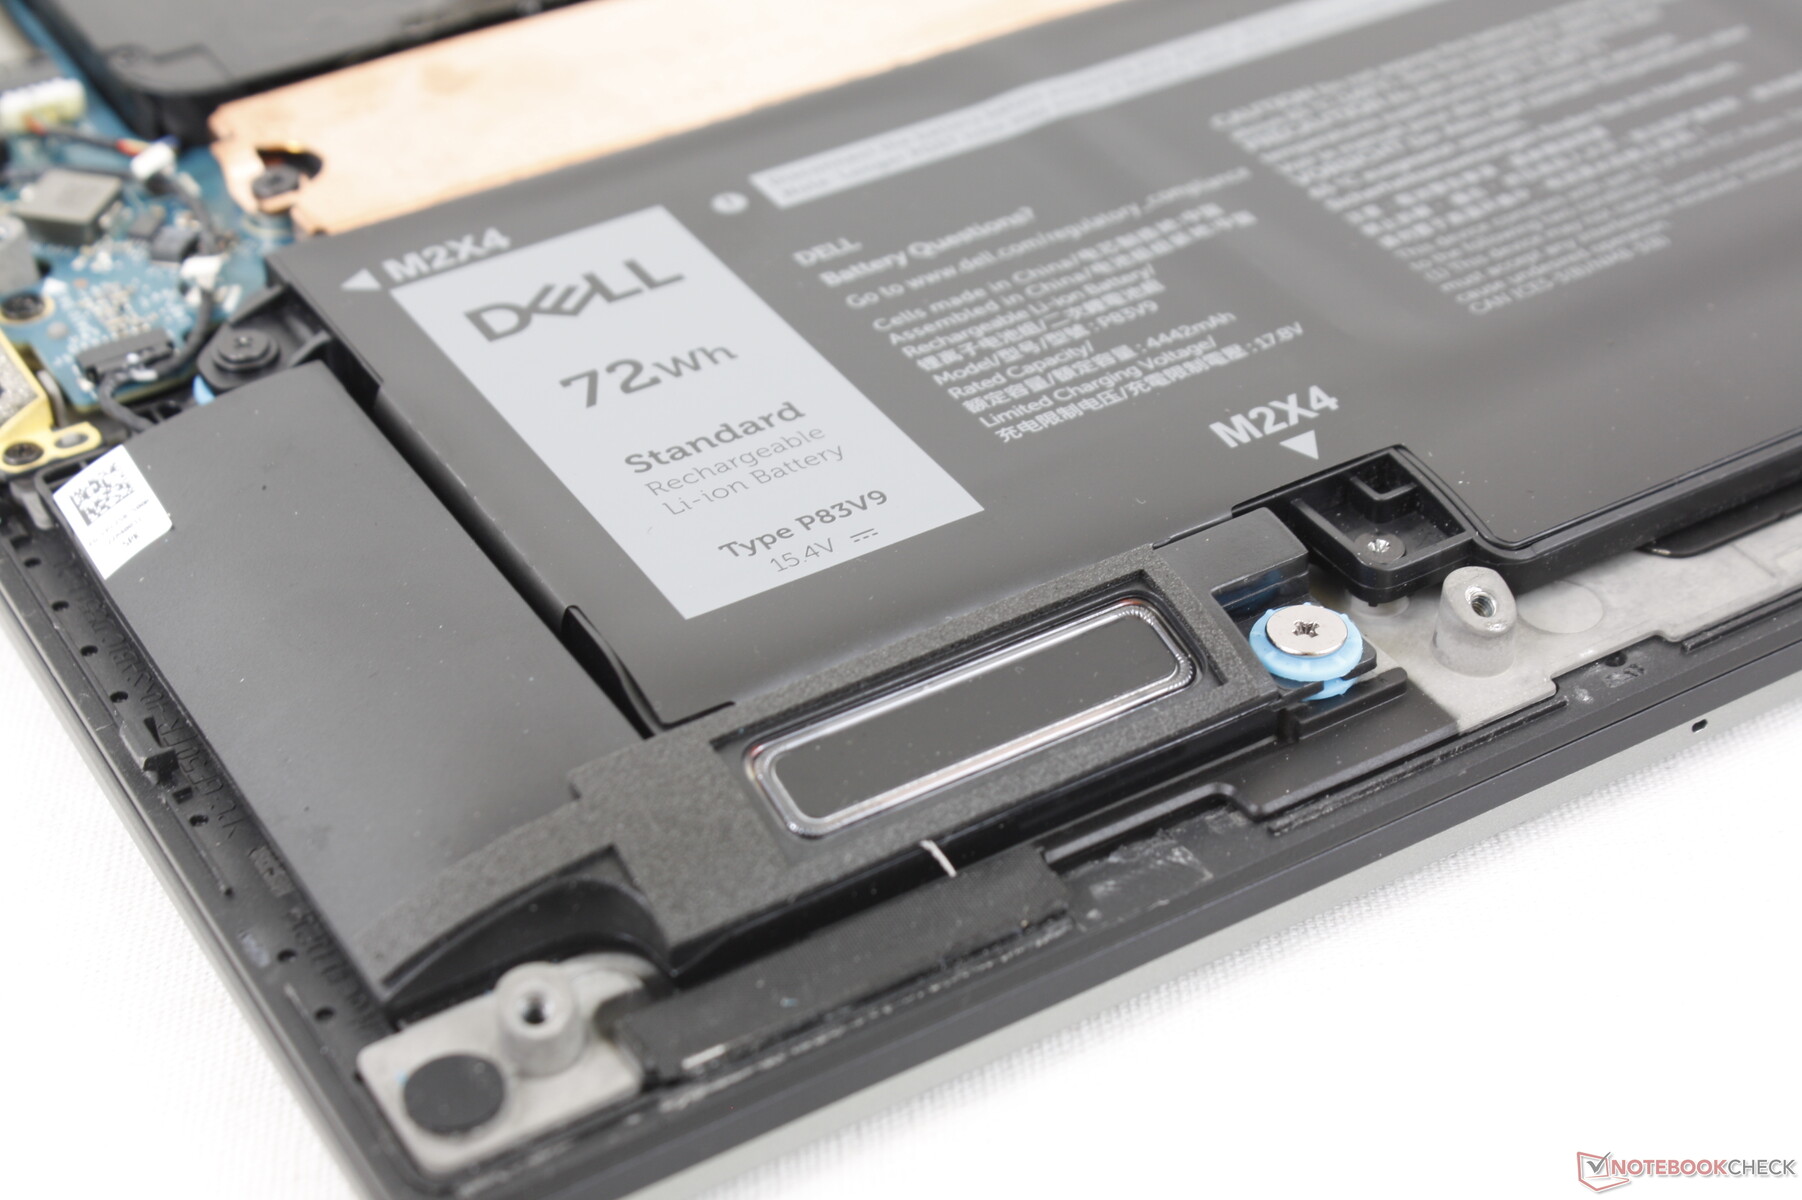
A capacidade da bateria é relativamente grande para um laptop ultramarino de 14 polegadas a 72 Wh. O tempo de funcionamento da WLAN dura pouco mais de 9,5 horas com carga total, o que é algumas horas mais curto do que o que gravamos no mais lento Core U-series HP ZBook Firefly 14 G8.
O carregamento da capacidade vazia à plena leva cerca de 2 horas.
| Dell Precision 5000 5470 i9-12900H, RTX A1000 Laptop GPU, 72 Wh | Lenovo ThinkPad P15v G2 21A9000XGE i7-11800H, T1200 Laptop GPU, 68 Wh | Dell Precision 5000 5560 i7-11850H, RTX A2000 Laptop GPU, 86 Wh | Lenovo ThinkPad P14s G2 AMD R7 PRO 5850U, Vega 8, 50 Wh | HP ZBook Firefly 14 G8 2C9Q2EA i7-1165G7, T500 Laptop GPU, 53 Wh | HP ZBook Firefly 14 G7 i7-10610U, Quadro P520, 53 Wh | |
|---|---|---|---|---|---|---|
| Duração da bateria | -8% | 4% | 7% | 162% | 21% | |
| Reader / Idle (h) | 14.7 | 17.2 17% | 12 -18% | |||
| WiFi v1.3 (h) | 9.6 | 7.5 -22% | 6.3 -34% | 8.3 -14% | 12.8 33% | 10.1 5% |
| Load (h) | 1.1 | 0.9 -18% | 1.8 64% | 1.4 27% | 4.3 291% | 1.5 36% |
| H.264 (h) | 8 | 10.6 | 12.5 |
Pro
Contra
Veredicto - Uber Poderoso sem o tamanho Uber
O Precision 5470 pode ser melhor descrito como uma estação de trabalho fina e leve com o processador de um laptop de jogos espesso e pesado. Você não vai encontrar outra estação de trabalho de 14 polegadas com a mesma CPU Core i9-12900H e até mesmo a discreta GPU Nvidia RTX como esta Dell. Se você está procurando maximizar o desempenho enquanto mantém o peso e o tamanho o mais baixo possível, então o Precision 5470 pode valer a pena considerar.
O Precision 5470 é mais rápido e mais potente do que seu pequeno tamanho poderia sugerir. Este é o modelo de estação de trabalho a ser obtido se você quiser manter o desempenho tão alto quanto possível com um pequeno fator de forma de 14 polegadas.
Infelizmente, o sistema é um pouco ambicioso demais quando se trata de desempenho. Seu Core i9-12900H tem um desempenho inferior ao de outros laptops com a mesma CPU. Ele ainda é rápido em relação a outras estações de trabalho de 14 polegadasmas definitivamente poderia ter sido mais rápido. Temos nossas preocupações sobre o quanto o Core i9-12900HK SKU pode realmente funcionar melhor sobre nosso Core i9-12900H, dadas as flutuações indesejáveis da taxa de relógio durante nossa revisão. Enquanto isso, o RTX A1000 exibe um fraco potencial de traçado de raio apesar de ter o RTX em seu nome muito parecido com nossas observações com o GeForce RTX 3050, no qual o A1000 se baseia.
A exigente CPU da série H da 12ª geração é diretamente responsável pelo ruído relativamente alto do ventilador e pelo alto consumo de energia do Precision 5470. Pode parecer e sentir-se como um laptop de 14 polegadas, mas às vezes pode definitivamente soar como um laptop de jogos. Este inconveniente é comum em pequenos laptops de alto desempenho.
Preço e Disponibilidade
O Precision 5470 está agora amplamente disponível através de revendedores online, como Newegg ou Amazônia embora apenas em configurações limitadas de FHD, variando de US$ 2.000 a US$ 2.300. Os usuários podem, em vez disso, comprar diretamente da Dell que terá mais opções configuráveis para escolher.
Dell Precision 5000 5470
- 09/16/2022 v7 (old)
Allen Ngo
Price comparison

