KFA2 GeForce RTX 4080 SG revisão da GPU desktop: Ótimo desempenho atende a preços questionáveis

Após revisarmos recentemente a KFA2 GeForce RTX 4090 SGagora é hora de o menor KFA2 GeForce RTX 4080 SG mostrar o que tem debaixo do capô. Por falar em debaixo do capô, ao contrário da linha Ampere, o segundo modelo mais rápido da geração atual é baseado em um chip gráfico diferente daquele do modelo topo-de-gama. Ele usa a GPU AD103, que é substancialmente menor e, portanto, mais barata de produzir do que a AD102. Entretanto, o menor custo de produção não se reflete totalmente no preço atual. Esta é uma questão amplamente discutida, e também nós acreditamos que os preços devem ser reduzidos significativamente para que as últimas placas gráficas não acabem se tornando aquecedoras de prateleira. O RRP do GeForce RTX 4080 mais que duplicou em relação ao seu predecessor (GeForce RTX 3080). Por enquanto, vamos deixar aqui nossas críticas sobre os preços. A partir deste ponto, queremos nos concentrar no desempenho e nas características do KFA2 GeForce RTX 4080 SG e discutir o quão bem este modelo se empilha particularmente em relação GPUs RDNA3 da AMD.
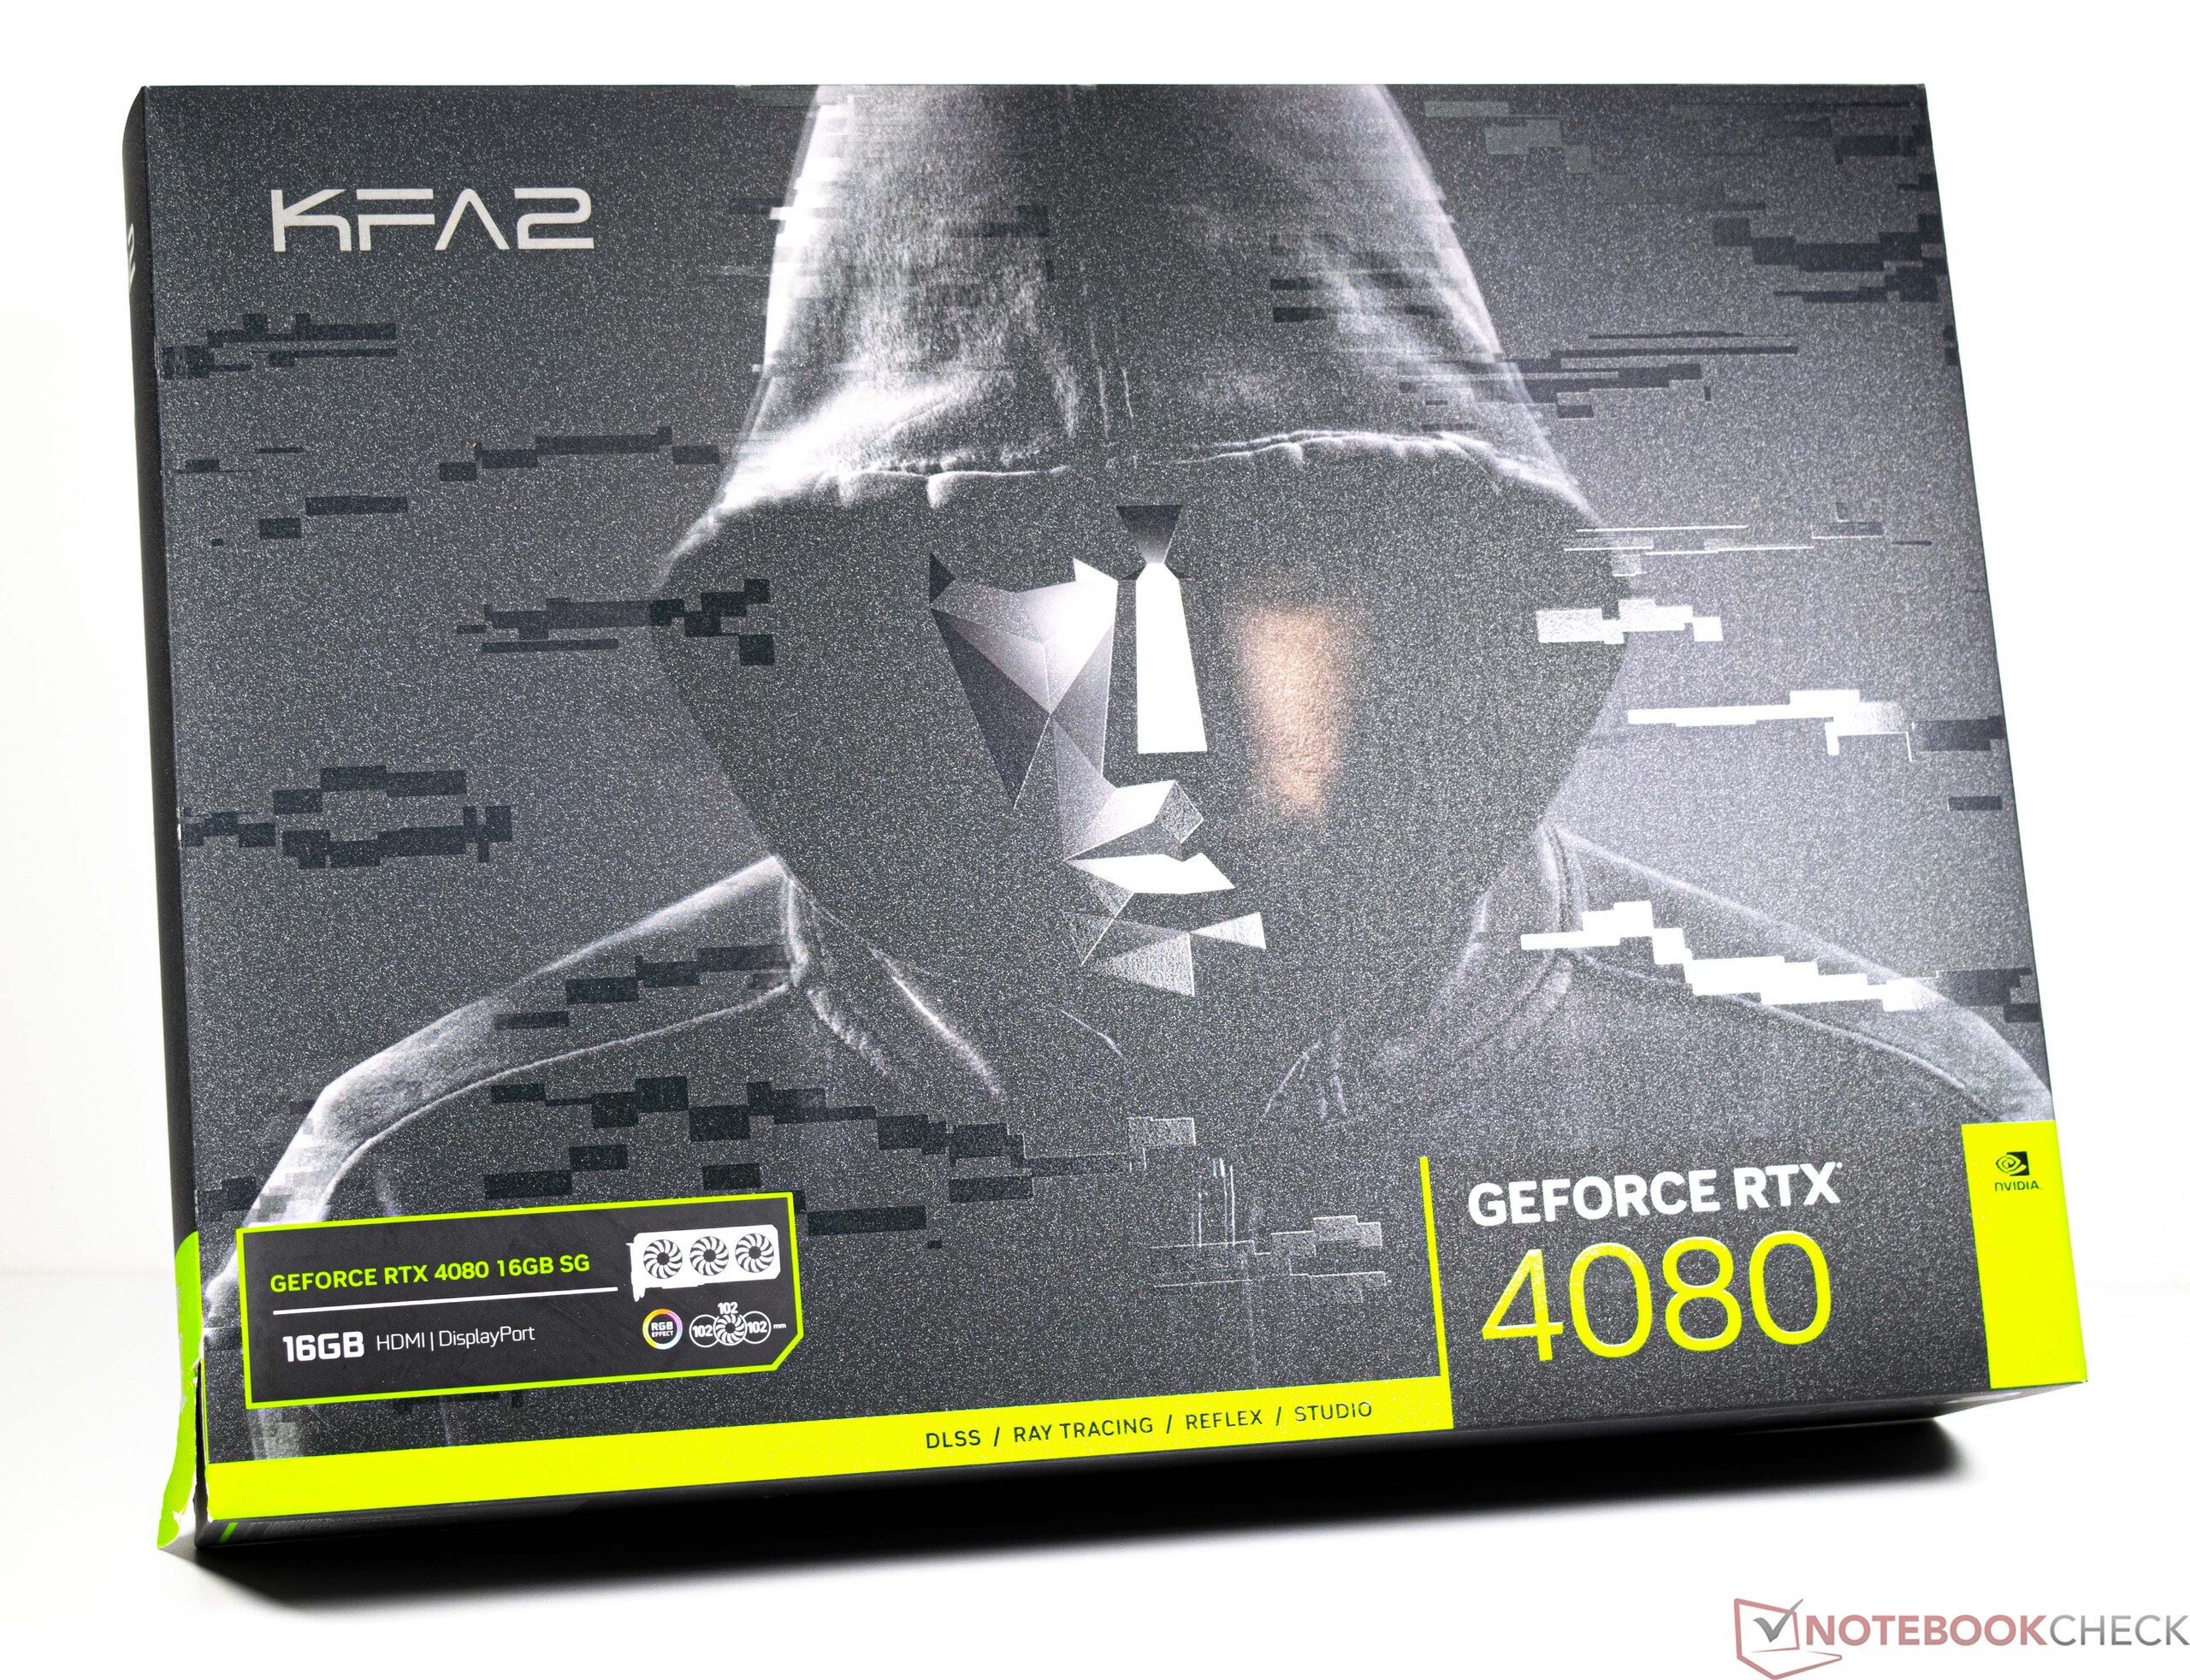
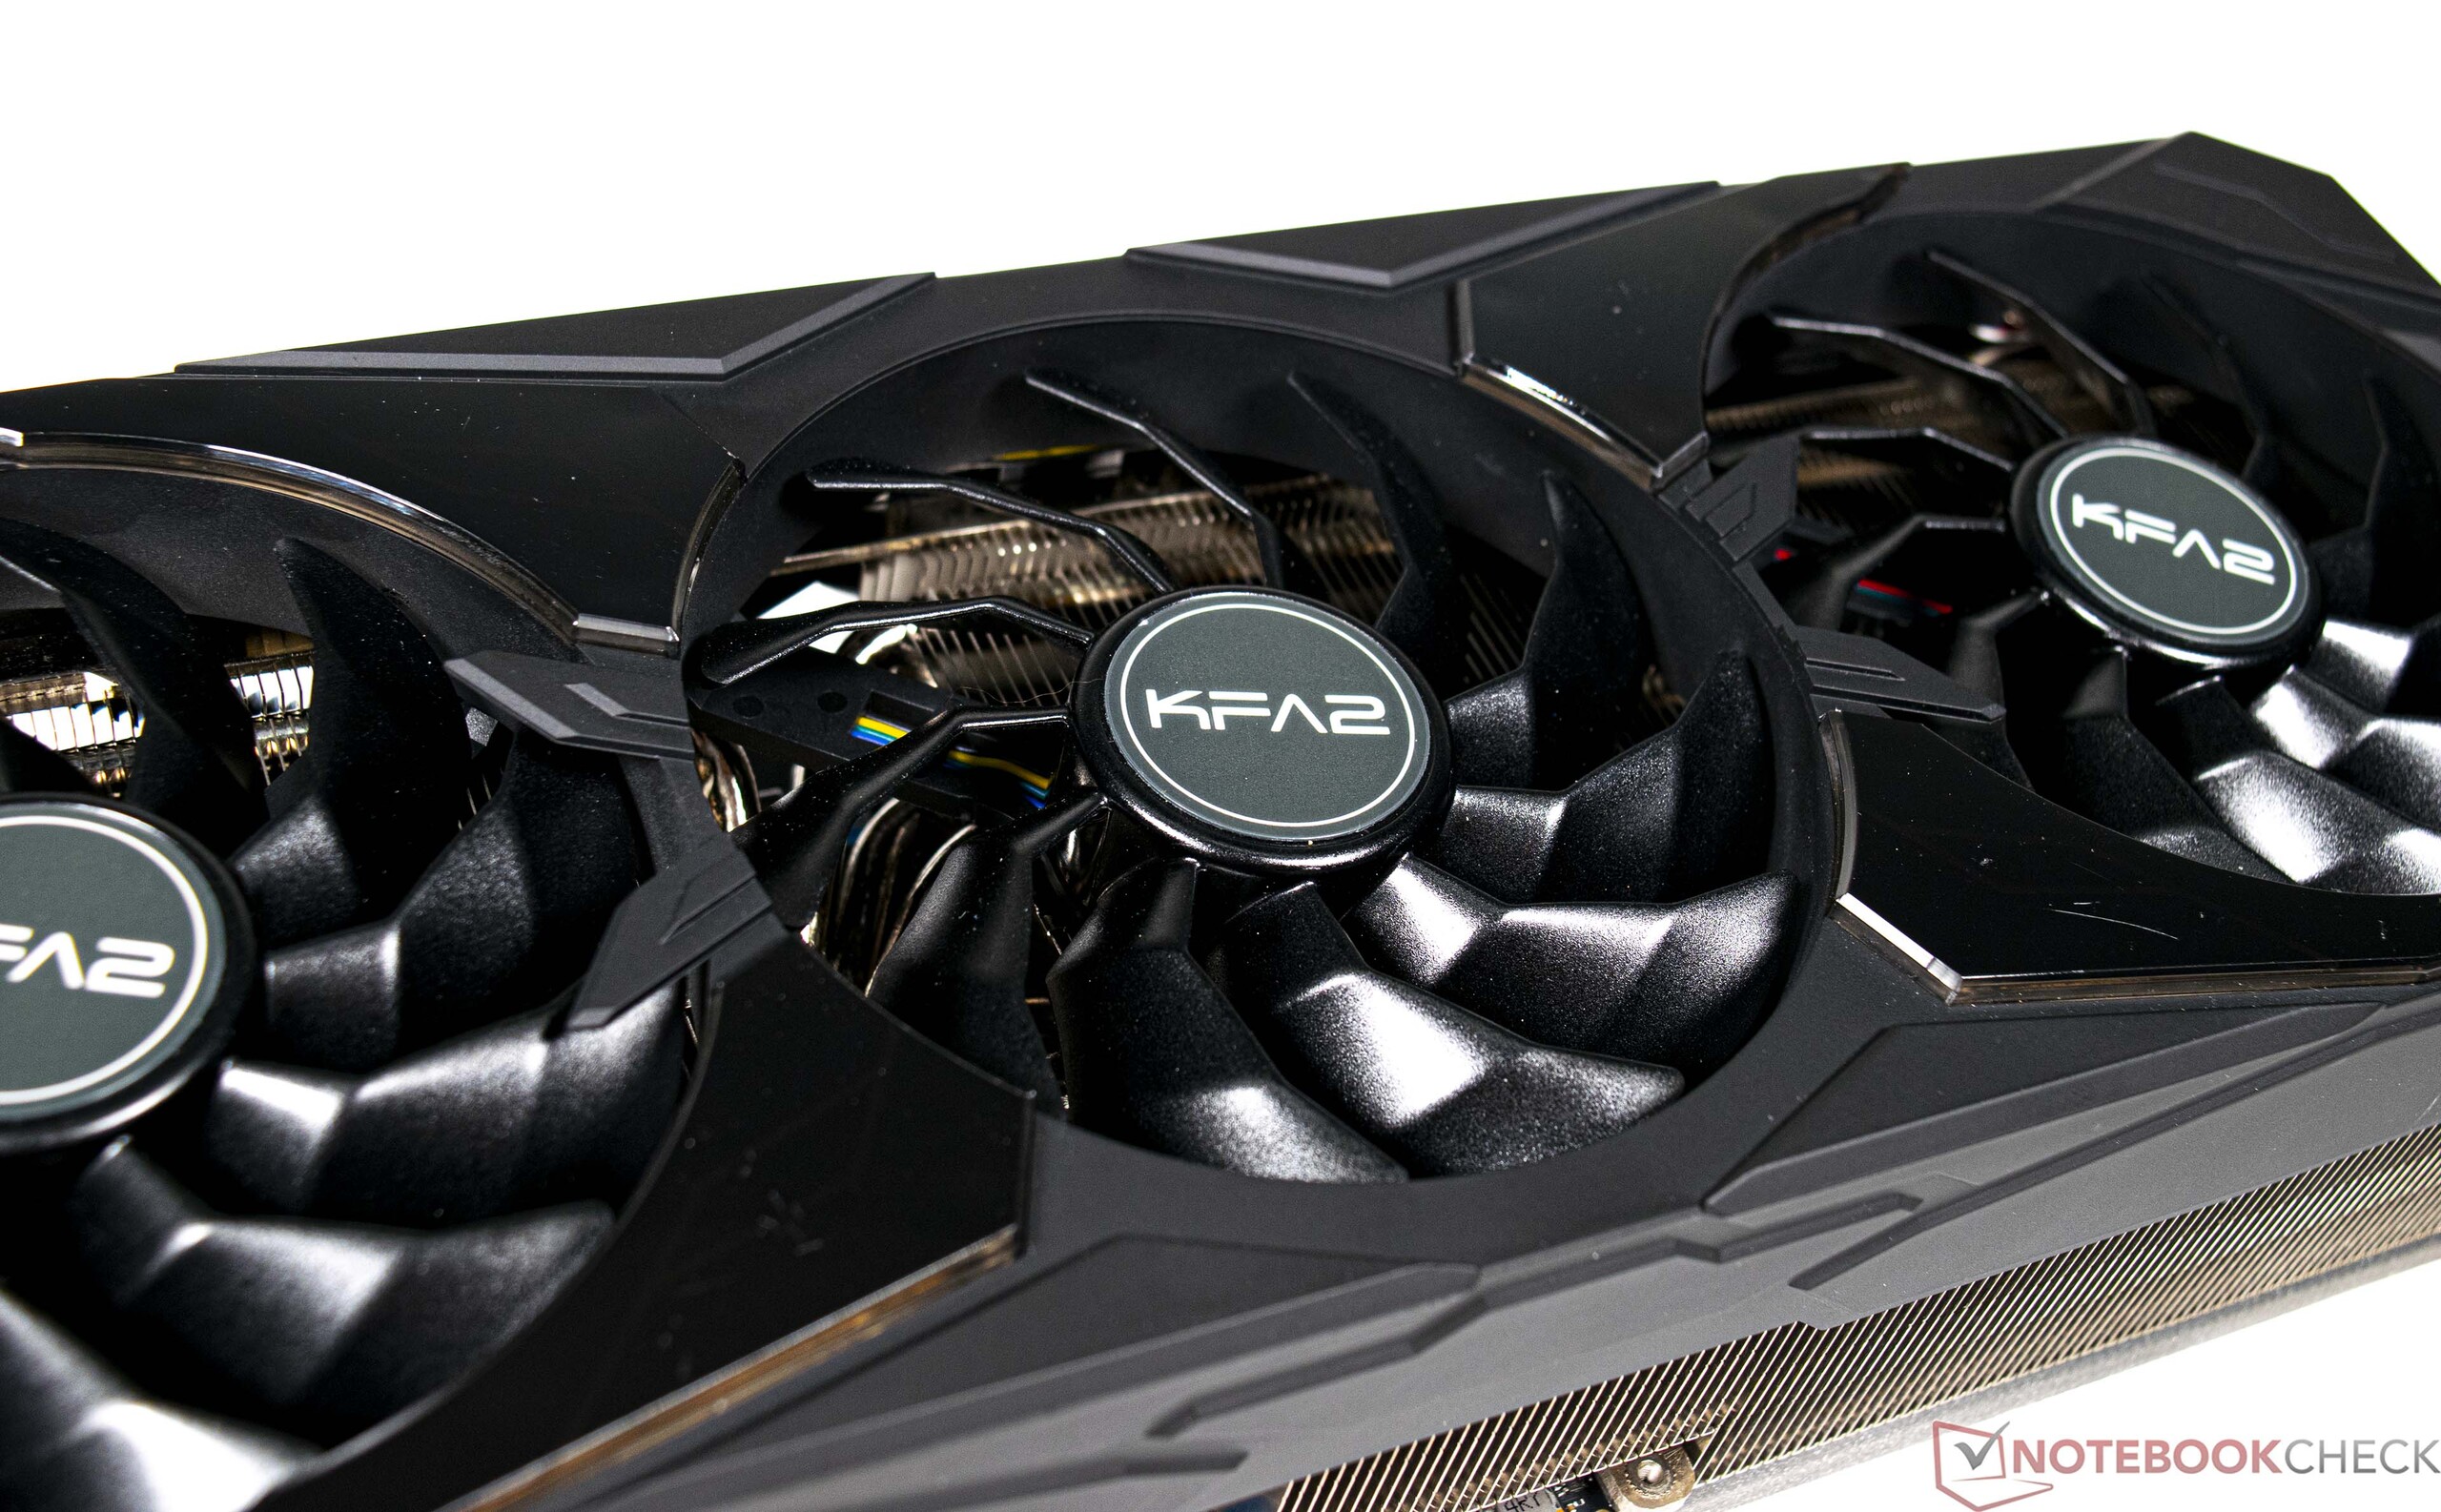
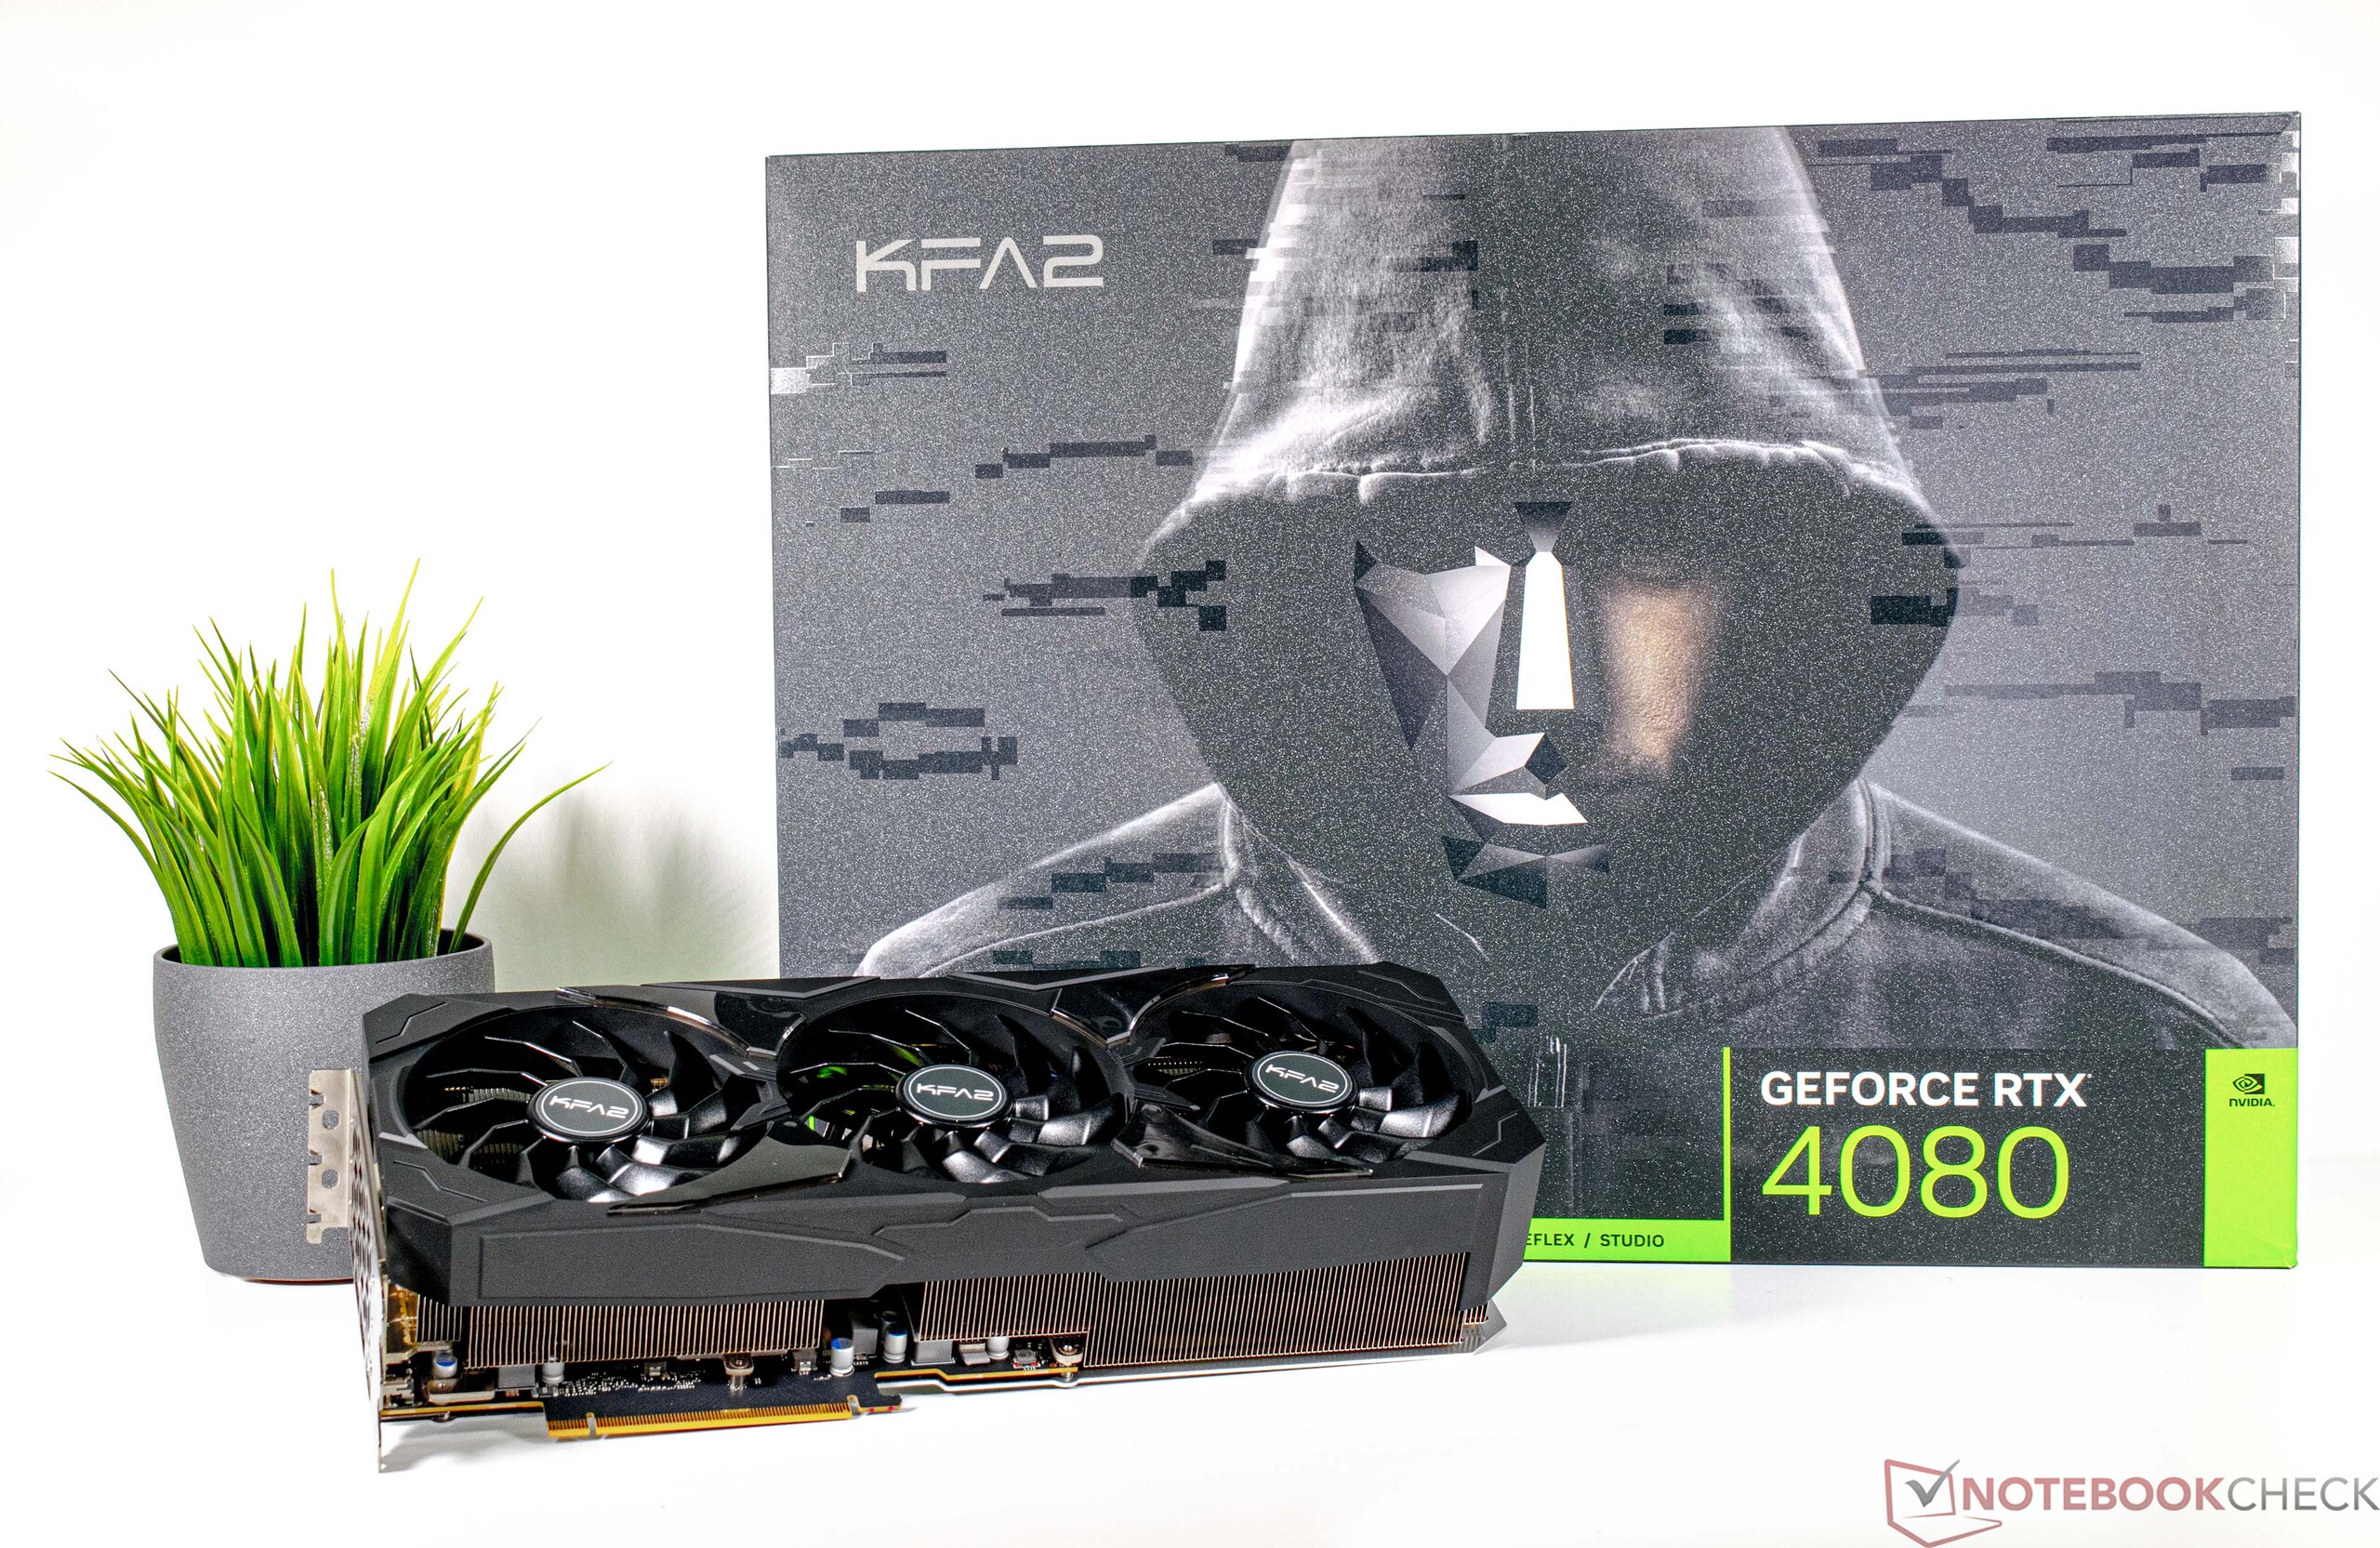
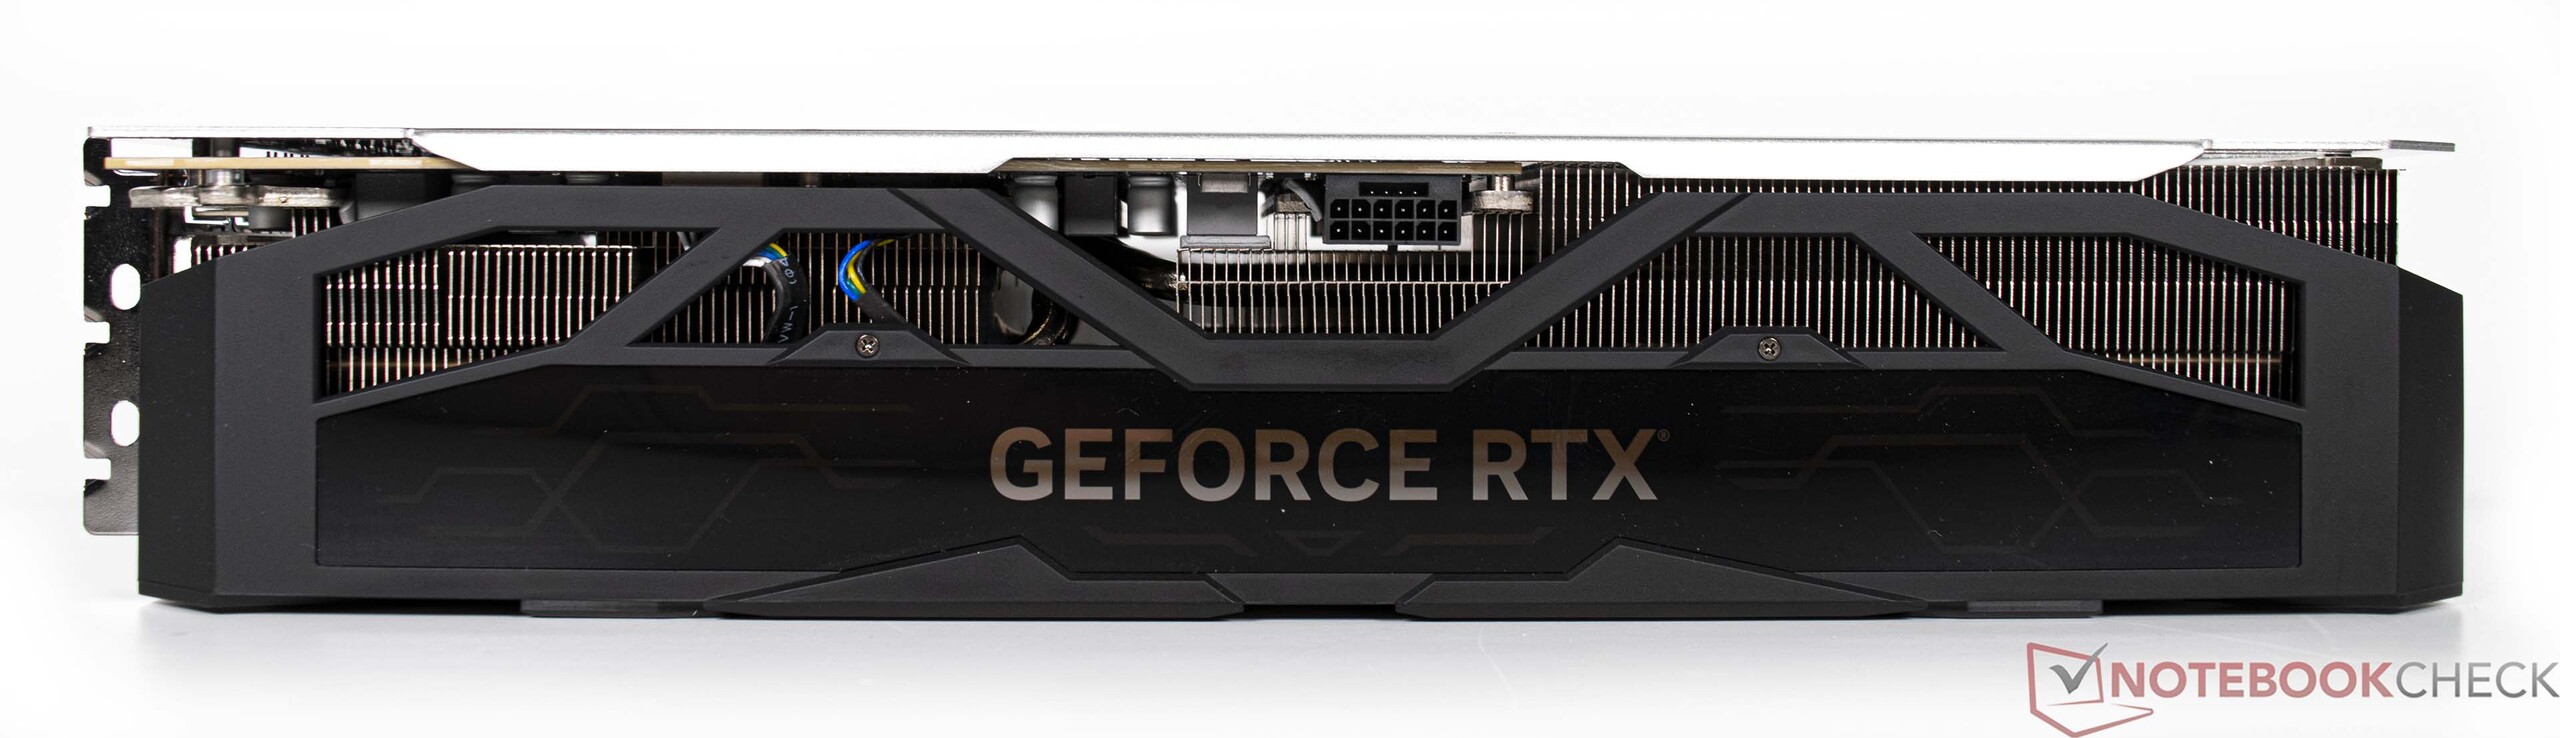
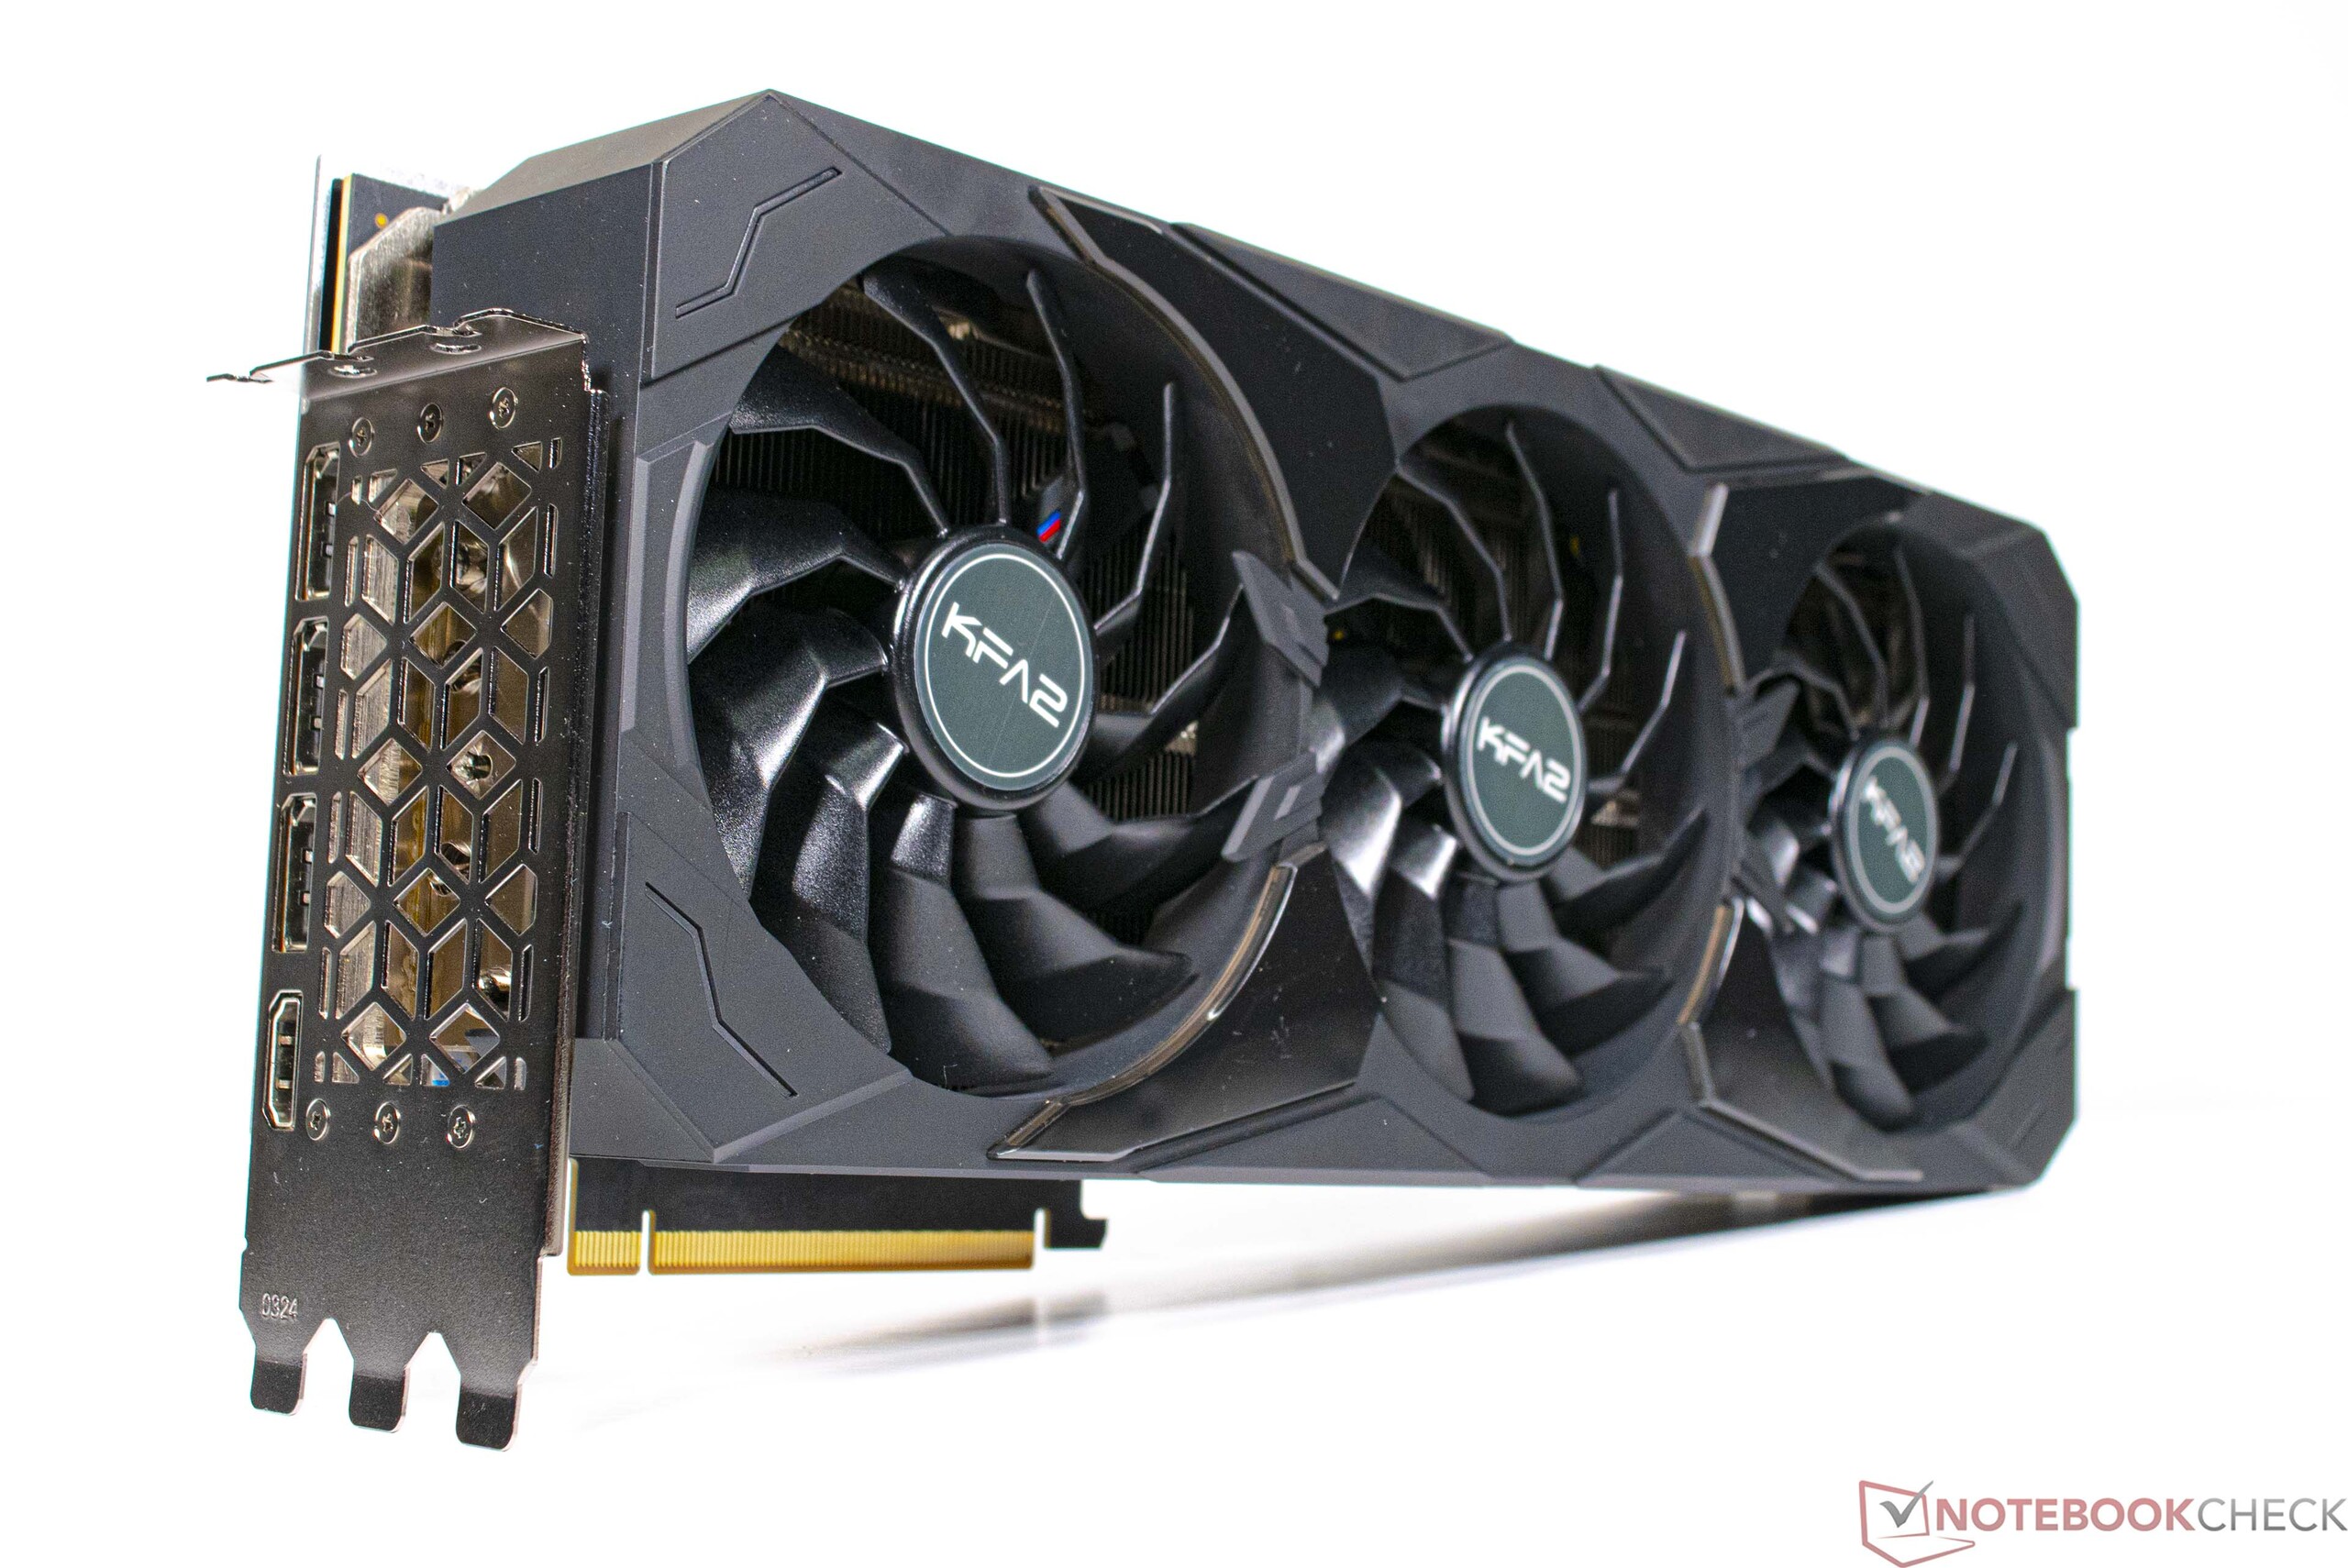
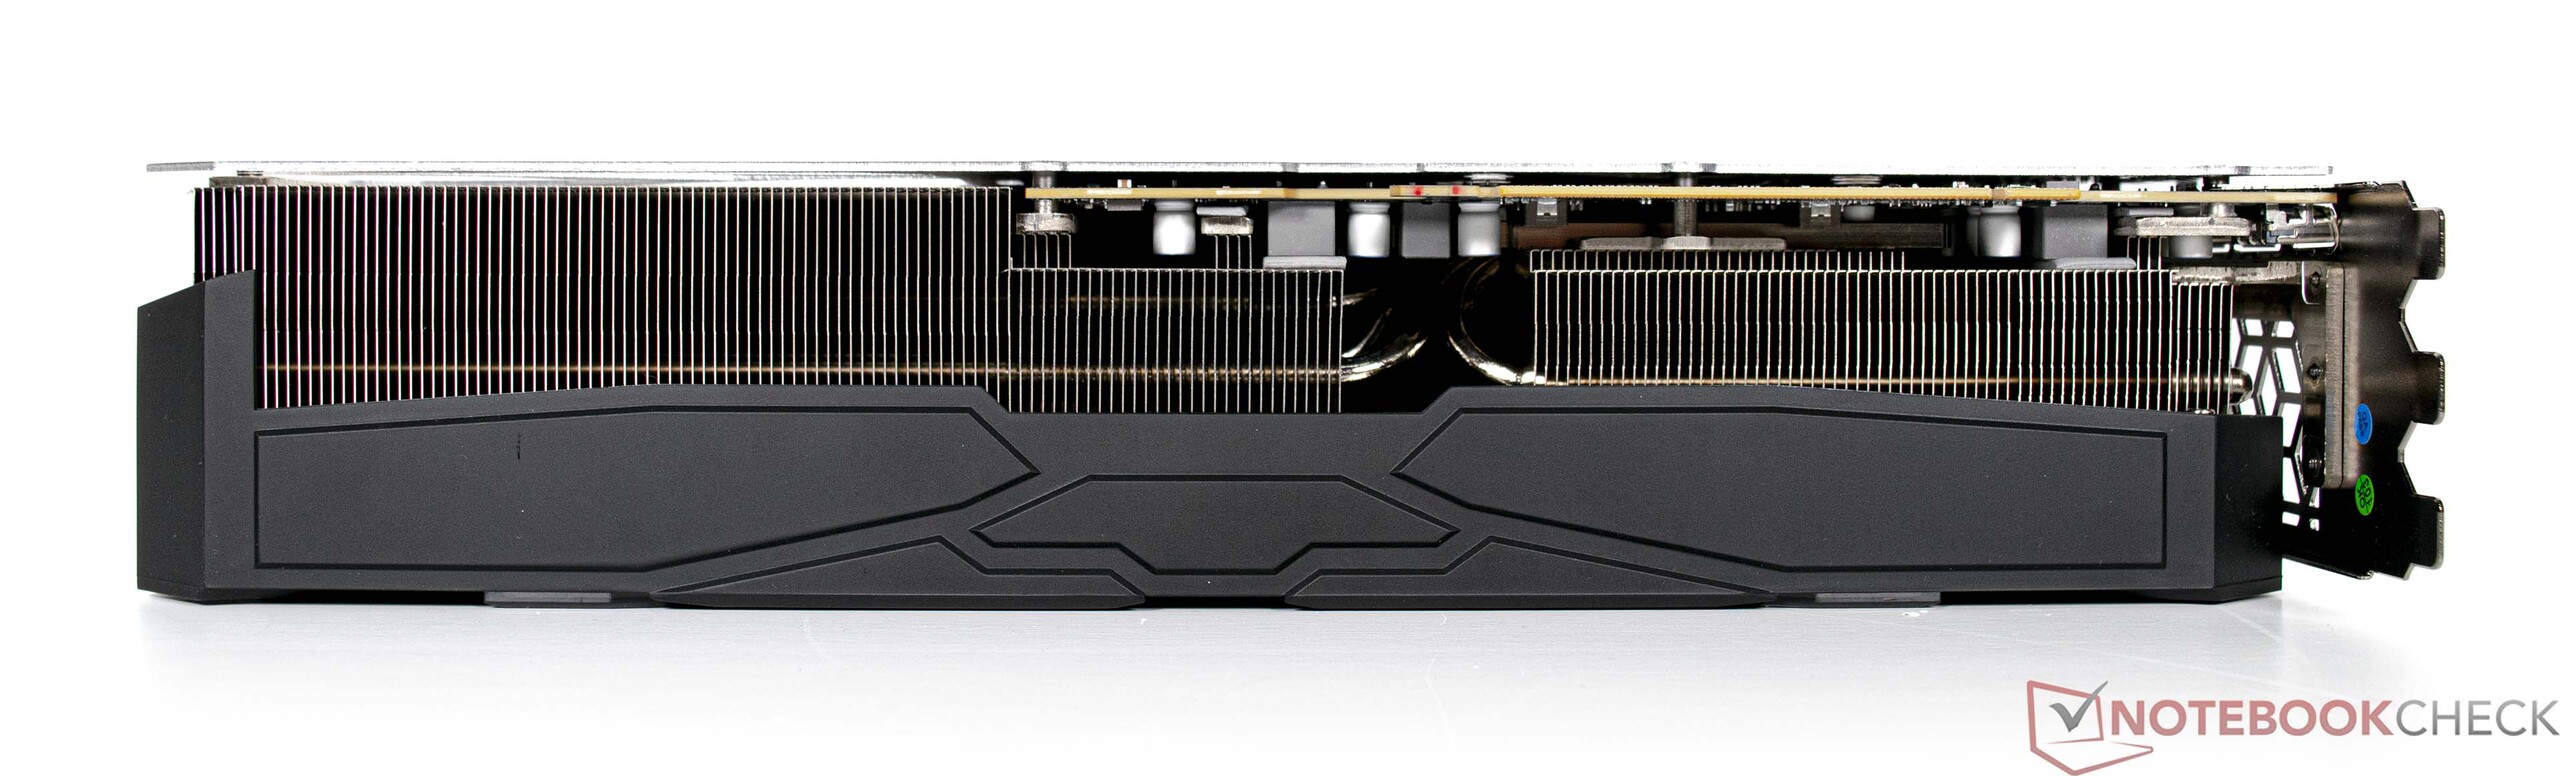
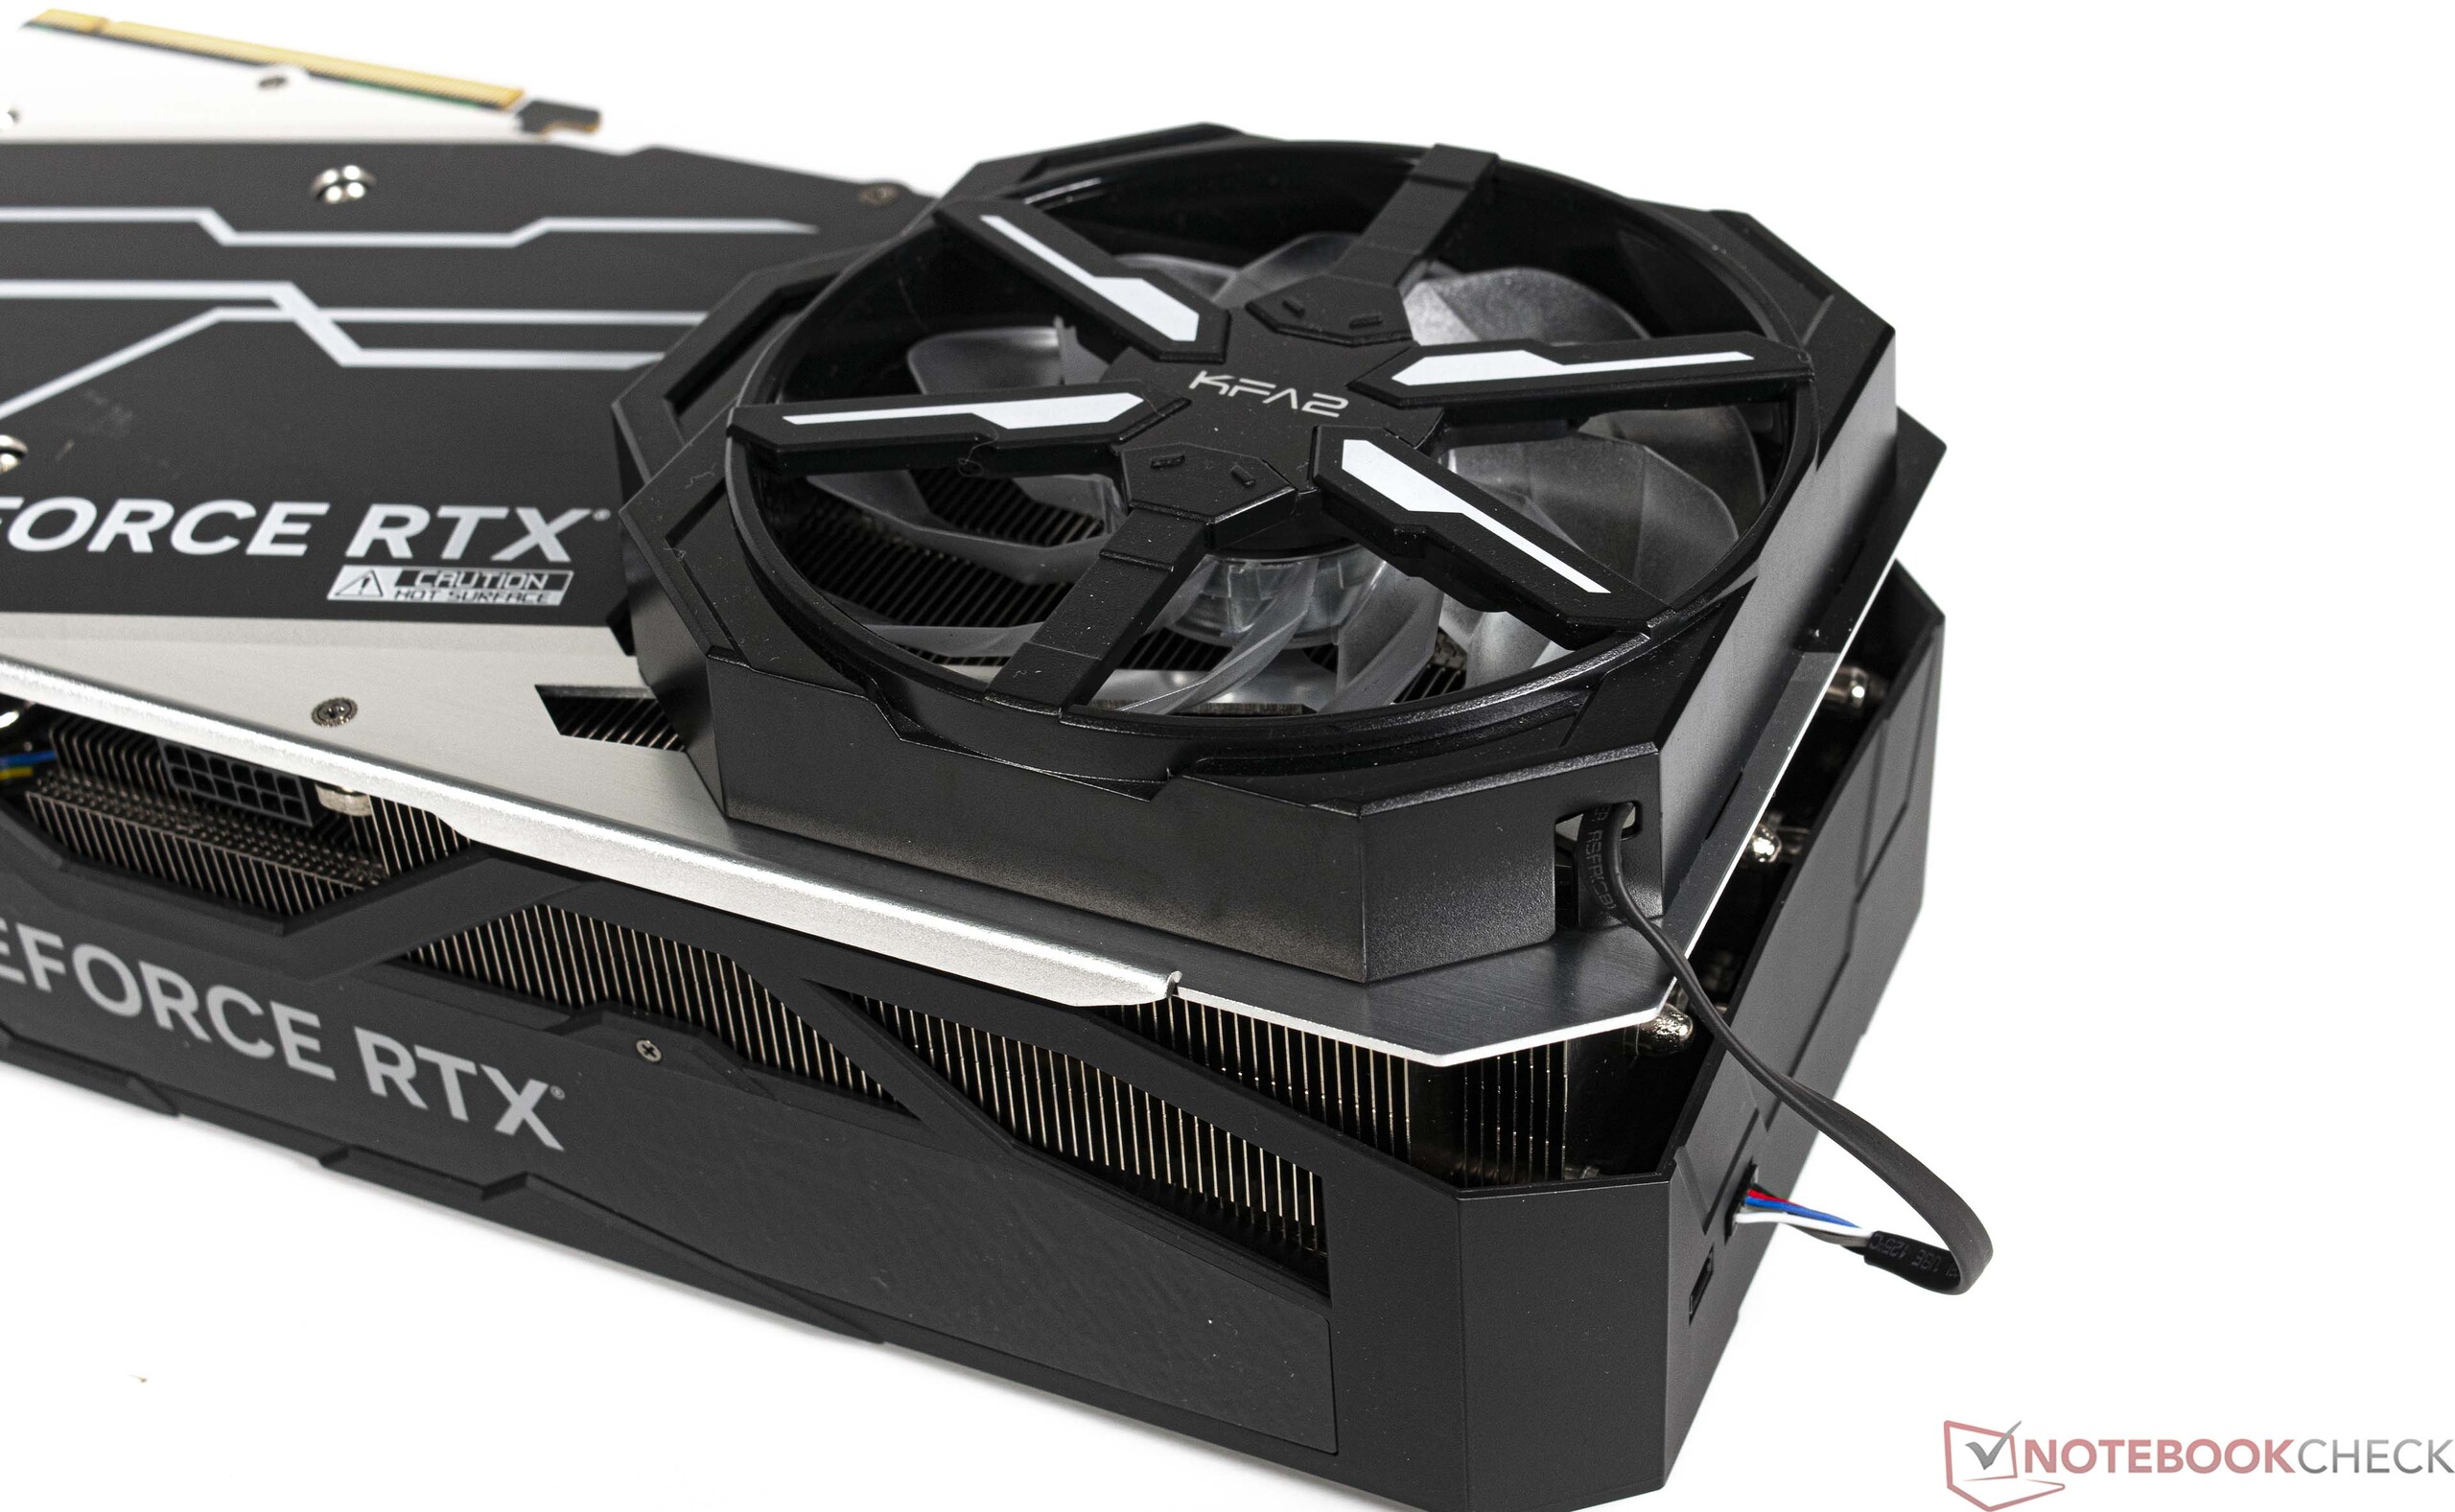
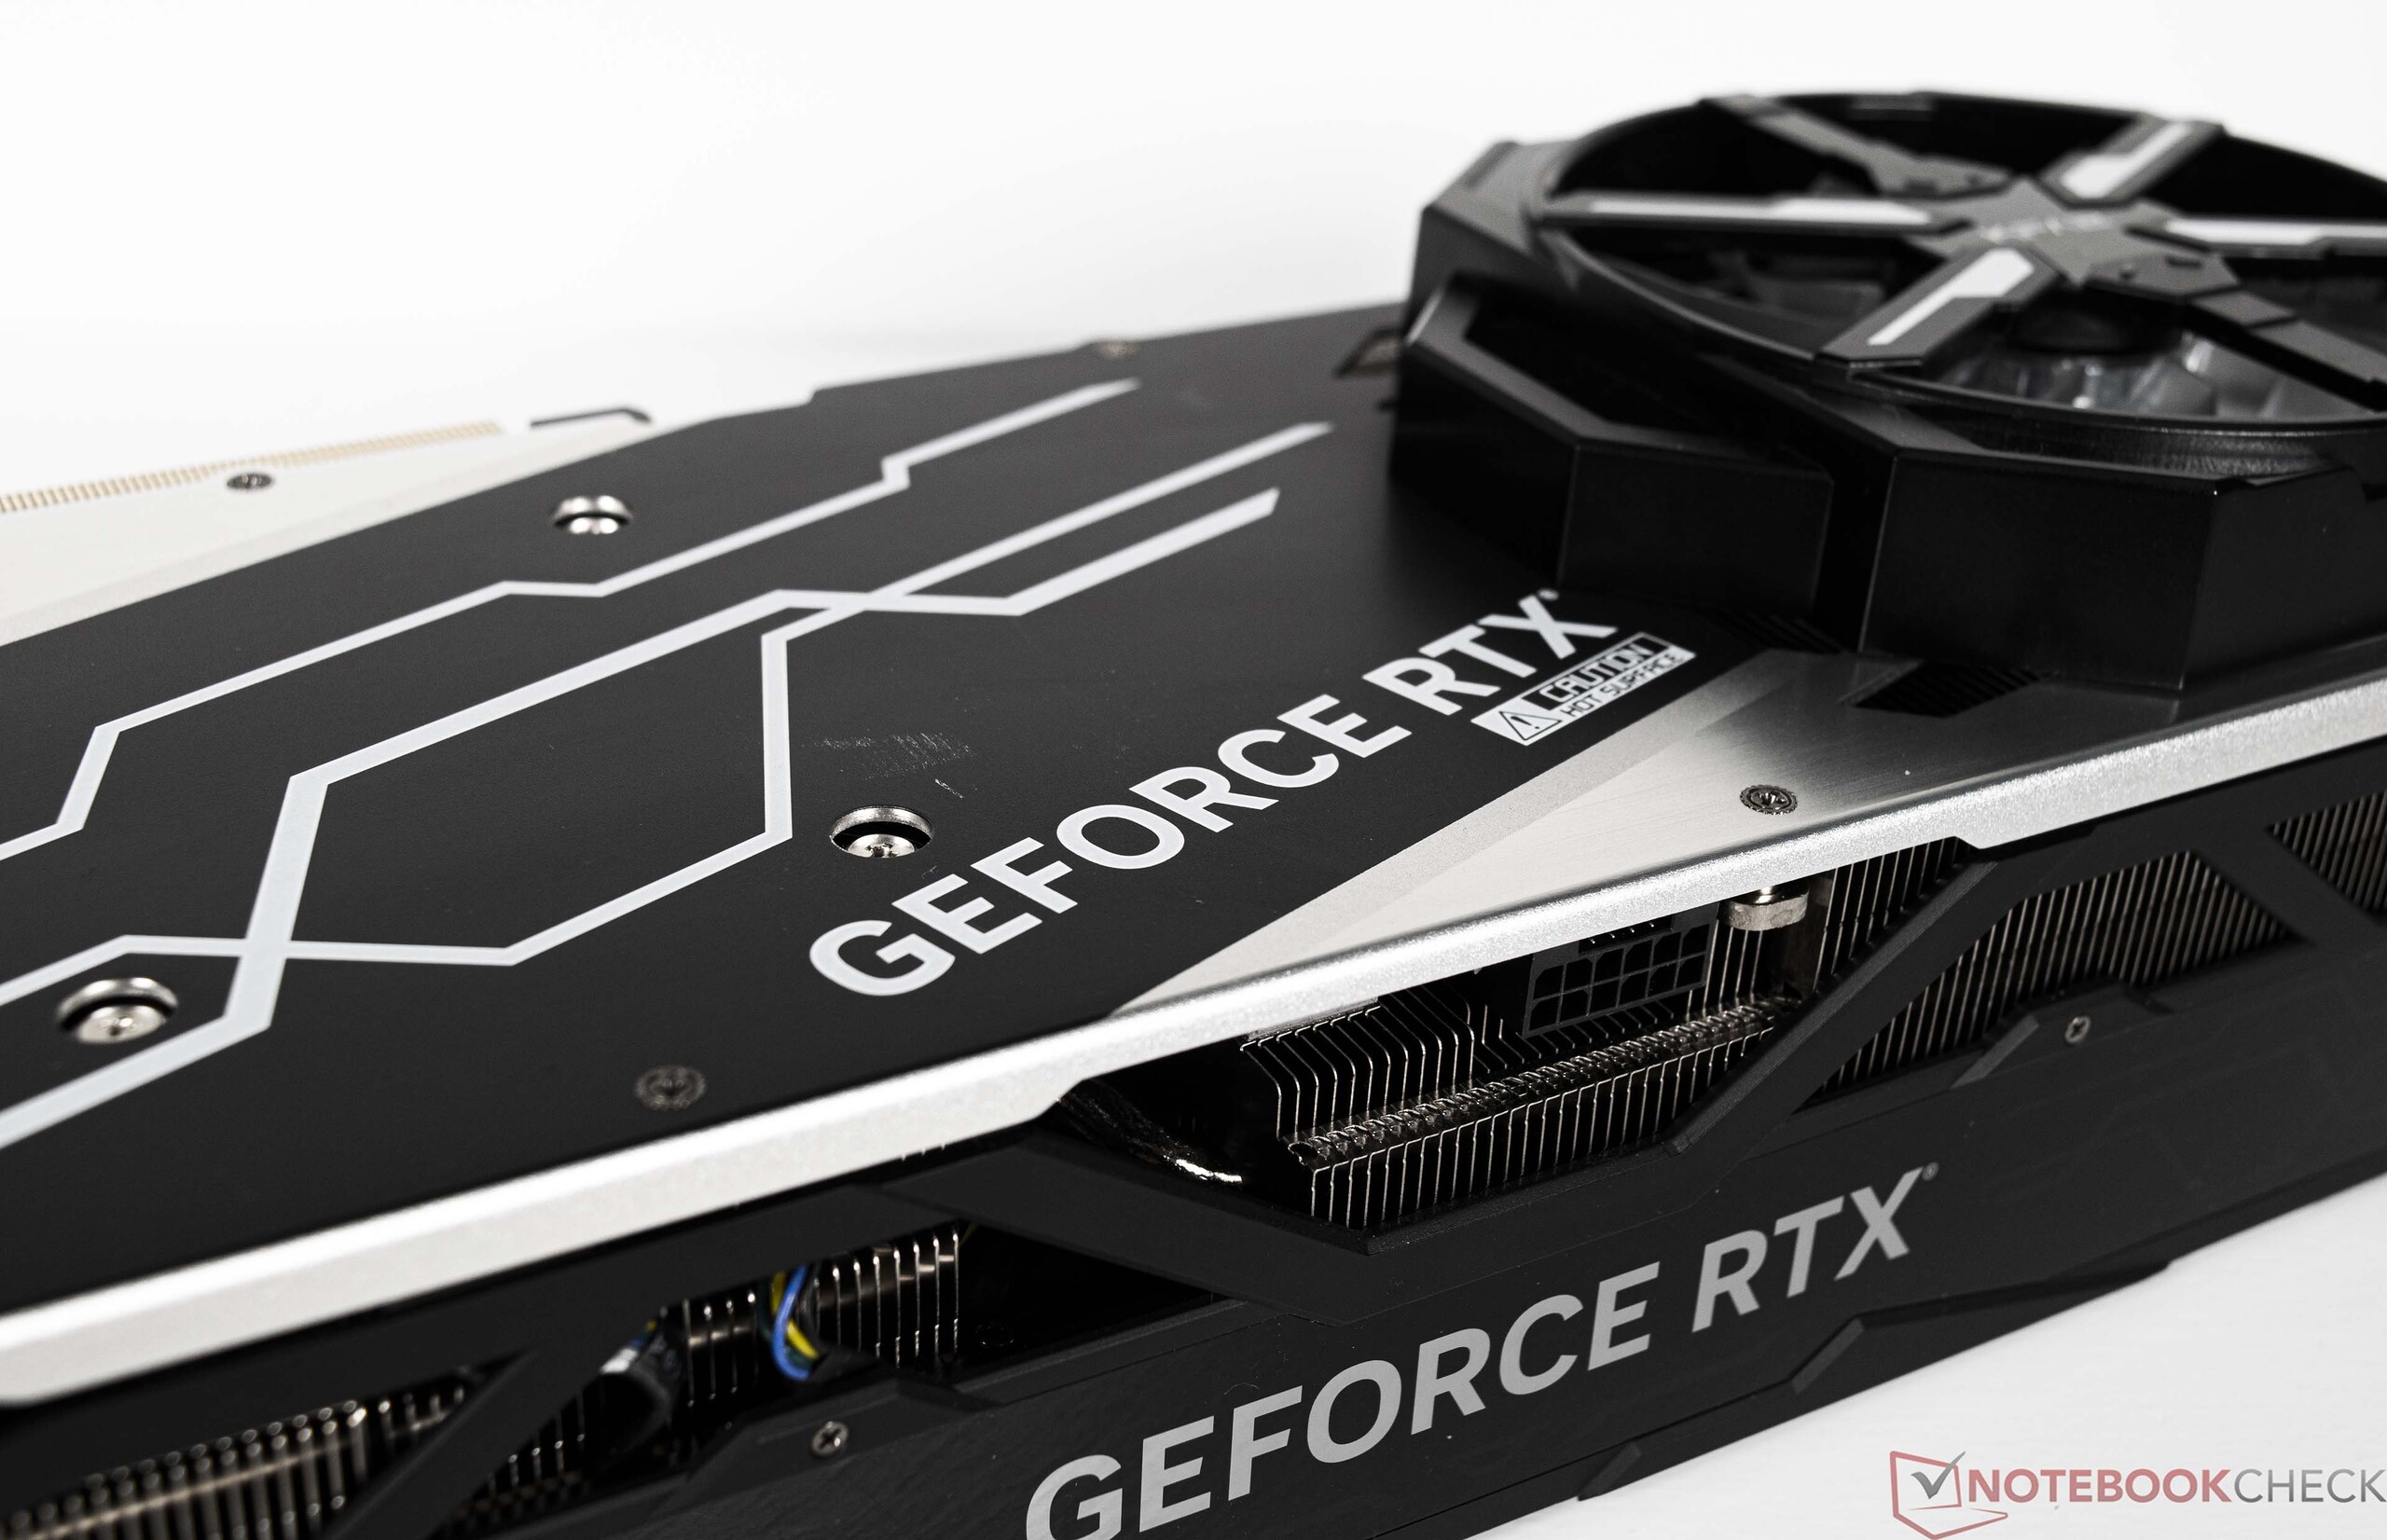
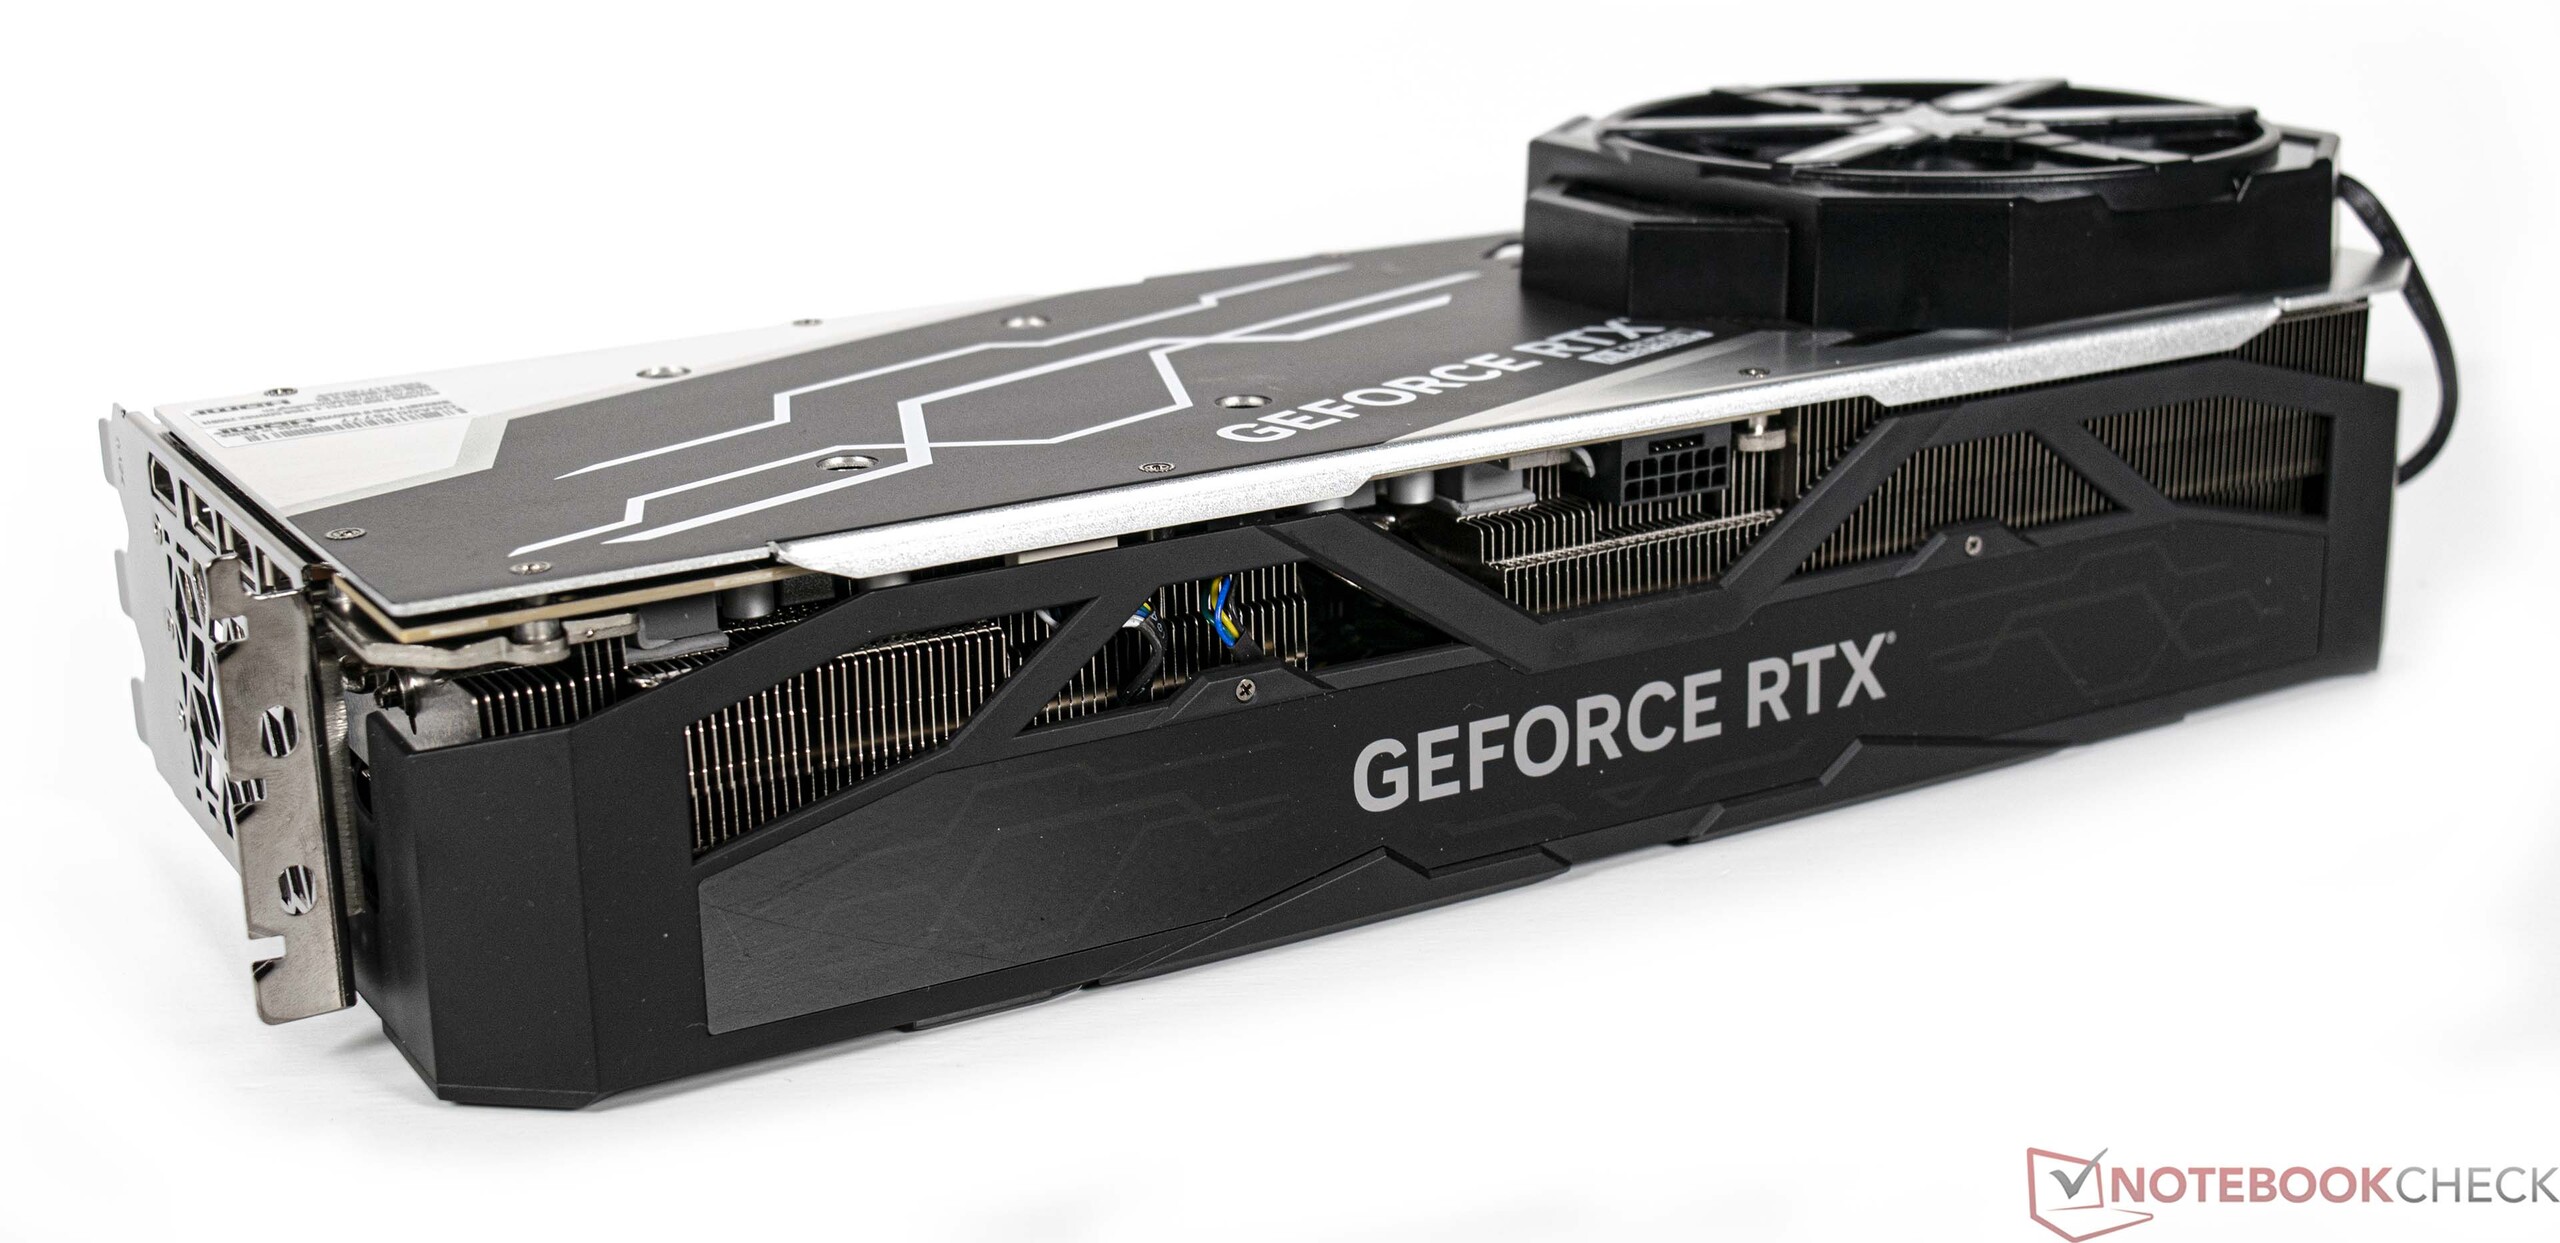
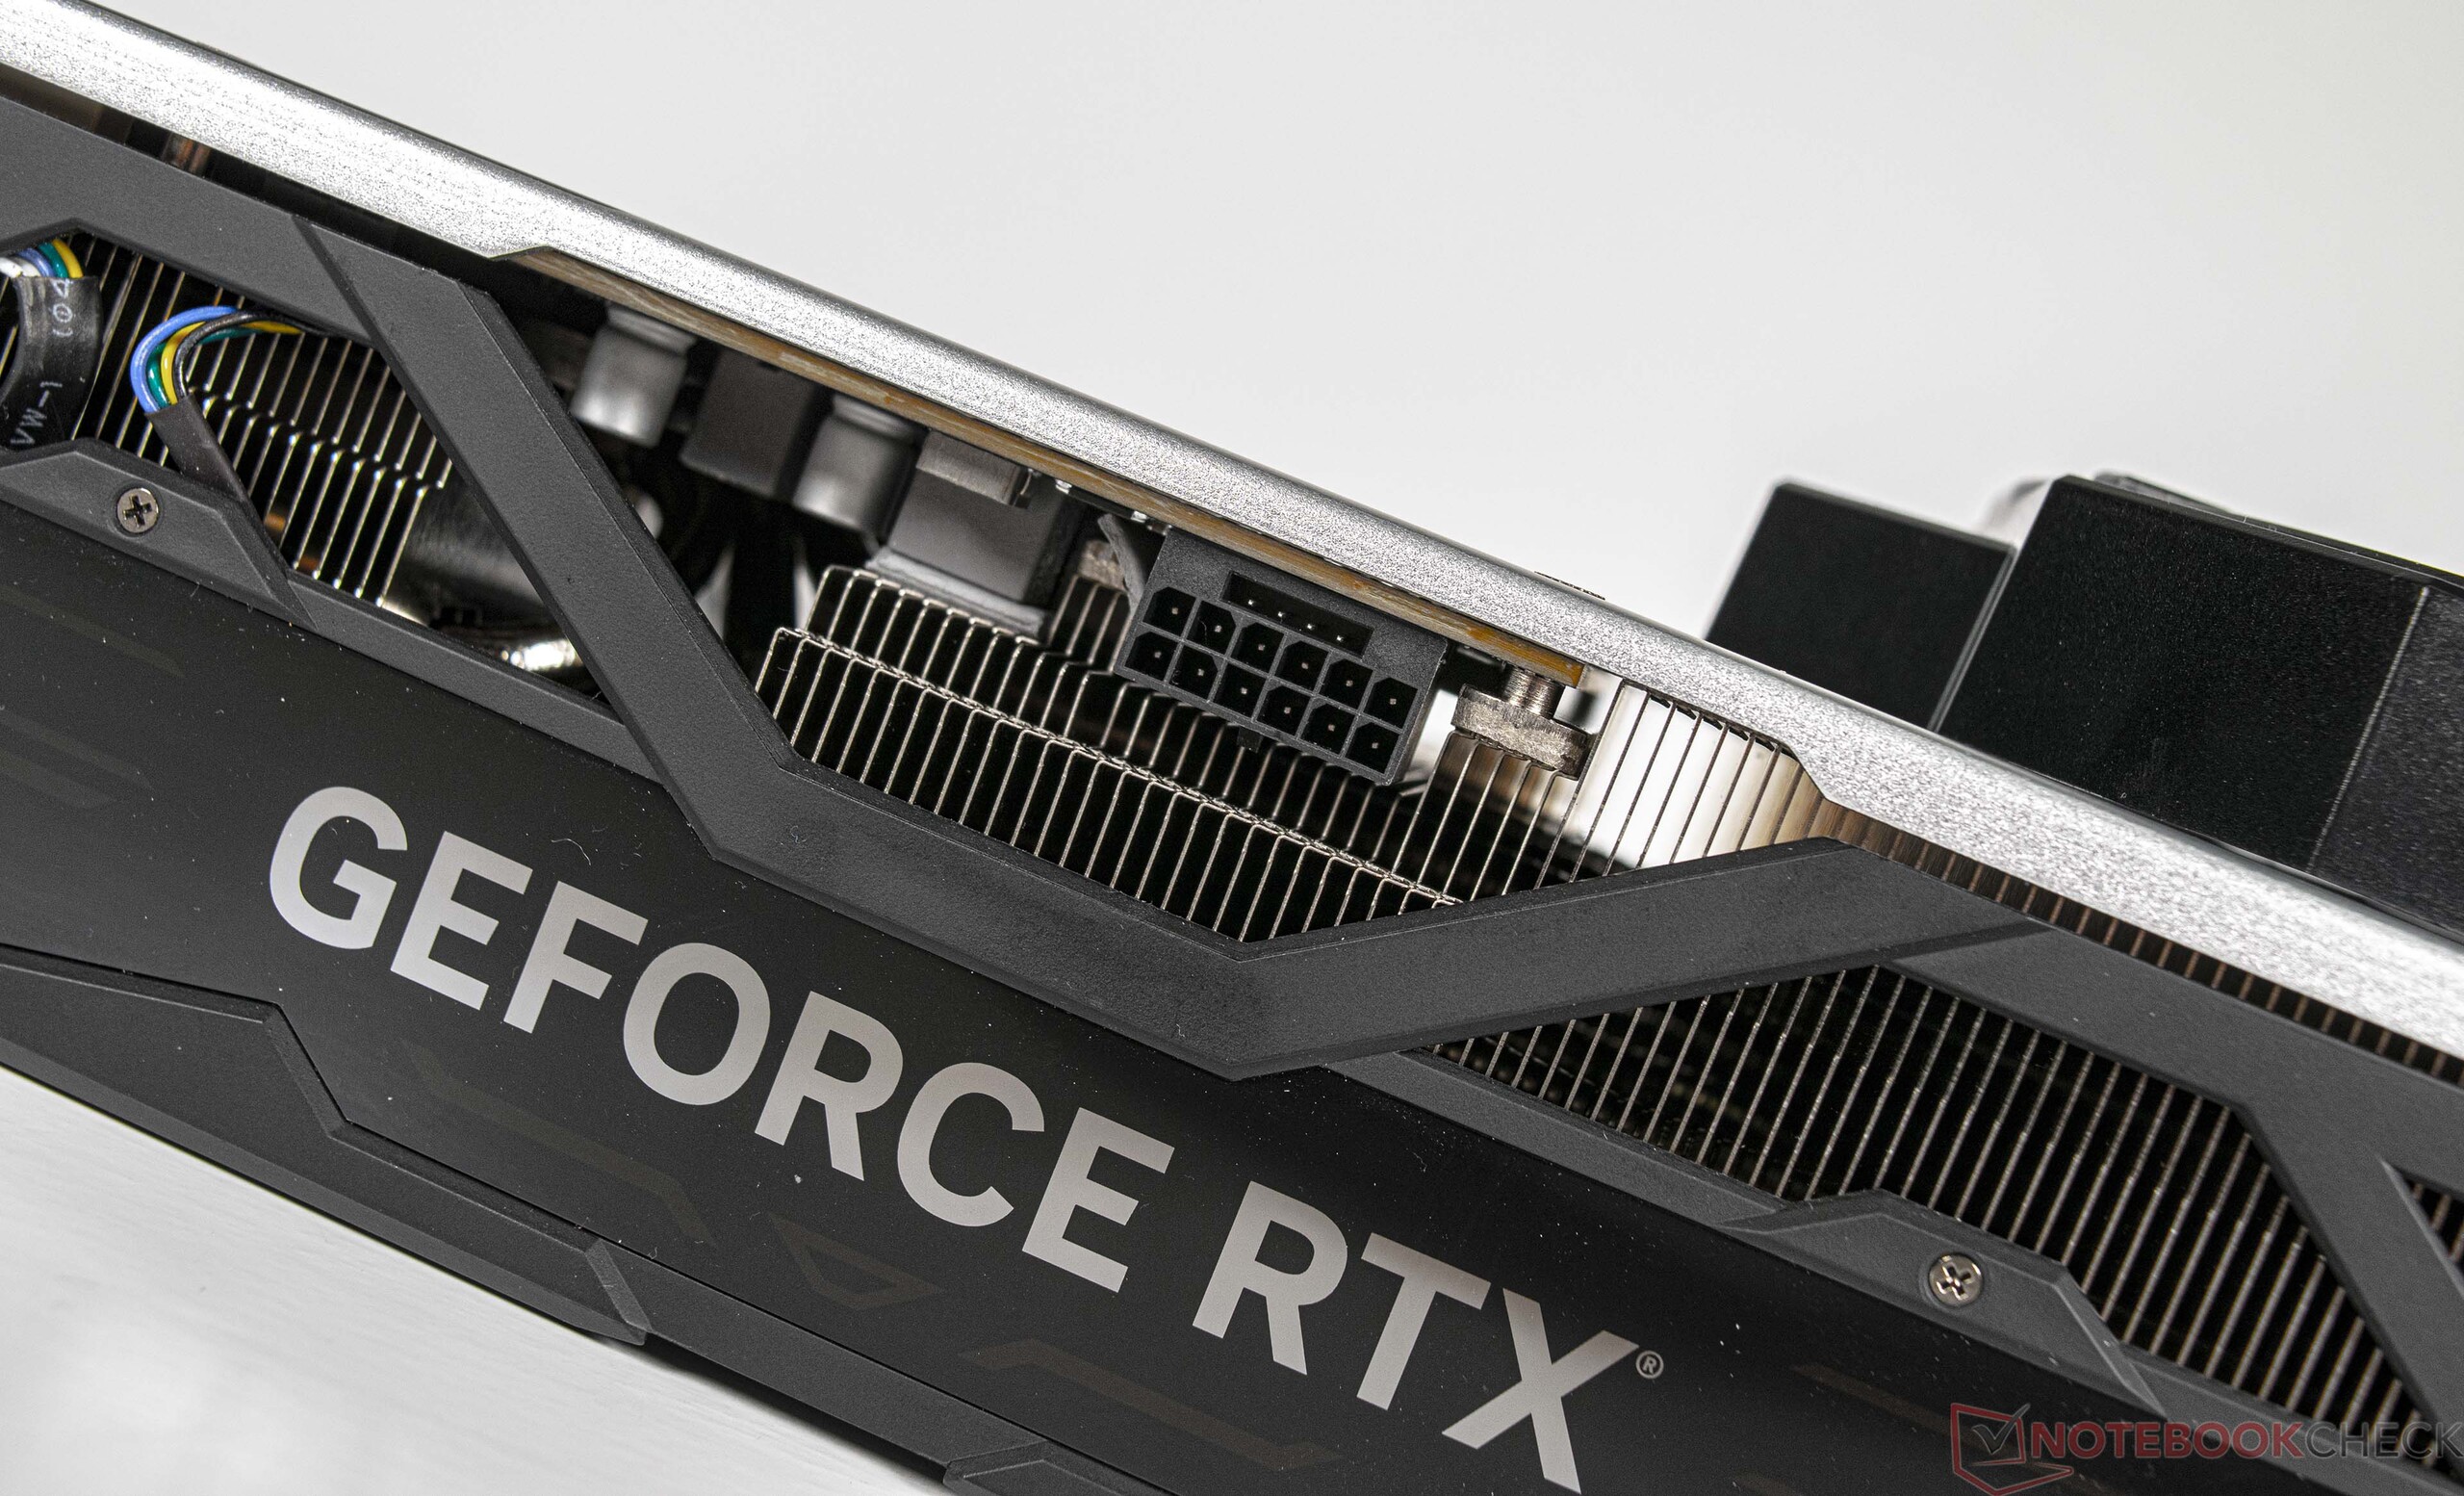
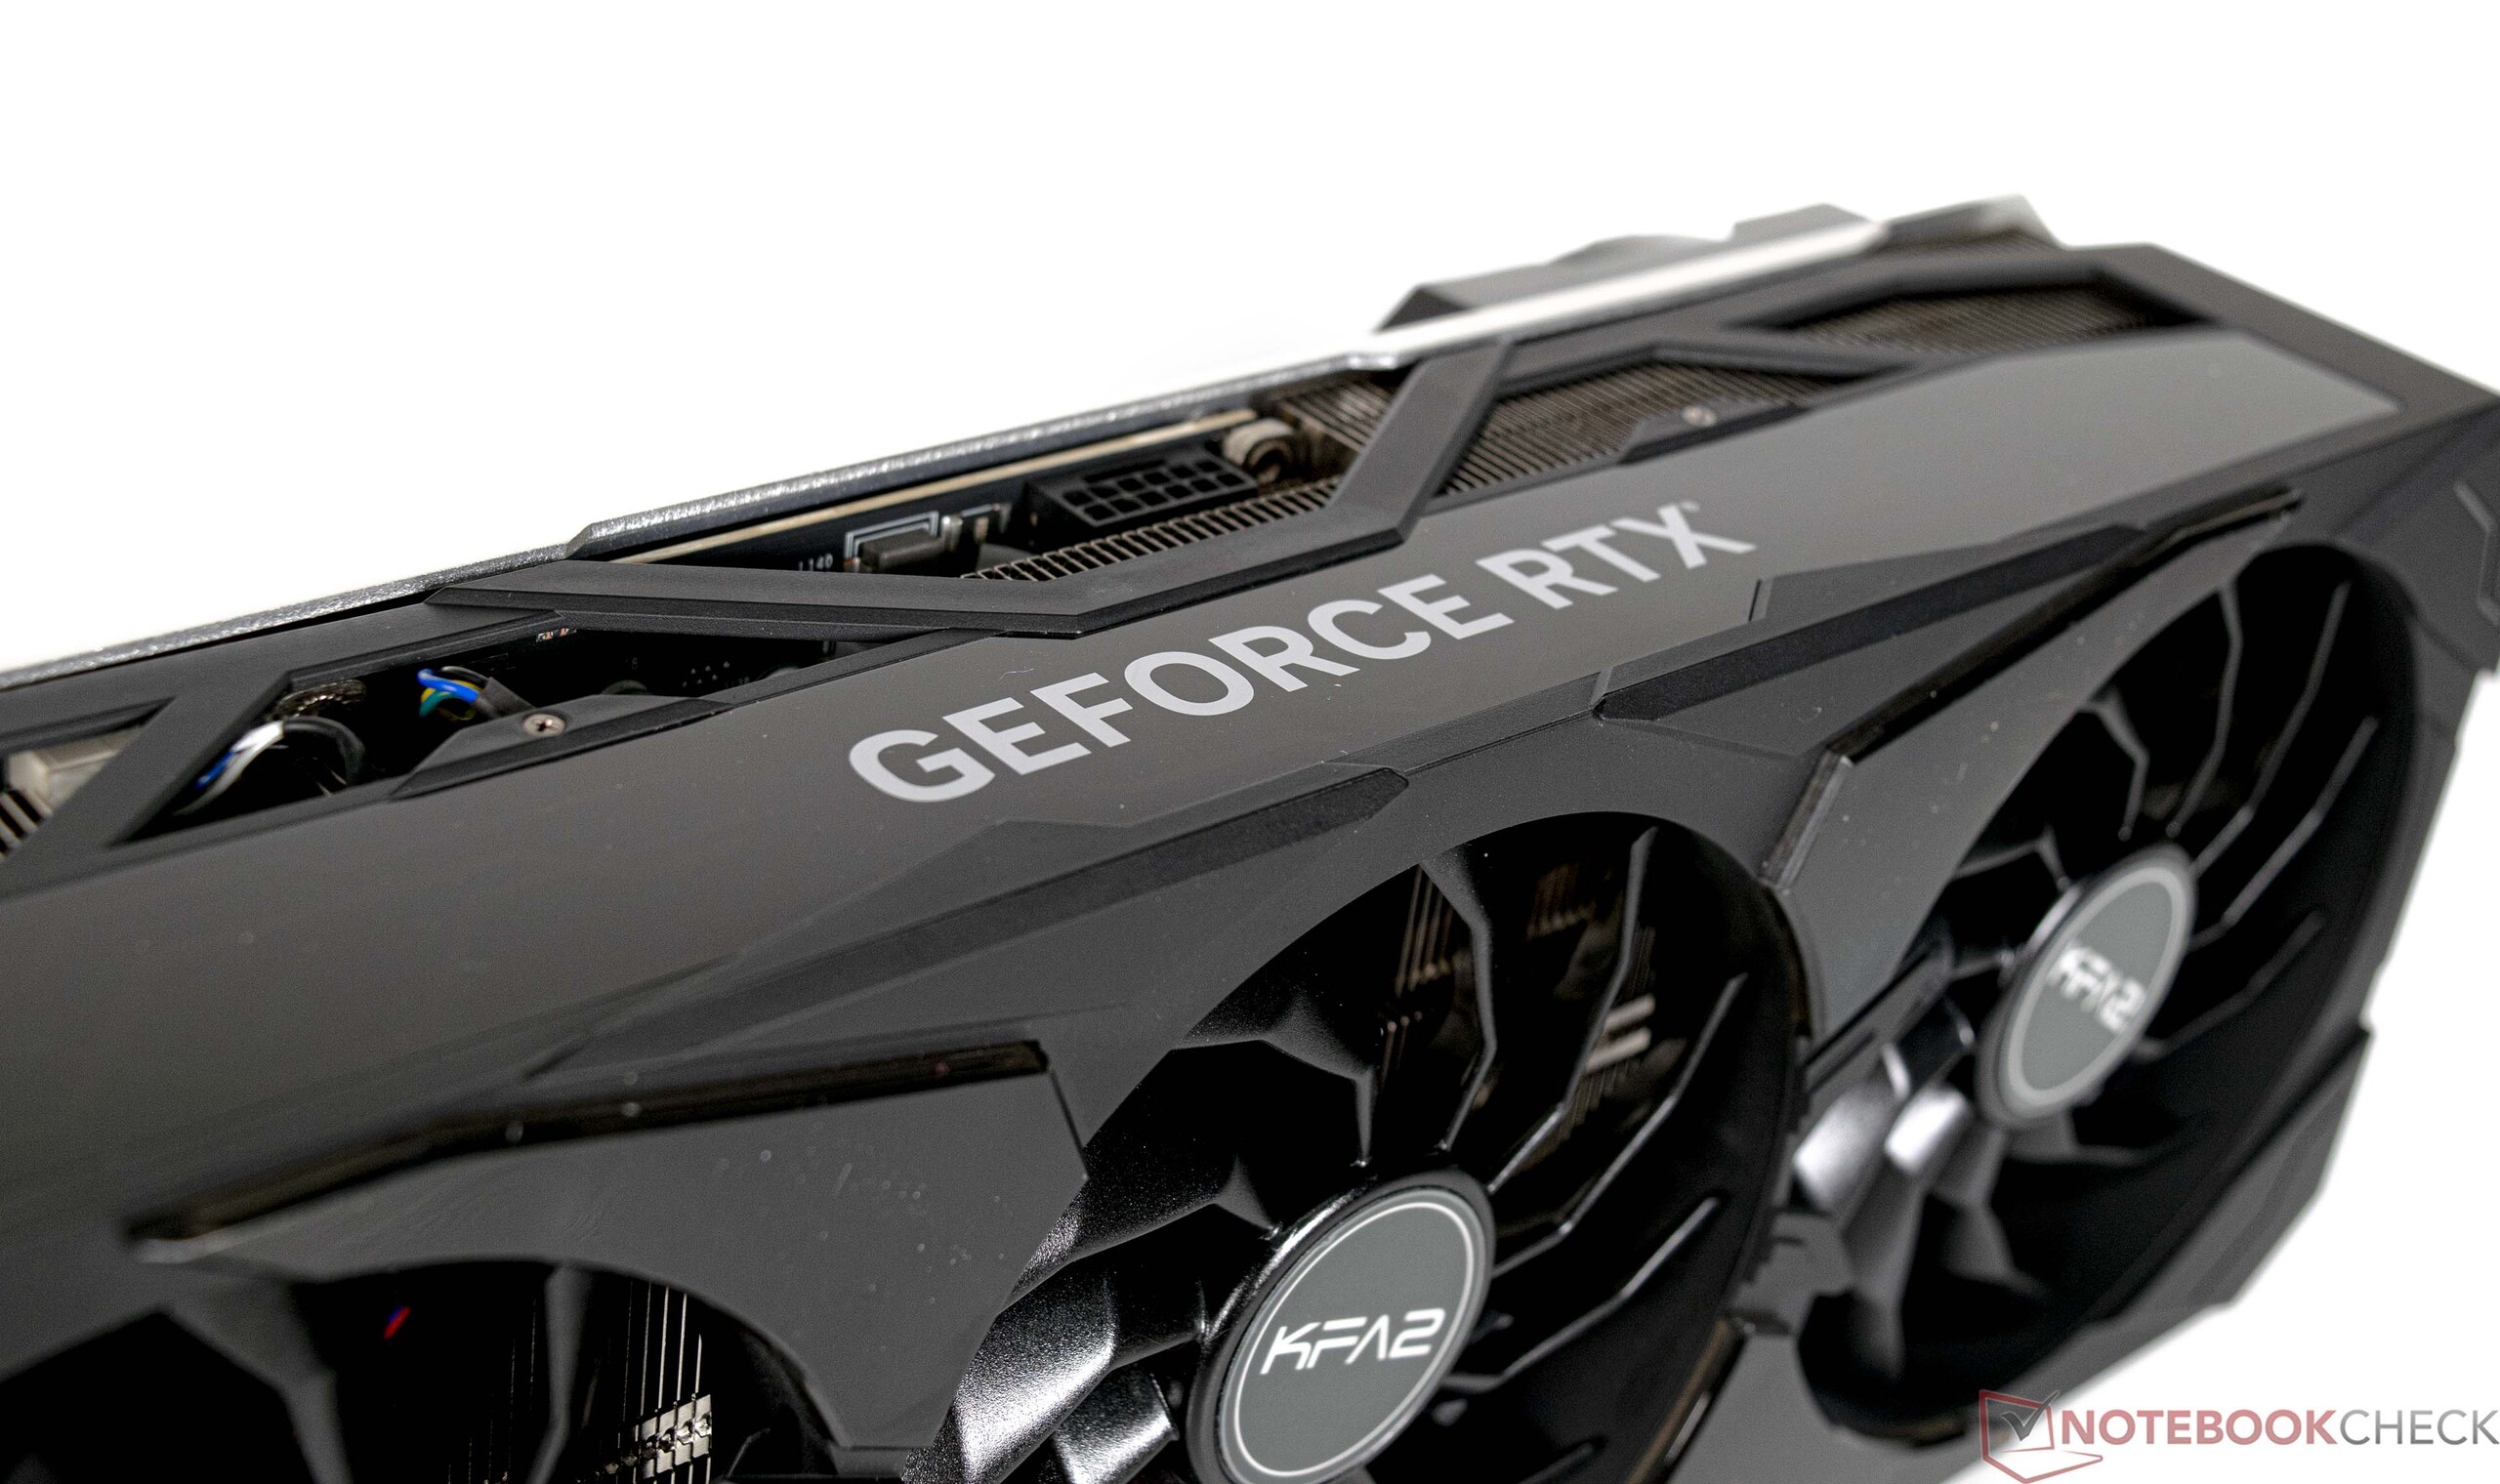
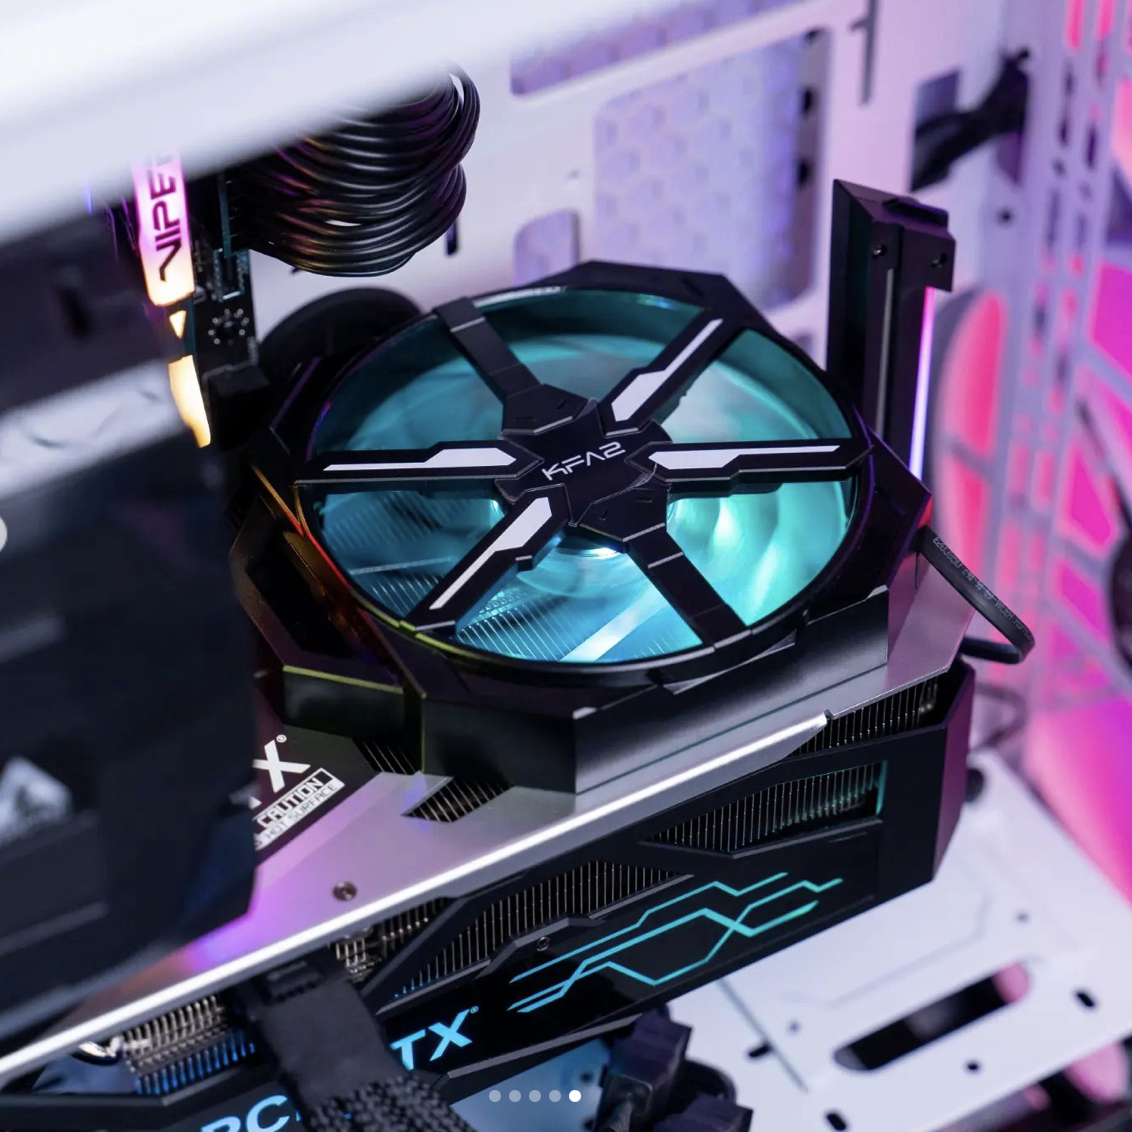
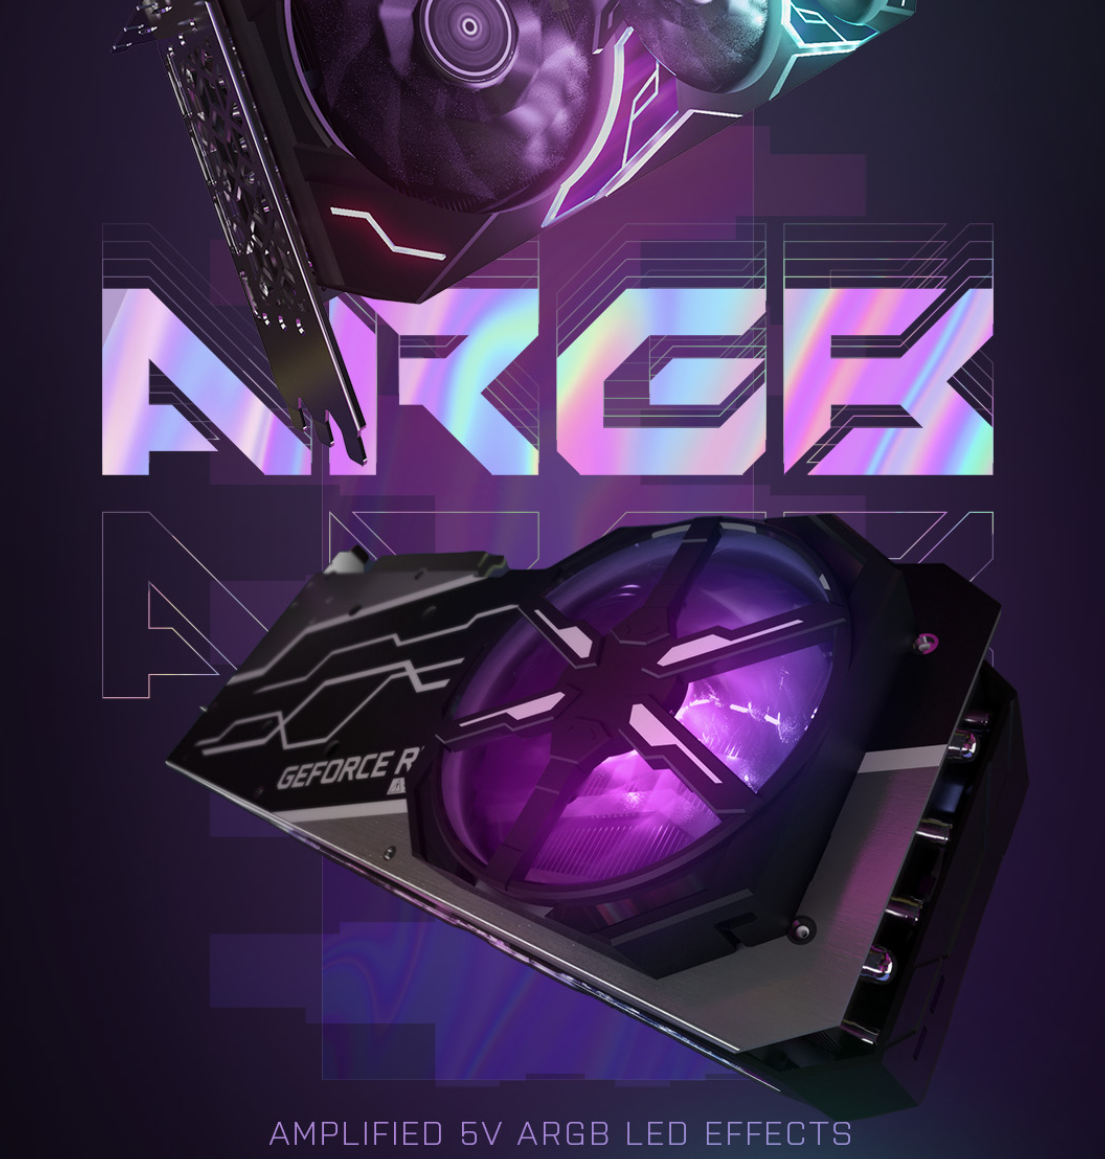
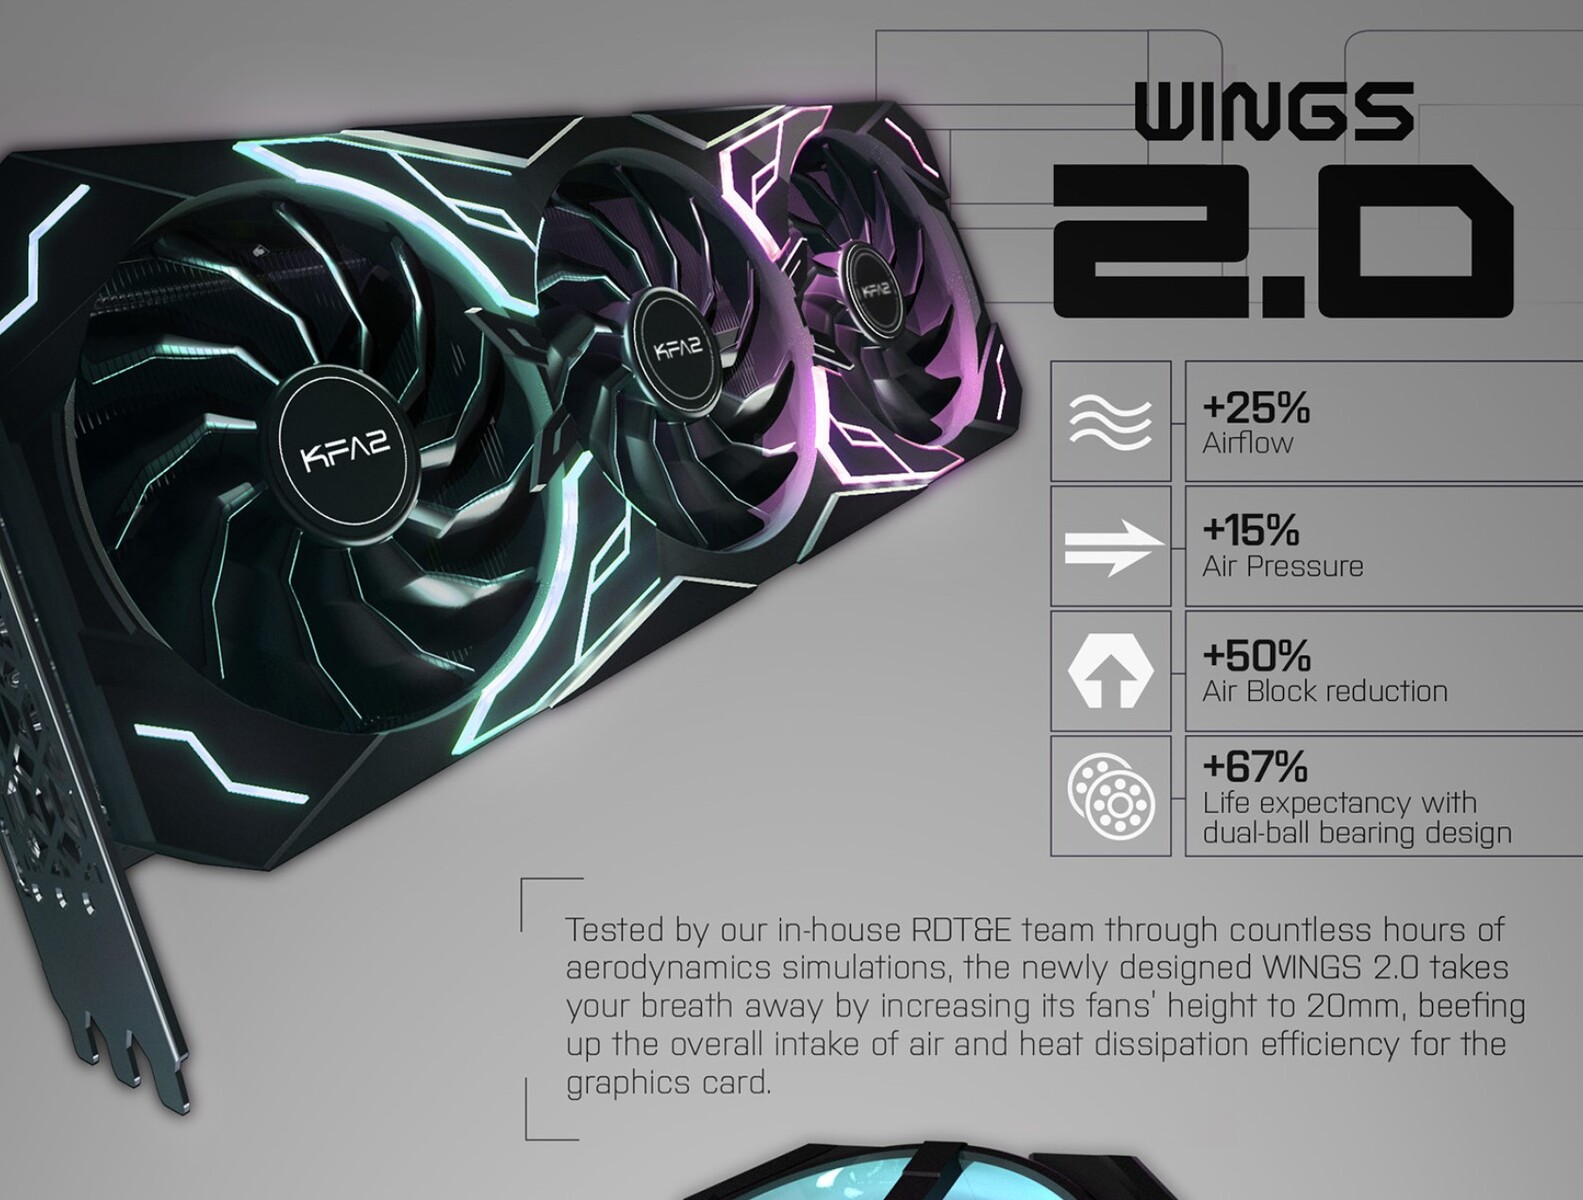
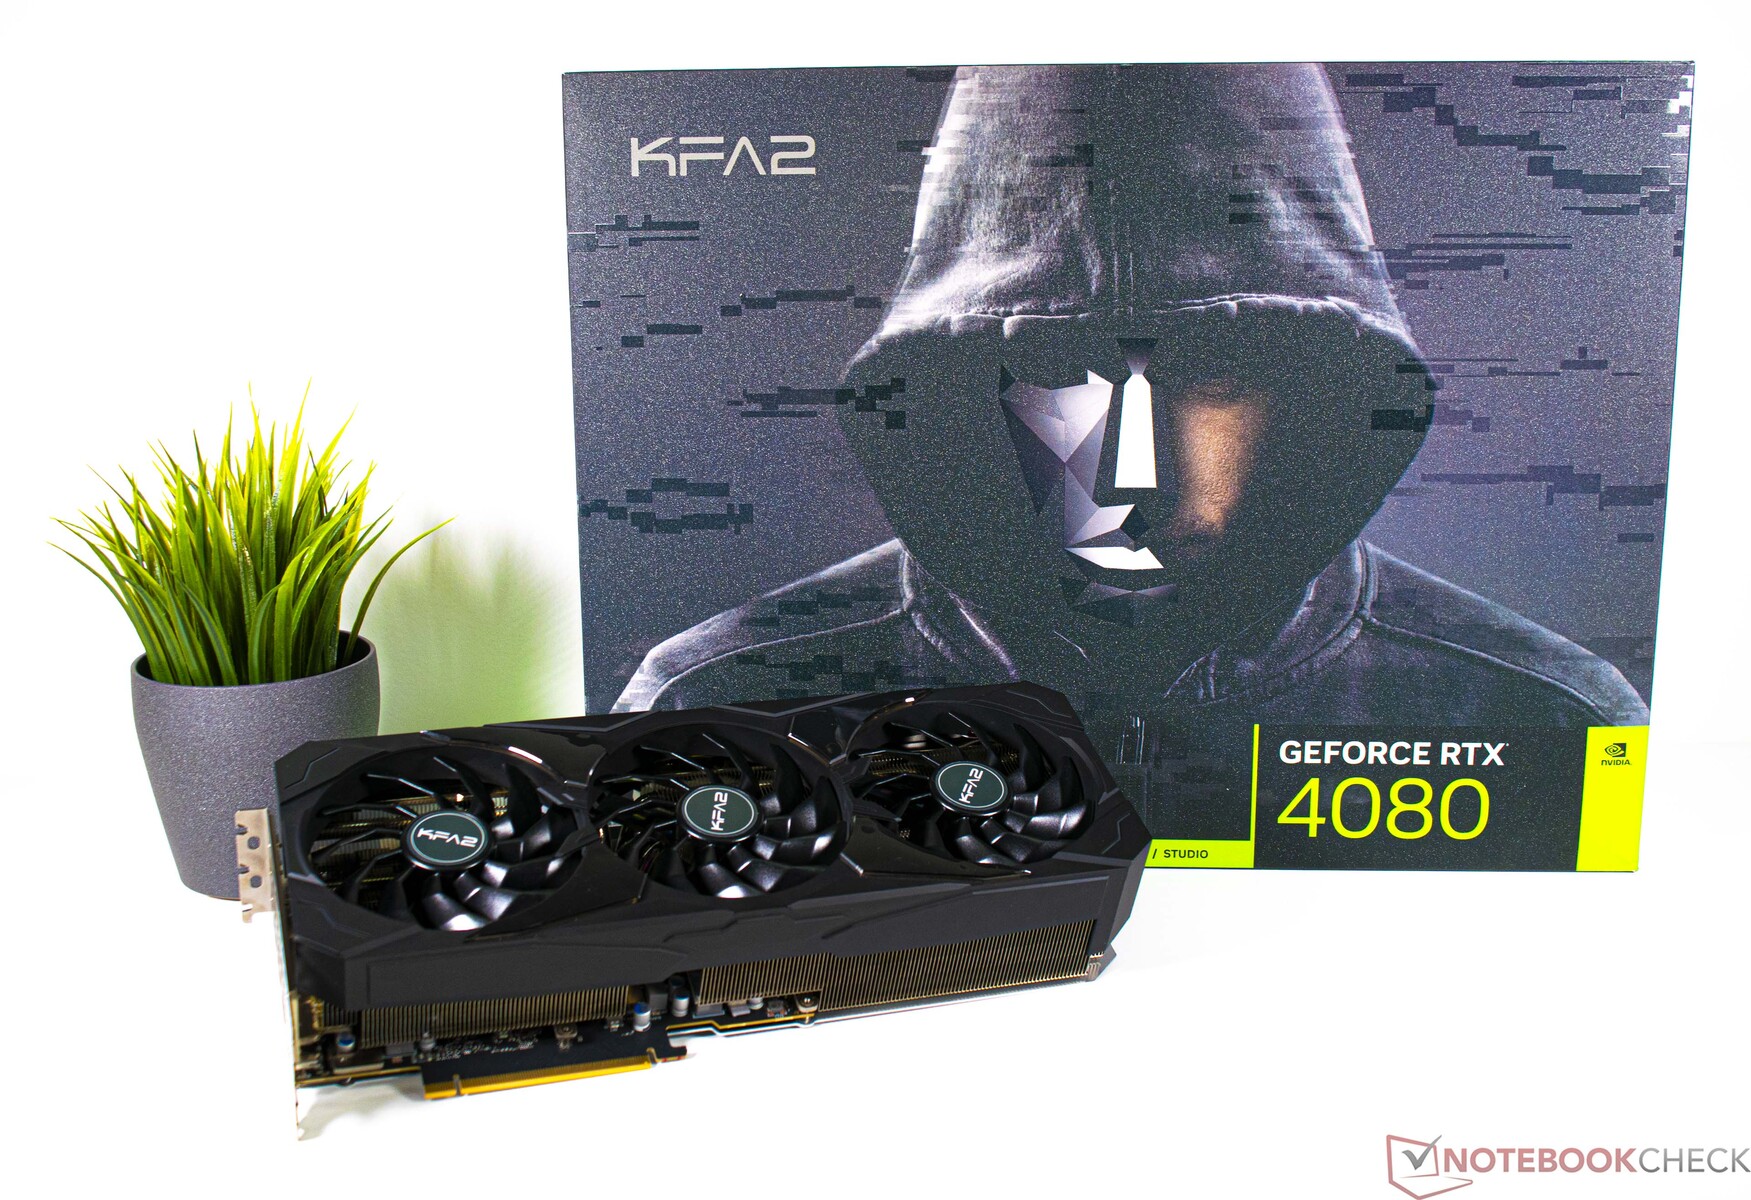
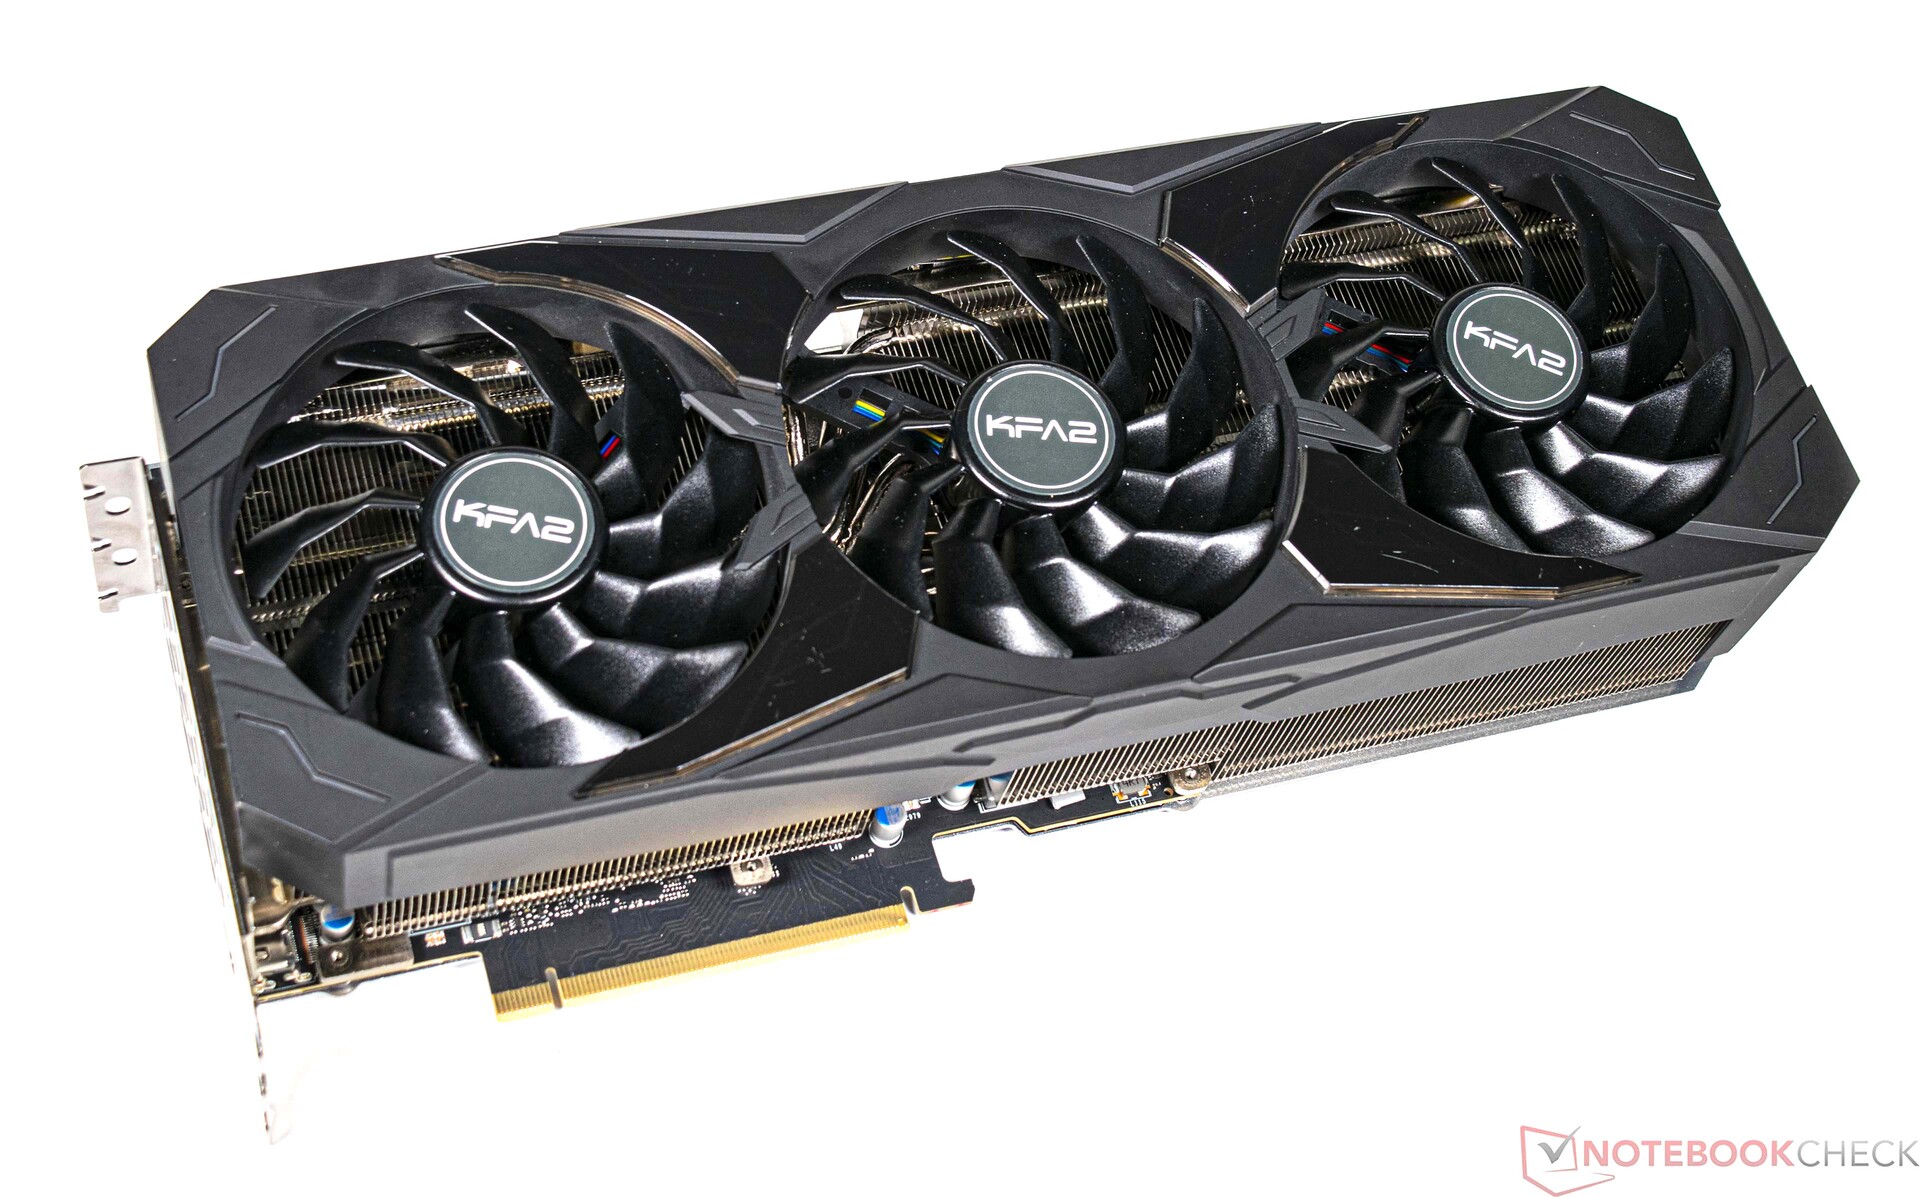
Embora a KFA2 seja freqüentemente um dos fabricantes com os preços mais baixos, a empresa se considera um concorrente de outros fabricantes que oferecem cartões mais caros, como o Asus com sua série Strix e o MSI com seus modelos Suprim-X. Infelizmente, não fomos capazes de comparar os diferentes cartões frente a frente porque ainda não conseguimos colocar nossas mãos em nenhum modelo Asus ou MSI. Entretanto, podemos dizer que a KFA2 GeForce RTX 4080 SG tem o mesmo nível de acabamento que a KFA2 GeForce RTX 4090 SG. Apesar de ter uma potência nominal muito inferior ao modelo superior, o KFA2 GeForce RTX 4080 SG é equipado com um enorme resfriador de quatro ranhuras. Há também uma tonelada de iluminação RGB que chama a atenção para o cartão. Como em todos os modelos atuais da Série RTX 40, o RTX 4080 é alimentado através do novo conector de 12VHPWR. O KFA2 não fez nada diferente aqui e incluiu um adaptador PCIe de 3x6+2 pinos adequado para 12VHPWR.
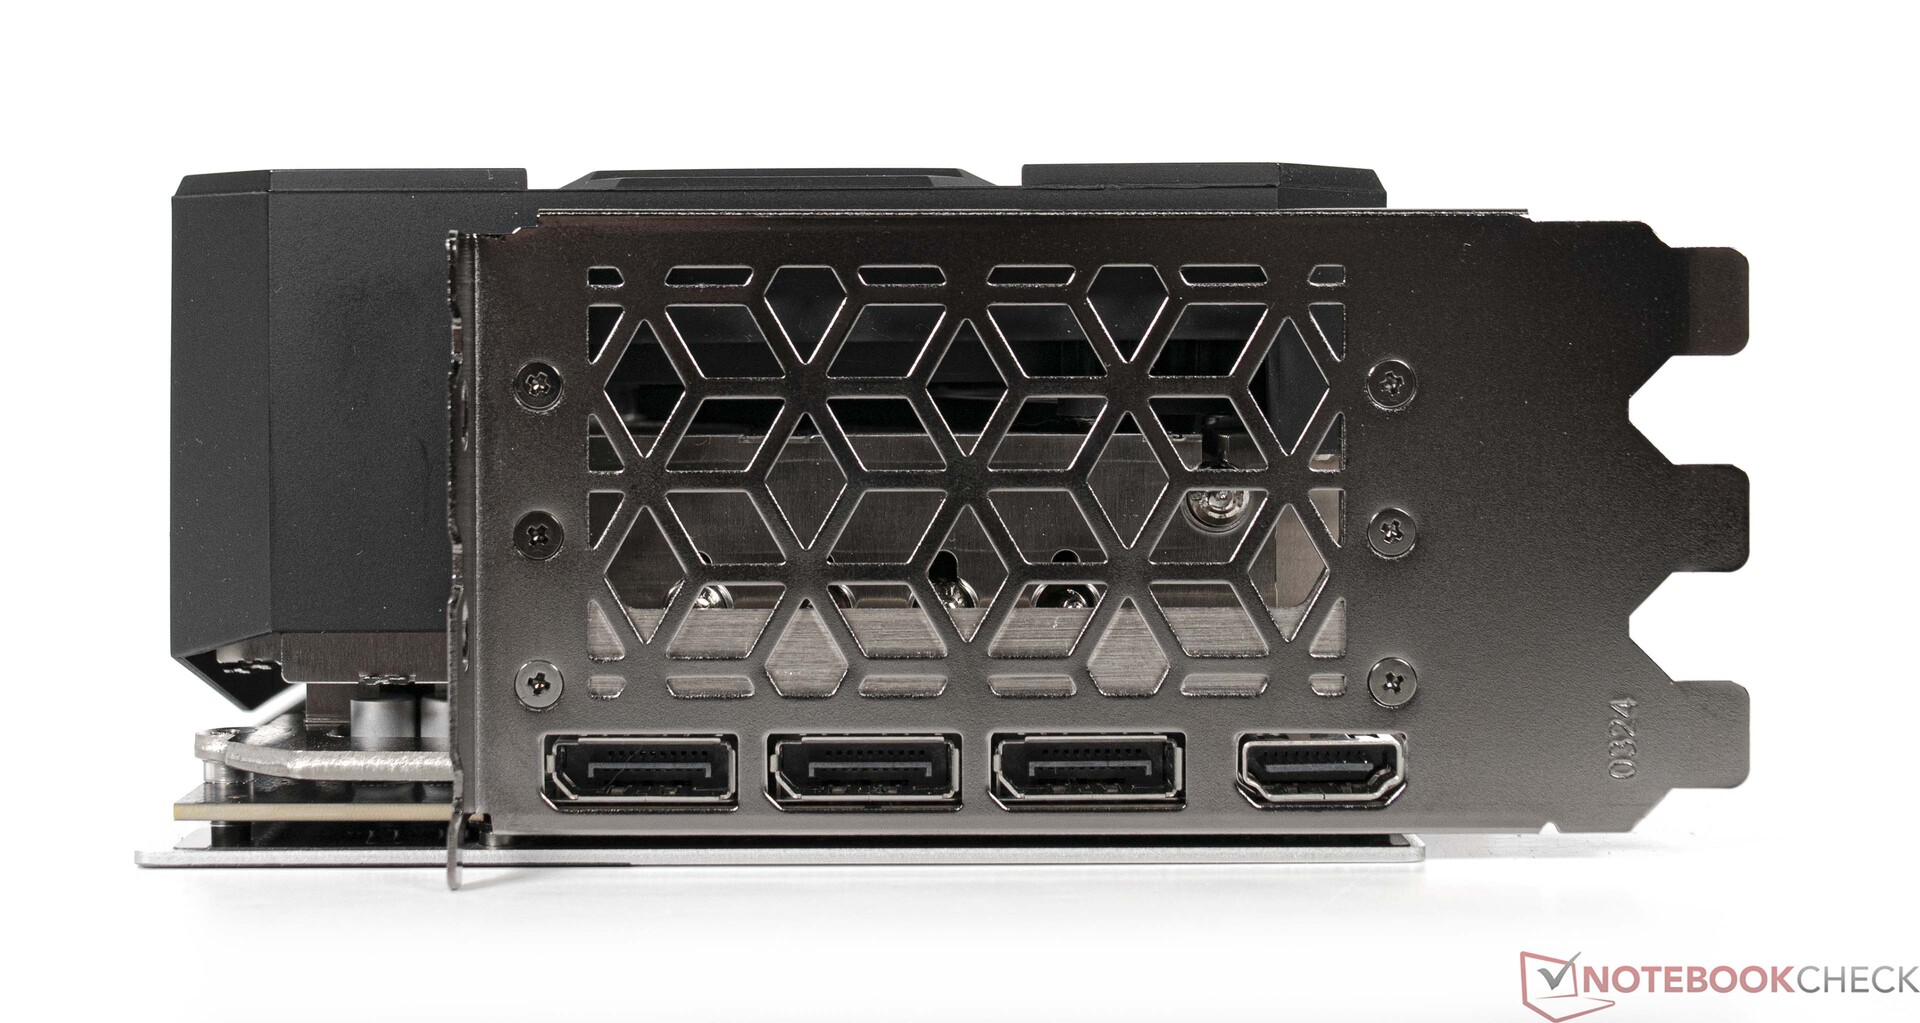
No exterior, o KFA2 GeForce RTX 4080 SG possui 1x porta HDMI 2.1a e 3x DisplayPort 1.4a.


Comparação das especificações da GPU
| Especificação | RTX 4090 (FE) | RTX 4080 | KFA2 RTX 4080 | RTX 3090 Ti | RTX 3090 (FE) | RTX 3080 Ti (FE) | RTX 3080 (FE) | RTX Titan RTX |
| Chip | AD102 | AD103 | AD103 | GA102 | GA102 | GA102 | GA102 | TU102 |
| Processo FinFET | 4 nm | 4 nm | 4 nm | 8 nm | 8 nm | 8 nm | 8 nm | 12 nm |
| Núcleos CUDA | 16.384 | 9.728 | 9.728 | 10.752 | 10.496 | 10.240 | 8.704 | 4.608 |
| Unidades de textura | 512 | 304 | 304 | 336 | 328 | 320 | 272 | 288 |
| Núcleos sensores | 512 4. Gen. | 304 4. Gen. | 304 4. Gen. | 336 3. Gen. | 328 3. Gen. | 320 3. Gen. | 272 3. Gen. | 576 2. Gen. |
| Núcleos RT | 128 | 76 | 76 | 84 | 82 | 80 | 68 | 72 |
| Relógio base GPU | 2.235 MHz | 2.205 MHz | 2.205 MHz | 1.560 MHz | 1.395 MHz | 1.365 MHz | 1.440 MHz | 1.350 MHz |
| Relógio de impulso GPU | 2.520 MHz | 2.505 MHz | 2.565 MHz | 1.860 MHz | 1.695 MHz | 1.665 MHz | 1.710 MHz | 1.770 MHz |
| Bus de memória | 384 bit | 256 bit | 256 bit | 384 bit | 384 bit | 384 bit | 320 bit | 384 bit |
| Largura de banda de memória | 1.008 GB/s | 716,8 GB/s | 716,8 GB/s | 1.008 GB/s | 936 GB/s | 912,4 GB/s | 760 GB/s | 672 GB/s |
| Memória de vídeo | 24 GB GDDR6X | 16 GB GDDR6X | 16 GB GDDR6X | 24 GB GDDR6X | 24 GB GDDR6X | 12 GB GDDR6X | 10 GB GDDR6X | 24 GB GDDR6 |
| Consumo de energia | 450 W | 320 W | 320 W | 450 W | 350 W | 350 W | 320 W | 280 W |
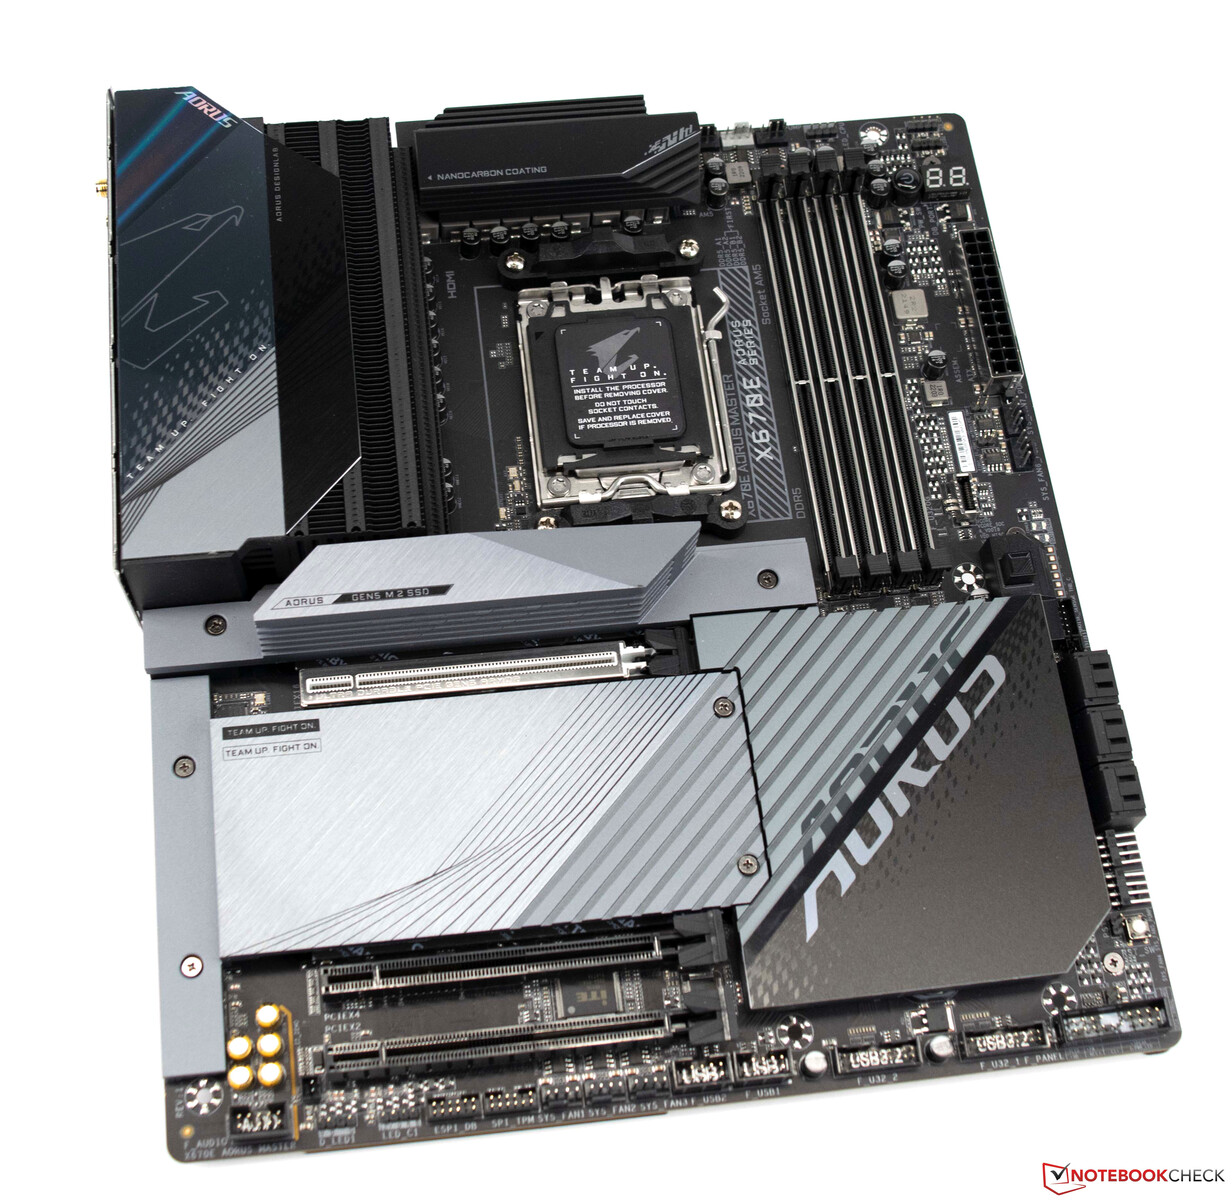
Nosso sistema de teste é baseado no AMD Ryzen 9 7950X
Nosso sistema de teste apresenta uma placa-mãe Gigabyte X670E Aorus Master pareada com uma CPU AMD de alto desempenho (Ryzen 9 7950X), que é resfriado por uma solução de Alphacool AIO (Alphacool Eisbaer Aurora 360 mm). O sistema tem 32 GB de memória G.Skill rodando em um perfil EXPO apropriado e é conectado a um monitor Gigabyte M32U.
Especificações detalhadas do sistema de teste
Nesta revisão, utilizamos o seguinte sistema para os testes e benchmarks:
- Lian-Li O11 Dynamic
- AMD Ryzen 9 7950X
- Gigabyte X670E Aorus Master, BIOS: F8a
- Alphacool Eisbear 360 AIO
- Fonte de alimentação Corsair RM 1000x
- G.Skill Trident Z5 Neo DDR5-6000 2x 16 GB, EXPO (DDR5-6000 CL30-38-38-96)
- Corsair MP600 2 TB
- Crucial MX500 2 TB
- Microsoft Windows 11 Professional 64-Bit (Versão 22H2)
Detalhes sobre o KFA2 GeForce RTX 4080 SG
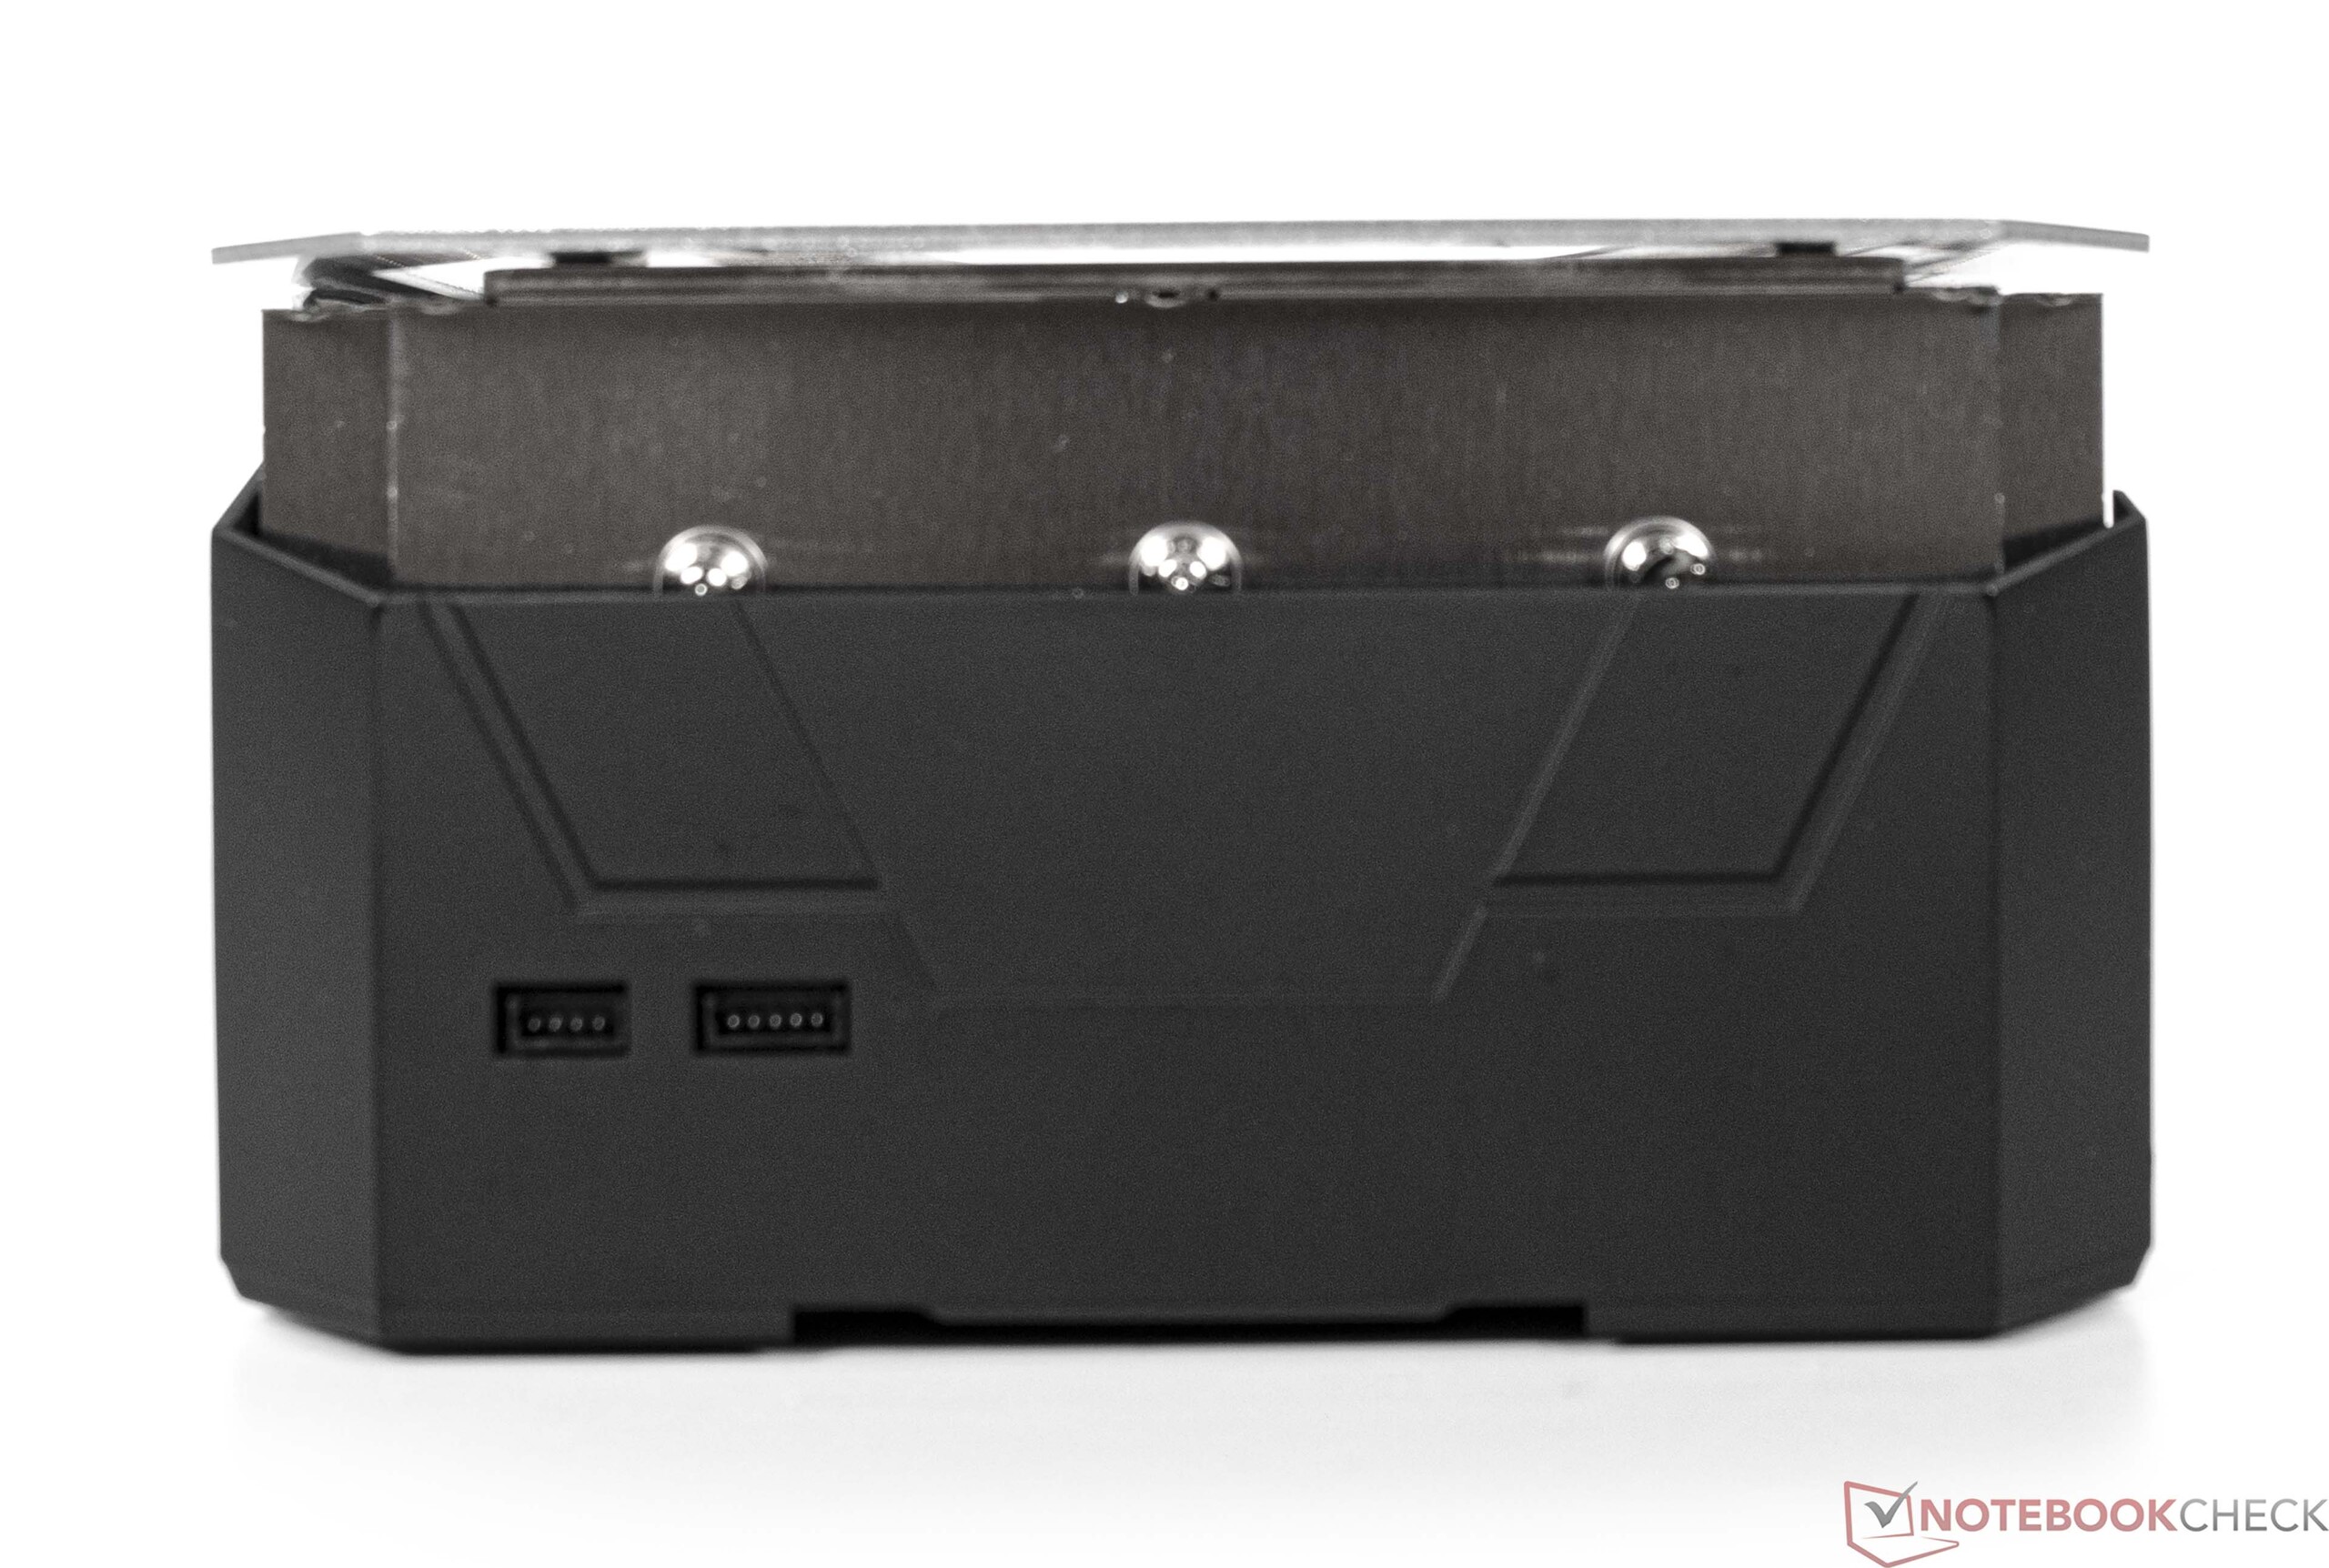
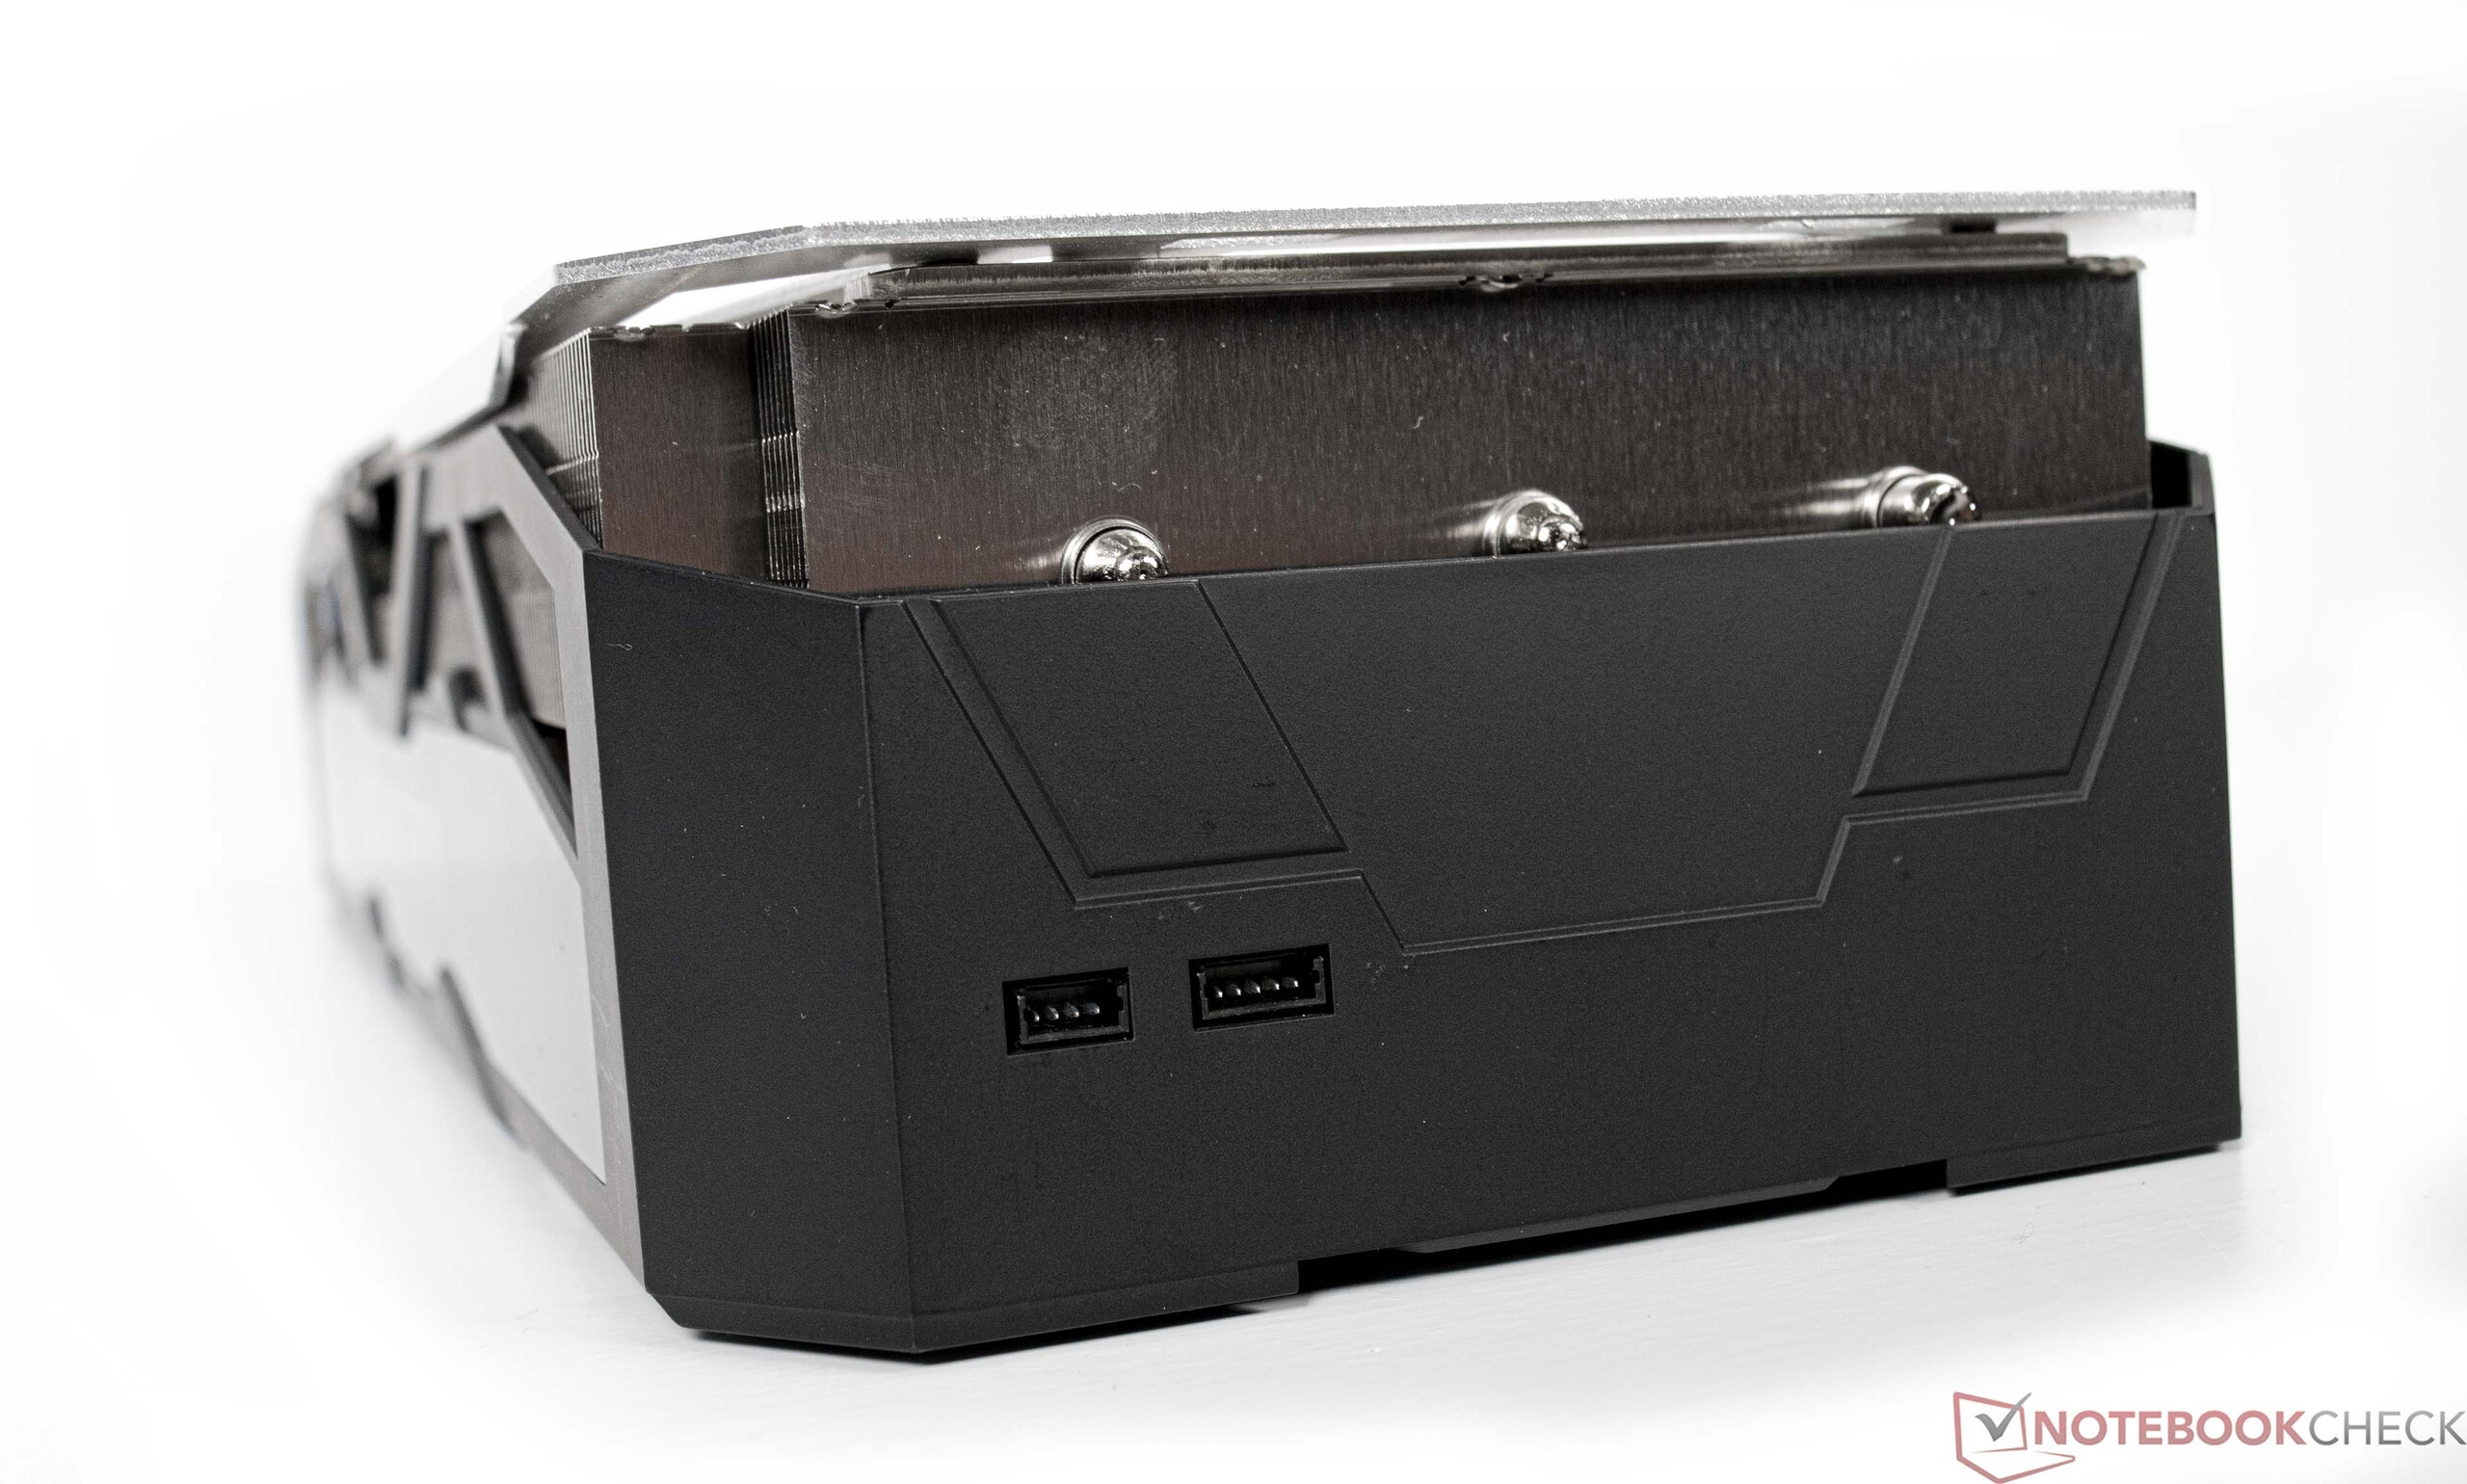
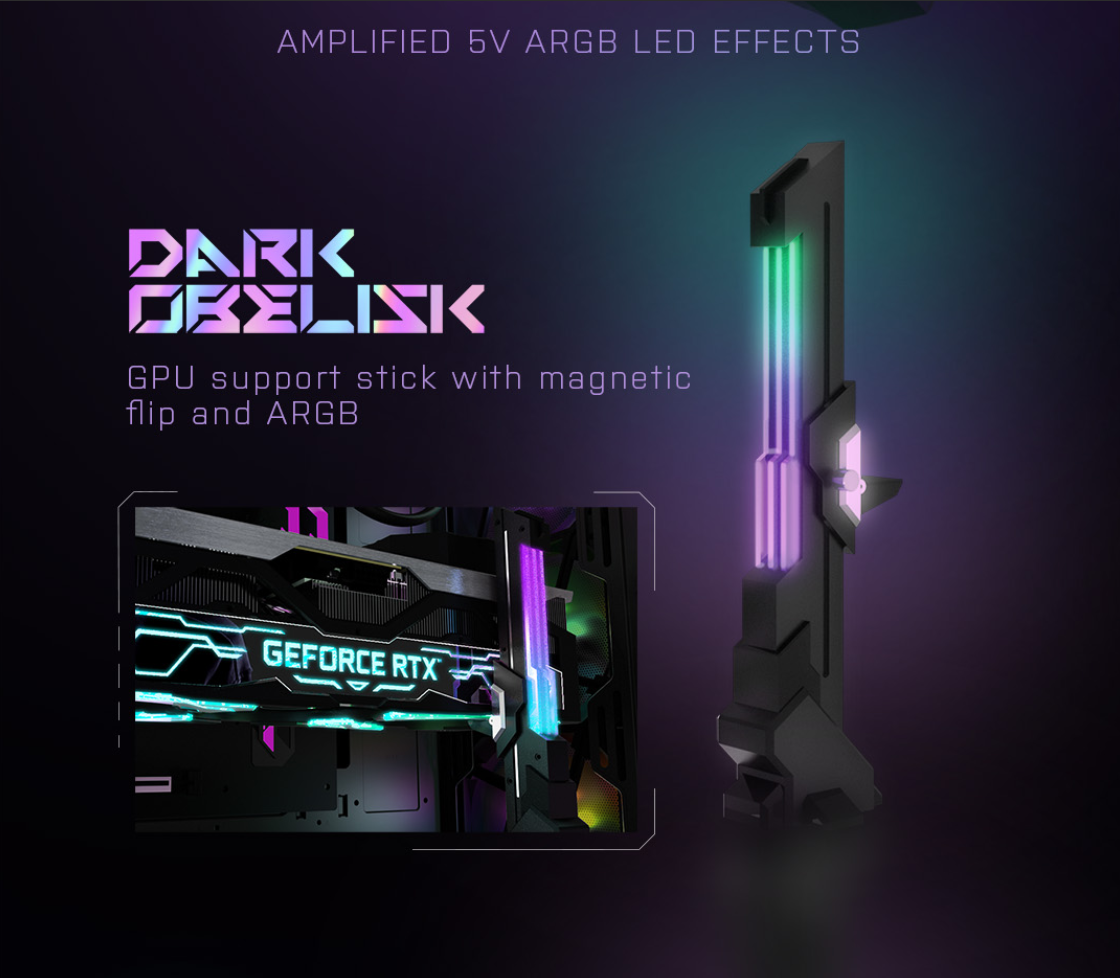
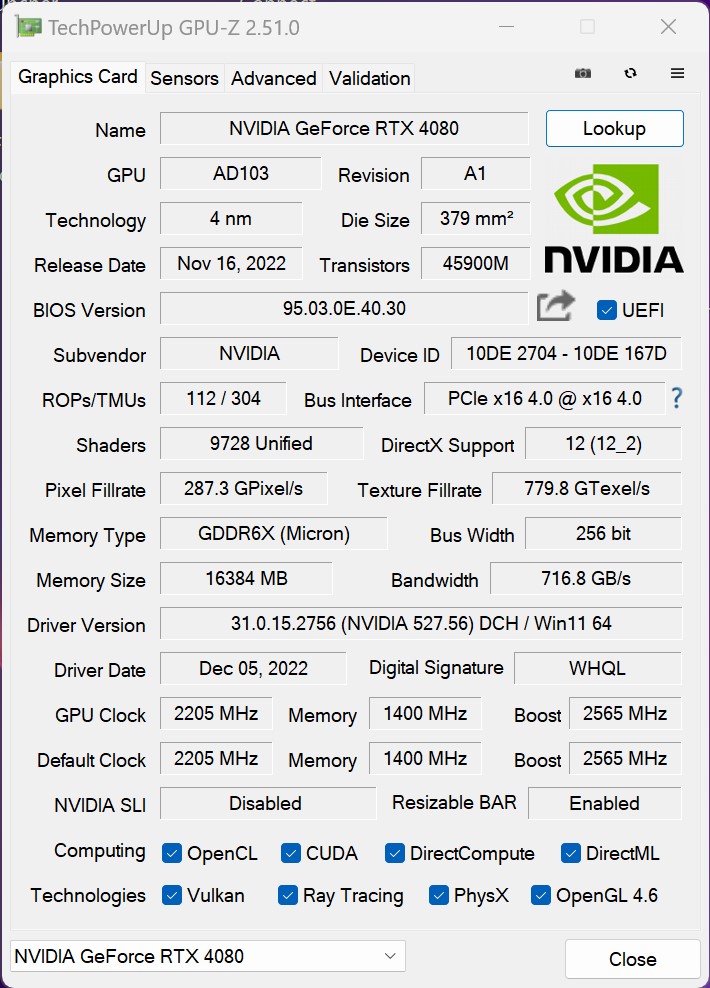
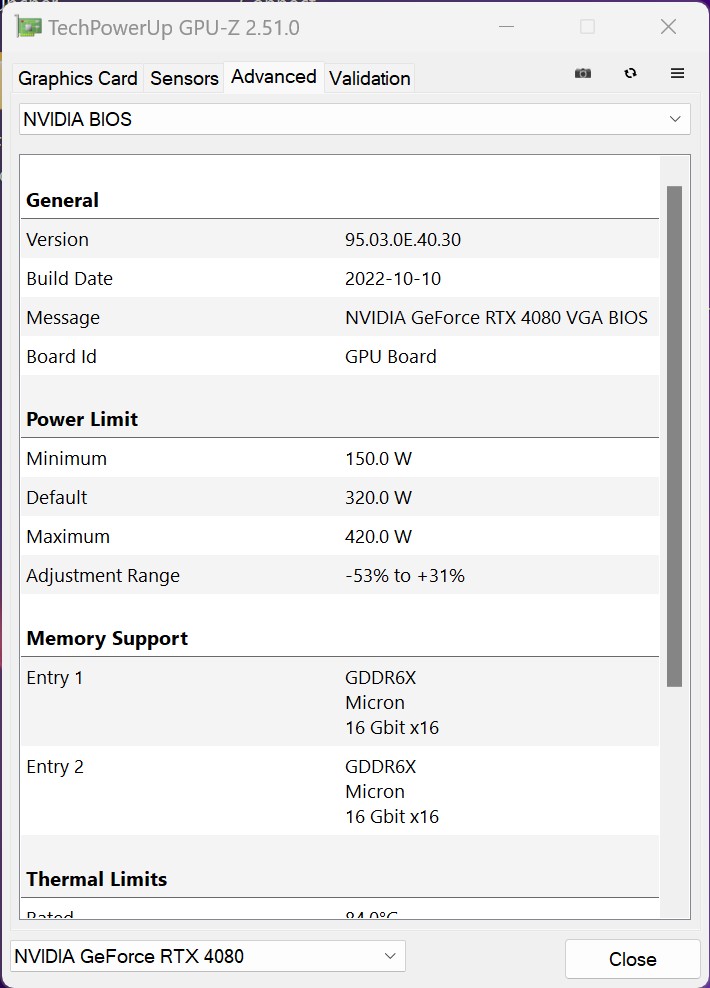
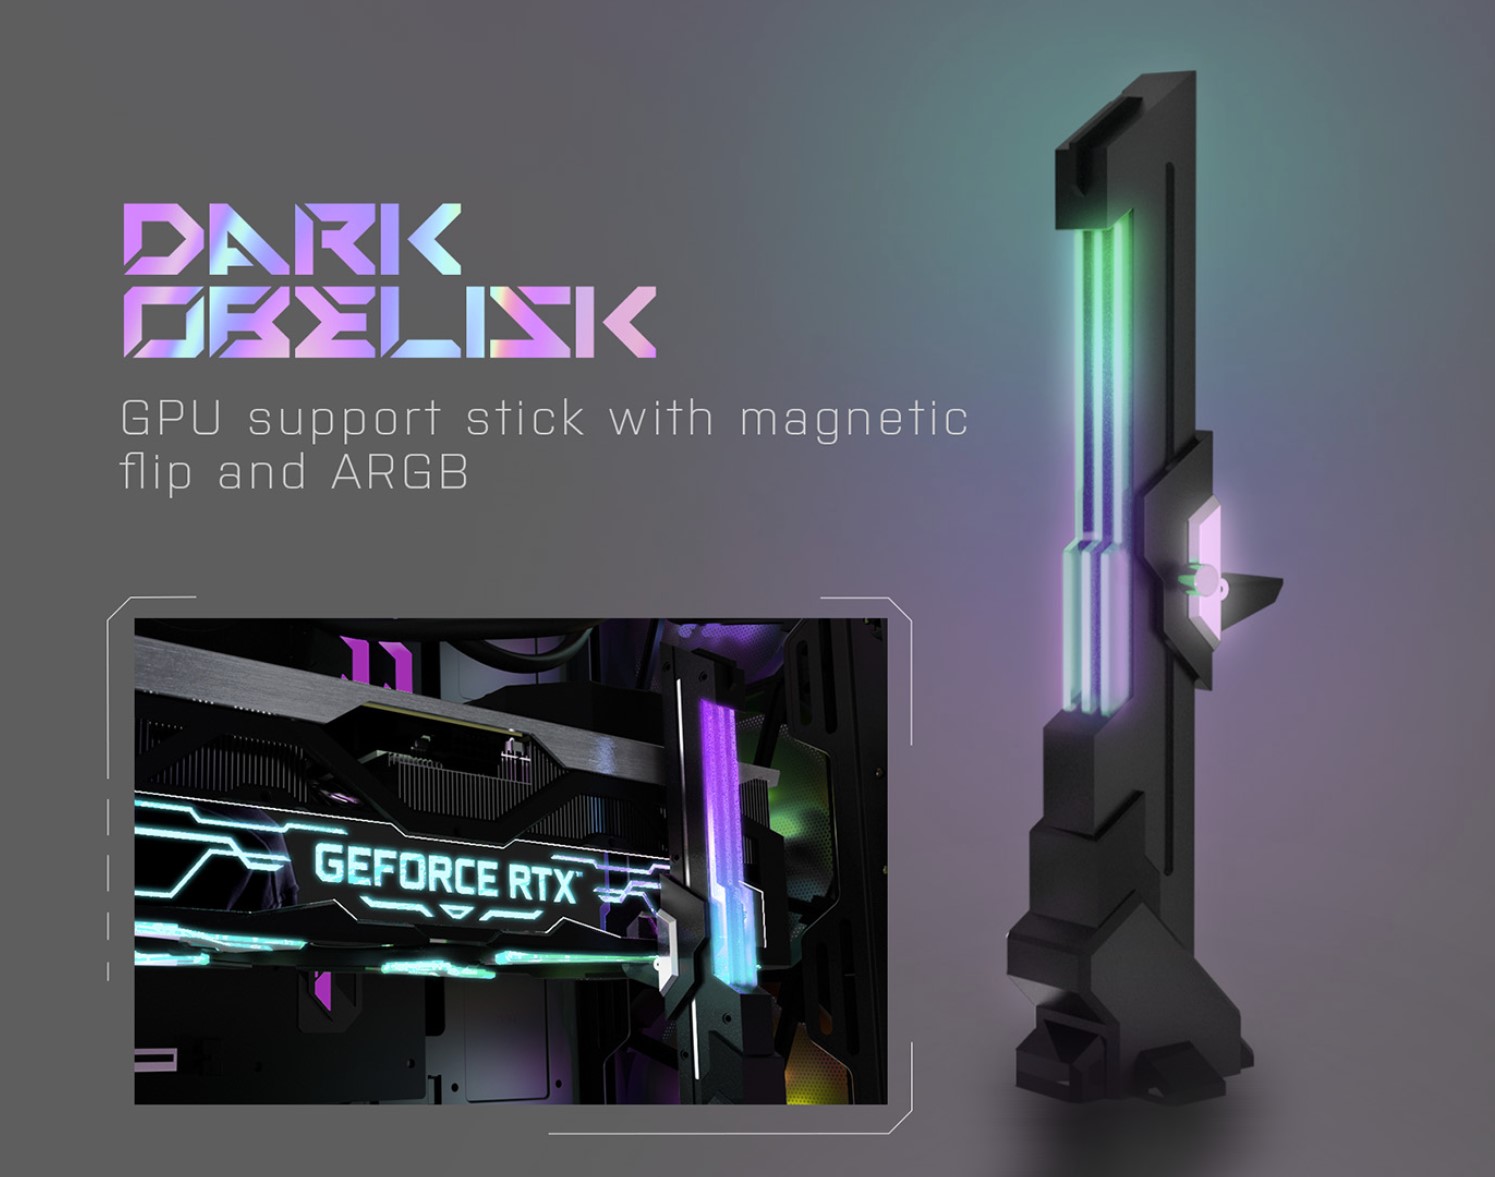
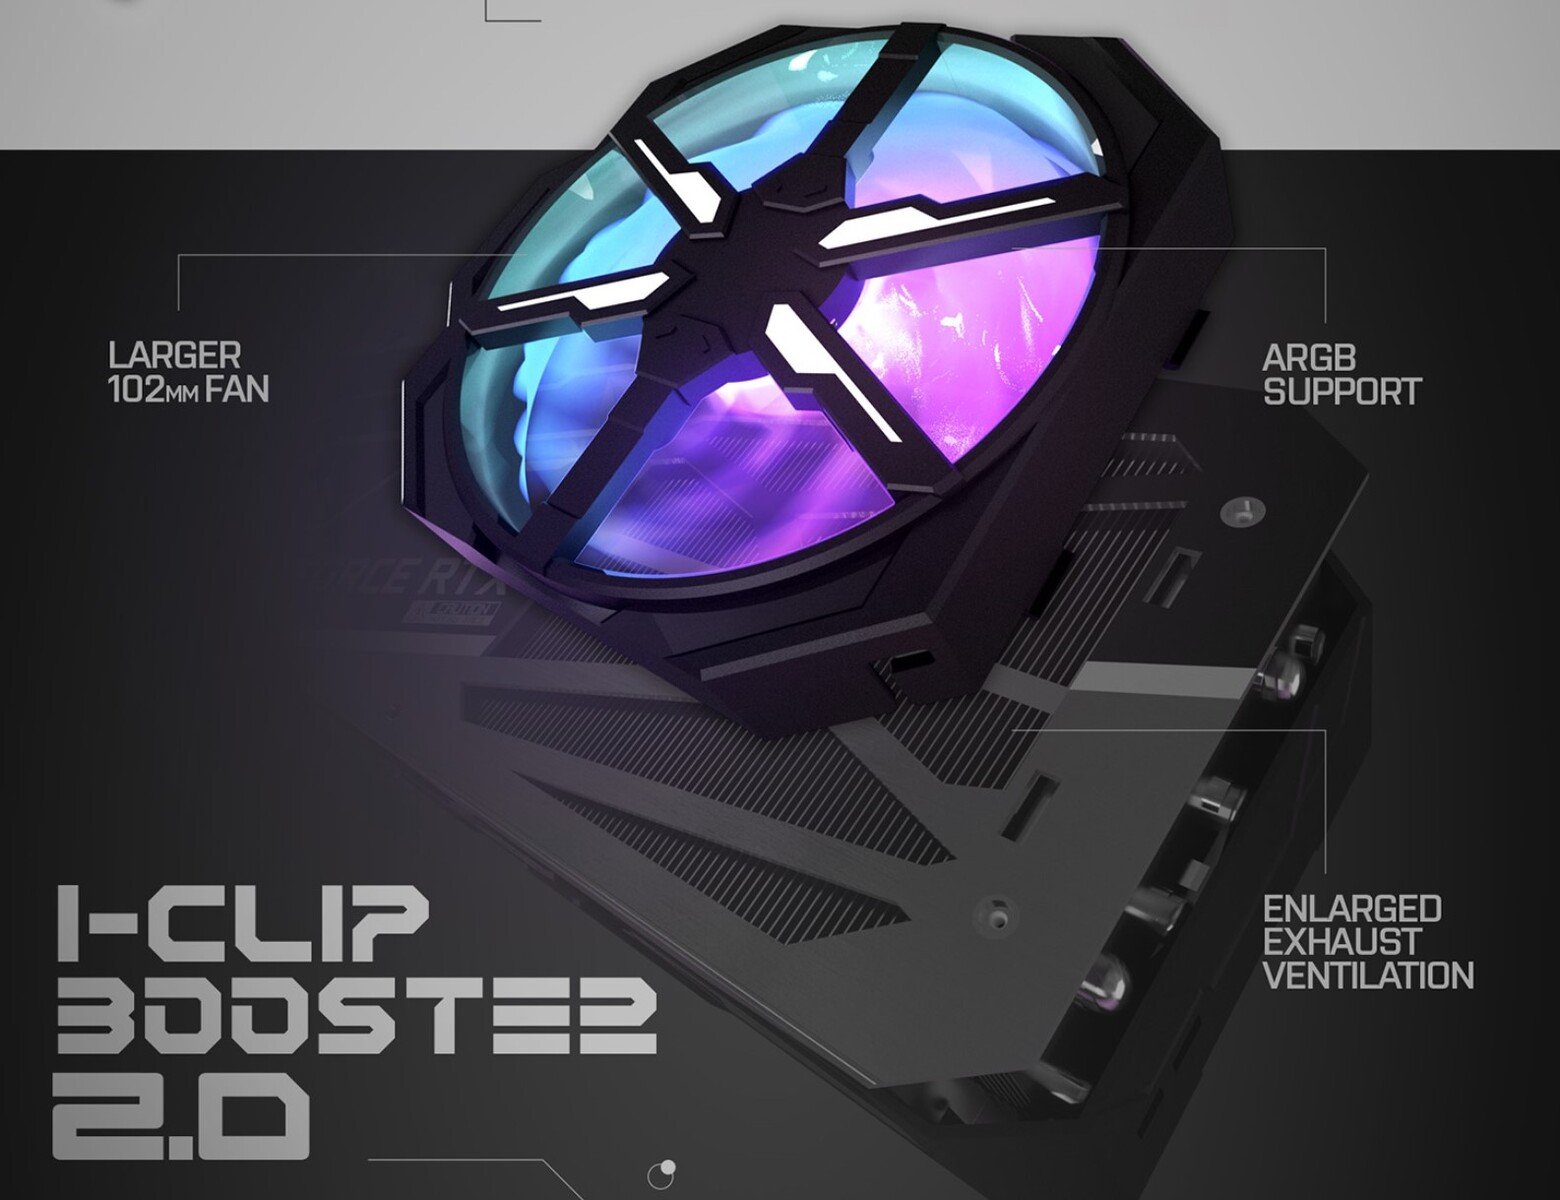
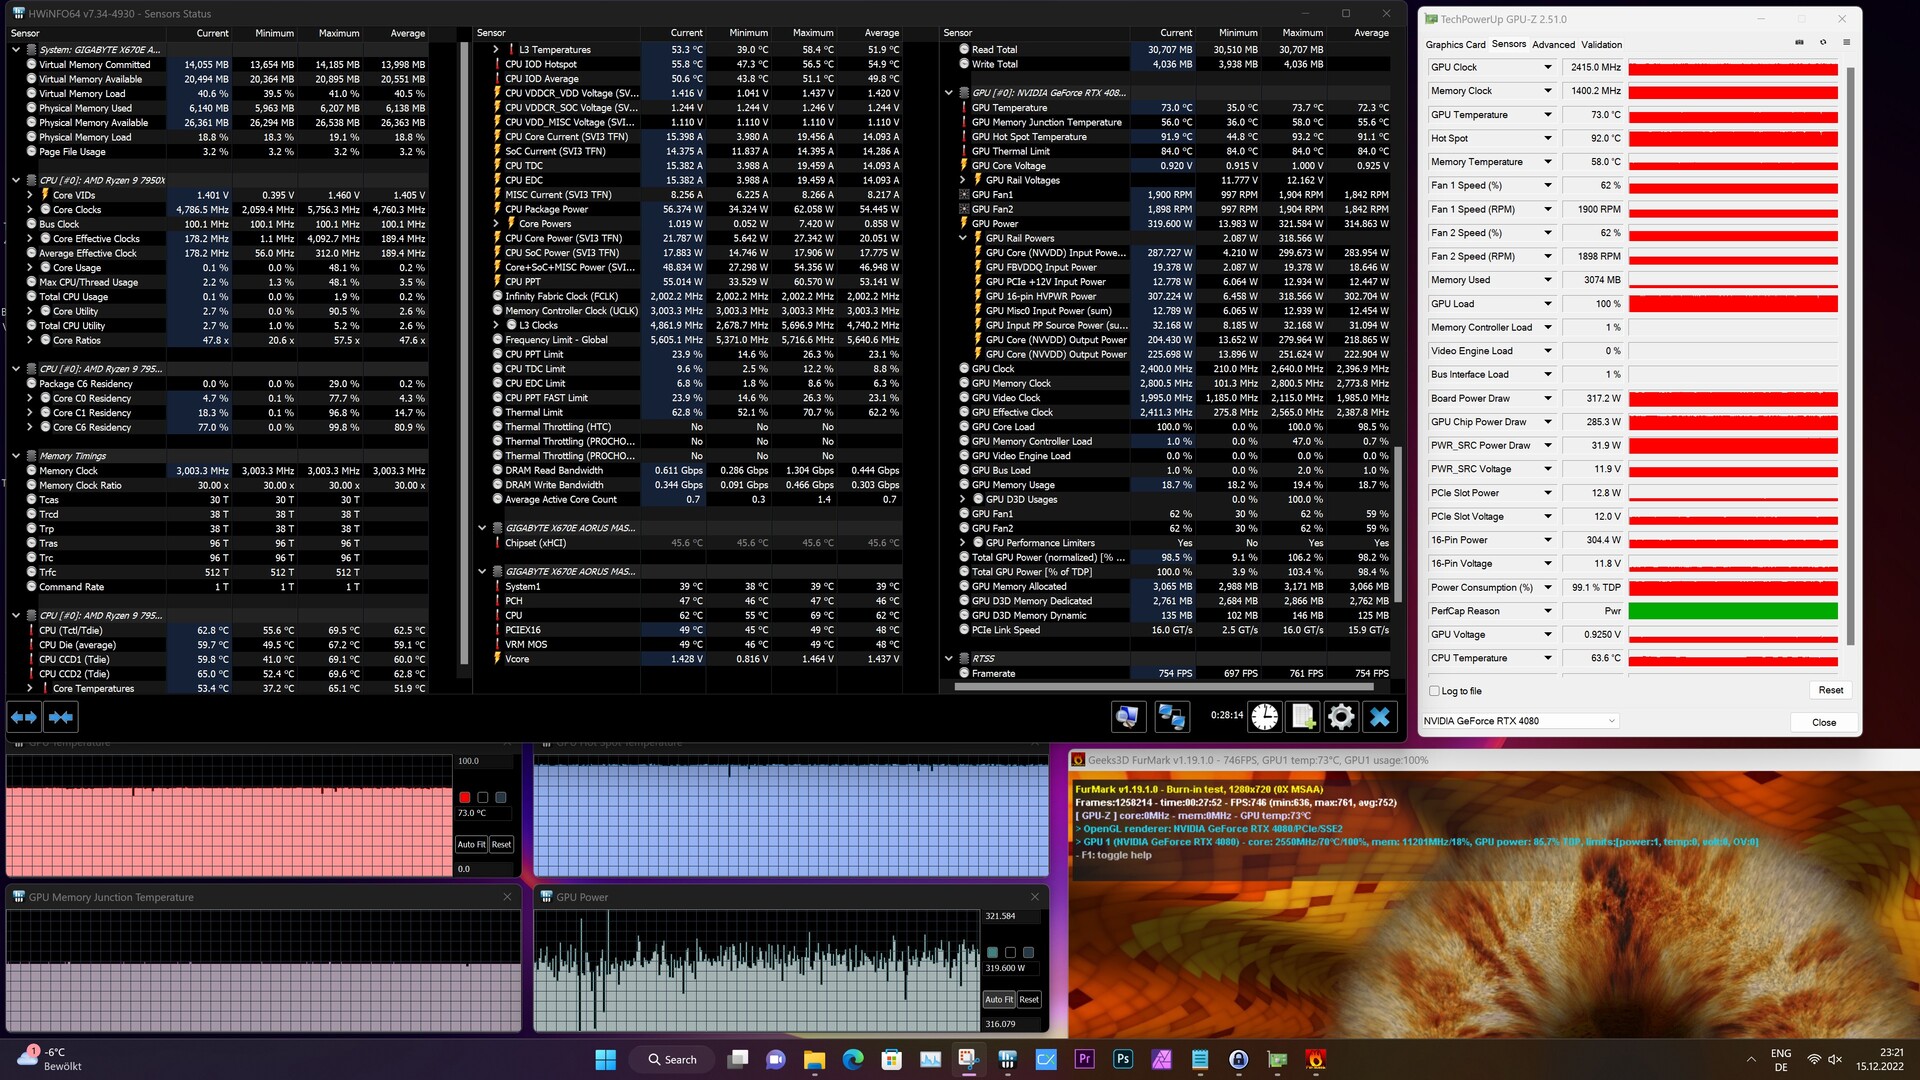
O KFA2 deu ao GeForce RTX 4080 SG velocidades de relógio ligeiramente maiores do que as especificadas pela Nvidia - o relógio de impulso máximo foi aumentado em 60 MHz para ser exato. Mas isto é irrelevante na prática porque conseguimos alcançar velocidades mais altas de forma consistente durante nossos testes. Em média, vimos taxas de relógio GPU de aproximadamente 2,8 GHz durante os jogos. A ferramenta leve Xtreme Tuner permite aos usuários controlar os ventiladores e a iluminação na placa gráfica. Para nossos testes, no entanto, não fizemos nenhuma alteração nas configurações padrão. O recurso 1-Click OC frequentemente encontrado nos modelos KFA2 é mais apenas para mostrar. Em aplicações da vida real, aumentar as velocidades da GPU em apenas 15 MHz quase não faz diferença. Esperamos que este recurso traga significativamente mais para a mesa no futuro. Além da placa gráfica em si, na caixa você também encontrará um ventilador opcional projetado para ser montado na parte de trás da placa. É pena que o ventilador seja incompatível com nossa placa-mãe, o que nos impede de usá-lo em nossa revisão. A empresa também incluiu um suporte GPU (ARGB Dark Obelisk). Este item é equipado com iluminação RGB integrada e, portanto, vai bem com o projeto geral do KFA2 GeForce RTX 4080 SG.
Padrões de referência sintéticos
Em testes sintéticos, o KFA2 GeForce RTX 4080 SG forneceu exatamente o mesmo nível de desempenho que o Edição Fundadores por Nvidia. O cartão KFA2 foi capaz de superar um AMD Radeon RX 7900 XT em onze por cento. A principal GPU da AMD, a Radeon RX 7900 XTX, está dentro da mesma faixa de desempenho e é apenas negligenciavelmente mais rápida do que nossa unidade de revisão. Depois de ver um enorme salto de desempenho do GeForce RTX 3090 ao RTX 4090, observamos um ganho de desempenho semelhante quando comparamos o RTX 4080 com o RTX 3080 Ti. Em geral, a arquitetura Ada Lovelace de Nvidia proporciona um desempenho 26 por cento maior do que Ampere.
Em termos de desempenho computacional, Nvidia tem claramente a vantagem às vezes, enquanto AMD é decididamente melhor em outros casos. Portanto, aqueles que procuram principalmente um alto desempenho de computação devem considerar cuidadosamente que programas de software pretendem utilizar e qual placa gráfica tem vantagem nessas aplicações específicas. Como tal, não podemos recomendar definitivamente um produto em particular a este respeito.
| Performance rating - Percent | |
| Palit GeForce RTX 4090 GameRock OC | |
| KFA2 GeForce RTX 4090 SG | |
| AMD Radeon RX 7900 XTX | |
| NVIDIA GeForce RTX 4080 Founders Edition | |
| KFA2 GeForce RTX 4080 SG | |
| AMD Radeon RX 7900 XT | |
| MSI Radeon RX 6950 XT Gaming X Trio | |
| ASUS TUF Gaming GeForce RTX 3080 Ti OC | |
| NVIDIA GeForce RTX 3090 Founders Edition | |
| Sapphire AMD Radeon RX 6950 XT Nitro+ Pure | |
| KFA2 GeForce RTX 3080 SG | |
| Nvidia Titan RTX | |
| Unigine Heaven 4.0 | |
| Extreme Preset DX11 | |
| Palit GeForce RTX 4090 GameRock OC | |
| KFA2 GeForce RTX 4090 SG | |
| KFA2 GeForce RTX 4080 SG | |
| NVIDIA GeForce RTX 4080 Founders Edition | |
| AMD Radeon RX 7900 XTX | |
| AMD Radeon RX 7900 XT | |
| MSI Radeon RX 6950 XT Gaming X Trio | |
| ASUS TUF Gaming GeForce RTX 3080 Ti OC | |
| NVIDIA GeForce RTX 3090 Founders Edition | |
| Sapphire AMD Radeon RX 6950 XT Nitro+ Pure | |
| KFA2 GeForce RTX 3080 SG | |
| Nvidia Titan RTX | |
| Extreme Preset OpenGL | |
| Palit GeForce RTX 4090 GameRock OC | |
| KFA2 GeForce RTX 4090 SG | |
| KFA2 GeForce RTX 4080 SG | |
| AMD Radeon RX 7900 XTX | |
| NVIDIA GeForce RTX 4080 Founders Edition | |
| AMD Radeon RX 7900 XT | |
| ASUS TUF Gaming GeForce RTX 3080 Ti OC | |
| NVIDIA GeForce RTX 3090 Founders Edition | |
| MSI Radeon RX 6950 XT Gaming X Trio | |
| KFA2 GeForce RTX 3080 SG | |
| Sapphire AMD Radeon RX 6950 XT Nitro+ Pure | |
| Nvidia Titan RTX | |
| Unigine Valley 1.0 | |
| 1920x1080 Extreme HD DirectX AA:x8 | |
| NVIDIA GeForce RTX 4080 Founders Edition | |
| KFA2 GeForce RTX 4090 SG | |
| Palit GeForce RTX 4090 GameRock OC | |
| AMD Radeon RX 7900 XTX | |
| KFA2 GeForce RTX 4080 SG | |
| AMD Radeon RX 7900 XT | |
| MSI Radeon RX 6950 XT Gaming X Trio | |
| ASUS TUF Gaming GeForce RTX 3080 Ti OC | |
| NVIDIA GeForce RTX 3090 Founders Edition | |
| Sapphire AMD Radeon RX 6950 XT Nitro+ Pure | |
| KFA2 GeForce RTX 3080 SG | |
| Nvidia Titan RTX | |
| 1920x1080 Extreme HD Preset OpenGL AA:x8 | |
| Palit GeForce RTX 4090 GameRock OC | |
| KFA2 GeForce RTX 4090 SG | |
| NVIDIA GeForce RTX 4080 Founders Edition | |
| AMD Radeon RX 7900 XTX | |
| KFA2 GeForce RTX 4080 SG | |
| AMD Radeon RX 7900 XT | |
| ASUS TUF Gaming GeForce RTX 3080 Ti OC | |
| NVIDIA GeForce RTX 3090 Founders Edition | |
| MSI Radeon RX 6950 XT Gaming X Trio | |
| KFA2 GeForce RTX 3080 SG | |
| Sapphire AMD Radeon RX 6950 XT Nitro+ Pure | |
| Nvidia Titan RTX | |
| 3DMark 11 | |
| 1280x720 Performance GPU | |
| Palit GeForce RTX 4090 GameRock OC | |
| KFA2 GeForce RTX 4090 SG | |
| KFA2 GeForce RTX 4080 SG | |
| NVIDIA GeForce RTX 4080 Founders Edition | |
| AMD Radeon RX 7900 XTX | |
| AMD Radeon RX 7900 XT | |
| MSI Radeon RX 6950 XT Gaming X Trio | |
| Sapphire AMD Radeon RX 6950 XT Nitro+ Pure | |
| NVIDIA GeForce RTX 3090 Founders Edition | |
| ASUS TUF Gaming GeForce RTX 3080 Ti OC | |
| KFA2 GeForce RTX 3080 SG | |
| Nvidia Titan RTX | |
| 1280x720 Performance | |
| Palit GeForce RTX 4090 GameRock OC | |
| KFA2 GeForce RTX 4090 SG | |
| KFA2 GeForce RTX 4080 SG | |
| NVIDIA GeForce RTX 4080 Founders Edition | |
| AMD Radeon RX 7900 XTX | |
| AMD Radeon RX 7900 XT | |
| MSI Radeon RX 6950 XT Gaming X Trio | |
| ASUS TUF Gaming GeForce RTX 3080 Ti OC | |
| NVIDIA GeForce RTX 3090 Founders Edition | |
| Nvidia Titan RTX | |
| Sapphire AMD Radeon RX 6950 XT Nitro+ Pure | |
| KFA2 GeForce RTX 3080 SG | |
Compute benchmarks and professional applications
| LuxMark v2.0 64Bit | |
| Sala GPUs-only | |
| AMD Radeon RX 6950 XT | |
| NVIDIA GeForce RTX 4090 | |
| NVIDIA GeForce RTX 4090 | |
| NVIDIA GeForce RTX 4080 | |
| KFA2 GeForce RTX 4080 SG | |
| NVIDIA GeForce RTX 3080 Ti | |
| AMD Radeon RX 7900 XTX | |
| NVIDIA GeForce RTX 3090 | |
| NVIDIA GeForce RTX 3080 12 GB | |
| AMD Radeon RX 7900 XT | |
| AMD Radeon RX 6950 XT | |
| NVIDIA Titan RTX | |
| Room GPUs-only | |
| NVIDIA GeForce RTX 4090 | |
| NVIDIA GeForce RTX 4090 | |
| NVIDIA GeForce RTX 4080 | |
| KFA2 GeForce RTX 4080 SG | |
| NVIDIA GeForce RTX 3090 | |
| NVIDIA GeForce RTX 3080 Ti | |
| NVIDIA GeForce RTX 3080 12 GB | |
| AMD Radeon RX 7900 XTX | |
| AMD Radeon RX 6950 XT | |
| NVIDIA Titan RTX | |
| AMD Radeon RX 7900 XT | |
| AMD Radeon RX 6950 XT | |
| Blender - v3.3 Classroom CUDA | |
| NVIDIA Titan RTX | |
| NVIDIA GeForce RTX 3080 Ti | |
| Geekbench 5.5 | |
| OpenCL Score | |
| NVIDIA GeForce RTX 4090 | |
| NVIDIA GeForce RTX 4090 | |
| KFA2 GeForce RTX 4080 SG | |
| NVIDIA GeForce RTX 4080 | |
| NVIDIA GeForce RTX 3090 | |
| NVIDIA GeForce RTX 3080 12 GB | |
| AMD Radeon RX 6950 XT | |
| NVIDIA Titan RTX | |
| Vulkan Score 5.5 | |
| NVIDIA GeForce RTX 4090 | |
| NVIDIA GeForce RTX 4090 | |
| NVIDIA Titan RTX | |
| NVIDIA GeForce RTX 3090 | |
| AMD Radeon RX 6950 XT | |
| NVIDIA GeForce RTX 3080 12 GB | |
| V-Ray 5 Benchmark | |
| GPU CUDA | |
| NVIDIA GeForce RTX 4090 | |
| NVIDIA GeForce RTX 4090 | |
| KFA2 GeForce RTX 4080 SG | |
| NVIDIA GeForce RTX 4080 | |
| NVIDIA GeForce RTX 3090 | |
| NVIDIA GeForce RTX 3080 Ti | |
| NVIDIA GeForce RTX 3080 12 GB | |
| AMD Radeon RX 6950 XT | |
| GPU RTX | |
| NVIDIA GeForce RTX 4090 | |
| NVIDIA GeForce RTX 4090 | |
| KFA2 GeForce RTX 4080 SG | |
| NVIDIA GeForce RTX 4080 | |
| NVIDIA GeForce RTX 3090 | |
| NVIDIA GeForce RTX 3080 Ti | |
| Affinity Photo 2 - Combined (Single / Multi GPU) | |
| NVIDIA GeForce RTX 4090 | |
| KFA2 GeForce RTX 4080 SG | |
| NVIDIA GeForce RTX 3080 Ti | |
| NVIDIA Titan RTX | |
| AMD Radeon RX 6950 XT | |
| AMD Radeon RX 7900 XTX | |
| AMD Radeon RX 7900 XT | |
* ... menor é melhor
Benchmarks de jogo
Como o KFA2 GeForce RTX 4090 SGa KFA2 GeForce RTX 4080 SG oferece um desempenho de jogo imensamente alto que só flexiona adequadamente seus músculos a 2160p. Escusado será dizer que o modelo pode suportar 1440p muito confortavelmente, e a CPU é um fator menos limitador do que com o RTX 4090 mais rápido. Os concorrentes da AMD não lutam muito contra o KFA2 GeForce RTX 4080 SG, apesar do fato de que alguns jogos rodam melhor em placas gráficas AMD. Por outro lado, há também jogos que funcionam muito melhor em GPUs Nvidia. Uma vez habilitados os recursos de traçado de raio, as placas Nvidia se adiantam ainda mais em relação às novas placas gráficas RDNA3. Sem DLSS, no entanto, mesmo as GPUs Nvidia mais rápidas agora lutam com o traçado de raio em resoluções mais altas. Como mostrado pelo Cyberpunk 2077, você terá que se contentar com 1080p quando o DLSS estiver desativado
Em qualquer caso, deve-se observar que o DLSS 3.0 está disponível exclusivamente nas novas GPUs da série GeForce RTX 40. A AMD tem uma característica semelhante no pronto na forma do FSR padrão aberto, que também pode ser utilizado com as GPUs Nvidia. Em última análise, cabe aos desenvolvedores de jogos integrar estas características em seus jogos. Você pode clicar em aqui para encontrar uma lista de jogos que suportam DLSS 3.0 agora mesmo ou que o suportarão no futuro
.| GTA V - 3840x2160 High/On (Advanced Graphics Off) AA:FX AF:8x | |
| Palit GeForce RTX 4090 GameRock OC | |
| NVIDIA GeForce RTX 4080 Founders Edition | |
| AMD Radeon RX 7900 XTX | |
| KFA2 GeForce RTX 4080 SG | |
| ASUS TUF Gaming GeForce RTX 3080 Ti OC | |
| NVIDIA GeForce RTX 3090 Founders Edition | |
| MSI Radeon RX 6950 XT Gaming X Trio | |
| AMD Radeon RX 7900 XT | |
| Sapphire AMD Radeon RX 6950 XT Nitro+ Pure | |
| KFA2 GeForce RTX 3080 SG | |
| Nvidia Titan RTX | |
| The Witcher 3 - 3840x2160 High Graphics & Postprocessing (Nvidia HairWorks Off) | |
| Palit GeForce RTX 4090 GameRock OC | |
| NVIDIA GeForce RTX 4080 Founders Edition | |
| KFA2 GeForce RTX 4080 SG | |
| AMD Radeon RX 7900 XTX | |
| AMD Radeon RX 7900 XT | |
| NVIDIA GeForce RTX 3090 Founders Edition | |
| ASUS TUF Gaming GeForce RTX 3080 Ti OC | |
| MSI Radeon RX 6950 XT Gaming X Trio | |
| Sapphire AMD Radeon RX 6950 XT Nitro+ Pure | |
| KFA2 GeForce RTX 3080 SG | |
| AMD Radeon RX 6900 XT | |
| Nvidia Titan RTX | |
| Final Fantasy XV Benchmark - 3840x2160 High Quality | |
| Palit GeForce RTX 4090 GameRock OC | |
| KFA2 GeForce RTX 4080 SG | |
| NVIDIA GeForce RTX 4080 Founders Edition | |
| AMD Radeon RX 7900 XTX | |
| NVIDIA GeForce RTX 3090 Founders Edition | |
| ASUS TUF Gaming GeForce RTX 3080 Ti OC | |
| Sapphire AMD Radeon RX 6950 XT Nitro+ Pure | |
| MSI Radeon RX 6950 XT Gaming X Trio | |
| AMD Radeon RX 7900 XT | |
| KFA2 GeForce RTX 3080 SG | |
| Nvidia Titan RTX | |
| Strange Brigade - 3840x2160 ultra AA:ultra AF:16 | |
| Palit GeForce RTX 4090 GameRock OC | |
| KFA2 GeForce RTX 4080 SG | |
| MSI Radeon RX 6950 XT Gaming X Trio | |
| AMD Radeon RX 7900 XT | |
| AMD Radeon RX 7900 XTX | |
| Sapphire AMD Radeon RX 6950 XT Nitro+ Pure | |
| NVIDIA GeForce RTX 3090 Founders Edition | |
| ASUS TUF Gaming GeForce RTX 3080 Ti OC | |
| KFA2 GeForce RTX 3080 SG | |
| Nvidia Titan RTX | |
| Far Cry 5 - 3840x2160 Ultra Preset AA:T | |
| Palit GeForce RTX 4090 GameRock OC | |
| AMD Radeon RX 7900 XTX | |
| NVIDIA GeForce RTX 4080 Founders Edition | |
| KFA2 GeForce RTX 4080 SG | |
| AMD Radeon RX 7900 XT | |
| MSI Radeon RX 6950 XT Gaming X Trio | |
| Sapphire AMD Radeon RX 6950 XT Nitro+ Pure | |
| ASUS TUF Gaming GeForce RTX 3080 Ti OC | |
| NVIDIA GeForce RTX 3090 Founders Edition | |
| KFA2 GeForce RTX 3080 SG | |
| Nvidia Titan RTX | |
| Far Cry New Dawn - 3840x2160 Ultra Preset | |
| Palit GeForce RTX 4090 GameRock OC | |
| AMD Radeon RX 7900 XTX | |
| KFA2 GeForce RTX 4080 SG | |
| AMD Radeon RX 7900 XT | |
| MSI Radeon RX 6950 XT Gaming X Trio | |
| Sapphire AMD Radeon RX 6950 XT Nitro+ Pure | |
| ASUS TUF Gaming GeForce RTX 3080 Ti OC | |
| NVIDIA GeForce RTX 3090 Founders Edition | |
| AMD Radeon RX 6900 XT | |
| KFA2 GeForce RTX 3080 SG | |
| Nvidia Titan RTX | |
| Far Cry 6 - 3840x2160 Ultra Graphics Quality + HD Textures AA:T | |
| Palit GeForce RTX 4090 GameRock OC | |
| AMD Radeon RX 7900 XTX | |
| NVIDIA GeForce RTX 4080 Founders Edition | |
| KFA2 GeForce RTX 4080 SG | |
| AMD Radeon RX 7900 XT | |
| MSI Radeon RX 6950 XT Gaming X Trio | |
| Sapphire AMD Radeon RX 6950 XT Nitro+ Pure | |
| ASUS TUF Gaming GeForce RTX 3080 Ti OC | |
| NVIDIA GeForce RTX 3090 Founders Edition | |
| Nvidia Titan RTX | |
| KFA2 GeForce RTX 3080 SG | |
| Metro Exodus - 3840x2160 Ultra Quality AF:16x | |
| Palit GeForce RTX 4090 GameRock OC | |
| NVIDIA GeForce RTX 4080 Founders Edition | |
| KFA2 GeForce RTX 4080 SG | |
| AMD Radeon RX 7900 XTX | |
| AMD Radeon RX 7900 XT | |
| MSI Radeon RX 6950 XT Gaming X Trio | |
| ASUS TUF Gaming GeForce RTX 3080 Ti OC | |
| NVIDIA GeForce RTX 3090 Founders Edition | |
| Sapphire AMD Radeon RX 6950 XT Nitro+ Pure | |
| AMD Radeon RX 6900 XT | |
| KFA2 GeForce RTX 3080 SG | |
| Nvidia Titan RTX | |
| F1 2020 - 3840x2160 Ultra High Preset AA:T AF:16x | |
| Palit GeForce RTX 4090 GameRock OC | |
| KFA2 GeForce RTX 4080 SG | |
| AMD Radeon RX 7900 XTX | |
| AMD Radeon RX 7900 XT | |
| MSI Radeon RX 6950 XT Gaming X Trio | |
| Sapphire AMD Radeon RX 6950 XT Nitro+ Pure | |
| ASUS TUF Gaming GeForce RTX 3080 Ti OC | |
| NVIDIA GeForce RTX 3090 Founders Edition | |
| AMD Radeon RX 6900 XT | |
| AMD Radeon RX 6900 XT | |
| KFA2 GeForce RTX 3080 SG | |
| Nvidia Titan RTX | |
| F1 2021 - 3840x2160 Ultra High Preset + Raytracing AA:T AF:16x | |
| Palit GeForce RTX 4090 GameRock OC | |
| KFA2 GeForce RTX 4080 SG | |
| NVIDIA GeForce RTX 4080 Founders Edition | |
| AMD Radeon RX 7900 XTX | |
| AMD Radeon RX 7900 XT | |
| ASUS TUF Gaming GeForce RTX 3080 Ti OC | |
| NVIDIA GeForce RTX 3090 Founders Edition | |
| MSI Radeon RX 6950 XT Gaming X Trio | |
| Sapphire AMD Radeon RX 6950 XT Nitro+ Pure | |
| KFA2 GeForce RTX 3080 SG | |
| Nvidia Titan RTX | |
| F1 22 - 3840x2160 Ultra High Preset AA:T AF:16x | |
| Palit GeForce RTX 4090 GameRock OC | |
| NVIDIA GeForce RTX 4080 Founders Edition | |
| KFA2 GeForce RTX 4080 SG | |
| AMD Radeon RX 7900 XTX | |
| AMD Radeon RX 7900 XT | |
| ASUS TUF Gaming GeForce RTX 3080 Ti OC | |
| NVIDIA GeForce RTX 3090 Founders Edition | |
| MSI Radeon RX 6950 XT Gaming X Trio | |
| Sapphire AMD Radeon RX 6950 XT Nitro+ Pure | |
| Nvidia Titan RTX | |
| Borderlands 3 - 3840x2160 Badass Overall Quality (DX11) | |
| Palit GeForce RTX 4090 GameRock OC | |
| NVIDIA GeForce RTX 4080 Founders Edition | |
| KFA2 GeForce RTX 4080 SG | |
| AMD Radeon RX 7900 XTX | |
| AMD Radeon RX 7900 XT | |
| ASUS TUF Gaming GeForce RTX 3080 Ti OC | |
| NVIDIA GeForce RTX 3090 Founders Edition | |
| MSI Radeon RX 6950 XT Gaming X Trio | |
| KFA2 GeForce RTX 3080 SG | |
| Sapphire AMD Radeon RX 6950 XT Nitro+ Pure | |
| AMD Radeon RX 6900 XT | |
| AMD Radeon RX 6900 XT | |
| Nvidia Titan RTX | |
| Metro Exodus - 1920x1080 Ultra Quality DXR AF:16x | |
| NVIDIA GeForce RTX 4090 | |
| NVIDIA GeForce RTX 4080 | |
| AMD Radeon RX 7900 XTX | |
| NVIDIA GeForce RTX 4080 | |
| AMD Radeon RX 7900 XT | |
| NVIDIA GeForce RTX 3080 Ti | |
| NVIDIA GeForce RTX 3090 | |
| AMD Radeon RX 6950 XT | |
| Far Cry 6 - 1920x1080 Ultra Graphics Quality + HD Textures + DXR AA:T | |
| NVIDIA GeForce RTX 4080 | |
| AMD Radeon RX 7900 XTX | |
| AMD Radeon RX 7900 XT | |
| NVIDIA GeForce RTX 4090 | |
| AMD Radeon RX 6950 XT | |
| NVIDIA GeForce RTX 3080 Ti | |
| NVIDIA GeForce RTX 4080 | |
| NVIDIA GeForce RTX 3090 | |
| AMD Radeon RX 6800 | |
| AMD Radeon RX 6950 XT | |
| Cyberpunk 2077 1.6 | |
| 3840x2160 Ray Tracing Ultra Preset (DLSS off) | |
| NVIDIA GeForce RTX 4090 (1.6) | |
| NVIDIA GeForce RTX 4080 (1.6) | |
| NVIDIA GeForce RTX 4080 (1.61) | |
| NVIDIA GeForce RTX 3090 (1.6) | |
| AMD Radeon RX 7900 XTX (1.61) | |
| NVIDIA GeForce RTX 3080 Ti (1.61) | |
| AMD Radeon RX 7900 XT (1.61) | |
| AMD Radeon RX 6950 XT (1.61) | |
| AMD Radeon RX 6800 (1.61) | |
| 1920x1080 Ray Tracing Ultra Preset (DLSS off) | |
| NVIDIA GeForce RTX 4090 (1.6) | |
| NVIDIA GeForce RTX 4080 (1.6) | |
| NVIDIA GeForce RTX 4080 (1.61) | |
| NVIDIA GeForce RTX 3080 Ti (1.61) | |
| NVIDIA GeForce RTX 3090 (1.6) | |
| AMD Radeon RX 7900 XTX (1.61) | |
| AMD Radeon RX 7900 XT (1.61) | |
| AMD Radeon RX 6950 XT (1.61) | |
| AMD Radeon RX 6800 (1.61) | |
| Control - 1920x1080 High Quality Preset & High Ray Tracing Preset (DX12) | |
| NVIDIA GeForce RTX 4090 | |
| NVIDIA GeForce RTX 4080 | |
| NVIDIA GeForce RTX 4080 | |
| AMD Radeon RX 7900 XTX | |
| NVIDIA GeForce RTX 3080 Ti | |
| AMD Radeon RX 7900 XT | |
| AMD Radeon RX 6950 XT | |
| AMD Radeon RX 6950 XT | |
| Ghostwire Tokyo - 1920x1080 Highest Settings + Maximum Ray Tracing | |
| NVIDIA GeForce RTX 4090 | |
| NVIDIA GeForce RTX 4080 | |
| NVIDIA GeForce RTX 4080 | |
| AMD Radeon RX 7900 XTX | |
| NVIDIA GeForce RTX 3080 Ti | |
| AMD Radeon RX 7900 XT | |
| AMD Radeon RX 6950 XT | |
| The Callisto Protocol - 1920x1080 Ultra Preset (without FSR Upscaling) + Full Ray-Tracing | |
| AMD Radeon RX 7900 XTX | |
| NVIDIA GeForce RTX 4090 | |
| AMD Radeon RX 7900 XT | |
| NVIDIA GeForce RTX 4080 | |
| AMD Radeon RX 6950 XT | |
| NVIDIA GeForce RTX 3080 Ti | |
| AMD Radeon RX 6800 | |
| Spider-Man Miles Morales - 1920x0180 Very High Preset + Ray-Tracing AA:T | |
| NVIDIA GeForce RTX 4090 | |
| NVIDIA GeForce RTX 4080 | |
| AMD Radeon RX 7900 XTX | |
| NVIDIA GeForce RTX 3080 Ti | |
| AMD Radeon RX 7900 XT | |
| AMD Radeon RX 6950 XT | |
| AMD Radeon RX 6800 | |
| baixo | média | alto | ultra | QHD | 4K DLSS | 4K | |
|---|---|---|---|---|---|---|---|
| GTA V (2015) | 188.1 | 188 | 187.7 | 164.3 | 159.2 | 183.9 | |
| The Witcher 3 (2015) | 811 | 719 | 549 | 268 | 202 | ||
| Dota 2 Reborn (2015) | 287.8 | 256.8 | 247.1 | 228.6 | 221.7 | ||
| Final Fantasy XV Benchmark (2018) | 236 | 235 | 225 | 195.7 | 116.9 | ||
| X-Plane 11.11 (2018) | 219 | 193.6 | 149.4 | 124.9 | |||
| Far Cry 5 (2018) | 239 | 209 | 203 | 188 | 185 | 139 | |
| Strange Brigade (2018) | 681 | 548 | 531 | 482 | 390 | 195.1 | |
| Shadow of the Tomb Raider (2018) | 334 | 299 | 304 | 288 | 241 | 132.2 | |
| Far Cry New Dawn (2019) | 196 | 173 | 166 | 150 | 149 | 130 | |
| Metro Exodus (2019) | 300 | 256 | 212 | 177.7 | 153.7 | 103.9 | |
| Control (2019) | 240 | 240 | 235 | 162 | 82.4 | ||
| Borderlands 3 (2019) | 239 | 203 | 189.9 | 187.2 | 163.2 | 95.2 | |
| F1 2020 (2020) | 552 | 478 | 463 | 396 | 332 | 201 | |
| F1 2021 (2021) | 656 | 606 | 514 | 256 | 240 | 144.3 | |
| Far Cry 6 (2021) | 205 | 177.3 | 161.6 | 155 | 150.6 | 107 | |
| Forza Horizon 5 (2021) | 302 | 242 | 238 | 177 | 164 | 124 | |
| God of War (2022) | 274 | 271 | 229 | 164.9 | 136.3 | 95.3 | |
| GRID Legends (2022) | 318 | 287 | 254 | 237 | 233 | 163.3 | |
| Cyberpunk 2077 1.6 (2022) | 216 | 213 | 201 | 190.1 | 129.1 | 63.4 | |
| Ghostwire Tokyo (2022) | 294 | 283 | 252 | 124.6 | |||
| Tiny Tina's Wonderlands (2022) | 385 | 320 | 269 | 226 | 165.8 | 89 | |
| F1 22 (2022) | 423 | 411 | 384 | 172.8 | 113.8 | 57.9 | |
| The Quarry (2022) | 376 | 291 | 249 | 207 | 149 | 79.2 | |
| FIFA 23 (2022) | 278 | 274 | 274 | 274 | 272 | 218 | |
| A Plague Tale Requiem (2022) | 174.1 | 172.5 | 153.9 | 127 | 95.4 | 54.4 | |
| Uncharted Legacy of Thieves Collection (2022) | 145.5 | 144.7 | 142.1 | 140.4 | 125.6 | 77.7 | |
| Call of Duty Modern Warfare 2 2022 (2022) | 317 | 286 | 230 | 219 | 170 | 158 | 112 |
| Spider-Man Miles Morales (2022) | 198.6 | 180.3 | 178.2 | 157.3 | 202 | 103.9 | |
| The Callisto Protocol (2022) | 231 | 213 | 172 | 171 | 138 | 85 | |
| Need for Speed Unbound (2022) | 177.8 | 171.4 | 160.4 | 140.3 | 137.8 | 104.5 |
Emissões da KFA2 GeForce RTX 4080 SG
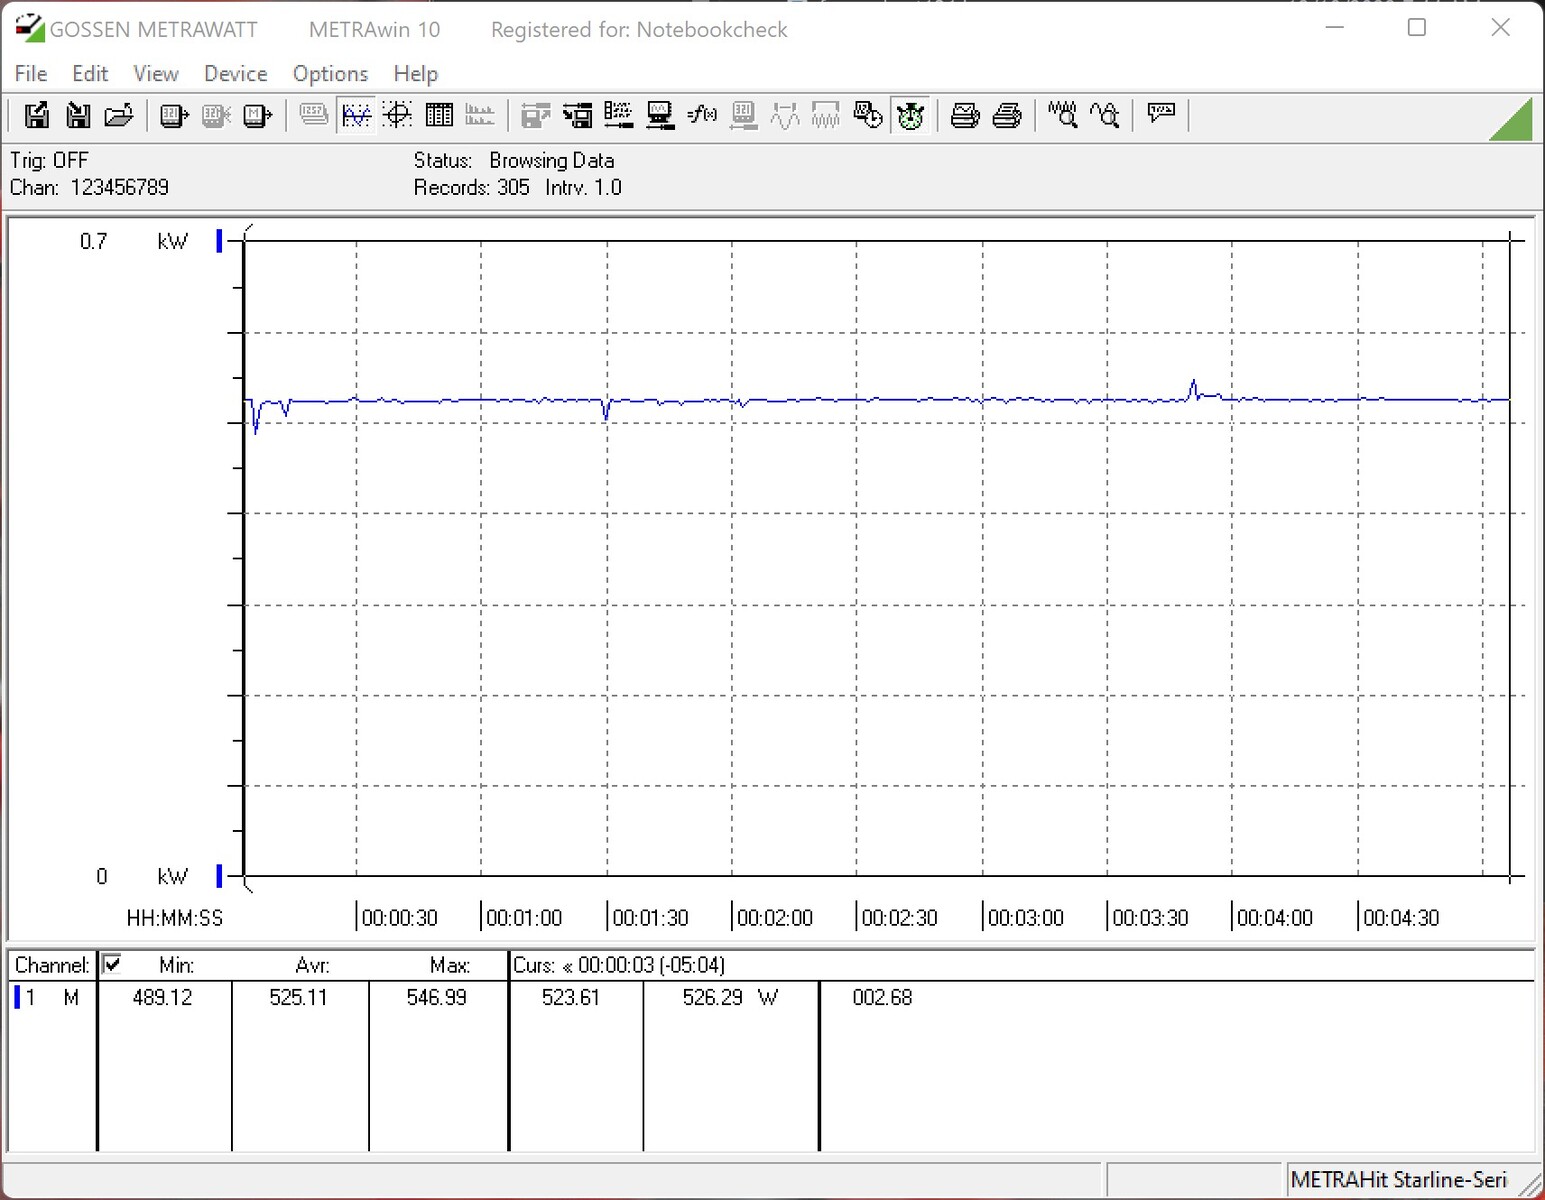
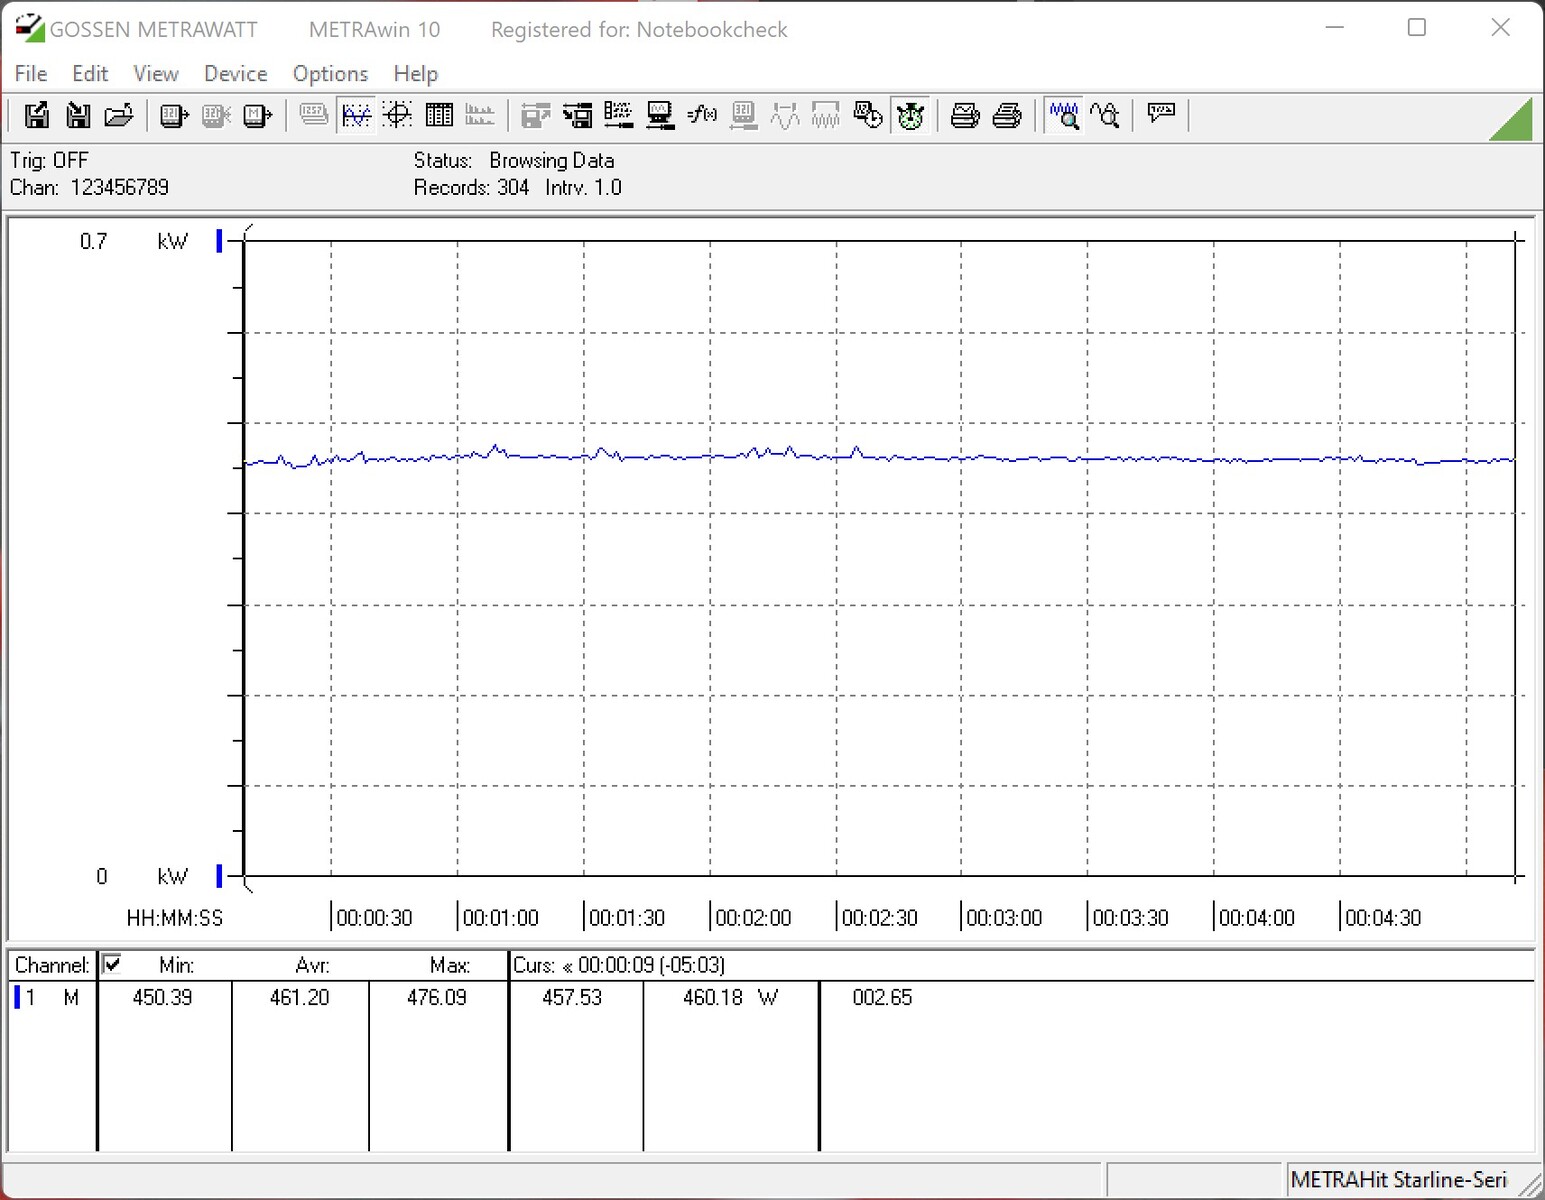
A KFA2 GeForce RTX 4080 SG tem um consumo de energia avaliado em 320 watts - que está no mesmo nível de uma placa Founders Edition da Nvidia. Embora seu uso de energia tenha permanecido inalterado em comparação com uma GeForce RTX 3080o RTX 4080 superou consideravelmente seu predecessor em nossos testes. A eficiência energética foi melhorada por uma margem impressionante com Ada Lovelace e o nó de 4 nm. O objetivo de potência do KFA2 GeForce RTX 4080 SG pode ser aumentado em até 31 por cento, permitindo que somente a placa gráfica consuma até 420 watts de potência. Usando o conector de 12VHPWR (incluído na caixa como um adaptador com conectores PCIe de 3x6+2 pinos), o consumo de energia da GPU ainda está dentro dos limites permitidos. A fim de evitar problemas de alimentação de energia, recomendamos o uso de três cabos separados para conectar a placa à PSU
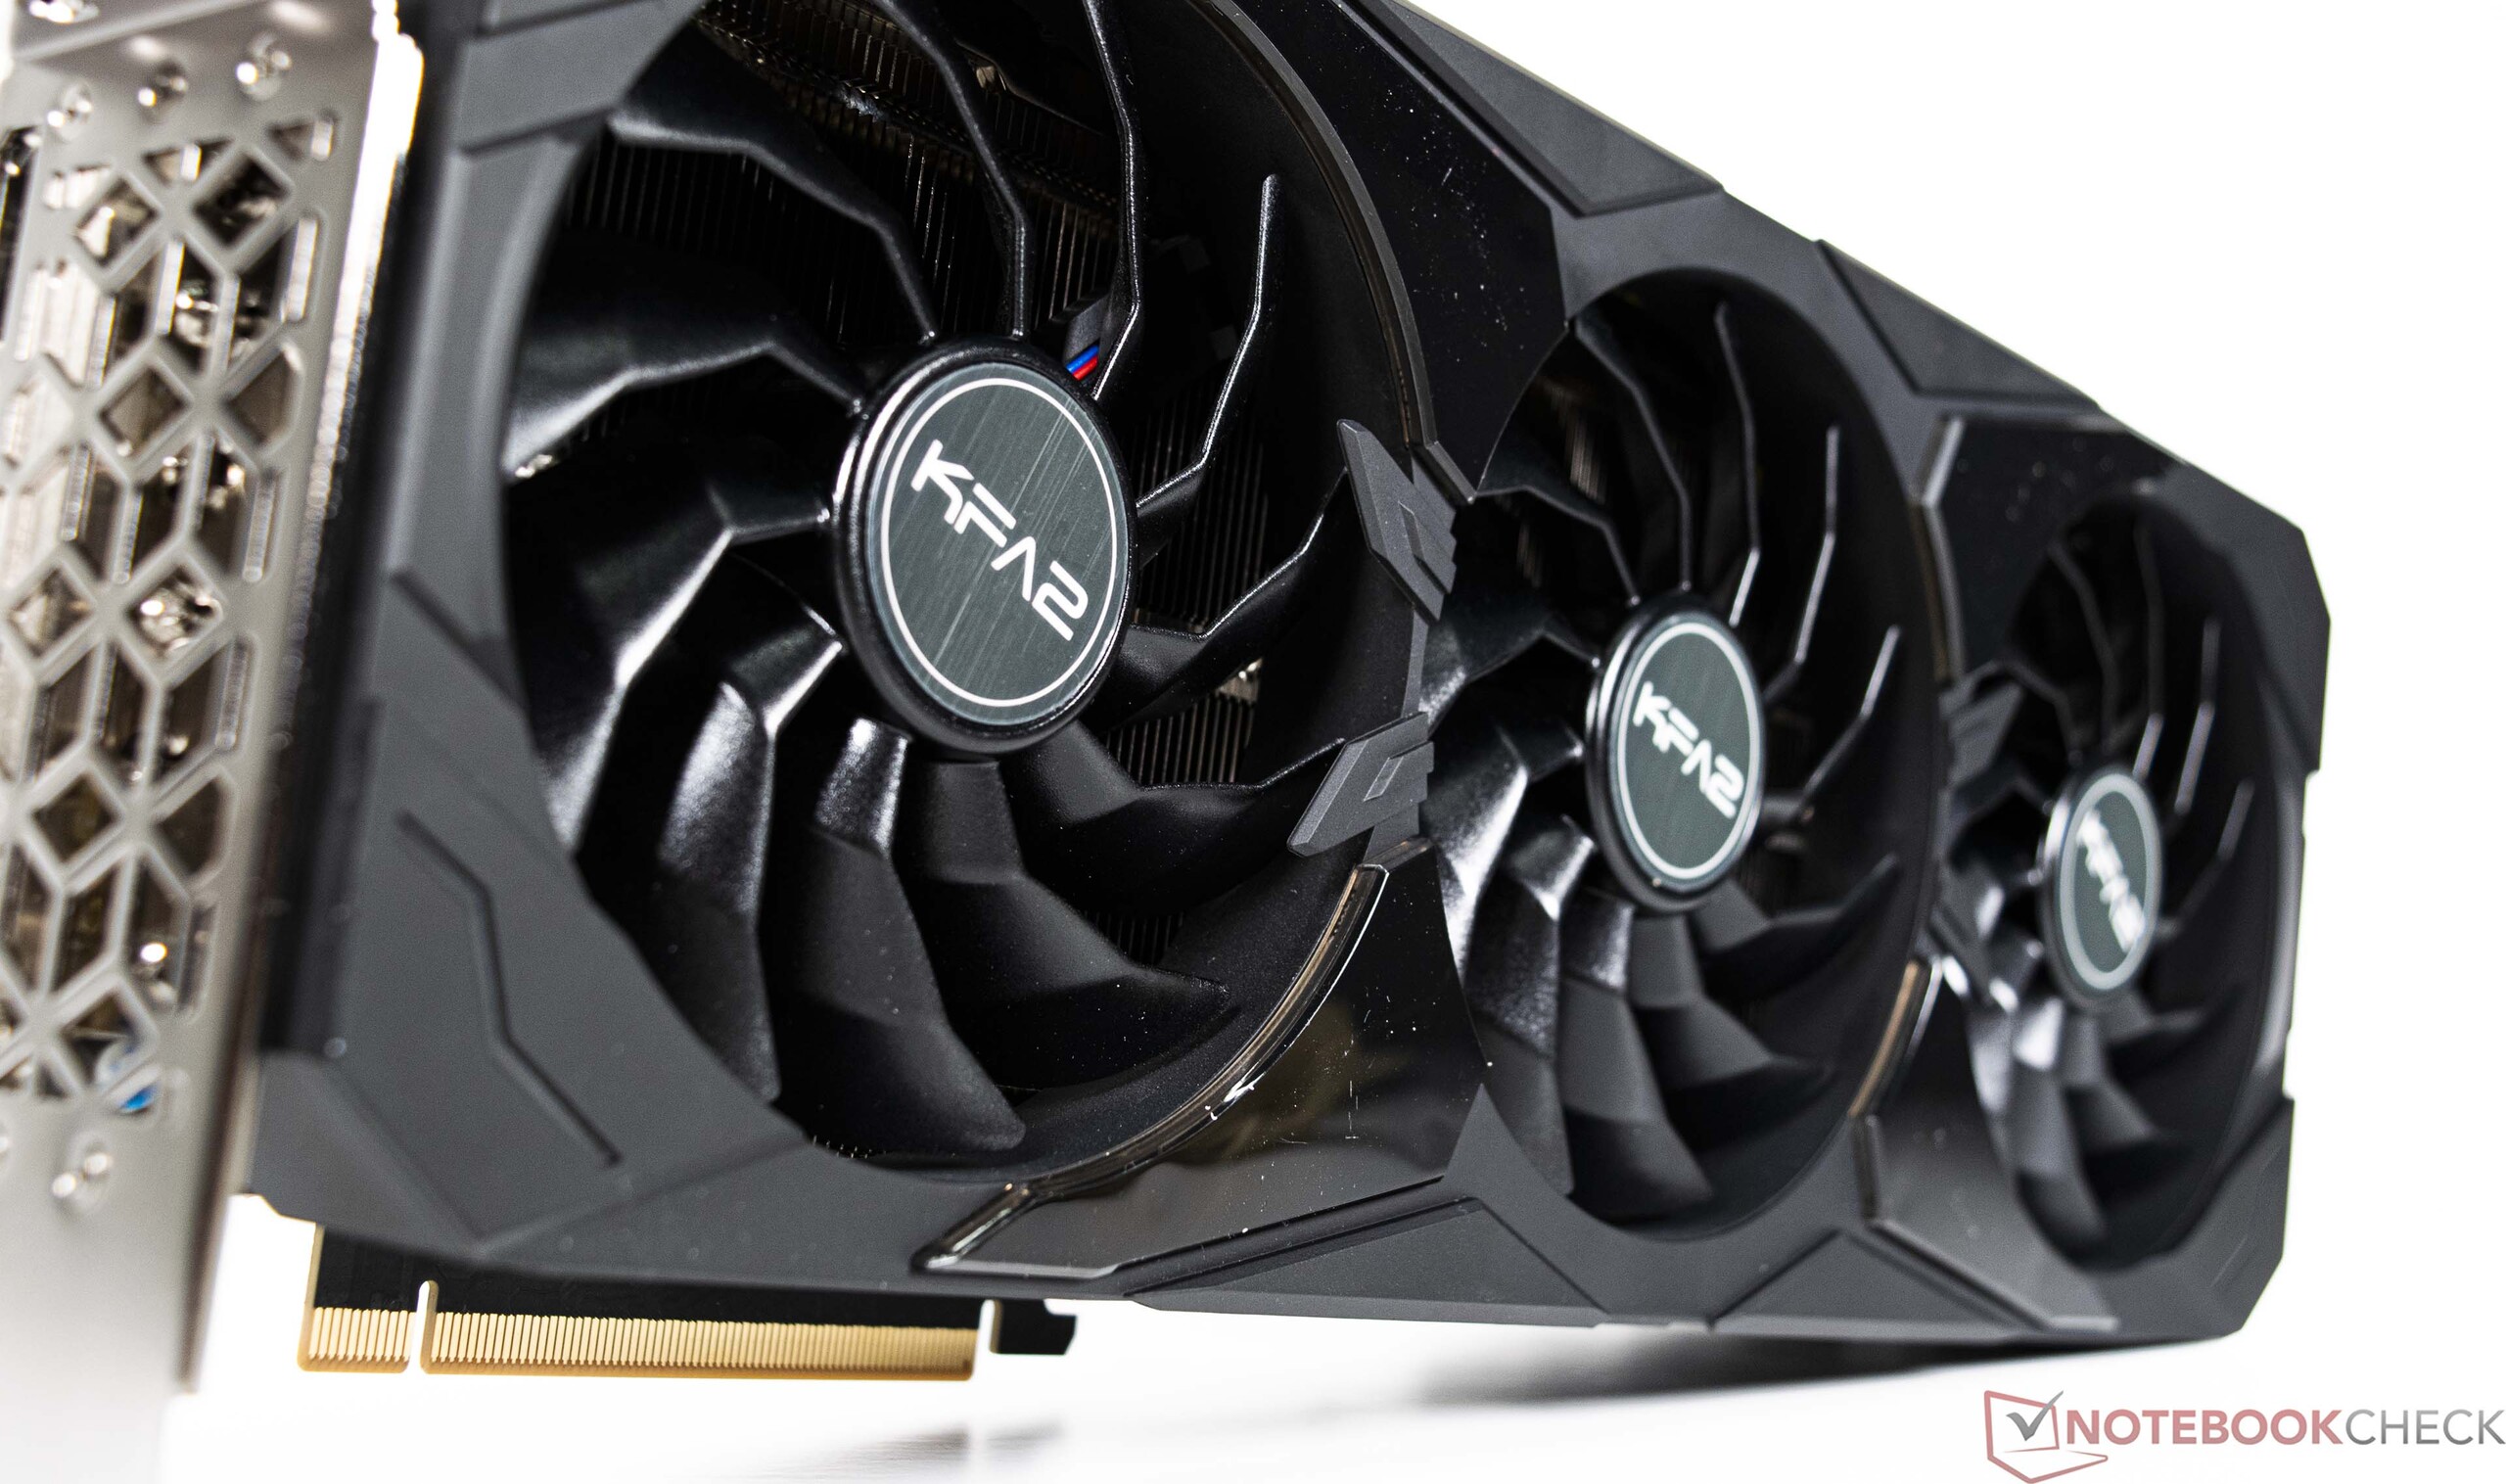
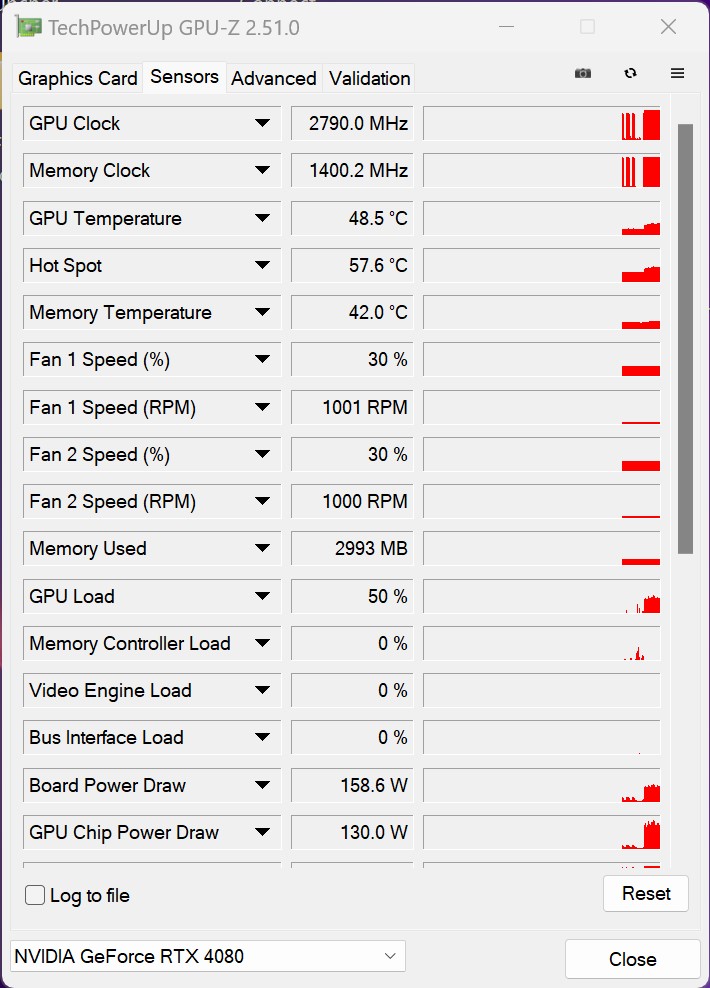
Durante o teste de estresse, o KFA2 GeForce RTX 4080 SG atingiu 320 watts sem esforço, e registramos uma temperatura GPU de cerca de 74°C (165°F). No entanto, a temperatura do ponto de acesso da GPU chegou a 93°C (199°F) sob carga. A VRAM permaneceu surpreendentemente fria a 58°C (136°F). A placa KFA2 depende de um dissipador de calor maciço com três ventiladores axiais de 102 mm para dissipar o calor. Opcionalmente, outro ventilador de 102 mm pode ser instalado na parte de trás da placa. Infelizmente, não pudemos testá-lo devido à incompatibilidade com nossa placa-mãe. Os ventiladores geraram um som de zumbido silencioso que ainda podia ser ouvido com a caixa do computador fechada (42 dB(A) de ruído com base em nossa medição). Quando aumentamos o limite de potência, os níveis de ruído da GPU subiram para 43 dB(A). Durante os jogos (The Witcher 3, 1080p, Ultra preset), nossa configuração produziu um ruído agradável de 36 dB(A). Também não notamos nenhum choramingar irritante da bobina
Em termos de consumo de energia, o KFA2 GeForce RTX 4080 SG deixa uma boa impressão e é pescoço e pescoço com o AMD Radeon RX 7900 XT - um cartão que proporciona um desempenho significativamente menor. O KFA GeForce RTX 3080 SG, que analisamos anteriormente, exigia mais potência sob carga. Em comparação com a KFA2 GeForce RTX 4090 SG, a placa gráfica menor Ada Lovelace usa 30% menos potência sob carga. No entanto, é preciso mencionar que a RTX 4090 é classificada em 450 watts e oferece um desempenho substancialmente maior
O fabricante recomenda o uso de uma PSU de 750 watts. Esta recomendação é baseada em um sistema com um AMD Ryzen 9 5900X. Mas se seu sistema tiver um processador Ryzen 9 7000 Series ou um processador Intel Raptor Lake, você deve levar em consideração o maior uso de energia destas CPUs sob carga. Portanto, recomendamos emparelhar a placa gráfica com uma PSU de 850 watts.
Barulho
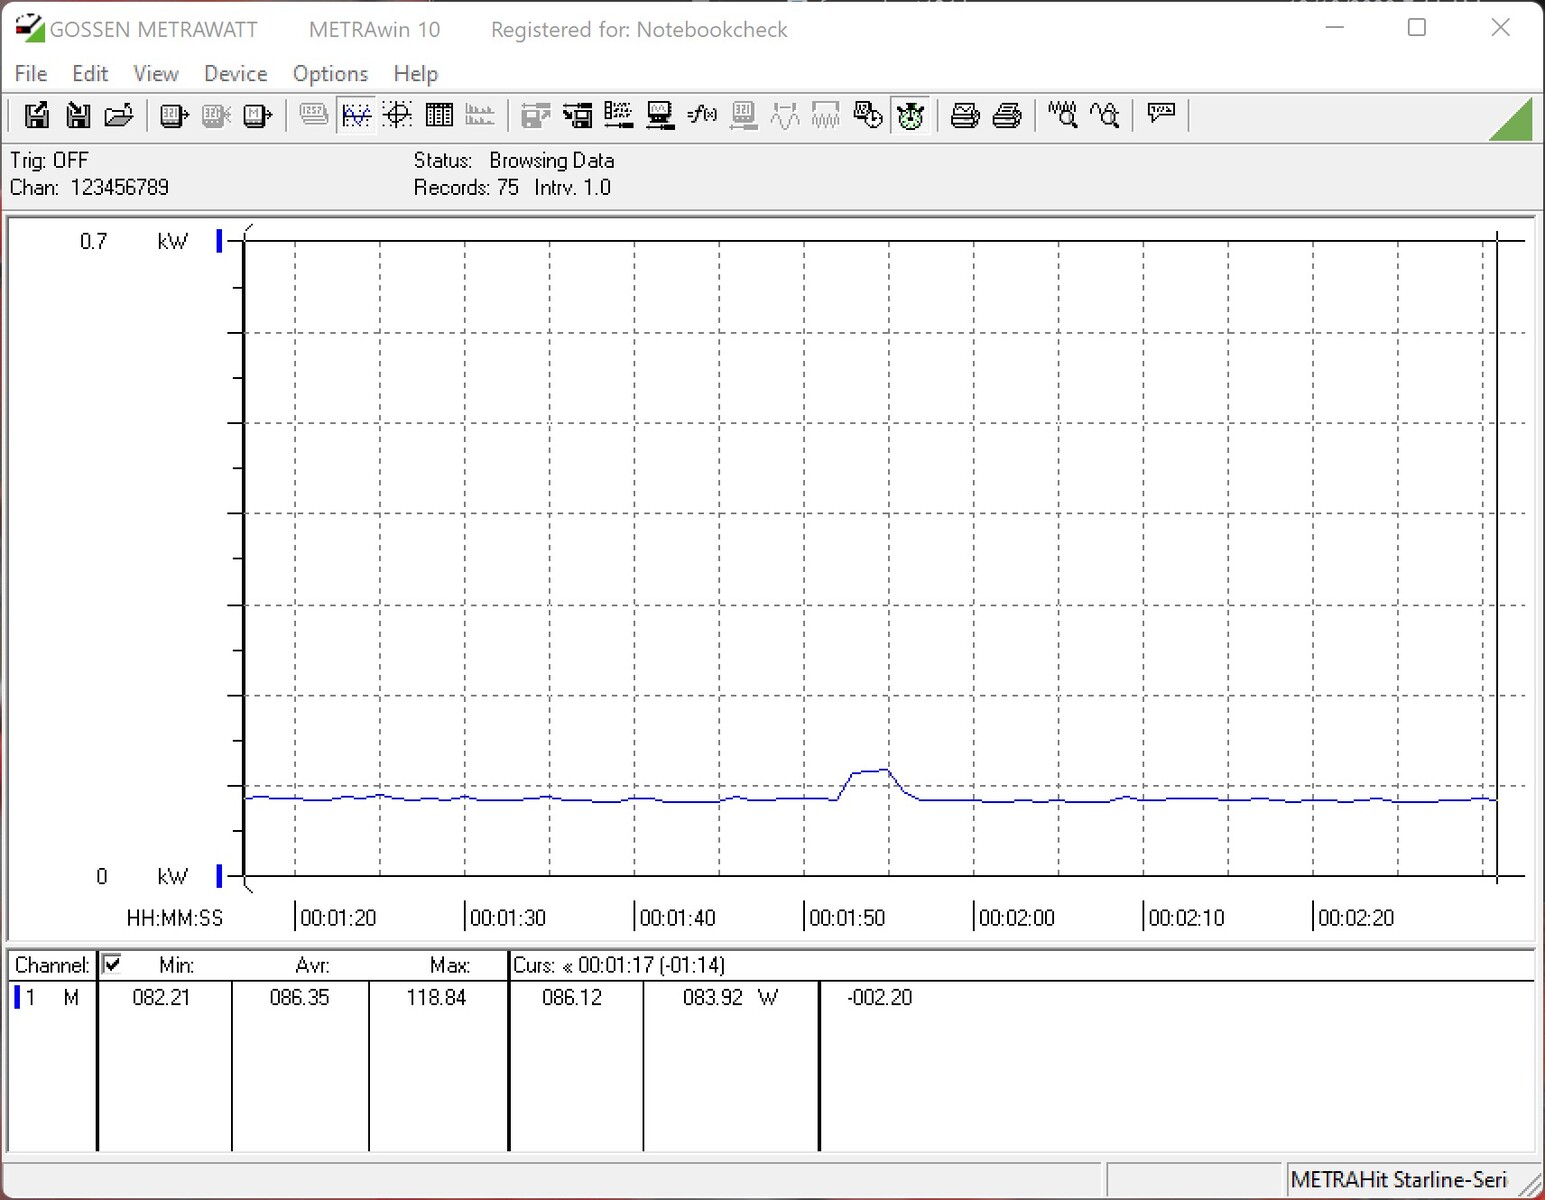
| Ocioso |
| 30.9 / 30.9 / 30.9 dB |
| Carga |
| 31 / 42.1 dB |
 | ||
30 dB silencioso 40 dB(A) audível 50 dB(A) ruidosamente alto |
||
min: | ||
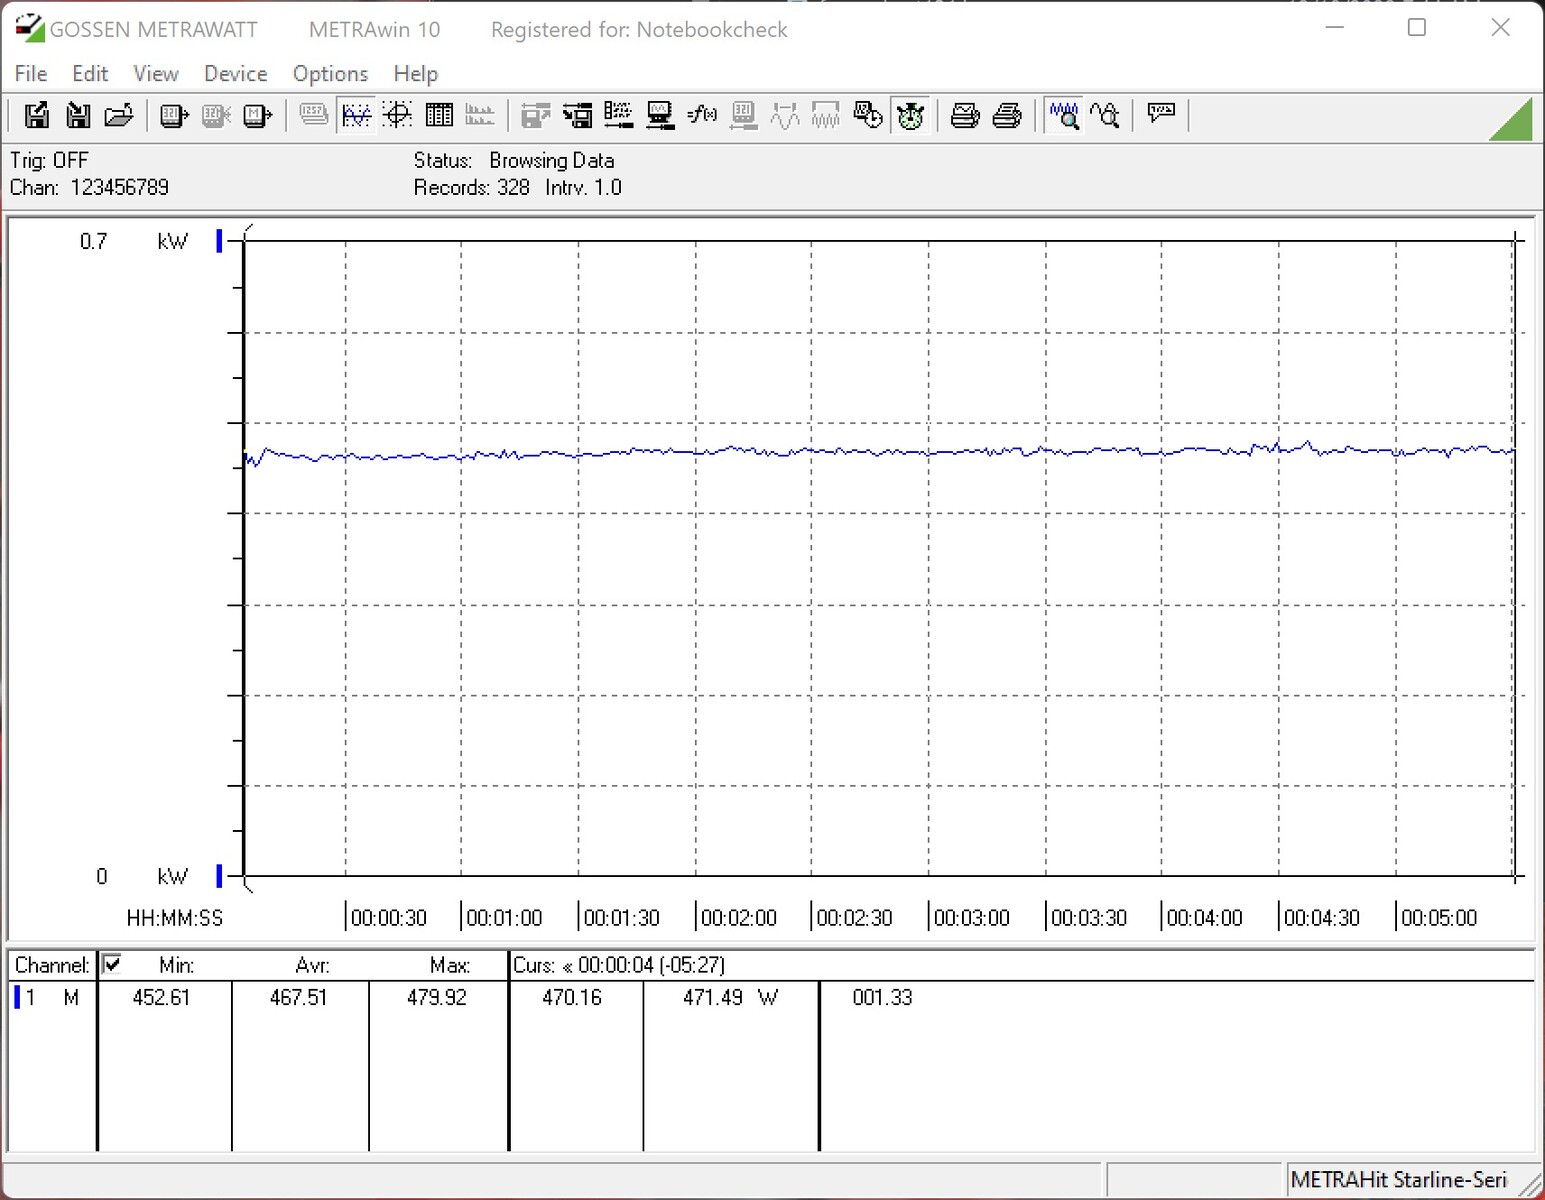
| Power Consumption / The Witcher 3 ultra (external Monitor) | |
| MSI Radeon RX 6950 XT Gaming X Trio (Idle: 79.6 W) | |
| Sapphire AMD Radeon RX 6950 XT Nitro+ Pure | |
| AMD Ryzen 7 5800X3D (Idle: 102 W) | |
| KFA2 GeForce RTX 4090 SG | |
| AMD Radeon RX 7900 XTX (Idle: 86.5 W) | |
| NVIDIA GeForce RTX 3090 Founders Edition | |
| ASUS TUF Gaming GeForce RTX 3080 Ti OC (Idle: 78.2 W) | |
| KFA2 GeForce RTX 3080 SG | |
| AMD Radeon RX 6900 XT (Idle: 99.15 W) | |
| KFA2 GeForce RTX 4080 SG (Idle: 86.4 W) | |
| AMD Radeon RX 7900 XT (Idle: 84.6 W) | |
| Power Consumption / FurMark 1.19 GPU Stress Test (external Monitor) | |
| KFA2 GeForce RTX 4090 SG | |
| MSI Radeon RX 6950 XT Gaming X Trio (Idle: 79.6 W) | |
| Sapphire AMD Radeon RX 6950 XT Nitro+ Pure | |
| AMD Radeon RX 7900 XTX (Idle: 86.5 W) | |
| NVIDIA GeForce RTX 3090 Founders Edition | |
| ASUS TUF Gaming GeForce RTX 3080 Ti OC (Idle: 78.2 W) | |
| AMD Radeon RX 7900 XT (Idle: 84.6 W) | |
| KFA2 GeForce RTX 3080 SG | |
| KFA2 GeForce RTX 4080 SG (Idle: 86.4 W) | |
| AMD Radeon RX 6900 XT (Idle: 99.15 W) | |
* ... menor é melhor
Power consumption with external monitor
Pro
Contra
Veredicto - Ótimo desempenho e muito RGB
A KFA2 GeForce RTX 4080 SG é, em todos os sentidos, uma placa gráfica extremamente rápida e é adequada para rodar jogos exigentes sem compromisso. Em comparação com a GeForce RTX 3080o cartão é capaz de proporcionar um desempenho substancialmente maior com o mesmo consumo de energia. As vantagens da nova geração de GPU é particularmente aparente quando o traçado de raio é habilitado. Junto com o DLSS 3.0 (incluindo Frame Generation), mesmo os novos jogos podem funcionar sem problemas a 2160p com os efeitos de traçado de raio ativados. Infelizmente, porém, você precisará de um GeForce RTX 4080 ou RTX 4090 para atingir este nível de desempenho. Os usuários das GPUs Nvidia mais antigas são deixados de fora da ação
O modelo KFA2 nesta revisão apresenta um design especialmente desenvolvido e um refrigerador maciço que teve um desempenho estupendamente bom durante nossa revisão. Ele é até mesmo capaz de resfriar a placa silenciosamente em aplicações 2D graças a seu modo de parada do ventilador. A GPU requer muita potência e é classificada em 320 watts, mas esta utilização de energia ainda está dentro de uma faixa razoável. Em nossa opinião, o aumento constante do consumo de energia não é o caminho certo para o futuro
A KFA2 GeForce RTX 4080 SG é uma ótima placa gráfica e nos impressionou completamente com seu alto desempenho em jogos. A ampla variedade de iluminação RGB chama a atenção para o refrigerador maciço.
A placa gráfica é alimentada através de um conector de 12VHPWR. As opiniões podem estar divididas sobre este conector, mas ainda não encontramos nenhum problema com ele. O único problema é que pensamos que o conector de 12VHPWR é colocado em um ponto abaixo do ideal. Devido ao quanto a placa gráfica fica acima do slot PCIe, espaço suficiente deve ser alocado ao grande cabo adaptador para que ele não fique dobrado bem ao lado da GPU. Isto poderia causar problemas de espaço em muitos casos de computadores
O KFA2 GeForce RTX 4080 SG está competindo w

