Lenovo IdeaPad Gaming 3i 15 G6 Laptop Review: Orçamento Laptop para jogos com tela fraca
A série IdeaPad Gaming da Lenovo é a porta de entrada acessível para os laptops de jogos da Lenovo com foco no que é importante, ou seja, o desempenho dos jogos, sem sinos e apitos. A 6ª geração do IdeaPad Gaming 3i 15 é baseada na atual Intel Tiger Lake, e vem com um Nvidia GeForce RTX 3050 Ti, 16 GB de RAM, um SSD PCIe de 512 GB, e uma tela IPS FHD de 15 polegadas. Este modelo exato não é vendido atualmente nos EUA. Há, entretanto, um dispositivo baseado no Intel Core i7-11370H com 8 GB de RAM e um SSD de 256 GB com preço de US$1.000
Possíveis concorrentes em comparação
Avaliação | Data | Modelo | Peso | Altura | Size | Resolução | Preço |
|---|---|---|---|---|---|---|---|
| 79.7 % v7 (old) | 03/2022 | Lenovo Ideapad Gaming 3 15IHU-82K1002RGE i5-11300H, GeForce RTX 3050 Ti Laptop GPU | 2 kg | 24.2 mm | 15.60" | 1920x1080 | |
| 82.7 % v7 (old) | 10/2021 | Dell G15 5515 R7 5800H, GeForce RTX 3050 Ti Laptop GPU | 2.4 kg | 24.9 mm | 15.60" | 1920x1080 | |
| 81.7 % v7 (old) | 11/2021 | Gigabyte G5 GD i5-11400H, GeForce RTX 3050 4GB Laptop GPU | 2.1 kg | 31.6 mm | 15.60" | 1920x1080 | |
| 81.4 % v7 (old) | 12/2021 | Medion Erazer Deputy P25 R7 5800H, GeForce RTX 3060 Laptop GPU | 2.3 kg | 26 mm | 15.60" | 1920x1080 | |
| 83.2 % v7 (old) | 09/2021 | Schenker XMG Focus 15 i7-11800H, GeForce RTX 3050 Ti Laptop GPU | 1.9 kg | 22 mm | 15.60" | 1920x1080 | |
| 83.4 % v7 (old) | 09/2021 | Lenovo Legion 5 15ACH-82JU00C6GE-FL R7 5800H, GeForce RTX 3060 Laptop GPU | 2.5 kg | 26 mm | 15.60" | 1920x1080 |
Estojo - Jogando duro de conseguir (Into)
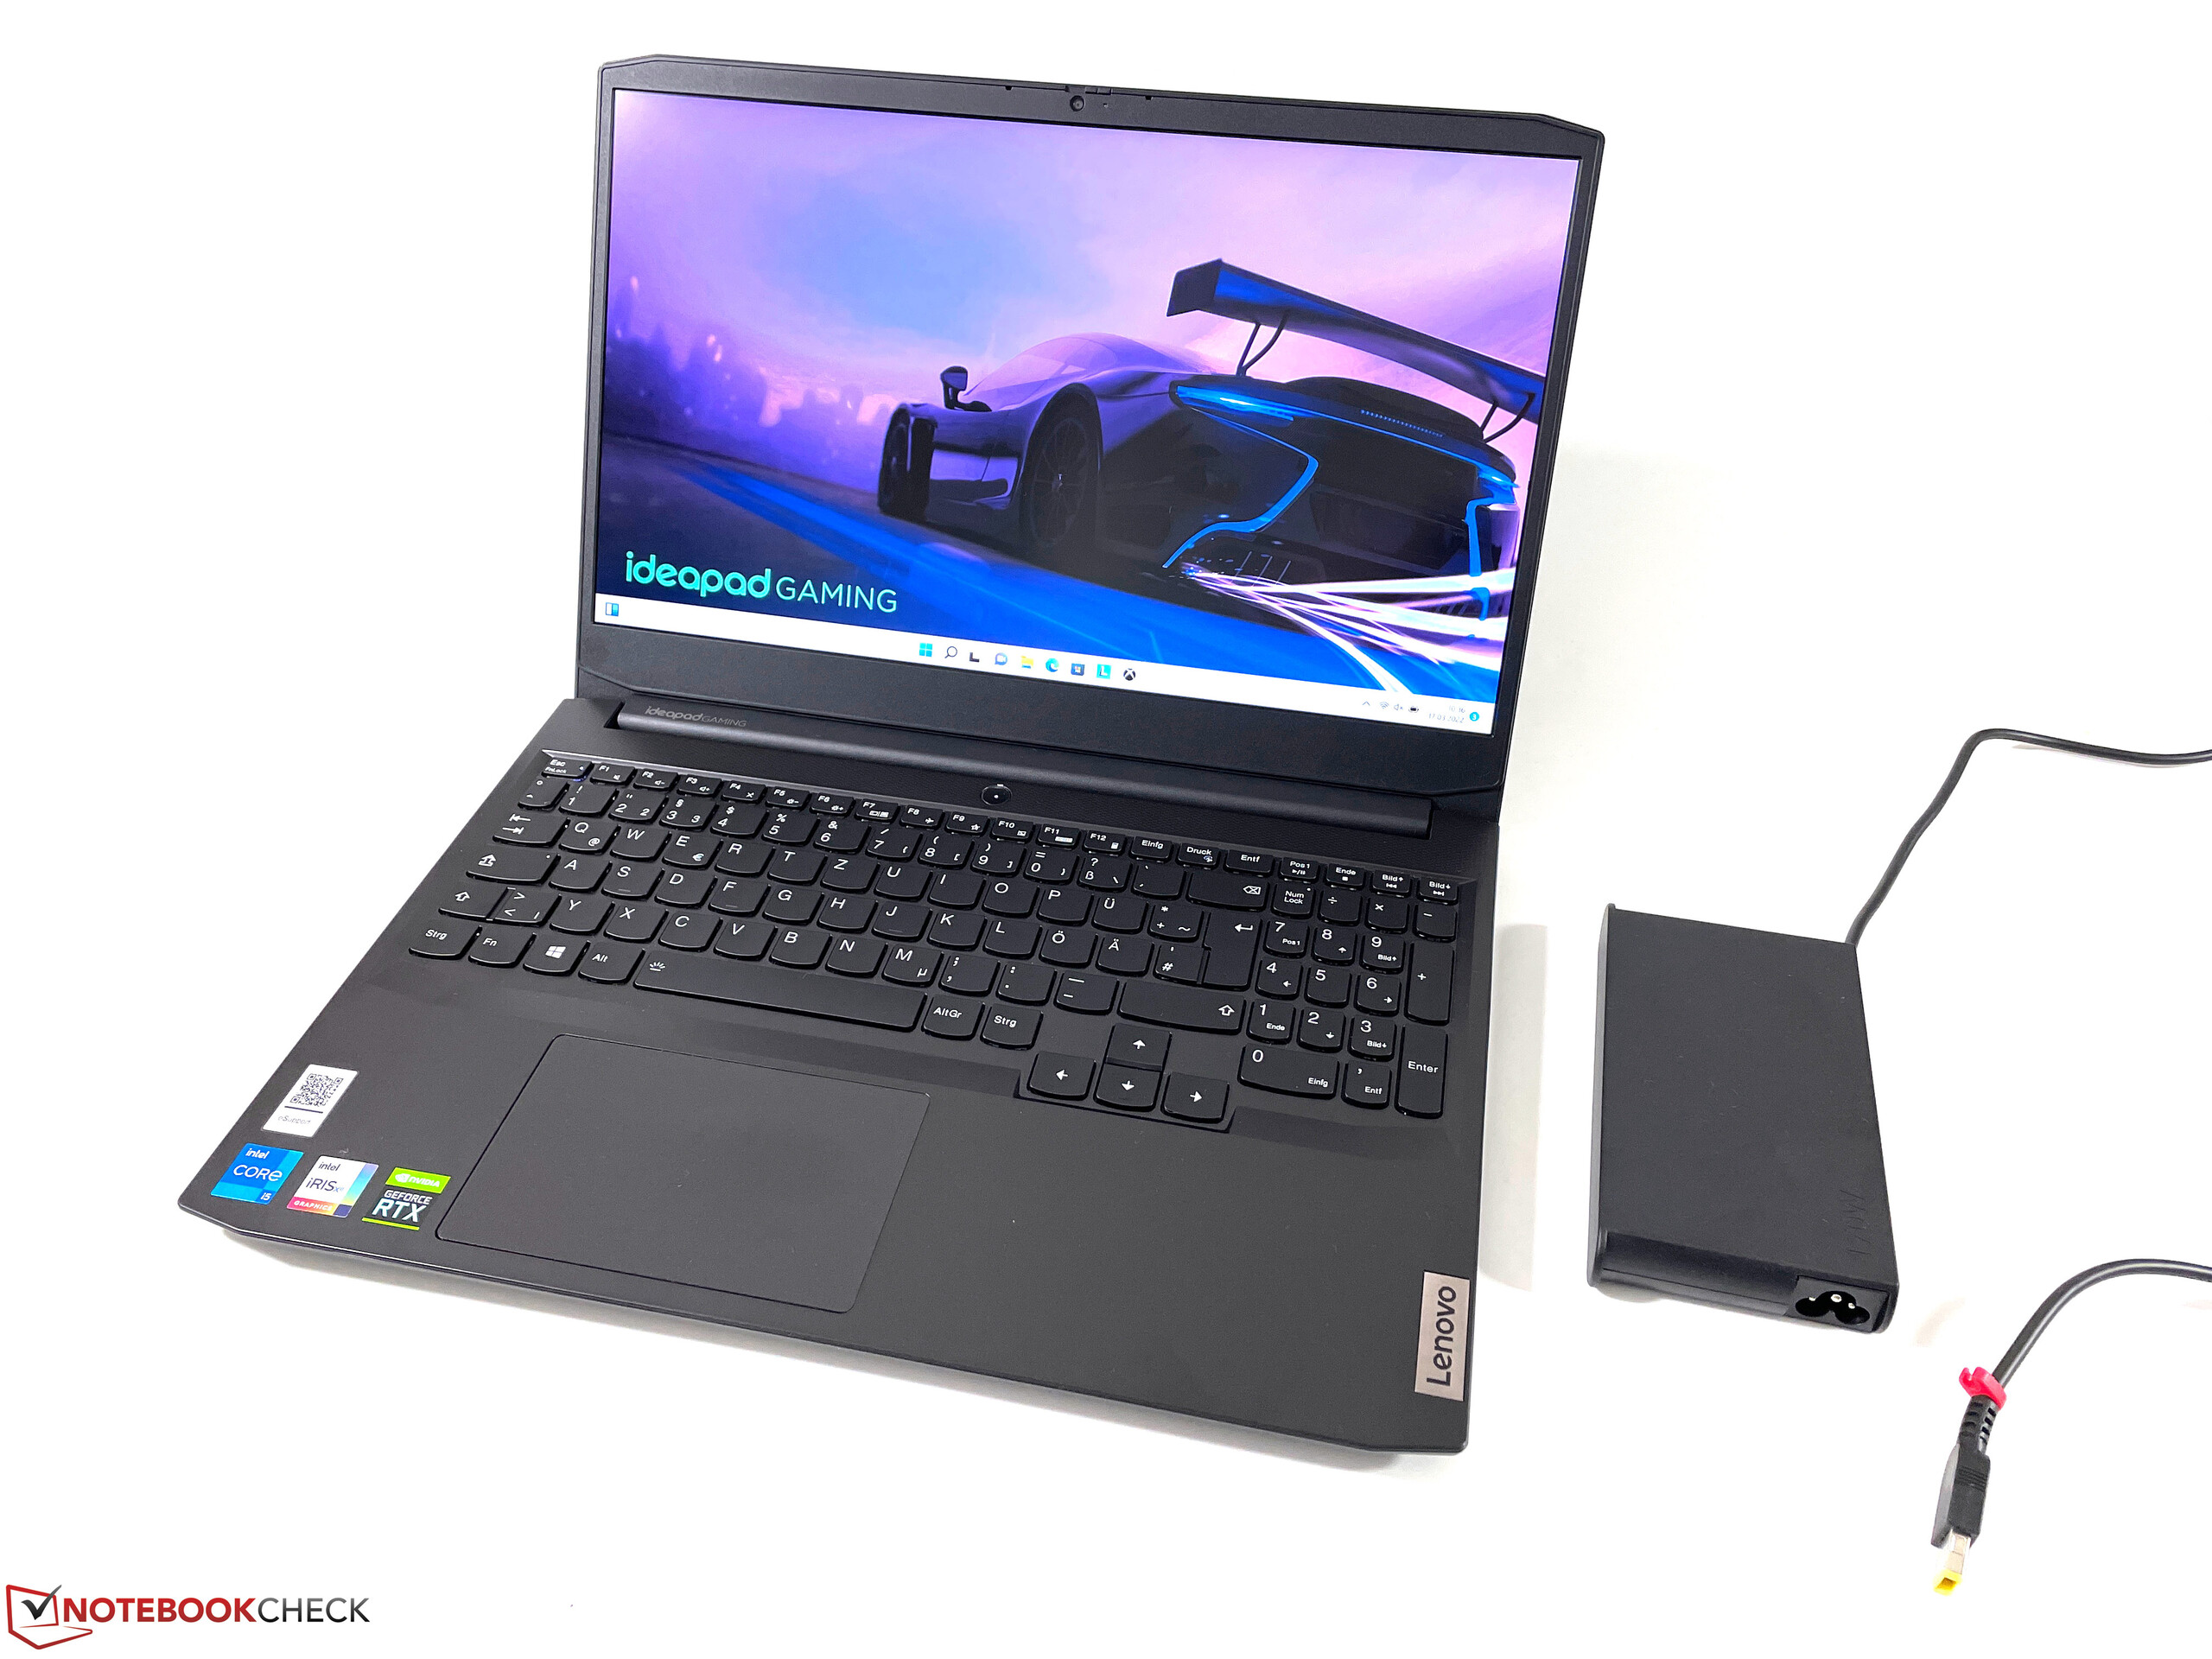
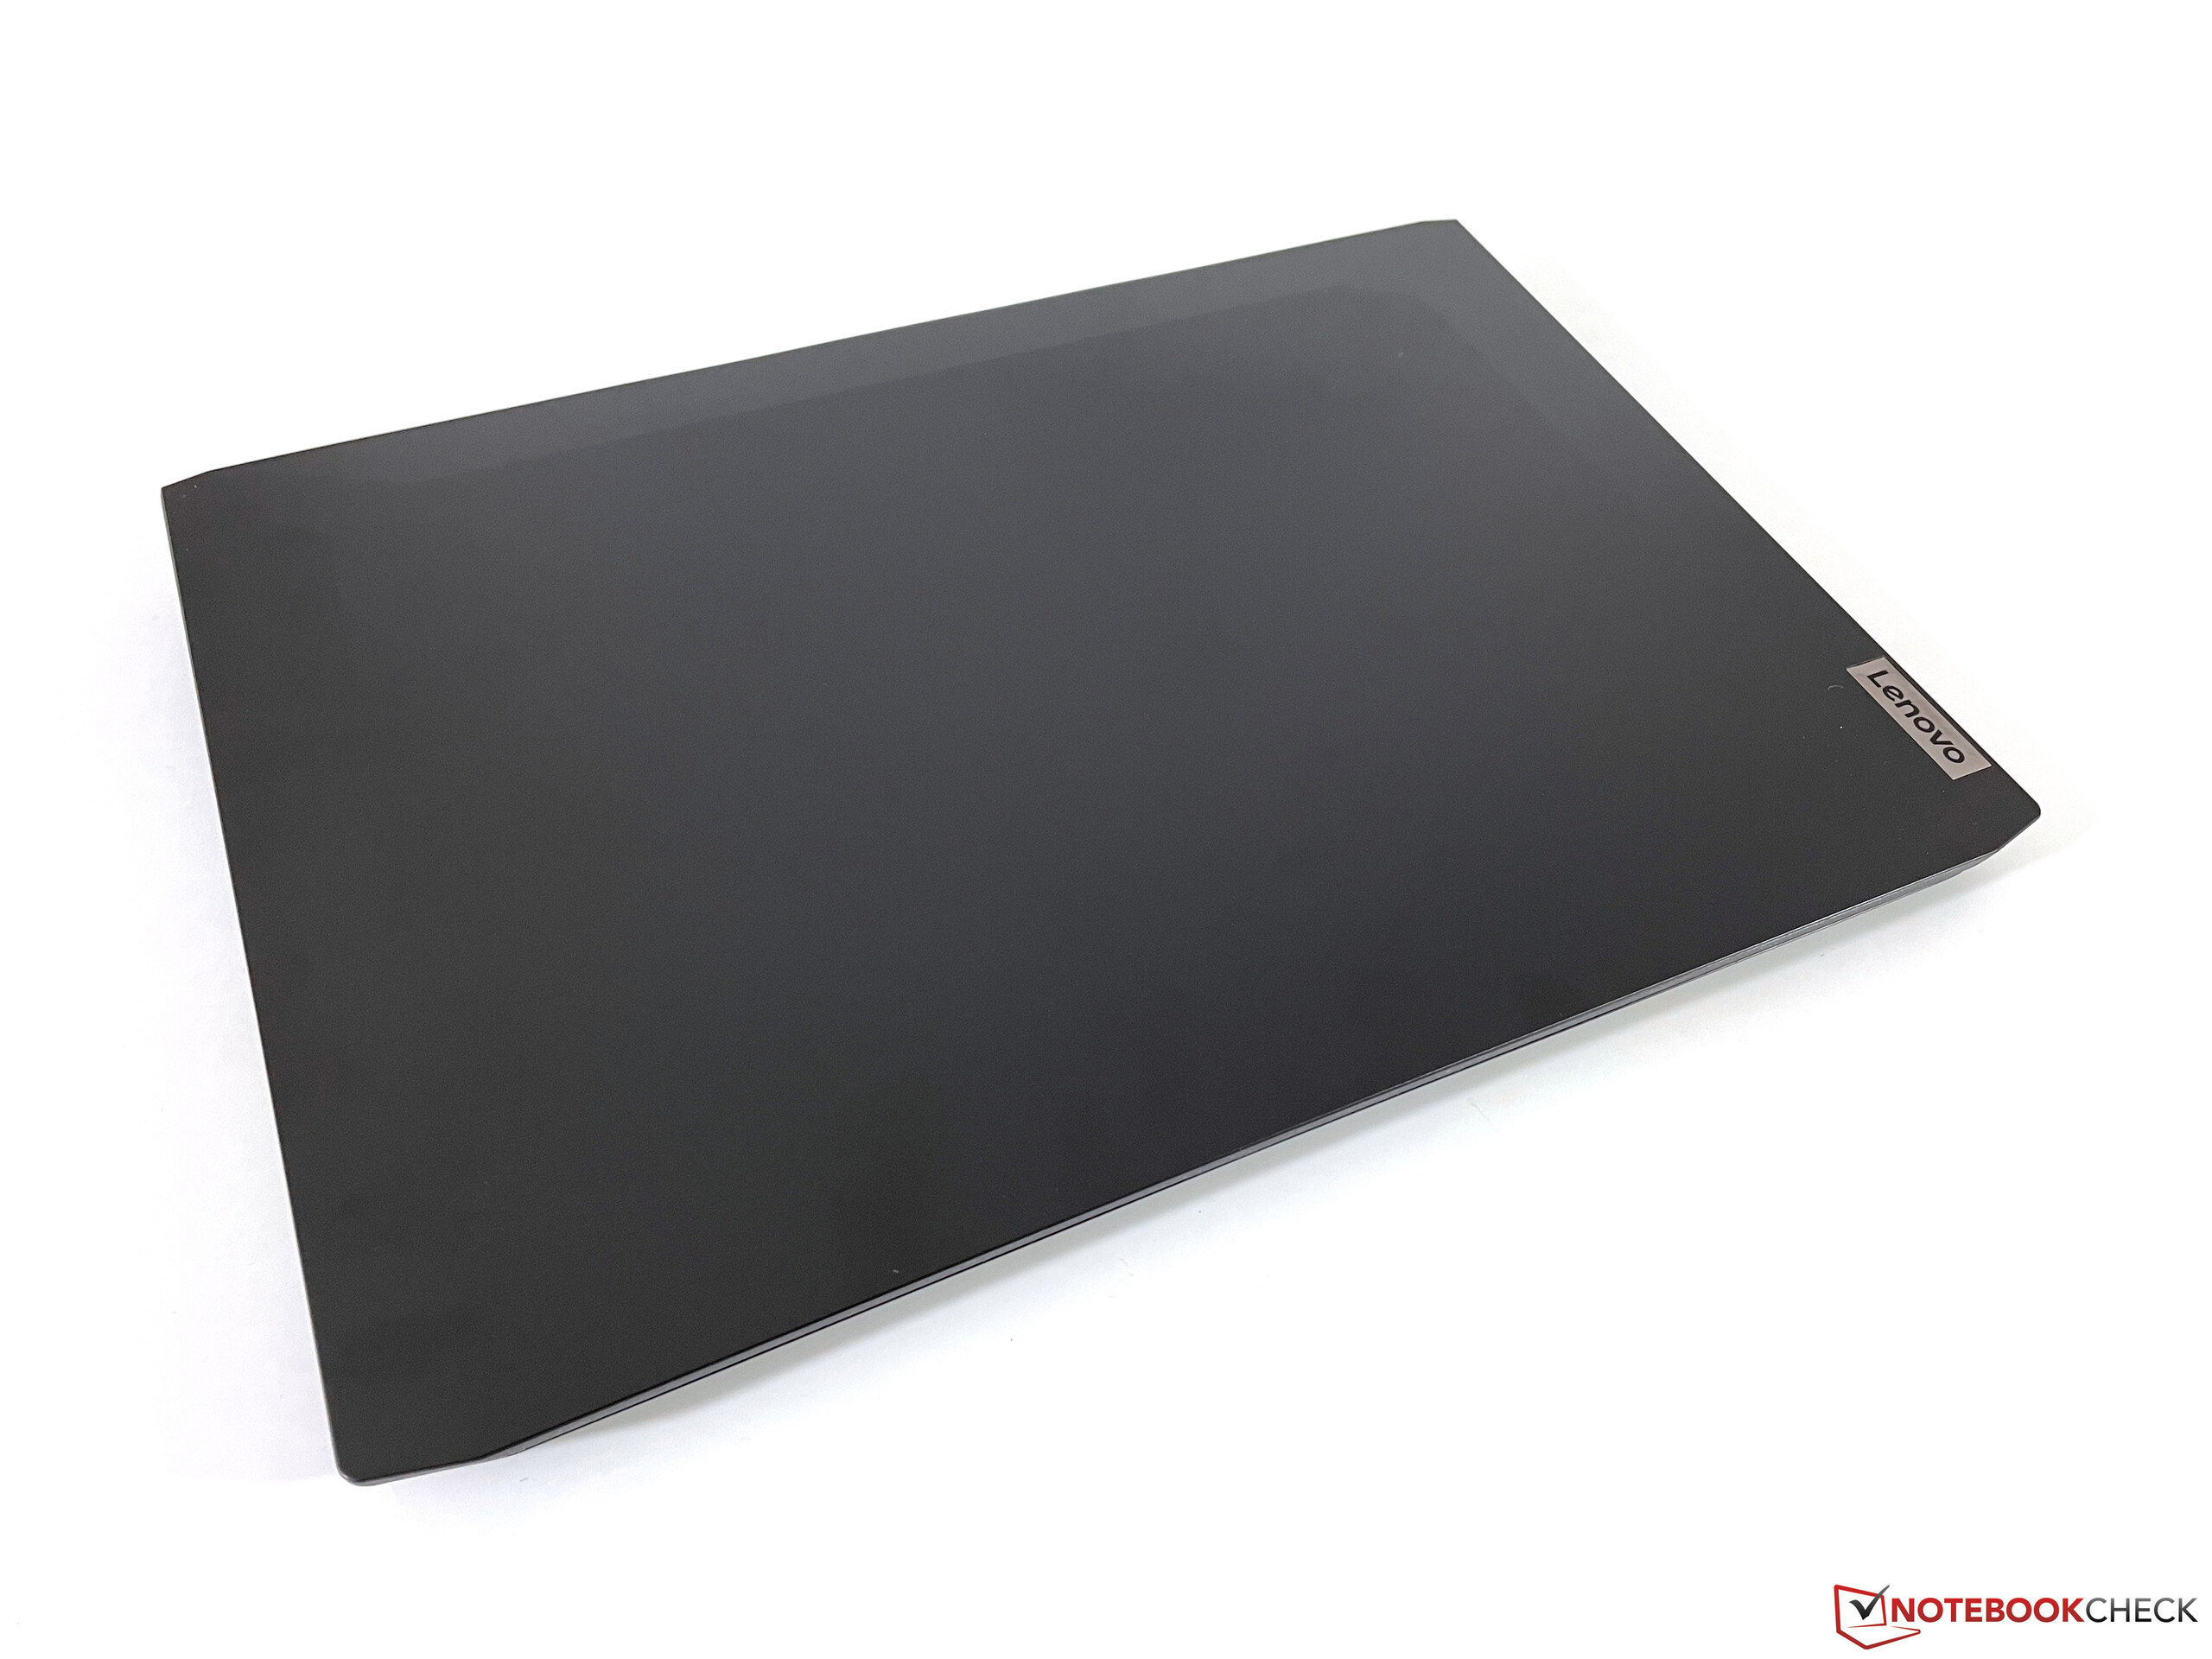
O estojo da IdeaPad Gaming 3 é feito inteiramente de plástico, e sua tampa inferior rugosa é indicativa de seu baixo preço. O design geral é utilitário e discreto. Não há elementos de design específicos para jogos, e o dispositivo não é reconhecível como um laptop para jogos. Falta até mesmo qualquer forma de efeito de iluminação da caixa.
Tanto a tampa superior quanto a unidade base apresentam um acabamento liso suscetível a impressões digitais e manchas. A rigidez da unidade base é decente, embora o centro do teclado possa ser deprimido com bastante facilidade, e a unidade inteira rangeu ligeiramente quando tentamos deformá-la.
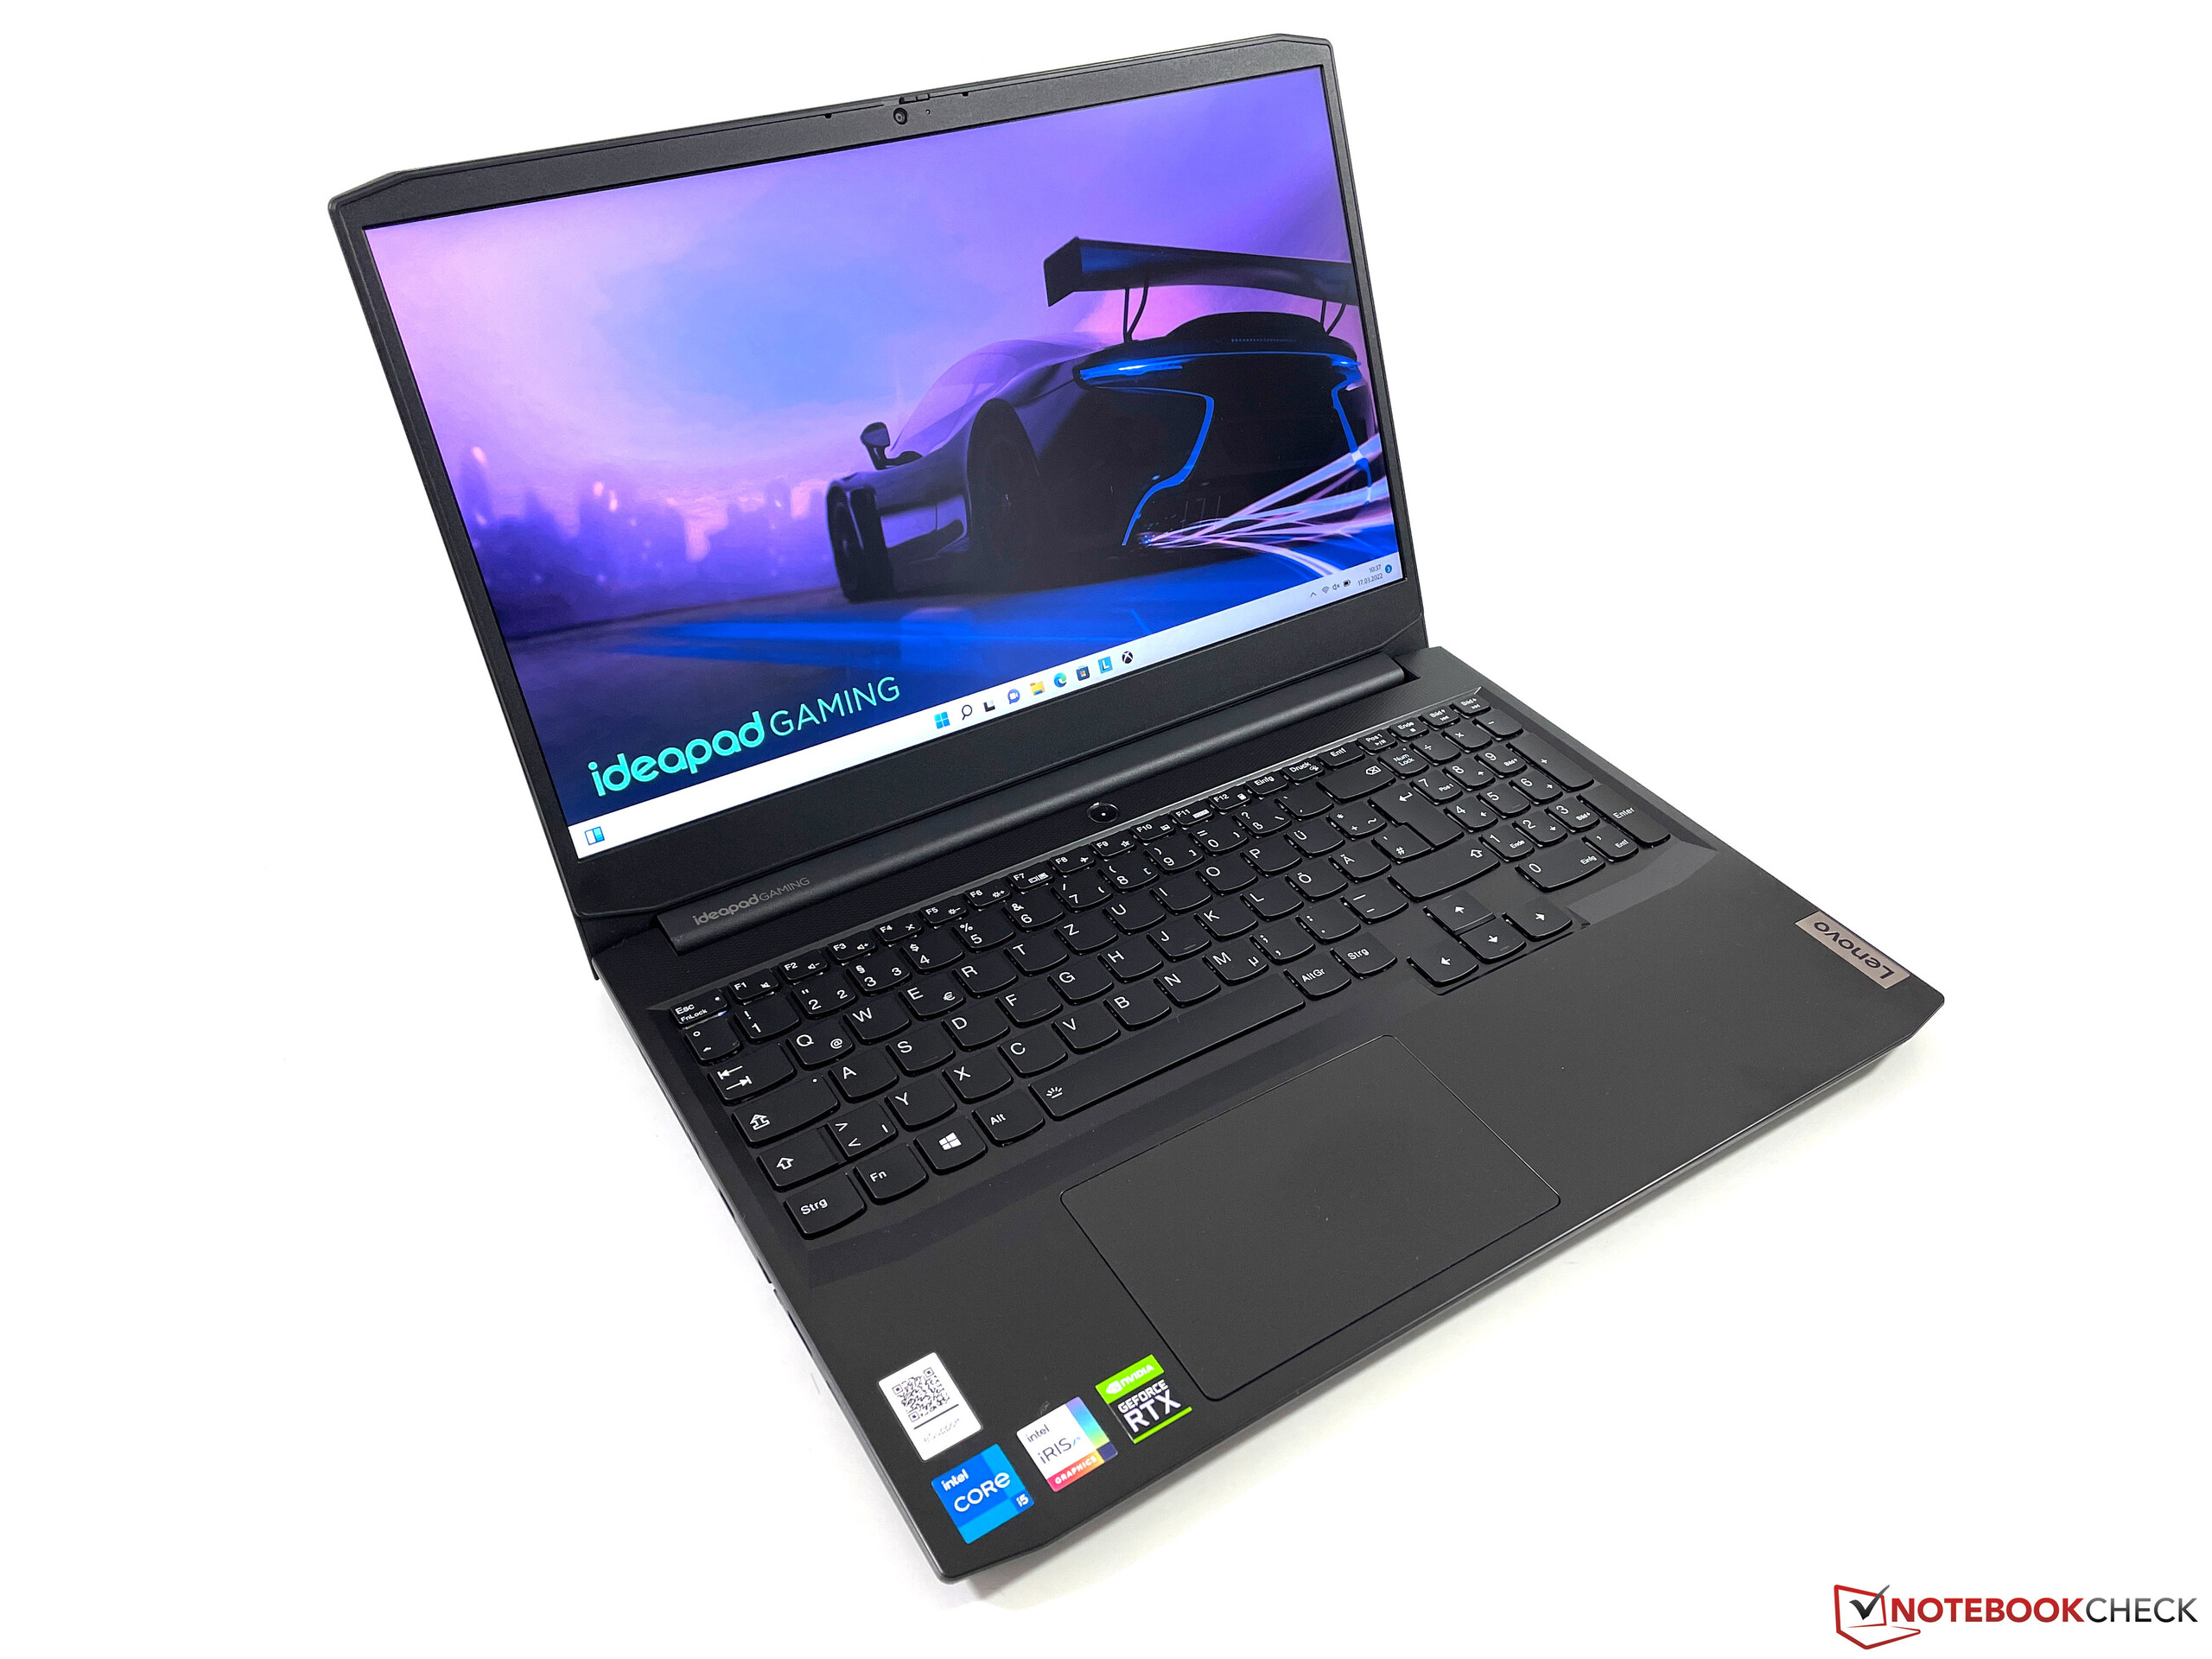
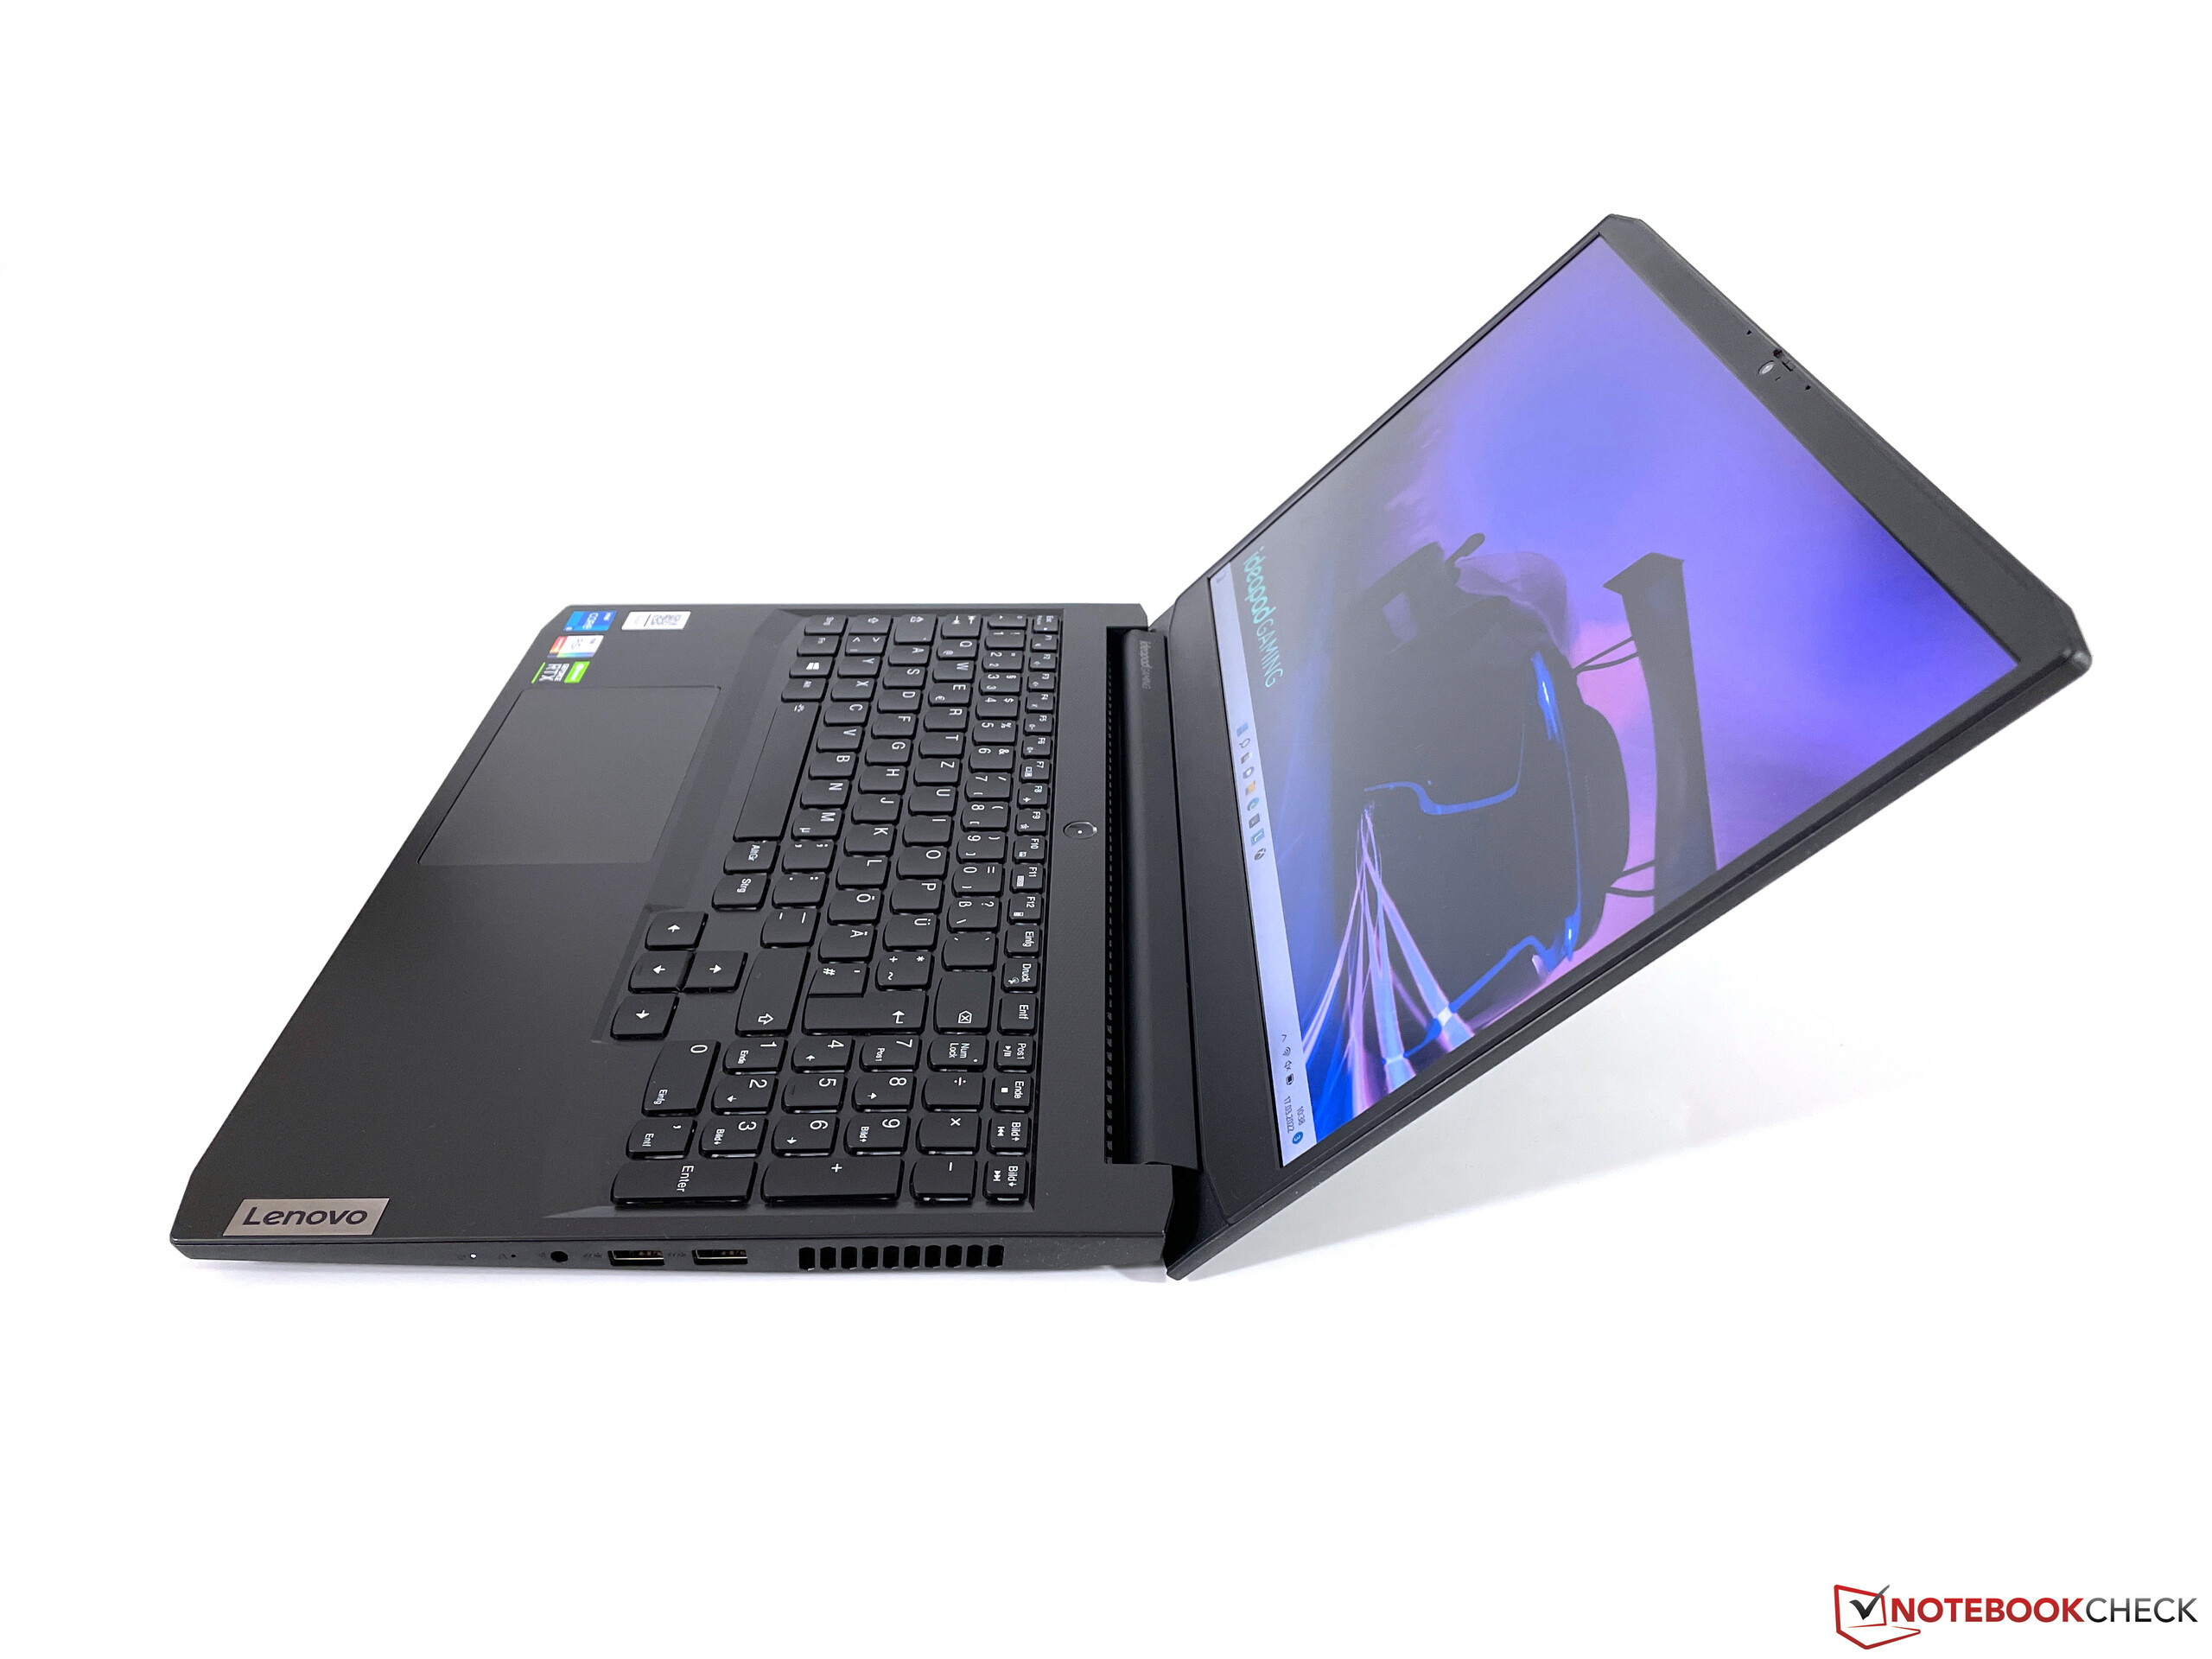
A dobradiça em si é ajustada bastante bem de modo geral, com alguns pequenos rasgos ao ajustar o display (ângulo máximo de abertura: 135°). A tampa do mostrador é visivelmente menos rígida que a base, e o painel mostrou um efeito de ondulação muito claro com pressão aplicada na parte de trás.
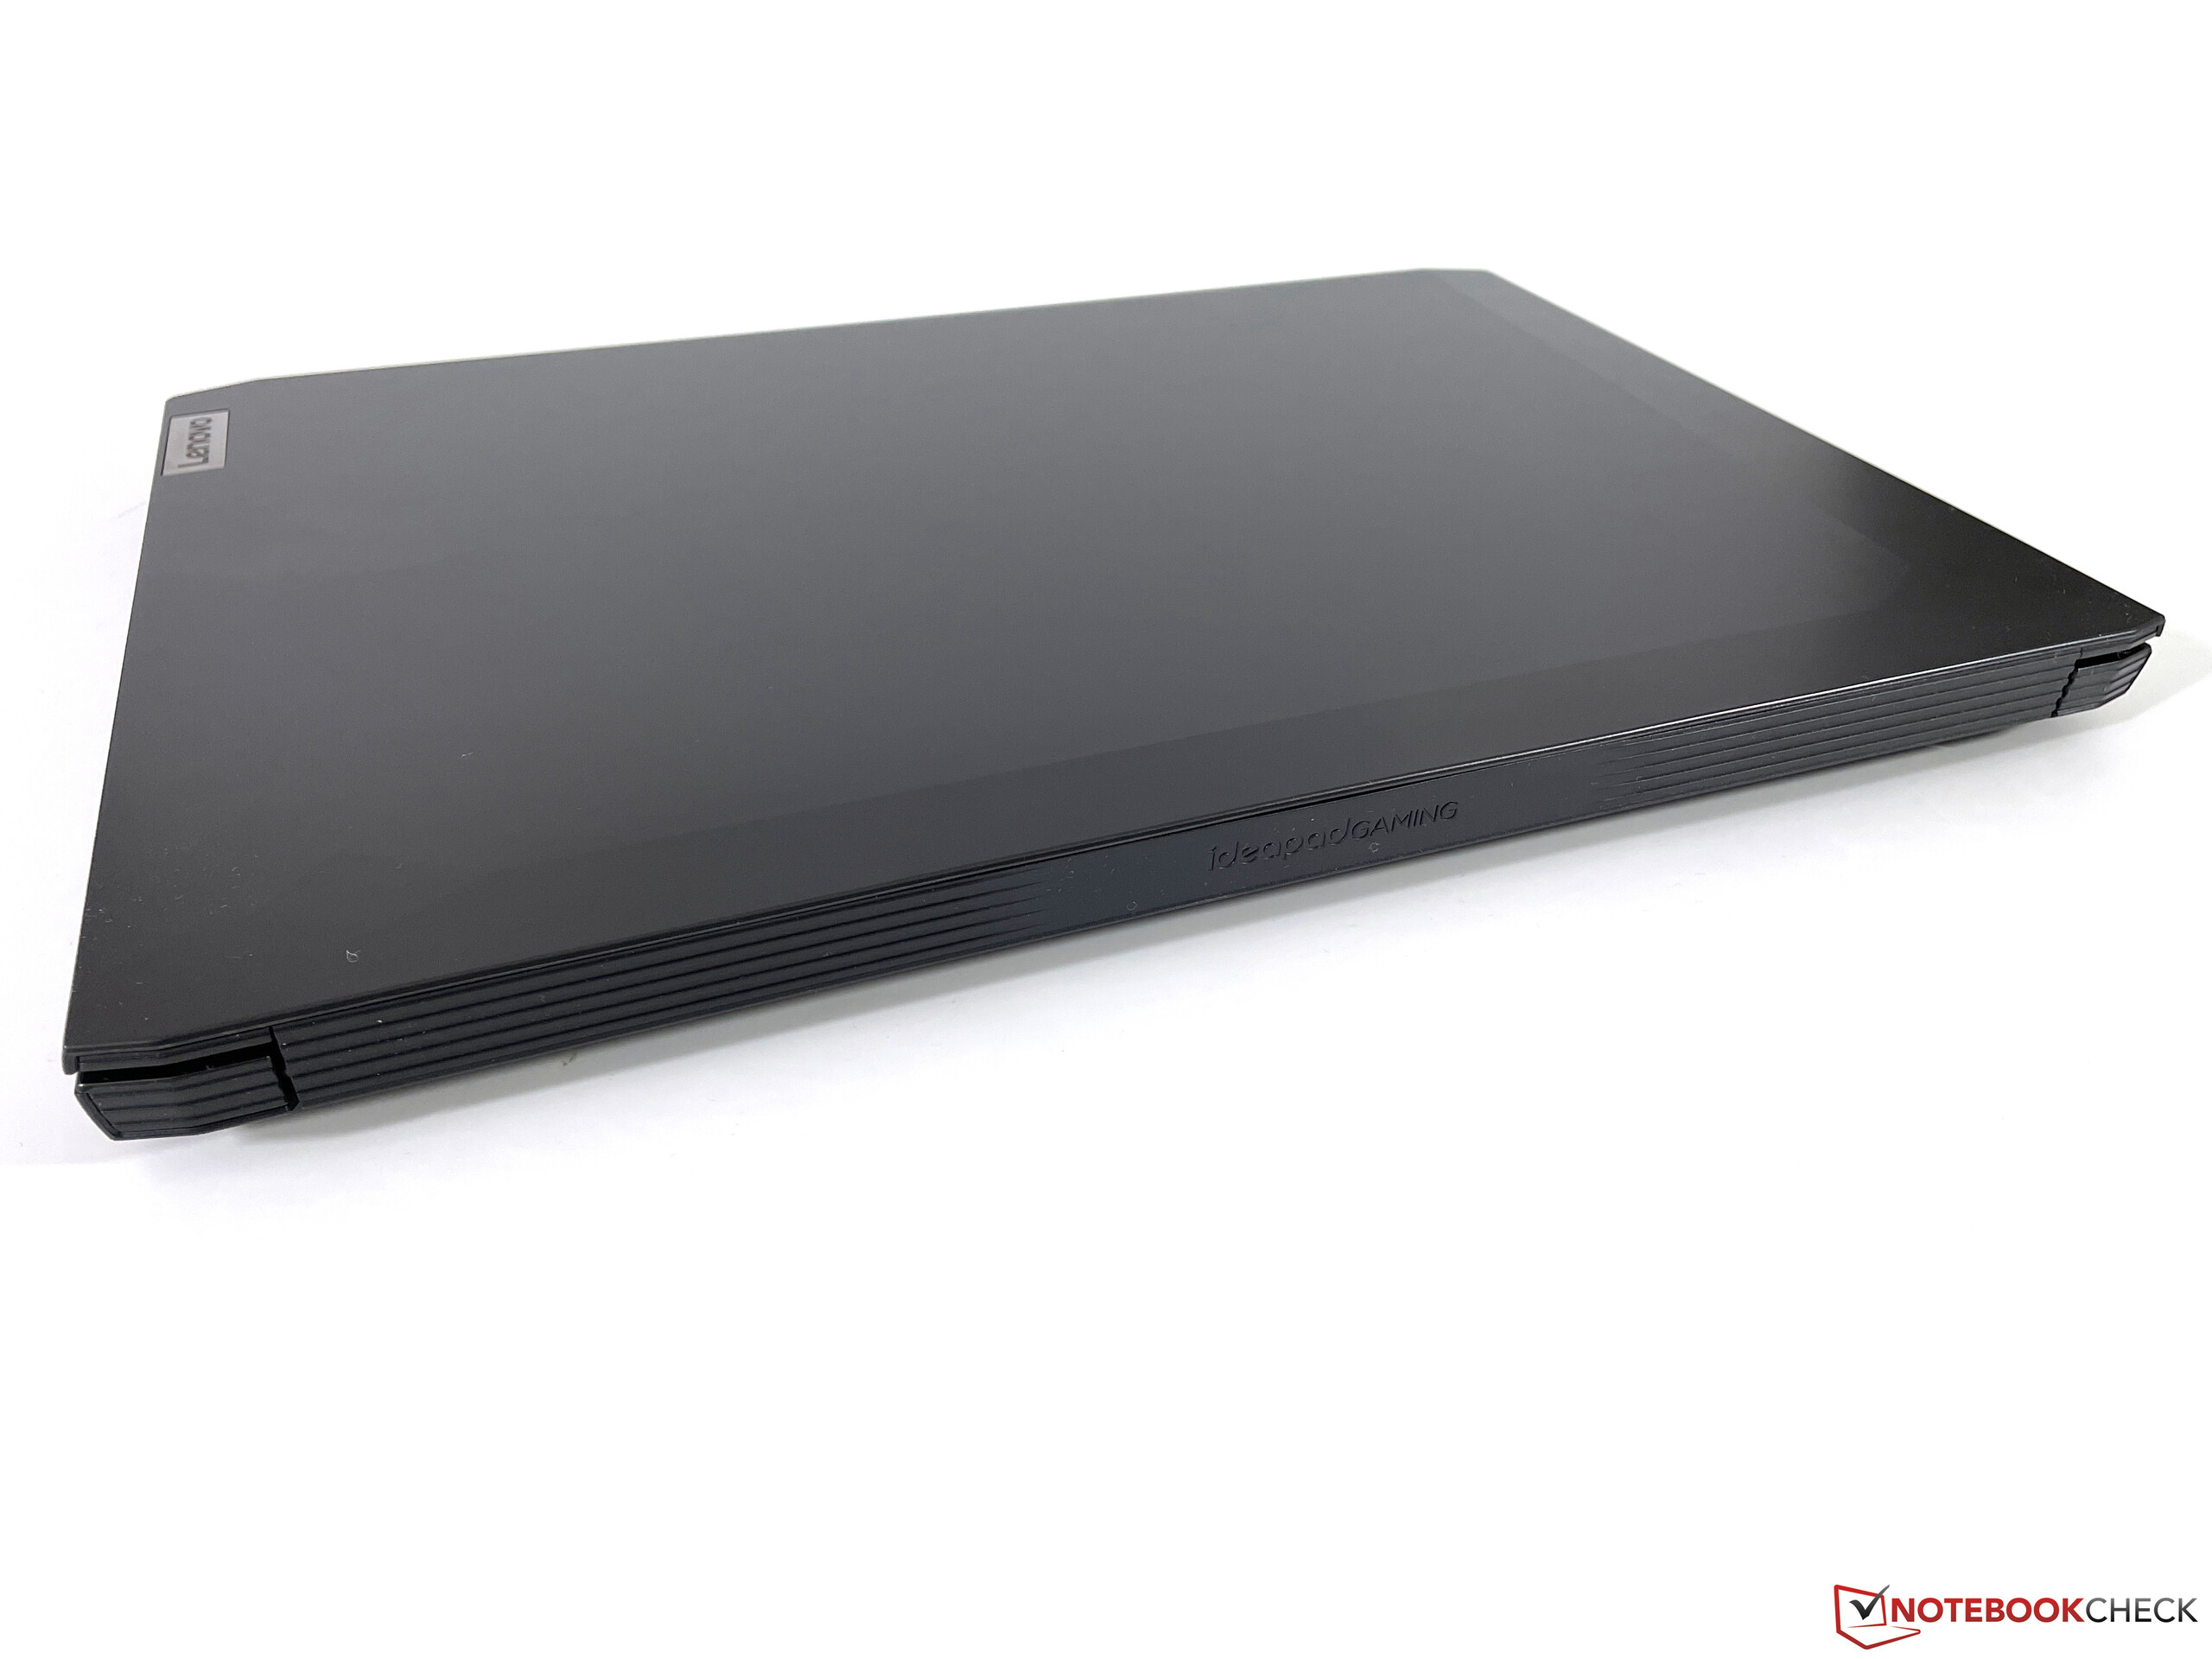
Tudo considerado o IdeaPad Gaming 3 é uma das unidades mais compactas entre seus concorrentes, embora as diferenças fossem bem menores. Com pouco mais de 2 kg (4,41 lbs), ele também era relativamente leve. Tenha em mente que a fonte de alimentação aumenta o orçamento de peso em mais de 25% (500 g/1,1 lbs).
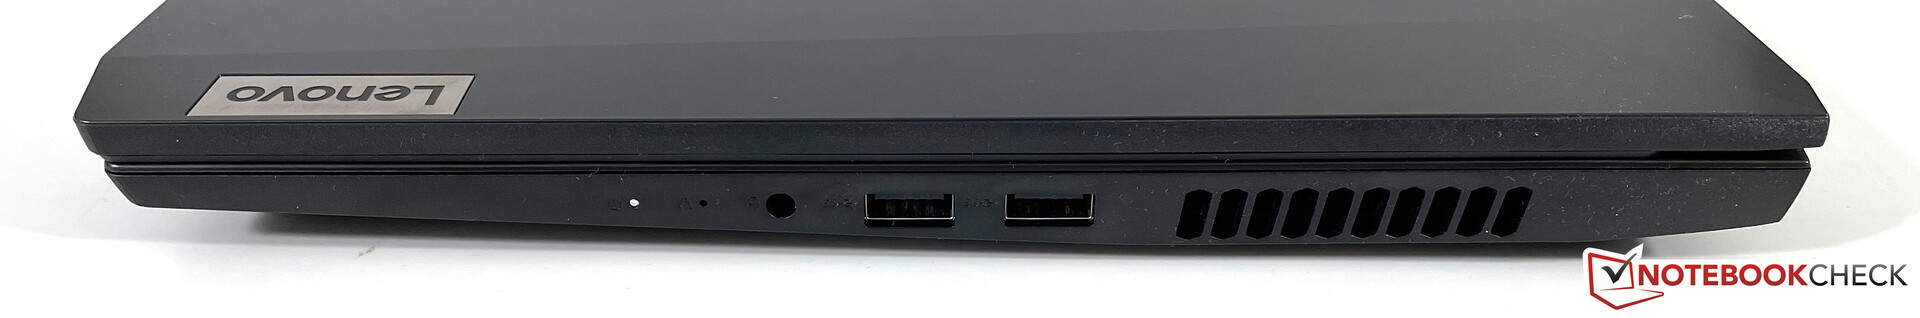
Conectividade - IdeaPad Gaming Cobre o Básico
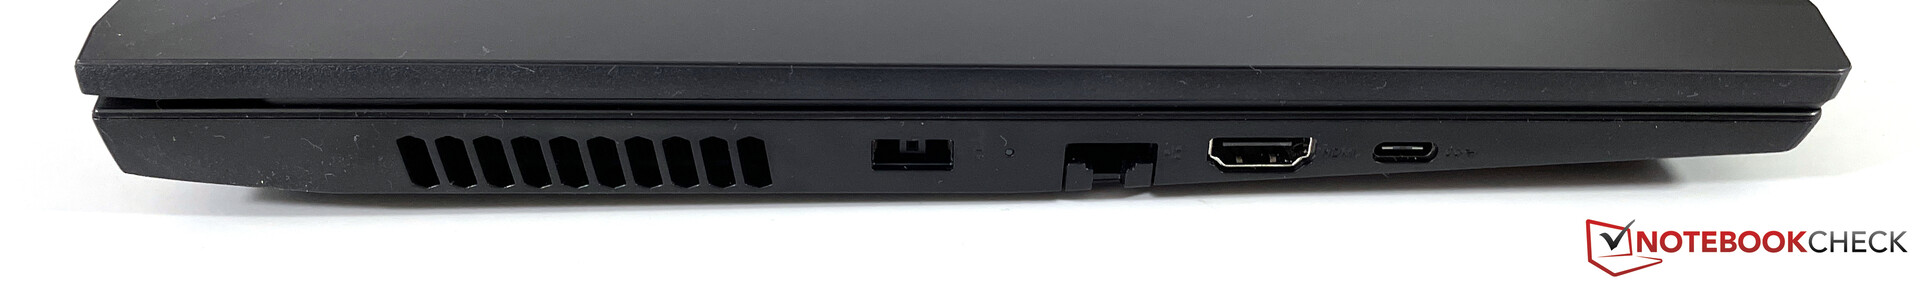
Todos os portos estão localizados em direção ao meio de ambos os lados. Achamos a localização da porta de energia particularmente difícil para jogadores canhotos que pretendem usar um mouse externo. Os protocolos suportados são mais uma vez indicativos de seu baixo ponto de preço. O dispositivo não tem suporte de Thunderbolt e não pode ser carregado através de sua porta USB-C, nem a porta carrega um sinal DisplayPort. Um leitor de cartões também não é encontrado em nenhum lugar.
Comunicação
Em termos de conectividade de rede, o IdeaPad Gaming 3 oferece uma porta ethernet, bem como um modem Wi-Fi. A Lenovo não economizou nesta parte e optou por um módulo Intel AX201 atualizado com suporte a Wi-Fi 6 (802.11ax, 160 MHz) e Bluetooth 5.1. As taxas de transferência quando conectado ao nosso roteador de referência Netgear Nighthawk AX12 foram muito boas e não encontramos nenhum problema de conectividade durante nosso período de revisão.
Webcam
Acima da tela encontramos uma webcam padrão 720p produzindo os resultados esperados. Em outras palavras: sua qualidade de imagem é pobre mesmo em iluminação decente. Pelo menos a câmera oferece um obturador de privacidade física.


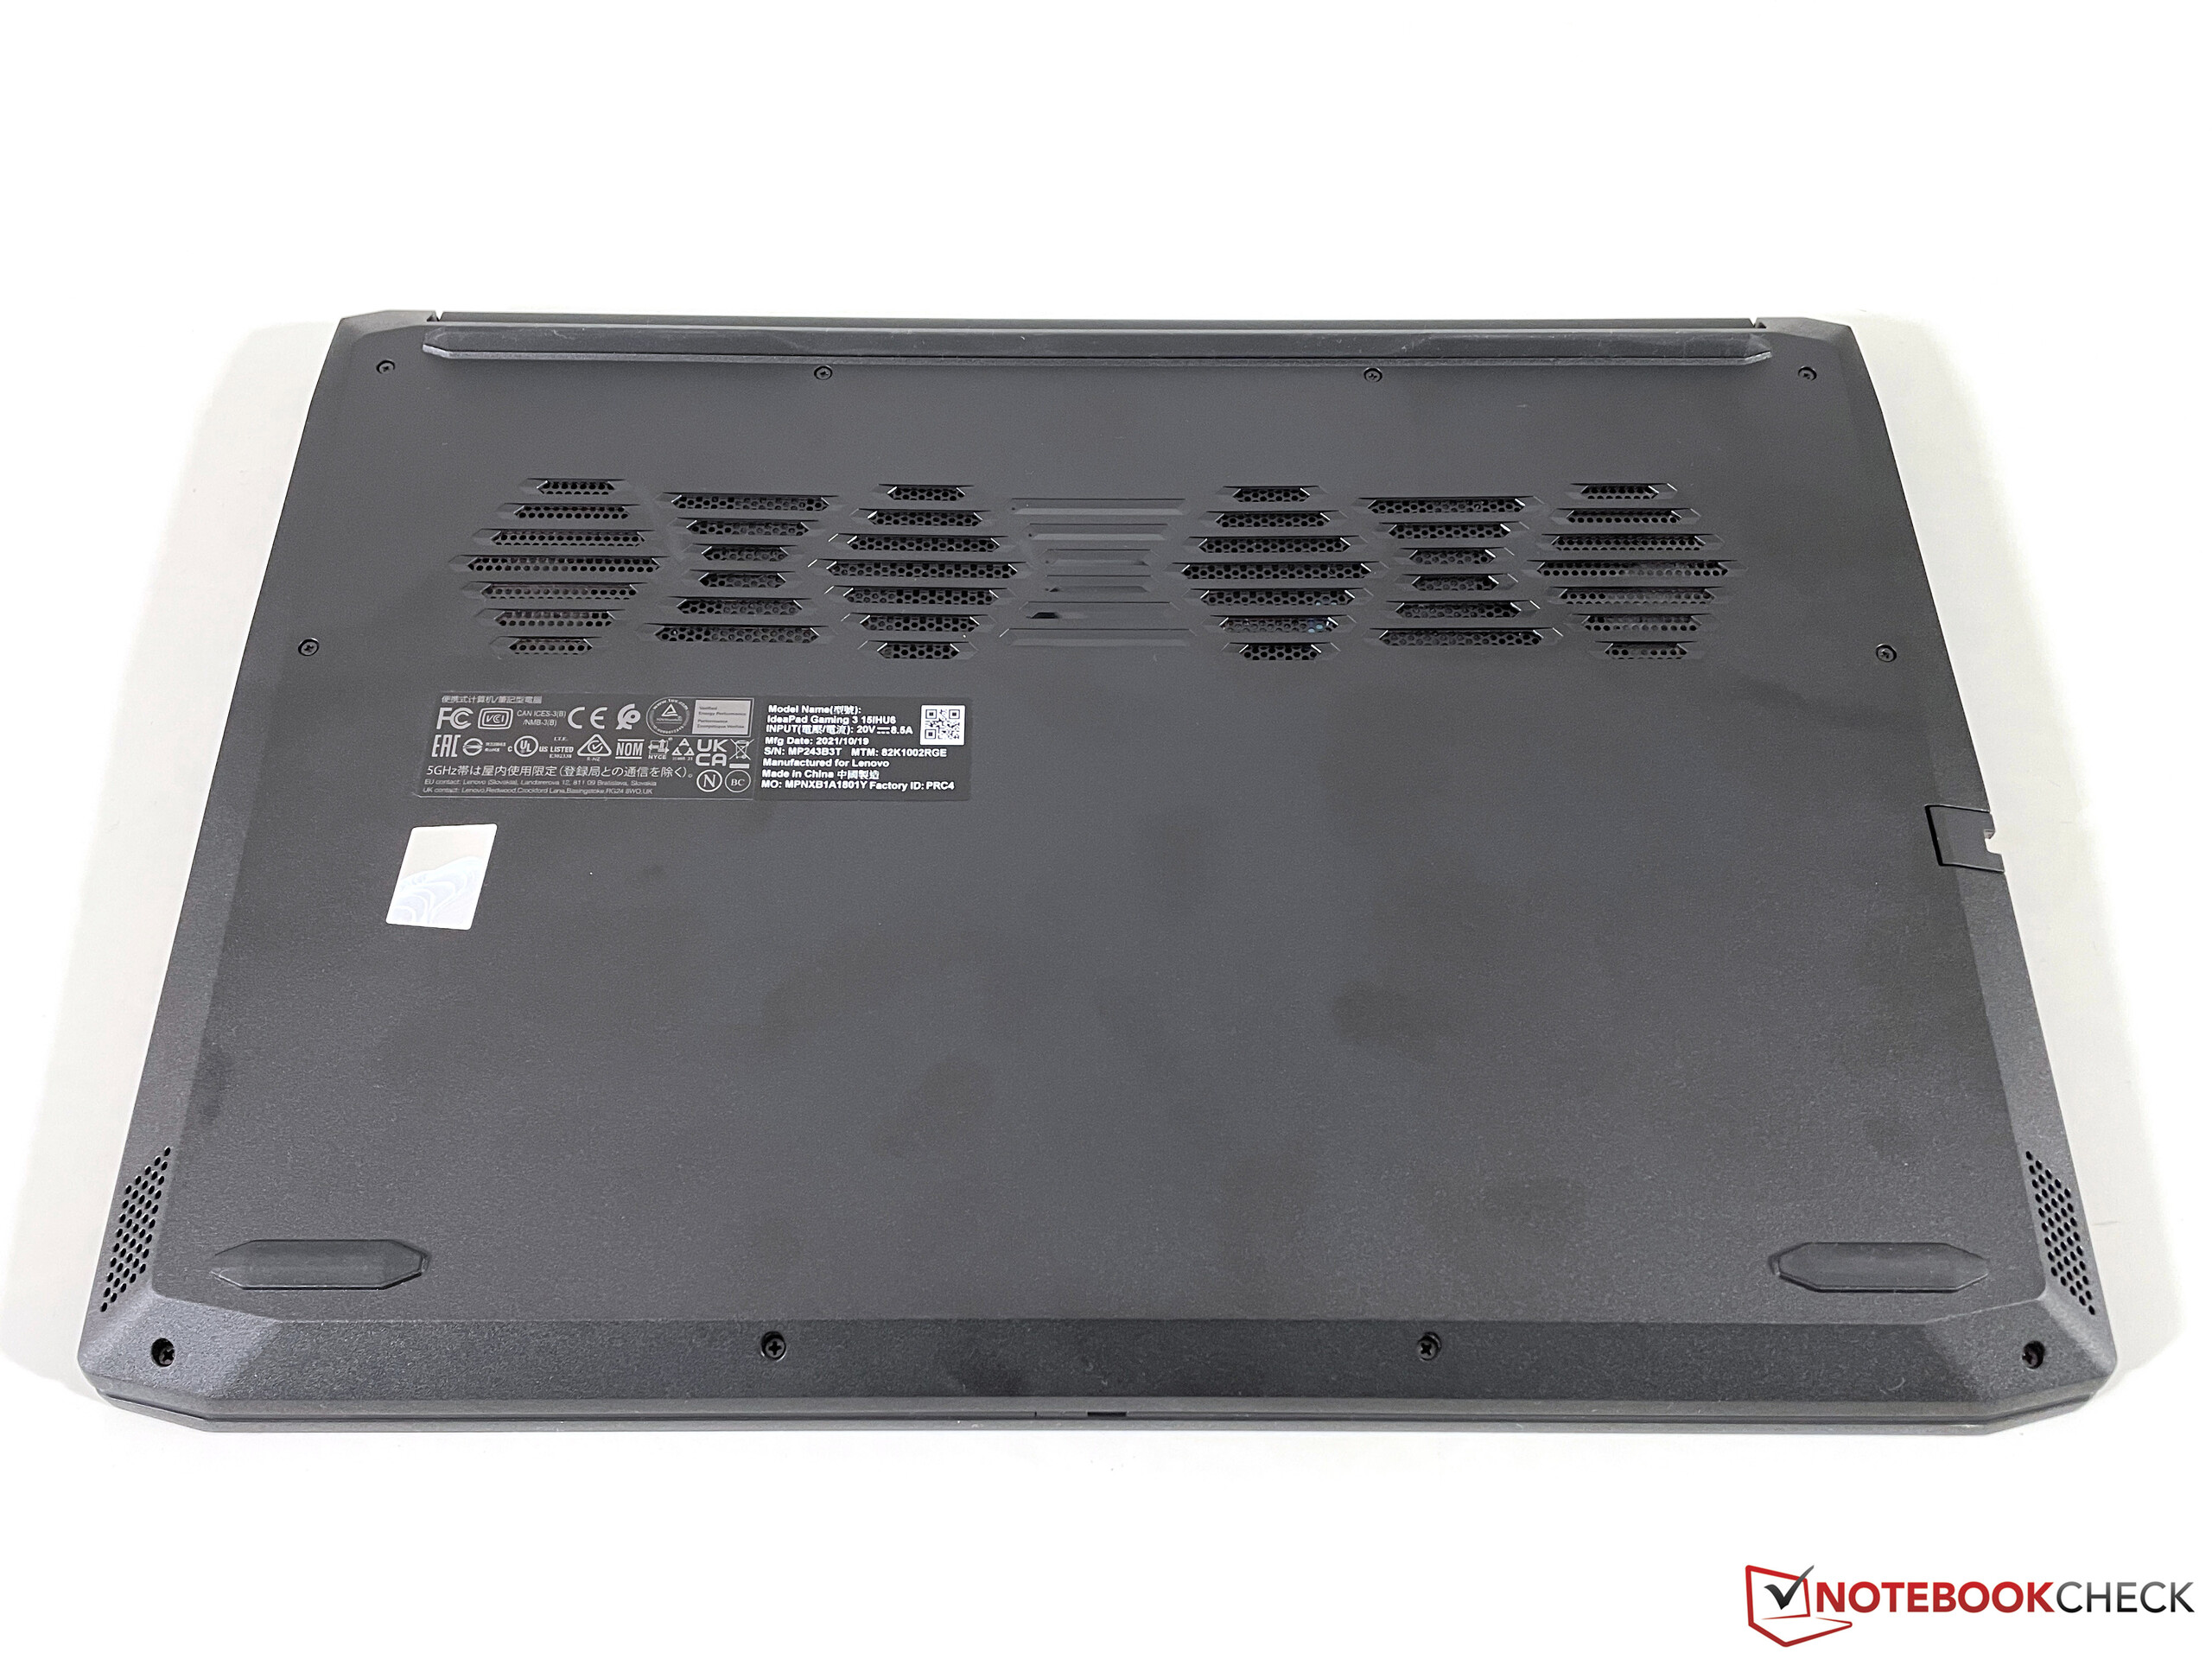
Manutenção
Em teoria, você pode tirar todo o painel inferior para ter acesso aos componentes internos do IdeaPad Gaming 3. E enquanto os parafusos Philips segurando a tampa no lugar podem ser facilmente desfeitos, descobrimos que a tampa inferior é impossível de remover sem danificar visual ou fisicamente a unidade base. Considerando que nossa unidade de revisão era uma unidade de loja, decidimos dar o dia por encerrado.
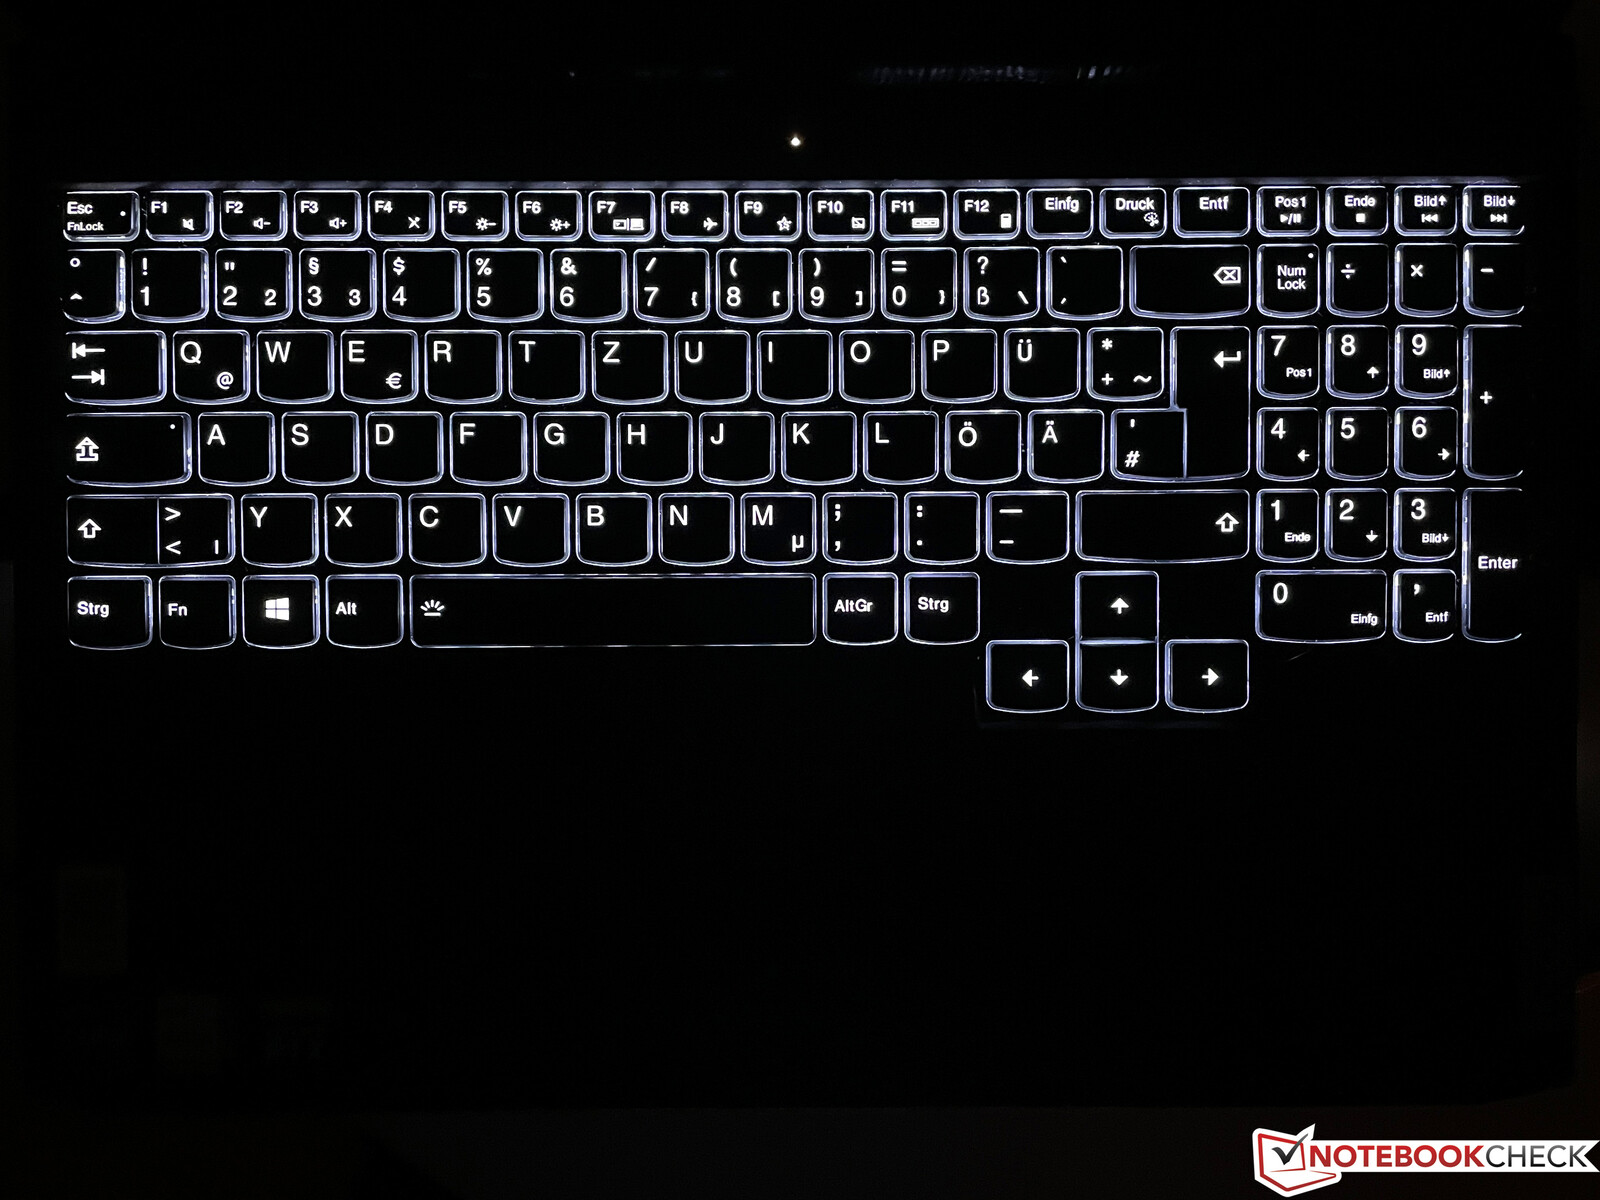
Dispositivos de entrada - IdeaPad Gaming com teclado retroiluminado
Teclado
O IdeaPad Gaming 3 vem com um teclado completo com numpad, embora este último seja comparativamente estreito. Ao contrário de outros IdeaPads, este teclado vem com maior curso (1,5 mm), tornando a digitação muito confortável e agradável. Mesmo quando comparado com os portáteis mais caros Legion Gaming notebooks, nossa unidade de revisão se saiu muito bem, e não tivemos problemas ao digitar textos longos. Os jogadores se beneficiarão das teclas grandes do cursor de deslocamento. O dispositivo não tem luz de fundo RGB e vem com uma luz de fundo branca de dois estágios em seu lugar. Com isso, uma luz de fundo RGB opcional de 4 zonas também está disponível.
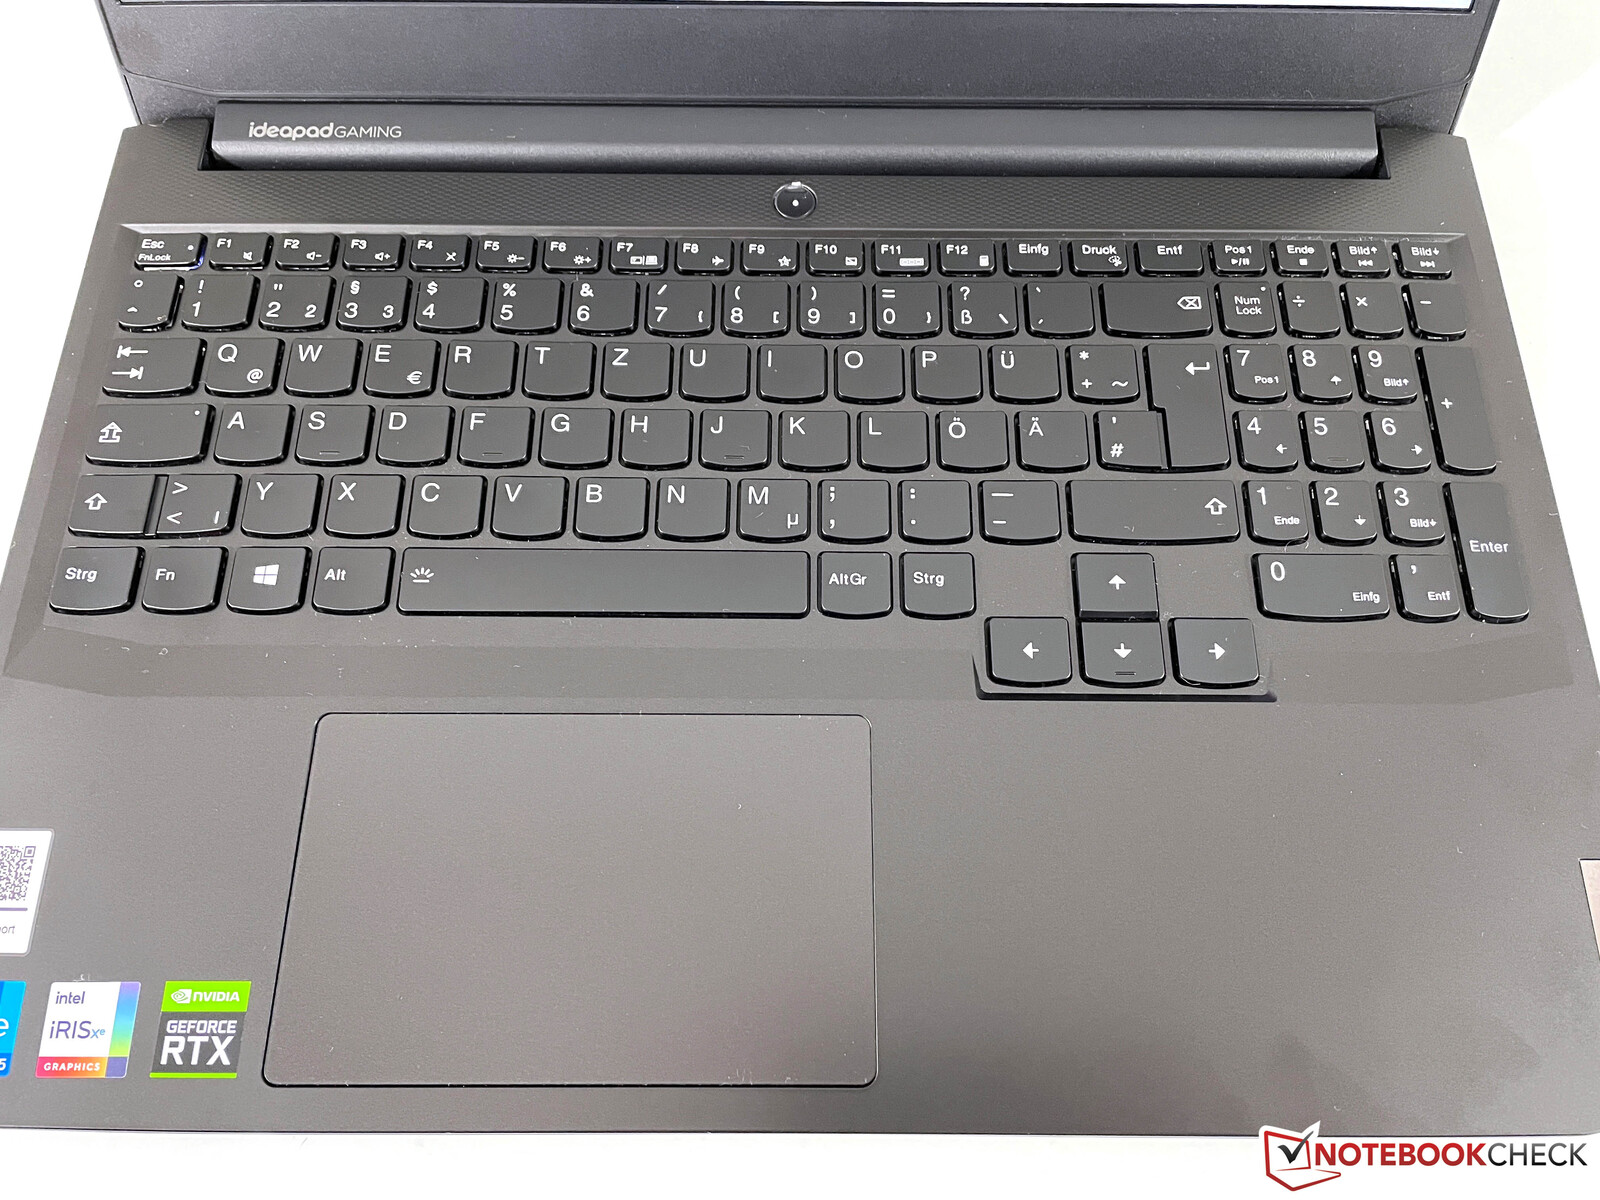
Touchpad
O clickpad é deslocado para a esquerda e centralizado embaixo da barra de espaço. Com 12 x 7,5 cm (4,72 x 2,95 polegadas) é suficientemente grande, e graças à sua superfície lisa usabilidade e ao controle do cursor foi uma brisa. Na parte inferior encontramos os botões integrados que produziam um barulho de clique alto e muito perceptível quando pressionados. A almofada suporta o padrão da Microsoft Precision e, portanto, gestos com até quatro dedos.
Display - Painel IPS Matte

Um total de três painéis diferentes de 1080p estão disponíveis para o IdeaPad Gaming 3, todos mate e baseados na tecnologia IPS: o display padrão de 60 Hz (250 lêndeas) com o qual nossa unidade de revisão foi equipada, um painel de 120 Hz (250 lêndeas) e um painel de 165 Hz (300 lêndeas) com cobertura sRGB completa.
Em nossos testes, o display padrão atingiu o pico acima da classificação de brilho da Lenovo e gerenciou umas boas 300 lêndeas. No entanto, subjetivamente, está tudo bem na melhor das hipóteses e certamente a desvantagem mais gritante do IdeaPad Gaming 3. O conteúdo da tela é um pouco granulado, cortesia do revestimento mate da tela, e as cores também não são particularmente carnudo. Não encontramos nenhuma evidência de PWM tremeluzente, mas em tempos de resposta um pouco letárgicos. Se for possível, sugerimos fortemente que se opte pelo painel opcional de 165 Hz. Tenha em mente que nem todas as opções de exibição estão disponíveis em todas as regiões.
| |||||||||||||||||||||||||
iluminação: 88 %
iluminação com acumulador: 307 cd/m²
Contraste: 1462:1 (Preto: 0.21 cd/m²)
ΔE ColorChecker Calman: 5.9 | ∀{0.5-29.43 Ø4.71}
calibrated: 4.8
ΔE Greyscale Calman: 4.9 | ∀{0.09-98 Ø4.96}
41.1% AdobeRGB 1998 (Argyll 3D)
59.6% sRGB (Argyll 3D)
39.7% Display P3 (Argyll 3D)
Gamma: 2.26
CCT: 6504 K
| Lenovo Ideapad Gaming 3 15IHU-82K1002RGE LEN156FHD, IPS, 1920x1080, 15.6" | Dell G15 5515 BOE092A, IPS, 1920x1080, 15.6" | Gigabyte G5 GD Chi Mei N156HRA-EA1, IPS, 1920x1080, 15.6" | Medion Erazer Deputy P25 Panda LM156LF-2F03, IPS, 1920x1080, 15.6" | Schenker XMG Focus 15 LG Philips LP156WFG-SPB5, IPS, 1920x1080, 15.6" | Lenovo Legion 5 15ACH-82JU00C6GE-FL B156HAN12.H, , 1920x1080, 15.6" | |
|---|---|---|---|---|---|---|
| Display | -3% | 5% | 0% | 62% | 64% | |
| Display P3 Coverage (%) | 39.7 | 39.1 -2% | 41.8 5% | 39.7 0% | 64.6 63% | 65.4 65% |
| sRGB Coverage (%) | 59.6 | 56.9 -5% | 62.3 5% | 59.7 0% | 95.3 60% | 96.3 62% |
| AdobeRGB 1998 Coverage (%) | 41.1 | 40.4 -2% | 43.2 5% | 41.1 0% | 66.5 62% | 67.5 64% |
| Response Times | 49% | 30% | 14% | 68% | 73% | |
| Response Time Grey 50% / Grey 80% * (ms) | 46.4 ? | 25.2 ? 46% | 34.4 ? 26% | 40.4 ? 13% | 18 ? 61% | 13.6 ? 71% |
| Response Time Black / White * (ms) | 35.2 ? | 16.8 ? 52% | 23.2 ? 34% | 30.4 ? 14% | 8.8 ? 75% | 9.2 ? 74% |
| PWM Frequency (Hz) | 200 ? | |||||
| Screen | -10% | 10% | 8% | 23% | 15% | |
| Brightness middle (cd/m²) | 307 | 278 -9% | 261 -15% | 283 -8% | 418 36% | 350 14% |
| Brightness (cd/m²) | 292 | 262 -10% | 246 -16% | 266 -9% | 376 29% | 350 20% |
| Brightness Distribution (%) | 88 | 83 -6% | 87 -1% | 85 -3% | 83 -6% | 96 9% |
| Black Level * (cd/m²) | 0.21 | 0.36 -71% | 0.19 10% | 0.2 5% | 0.41 -95% | 0.3 -43% |
| Contrast (:1) | 1462 | 772 -47% | 1374 -6% | 1415 -3% | 1020 -30% | 1167 -20% |
| Colorchecker dE 2000 * | 5.9 | 5.74 3% | 3.9 34% | 5.32 10% | 1.67 72% | 3.9 34% |
| Colorchecker dE 2000 max. * | 21.6 | 19.63 9% | 19.26 11% | 17.68 18% | 3.88 82% | 8.2 62% |
| Colorchecker dE 2000 calibrated * | 4.8 | 4.7 2% | 3.24 32% | 3.94 18% | 0.98 80% | 1.6 67% |
| Greyscale dE 2000 * | 4.9 | 3.1 37% | 2.7 45% | 2.9 41% | 2.9 41% | 5.5 -12% |
| Gamma | 2.26 97% | 2.011 109% | 2.248 98% | 2.062 107% | 2.26 97% | 2.15 102% |
| CCT | 6504 100% | 6207 105% | 6828 95% | 7167 91% | 6209 105% | 7414 88% |
| Média Total (Programa/Configurações) | 12% /
-0% | 15% /
12% | 7% /
7% | 51% /
38% | 51% /
33% |
* ... menor é melhor
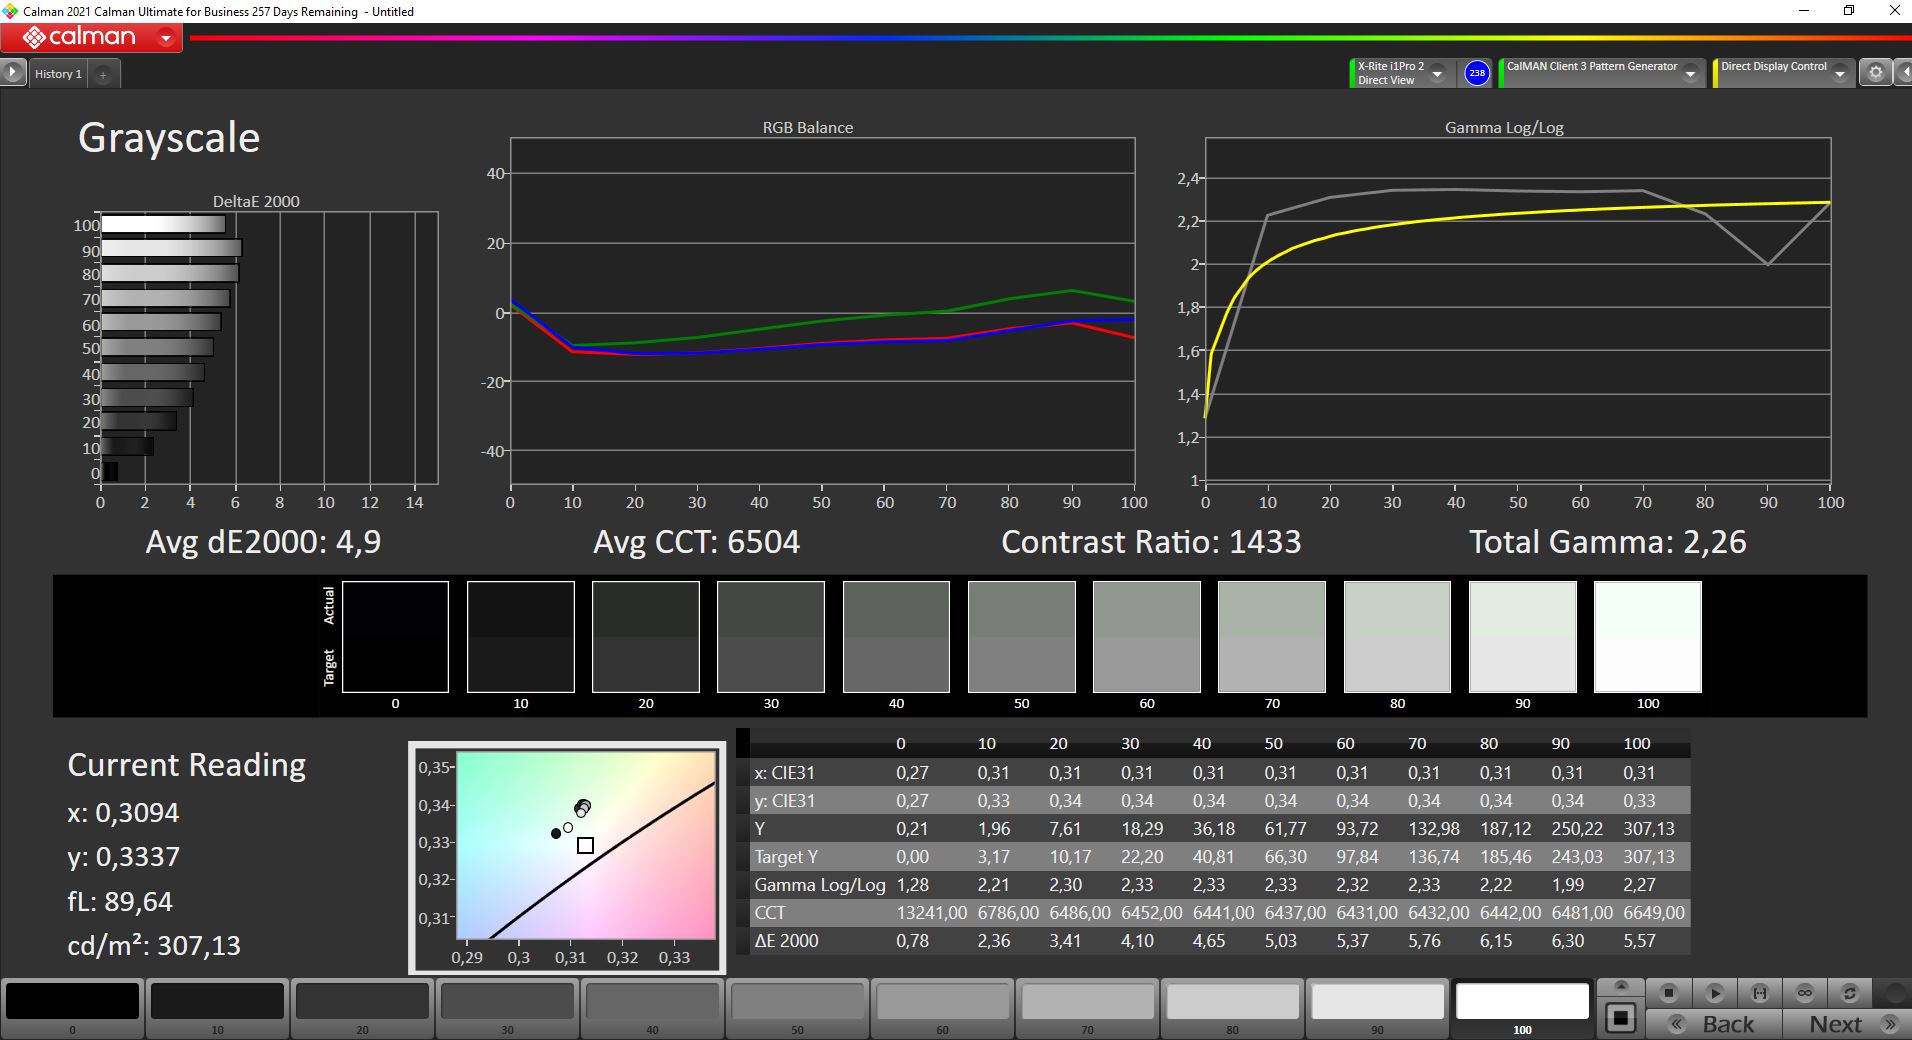
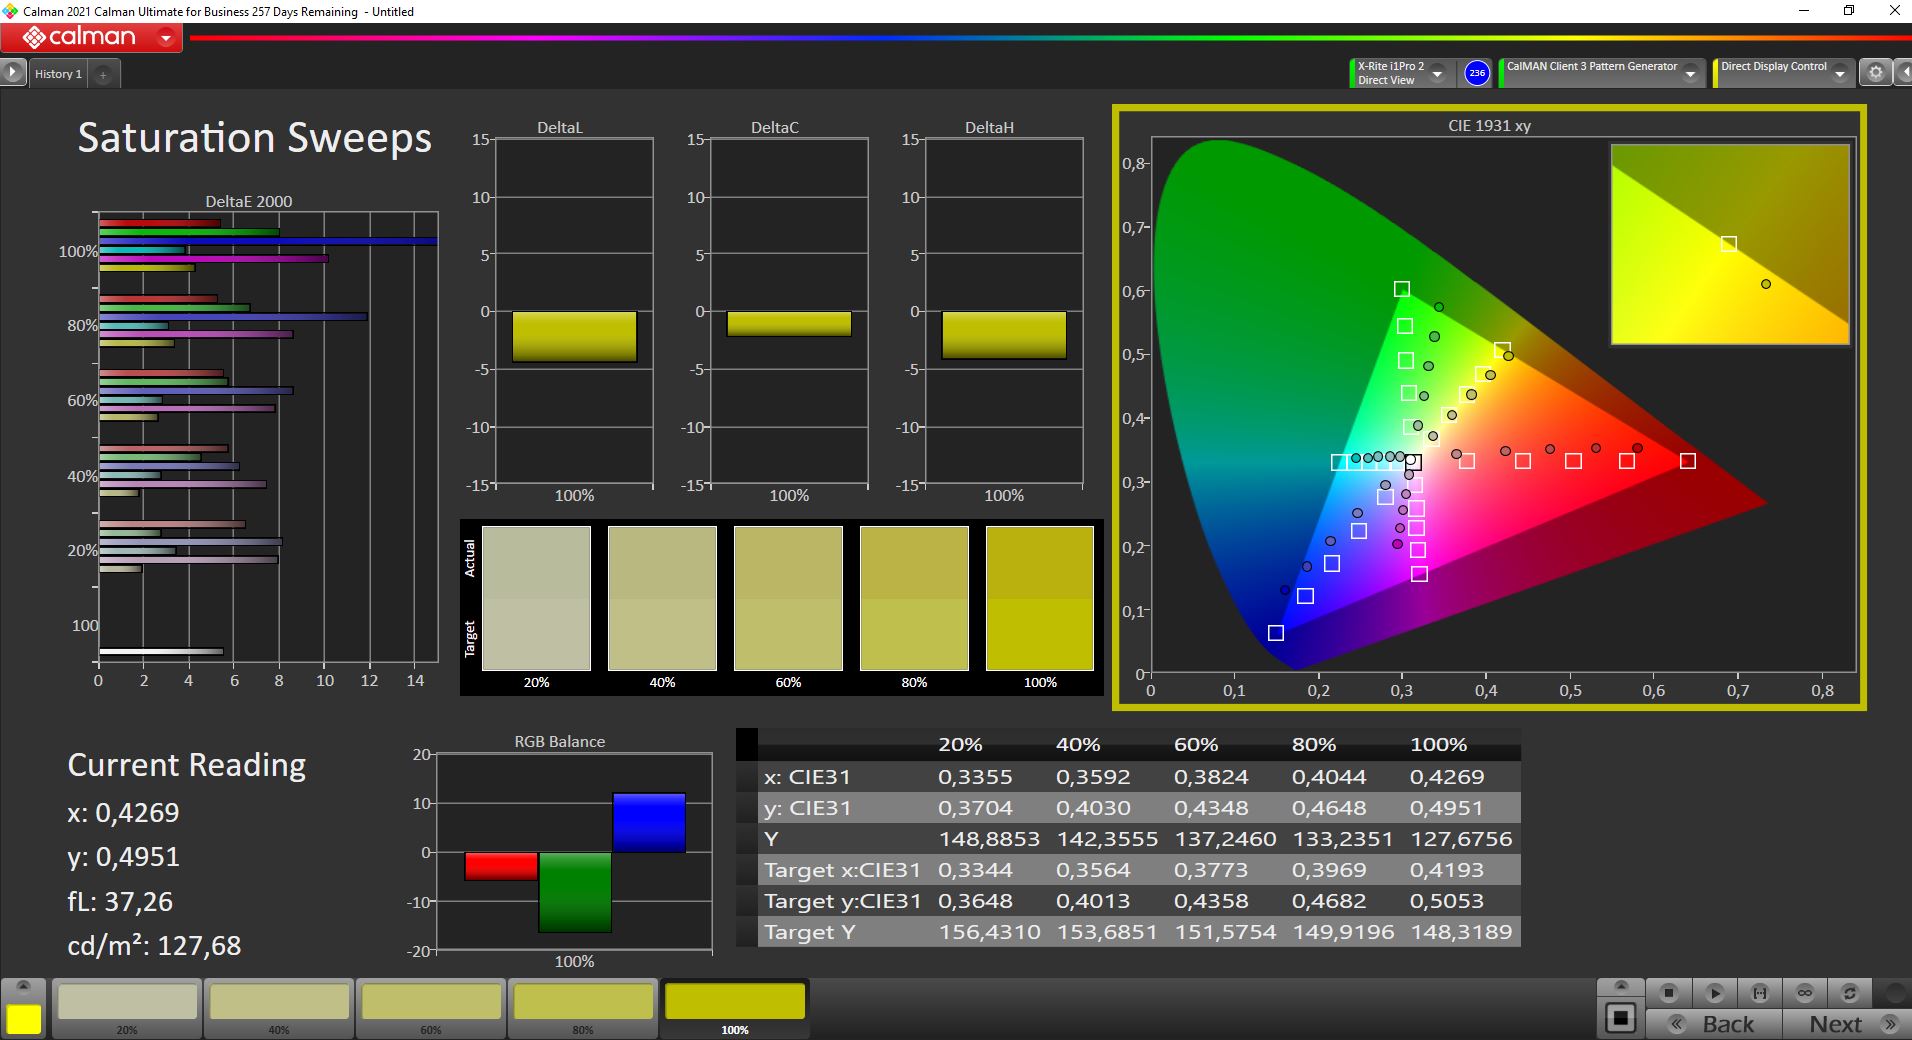
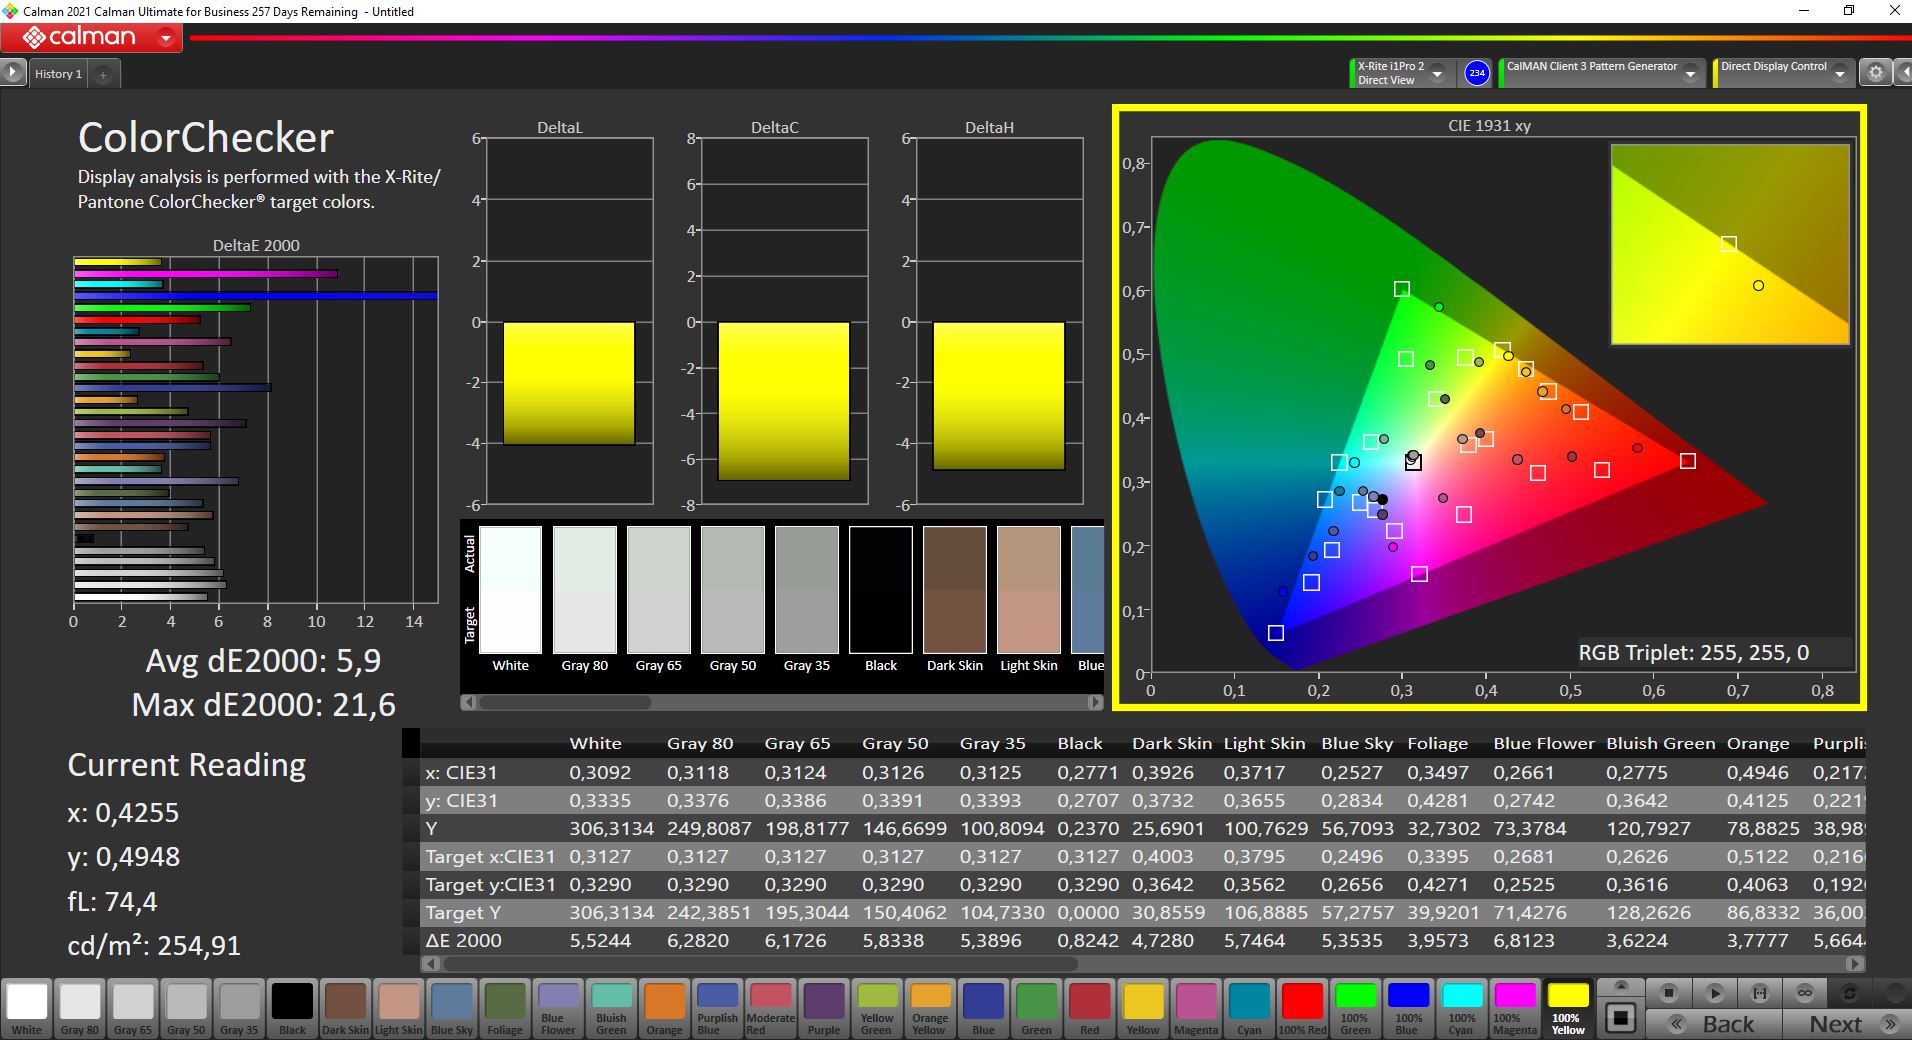
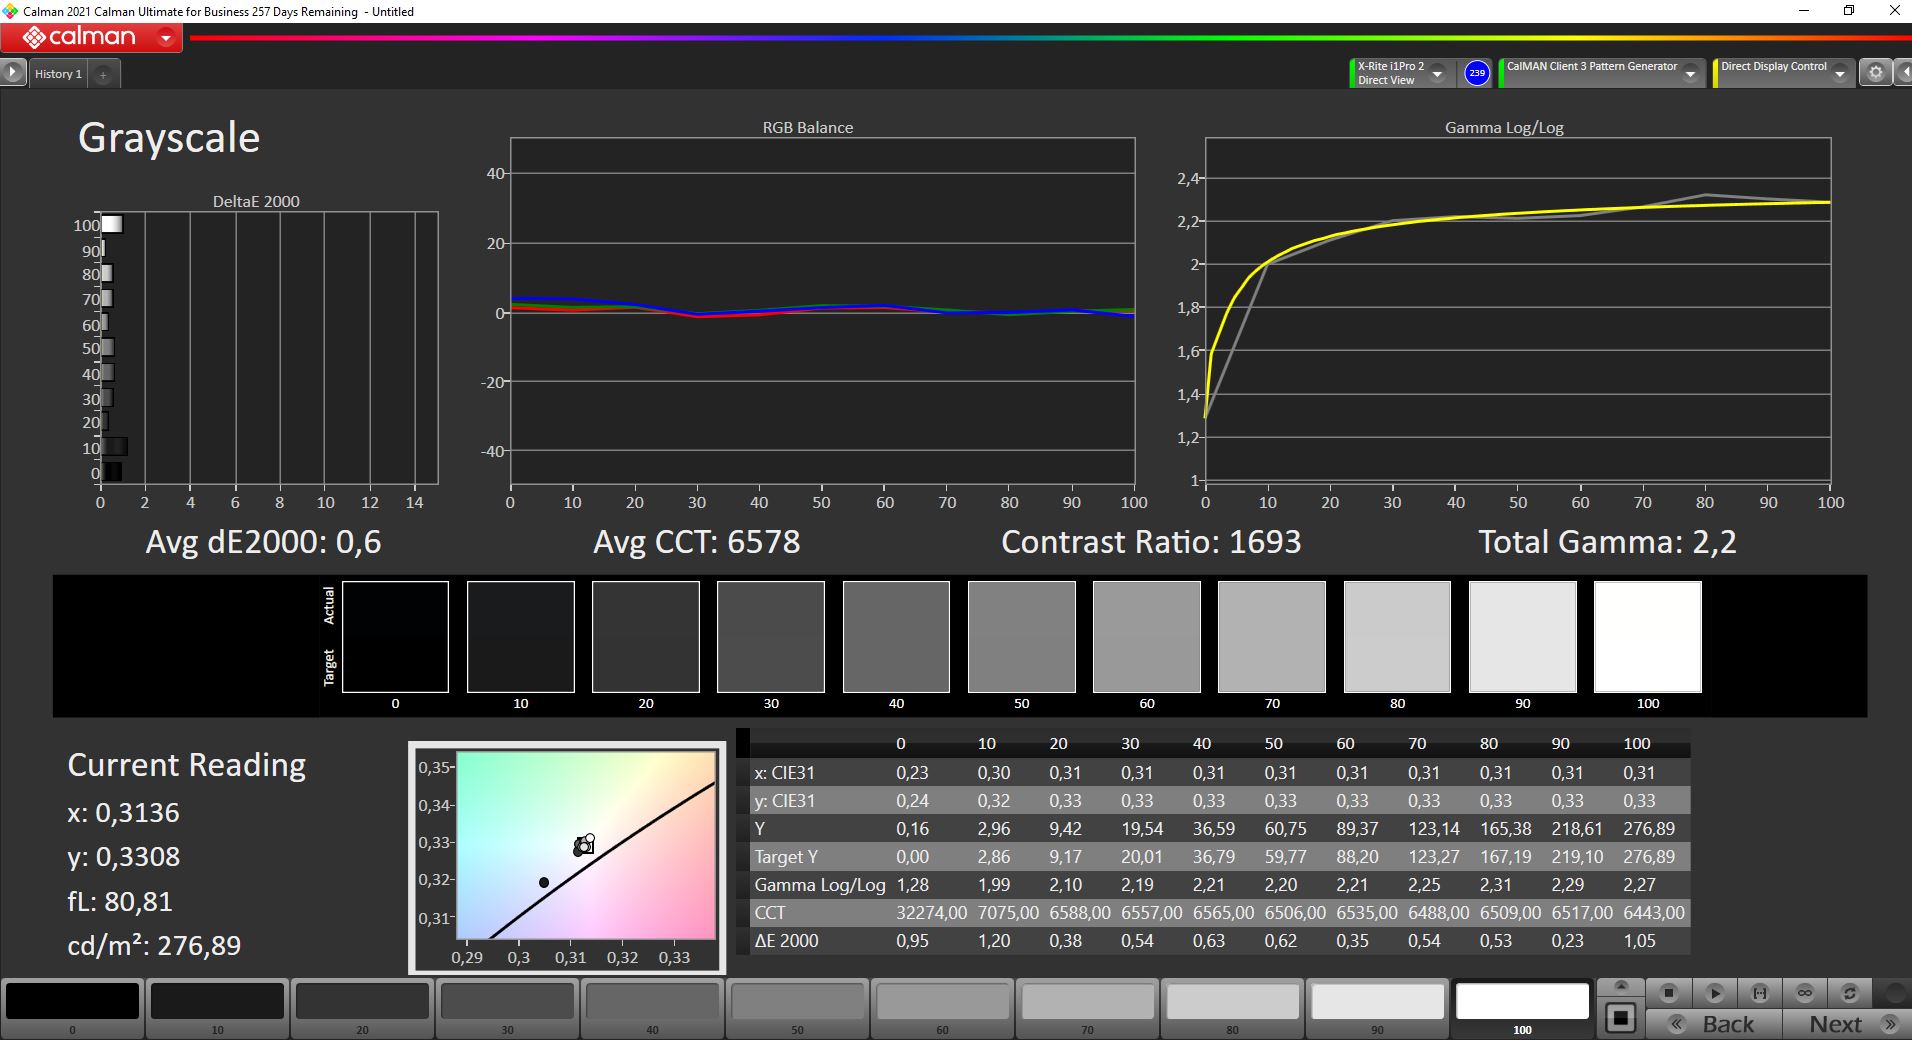
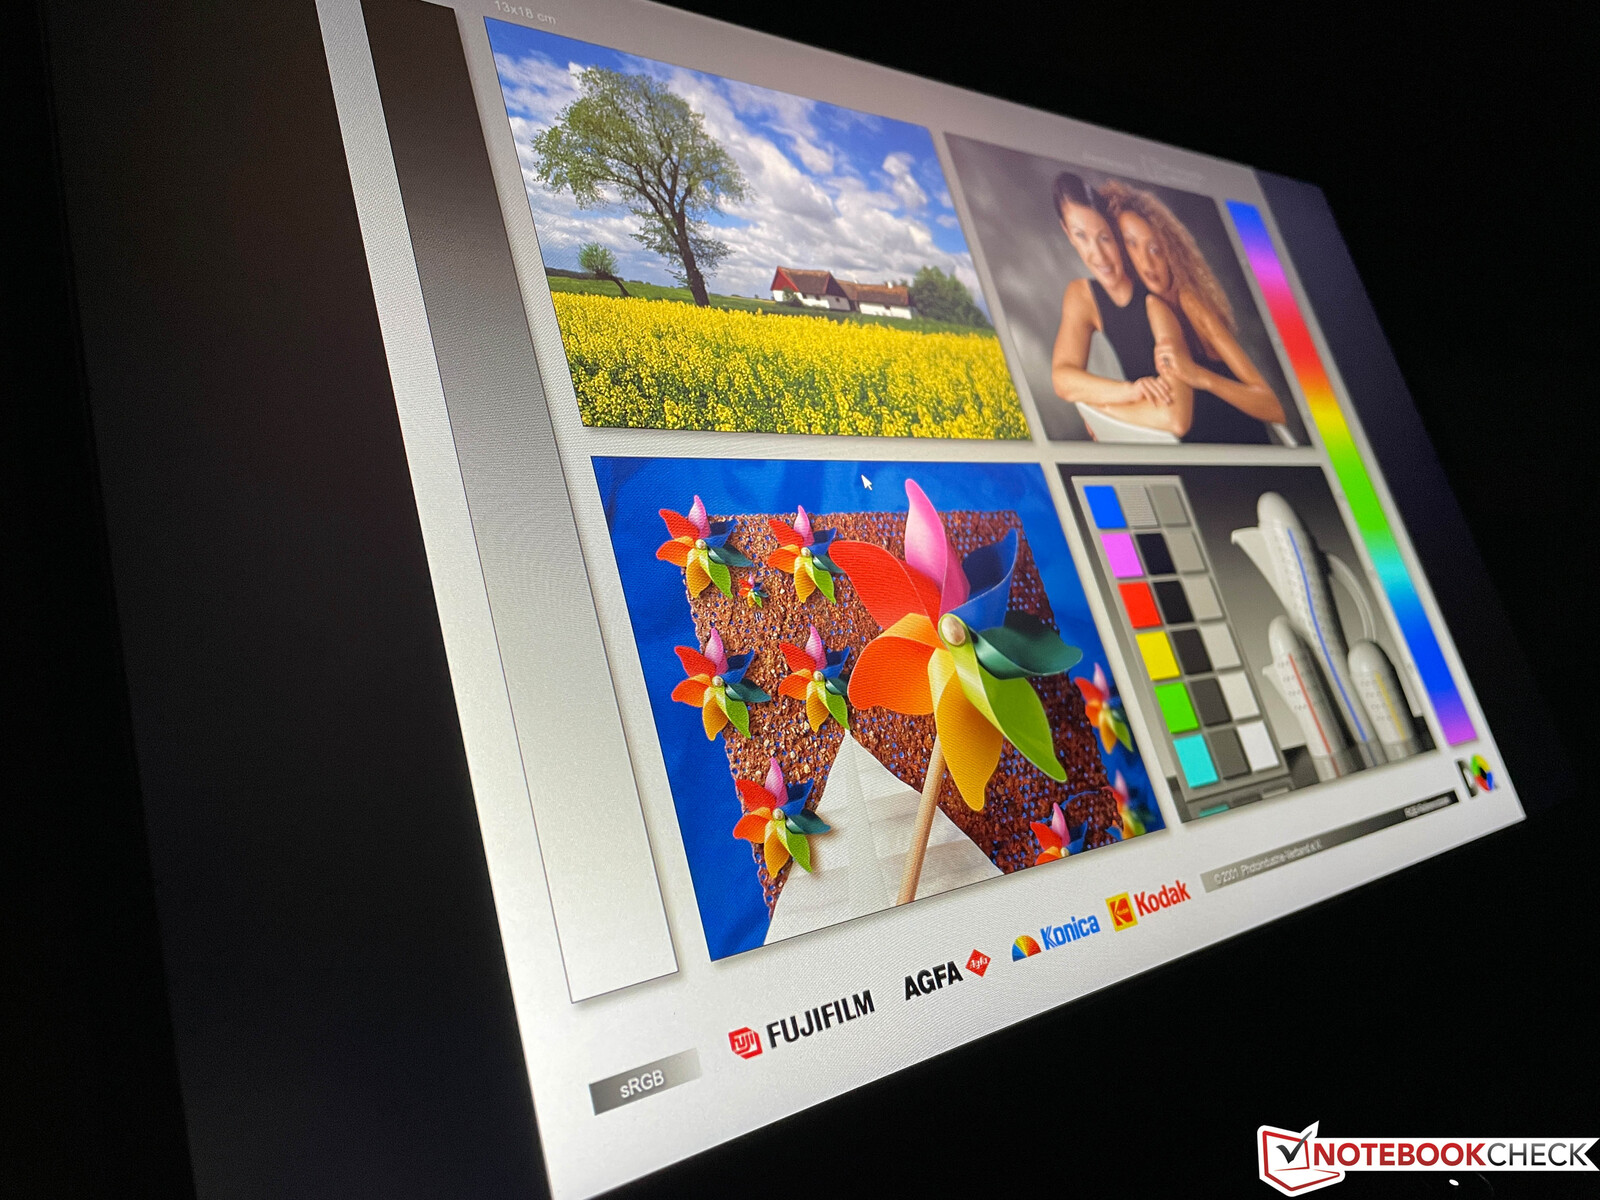
Quando analisado utilizando o software profissional CalMAN (X-Rite i1 Pro 2), o baixo preço do painel IPS realmente mostrou. Embora sua escala de cinza não sofresse nenhuma forma de tonalidade de cor perceptível, encontramos cores extremamente imprecisas. Fomos capazes de melhorar a escala de cinza através da calibração e, como sempre, você pode encontrar o perfil ICC resultante para download acima. Tenha em mente que nossa calibração resultou em uma ligeira diminuição do brilho geral e que não conseguimos melhorar em nada a precisão da cor do painel de visualização. A tela é simplesmente incapaz de ter cores melhores como pode ser testemunhado por sua cobertura de espaço de cor sRGB relativamente pobre, de apenas 60%. Portanto, o display não é adequado para qualquer forma de edição de fotos.
Exibir tempos de resposta
| ↔ Tempo de resposta preto para branco | ||
|---|---|---|
| 35.2 ms ... ascensão ↗ e queda ↘ combinadas | ↗ 18.8 ms ascensão |  |
| ↘ 16.4 ms queda | ||
| A tela mostra taxas de resposta lentas em nossos testes e será insatisfatória para os jogadores. Em comparação, todos os dispositivos testados variam de 0.1 (mínimo) a 240 (máximo) ms. » 93 % de todos os dispositivos são melhores. Isso significa que o tempo de resposta medido é pior que a média de todos os dispositivos testados (19.8 ms). | ||
| ↔ Tempo de resposta 50% cinza a 80% cinza | ||
| 46.4 ms ... ascensão ↗ e queda ↘ combinadas | ↗ 21.2 ms ascensão |  |
| ↘ 25.2 ms queda | ||
| A tela mostra taxas de resposta lentas em nossos testes e será insatisfatória para os jogadores. Em comparação, todos os dispositivos testados variam de 0.165 (mínimo) a 636 (máximo) ms. » 80 % de todos os dispositivos são melhores. Isso significa que o tempo de resposta medido é pior que a média de todos os dispositivos testados (31 ms). | ||
Cintilação da tela / PWM (modulação por largura de pulso)
| Tela tremeluzindo / PWM não detectado |  | ||
[pwm_comparison] Em comparação: 52 % de todos os dispositivos testados não usam PWM para escurecer a tela. Se PWM foi detectado, uma média de 7754 (mínimo: 5 - máximo: 343500) Hz foi medida. | |||
Graças ao seu revestimento mate da tela, o IdeaPad Gaming 3 pode ser usado ao ar livre, desde que não seja muito brilhante. Como é típico dos painéis IPS, seus ângulos de visão eram muito amplos.
Desempenho - IdeaPad com Tiger Lake e RTX 3000
Condições de teste
O software Vantage pré-carregado da Lenovo vem com três perfis de potência: Silencioso, Automático, e Performance. Tanto no Silent como no Auto, a GPU é limitada a 60 W enquanto o Performance desbloqueia os 90 W completos. Tenha em mente que o modo Performance não está disponível em bateria, o que significa que nossos testes de bateria foram executados no perfil Auto.
Processador
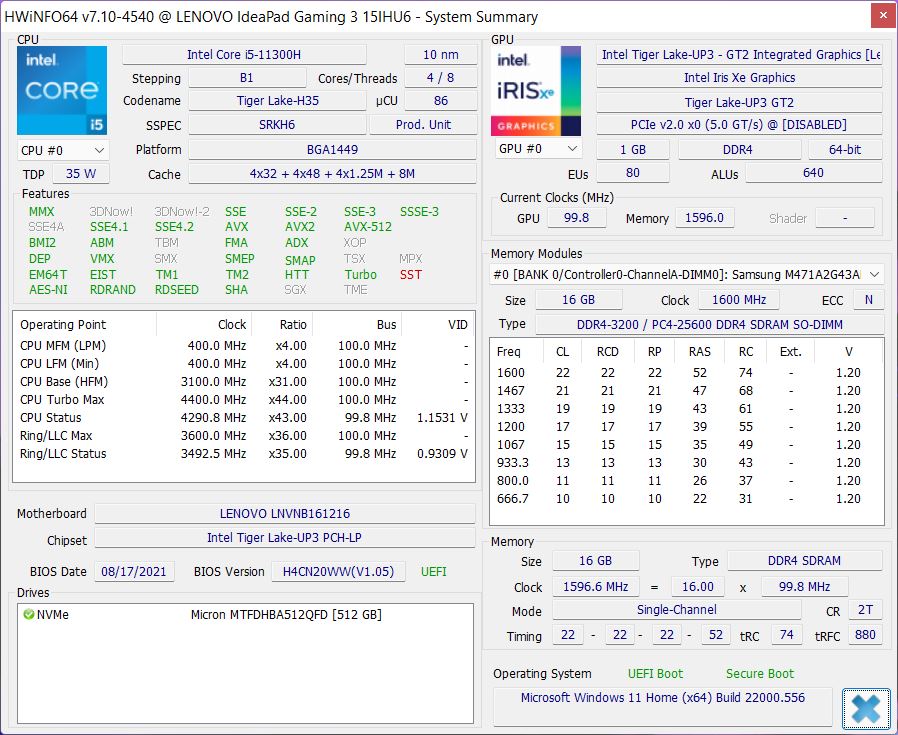
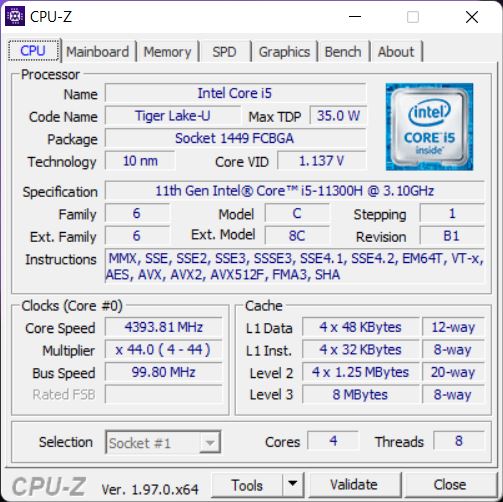
O processador Intel Tiger Lake H35 é um velho amigo. É uma versão um pouco mais rápida de seus irmãos Tiger Lake U com quatro núcleos e uma GPU Iris Xe embutida. Onúcleo i5-11300H de nossa unidade de análise
é avaliado em 42 W, e, portanto, tem um desempenho muito consistente mesmo sob carga sustentada de longa duração</span>Cinebench R15 Multi Loop
Nossos benchmarks indicam que enquanto oCore i5-11300H pode ser capaz de acompanhar seus concorrentes em desempenho de núcleo único, ele é completamente destruído em cenários multi-core. O maior benefício do H35 Tiger Lake, a GPU Iris Xe, não tem utilidade em um laptop com GPU dedicado, e teríamos preferido uma CPU diferente Tiger Lake, como por exemplo a CPU de 6 núcleos Core i5-11400H. Como testes subseqüentes mostraram, o dispositivo sofre imensamente com seu fraco desempenho da CPU, por exemplo, quando se trata de jogos. Alternativamente, o IdeaPad Gaming 3 também está disponível com umAMD Ryzen 5 5600H com um desempenho multi-core muito superior.
Em bateria, a CPU é limitada a apenas 25 W após um curto período de tempo. Consequentemente, ele tem um desempenho ainda pior em situações de carga multi-core. Benchmarks adicionais da CPU podem ser encontrados em nosso seção de tecnologia.
Cinebench R23: Multi Core | Single Core
Cinebench R20: CPU (Multi Core) | CPU (Single Core)
Cinebench R15: CPU Multi 64Bit | CPU Single 64Bit
Blender: v2.79 BMW27 CPU
7-Zip 18.03: 7z b 4 | 7z b 4 -mmt1
Geekbench 5.5: Multi-Core | Single-Core
HWBOT x265 Benchmark v2.2: 4k Preset
LibreOffice : 20 Documents To PDF
R Benchmark 2.5: Overall mean
| CPU Performance rating | |
| Média da turma Gaming | |
| Medion Erazer Deputy P25 | |
| Schenker XMG Focus 15 | |
| Lenovo Legion 5 15ACH-82JU00C6GE-FL | |
| Dell G15 5515 | |
| Gigabyte G5 GD | |
| Lenovo Ideapad Gaming 3 15IHU-82K1002RGE | |
| Média Intel Core i5-11300H | |
| Cinebench R23 / Multi Core | |
| Média da turma Gaming (10488 - 42661, n=107, últimos 2 anos) | |
| Lenovo Legion 5 15ACH-82JU00C6GE-FL | |
| Medion Erazer Deputy P25 | |
| Dell G15 5515 | |
| Schenker XMG Focus 15 | |
| Gigabyte G5 GD | |
| Lenovo Ideapad Gaming 3 15IHU-82K1002RGE | |
| Média Intel Core i5-11300H (3313 - 6581, n=10) | |
| Cinebench R23 / Single Core | |
| Média da turma Gaming (1166 - 2415, n=107, últimos 2 anos) | |
| Gigabyte G5 GD | |
| Medion Erazer Deputy P25 | |
| Dell G15 5515 | |
| Lenovo Legion 5 15ACH-82JU00C6GE-FL | |
| Schenker XMG Focus 15 | |
| Média Intel Core i5-11300H (1218 - 1431, n=11) | |
| Lenovo Ideapad Gaming 3 15IHU-82K1002RGE | |
| Cinebench R20 / CPU (Multi Core) | |
| Média da turma Gaming (4029 - 16433, n=106, últimos 2 anos) | |
| Lenovo Legion 5 15ACH-82JU00C6GE-FL | |
| Medion Erazer Deputy P25 | |
| Dell G15 5515 | |
| Schenker XMG Focus 15 | |
| Gigabyte G5 GD | |
| Lenovo Ideapad Gaming 3 15IHU-82K1002RGE | |
| Média Intel Core i5-11300H (1300 - 2533, n=10) | |
| Cinebench R20 / CPU (Single Core) | |
| Média da turma Gaming (442 - 913, n=106, últimos 2 anos) | |
| Gigabyte G5 GD | |
| Medion Erazer Deputy P25 | |
| Dell G15 5515 | |
| Lenovo Legion 5 15ACH-82JU00C6GE-FL | |
| Schenker XMG Focus 15 | |
| Média Intel Core i5-11300H (431 - 548, n=11) | |
| Lenovo Ideapad Gaming 3 15IHU-82K1002RGE | |
| Cinebench R15 / CPU Multi 64Bit | |
| Média da turma Gaming (1578 - 6330, n=105, últimos 2 anos) | |
| Lenovo Legion 5 15ACH-82JU00C6GE-FL | |
| Medion Erazer Deputy P25 | |
| Dell G15 5515 | |
| Schenker XMG Focus 15 | |
| Gigabyte G5 GD | |
| Lenovo Ideapad Gaming 3 15IHU-82K1002RGE | |
| Média Intel Core i5-11300H (632 - 990, n=11) | |
| Cinebench R15 / CPU Single 64Bit | |
| Média da turma Gaming (188.8 - 350, n=106, últimos 2 anos) | |
| Medion Erazer Deputy P25 | |
| Dell G15 5515 | |
| Lenovo Legion 5 15ACH-82JU00C6GE-FL | |
| Gigabyte G5 GD | |
| Schenker XMG Focus 15 | |
| Lenovo Ideapad Gaming 3 15IHU-82K1002RGE | |
| Média Intel Core i5-11300H (123 - 211, n=8) | |
| Blender / v2.79 BMW27 CPU | |
| Média Intel Core i5-11300H (466 - 862, n=10) | |
| Lenovo Ideapad Gaming 3 15IHU-82K1002RGE | |
| Gigabyte G5 GD | |
| Schenker XMG Focus 15 | |
| Dell G15 5515 | |
| Medion Erazer Deputy P25 | |
| Lenovo Legion 5 15ACH-82JU00C6GE-FL | |
| Média da turma Gaming (79 - 330, n=104, últimos 2 anos) | |
| 7-Zip 18.03 / 7z b 4 | |
| Média da turma Gaming (33491 - 148086, n=105, últimos 2 anos) | |
| Medion Erazer Deputy P25 | |
| Dell G15 5515 | |
| Lenovo Legion 5 15ACH-82JU00C6GE-FL | |
| Schenker XMG Focus 15 | |
| Gigabyte G5 GD | |
| Lenovo Ideapad Gaming 3 15IHU-82K1002RGE | |
| Média Intel Core i5-11300H (17573 - 26001, n=10) | |
| 7-Zip 18.03 / 7z b 4 -mmt1 | |
| Média da turma Gaming (4199 - 7436, n=105, últimos 2 anos) | |
| Dell G15 5515 | |
| Medion Erazer Deputy P25 | |
| Lenovo Legion 5 15ACH-82JU00C6GE-FL | |
| Schenker XMG Focus 15 | |
| Gigabyte G5 GD | |
| Média Intel Core i5-11300H (4603 - 4969, n=10) | |
| Lenovo Ideapad Gaming 3 15IHU-82K1002RGE | |
| Geekbench 5.5 / Multi-Core | |
| Média da turma Gaming (6460 - 28263, n=105, últimos 2 anos) | |
| Schenker XMG Focus 15 | |
| Lenovo Legion 5 15ACH-82JU00C6GE-FL | |
| Dell G15 5515 | |
| Medion Erazer Deputy P25 | |
| Gigabyte G5 GD | |
| Média Intel Core i5-11300H (3631 - 5499, n=10) | |
| Lenovo Ideapad Gaming 3 15IHU-82K1002RGE | |
| Geekbench 5.5 / Single-Core | |
| Média da turma Gaming (986 - 2474, n=105, últimos 2 anos) | |
| Gigabyte G5 GD | |
| Schenker XMG Focus 15 | |
| Medion Erazer Deputy P25 | |
| Lenovo Legion 5 15ACH-82JU00C6GE-FL | |
| Dell G15 5515 | |
| Média Intel Core i5-11300H (1342 - 1462, n=10) | |
| Lenovo Ideapad Gaming 3 15IHU-82K1002RGE | |
| HWBOT x265 Benchmark v2.2 / 4k Preset | |
| Média da turma Gaming (11.5 - 44.4, n=105, últimos 2 anos) | |
| Medion Erazer Deputy P25 | |
| Lenovo Legion 5 15ACH-82JU00C6GE-FL | |
| Dell G15 5515 | |
| Schenker XMG Focus 15 | |
| Gigabyte G5 GD | |
| Lenovo Ideapad Gaming 3 15IHU-82K1002RGE | |
| Média Intel Core i5-11300H (4.32 - 8.38, n=10) | |
| LibreOffice / 20 Documents To PDF | |
| Lenovo Legion 5 15ACH-82JU00C6GE-FL | |
| Dell G15 5515 | |
| Medion Erazer Deputy P25 | |
| Lenovo Ideapad Gaming 3 15IHU-82K1002RGE | |
| Média Intel Core i5-11300H (43.6 - 59.4, n=10) | |
| Média da turma Gaming (33.2 - 88.8, n=105, últimos 2 anos) | |
| Schenker XMG Focus 15 | |
| Gigabyte G5 GD | |
| R Benchmark 2.5 / Overall mean | |
| Média Intel Core i5-11300H (0.6 - 0.644, n=10) | |
| Lenovo Ideapad Gaming 3 15IHU-82K1002RGE | |
| Schenker XMG Focus 15 | |
| Gigabyte G5 GD | |
| Lenovo Legion 5 15ACH-82JU00C6GE-FL | |
| Medion Erazer Deputy P25 | |
| Dell G15 5515 | |
| Média da turma Gaming (0.3439 - 0.759, n=106, últimos 2 anos) | |
* ... menor é melhor
AIDA64: FP32 Ray-Trace | FPU Julia | CPU SHA3 | CPU Queen | FPU SinJulia | FPU Mandel | CPU AES | CPU ZLib | FP64 Ray-Trace | CPU PhotoWorxx
| Performance rating | |
| Média da turma Gaming | |
| Lenovo Legion 5 15ACH-82JU00C6GE-FL | |
| Dell G15 5515 | |
| Medion Erazer Deputy P25 | |
| Gigabyte G5 GD | |
| Lenovo Ideapad Gaming 3 15IHU-82K1002RGE | |
| Média Intel Core i5-11300H | |
| AIDA64 / FP32 Ray-Trace | |
| Média da turma Gaming (10227 - 85542, n=105, últimos 2 anos) | |
| Lenovo Legion 5 15ACH-82JU00C6GE-FL | |
| Medion Erazer Deputy P25 | |
| Dell G15 5515 | |
| Gigabyte G5 GD | |
| Lenovo Ideapad Gaming 3 15IHU-82K1002RGE | |
| Média Intel Core i5-11300H (6128 - 8440, n=9) | |
| AIDA64 / FPU Julia | |
| Média da turma Gaming (51376 - 238426, n=105, últimos 2 anos) | |
| Lenovo Legion 5 15ACH-82JU00C6GE-FL | |
| Medion Erazer Deputy P25 | |
| Dell G15 5515 | |
| Gigabyte G5 GD | |
| Lenovo Ideapad Gaming 3 15IHU-82K1002RGE | |
| Média Intel Core i5-11300H (25739 - 33986, n=9) | |
| AIDA64 / CPU SHA3 | |
| Média da turma Gaming (2180 - 10115, n=105, últimos 2 anos) | |
| Lenovo Legion 5 15ACH-82JU00C6GE-FL | |
| Medion Erazer Deputy P25 | |
| Dell G15 5515 | |
| Gigabyte G5 GD | |
| Lenovo Ideapad Gaming 3 15IHU-82K1002RGE | |
| Média Intel Core i5-11300H (1773 - 2286, n=9) | |
| AIDA64 / CPU Queen | |
| Média da turma Gaming (49785 - 173351, n=90, últimos 2 anos) | |
| Lenovo Legion 5 15ACH-82JU00C6GE-FL | |
| Medion Erazer Deputy P25 | |
| Dell G15 5515 | |
| Gigabyte G5 GD | |
| Lenovo Ideapad Gaming 3 15IHU-82K1002RGE | |
| Média Intel Core i5-11300H (41257 - 49312, n=9) | |
| AIDA64 / FPU SinJulia | |
| Média da turma Gaming (4424 - 33636, n=105, últimos 2 anos) | |
| Medion Erazer Deputy P25 | |
| Dell G15 5515 | |
| Lenovo Legion 5 15ACH-82JU00C6GE-FL | |
| Gigabyte G5 GD | |
| Lenovo Ideapad Gaming 3 15IHU-82K1002RGE | |
| Média Intel Core i5-11300H (3925 - 4677, n=9) | |
| AIDA64 / FPU Mandel | |
| Média da turma Gaming (25115 - 128721, n=105, últimos 2 anos) | |
| Lenovo Legion 5 15ACH-82JU00C6GE-FL | |
| Medion Erazer Deputy P25 | |
| Dell G15 5515 | |
| Gigabyte G5 GD | |
| Lenovo Ideapad Gaming 3 15IHU-82K1002RGE | |
| Média Intel Core i5-11300H (15820 - 20669, n=9) | |
| AIDA64 / CPU AES | |
| Lenovo Legion 5 15ACH-82JU00C6GE-FL | |
| Dell G15 5515 | |
| Média da turma Gaming (39258 - 247074, n=105, últimos 2 anos) | |
| Gigabyte G5 GD | |
| Lenovo Ideapad Gaming 3 15IHU-82K1002RGE | |
| Média Intel Core i5-11300H (37694 - 71519, n=9) | |
| Medion Erazer Deputy P25 | |
| AIDA64 / CPU ZLib | |
| Média da turma Gaming (574 - 2531, n=105, últimos 2 anos) | |
| Lenovo Legion 5 15ACH-82JU00C6GE-FL | |
| Medion Erazer Deputy P25 | |
| Dell G15 5515 | |
| Gigabyte G5 GD | |
| Lenovo Ideapad Gaming 3 15IHU-82K1002RGE | |
| Média Intel Core i5-11300H (269 - 390, n=9) | |
| AIDA64 / FP64 Ray-Trace | |
| Média da turma Gaming (5509 - 45446, n=105, últimos 2 anos) | |
| Medion Erazer Deputy P25 | |
| Lenovo Legion 5 15ACH-82JU00C6GE-FL | |
| Dell G15 5515 | |
| Gigabyte G5 GD | |
| Lenovo Ideapad Gaming 3 15IHU-82K1002RGE | |
| Média Intel Core i5-11300H (3322 - 4613, n=9) | |
| AIDA64 / CPU PhotoWorxx | |
| Média da turma Gaming (12271 - 89891, n=105, últimos 2 anos) | |
| Gigabyte G5 GD | |
| Média Intel Core i5-11300H (9705 - 38002, n=9) | |
| Dell G15 5515 | |
| Lenovo Legion 5 15ACH-82JU00C6GE-FL | |
| Medion Erazer Deputy P25 | |
| Lenovo Ideapad Gaming 3 15IHU-82K1002RGE | |
Desempenho do sistema
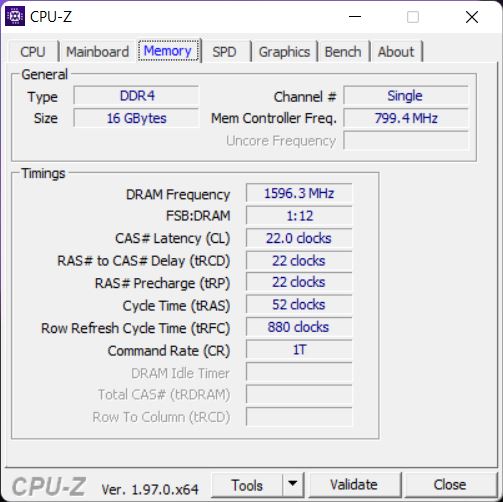
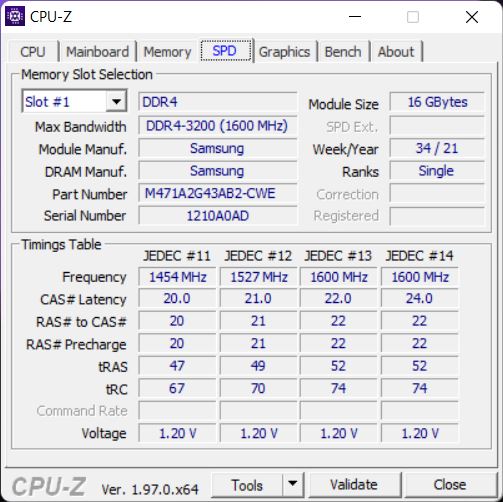
Subjetivamente, o dispositivo funcionou muito bem e respondeu instantaneamente à entrada. Em contraste, muitas vezes teve um desempenho bastante ruim em benchmarks e só conseguiu garantir um dos pontos no final da lista. Este desempenho ruim deve-se em parte ao fato de a CPU não apresentar mais de quatro núcleos e em parte porque nossa unidade de revisão foi equipada com apenas um único módulo DDR4-3200 RAM rodando em modo de canal único.
CrossMark: Overall | Productivity | Creativity | Responsiveness
| PCMark 10 / Score | |
| Média da turma Gaming (5828 - 12414, n=93, últimos 2 anos) | |
| Medion Erazer Deputy P25 | |
| Lenovo Legion 5 15ACH-82JU00C6GE-FL | |
| Schenker XMG Focus 15 | |
| Dell G15 5515 | |
| Gigabyte G5 GD | |
| Lenovo Ideapad Gaming 3 15IHU-82K1002RGE | |
| Média Intel Core i5-11300H, NVIDIA GeForce RTX 3050 Ti Laptop GPU (5442 - 5641, n=2) | |
| PCMark 10 / Essentials | |
| Média da turma Gaming (8810 - 11935, n=97, últimos 2 anos) | |
| Lenovo Legion 5 15ACH-82JU00C6GE-FL | |
| Schenker XMG Focus 15 | |
| Medion Erazer Deputy P25 | |
| Dell G15 5515 | |
| Gigabyte G5 GD | |
| Média Intel Core i5-11300H, NVIDIA GeForce RTX 3050 Ti Laptop GPU (8524 - 8829, n=2) | |
| Lenovo Ideapad Gaming 3 15IHU-82K1002RGE | |
| PCMark 10 / Productivity | |
| Média da turma Gaming (6845 - 25323, n=95, últimos 2 anos) | |
| Lenovo Legion 5 15ACH-82JU00C6GE-FL | |
| Lenovo Ideapad Gaming 3 15IHU-82K1002RGE | |
| Medion Erazer Deputy P25 | |
| Schenker XMG Focus 15 | |
| Dell G15 5515 | |
| Gigabyte G5 GD | |
| Média Intel Core i5-11300H, NVIDIA GeForce RTX 3050 Ti Laptop GPU (7664 - 9112, n=2) | |
| PCMark 10 / Digital Content Creation | |
| Média da turma Gaming (7602 - 19954, n=95, últimos 2 anos) | |
| Medion Erazer Deputy P25 | |
| Schenker XMG Focus 15 | |
| Lenovo Legion 5 15ACH-82JU00C6GE-FL | |
| Dell G15 5515 | |
| Gigabyte G5 GD | |
| Média Intel Core i5-11300H, NVIDIA GeForce RTX 3050 Ti Laptop GPU (6271 - 6462, n=2) | |
| Lenovo Ideapad Gaming 3 15IHU-82K1002RGE | |
| CrossMark / Overall | |
| Média da turma Gaming (1366 - 2409, n=94, últimos 2 anos) | |
| Lenovo Ideapad Gaming 3 15IHU-82K1002RGE | |
| Média Intel Core i5-11300H, NVIDIA GeForce RTX 3050 Ti Laptop GPU (n=1) | |
| CrossMark / Productivity | |
| Média da turma Gaming (1386 - 2254, n=94, últimos 2 anos) | |
| Lenovo Ideapad Gaming 3 15IHU-82K1002RGE | |
| Média Intel Core i5-11300H, NVIDIA GeForce RTX 3050 Ti Laptop GPU (n=1) | |
| CrossMark / Creativity | |
| Média da turma Gaming (1343 - 2786, n=94, últimos 2 anos) | |
| Lenovo Ideapad Gaming 3 15IHU-82K1002RGE | |
| Média Intel Core i5-11300H, NVIDIA GeForce RTX 3050 Ti Laptop GPU (n=1) | |
| CrossMark / Responsiveness | |
| Média da turma Gaming (1226 - 2334, n=94, últimos 2 anos) | |
| Lenovo Ideapad Gaming 3 15IHU-82K1002RGE | |
| Média Intel Core i5-11300H, NVIDIA GeForce RTX 3050 Ti Laptop GPU (n=1) | |
| PCMark 10 Score | 5641 pontos | |
Ajuda | ||
| AIDA64 / Memory Copy | |
| Média da turma Gaming (21750 - 129946, n=105, últimos 2 anos) | |
| Gigabyte G5 GD | |
| Dell G15 5515 | |
| Medion Erazer Deputy P25 | |
| Lenovo Legion 5 15ACH-82JU00C6GE-FL | |
| Média Intel Core i5-11300H (19947 - 60141, n=9) | |
| Lenovo Ideapad Gaming 3 15IHU-82K1002RGE | |
| AIDA64 / Memory Read | |
| Média da turma Gaming (22956 - 118858, n=105, últimos 2 anos) | |
| Gigabyte G5 GD | |
| Dell G15 5515 | |
| Lenovo Legion 5 15ACH-82JU00C6GE-FL | |
| Medion Erazer Deputy P25 | |
| Média Intel Core i5-11300H (22688 - 62684, n=9) | |
| Lenovo Ideapad Gaming 3 15IHU-82K1002RGE | |
| AIDA64 / Memory Write | |
| Média da turma Gaming (22297 - 135096, n=105, últimos 2 anos) | |
| Gigabyte G5 GD | |
| Média Intel Core i5-11300H (20959 - 65245, n=9) | |
| Medion Erazer Deputy P25 | |
| Dell G15 5515 | |
| Lenovo Legion 5 15ACH-82JU00C6GE-FL | |
| Lenovo Ideapad Gaming 3 15IHU-82K1002RGE | |
| AIDA64 / Memory Latency | |
| Média da turma Gaming (75.3 - 259, n=105, últimos 2 anos) | |
| Gigabyte G5 GD | |
| Lenovo Ideapad Gaming 3 15IHU-82K1002RGE | |
| Média Intel Core i5-11300H (76.3 - 93.6, n=9) | |
| Lenovo Legion 5 15ACH-82JU00C6GE-FL | |
| Medion Erazer Deputy P25 | |
| Dell G15 5515 | |
* ... menor é melhor
Latências DPC
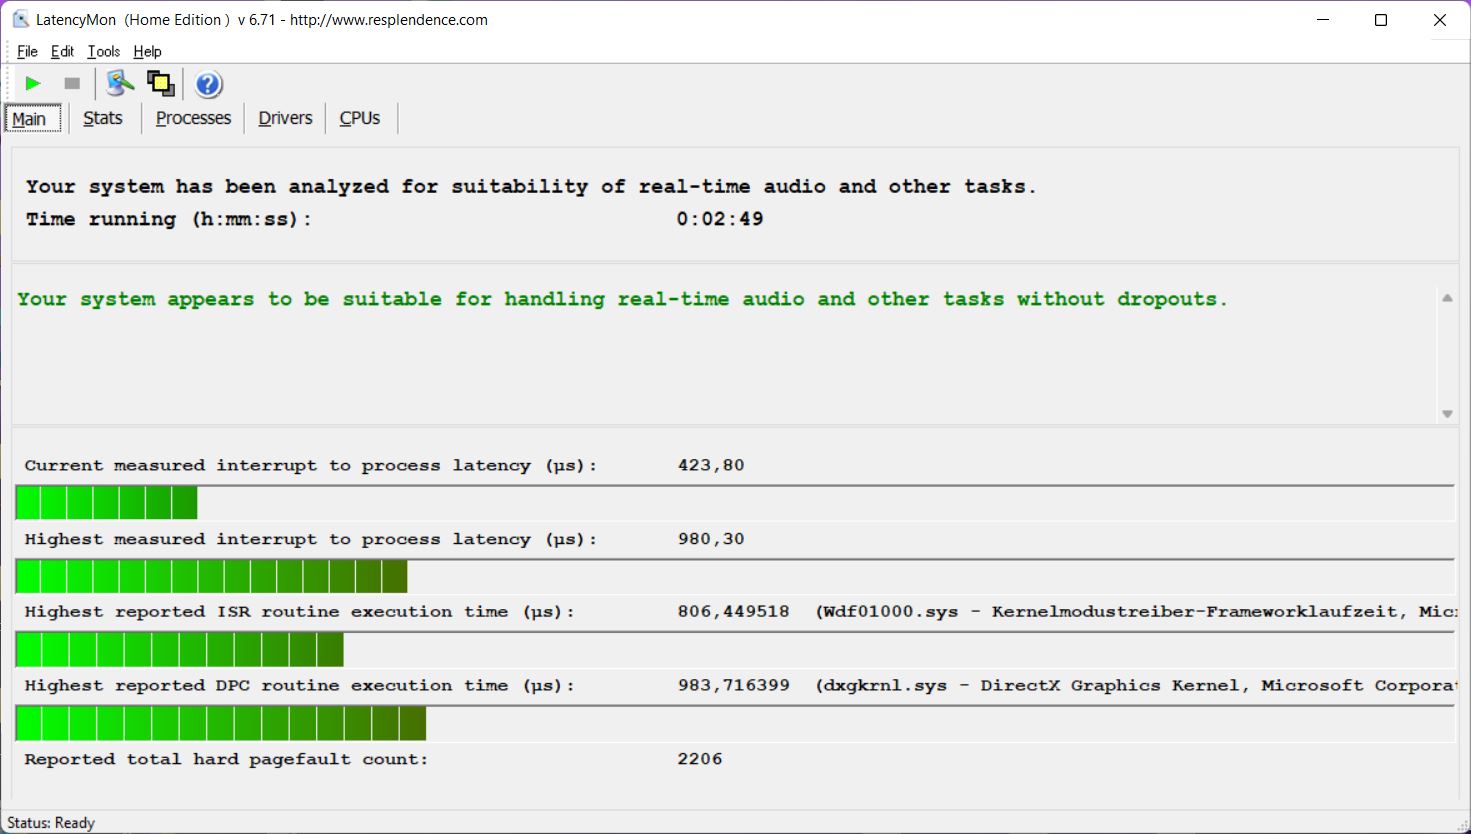
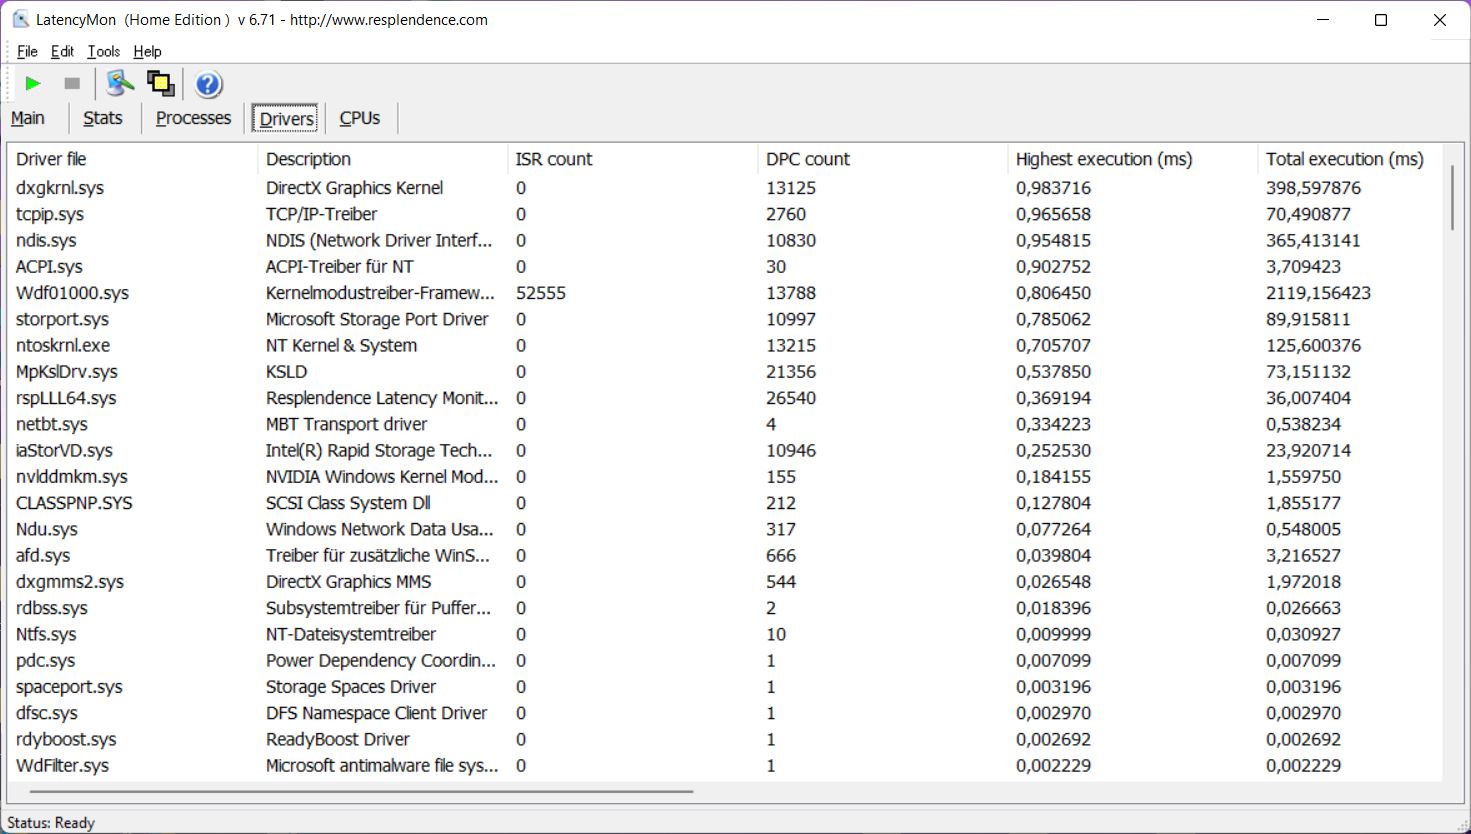
Nosso teste de latência não revelou grandes problemas com a mais recente BIOS disponível no momento em que escrevemos. Com isso, encontramos alguns quadros descartados durante nosso teste de reprodução de vídeo de 4K.
| DPC Latencies / LatencyMon - interrupt to process latency (max), Web, Youtube, Prime95 | |
| Medion Erazer Deputy P25 | |
| Lenovo Ideapad Gaming 3 15IHU-82K1002RGE | |
| Lenovo Legion 5 15ACH-82JU00C6GE-FL | |
| Dell G15 5515 | |
| Schenker XMG Focus 15 | |
| Gigabyte G5 GD | |
* ... menor é melhor
Dispositivos de armazenamento
Dentro do IdeaPad Gaming 3 encontramos um SSD M.2-2280 feito pela Micron conectado a uma interface PCIe 3.0 x4. Ele teve desempenho rápido o suficiente para o uso diário, mas não particularmente rápido quando comparado com seus concorrentes. Após a primeira inicialização, encontramos um total de 424 GB de espaço livre no SSD de 512 GB, e o dispositivo também apresenta um slot secundário de 2,5 polegadas. Nota: todos os SKUs vendidos nos Estados Unidos apresentam um disco rígido de 1 TB emparelhado com um SSD de 256 GB, por padrão. Benchmarks adicionais de SSD podem ser encontrados aqui.

* ... menor é melhor
Sustained Read: DiskSpd Read Loop, Queue Depth 8
Desempenho gráfico
O IdeaPad Gaming 3 suporta Nvidia Optimus para comutação totalmente automática da GPU baseada em carga entre a GPU dedicada e a GPU integrada. Entretanto, falta-lhe suporte para MUX (Advanced Optimus), e o aplicativo Vantage não suporta o pino da GPU para o chip dedicado GeForce. A única forma suportada de pino de GPU é através da configuração da BIOS que permite desativar a GPU dedicada e usando exclusivamente a integradaIris Xe.
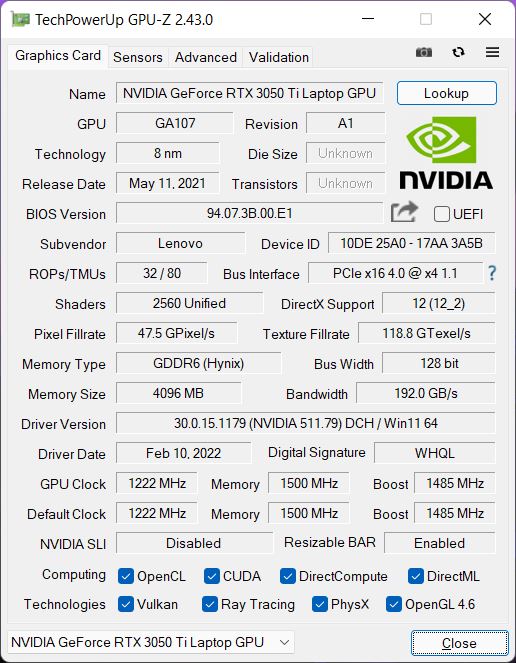
O chipGeForce RTX 3050 Ti instalado é o modelo mais rápido disponível com um TGP de 90 W e uma velocidade máxima de relógio de 1.702 MHz. Em nossos benchmarks, o dispositivo foi executado acima da média para um dispositivo RTX 3050 Ti. Dito isto, vários RTX 3050 Ti e RTX 3060- concorrentes equipados conseguiram superar ligeiramente o desempenho do IdeaPad Gaming 3. O desempenho da GPU é consistente com o tempo, e o IdeaPad Gaming 3 completou o teste de estresse Time Spy com uma pontuação de 98,5 %.
O desempenho da GPU é limitado a apenas 30 W na bateria. Assim, o IdeaPad Gaming 3 sofre uma perda de desempenho de 50% (2.815 vs. 5.677 em Time Spy Graphics). Benchmarks adicionais de GPU podem ser encontrados em nosso seção de tecnologia.
| 3DMark 11 Performance | 15615 pontos | |
| 3DMark Cloud Gate Standard Score | 26518 pontos | |
| 3DMark Fire Strike Score | 11894 pontos | |
| 3DMark Time Spy Score | 5512 pontos | |
Ajuda | ||
Desempenho nos jogos
No papel, o desempenho dos jogos deve ser decente mesmo com jogos atuais, tais como Cyberpunk 2077, funcionando sem problemas em ambientes mais altos. Entretanto, como já observamos durante nossos benchmarks de CPU, a CPU comparativamente lenta é a principal responsável pelo desempenho do IdeaPad Gaming 3 um pouco pior do que a maioria de seus concorrentes. Durante nosso loop Witcher 3 pudemos descobrir que o desempenho gráfico permaneceu consistente durante longos períodos de tempo. Na bateria, Witcher 3 Ultra caiu de 47 FPS para apenas 32 FPS. Benchmarks adicionais de jogos podem ser encontrados aqui
| The Witcher 3 | |
| 1920x1080 High Graphics & Postprocessing (Nvidia HairWorks Off) | |
| Média da turma Gaming (341 - 404, n=2, últimos 2 anos) | |
| Lenovo Legion 5 15ACH-82JU00C6GE-FL | |
| Medion Erazer Deputy P25 | |
| Schenker XMG Focus 15 | |
| Dell G15 5515 | |
| Gigabyte G5 GD | |
| Lenovo Ideapad Gaming 3 15IHU-82K1002RGE | |
| Média NVIDIA GeForce RTX 3050 Ti Laptop GPU (30 - 110, n=26) | |
| 1920x1080 Ultra Graphics & Postprocessing (HBAO+) | |
| Média da turma Gaming (104.7 - 240, n=7, últimos 2 anos) | |
| Medion Erazer Deputy P25 | |
| Lenovo Legion 5 15ACH-82JU00C6GE-FL (Ultra Performance) | |
| Lenovo Legion 5 15ACH-82JU00C6GE-FL (Auto) | |
| Lenovo Legion 5 15ACH-82JU00C6GE-FL (Eco) | |
| Dell G15 5515 | |
| Schenker XMG Focus 15 | |
| Gigabyte G5 GD | |
| Média NVIDIA GeForce RTX 3050 Ti Laptop GPU (19 - 58.5, n=29) | |
| Lenovo Ideapad Gaming 3 15IHU-82K1002RGE | |
| Final Fantasy XV Benchmark | |
| 1920x1080 High Quality | |
| Média da turma Gaming (41 - 215, n=95, últimos 2 anos) | |
| Lenovo Legion 5 15ACH-82JU00C6GE-FL (1.3) | |
| Medion Erazer Deputy P25 | |
| Schenker XMG Focus 15 | |
| Dell G15 5515 (1.3) | |
| Média NVIDIA GeForce RTX 3050 Ti Laptop GPU (23.5 - 106, n=24) | |
| Gigabyte G5 GD (1.3) | |
| Lenovo Ideapad Gaming 3 15IHU-82K1002RGE (1.3) | |
| 1920x1080 Standard Quality | |
| Média da turma Gaming (85.7 - 236, n=82, últimos 2 anos) | |
| Lenovo Legion 5 15ACH-82JU00C6GE-FL (1.3) | |
| Schenker XMG Focus 15 | |
| Dell G15 5515 (1.3) | |
| Gigabyte G5 GD (1.3) | |
| Média NVIDIA GeForce RTX 3050 Ti Laptop GPU (33.4 - 106, n=24) | |
| Lenovo Ideapad Gaming 3 15IHU-82K1002RGE (1.3) | |
| Strange Brigade | |
| 1920x1080 high AA:high AF:8 | |
| Média da turma Gaming (129.5 - 494, n=75, últimos 2 anos) | |
| Medion Erazer Deputy P25 (1.47.22.14 D3D12) | |
| Schenker XMG Focus 15 (1.47.22.14 D3D12) | |
| Dell G15 5515 (1.47.22.14 D3D12) | |
| Lenovo Ideapad Gaming 3 15IHU-82K1002RGE (1.47.22.14 D3D12) | |
| Gigabyte G5 GD (1.47.22.14 D3D12) | |
| Média NVIDIA GeForce RTX 3050 Ti Laptop GPU (79.2 - 117.3, n=23) | |
| 1920x1080 ultra AA:ultra AF:16 | |
| Média da turma Gaming (76.3 - 458, n=87, últimos 2 anos) | |
| Medion Erazer Deputy P25 (1.47.22.14 D3D12) | |
| Dell G15 5515 (1.47.22.14 D3D12) | |
| Schenker XMG Focus 15 (1.47.22.14 D3D12) | |
| Gigabyte G5 GD (1.47.22.14 D3D12) | |
| Lenovo Ideapad Gaming 3 15IHU-82K1002RGE (1.47.22.14 D3D12) | |
| Média NVIDIA GeForce RTX 3050 Ti Laptop GPU (34.8 - 101.3, n=25) | |
| F1 2021 | |
| 1920x1080 High Preset AA:T AF:16x | |
| Lenovo Legion 5 15ACH-82JU00C6GE-FL | |
| Dell G15 5515 (807588) | |
| Gigabyte G5 GD (824817) | |
| Média NVIDIA GeForce RTX 3050 Ti Laptop GPU (68 - 131, n=11) | |
| Lenovo Ideapad Gaming 3 15IHU-82K1002RGE (852849) | |
| 1920x1080 Ultra High Preset + Raytracing AA:T AF:16x | |
| Lenovo Legion 5 15ACH-82JU00C6GE-FL | |
| Dell G15 5515 (807588) | |
| Gigabyte G5 GD (824817) | |
| Média NVIDIA GeForce RTX 3050 Ti Laptop GPU (44.4 - 69, n=11) | |
| Lenovo Ideapad Gaming 3 15IHU-82K1002RGE (852849) | |
Witcher 3 FPS Graph
| baixo | média | alto | ultra | |
|---|---|---|---|---|
| GTA V (2015) | 134 | 118 | 85.6 | 55 |
| The Witcher 3 (2015) | 172 | 136 | 91 | 47.1 |
| Dota 2 Reborn (2015) | 115 | 103 | 94.5 | 90.6 |
| Final Fantasy XV Benchmark (2018) | 98.9 | 68.9 | 47.9 | |
| X-Plane 11.11 (2018) | 87.5 | 72 | 61 | |
| Far Cry 5 (2018) | 88 | 67 | 66 | 62 |
| Strange Brigade (2018) | 208 | 129 | 106 | 90 |
| F1 2021 (2021) | 157 | 102 | 82.3 | 44.4 |
| GRID Legends (2022) | 91 | 84 | 73 | 56 |
| Cyberpunk 2077 1.6 (2022) | 55 | 50 | 39 | 37 |
Emissões - Laptop de jogos Lenovo
Emissões sonoras
O desempenho do ventilador pode ser facilmente ajustado ao seu gosto, graças aos três perfis de potência disponíveis. Por exemplo, você pode esperar emissões ocasionais de ruído perceptíveis com o perfil de desempenho ativado e é melhor selecionar o perfil Silencioso se você insistir no silêncio final sem ventilador ou outros ruídos, tais como choro de bobina.
Sob carga, encontramos diferenças significativas entre emissões de ruído enquanto jogamos e emissões de ruído durante nosso teste de estresse torturando tanto a CPU quanto a GPU em sua totalidade. Ao jogar, o IdeaPad permaneceu comparativamente silencioso a apenas 43 dB(A) mesmo com o perfil de desempenho habilitado. Entretanto, sugerimos enfaticamente testar seus jogos nos outros dois perfis de potência, assim como alguns de vocês podem se beneficiar de ventiladores mais silenciosos sem sacrificar muito o desempenho. A tabela a seguir mostra as emissões de ruído dos ventiladores nos três perfis durante ambos os jogos e nosso teste de estresse.
| Cenário | Silencioso | Automático | Desempenho |
|---|---|---|---|
| Witcher 3 Ultra | 35,2 dB(A) (46 FPS) | 39,8 dB(A) (47 FPS) | 43,5 dB(A) (47 FPS) |
| Cyberpunk 2077 1,5 Ultra | 35,2 dB(A) (27 FPS) | 39,8 dB(A) (29 FPS) | 43,5 dB(A) (37 FPS) |
| Teste de estresse | 35,2 dB(A) | 48,3 dB(A) | 53,1 dB(A) |
Barulho
| Ocioso |
| 23.9 / 26.8 / 26.8 dB |
| Carga |
| 43.5 / 53.1 dB |
 | ||
30 dB silencioso 40 dB(A) audível 50 dB(A) ruidosamente alto |
||
min: | ||
| Lenovo Ideapad Gaming 3 15IHU-82K1002RGE GeForce RTX 3050 Ti Laptop GPU, i5-11300H, Micron 2210 MTFDHBA512QFD | Dell G15 5515 GeForce RTX 3050 Ti Laptop GPU, R7 5800H, Samsung PM991a MZ9LQ512HBLU-00BD1 | Gigabyte G5 GD GeForce RTX 3050 4GB Laptop GPU, i5-11400H, ESR512GTLG-E6GBTNB4 | Medion Erazer Deputy P25 GeForce RTX 3060 Laptop GPU, R7 5800H, Phison E12S-512GB-Phison-SSD-BICS4 | Schenker XMG Focus 15 GeForce RTX 3050 Ti Laptop GPU, i7-11800H, Samsung SSD 970 EVO Plus 1TB | Lenovo Legion 5 15ACH-82JU00C6GE-FL GeForce RTX 3060 Laptop GPU, R7 5800H, Micron 2300 512GB MTFDHBA512TDV | |
|---|---|---|---|---|---|---|
| Noise | -1% | -14% | -16% | -21% | -12% | |
| desligado / ambiente * (dB) | 23.9 | 24 -0% | 24 -0% | 25 -5% | 24 -0% | 24.2 -1% |
| Idle Minimum * (dB) | 23.9 | 25 -5% | 29 -21% | 27 -13% | 25 -5% | 29 -21% |
| Idle Average * (dB) | 26.8 | 26 3% | 30 -12% | 29 -8% | 30 -12% | 29 -8% |
| Idle Maximum * (dB) | 26.8 | 30 -12% | 32 -19% | 31 -16% | 43 -60% | 29 -8% |
| Load Average * (dB) | 43.5 | 44 -1% | 53 -22% | 57 -31% | 56 -29% | 53.5 -23% |
| Witcher 3 ultra * (dB) | 43.5 | 44 -1% | 52 -20% | 56 -29% | 56 -29% | 53.5 -23% |
| Load Maximum * (dB) | 53.1 | 48 10% | 54 -2% | 58 -9% | 58 -9% | 53.5 -1% |
* ... menor é melhor
Temperatura
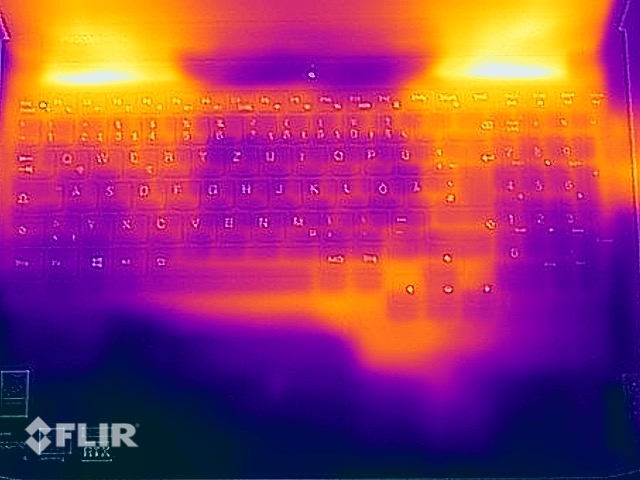
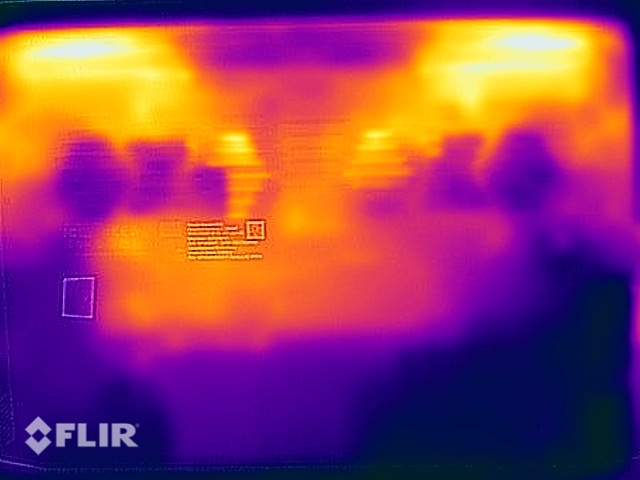
O sistema de resfriamento do IdeaPad Gaming 3 faz um trabalho decente, e as temperaturas de superfície permaneceram relativamente baixas enquanto jogava. Somente no fundo conseguimos encontrar um único ponto quente atingindo um máximo de 45 °C, o que significa que o dispositivo deve ser facilmente utilizável em seu colo. O laptop permaneceu muito frio quando ocioso e em situações de baixa carga.
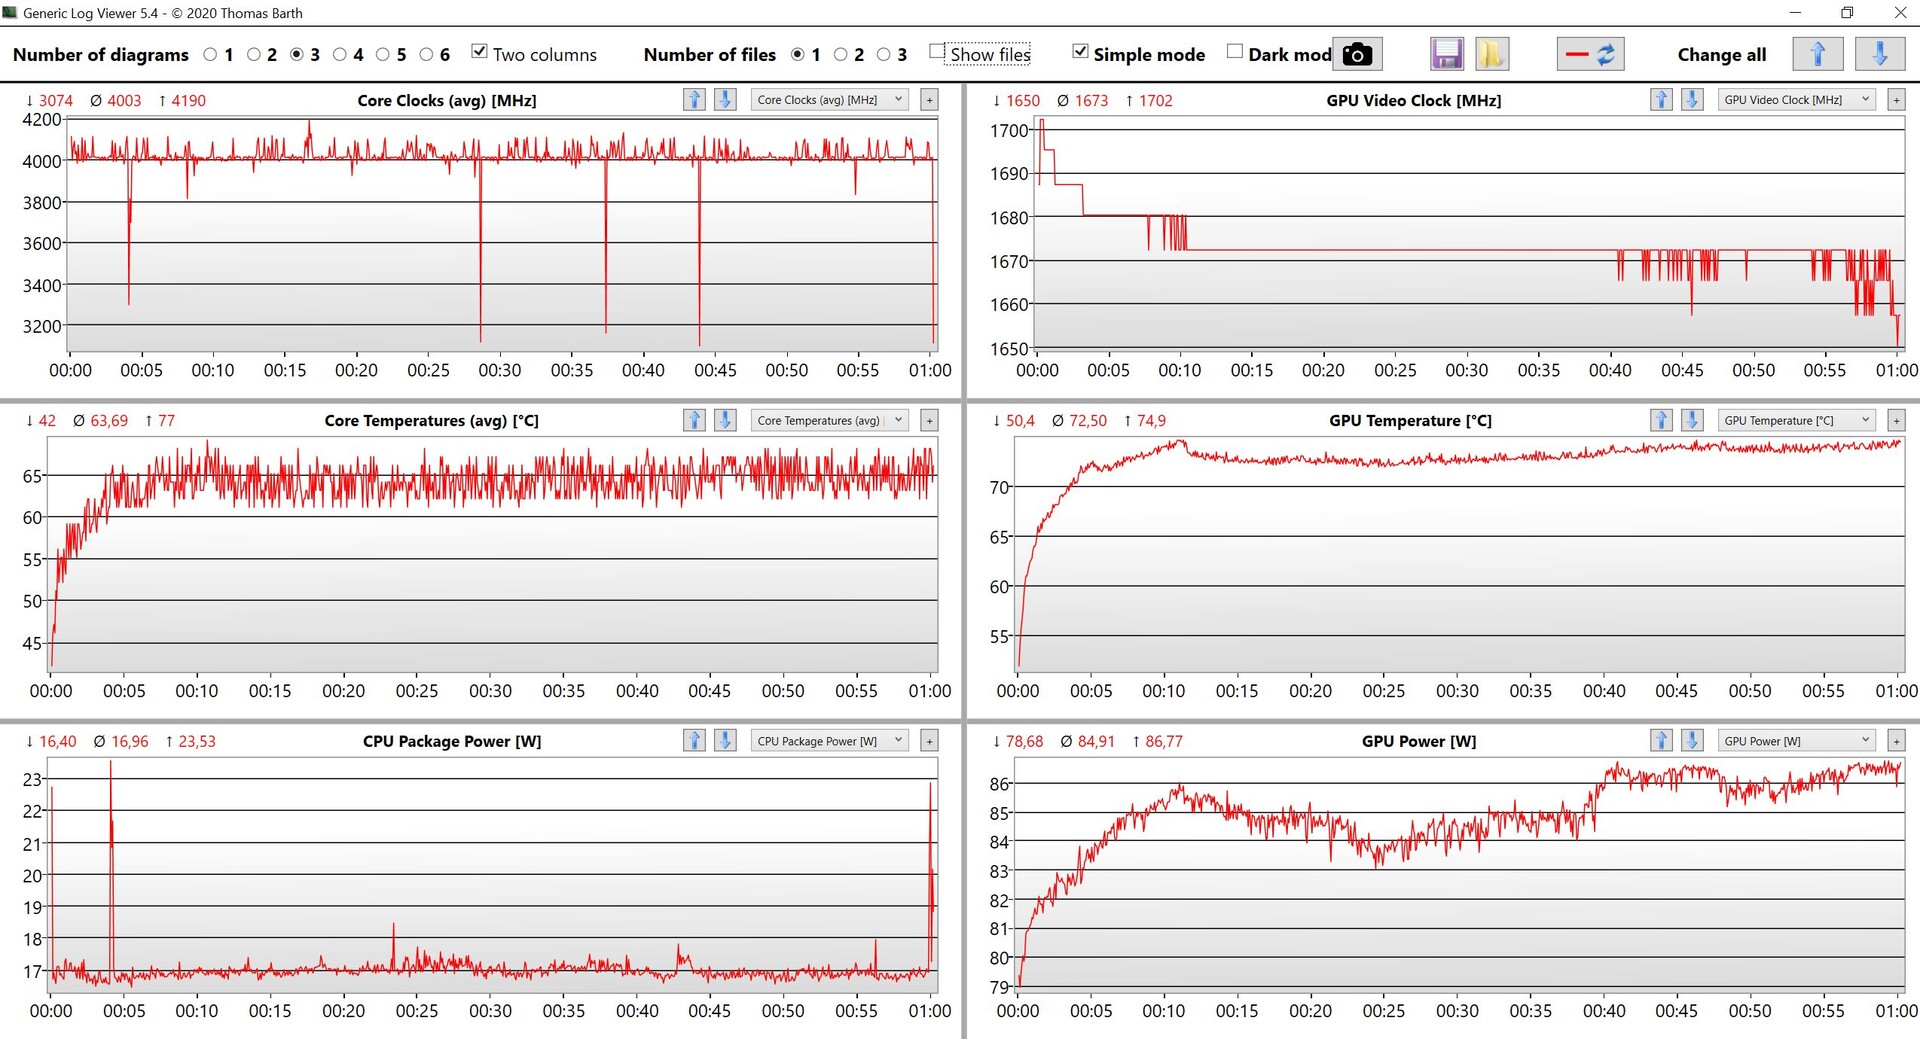
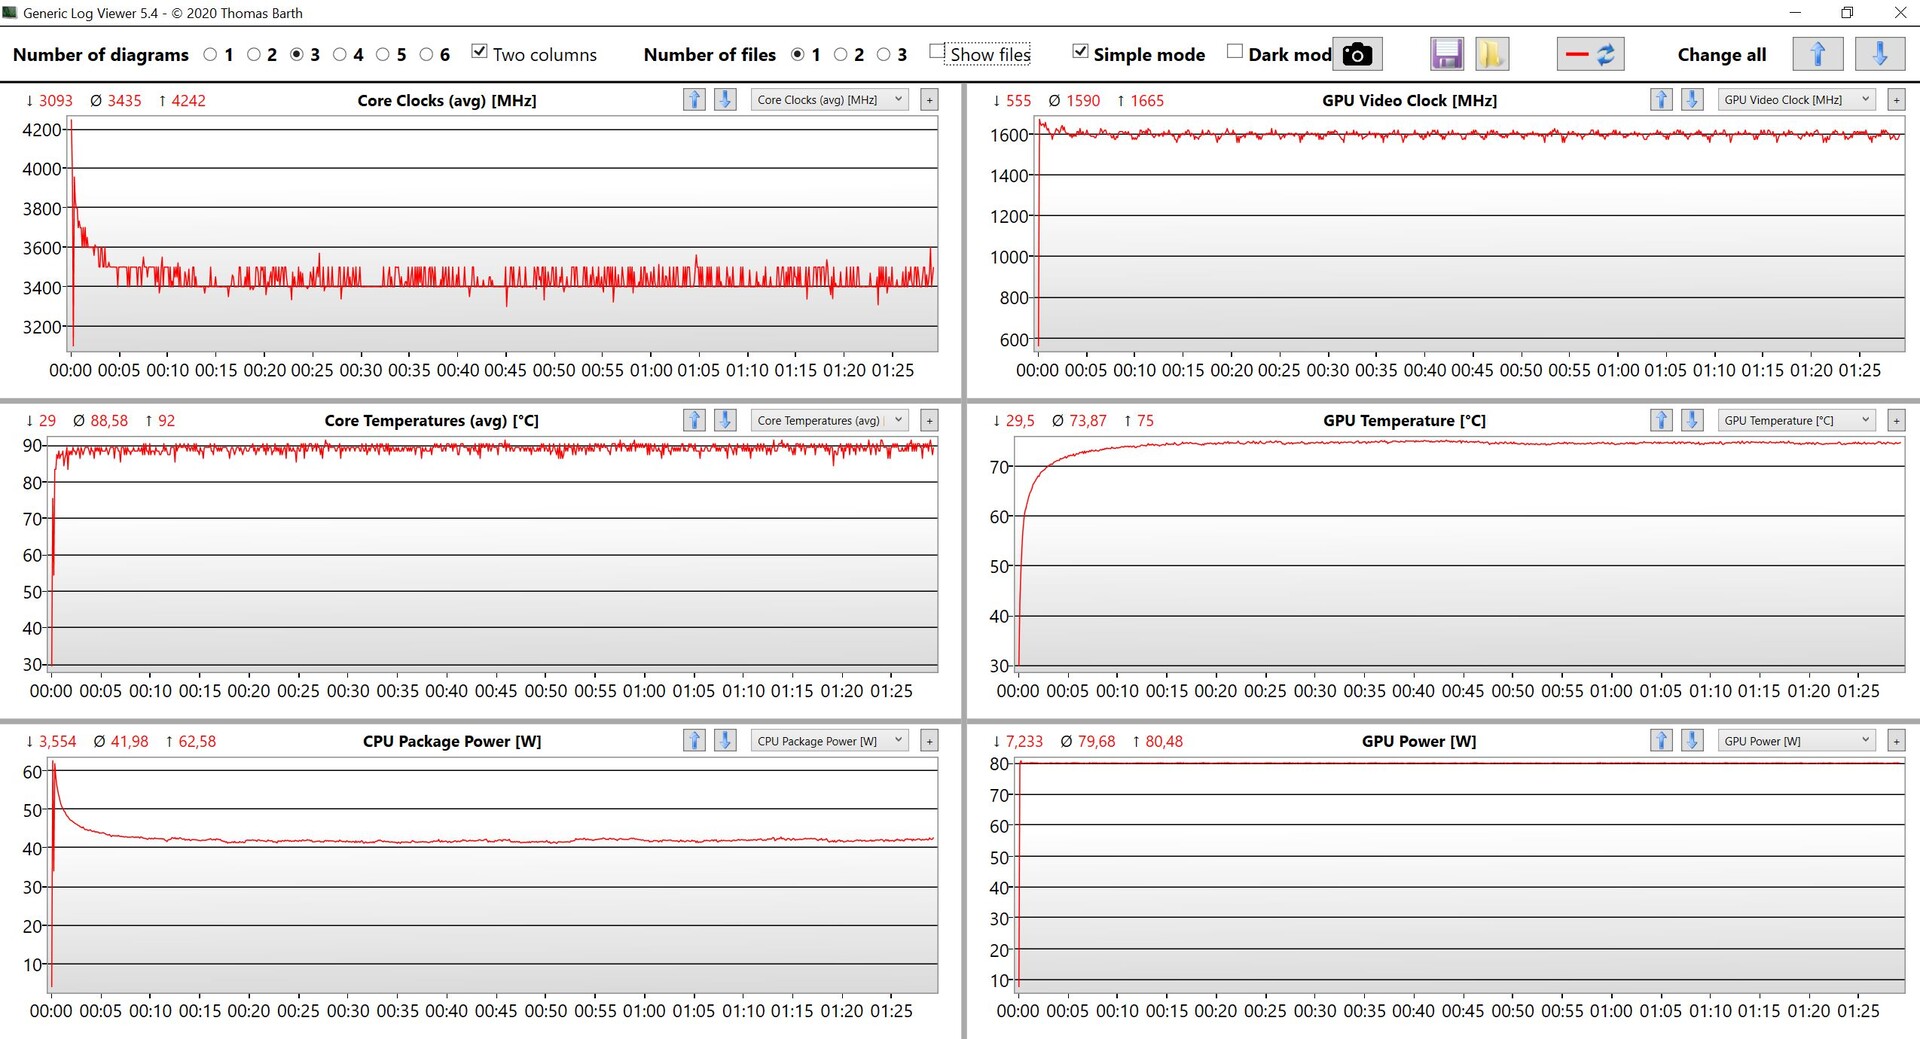
Durante nosso teste de estresse, encontramos tanto CPU (42 W) quanto GPU dedicado (80 W) consistentes durante longos períodos de tempo, e o desempenho não foi impedido de forma alguma imediatamente após o teste de estresse.
(±) A temperatura máxima no lado superior é 43.2 °C / 110 F, em comparação com a média de 40.4 °C / 105 F , variando de 21.2 a 68.8 °C para a classe Gaming.
(-) A parte inferior aquece até um máximo de 47.9 °C / 118 F, em comparação com a média de 43.2 °C / 110 F
(+) Em uso inativo, a temperatura média para o lado superior é 24.2 °C / 76 F, em comparação com a média do dispositivo de 33.9 °C / ### class_avg_f### F.
(±) Jogando The Witcher 3, a temperatura média para o lado superior é 35.5 °C / 96 F, em comparação com a média do dispositivo de 33.9 °C / ## #class_avg_f### F.
(±) Os apoios para as mãos e o touchpad podem ficar muito quentes ao toque, com um máximo de 38.2 °C / 100.8 F.
(-) A temperatura média da área do apoio para as mãos de dispositivos semelhantes foi 28.8 °C / 83.8 F (-9.4 °C / -17 F).
| Lenovo Ideapad Gaming 3 15IHU-82K1002RGE Intel Core i5-11300H, NVIDIA GeForce RTX 3050 Ti Laptop GPU | Dell G15 5515 AMD Ryzen 7 5800H, NVIDIA GeForce RTX 3050 Ti Laptop GPU | Gigabyte G5 GD Intel Core i5-11400H, NVIDIA GeForce RTX 3050 4GB Laptop GPU | Medion Erazer Deputy P25 AMD Ryzen 7 5800H, NVIDIA GeForce RTX 3060 Laptop GPU | Schenker XMG Focus 15 Intel Core i7-11800H, NVIDIA GeForce RTX 3050 Ti Laptop GPU | Lenovo Legion 5 15ACH-82JU00C6GE-FL AMD Ryzen 7 5800H, NVIDIA GeForce RTX 3060 Laptop GPU | |
|---|---|---|---|---|---|---|
| Heat | -5% | -9% | 4% | -25% | -1% | |
| Maximum Upper Side * (°C) | 43.2 | 50 -16% | 45 -4% | 37 14% | 43 -0% | 42.6 1% |
| Maximum Bottom * (°C) | 47.9 | 49 -2% | 50 -4% | 40 16% | 46 4% | 52.2 -9% |
| Idle Upper Side * (°C) | 24.9 | 26 -4% | 28 -12% | 27 -8% | 39 -57% | 24.9 -0% |
| Idle Bottom * (°C) | 27 | 26 4% | 31 -15% | 29 -7% | 40 -48% | 25.3 6% |
* ... menor é melhor
Oradores
Os alto-falantes estéreo são classificados em 2 W cada e são suficientemente altos, mas muito metálicos no geral. E enquanto o software Nahimic pré-carregado permite algum ajuste fino notável usando perfis pré-instalados, encontramos outros laptops com um desempenho muito melhor a esse respeito. Assim, sugerimos fortemente a conexão de alto-falantes externos ou fones de ouvido para a maioria dos casos de uso, desde jogos até música.
Lenovo Ideapad Gaming 3 15IHU-82K1002RGE análise de áudio
(±) | o volume do alto-falante é médio, mas bom (###valor### dB)
Graves 100 - 315Hz
(-) | quase nenhum baixo - em média 23.8% menor que a mediana
(±) | a linearidade dos graves é média (10.3% delta para a frequência anterior)
Médios 400 - 2.000 Hz
(±) | médios mais altos - em média 6.7% maior que a mediana
(+) | médios são lineares (6% delta para frequência anterior)
Altos 2 - 16 kHz
(+) | agudos equilibrados - apenas 3.6% longe da mediana
(±) | a linearidade dos máximos é média (7.4% delta para frequência anterior)
Geral 100 - 16.000 Hz
(±) | a linearidade do som geral é média (20.7% diferença em relação à mediana)
Comparado com a mesma classe
» 74% de todos os dispositivos testados nesta classe foram melhores, 4% semelhantes, 21% piores
» O melhor teve um delta de 6%, a média foi 18%, o pior foi 132%
Comparado com todos os dispositivos testados
» 56% de todos os dispositivos testados foram melhores, 8% semelhantes, 36% piores
» O melhor teve um delta de 4%, a média foi 23%, o pior foi 134%
Lenovo Legion 5 15ACH-82JU00C6GE-FL análise de áudio
(±) | o volume do alto-falante é médio, mas bom (###valor### dB)
Graves 100 - 315Hz
(-) | quase nenhum baixo - em média 22.1% menor que a mediana
(±) | a linearidade dos graves é média (11.4% delta para a frequência anterior)
Médios 400 - 2.000 Hz
(+) | médios equilibrados - apenas 4.5% longe da mediana
(+) | médios são lineares (5% delta para frequência anterior)
Altos 2 - 16 kHz
(+) | agudos equilibrados - apenas 2.9% longe da mediana
(+) | os máximos são lineares (4.5% delta da frequência anterior)
Geral 100 - 16.000 Hz
(±) | a linearidade do som geral é média (17.8% diferença em relação à mediana)
Comparado com a mesma classe
» 53% de todos os dispositivos testados nesta classe foram melhores, 10% semelhantes, 37% piores
» O melhor teve um delta de 6%, a média foi 18%, o pior foi 132%
Comparado com todos os dispositivos testados
» 36% de todos os dispositivos testados foram melhores, 8% semelhantes, 56% piores
» O melhor teve um delta de 4%, a média foi 23%, o pior foi 134%
Gerenciamento de energia - Lenovo Gaming Laptop com bateria pequena
Consumo de energia
Nossa unidade de revisão se mostrou surpreendentemente eficiente quando ociosa. Enquanto jogava, consumiu um total de 120-130 W e atingiu o pico de 172 W durante nosso teste de estresse antes de assentar a uma potência mais razoável de 150 W. O fornecimento de energia incluído de 170 W é, portanto, adequado.
| desligado | |
| Ocioso | |
| Carga |
|
Key:
min: | |
| Lenovo Ideapad Gaming 3 15IHU-82K1002RGE i5-11300H, GeForce RTX 3050 Ti Laptop GPU, Micron 2210 MTFDHBA512QFD, IPS, 1920x1080, 15.6" | Dell G15 5515 R7 5800H, GeForce RTX 3050 Ti Laptop GPU, Samsung PM991a MZ9LQ512HBLU-00BD1, IPS, 1920x1080, 15.6" | Gigabyte G5 GD i5-11400H, GeForce RTX 3050 4GB Laptop GPU, ESR512GTLG-E6GBTNB4, IPS, 1920x1080, 15.6" | Medion Erazer Deputy P25 R7 5800H, GeForce RTX 3060 Laptop GPU, Phison E12S-512GB-Phison-SSD-BICS4, IPS, 1920x1080, 15.6" | Schenker XMG Focus 15 i7-11800H, GeForce RTX 3050 Ti Laptop GPU, Samsung SSD 970 EVO Plus 1TB, IPS, 1920x1080, 15.6" | Lenovo Legion 5 15ACH-82JU00C6GE-FL R7 5800H, GeForce RTX 3060 Laptop GPU, Micron 2300 512GB MTFDHBA512TDV, , 1920x1080, 15.6" | Média NVIDIA GeForce RTX 3050 Ti Laptop GPU | Média da turma Gaming | |
|---|---|---|---|---|---|---|---|---|
| Power Consumption | -26% | -65% | -48% | -138% | -44% | -41% | -112% | |
| Idle Minimum * (Watt) | 4.9 | 5 -2% | 13 -165% | 8 -63% | 23 -369% | 7.3 -49% | 8.2 ? -67% | 13 ? -165% |
| Idle Average * (Watt) | 8.3 | 9 -8% | 15 -81% | 11 -33% | 25 -201% | 10.5 -27% | 12.6 ? -52% | 19 ? -129% |
| Idle Maximum * (Watt) | 8.9 | 20 -125% | 20 -125% | 16 -80% | 29 -226% | 15.7 -76% | 17.2 ? -93% | 24.6 ? -176% |
| Load Average * (Watt) | 81 | 94 -16% | 102 -26% | 109 -35% | 106 -31% | 108 -33% | 92 ? -14% | 110.7 ? -37% |
| Witcher 3 ultra * (Watt) | 119 | 123 -3% | 124 -4% | 183 -54% | 128 -8% | 175 -47% | ||
| Load Maximum * (Watt) | 172 | 172 -0% | 148 14% | 211 -23% | 156 9% | 228 -33% | 139.1 ? 19% | 259 ? -51% |
* ... menor é melhor
Power Consumption Witcher 3 / stress test
Power Consumption with External Monitor
Vida útil da bateria
Apesar de sua grande caixa, o IdeaPad Gaming 3 vem com uma pequena bateria de 45 Wh de 3 células que permite uma vida útil geral decente da bateria, pelo menos quando ociosa. Sob carga, ela conseguiu durar cerca de uma hora. Em nosso teste Wi-Fi navegando na web, ele durou entre 5,5 e 6,5 horas, dependendo da luminosidade da tela. Em nosso teste de vídeo, ele durou mais de 7,5 horas com brilho de tela normalizado em 150 nits (84% em nosso dispositivo). O carregamento de um dispositivo ligado de quase vazio para cheio leva cerca de duas horas.
| Lenovo Ideapad Gaming 3 15IHU-82K1002RGE i5-11300H, GeForce RTX 3050 Ti Laptop GPU, 45 Wh | Dell G15 5515 R7 5800H, GeForce RTX 3050 Ti Laptop GPU, 56 Wh | Gigabyte G5 GD i5-11400H, GeForce RTX 3050 4GB Laptop GPU, 41 Wh | Medion Erazer Deputy P25 R7 5800H, GeForce RTX 3060 Laptop GPU, 49 Wh | Schenker XMG Focus 15 i7-11800H, GeForce RTX 3050 Ti Laptop GPU, 49 Wh | Lenovo Legion 5 15ACH-82JU00C6GE-FL R7 5800H, GeForce RTX 3060 Laptop GPU, 80 Wh | Média da turma Gaming | |
|---|---|---|---|---|---|---|---|
| Duração da bateria | 24% | -35% | 1% | -30% | -2% | 18% | |
| H.264 (h) | 7.7 | 8.8 14% | 3.6 -53% | 4.3 -44% | 8.32 ? 8% | ||
| WiFi v1.3 (h) | 6.6 | 8 21% | 3.1 -53% | 6.7 2% | 3.9 -41% | 4.8 -27% | 7.11 ? 8% |
| Load (h) | 1.1 | 1.5 36% | 1.1 0% | 1.1 0% | 0.9 -18% | 1.8 64% | 1.502 ? 37% |
| Reader / Idle (h) | 13.5 | 5.7 | 10.5 | 6.5 | 8.27 ? |
Pro
Contra
Veredicto - Jogadores de orçamento melhor com a AMD
O IdeaPad Gaming 3i 15 G6 é um caderno de jogos acessível, equipado com um rápidoRTX 3050 Ti para um desempenho adequado em jogos FHD. Estamos, entretanto, surpresos com a escolha da Lenovo de CPU. O processador quad-core relativamente lento da Intel Tiger Lake simplesmente não faz sentido em um dispositivo com uma poderosa GPU dedicada. Os resultados são uma performance relativamente baixa para jogos, e o notebook teria se beneficiado imensamente do núcleo de 6 núcleos i5-11400H. E para acrescentar insulto aos danos, esta CPU Tiger Lake teria sido ainda mais barata do que a Lenovo i5-11300H optou. E a SKU equipada com AMD baseada noRyzen 5 5600H também está disponível, e oferece um desempenho geral muito melhor. É, no entanto, difícil de obter em muitas regiões.
Em geral, o IdeaPad Gaming 3 cobre os fundamentos mais importantes dos jogos sem sinos e apitos. Além da CPU lenta, também achamos que a exibição padrão é subnormal. Pode ser mate e oferecer amplos ângulos de visão graças a seu painel IPS incorporado, mas sua qualidade de imagem (granulado) e representação de cores são bastante ruins. Sem dúvida, o painel padrão é uma unidade bastante barata, pois sua baixa precisão de cor e sua baixa cobertura sRGB são mais um testemunho disso. Opcionalmente, o IdeaPad Gaming 3 está disponível com um painel de 165 Hz 1080p com cobertura sRGB completa em regiões selecionadas que, se disponível, seria certamente uma escolha muito melhor.
O IdeaPad Gaming 3i 15 é um notebook para jogos com um RTX 3050 Ti edesempenho adequado para jogos FHD. Se você puder esticar um pouco mais seu orçamento, recomendamos o painel opcional de 165 Hz.
Seus concorrentes, como o Dell G15,Medion Erazer,Schenker XMG Focus, ou até mesmo o próprioLegion 5 15 da Lenovo oferecem um desempenho muito superior e, muitas vezes, também exibições significativamente melhores. Entretanto, se você estiver operando com um orçamento apertado, o painel FHD padrão certamente será suficiente.
Preço e Disponibilidade
Um total de quatro SKUs estão disponíveis nos Estados Unidos equipados com um Core i5-11300H e um GeForce GTX 1650 ou um Core i7-11370H e um GTX 1650, RTX 3050, ou RTX 3050 Ti. Os preços começam em torno de US$ 800 para o modelo base, e os dispositivos são vendidos através da Lenovo's própria webshop assim como vários varejistas, como Amazon.
Lenovo Ideapad Gaming 3 15IHU-82K1002RGE
- 03/22/2022 v7 (old)
Andreas Osthoff
Price comparison

