MSI Katana GF66 12UGS revisão de laptop: A atualização para o Alder Lake traz significativamente mais desempenho
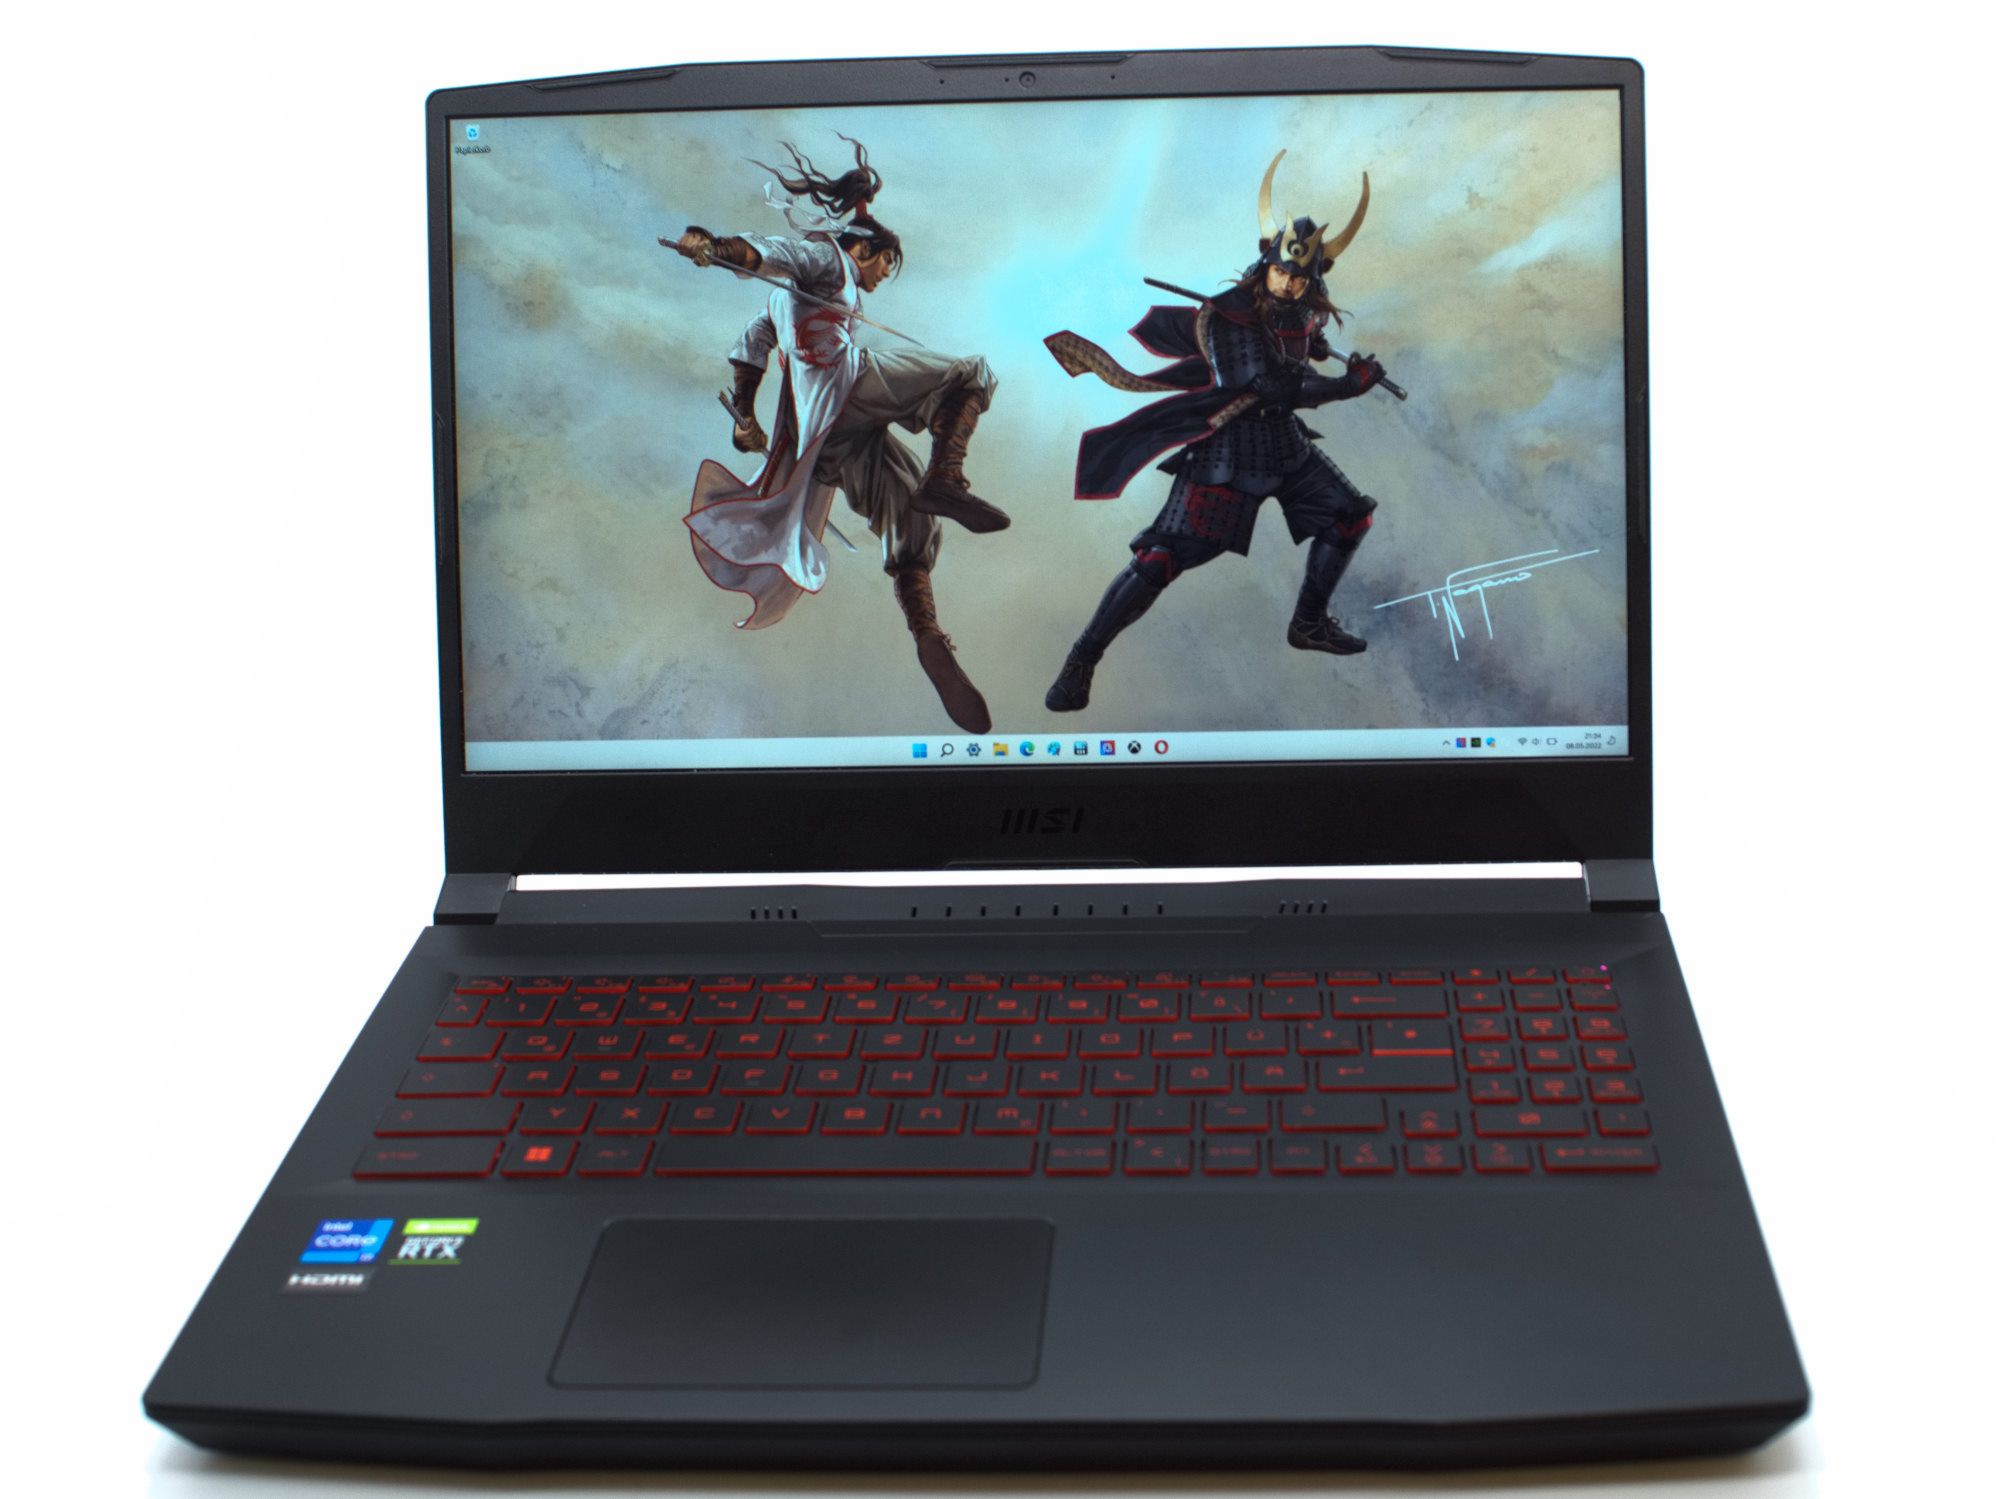
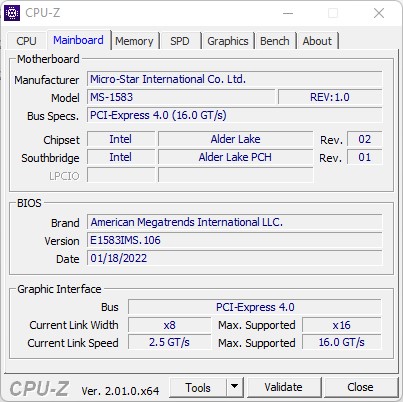
Em termos de desempenho de computação, a MSI atualizou significativamente o Katana GF66 que testamos no ano passado. O Intel Core i7-11800H e Nvidia GeForce RTX 3070 foram substituídos pelos chips mais atuais e, neste ponto, um Core i7-12700H e RTX 3070 Ti compõem o desempenho computacional. Nada mudou no exterior do elegante laptop para jogos, e o design de Nagano Tsuyoshi foi mantido sem nenhuma alteração.
Além das atualizações de hardware, o display também foi substituído por outro painel. No entanto, isto parece ser mais um downgrade do que um upgrade, e a avaliação da tela do GF66 12UGS se torna significativamente pior do que a do GF66 11UG.
Para um laptop com o poderoso Nvidia GeForce RTX 3070 Ti, o Katana é relativamente acessível a cerca de 2000 euros (~$2142). A esse preço, vemos também vários laptops para jogos com configurações supostamente mais fracas entre nossos dispositivos de comparação. Entretanto, mais uma vez, vemos a poderosa influência dos valores TDP e TGP no desempenho computacional. Em vários benchmarks, alguns laptops, como o Asus TUF Gaming F15 ou o Lenovo Legion 5são capazes de superar significativamente o atual Katana GF66 e seu grande irmão, o GF76.
Possíveis concorrentes em comparação
Avaliação | Data | Modelo | Peso | Altura | Size | Resolução | Preço |
|---|---|---|---|---|---|---|---|
| 80.3 % v7 (old) | 06/2022 | MSI Katana GF66 12UGS i7-12700H, GeForce RTX 3070 Ti Laptop GPU | 2.3 kg | 27.5 mm | 15.60" | 1920x1080 | |
| 79.2 % v7 (old) | 09/2021 | MSI Katana GF66 11UG-220 i7-11800H, GeForce RTX 3070 Laptop GPU | 2.3 kg | 25 mm | 15.60" | 1920x1080 | |
| 82.6 % v7 (old) | 05/2022 | MSI Katana GF76 12UGS i7-12700H, GeForce RTX 3070 Ti Laptop GPU | 2.7 kg | 25.2 mm | 17.30" | 1920x1080 | |
| 87.2 % v7 (old) | 03/2022 | Asus TUF Gaming F15 FX507ZM i7-12700H, GeForce RTX 3060 Laptop GPU | 2.1 kg | 24.95 mm | 15.60" | 1920x1080 | |
| 85 % v7 (old) | 07/2021 | Asus TUF Gaming A15 FA506QR-AZ061T R7 5800H, GeForce RTX 3070 Laptop GPU | 2.3 kg | 24 mm | 15.60" | 1920x1080 | |
| 84 % v7 (old) | 06/2022 | Acer Nitro 5 AN515-58-72QR i7-12700H, GeForce RTX 3070 Ti Laptop GPU | 2.5 kg | 26.8 mm | 15.60" | 2560x1440 | |
| 82.6 % v7 (old) | 05/2022 | Lenovo Legion 5 15ACH6A-82NW0010GE R5 5600H, Radeon RX 6600M | 2.5 kg | 25.75 mm | 15.60" | 1920x1080 |
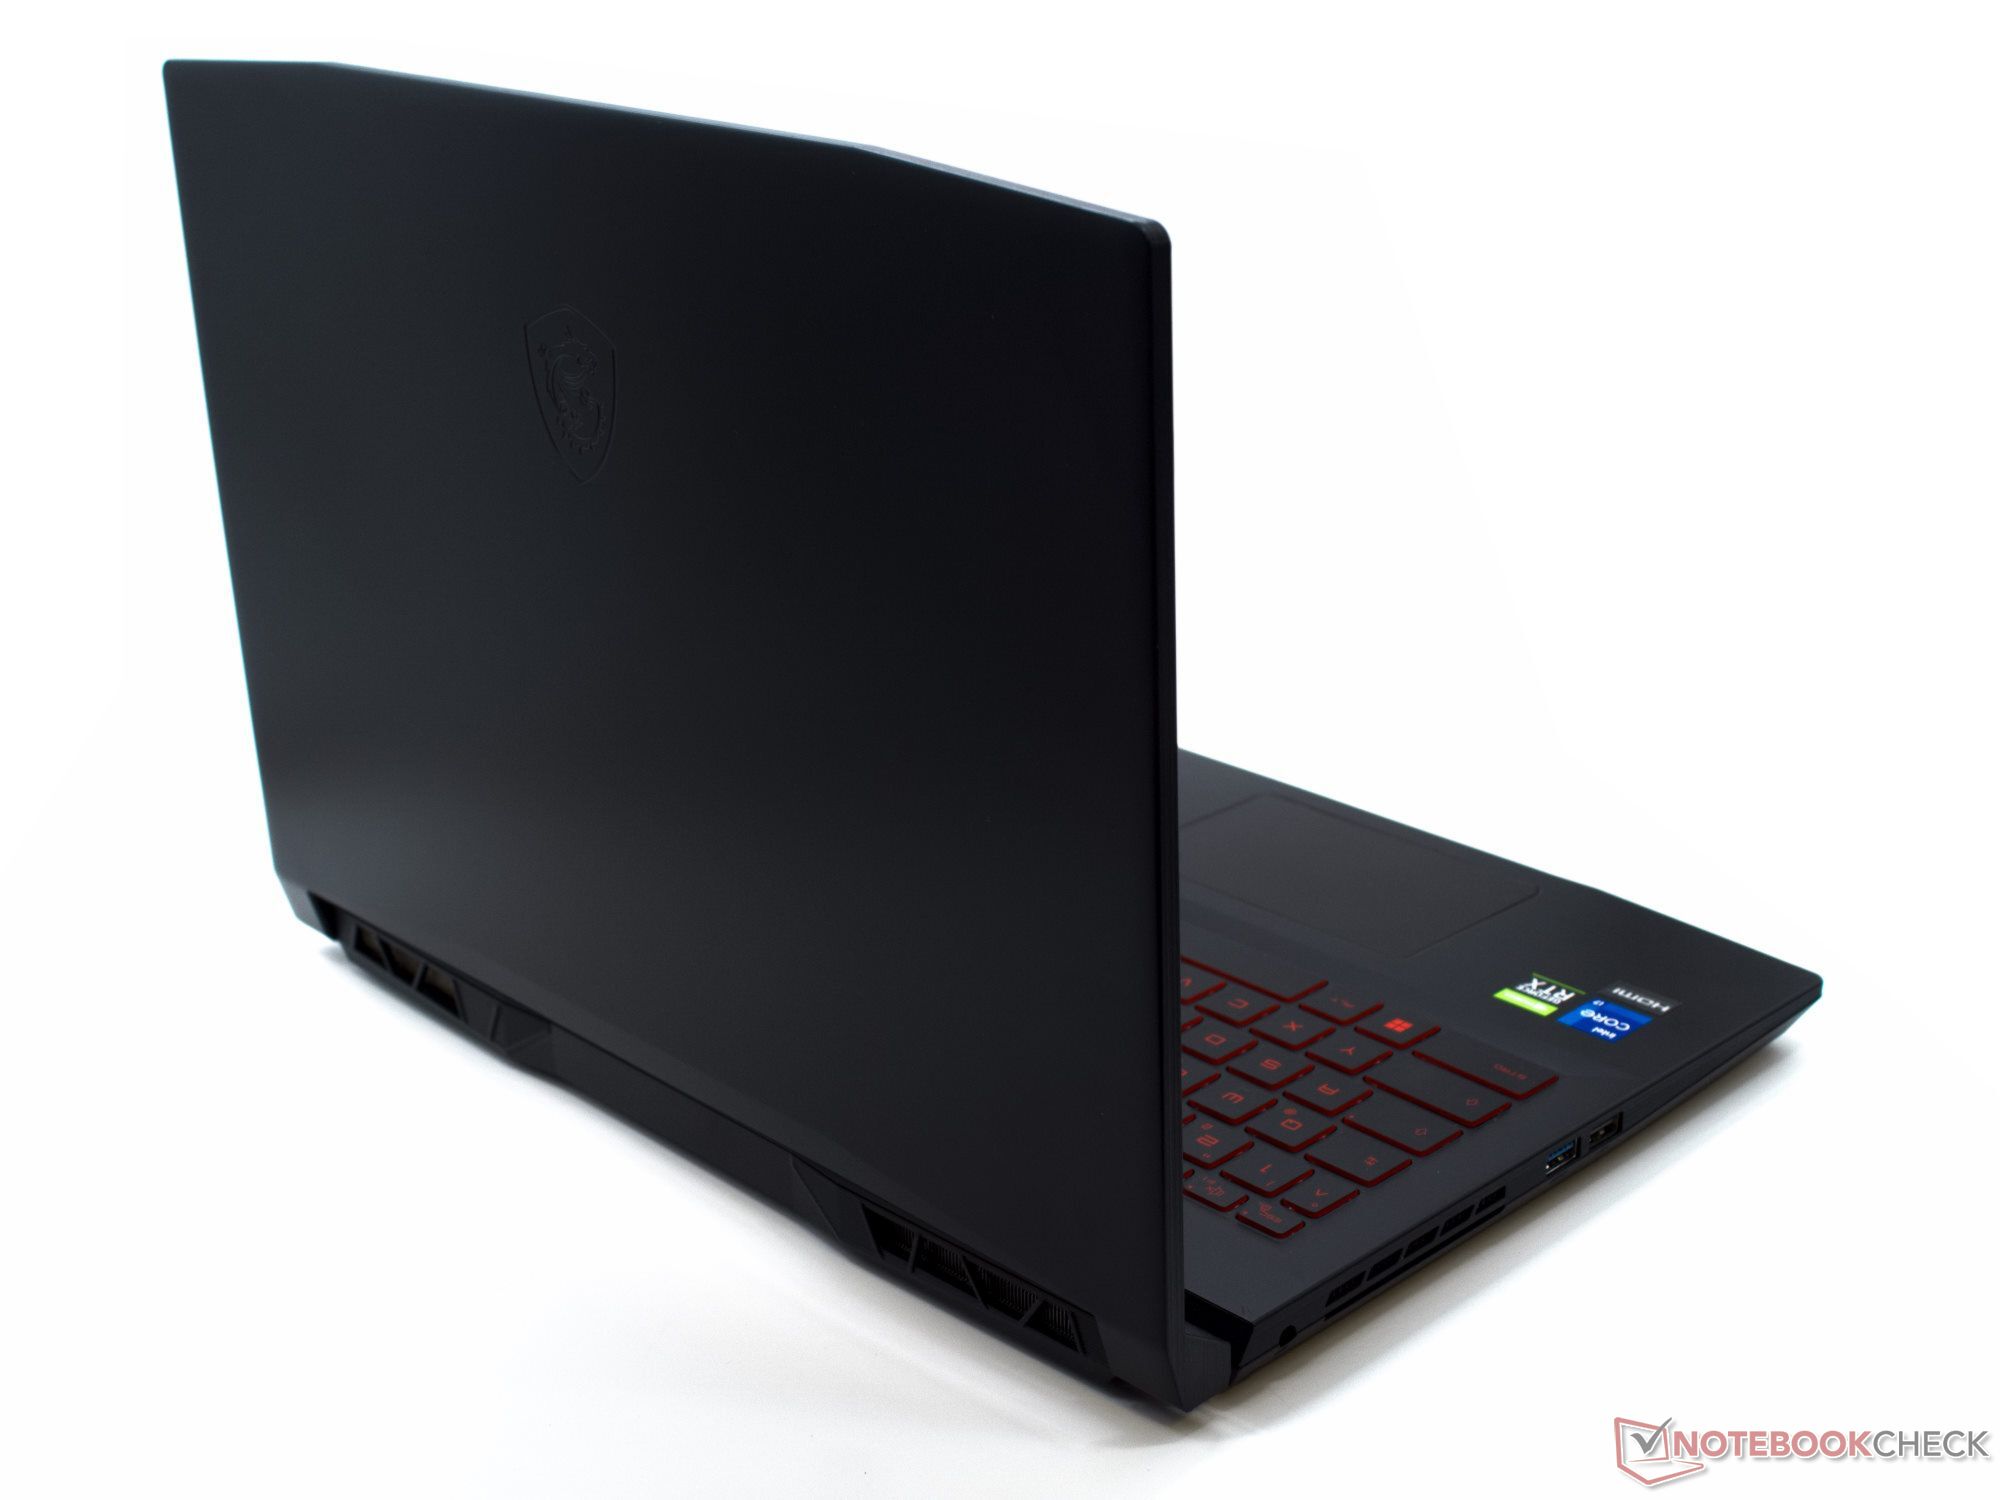
Estojo e equipamentos - Faltam atualizações aqui
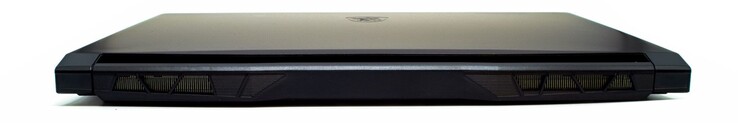
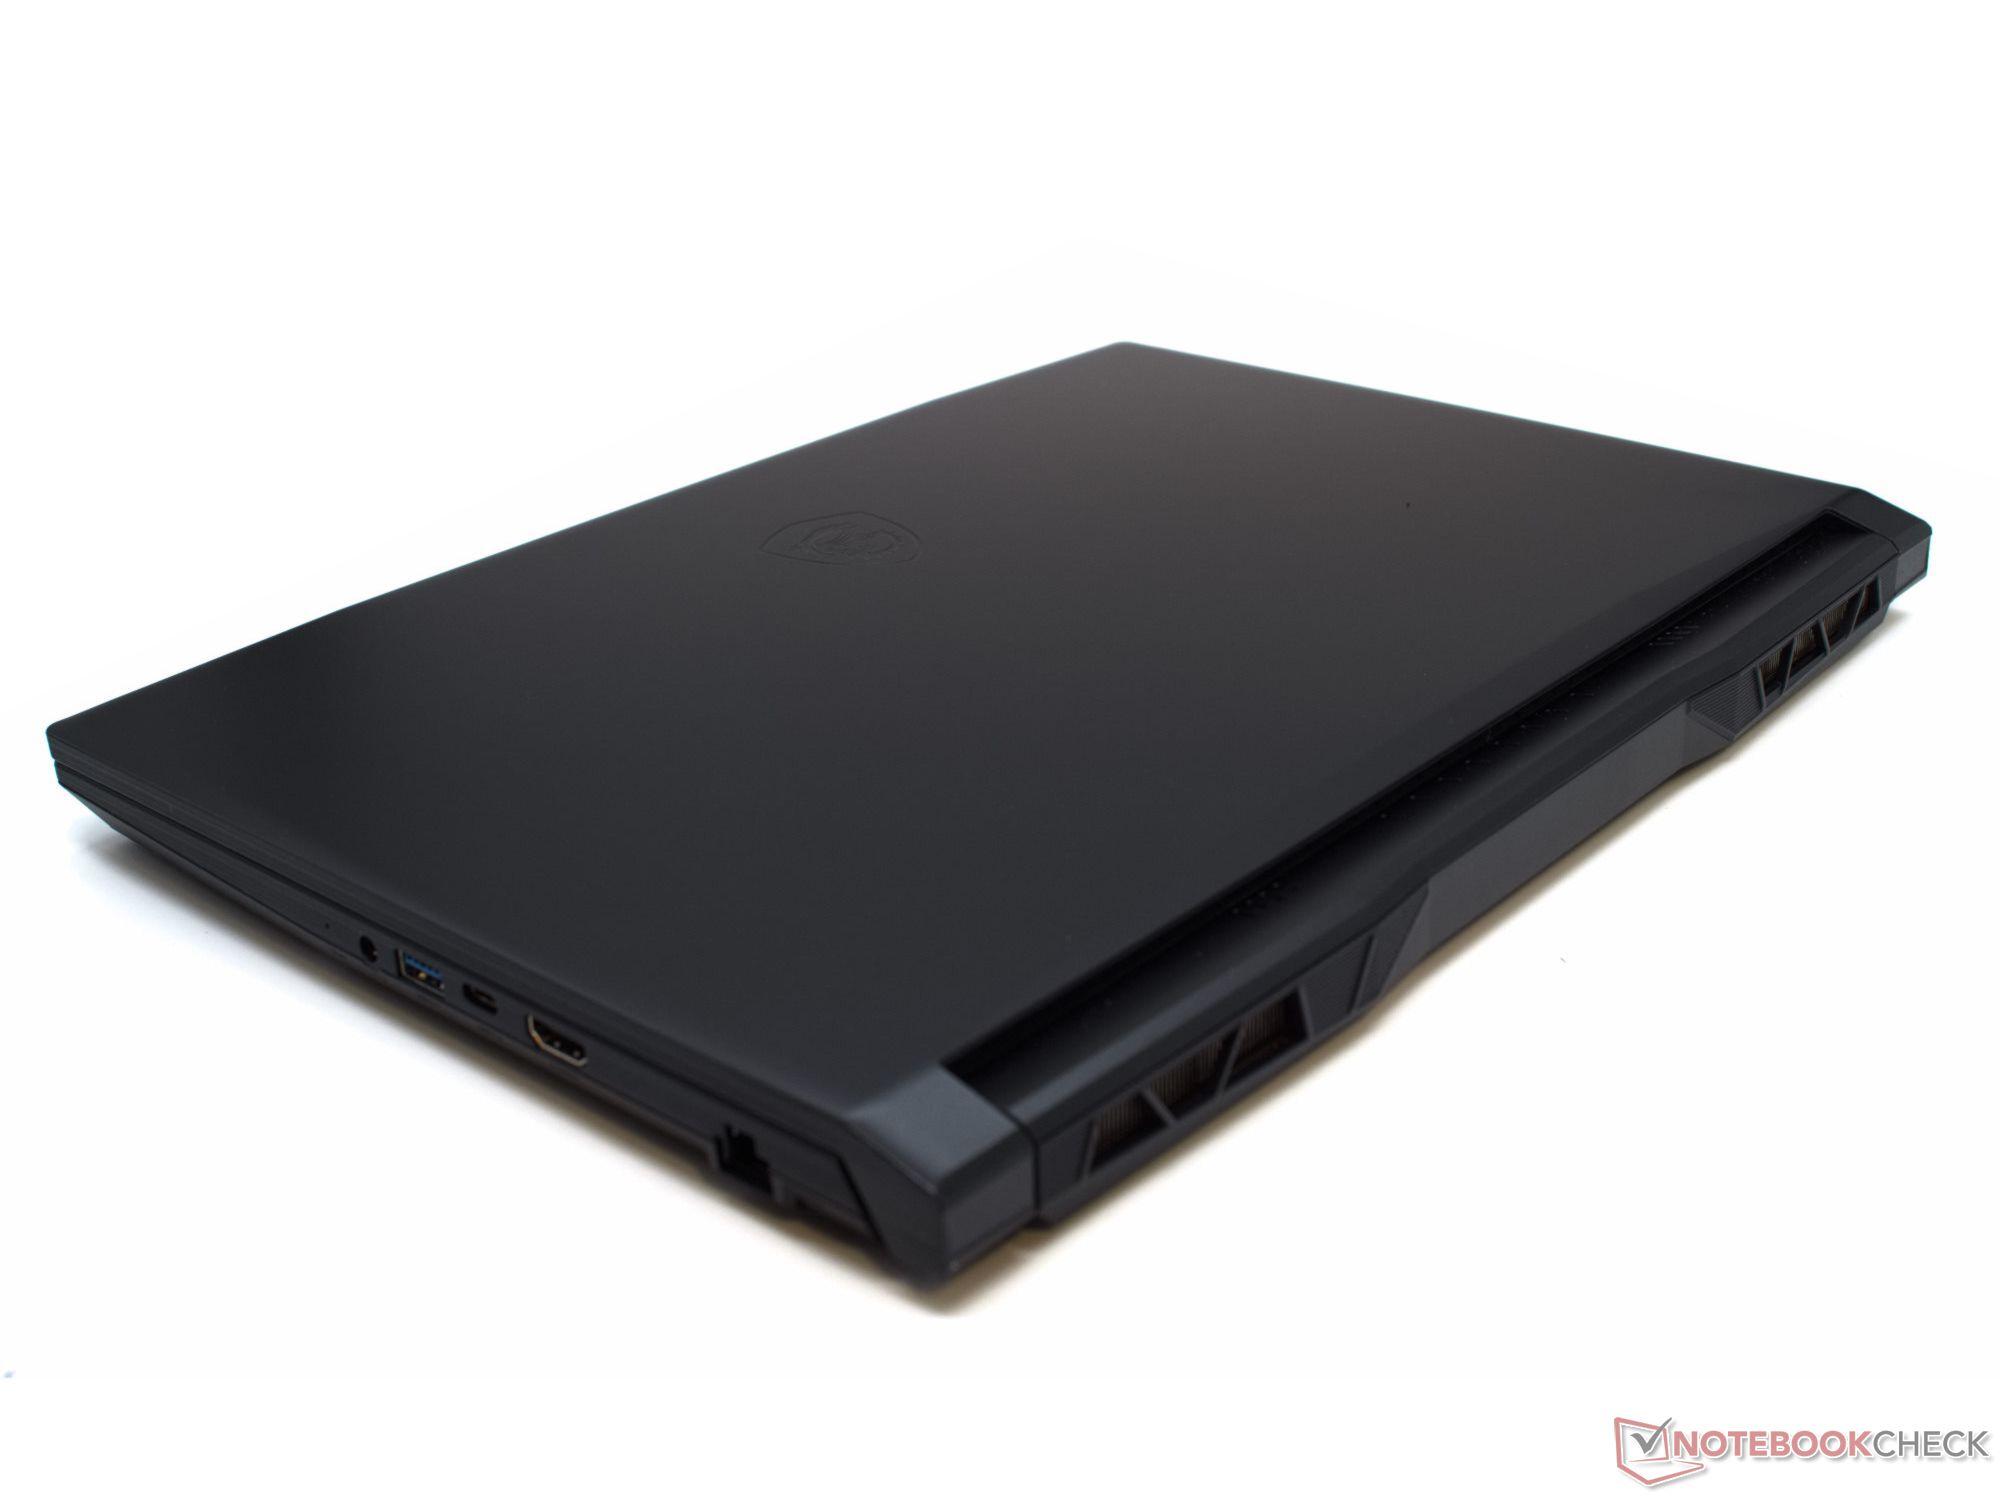
Em comparação com o GF66 11UGnão há mudanças no estojo ou no equipamento de conexão. O design ainda é elegante e discreto, e a quantidade, o posicionamento e os tipos das conexões também permanecem os mesmos. Isto significa que continuamos a sentir falta do Thunderbolt e do DisplayPort na conexão USB-C do laptop do jogo. Você pode encontrar uma descrição mais detalhada do estojo e do equipamento de conexão em nossa revisão do MSI Katana GF66 11UG.
Há algumas ligeiras melhorias na melhor webcam e estabilidade das dobradiças da tela, que agora oferecem mais resistência do que as do predecessor, mantendo a tela melhor no lugar.
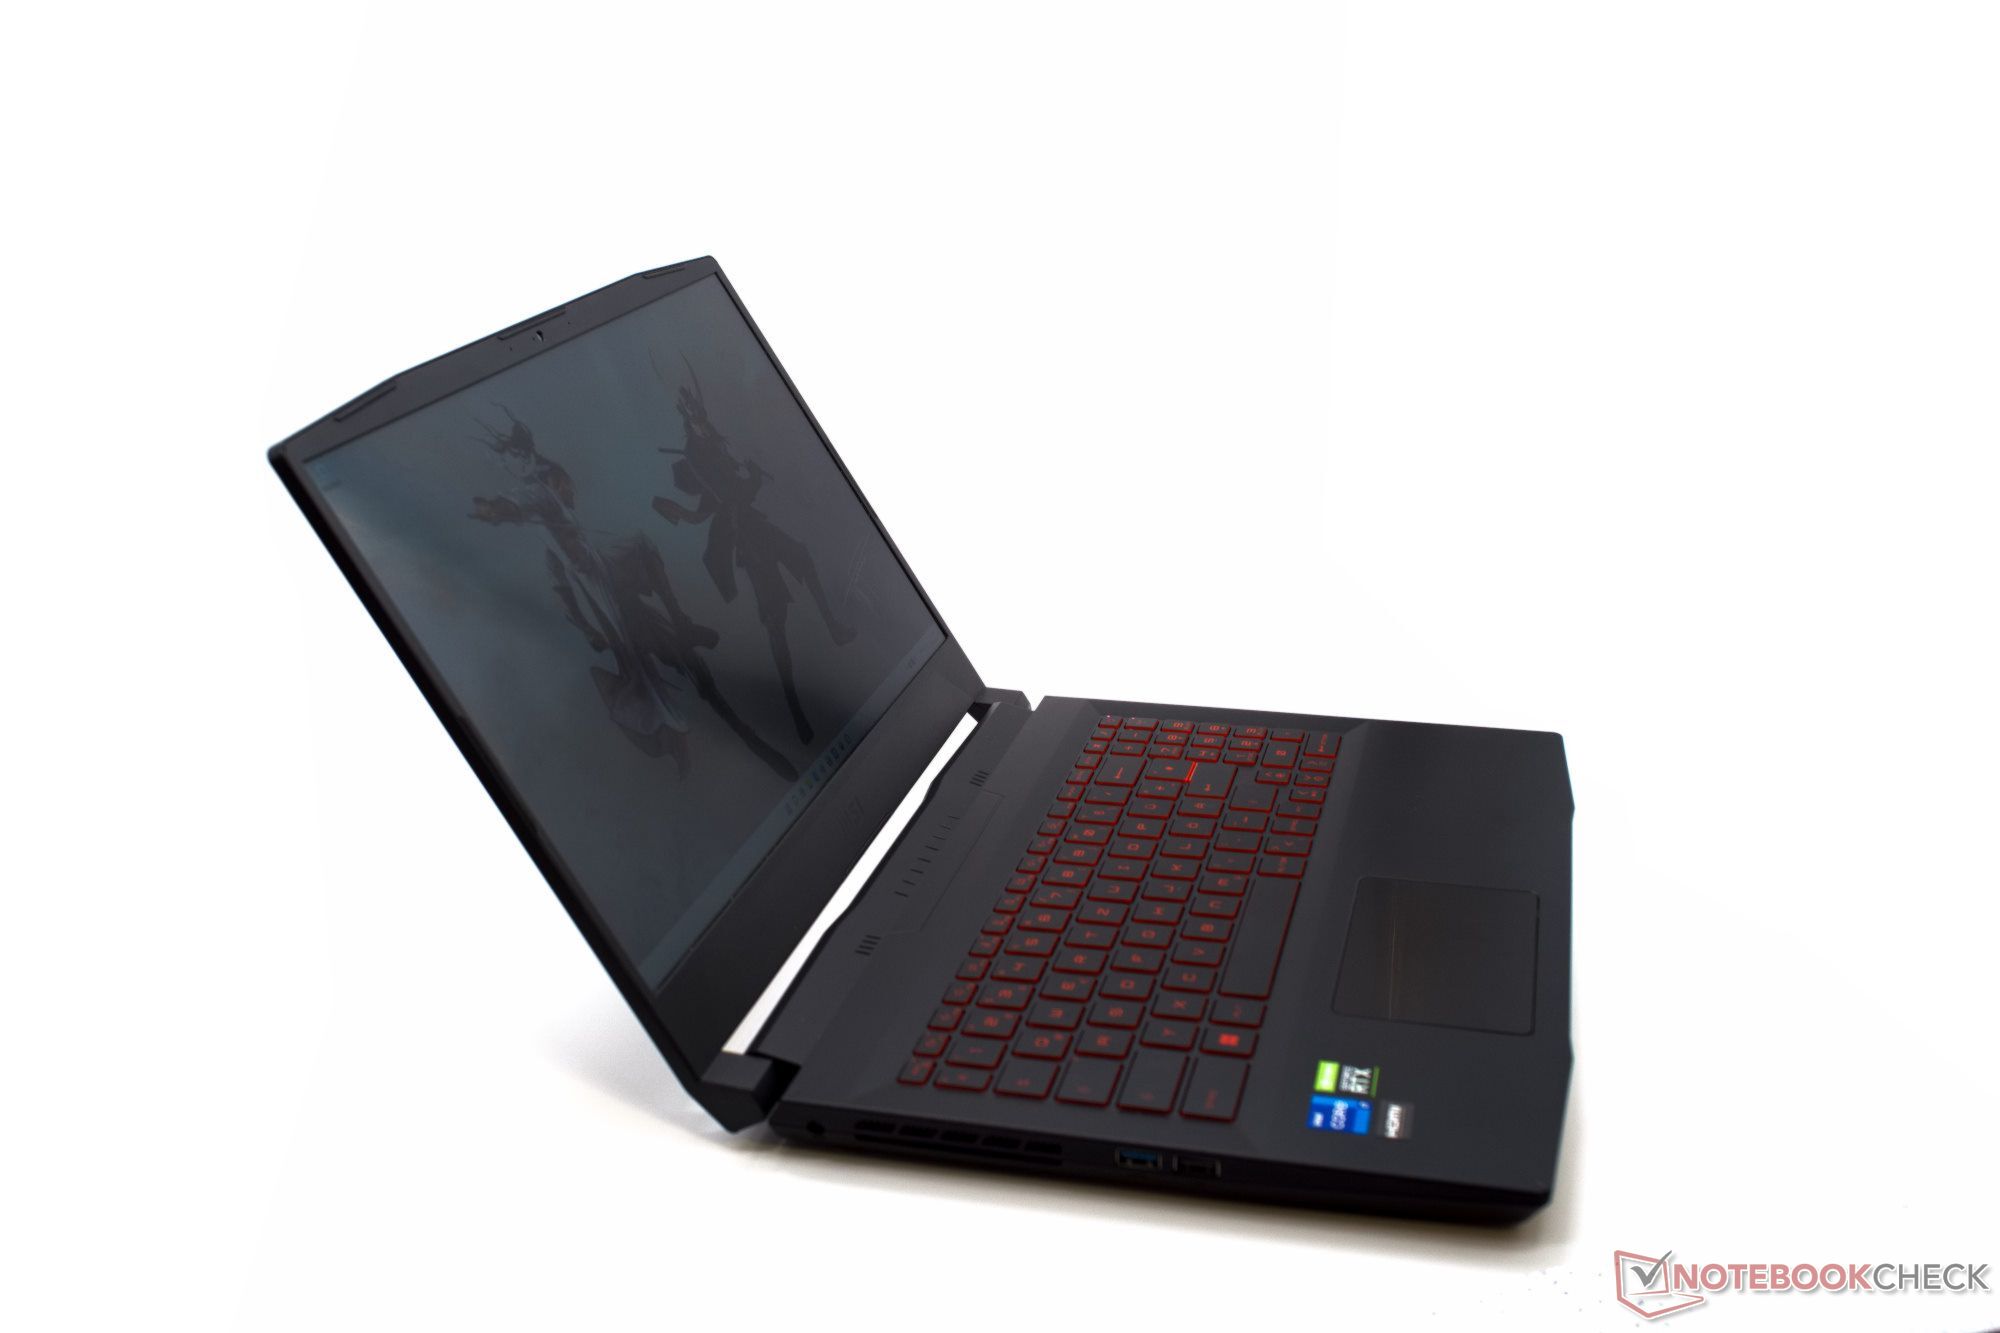
Em termos de tamanho e peso, o Katana GF66 12UGS se situa no meio do campo dos concorrentes. Como é típico dos laptops para jogos, o peso é superior a 2 quilos.
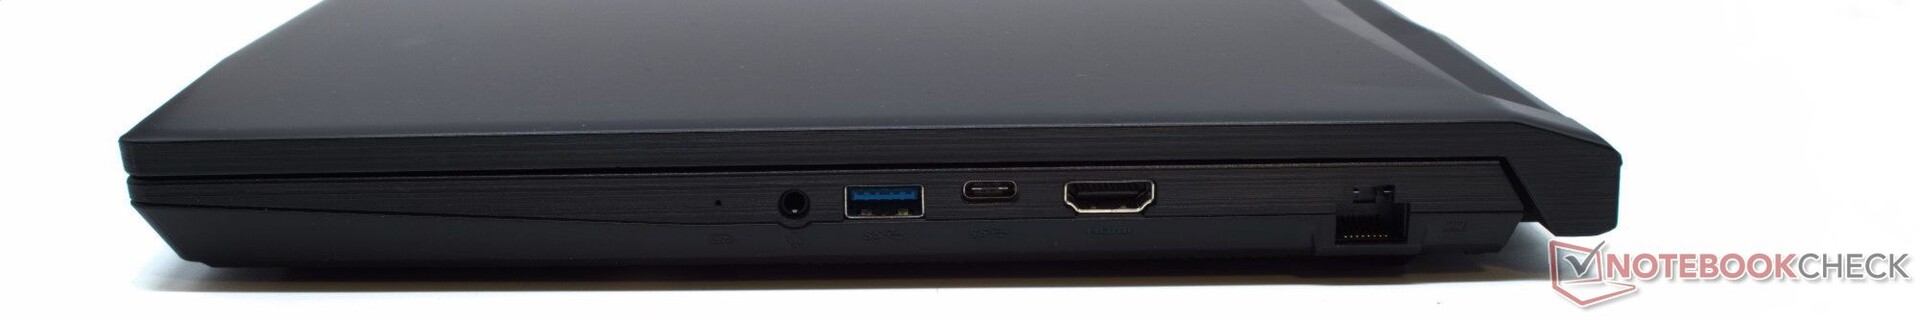
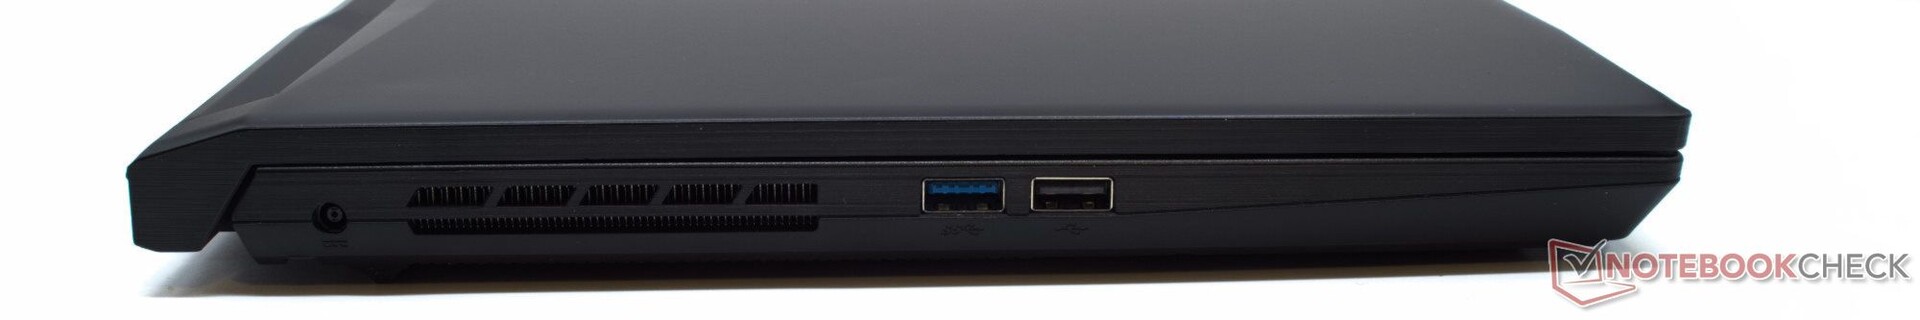
Equipamento de conexão
A MSI Katana realmente não oferece muito em termos de conexões. A porta USB-2.0 no lado esquerdo mostra claramente que a MSI cortou alguns cantos nas conexões. Outro equipamento que lhe falta é um leitor de cartões ou uma porta USB-C totalmente equipada.
Comunicação
O módulo Intel AX201 continua a oferecer as funcionalidades WLAN-ax e Bluetooth 5.2. As altas taxas de transferência que medimos em nosso teste com o ROG Rapture GT-AXE11000 apontam para antenas poderosas no laptop de jogos.
Webcam
Mesmo que a qualidade da webcam continue a deixar algo a desejar, a câmera do GF66 melhorou ligeiramente em comparação com o ano passado. Por exemplo, os desvios de cor agora são ligeiramente menores, e o contraste e a nitidez melhoraram ligeiramente.


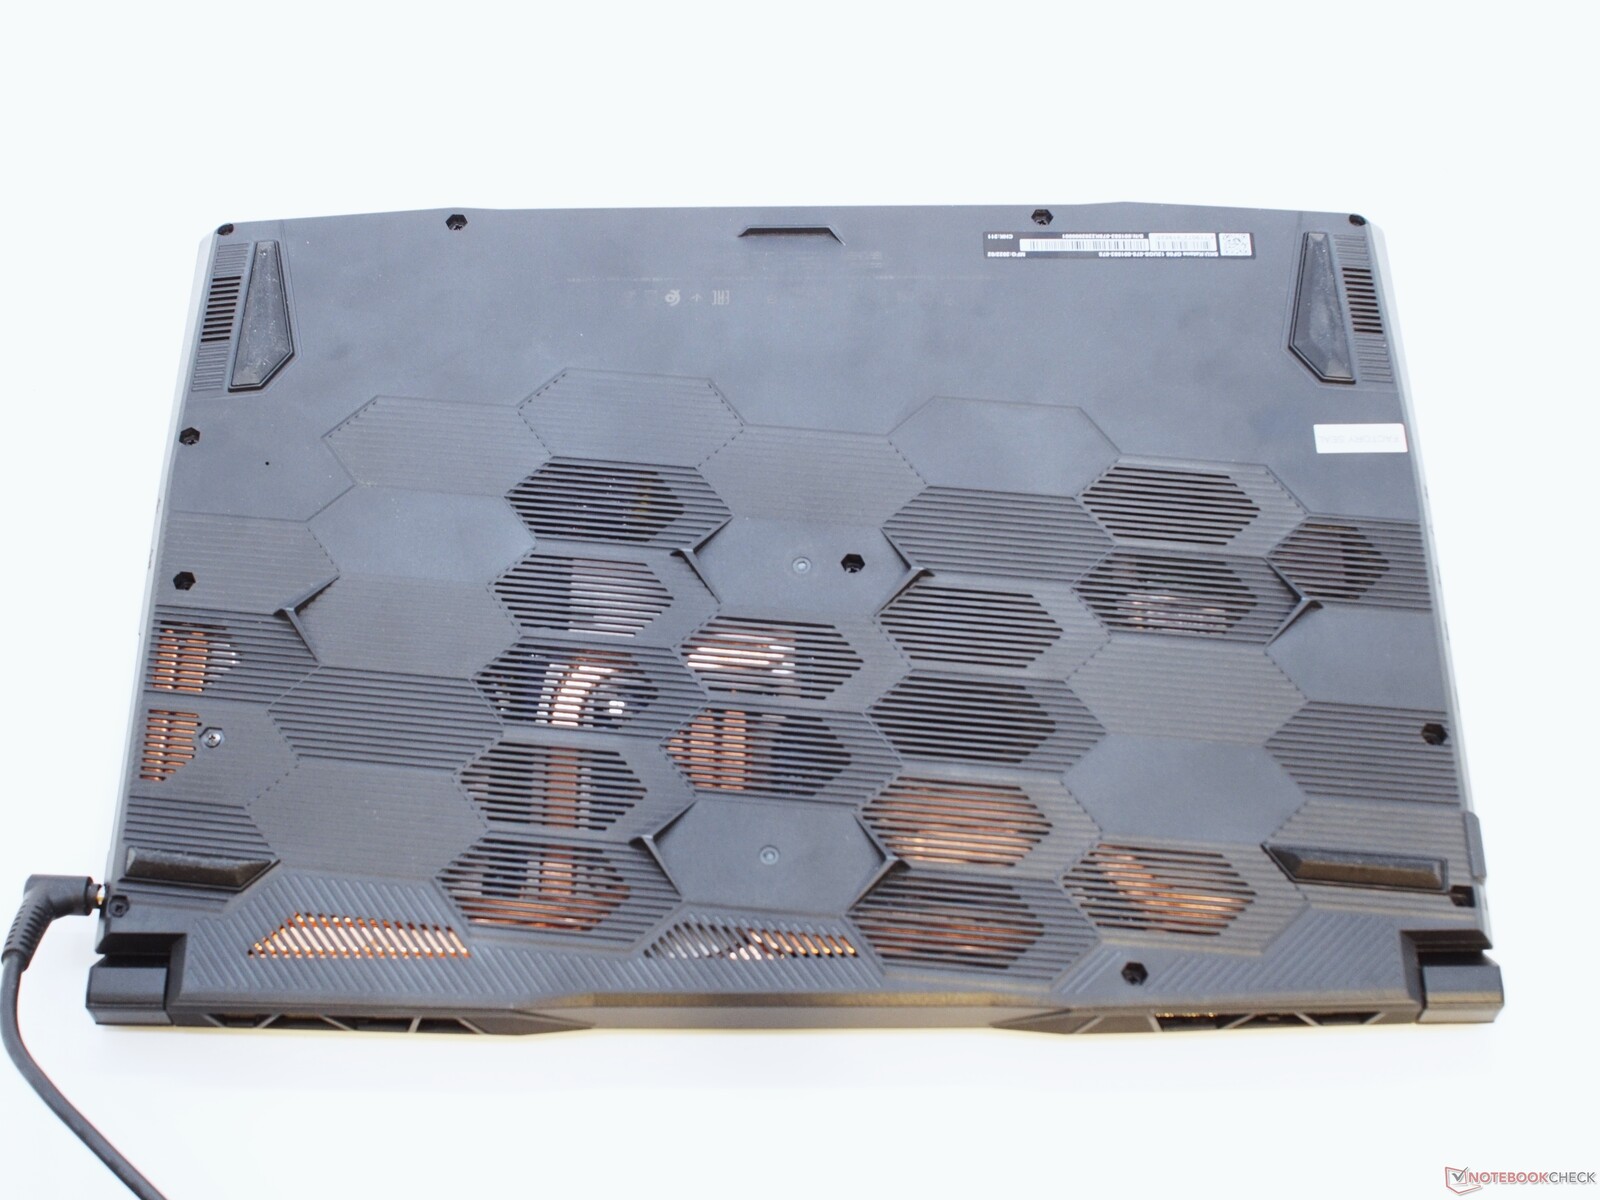
Manutenção
Embora o MSI Katana GF66 deva ser realmente fácil de abrir, o MSI esconde pelo menos um dos parafusos sob um adesivo de vedação na maioria das vezes. Embora este selo deva ser fácil de remover, nós não o fizemos, já que nossa unidade de teste é um emprestador. Sob a tampa de base, a memória de trabalho, o módulo WLAN e os SSDs M.2-NVMe podem ser substituídos ou expandidos, uma vez que o laptop para jogos também oferece um slot M.2 gratuito.
Garantia
A MSI oferece o GF66 na Europa com uma garantia de 24 meses do fabricante. Os dispositivos defeituosos serão retirados e reparados em um local central, de onde são enviados de volta ao cliente. A propósito, a remoção do adesivo de vedação não terá impacto sobre a garantia do dispositivo. O selo destina-se apenas a mostrar ao cliente se os dispositivos estão em seu estado original.
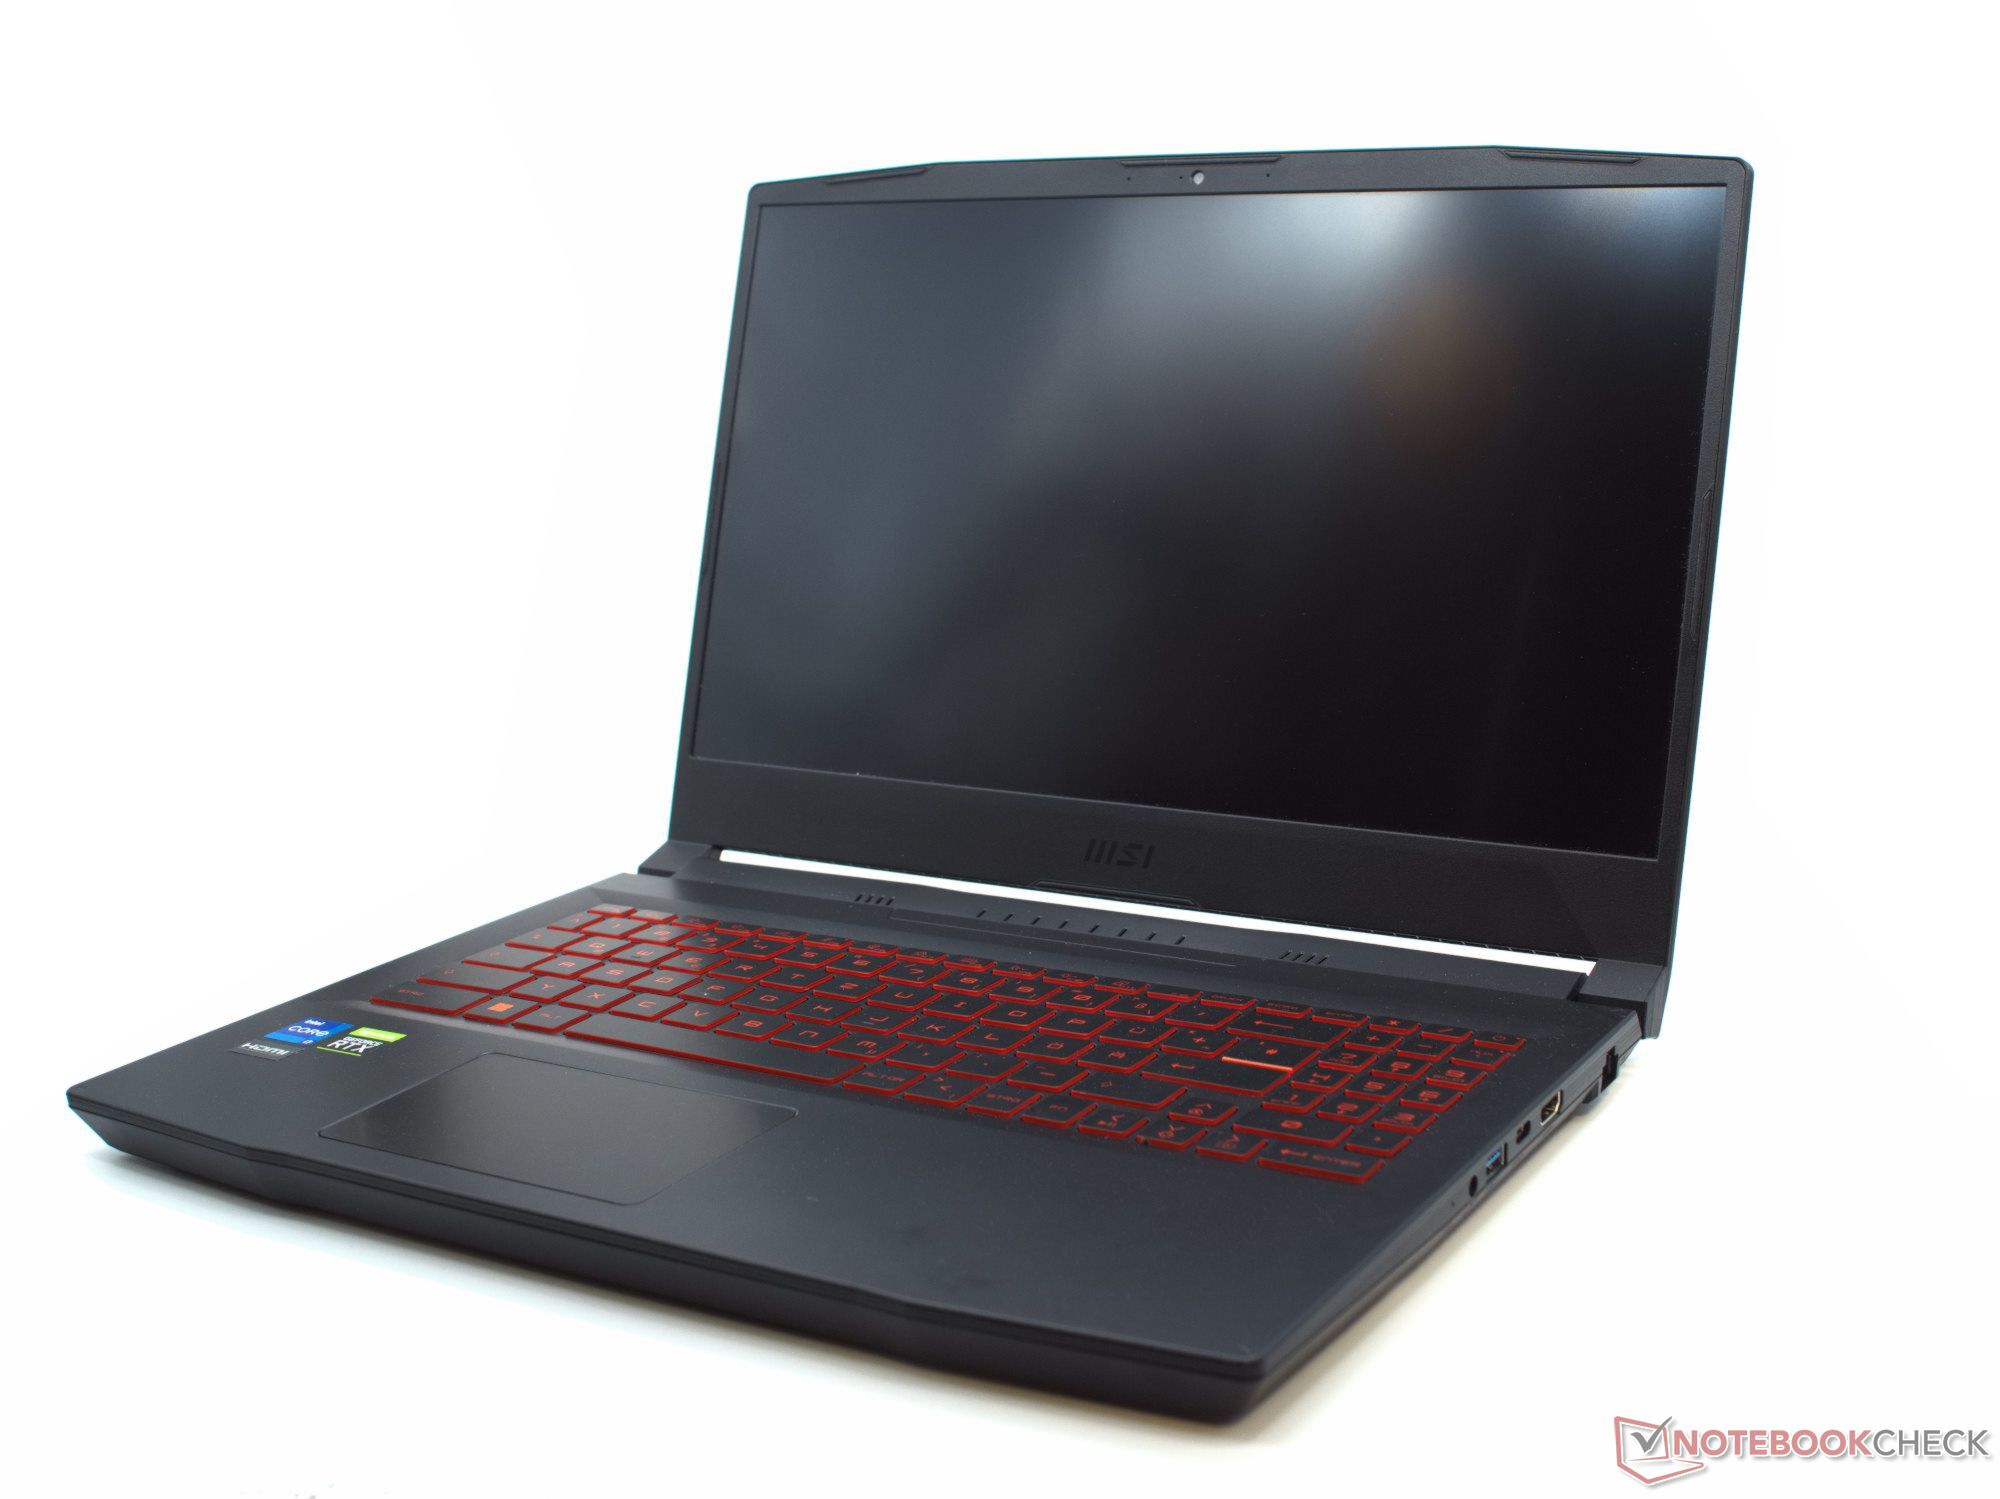
Dispositivos de entrada - Nada de novo aqui
O teclado e o touchpad do laptop do jogo não mostram nenhuma mudança em comparação com o concorrente. As teclas têm um tamanho confortável, e a iluminação de fundo vermelha do teclado pode ser ajustada sem brilho. Infelizmente, o tamanho do touchpad bastante pequeno não foi aumentado, mas o touchpad responde às entradas sem falhas.
Neste ponto, há drivers funcionando para todas as teclas de função, de modo que você pode controlar a webcam, o microfone e o MSI Center através do pressionamento de teclas, e a sobreposição da mira também funciona agora, facilitando a mira em muitos jogos.
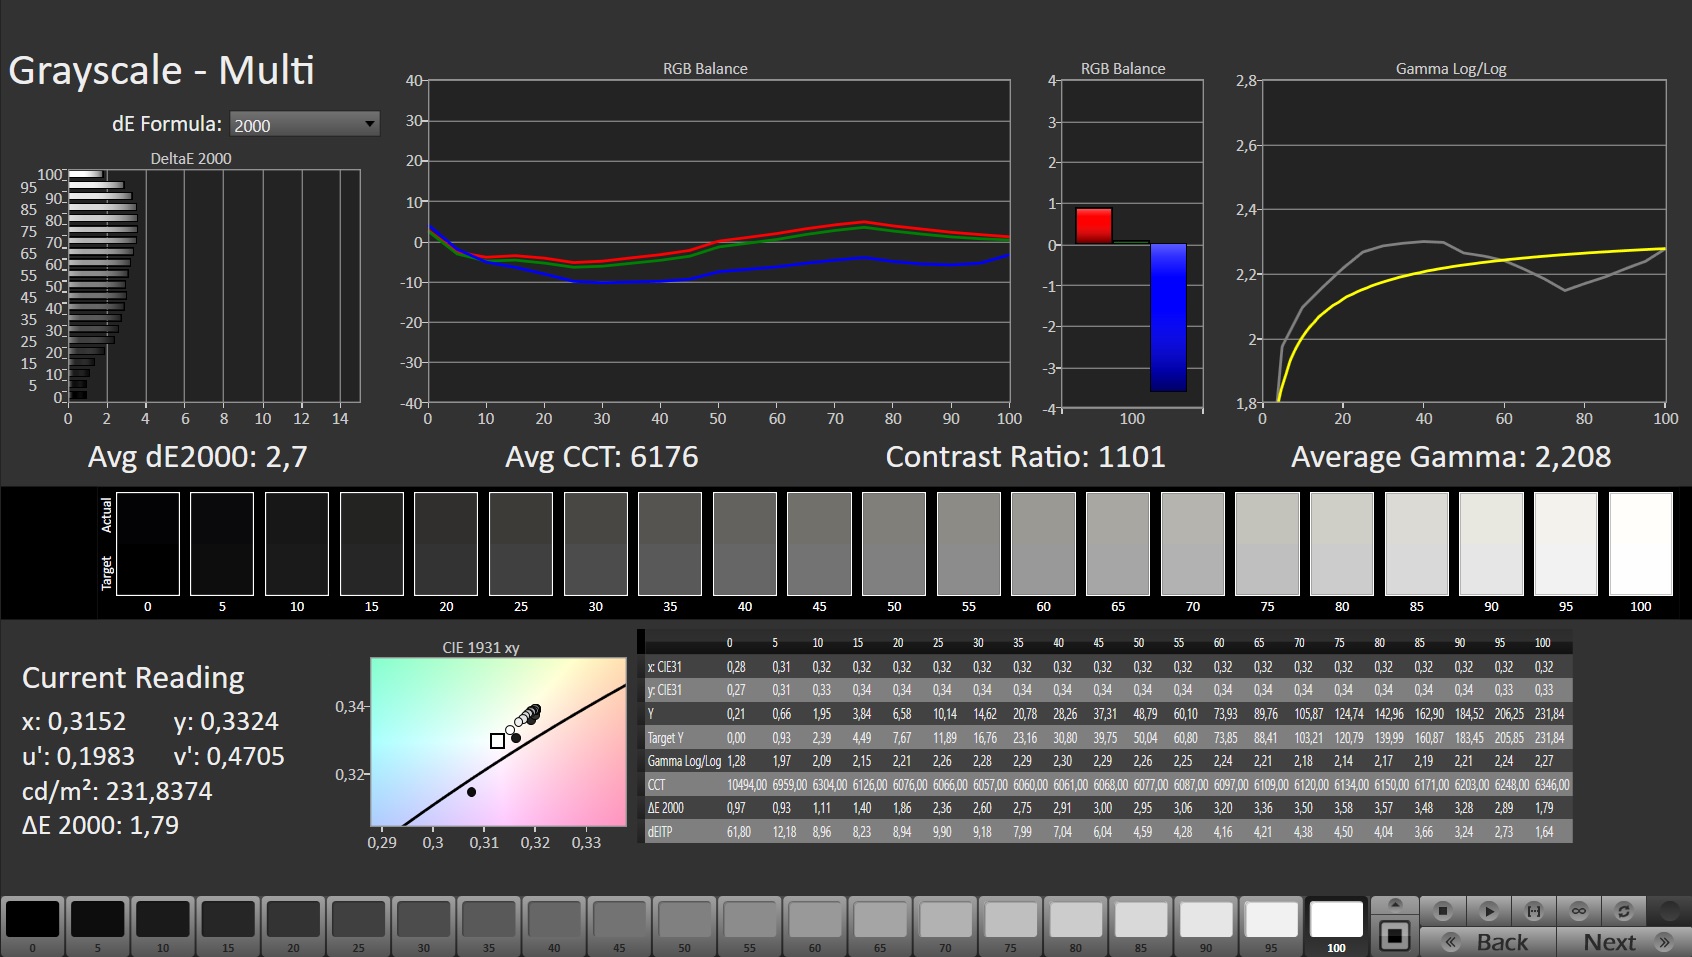
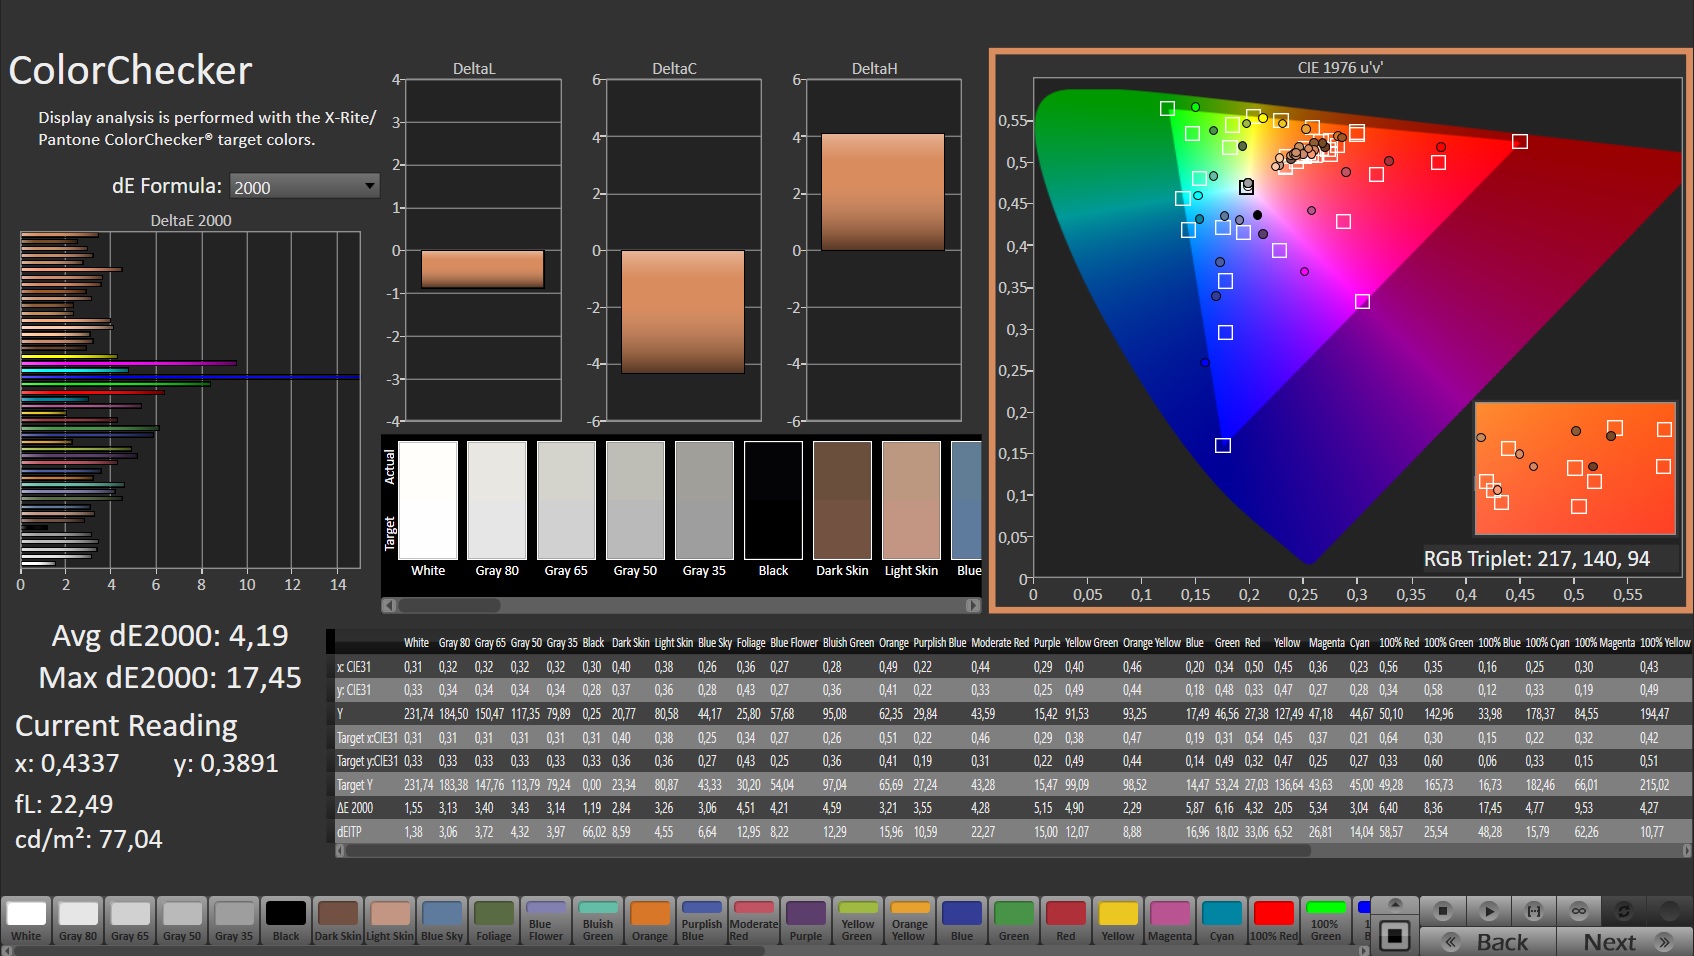
Display - MSI realiza aqui um claro downgrade

A exibição do GF66 12UGS é significativamente pior do que a do GF66 11UG. Enquanto 144 Hz e uma resolução Full-HD são adequados para um laptop para jogos com o GeForce RTX 3070 Ti, o resto dos valores do painel não suportam usá-lo como um monitor de jogos. Com 58,3%, a cobertura de espaço colorido sRGB do novo painel AU Optronics é pior que a do painel do modelo anterior; com uma média de 225 cd/m², o brilho é pior; e os tempos de resposta também são piores. A MSI realizou um claro downgrade aqui.
A relação de contraste de 1081:1 é boa, mas apenas o Asus TUF Gaming A15 tem um valor mais baixo em nosso campo de comparação. Além dos 144 Hz, a exibição do laptop para jogos oferece valores mais apropriados para um laptop de escritório.
| |||||||||||||||||||||||||
iluminação: 90 %
iluminação com acumulador: 227 cd/m²
Contraste: 1081:1 (Preto: 0.21 cd/m²)
ΔE ColorChecker Calman: 4.19 | ∀{0.5-29.43 Ø4.71}
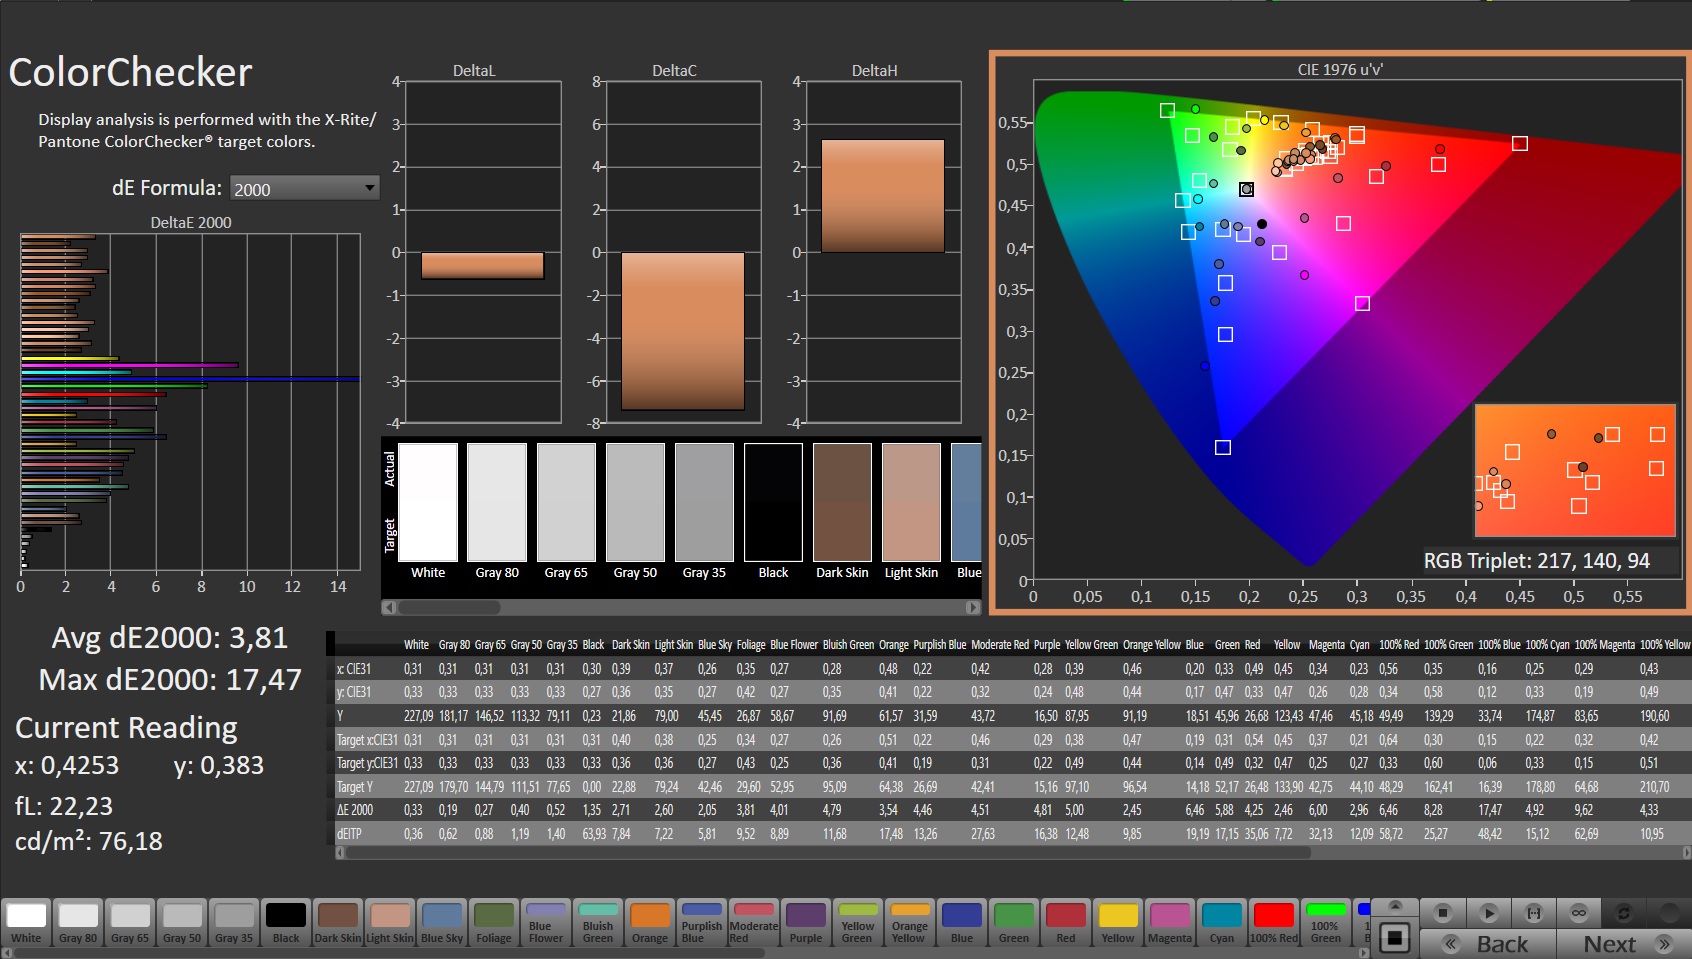
calibrated: 3.81
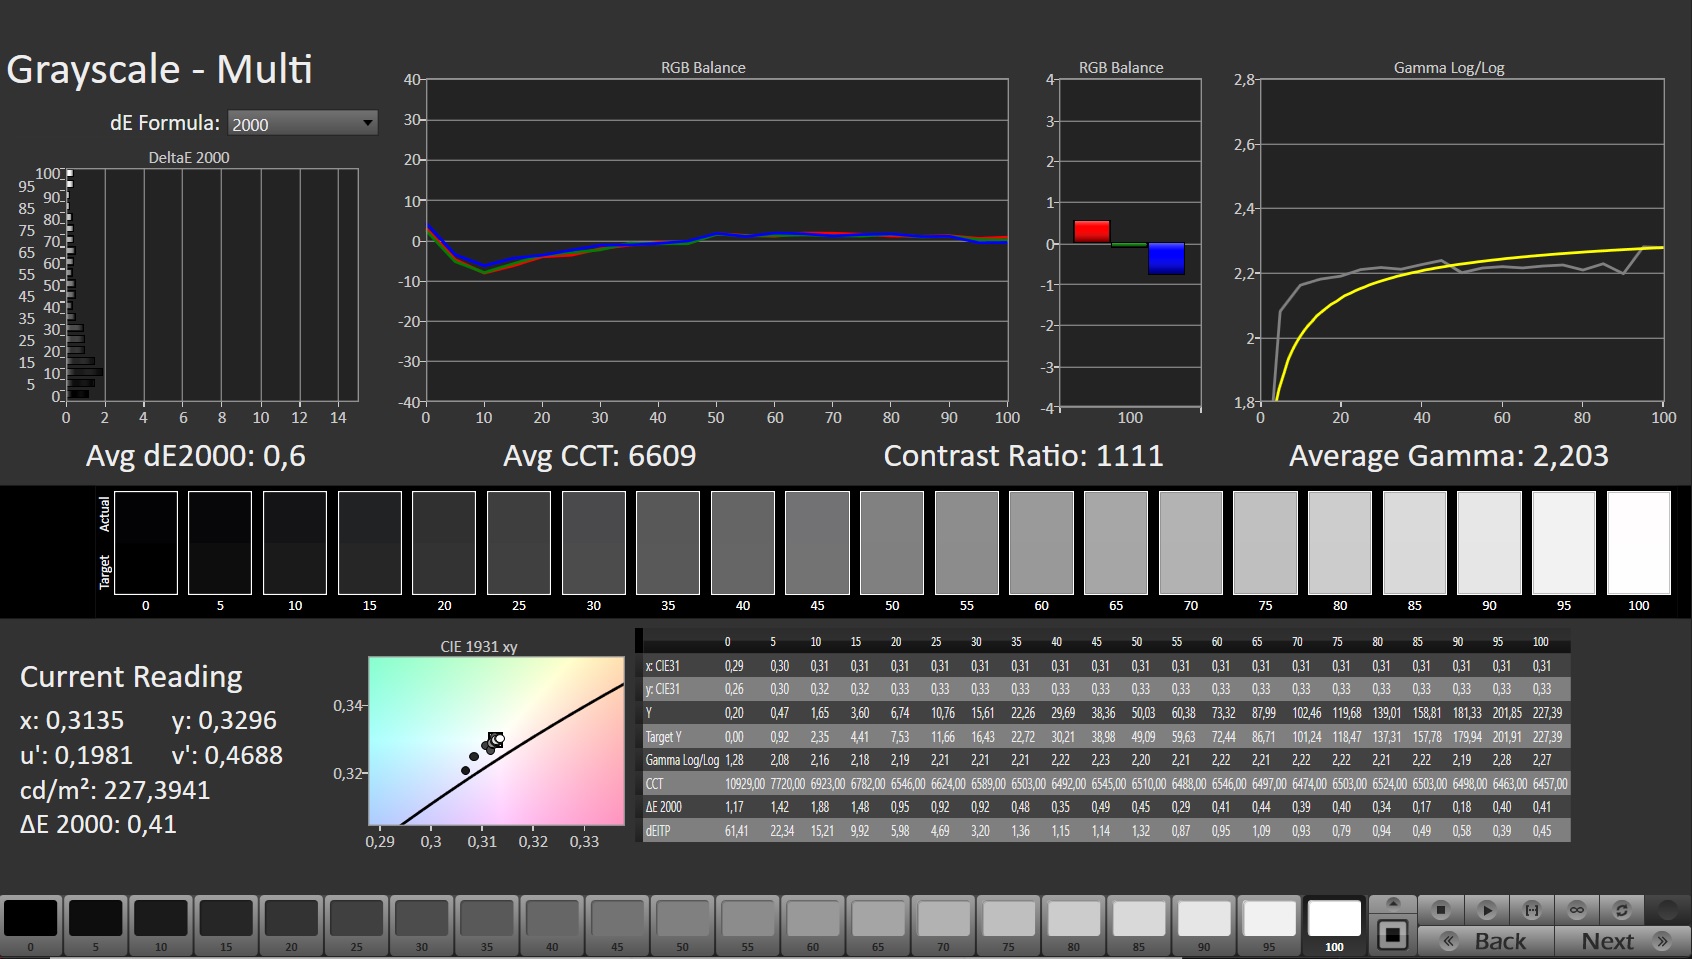
ΔE Greyscale Calman: 2.7 | ∀{0.09-98 Ø4.96}
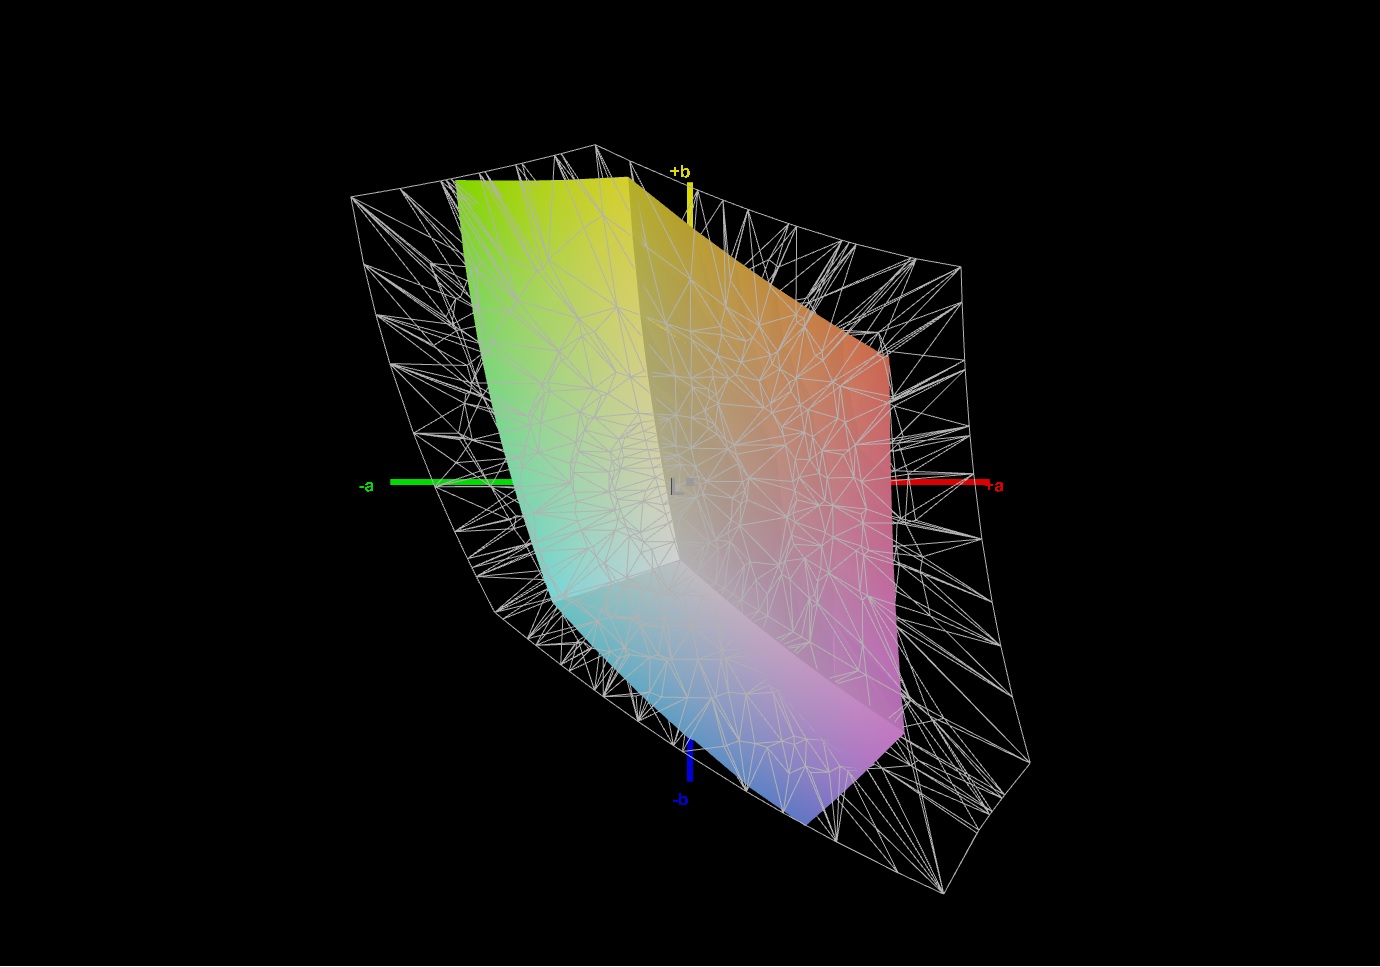
40.4% AdobeRGB 1998 (Argyll 3D)
58.3% sRGB (Argyll 3D)
39.1% Display P3 (Argyll 3D)
Gamma: 2.208
CCT: 6176 K
| MSI Katana GF66 12UGS AU Optronics AUOAF90, IPS, 1920x1080, 15.6" | MSI Katana GF66 11UG-220 AU Optronics B156HAN08.0, IPS, 1920x1080, 15.6" | MSI Katana GF76 12UGS AU Optronics B173HAN04.9, IPS, 1920x1080, 17.3" | Asus TUF Gaming F15 FX507ZM TL156VDXP0101, IPS, 1920x1080, 15.6" | Asus TUF Gaming A15 FA506QR-AZ061T Sharp SHP1532, IPS, 1920x1080, 15.6" | Acer Nitro 5 AN515-58-72QR Chi Mei N156KME-GNA, IPS, 2560x1440, 15.6" | Lenovo Legion 5 15ACH6A-82NW0010GE LGD06A5, IPS, 1920x1080, 15.6" | |
|---|---|---|---|---|---|---|---|
| Display | 63% | -1% | 69% | 109% | 77% | ||
| Display P3 Coverage (%) | 39.1 | 65.4 67% | 38.5 -2% | 66.4 70% | 95.6 145% | 71.1 82% | |
| sRGB Coverage (%) | 58.3 | 91.3 57% | 57.8 -1% | 97 66% | 99.8 71% | 99.1 70% | |
| AdobeRGB 1998 Coverage (%) | 40.4 | 66.7 65% | 39.8 -1% | 68.5 70% | 85.2 111% | 72.3 79% | |
| Response Times | 71% | 3% | 71% | 71% | 63% | 71% | |
| Response Time Grey 50% / Grey 80% * (ms) | 40 ? | 7.4 ? 81% | 40.6 ? -2% | 5.6 ? 86% | 12 ? 70% | 15.7 ? 61% | 15 ? 62% |
| Response Time Black / White * (ms) | 28.4 ? | 11.2 ? 61% | 26.4 ? 7% | 12.8 ? 55% | 8 ? 72% | 10.2 ? 64% | 6 ? 79% |
| PWM Frequency (Hz) | 1250 ? | ||||||
| Screen | 7% | 23% | 32% | 30% | 12% | 15% | |
| Brightness middle (cd/m²) | 227 | 307 35% | 281 24% | 353.7 56% | 297 31% | 332 46% | 371 63% |
| Brightness (cd/m²) | 225 | 321 43% | 264 17% | 340 51% | 268 19% | 303 35% | 328 46% |
| Brightness Distribution (%) | 90 | 83 -8% | 88 -2% | 89 -1% | 84 -7% | 86 -4% | 85 -6% |
| Black Level * (cd/m²) | 0.21 | 0.27 -29% | 0.2 5% | 0.34 -62% | 0.22 -5% | 0.29 -38% | 0.32 -52% |
| Contrast (:1) | 1081 | 1137 5% | 1405 30% | 1040 -4% | 1350 25% | 1145 6% | 1159 7% |
| Colorchecker dE 2000 * | 4.19 | 4.67 -11% | 3.69 12% | 1.74 58% | 1.36 68% | 3.61 14% | 3.25 22% |
| Colorchecker dE 2000 max. * | 17.45 | 7.53 57% | 8.46 52% | 3.63 79% | 3.82 78% | 7.71 56% | 6.33 64% |
| Colorchecker dE 2000 calibrated * | 3.81 | 2.41 37% | 3.61 5% | 0.5 87% | 0.59 85% | 1.11 71% | |
| Greyscale dE 2000 * | 2.7 | 4.5 -67% | 0.94 65% | 2.1 22% | 1.88 30% | 5.2 -93% | 4.94 -83% |
| Gamma | 2.208 100% | 2.276 97% | 2.42 91% | 2.3 96% | 2.48 89% | 2.155 102% | 2.45 90% |
| CCT | 6176 105% | 6824 95% | 6443 101% | 6257 104% | 6768 96% | 6724 97% | 6064 107% |
| Color Space (Percent of AdobeRGB 1998) (%) | 63 | ||||||
| Color Space (Percent of sRGB) (%) | 99 | ||||||
| Média Total (Programa/Configurações) | 47% /
28% | 8% /
15% | 57% /
45% | 51% /
38% | 61% /
40% | 54% /
36% |
* ... menor é melhor
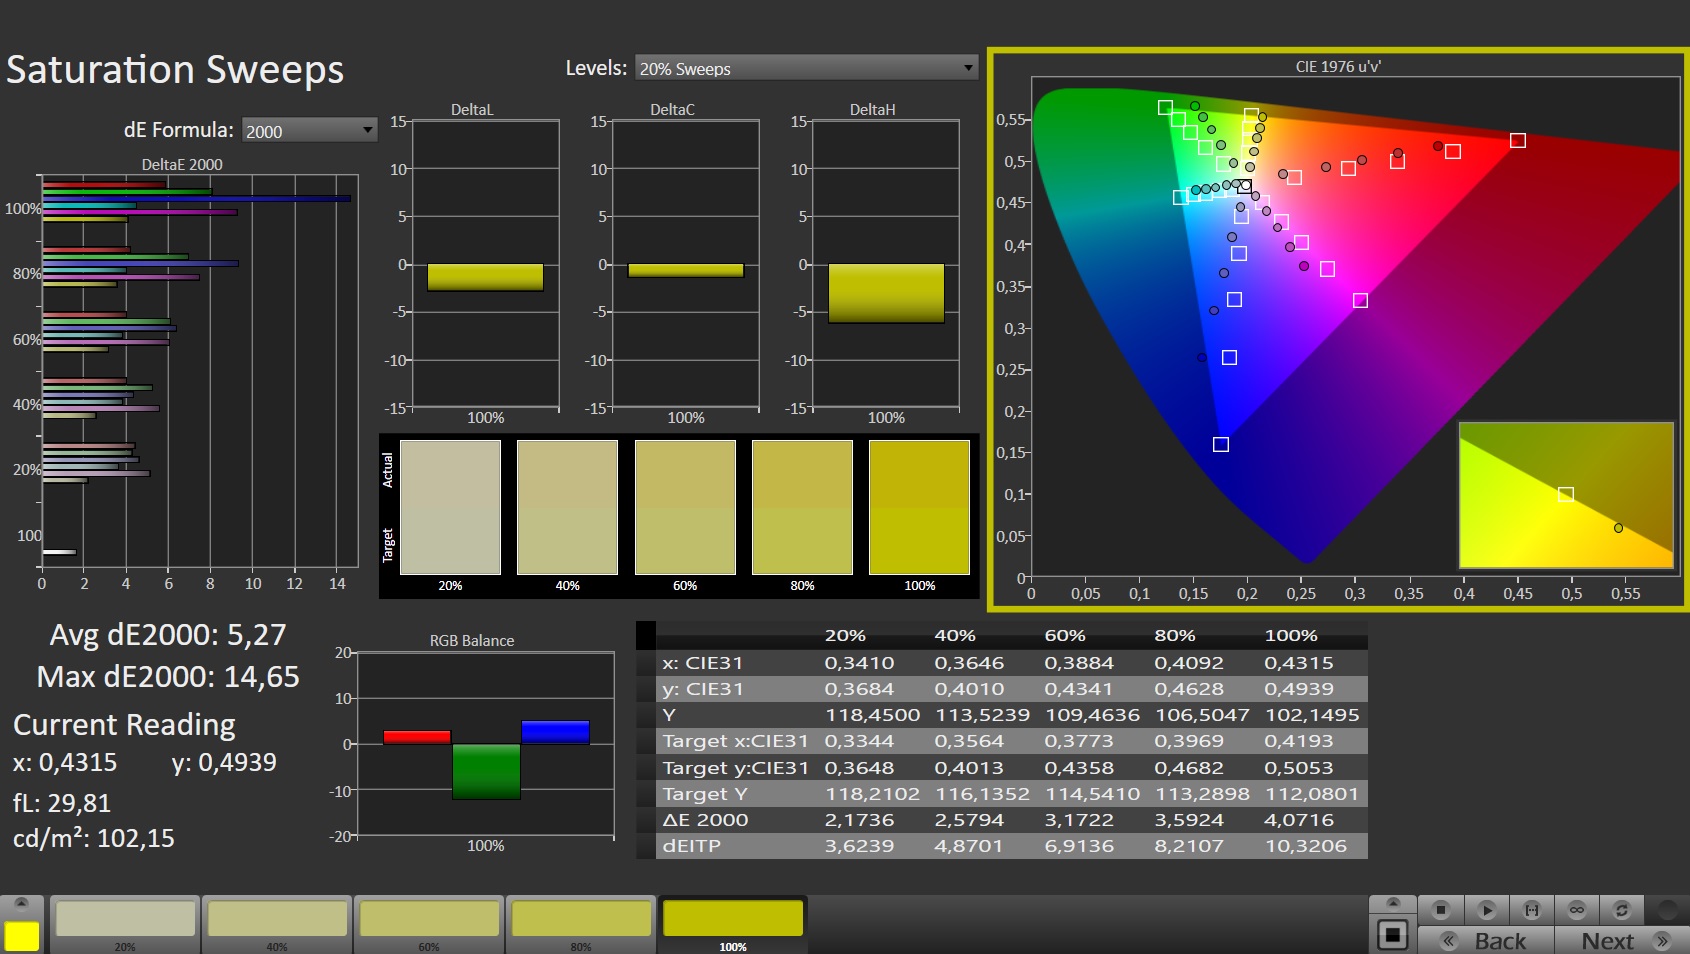
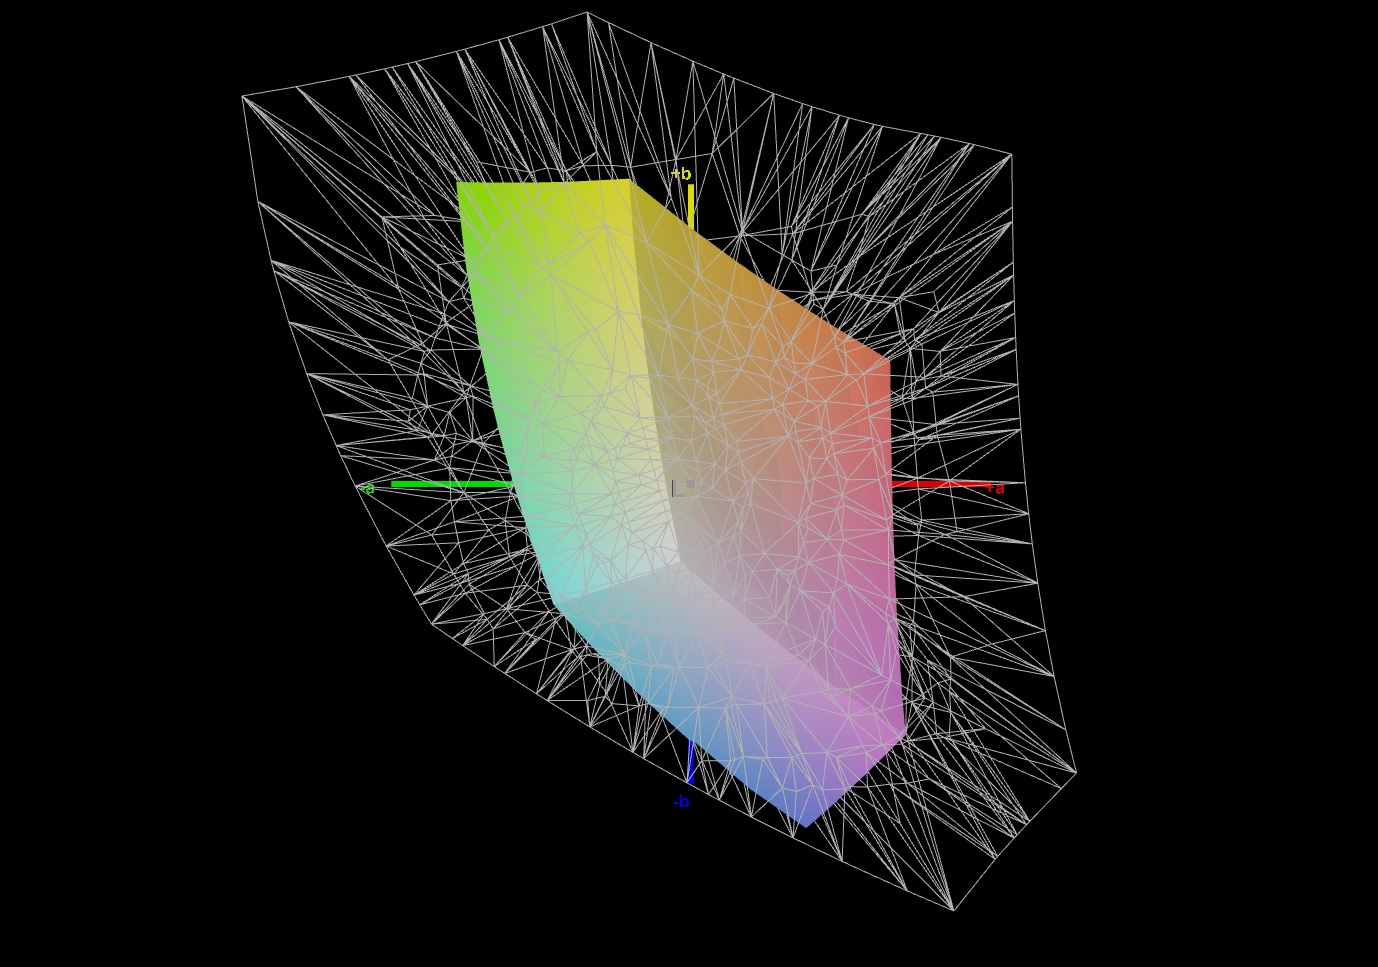
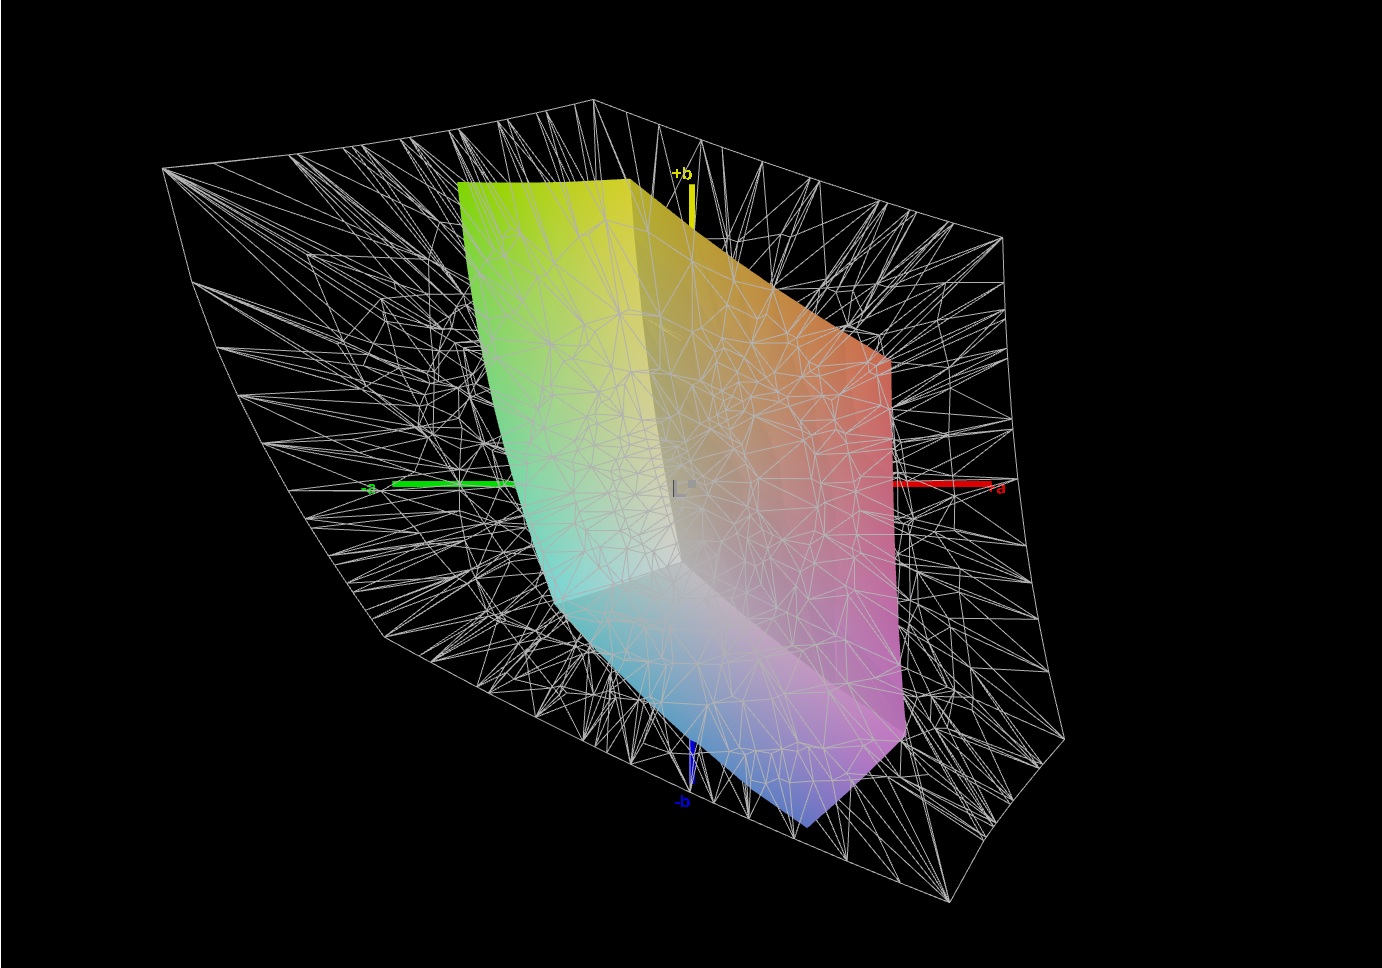
A cobertura do espaço de cores e reprodução de cores do MSI Katana GF66 12UGS é pouco convincente. Quase todas as cores estão fora da faixa de reprodução natural, e você pode até mesmo notar desvios de cor com seus olhos nus. Devido à baixa cobertura do espaço de cor, mesmo uma calibração com CalMan e o Colorímetro X-Rite i1 dificilmente trará quaisquer melhorias.

Exibir tempos de resposta
| ↔ Tempo de resposta preto para branco | ||
|---|---|---|
| 28.4 ms ... ascensão ↗ e queda ↘ combinadas | ↗ 15.2 ms ascensão | 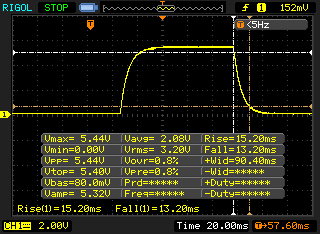 |
| ↘ 13.2 ms queda | ||
| A tela mostra taxas de resposta relativamente lentas em nossos testes e pode ser muito lenta para os jogadores. Em comparação, todos os dispositivos testados variam de 0.1 (mínimo) a 240 (máximo) ms. » 75 % de todos os dispositivos são melhores. Isso significa que o tempo de resposta medido é pior que a média de todos os dispositivos testados (19.8 ms). | ||
| ↔ Tempo de resposta 50% cinza a 80% cinza | ||
| 40 ms ... ascensão ↗ e queda ↘ combinadas | ↗ 18.8 ms ascensão | 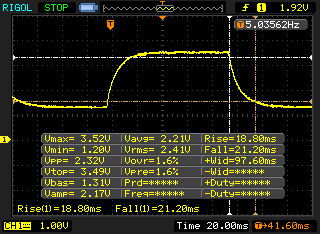 |
| ↘ 21.2 ms queda | ||
| A tela mostra taxas de resposta lentas em nossos testes e será insatisfatória para os jogadores. Em comparação, todos os dispositivos testados variam de 0.165 (mínimo) a 636 (máximo) ms. » 61 % de todos os dispositivos são melhores. Isso significa que o tempo de resposta medido é pior que a média de todos os dispositivos testados (31 ms). | ||
Cintilação da tela / PWM (modulação por largura de pulso)
| Tela tremeluzindo / PWM não detectado | 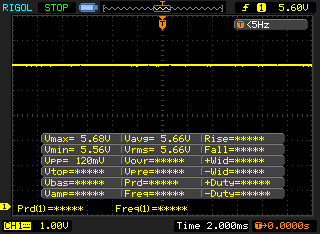 | ||
[pwm_comparison] Em comparação: 52 % de todos os dispositivos testados não usam PWM para escurecer a tela. Se PWM foi detectado, uma média de 7757 (mínimo: 5 - máximo: 343500) Hz foi medida. | |||
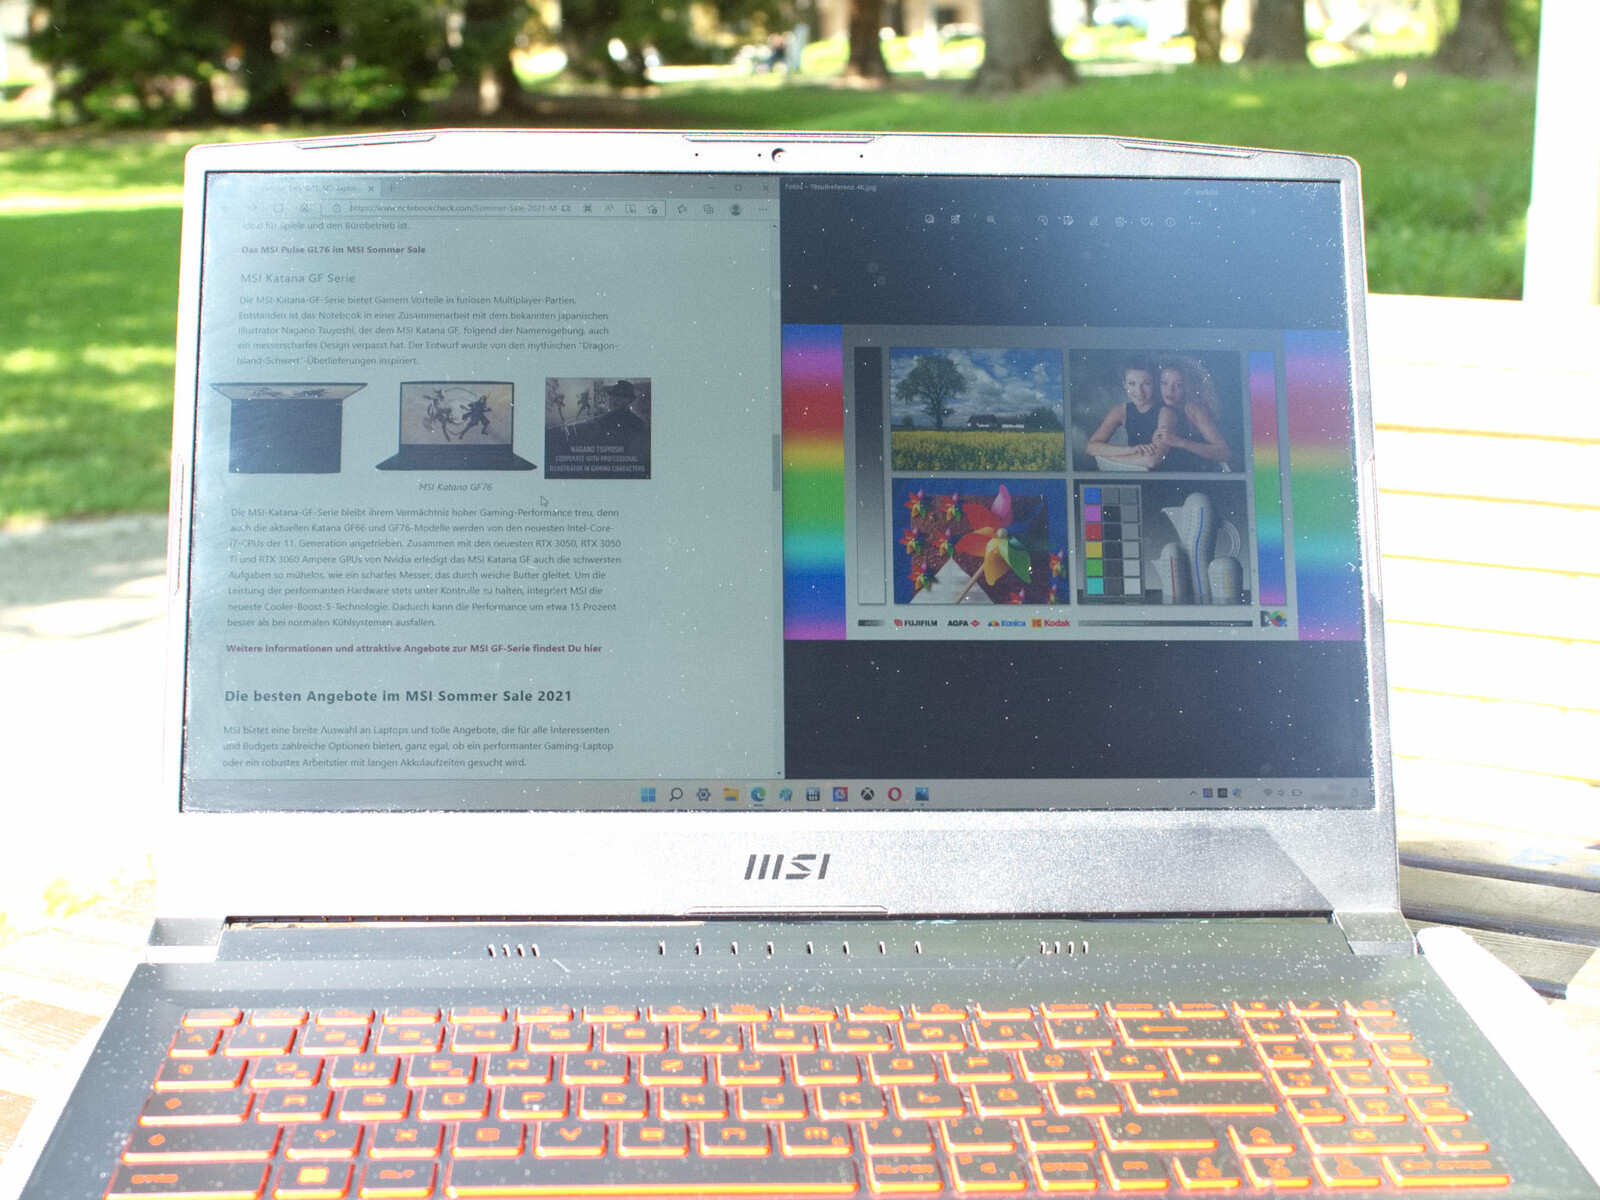
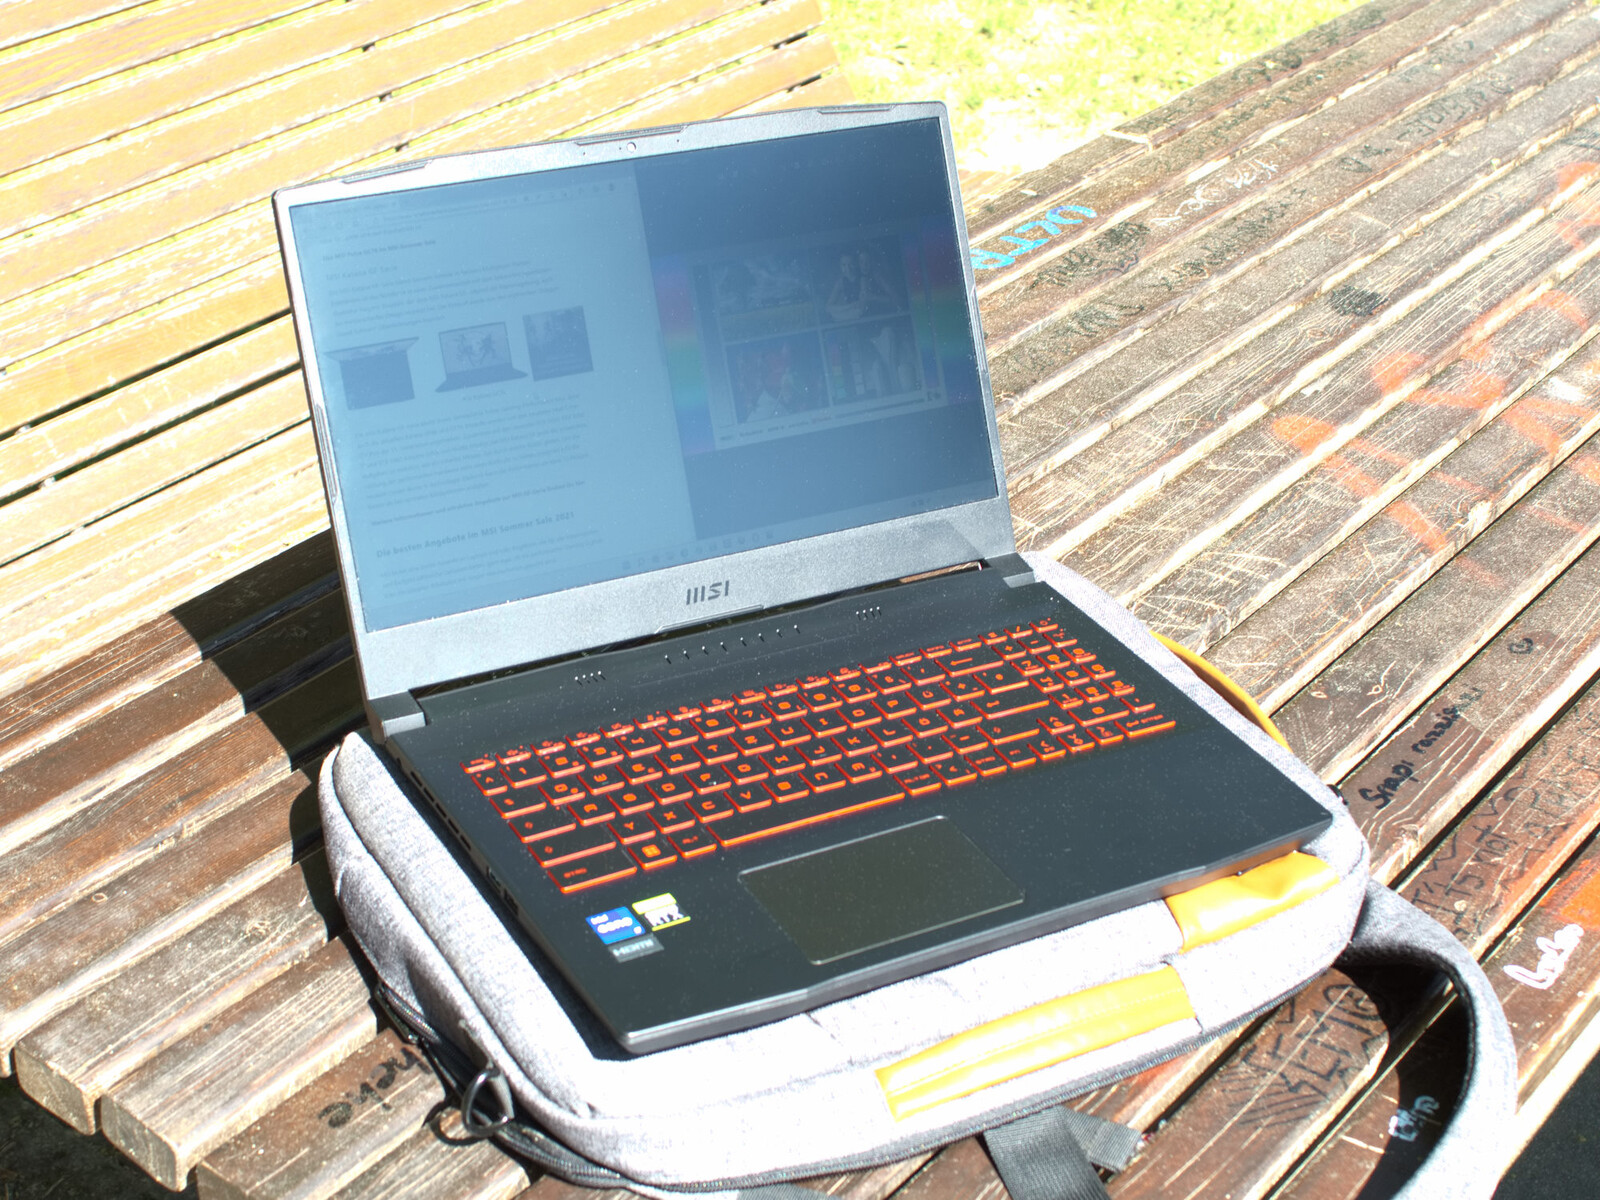
Sob a luz solar brilhante, o conteúdo da imagem só pode ser lido de forma limitada. Para poder lê-la facilmente, a tela teria que oferecer um brilho maior.
Na análise dos ângulos de visão, o MSI GF66 12UGS faz justiça à especificação Wide View (nível IPS) na folha de dados. Há apenas desvios mínimos nas cores e contraste de todos os ângulos de visão. Por outro lado, o brilho percebido cai relativamente rápido, mas que isto parece exagerado na imagem da câmera.

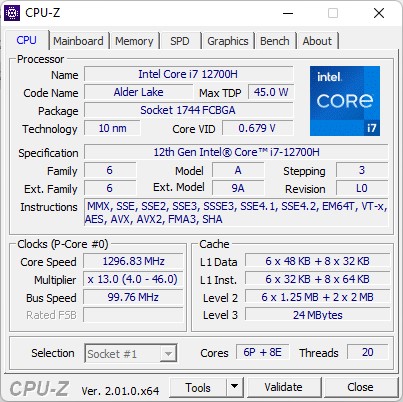
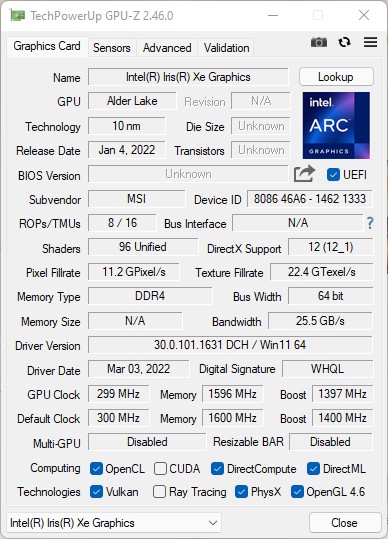
Desempenho - A atual geração de CPU
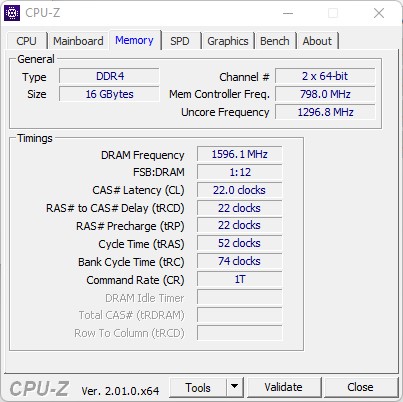
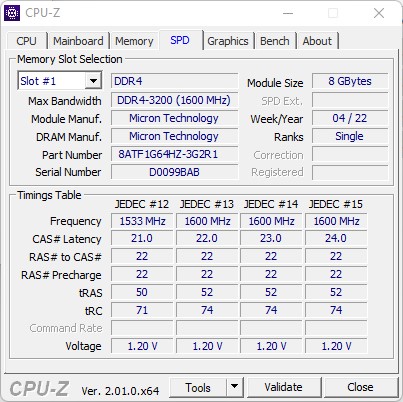
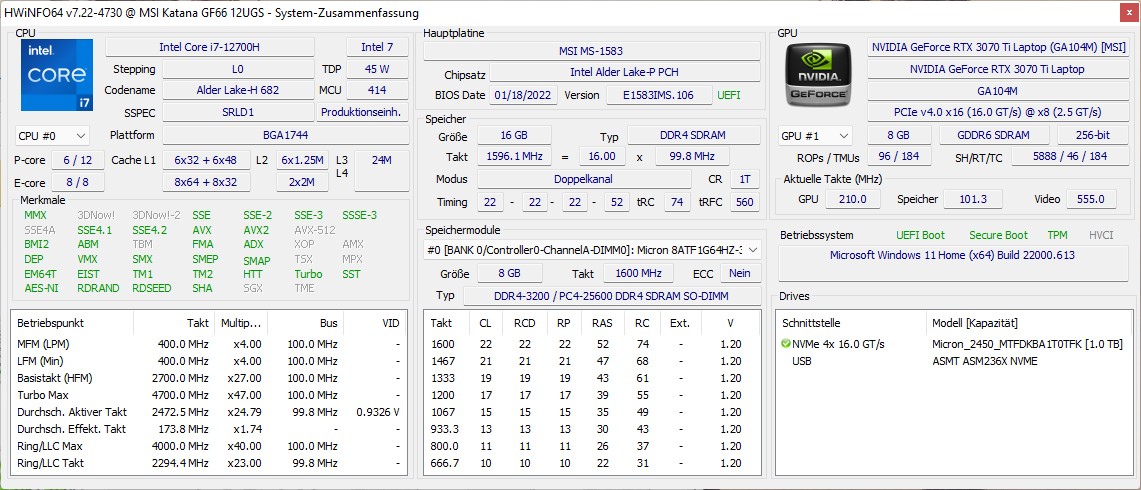
Os computadores portáteis para jogos MSI Katana GF66 12U estão disponíveis em uma ampla variedade de configurações. Tanto oIntel Core i5-12500Hou oi7-12700Hestão disponíveis, assim como 8 ou 16 GB de memória de trabalho DDR4-3200. A MSI também oferece várias configurações de chips gráficos desde o Nvidia GeForce RTX 3050 até o RTX 3070 Ti. No sistema operacional pré-instalado, você também tem a opção entre FreeDos ou Windows 11 Home.
Nossa unidade de teste oferece uma configuração poderosa com o Nvidia GeForce RTX 3070 Ti, Intel Core i7-12700He 16 GB de RAM. Com isto, o laptop é claramente voltado para o jogo. Graças à poderosa placa gráfica, mesmo jogos graficamente exigentes podem ser jogados com altas taxas de quadros.
Condições de teste
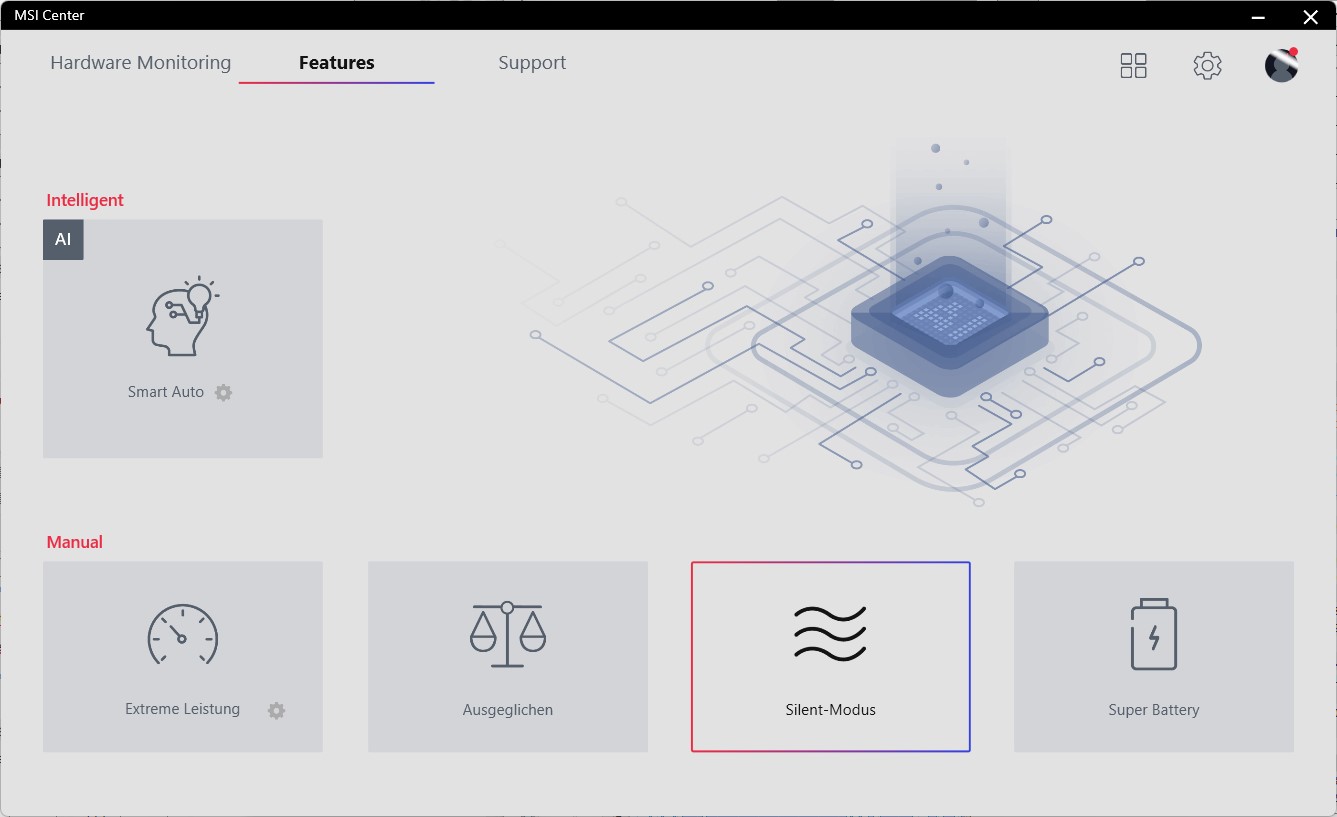
Graças ao controle de desempenho inteligente, você basicamente não precisa configurar nada manualmente no MSI Katana GF66. Neste modo de desempenho, o laptop muda automaticamente para um dos modos pré-instalados entre Silent e Extreme Performance
Os limites de desempenho do PL1 estão entre 85 e 23 watts. Na operação com bateria, o PL1 também pode ser baixado para 13 watts no modo Super Bateria
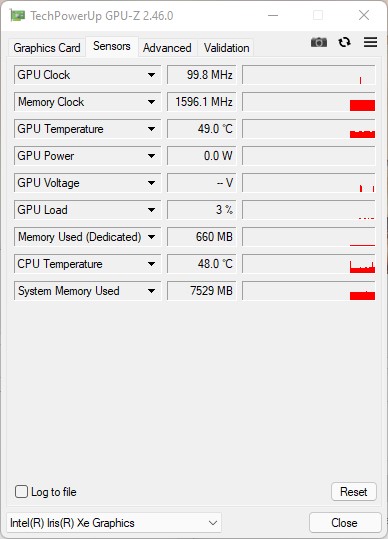
Todos os testes foram realizados no modo de desempenho Smart Auto. O consumo do processador a longo prazo é de cerca de 38 watts aqui, mas o laptop também é capaz de aumentar significativamente este desempenho durante os jogos ou em outros cenários.
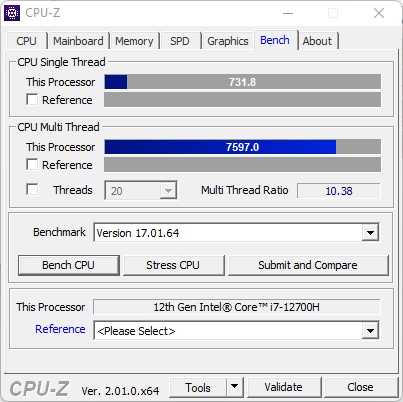
Processador
O Intel Core i7-12700H pertence às CPUs de alta qualidade da nova geração Alder Lake. O processador oferece seis núcleos de desempenho e oito de eficiência. Desta forma, a CPU é capaz de operar em 20 fios. Com um TDP configurável até 45 watts em PL1, o processador é adequado para laptops maiores com um poderoso sistema de resfriamento.
Em nosso teste, o Katana GF66 é capaz de mostrar um desempenho significativamente maior em algumas áreas do que seu predecessor. Mesmo no modo de desempenho AI, ele supera seu irmão mais velho na maioria dos benchmarks genéricos do processador. Nós testamos o MSI Katana GF76que é equipado com o mesmo hardware, no modo de Desempenho Extremo. Enquanto aquele laptop mostra um desempenho superior sob carga mais longa desta forma, ele tem um desempenho a nível de olho em benchmarks com cargas de curto prazo. A comparação entre o GF66 11U e o GF66 12UGS é mais interessante. No modo AI bastante equilibrado, o Intel Core i7-12700H no GF66 atinge aproximadamente o mesmo desempenho que seu predecessor no modo de Desempenho Extremo.
Cinebench R15 Multi Constant Load Test
* ... menor é melhor
AIDA64: FP32 Ray-Trace | FPU Julia | CPU SHA3 | CPU Queen | FPU SinJulia | FPU Mandel | CPU AES | CPU ZLib | FP64 Ray-Trace | CPU PhotoWorxx
| Performance rating | |
| Média da turma Gaming | |
| Média Intel Core i7-12700H | |
| MSI Katana GF76 12UGS | |
| MSI Katana GF66 12UGS | |
| Asus TUF Gaming A15 FA506QR-AZ061T | |
| Lenovo Legion 5 15ACH6A-82NW0010GE | |
| Acer Nitro 5 AN515-58-72QR | |
| MSI Katana GF66 11UG-220 -9! | |
| AIDA64 / FP32 Ray-Trace | |
| Média da turma Gaming (10227 - 85542, n=105, últimos 2 anos) | |
| Asus TUF Gaming A15 FA506QR-AZ061T | |
| Lenovo Legion 5 15ACH6A-82NW0010GE | |
| Média Intel Core i7-12700H (2585 - 17957, n=64) | |
| MSI Katana GF66 12UGS | |
| MSI Katana GF76 12UGS | |
| Acer Nitro 5 AN515-58-72QR | |
| AIDA64 / FPU Julia | |
| Média da turma Gaming (51376 - 238426, n=105, últimos 2 anos) | |
| Lenovo Legion 5 15ACH6A-82NW0010GE | |
| Asus TUF Gaming A15 FA506QR-AZ061T | |
| Média Intel Core i7-12700H (12439 - 90760, n=64) | |
| Acer Nitro 5 AN515-58-72QR | |
| MSI Katana GF66 12UGS | |
| MSI Katana GF76 12UGS | |
| AIDA64 / CPU SHA3 | |
| Média da turma Gaming (2180 - 10115, n=105, últimos 2 anos) | |
| MSI Katana GF76 12UGS | |
| Média Intel Core i7-12700H (833 - 4242, n=64) | |
| MSI Katana GF66 12UGS | |
| Acer Nitro 5 AN515-58-72QR | |
| Lenovo Legion 5 15ACH6A-82NW0010GE | |
| Asus TUF Gaming A15 FA506QR-AZ061T | |
| AIDA64 / CPU Queen | |
| Média da turma Gaming (49785 - 173351, n=90, últimos 2 anos) | |
| MSI Katana GF76 12UGS | |
| MSI Katana GF66 12UGS | |
| Acer Nitro 5 AN515-58-72QR | |
| Média Intel Core i7-12700H (57923 - 103202, n=63) | |
| Asus TUF Gaming A15 FA506QR-AZ061T | |
| Lenovo Legion 5 15ACH6A-82NW0010GE | |
| AIDA64 / FPU SinJulia | |
| Média da turma Gaming (4424 - 33636, n=105, últimos 2 anos) | |
| Asus TUF Gaming A15 FA506QR-AZ061T | |
| Acer Nitro 5 AN515-58-72QR | |
| MSI Katana GF66 12UGS | |
| MSI Katana GF76 12UGS | |
| Média Intel Core i7-12700H (3249 - 9939, n=64) | |
| Lenovo Legion 5 15ACH6A-82NW0010GE | |
| AIDA64 / FPU Mandel | |
| Média da turma Gaming (25115 - 128721, n=105, últimos 2 anos) | |
| Lenovo Legion 5 15ACH6A-82NW0010GE | |
| Asus TUF Gaming A15 FA506QR-AZ061T | |
| Média Intel Core i7-12700H (7135 - 44760, n=64) | |
| Acer Nitro 5 AN515-58-72QR | |
| MSI Katana GF66 12UGS | |
| MSI Katana GF76 12UGS | |
| AIDA64 / CPU AES | |
| Média da turma Gaming (39258 - 247074, n=105, últimos 2 anos) | |
| Lenovo Legion 5 15ACH6A-82NW0010GE | |
| MSI Katana GF76 12UGS | |
| MSI Katana GF66 12UGS | |
| Média Intel Core i7-12700H (31839 - 144360, n=64) | |
| Asus TUF Gaming A15 FA506QR-AZ061T | |
| Acer Nitro 5 AN515-58-72QR | |
| AIDA64 / CPU ZLib | |
| Média da turma Gaming (574 - 2531, n=105, últimos 2 anos) | |
| Acer Nitro 5 AN515-58-72QR | |
| MSI Katana GF76 12UGS | |
| MSI Katana GF66 12UGS | |
| Média Intel Core i7-12700H (305 - 1171, n=64) | |
| Asus TUF Gaming A15 FA506QR-AZ061T | |
| Lenovo Legion 5 15ACH6A-82NW0010GE | |
| MSI Katana GF66 11UG-220 | |
| AIDA64 / FP64 Ray-Trace | |
| Média da turma Gaming (5509 - 45446, n=105, últimos 2 anos) | |
| Asus TUF Gaming A15 FA506QR-AZ061T | |
| Lenovo Legion 5 15ACH6A-82NW0010GE | |
| Média Intel Core i7-12700H (1437 - 9692, n=64) | |
| Acer Nitro 5 AN515-58-72QR | |
| MSI Katana GF76 12UGS | |
| MSI Katana GF66 12UGS | |
| AIDA64 / CPU PhotoWorxx | |
| Média da turma Gaming (12271 - 89891, n=105, últimos 2 anos) | |
| Média Intel Core i7-12700H (12863 - 52207, n=64) | |
| MSI Katana GF66 12UGS | |
| MSI Katana GF76 12UGS | |
| Acer Nitro 5 AN515-58-72QR | |
| Asus TUF Gaming A15 FA506QR-AZ061T | |
| Lenovo Legion 5 15ACH6A-82NW0010GE | |
Desempenho do sistema
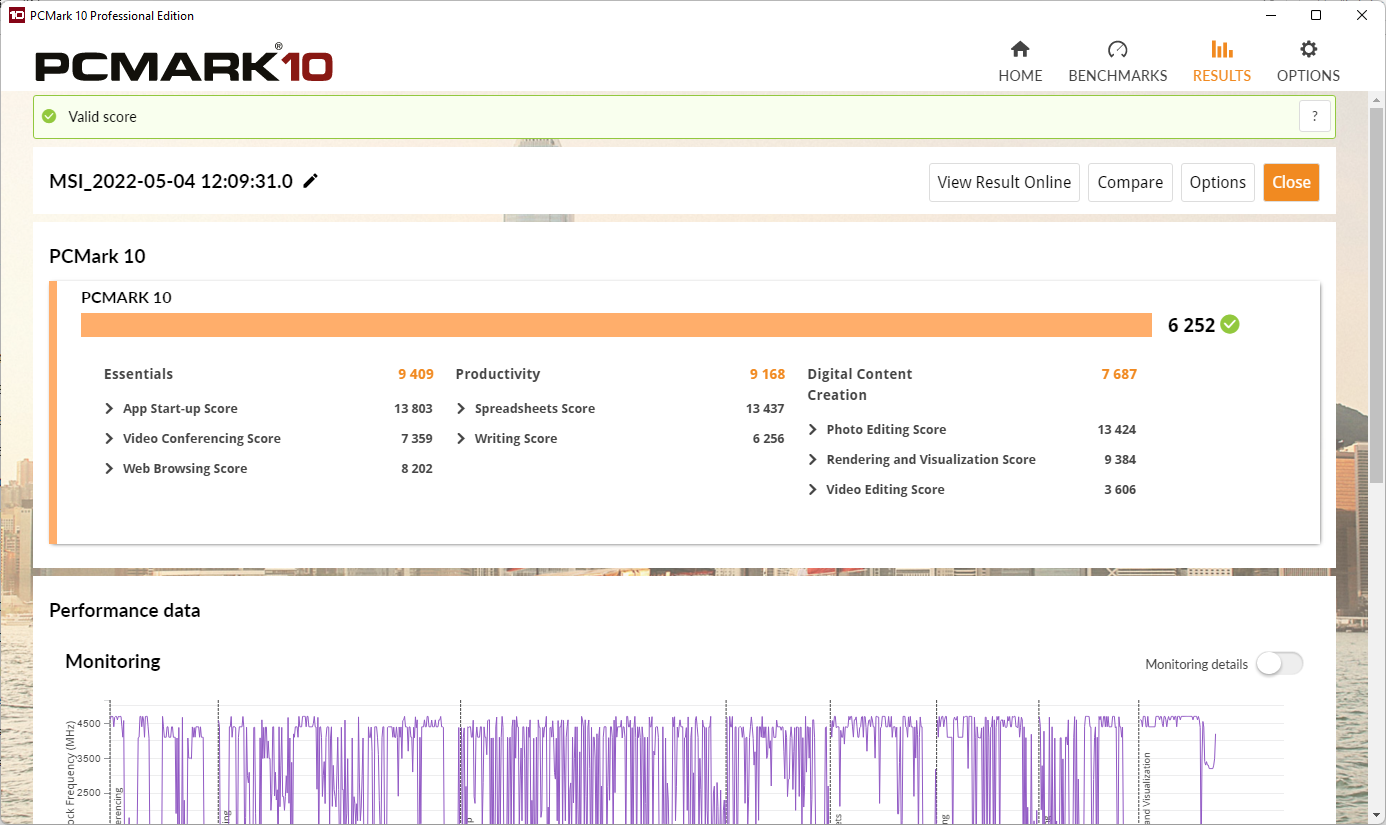
Embora o Katana GF66 seja capaz de oferecer um desempenho sólido nos benchmarks PCMark10 e CrossMark, ele é incapaz de superar todos os concorrentes. A responsabilidade por isto deve estar principalmente na memória de trabalho relativamente lenta e no TDP/TGP ligeiramente limitado. A latência medida da memória de trabalho se torna extremamente alta em 95,7 ns.
Apesar da operação por bateria, o MSI Katana GF66 é capaz de atingir um valor relativamente bom no PCMark 10, como mostra um teste de referência adicional. Com 9409 e 9168 pontos nos segmentos Essentials e Productivity respectivamente, o laptop para jogos atinge um alto número de pontos mesmo em operação com bateria.
CrossMark: Overall | Productivity | Creativity | Responsiveness
| PCMark 10 / Score | |
| Média da turma Gaming (5828 - 12414, n=93, últimos 2 anos) | |
| MSI Katana GF76 12UGS | |
| Média Intel Core i7-12700H, NVIDIA GeForce RTX 3070 Ti Laptop GPU (6941 - 7947, n=11) | |
| MSI Katana GF66 12UGS | |
| Asus TUF Gaming F15 FX507ZM | |
| Lenovo Legion 5 15ACH6A-82NW0010GE | |
| Acer Nitro 5 AN515-58-72QR | |
| Asus TUF Gaming A15 FA506QR-AZ061T | |
| MSI Katana GF66 11UG-220 | |
| PCMark 10 / Essentials | |
| MSI Katana GF76 12UGS | |
| Média da turma Gaming (8810 - 11935, n=97, últimos 2 anos) | |
| Média Intel Core i7-12700H, NVIDIA GeForce RTX 3070 Ti Laptop GPU (9892 - 10935, n=11) | |
| Lenovo Legion 5 15ACH6A-82NW0010GE | |
| Asus TUF Gaming F15 FX507ZM | |
| MSI Katana GF66 12UGS | |
| Asus TUF Gaming A15 FA506QR-AZ061T | |
| Acer Nitro 5 AN515-58-72QR | |
| MSI Katana GF66 11UG-220 | |
| PCMark 10 / Productivity | |
| Média da turma Gaming (6845 - 25323, n=95, últimos 2 anos) | |
| MSI Katana GF76 12UGS | |
| MSI Katana GF66 12UGS | |
| Média Intel Core i7-12700H, NVIDIA GeForce RTX 3070 Ti Laptop GPU (9024 - 10638, n=11) | |
| Asus TUF Gaming A15 FA506QR-AZ061T | |
| Lenovo Legion 5 15ACH6A-82NW0010GE | |
| MSI Katana GF66 11UG-220 | |
| Asus TUF Gaming F15 FX507ZM | |
| Acer Nitro 5 AN515-58-72QR | |
| PCMark 10 / Digital Content Creation | |
| Média da turma Gaming (7602 - 19954, n=95, últimos 2 anos) | |
| Asus TUF Gaming F15 FX507ZM | |
| Média Intel Core i7-12700H, NVIDIA GeForce RTX 3070 Ti Laptop GPU (10165 - 12546, n=11) | |
| MSI Katana GF66 12UGS | |
| MSI Katana GF76 12UGS | |
| Acer Nitro 5 AN515-58-72QR | |
| Lenovo Legion 5 15ACH6A-82NW0010GE | |
| MSI Katana GF66 11UG-220 | |
| Asus TUF Gaming A15 FA506QR-AZ061T | |
| CrossMark / Overall | |
| Média da turma Gaming (1366 - 2409, n=94, últimos 2 anos) | |
| MSI Katana GF66 12UGS | |
| MSI Katana GF76 12UGS | |
| Média Intel Core i7-12700H, NVIDIA GeForce RTX 3070 Ti Laptop GPU (974 - 2000, n=12) | |
| Acer Nitro 5 AN515-58-72QR | |
| CrossMark / Productivity | |
| MSI Katana GF66 12UGS | |
| MSI Katana GF76 12UGS | |
| Média da turma Gaming (1386 - 2254, n=94, últimos 2 anos) | |
| Média Intel Core i7-12700H, NVIDIA GeForce RTX 3070 Ti Laptop GPU (907 - 1962, n=12) | |
| Acer Nitro 5 AN515-58-72QR | |
| CrossMark / Creativity | |
| Média da turma Gaming (1343 - 2786, n=94, últimos 2 anos) | |
| MSI Katana GF66 12UGS | |
| Média Intel Core i7-12700H, NVIDIA GeForce RTX 3070 Ti Laptop GPU (1027 - 2057, n=12) | |
| Acer Nitro 5 AN515-58-72QR | |
| MSI Katana GF76 12UGS | |
| CrossMark / Responsiveness | |
| MSI Katana GF66 12UGS | |
| MSI Katana GF76 12UGS | |
| Média Intel Core i7-12700H, NVIDIA GeForce RTX 3070 Ti Laptop GPU (1029 - 2142, n=12) | |
| Média da turma Gaming (1226 - 2334, n=94, últimos 2 anos) | |
| Acer Nitro 5 AN515-58-72QR | |
| PCMark 10 Score | 7458 pontos | |
Ajuda | ||
| AIDA64 / Memory Copy | |
| Média da turma Gaming (21750 - 129946, n=105, últimos 2 anos) | |
| Média Intel Core i7-12700H (25615 - 80511, n=64) | |
| Asus TUF Gaming F15 FX507ZM | |
| MSI Katana GF76 12UGS | |
| MSI Katana GF66 12UGS | |
| Acer Nitro 5 AN515-58-72QR | |
| Asus TUF Gaming A15 FA506QR-AZ061T | |
| Lenovo Legion 5 15ACH6A-82NW0010GE | |
| AIDA64 / Memory Read | |
| Média da turma Gaming (22956 - 118858, n=105, últimos 2 anos) | |
| Asus TUF Gaming F15 FX507ZM | |
| Média Intel Core i7-12700H (25586 - 79442, n=64) | |
| MSI Katana GF76 12UGS | |
| MSI Katana GF66 12UGS | |
| Asus TUF Gaming A15 FA506QR-AZ061T | |
| Acer Nitro 5 AN515-58-72QR | |
| Lenovo Legion 5 15ACH6A-82NW0010GE | |
| AIDA64 / Memory Write | |
| Média da turma Gaming (22297 - 135096, n=105, últimos 2 anos) | |
| Asus TUF Gaming F15 FX507ZM | |
| Média Intel Core i7-12700H (23679 - 88660, n=64) | |
| MSI Katana GF76 12UGS | |
| MSI Katana GF66 12UGS | |
| Acer Nitro 5 AN515-58-72QR | |
| Asus TUF Gaming A15 FA506QR-AZ061T | |
| Lenovo Legion 5 15ACH6A-82NW0010GE | |
| AIDA64 / Memory Latency | |
| Média da turma Gaming (75.3 - 259, n=105, últimos 2 anos) | |
| MSI Katana GF66 12UGS | |
| MSI Katana GF76 12UGS | |
| Lenovo Legion 5 15ACH6A-82NW0010GE | |
| Asus TUF Gaming A15 FA506QR-AZ061T | |
| Média Intel Core i7-12700H (76.2 - 133.9, n=62) | |
| MSI Katana GF66 11UG-220 | |
| MSI Katana GF66 11UG-220 | |
| Asus TUF Gaming F15 FX507ZM | |
| Acer Nitro 5 AN515-58-72QR | |
| Acer Nitro 5 AN515-58-72QR | |
* ... menor é melhor
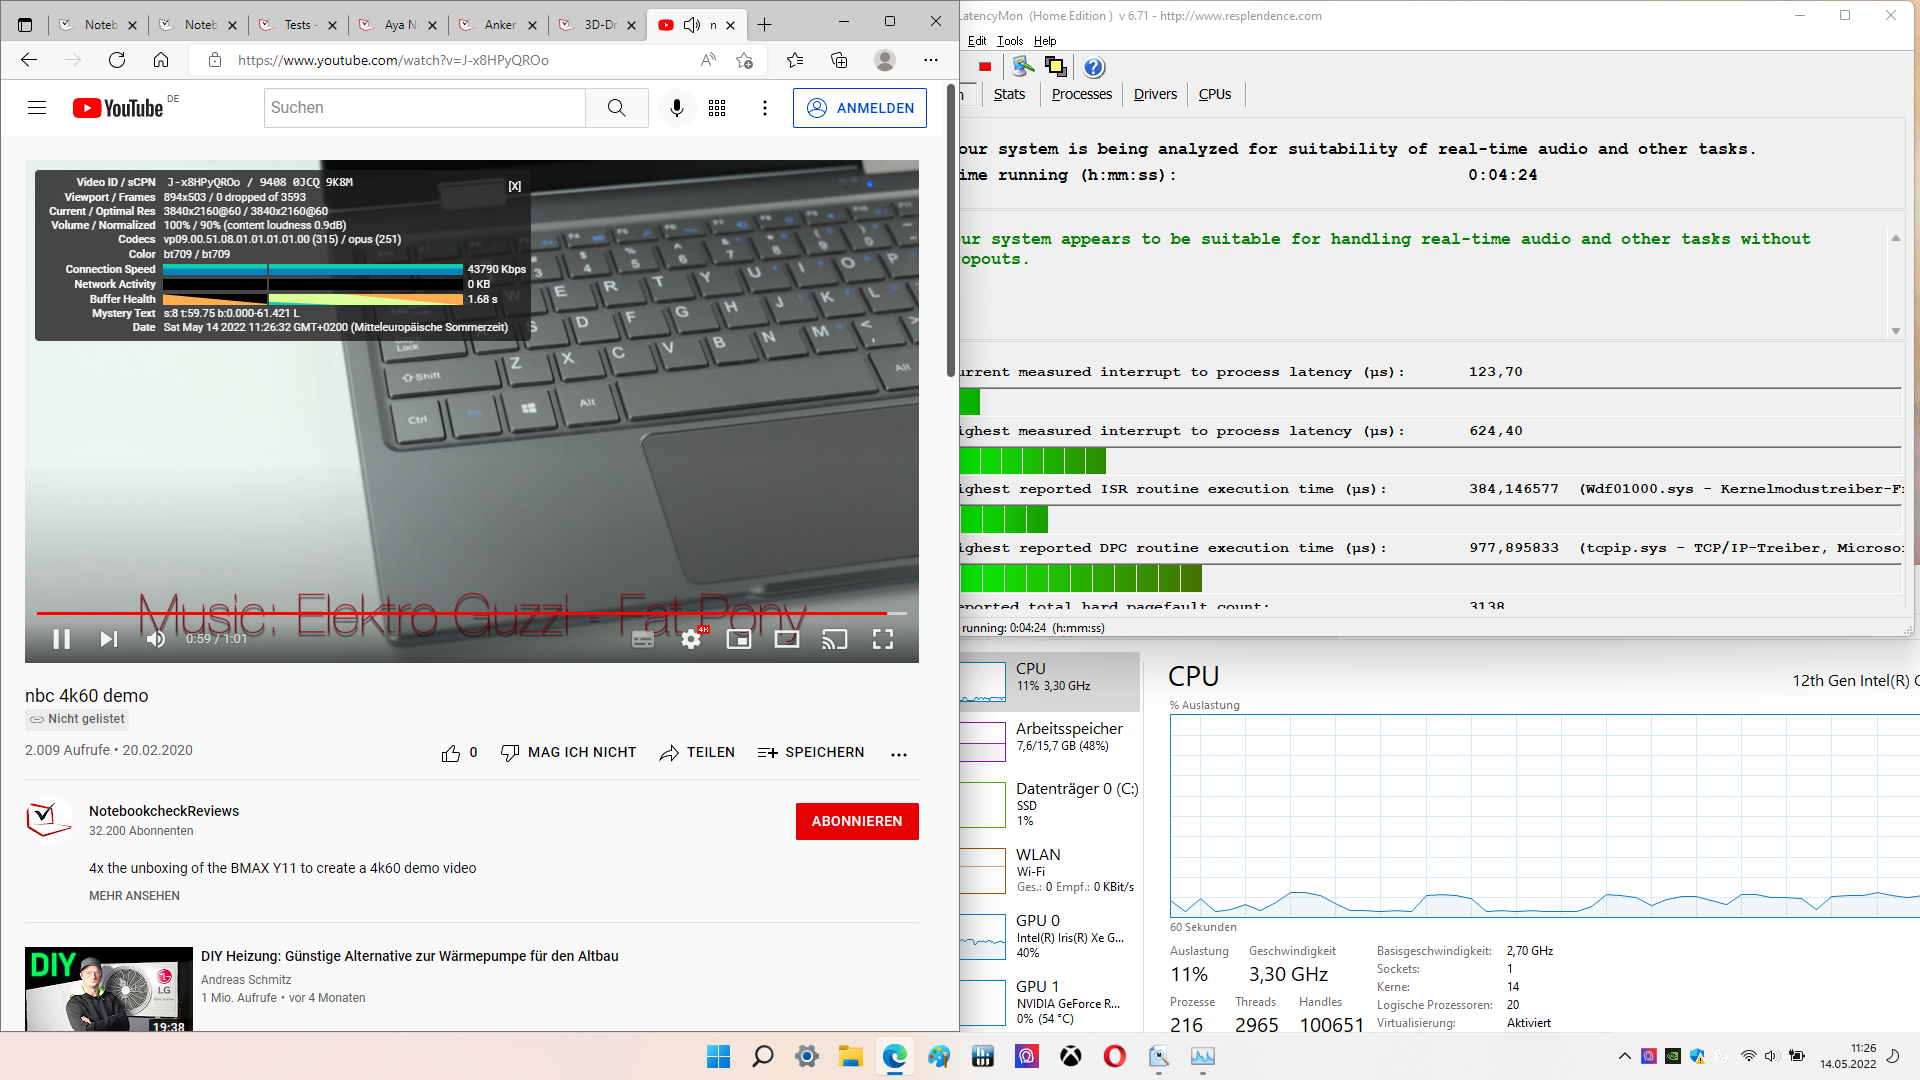
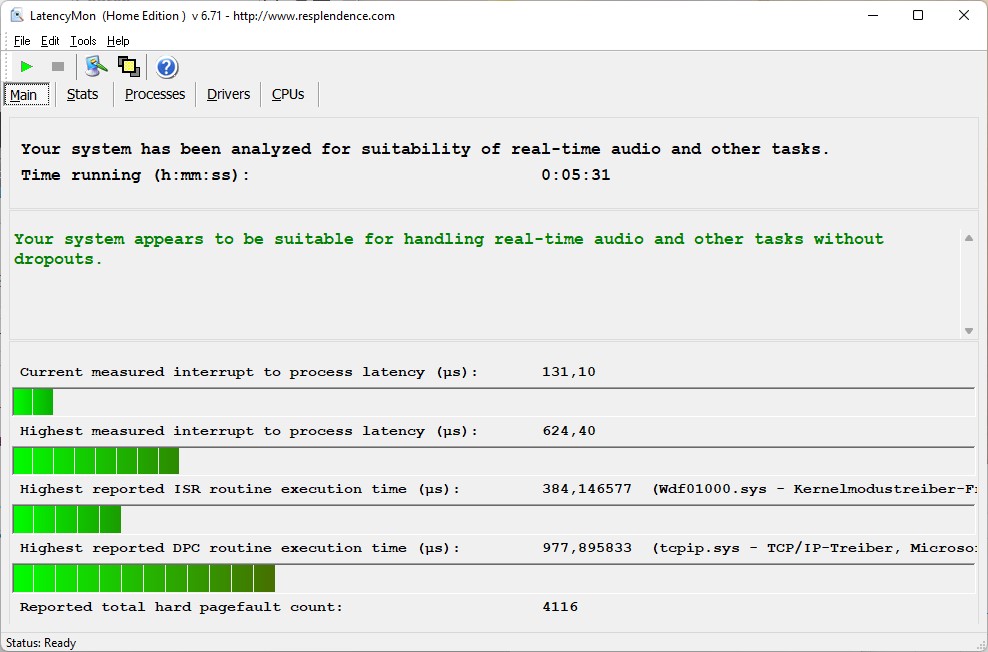
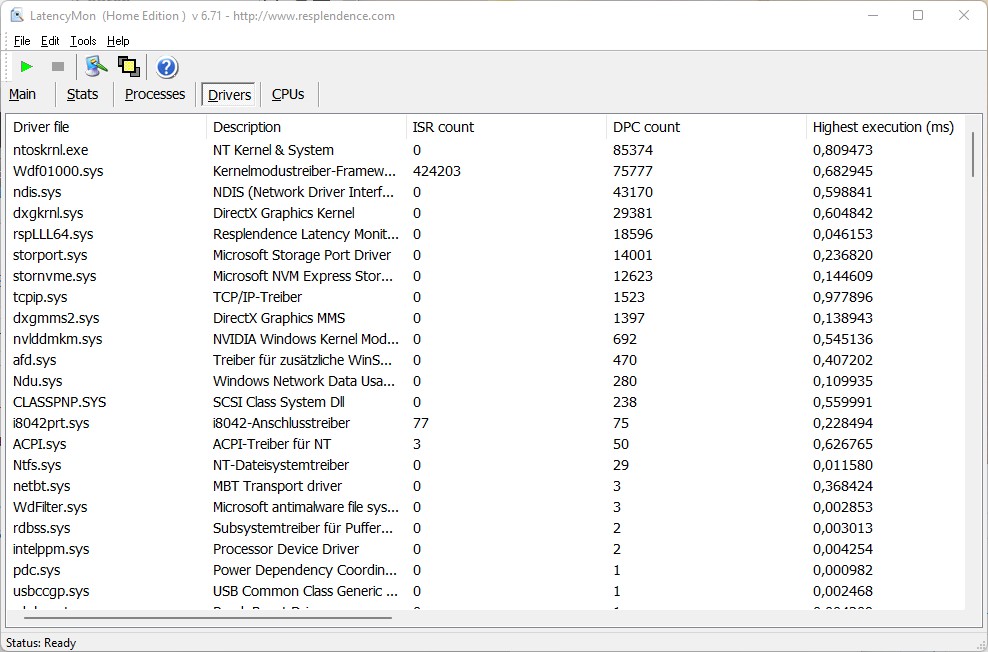
Latências DPC
As latências ao executar procedimentos críticos de tempo são relativamente baixas, de modo que o Katana GF66 na configuração de nossa unidade de teste também deve ser adequado para aplicações em tempo real. No vídeo de teste do Youtube de 4K 60Hz, não houve queda de quadros. As atualizações do driver e outros fatores podem influenciar significativamente os valores aqui.
| DPC Latencies / LatencyMon - interrupt to process latency (max), Web, Youtube, Prime95 | |
| MSI Katana GF76 12UGS | |
| Asus TUF Gaming A15 FA506QR-AZ061T | |
| MSI Katana GF66 11UG-220 | |
| Lenovo Legion 5 15ACH6A-82NW0010GE | |
| Acer Nitro 5 AN515-58-72QR | |
| MSI Katana GF66 12UGS | |
* ... menor é melhor
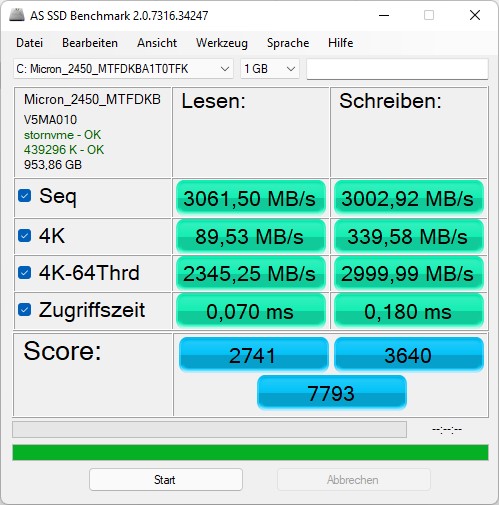
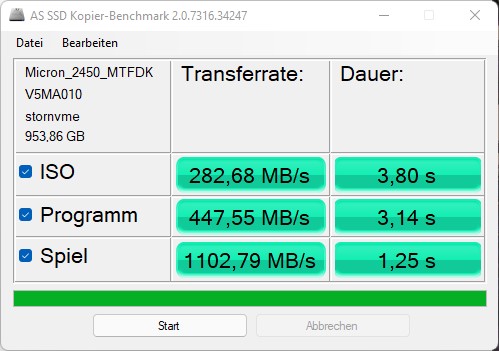
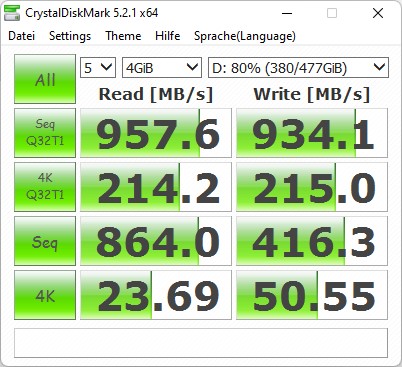
Solução de armazenamento
Embora o Micron 2450 NVMe SSD com 1 TB de armazenamento utilizado aqui seja capaz de alcançar um dos melhores lugares em nosso campo de comparação, ele coloca mais no meio do campo em nosso tabela de SSDs e HDDs. Embora os resultados nos marcos de referência únicos de armazenamento sejam bons, eles não são excelentes.

* ... menor é melhor
Constant Performance Reading: DiskSpd Read Loop, Queue Depth 8
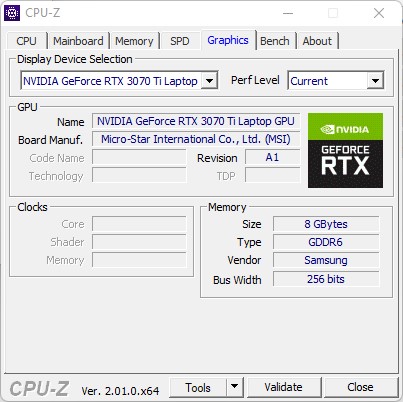
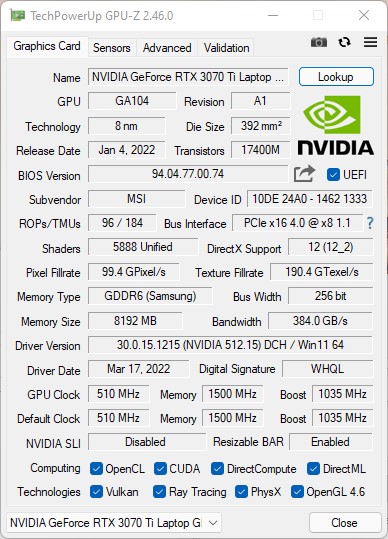
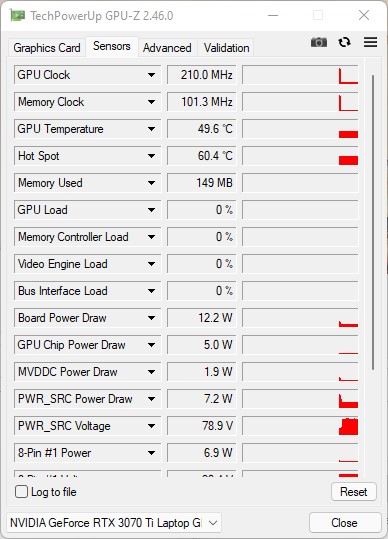
Placa Gráfica
Como uma das mais poderosas placas gráficas para laptop, a Nvidia Geforce RTX 3070 Ti é capaz de atingir altas taxas de quadros em muitos jogos. Entretanto, em nossa unidade de teste, o desempenho da placa gráfica é fortemente limitado, uma vez que o RTX 3070 Ti só funciona a cerca de 90 watts durante um período de tempo mais longo. Isto se torna particularmente claro no benchmark Time Spy, onde o desempenho está cerca de 600 pontos abaixo da média de todos os dispositivos com hardware semelhante. Mas em nossa comparação com os concorrentes do mesmo segmento de preço, o laptop para jogos MSI ainda oferece resultados poderosos.
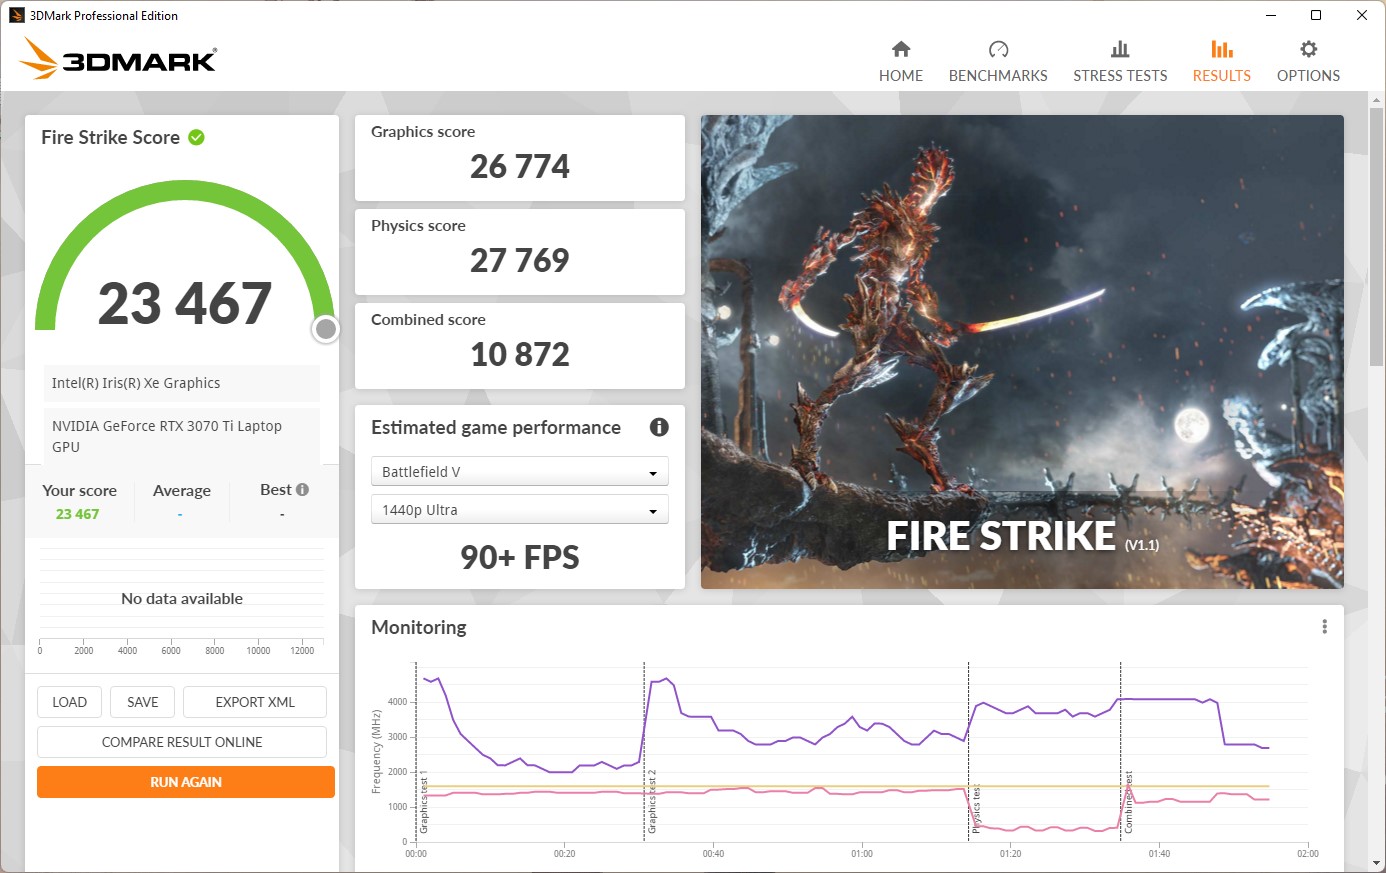
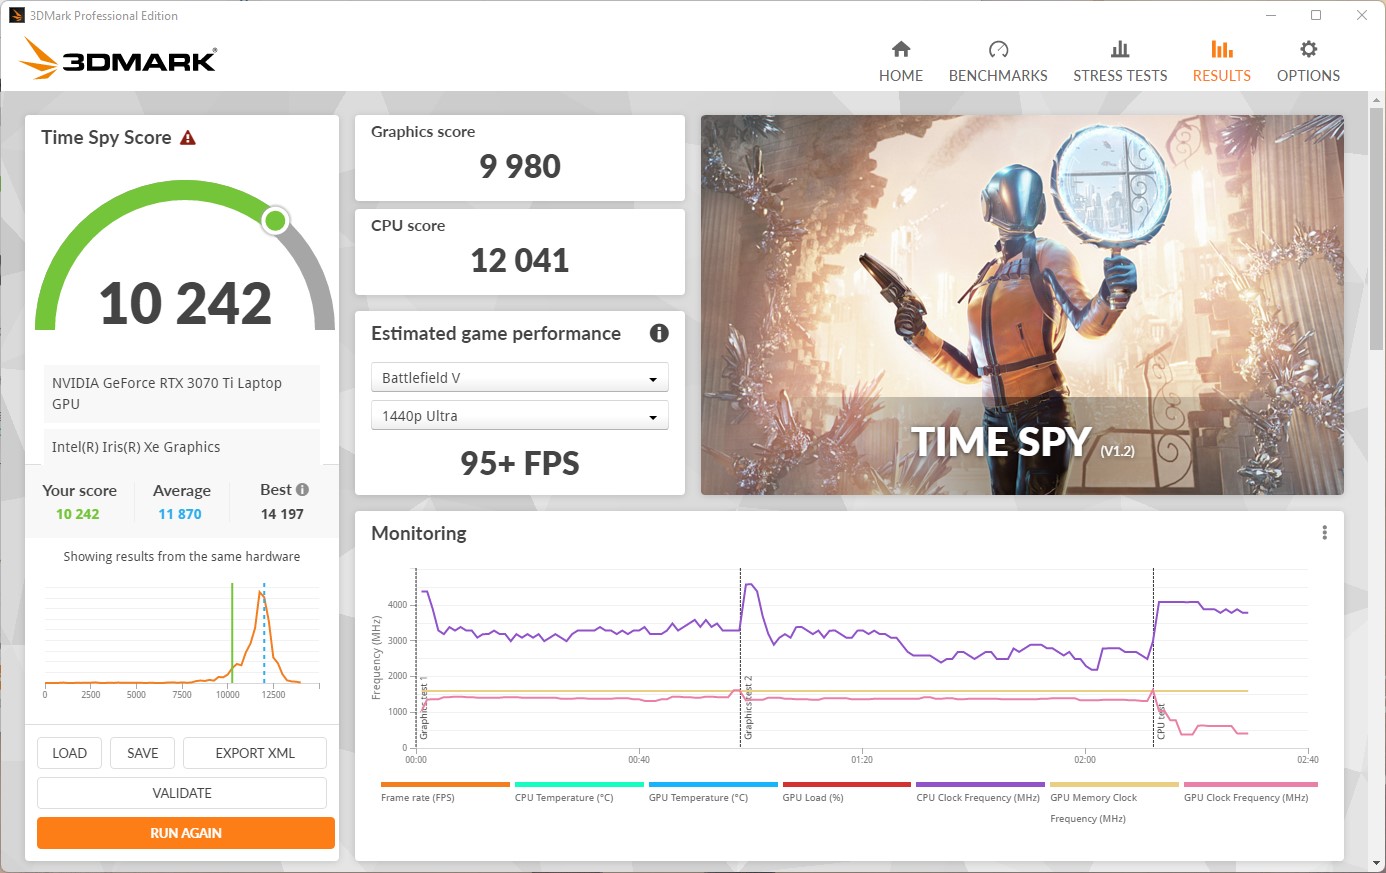
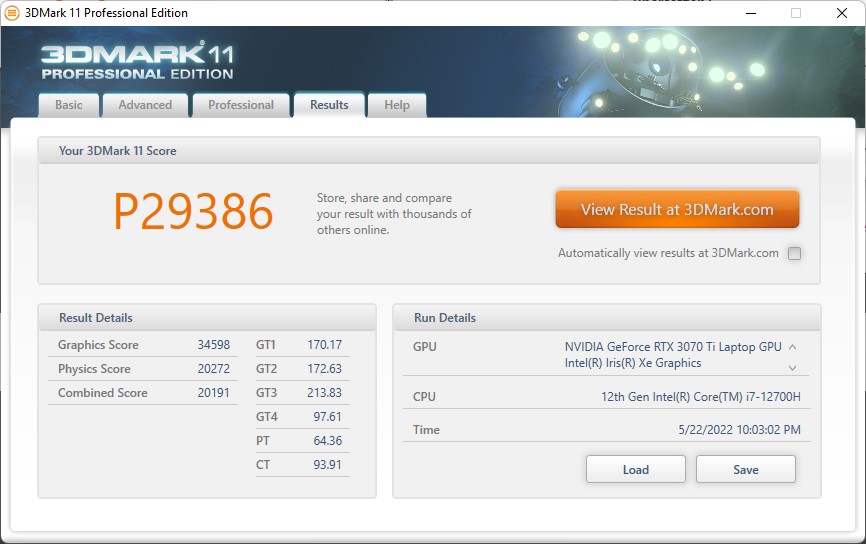
| 3DMark 11 Performance | 29386 pontos | |
| 3DMark Fire Strike Score | 23467 pontos | |
| 3DMark Time Spy Score | 10242 pontos | |
Ajuda | ||
Desempenho nos jogos
O MSI Katana GF66 11UGS é capaz de trazer à tela quase todos os jogos que testamos em todos os níveis de qualidade e resolução Full-HD a mais de 100 FPS. Isto o torna um laptop para jogos muito versátil.
| Far Cry 6 | |
| 1920x1080 High Graphics Quality AA:T | |
| Média da turma Gaming (n=1últimos 2 anos) | |
| Média NVIDIA GeForce RTX 3070 Ti Laptop GPU (89 - 108, n=3) | |
| MSI Katana GF66 12UGS | |
| Lenovo Legion 5 15ACH6A-82NW0010GE | |
| Lenovo Legion 5 15ACH6A-82NW0010GE | |
| 1920x1080 Ultra Graphics Quality + HD Textures AA:T | |
| Média da turma Gaming (n=1últimos 2 anos) | |
| Média NVIDIA GeForce RTX 3070 Ti Laptop GPU (82 - 95.3, n=4) | |
| MSI Katana GF66 12UGS | |
| Lenovo Legion 5 15ACH6A-82NW0010GE | |
| Lenovo Legion 5 15ACH6A-82NW0010GE | |
| Ghostwire Tokyo | |
| 1920x1080 High Settings | |
| Média NVIDIA GeForce RTX 3070 Ti Laptop GPU (123.9 - 152, n=4) | |
| MSI Katana GF66 12UGS | |
| 1920x1080 Highest Settings | |
| Média NVIDIA GeForce RTX 3070 Ti Laptop GPU (115.4 - 145.1, n=4) | |
| MSI Katana GF66 12UGS | |
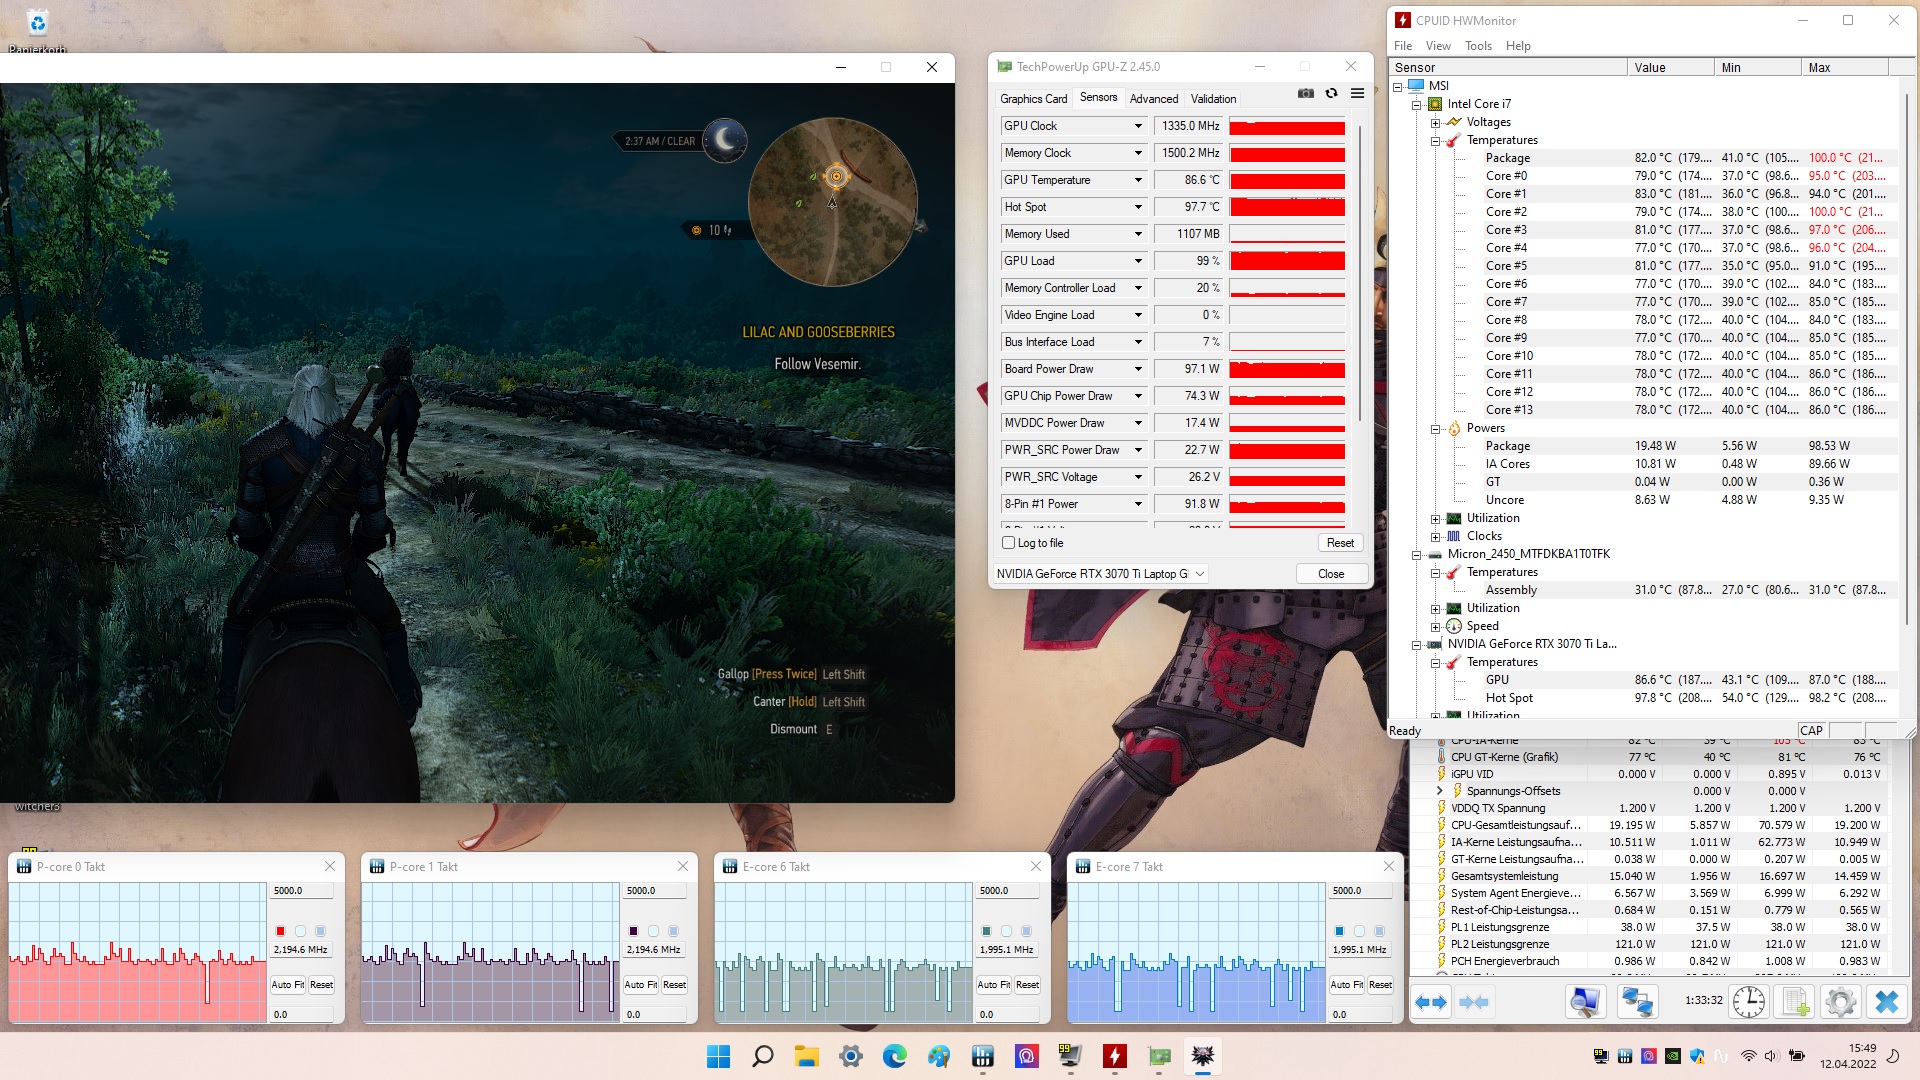
Mesmo que a taxa de quadros caia ligeiramente após algum tempo no teste de carga constante com"The Witcher 3"(FHD/Ultra), ela permanece então bastante constante a um valor relativamente alto de 80 a 90 FPS.
The Witcher 3 FPS Chart
| baixo | média | alto | ultra | QHD | 4K | |
|---|---|---|---|---|---|---|
| GTA V (2015) | 180.7 | 175.2 | 168 | 102.5 | ||
| The Witcher 3 (2015) | 403 | 139.7 | 96.8 | |||
| Dota 2 Reborn (2015) | 180.4 | 165.1 | 148.1 | 138.1 | ||
| Final Fantasy XV Benchmark (2018) | 174.3 | 120.6 | 89.5 | 68.2 | 39.6 | |
| X-Plane 11.11 (2018) | 139 | 126.4 | 102.5 | |||
| Far Cry 5 (2018) | 131 | 124 | 117 | |||
| Strange Brigade (2018) | 435 | 232 | 193.4 | 171.2 | ||
| Far Cry 6 (2021) | 99 | 89 | 82 | |||
| Ghostwire Tokyo (2022) | 127 | 124 | 123.9 | 115.4 |
Emissões - Um portátil de jogo bastante silencioso
Emissões sonoras
No modo AI, o Katana GF66 permanece significativamente mais silencioso do que você esperaria de um laptop para jogos. A um máximo de 45 dB(A), o nível de ruído do laptop não é irritante.
Barulho
| Ocioso |
| 27 / 28 / 31 dB |
| Carga |
| 44 / 45 dB |
 | ||
30 dB silencioso 40 dB(A) audível 50 dB(A) ruidosamente alto |
||
min: | ||
| MSI Katana GF66 12UGS i7-12700H, GeForce RTX 3070 Ti Laptop GPU | MSI Katana GF76 12UGS i7-12700H, GeForce RTX 3070 Ti Laptop GPU | Asus TUF Gaming F15 FX507ZM i7-12700H, GeForce RTX 3060 Laptop GPU | Asus TUF Gaming A15 FA506QR-AZ061T R7 5800H, GeForce RTX 3070 Laptop GPU | Acer Nitro 5 AN515-58-72QR i7-12700H, GeForce RTX 3070 Ti Laptop GPU | Lenovo Legion 5 15ACH6A-82NW0010GE R5 5600H, Radeon RX 6600M | |
|---|---|---|---|---|---|---|
| Noise | -11% | 3% | 1% | -7% | -3% | |
| desligado / ambiente * (dB) | 26 | 23 12% | 23.2 11% | 26 -0% | 26 -0% | 25 4% |
| Idle Minimum * (dB) | 27 | 28.41 -5% | 23.6 13% | 26 4% | 26 4% | 25 7% |
| Idle Average * (dB) | 28 | 28.41 -1% | 23.6 16% | 26 7% | 29 -4% | 25 11% |
| Idle Maximum * (dB) | 31 | 36.71 -18% | 25.4 18% | 27.4 12% | 33 -6% | 34.5 -11% |
| Load Average * (dB) | 44 | 53.04 -21% | 38 14% | 46.6 -6% | 47 -7% | 51.1 -16% |
| Witcher 3 ultra * (dB) | 44 | 54.22 -23% | 54.1 -23% | 53 -20% | ||
| Load Maximum * (dB) | 45 | 54.38 -21% | 57.2 -27% | 49.3 -10% | 53 -18% | 51.3 -14% |
* ... menor é melhor
Temperaturas
Pelo menos, as chaves WASD não atingem as temperaturas mais altas do dispositivo durante o teste de estresse, mesmo que os mais de 50 °C (122 °F) que medimos aqui não sejam muito convidativos para longas sessões de jogo. Por outro lado, as altas temperaturas de superfície são um problema de muitos laptops para jogos. Portanto, também para o MSI Katana GF66, é recomendado o uso de um teclado externo.
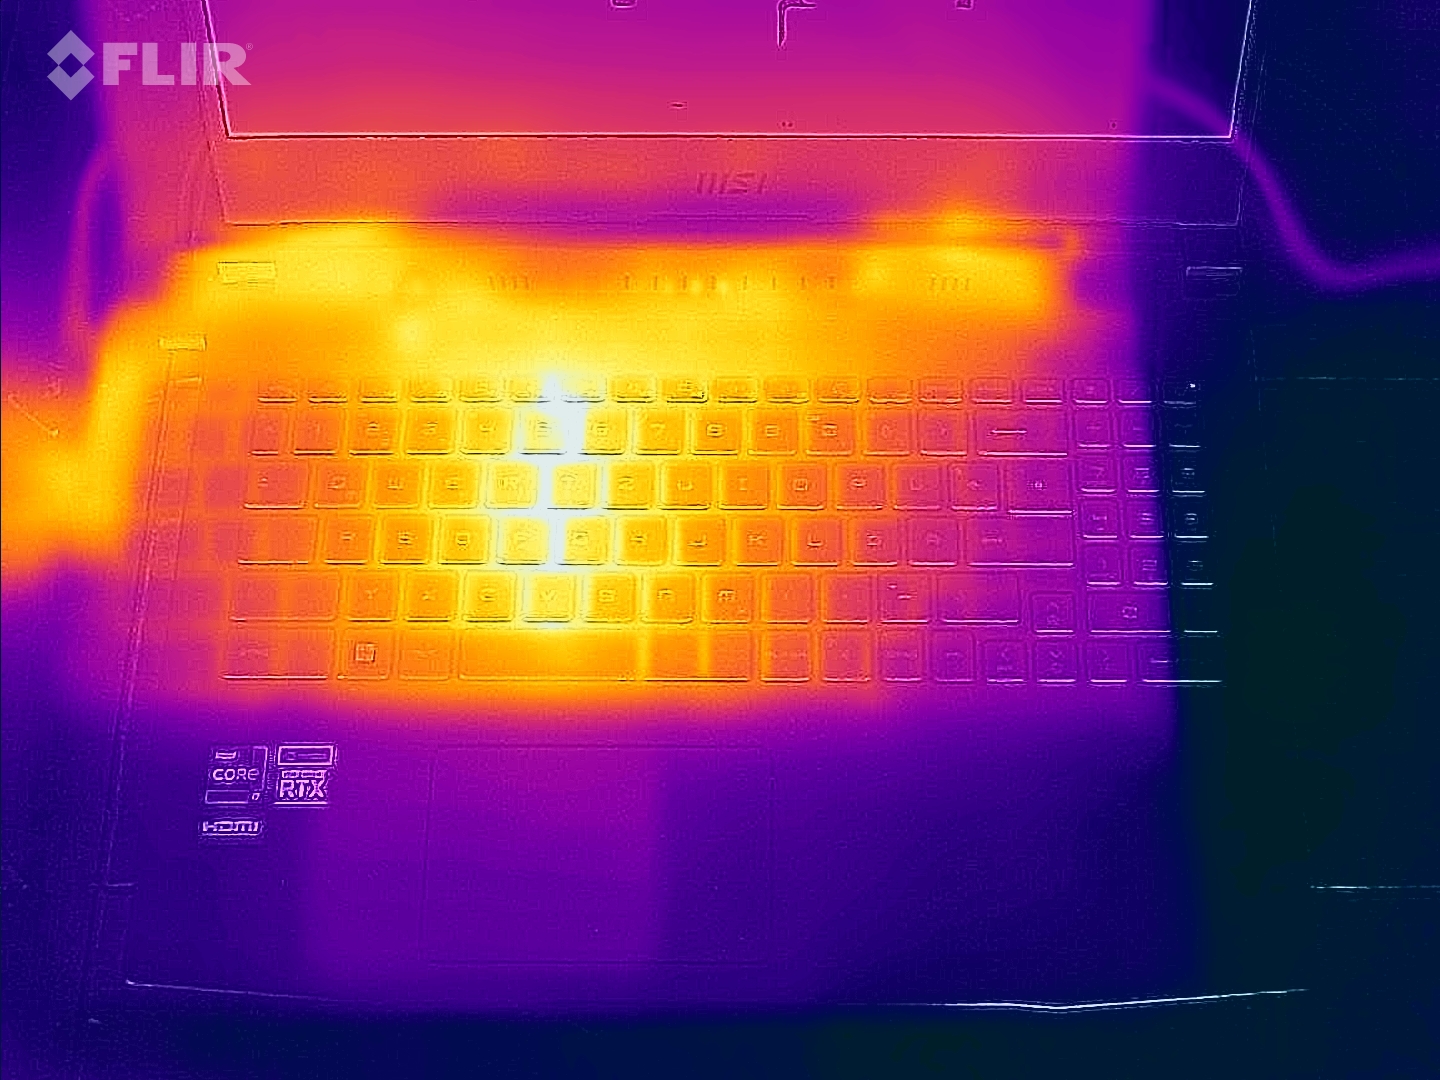
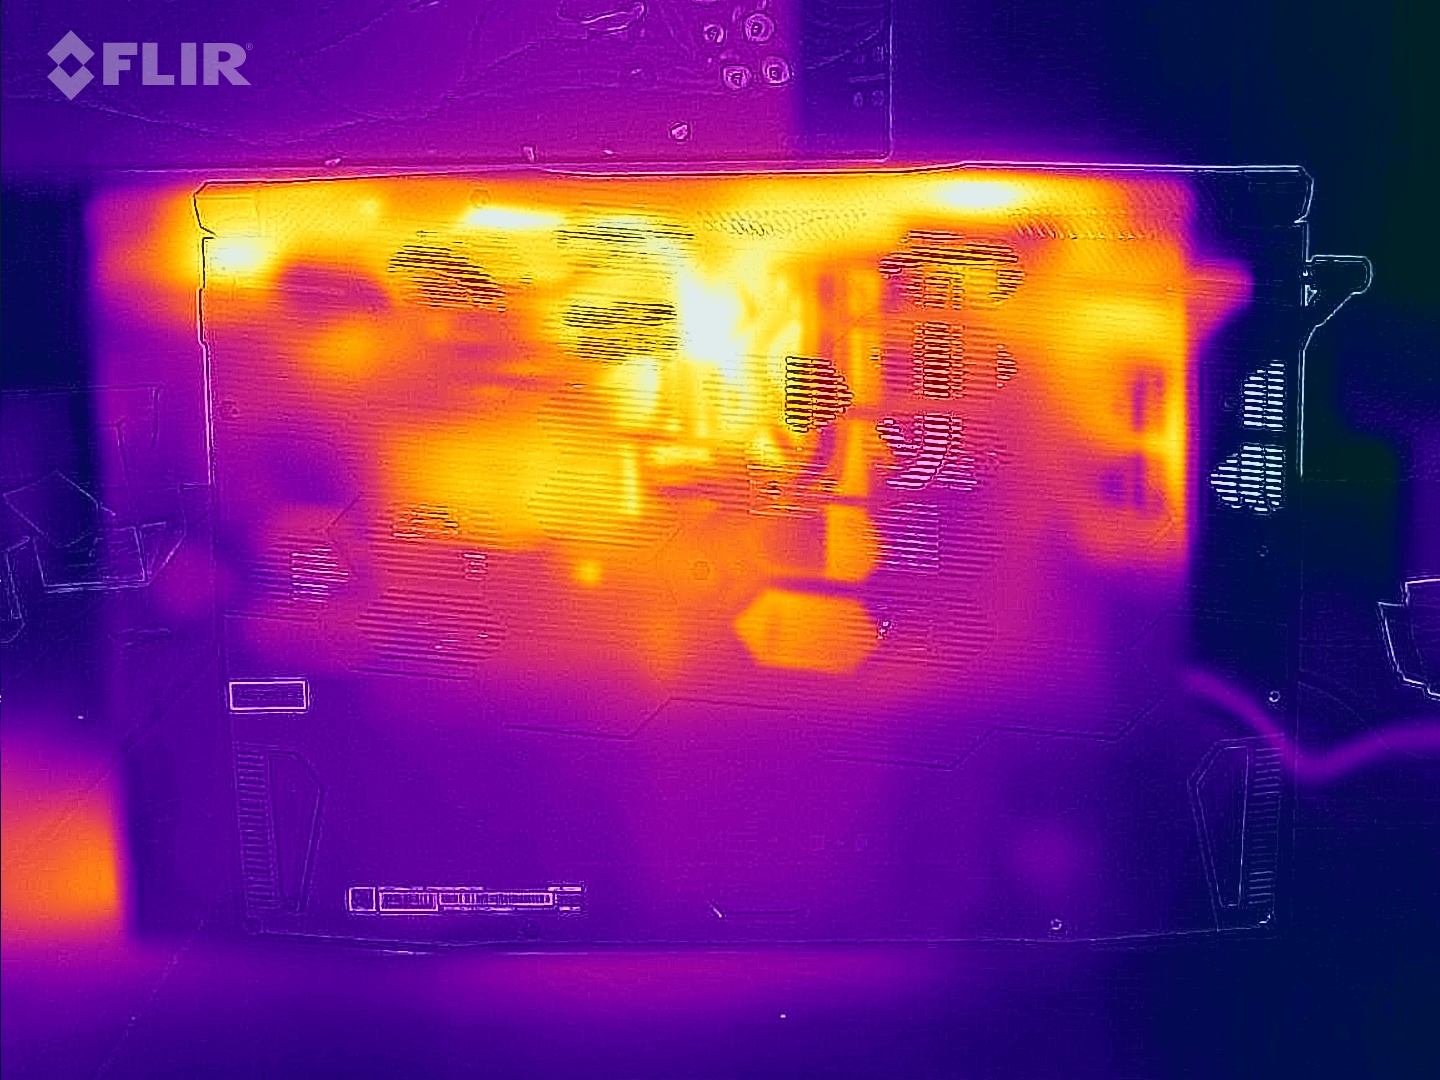
(-) A temperatura máxima no lado superior é 61 °C / 142 F, em comparação com a média de 40.4 °C / 105 F , variando de 21.2 a 68.8 °C para a classe Gaming.
(-) A parte inferior aquece até um máximo de 55 °C / 131 F, em comparação com a média de 43.2 °C / 110 F
(±) Em uso inativo, a temperatura média para o lado superior é 33.9 °C / 93 F, em comparação com a média do dispositivo de 33.9 °C / ### class_avg_f### F.
(-) Jogando The Witcher 3, a temperatura média para o lado superior é 46.8 °C / 116 F, em comparação com a média do dispositivo de 33.9 °C / ## #class_avg_f### F.
(-) Os apoios para as mãos e o touchpad podem ficar muito quentes ao toque, com um máximo de 43 °C / 109.4 F.
(-) A temperatura média da área do apoio para as mãos de dispositivos semelhantes foi 28.8 °C / 83.8 F (-14.2 °C / -25.6 F).
| MSI Katana GF66 12UGS i7-12700H, GeForce RTX 3070 Ti Laptop GPU | MSI Katana GF66 11UG-220 i7-11800H, GeForce RTX 3070 Laptop GPU | MSI Katana GF76 12UGS i7-12700H, GeForce RTX 3070 Ti Laptop GPU | Asus TUF Gaming F15 FX507ZM i7-12700H, GeForce RTX 3060 Laptop GPU | Asus TUF Gaming A15 FA506QR-AZ061T R7 5800H, GeForce RTX 3070 Laptop GPU | Acer Nitro 5 AN515-58-72QR i7-12700H, GeForce RTX 3070 Ti Laptop GPU | Lenovo Legion 5 15ACH6A-82NW0010GE R5 5600H, Radeon RX 6600M | |
|---|---|---|---|---|---|---|---|
| Heat | 15% | 8% | 12% | 9% | 16% | 23% | |
| Maximum Upper Side * (°C) | 61 | 56 8% | 51 16% | 44.4 27% | 46.7 23% | 48 21% | 39.9 35% |
| Maximum Bottom * (°C) | 55 | 49 11% | 55 -0% | 48.8 11% | 55.9 -2% | 51 7% | 43.8 20% |
| Idle Upper Side * (°C) | 43 | 36 16% | 37 14% | 37.8 12% | 37.1 14% | 34 21% | 34.1 21% |
| Idle Bottom * (°C) | 38 | 28 26% | 38 -0% | 39.6 -4% | 38.1 -0% | 33 13% | 31.7 17% |
* ... menor é melhor
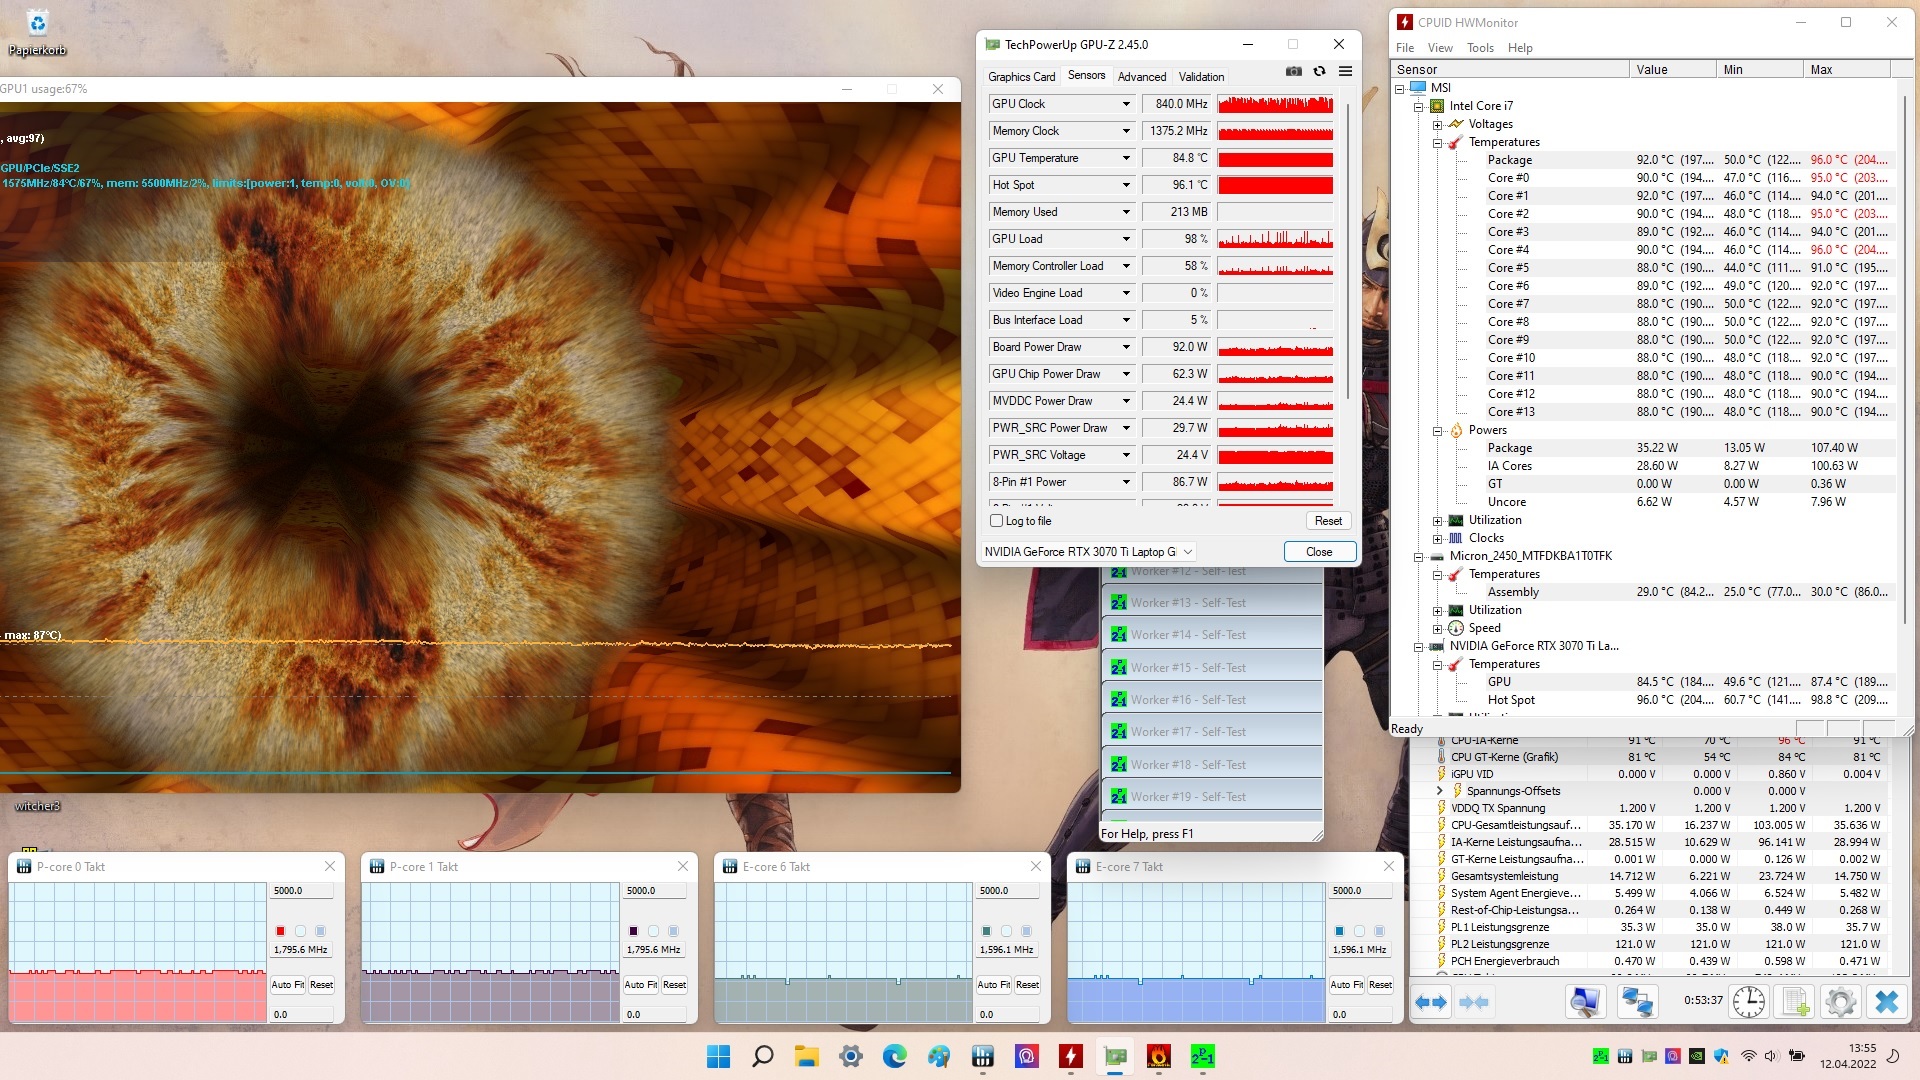
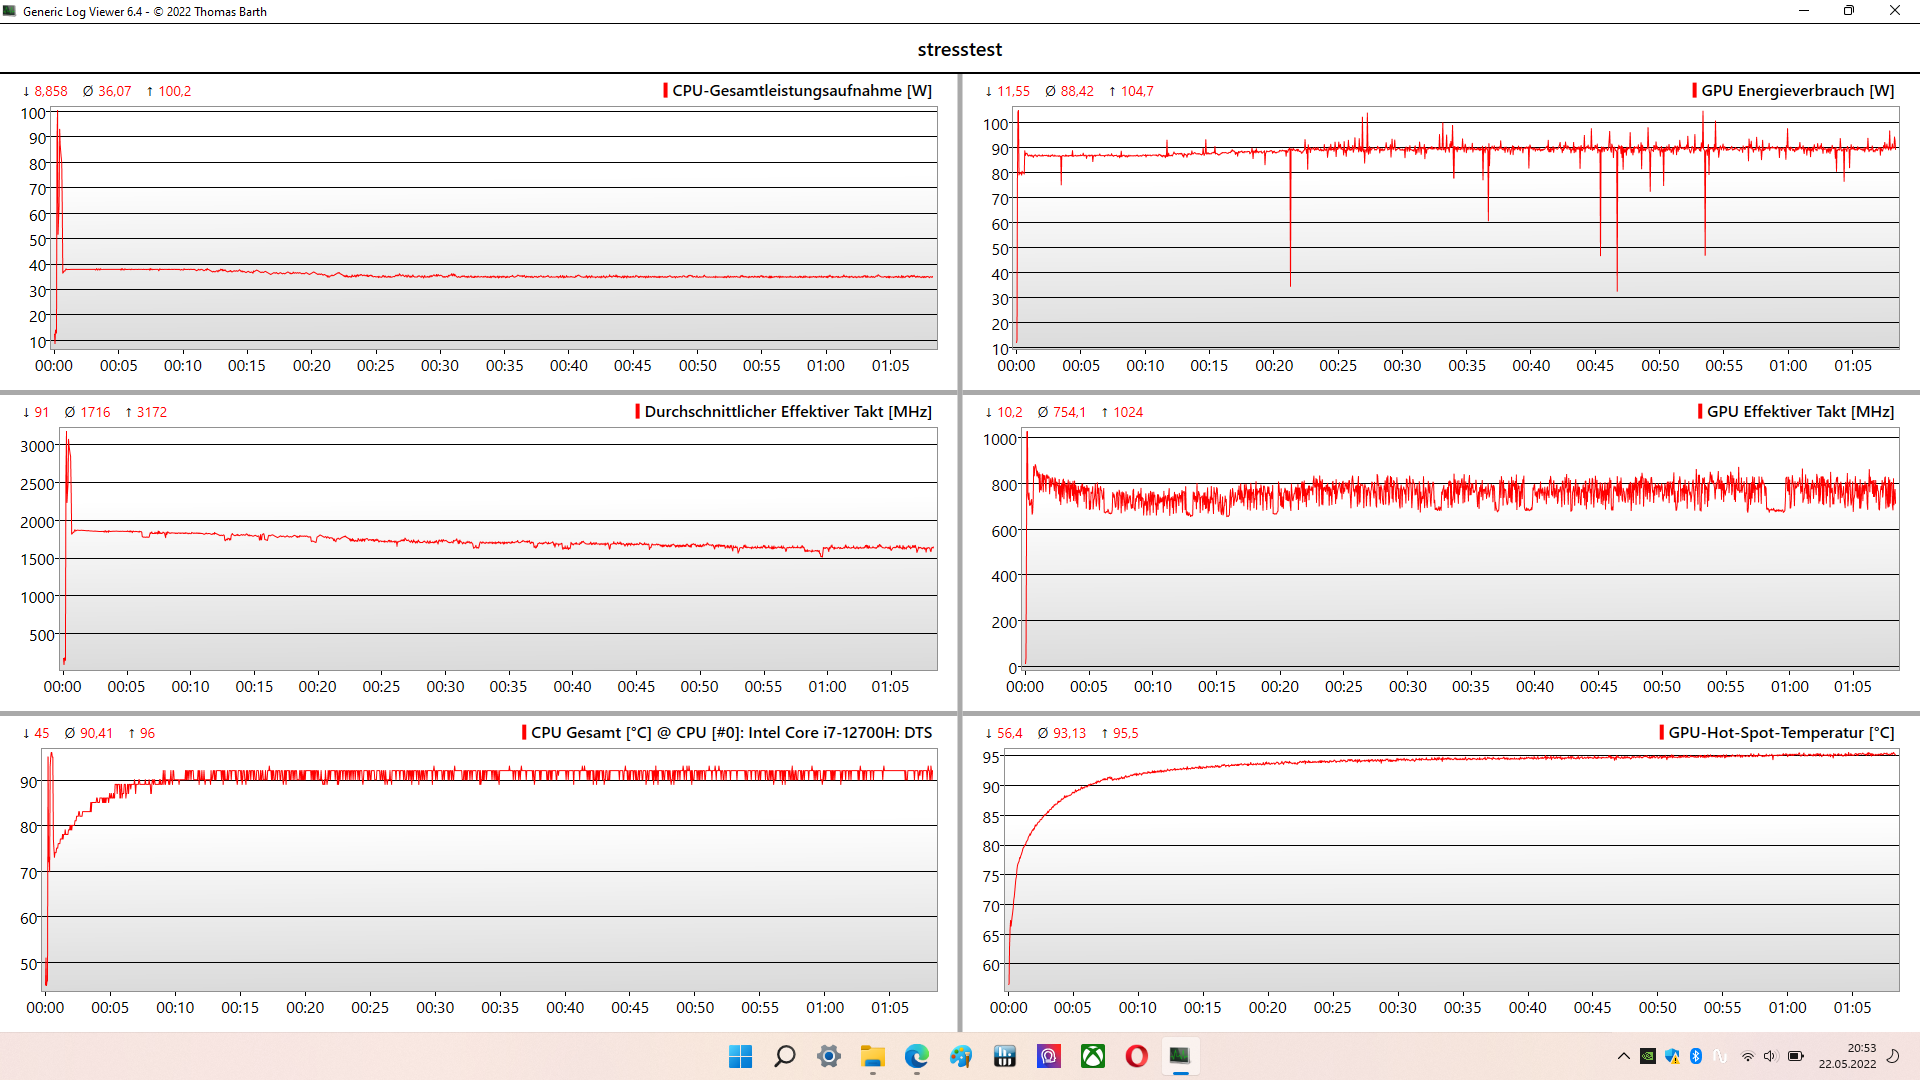
Teste de estresse
Durante um período de tempo mais longo, o consumo da CPU durante o teste de estresse é de 33 watts, enquanto nos primeiros 10 minutos do teste de estresse, ela ainda é capaz de usar 45 watts. Entretanto, a CPU e a GPU simplesmente alternam um pouco do consumo comum compartilhado, que fica em torno de 120 watts. Não notamos nenhum problema significativo nas temperaturas de ambos os chips. A 90 e 95 °C respectivamente (194 e 203 °F), ambos caem em uma faixa alta mas ainda não crítica e podem ser mantidos de forma estável.
Oradores
Um alto volume máximo e uma boa reprodução geral de música e voz garantem uma imagem sonora sólida. Podemos perdoar a leve fraqueza no baixo do laptop. Uma redução no volume garante um som mais equilibrado.
MSI Katana GF66 12UGS análise de áudio
(±) | o volume do alto-falante é médio, mas bom (###valor### dB)
Graves 100 - 315Hz
(-) | quase nenhum baixo - em média 17.3% menor que a mediana
(±) | a linearidade dos graves é média (9.9% delta para a frequência anterior)
Médios 400 - 2.000 Hz
(±) | médios mais altos - em média 6.8% maior que a mediana
(±) | a linearidade dos médios é média (8.3% delta para frequência anterior)
Altos 2 - 16 kHz
(+) | agudos equilibrados - apenas 1.1% longe da mediana
(+) | os máximos são lineares (4.2% delta da frequência anterior)
Geral 100 - 16.000 Hz
(±) | a linearidade do som geral é média (16.5% diferença em relação à mediana)
Comparado com a mesma classe
» 42% de todos os dispositivos testados nesta classe foram melhores, 7% semelhantes, 51% piores
» O melhor teve um delta de 6%, a média foi 18%, o pior foi 132%
Comparado com todos os dispositivos testados
» 28% de todos os dispositivos testados foram melhores, 6% semelhantes, 66% piores
» O melhor teve um delta de 4%, a média foi 23%, o pior foi 134%
Apple MacBook Pro 16 2021 M1 Pro análise de áudio
(+) | os alto-falantes podem tocar relativamente alto (###valor### dB)
Graves 100 - 315Hz
(+) | bons graves - apenas 3.8% longe da mediana
(+) | o baixo é linear (5.2% delta para a frequência anterior)
Médios 400 - 2.000 Hz
(+) | médios equilibrados - apenas 1.3% longe da mediana
(+) | médios são lineares (2.1% delta para frequência anterior)
Altos 2 - 16 kHz
(+) | agudos equilibrados - apenas 1.9% longe da mediana
(+) | os máximos são lineares (2.7% delta da frequência anterior)
Geral 100 - 16.000 Hz
(+) | o som geral é linear (4.6% diferença em relação à mediana)
Comparado com a mesma classe
» 0% de todos os dispositivos testados nesta classe foram melhores, 0% semelhantes, 100% piores
» O melhor teve um delta de 5%, a média foi 17%, o pior foi 45%
Comparado com todos os dispositivos testados
» 0% de todos os dispositivos testados foram melhores, 0% semelhantes, 100% piores
» O melhor teve um delta de 4%, a média foi 23%, o pior foi 134%
Gerenciamento de energia - Uma bateria com pouca vida útil
Consumo de energia
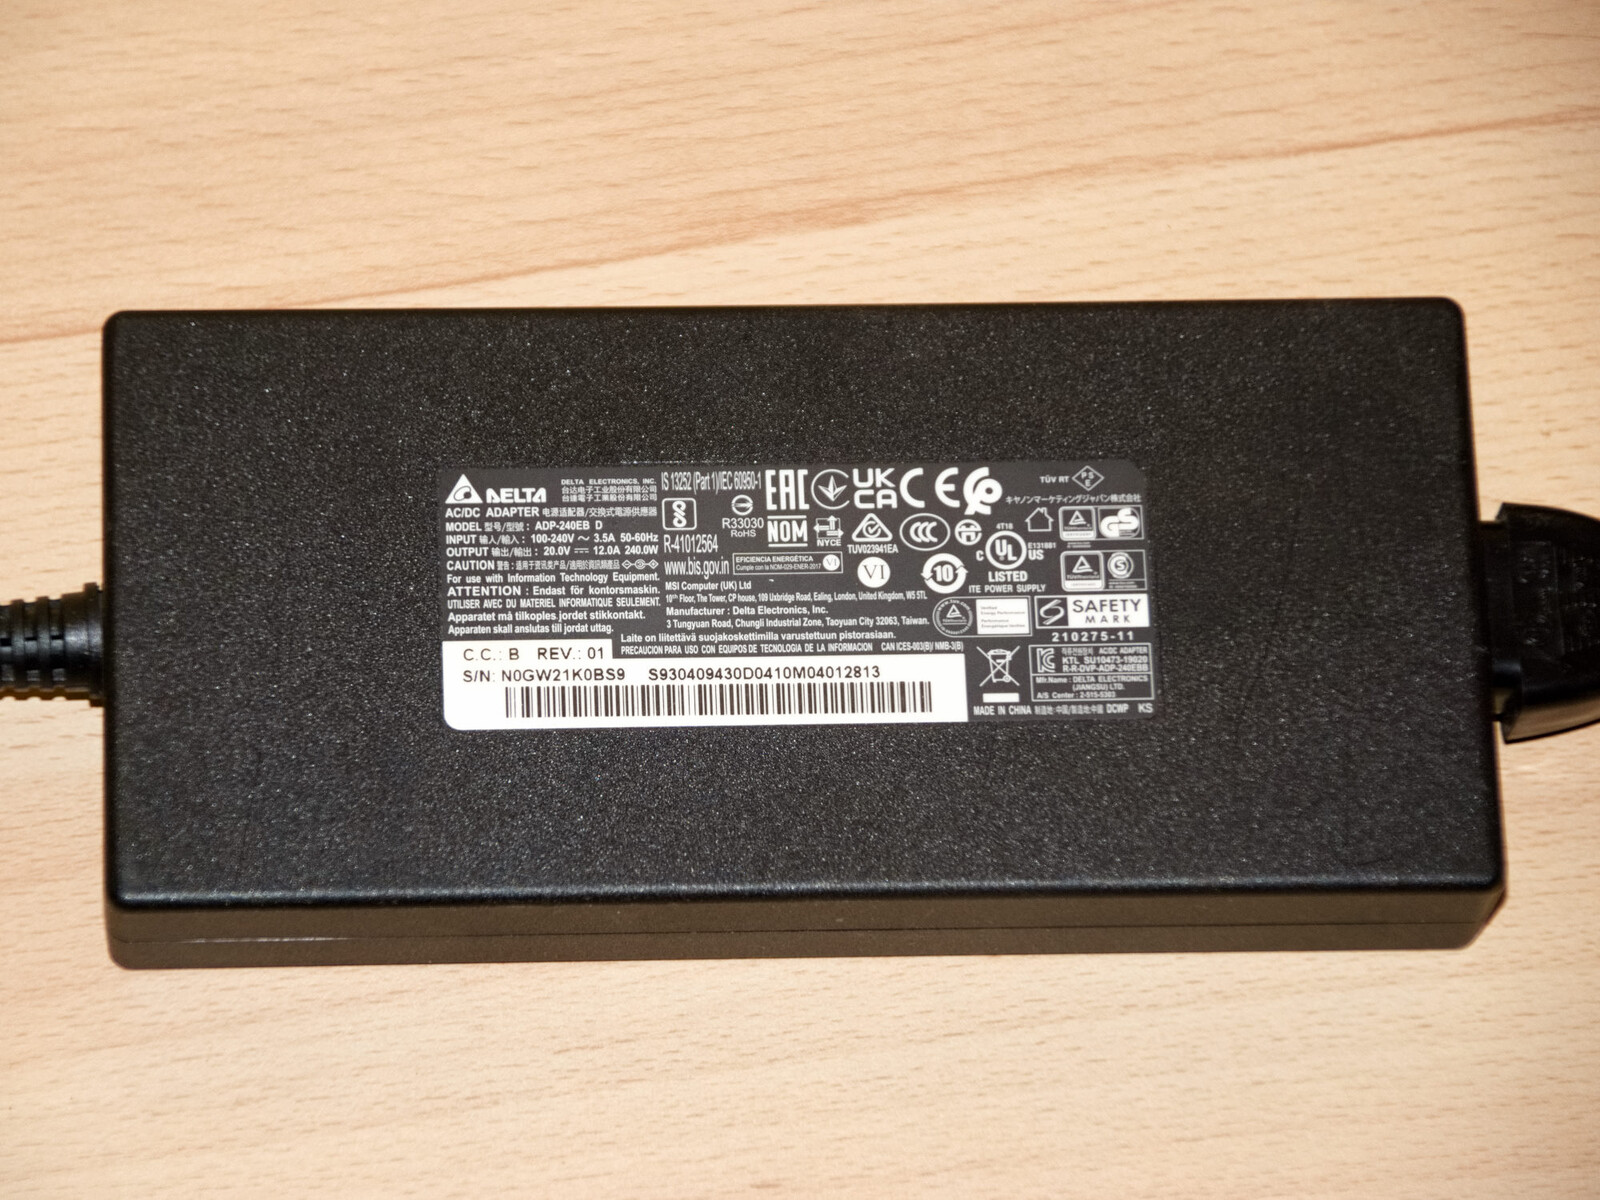
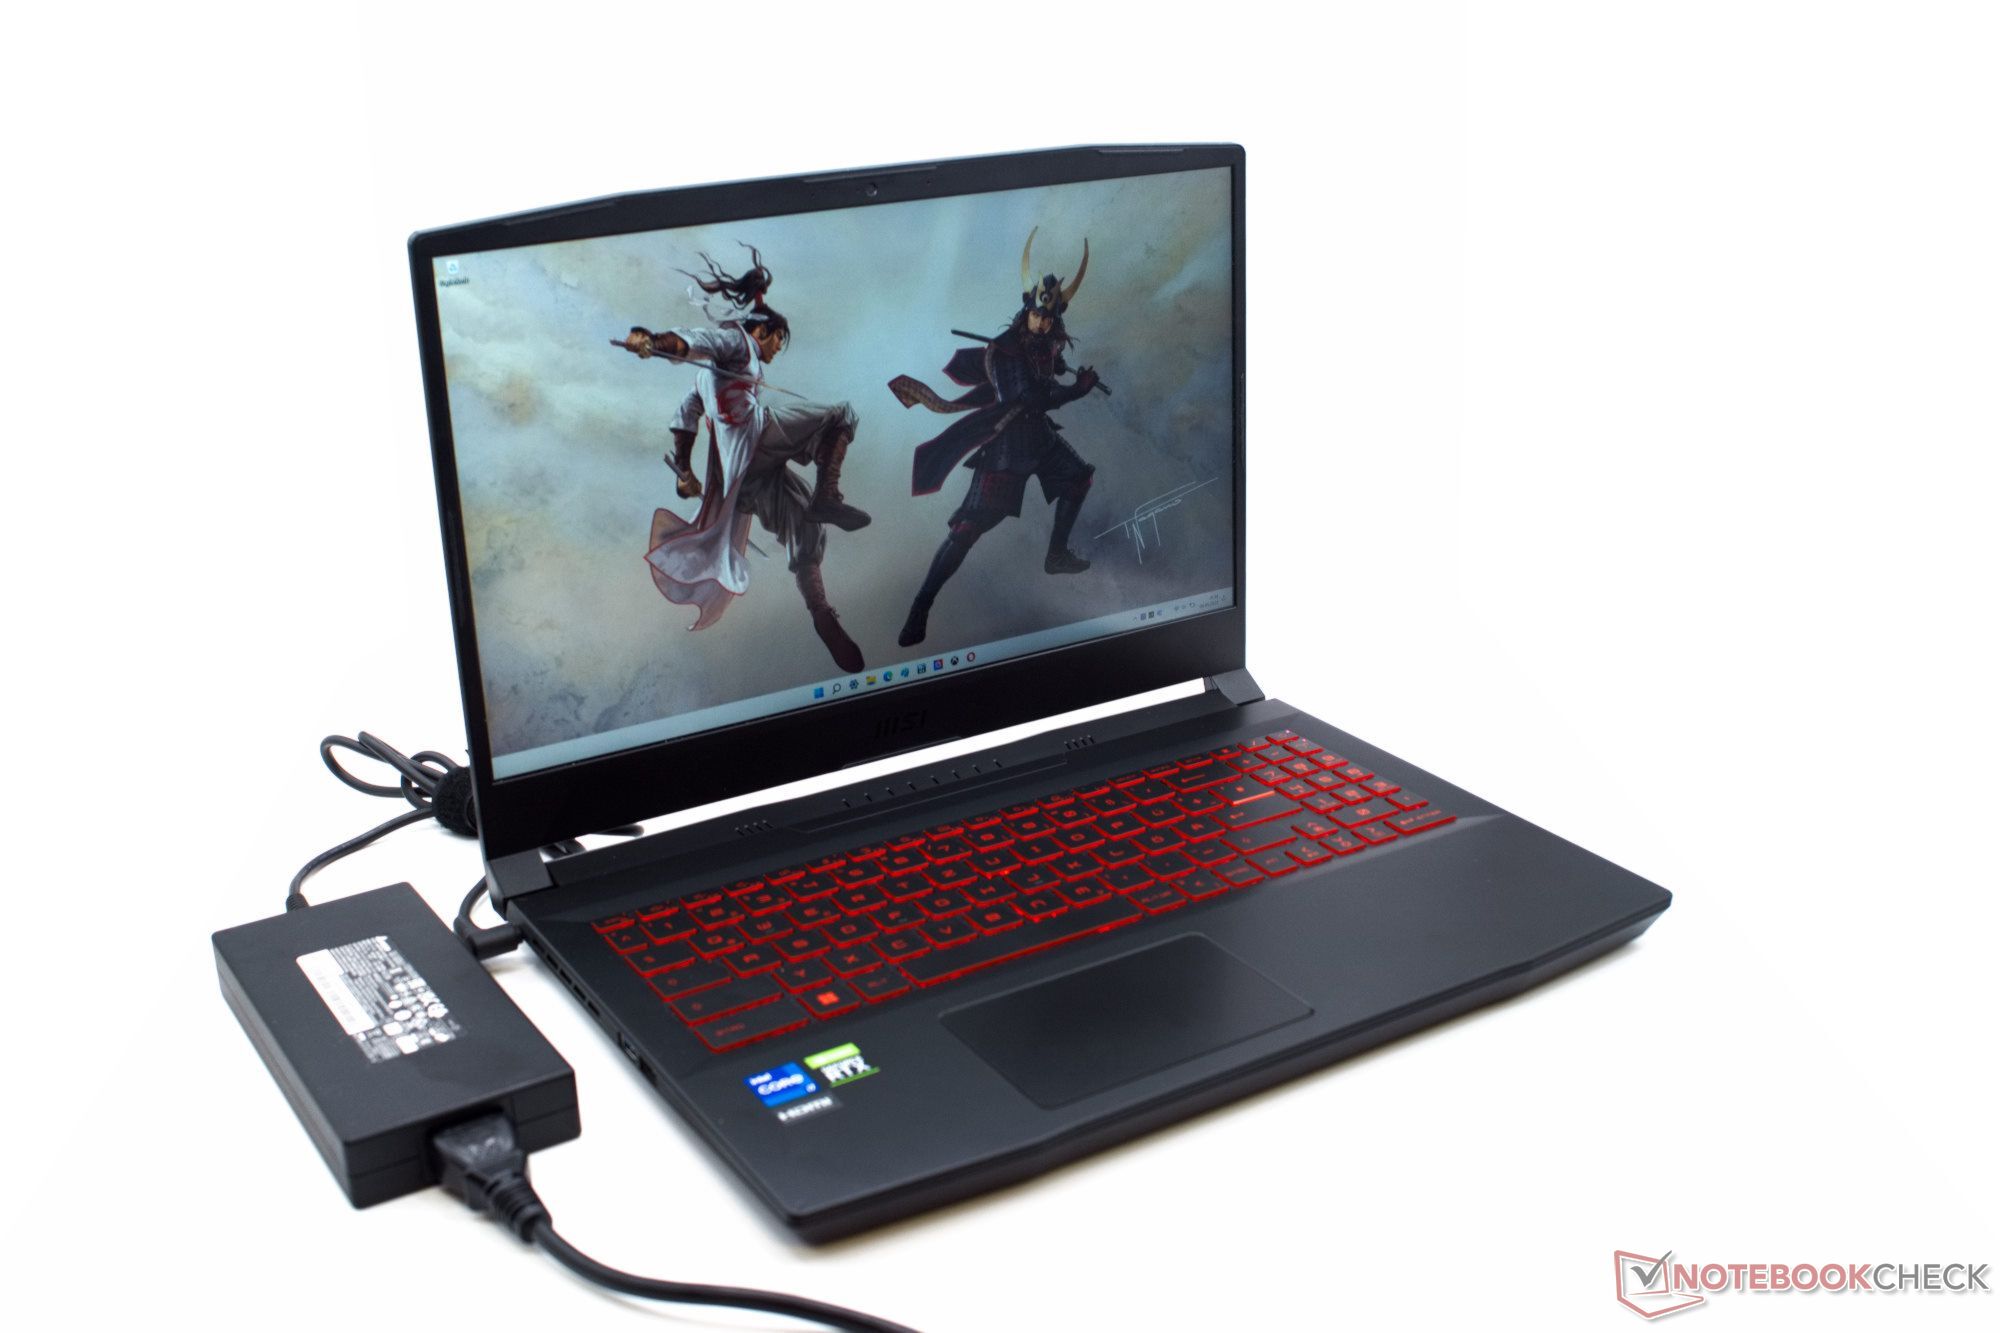
Embora a fonte de alimentação ainda estivesse bem dimensionada no predecessor, a MSI aumentou significativamente este tamanho aqui e incluiu uma fonte de alimentação com um desempenho apropriado de 240 watts. Isto significa que o laptop para jogos não atingirá os limites da fonte de energia mesmo sob carga máxima
Em termos de consumo de energia, o laptop está em um nível que está abaixo da média dos laptops para jogos.
| desligado | |
| Ocioso | |
| Carga |
|
Key:
min: | |
| MSI Katana GF66 12UGS i7-12700H, GeForce RTX 3070 Ti Laptop GPU | MSI Katana GF76 12UGS i7-12700H, GeForce RTX 3070 Ti Laptop GPU | Asus TUF Gaming F15 FX507ZM i7-12700H, GeForce RTX 3060 Laptop GPU | Asus TUF Gaming A15 FA506QR-AZ061T R7 5800H, GeForce RTX 3070 Laptop GPU | Acer Nitro 5 AN515-58-72QR i7-12700H, GeForce RTX 3070 Ti Laptop GPU | Lenovo Legion 5 15ACH6A-82NW0010GE R5 5600H, Radeon RX 6600M | Média da turma Gaming | |
|---|---|---|---|---|---|---|---|
| Power Consumption | -19% | -4% | 1% | -12% | -13% | -29% | |
| Idle Minimum * (Watt) | 9 | 14.2 -58% | 6.3 30% | 10.2 -13% | 7 22% | 10 -11% | 13 ? -44% |
| Idle Average * (Watt) | 13 | 18 -38% | 9.8 25% | 12.8 2% | 15 -15% | 13.2 -2% | 19 ? -46% |
| Idle Maximum * (Watt) | 20 | 22 -10% | 26.5 -33% | 15 25% | 24 -20% | 15.6 22% | 24.6 ? -23% |
| Load Average * (Watt) | 100 | 98 2% | 103.8 -4% | 130 -30% | 124 -24% | 178 -78% | 110.7 ? -11% |
| Witcher 3 ultra * (Watt) | 149 | 159 -7% | 189 -27% | 137 8% | 195.1 -31% | 181 -21% | |
| Load Maximum * (Watt) | 212 | 219 -3% | 241.9 -14% | 184 13% | 220 -4% | 180 15% | 259 ? -22% |
* ... menor é melhor
Power Consumption The Witcher 3 / Stress Test
{
Vida útil da bateria
Por outro lado, o MSI Katana GF66 12UGS também não é realmente eficiente. Portanto, não é surpreendente que o laptop para jogos ofereça apenas uma bateria de curta duração. Entretanto, a duração da bateria ainda permanece dentro de uma faixa que é normal para os concorrentes dos laptops para jogos.
| MSI Katana GF66 12UGS i7-12700H, GeForce RTX 3070 Ti Laptop GPU, 52 Wh | MSI Katana GF76 12UGS i7-12700H, GeForce RTX 3070 Ti Laptop GPU, 53.5 Wh | Asus TUF Gaming F15 FX507ZM i7-12700H, GeForce RTX 3060 Laptop GPU, 90 Wh | Asus TUF Gaming A15 FA506QR-AZ061T R7 5800H, GeForce RTX 3070 Laptop GPU, 90 Wh | Acer Nitro 5 AN515-58-72QR i7-12700H, GeForce RTX 3070 Ti Laptop GPU, 57.5 Wh | Lenovo Legion 5 15ACH6A-82NW0010GE R5 5600H, Radeon RX 6600M, 80 Wh | Média da turma Gaming | |
|---|---|---|---|---|---|---|---|
| Duração da bateria | 34% | 40% | 223% | 25% | 163% | 102% | |
| Reader / Idle (h) | 15.8 | 17.4 | 5.7 | 12.8 | 8.27 ? | ||
| WiFi v1.3 (h) | 2.4 | 3.7 54% | 4.8 100% | 11.4 375% | 3.9 63% | 9.2 283% | 7.11 ? 196% |
| Load (h) | 1.4 | 1.6 14% | 1.1 -21% | 2.4 71% | 1.2 -14% | 2 43% | 1.502 ? 7% |
| H.264 (h) | 3.3 | 4.7 | 8.32 ? |
Pro
Contra
Veredicto

A MSI fez melhorias em muitas áreas no Katana GF66, mostrando, mesmo sem valores máximos nos limites configurados do TDP, que os jogos também podem ser feitos a preços relativamente acessíveis. Entretanto, o Nvidia RTX 3070 Ti e o Intel Core i7-12700H ainda são um pouco ilusórios. Este é outro caso em que teríamos realmente gostado de ter especificações mais claras sobre o TDP do fabricante. Mas o verdadeiro problema para os jogadores exigentes é a má exibição. Com seus tempos de resposta lentos e má reprodução de cores, o display não é realmente 100% adequado para jogos.
O MSI Katana GF66 12UGS é um laptop com uma relação preço-desempenho equilibrada, proporcionando uma entrada bastante acessível na classe superior de jogos móveis.
Embora a "espada de plástico" não consiga brilhar com o melhor equipamento, ela é basicamente sólida. Aqueles que não têm exigências muito altas sobre um laptop para jogos encontrarão um bom companheiro neste dispositivo. Apesar do TGP/TDP ligeiramente limitado, a placa gráfica e o processador são muito poderosos, permitindo que o Katana GF66 12UGS cumpra sua tarefa principal como um laptop para jogos.
Preço e Disponibilidade
O MSI Katana GF66 está disponível em muitas configurações nos EUA, a maioria delas ainda com processadores da 11ª geração. Uma configuração com um processador da 12ª geração i7 e o RTX 3050 Ti está atualmente disponível em Amazon por $1150 e com um processador i5 por $1130. Uma configuração superior do GF76 está disponível na Amazon, por exemplo, por $1960.
MSI Katana GF66 12UGS
- 05/31/2022 v7 (old)
Marc Herter
Price comparison

