Asus TUF Gaming A15 com Ryzen 7 em revisão: Ingresso no laptop para jogos com CPU AMD

Com o site Asus TUF Gaming F15, já pudemos testar uma versão quase idêntica de nosso dispositivo de teste com uma CPU Intel. Agora temos a versão AMD com umRyzen 7 5800Hna forma do Asus TUF Gaming A15, que é suportado por 16 GB de RAM. UmNvidia GeForce RTX 3070é responsável
pela exibição do conteúdo da imagem, e um SSD de 1 TB também está disponível.Esta configuração é oferecida a um preço de aproximadamente 1.700 Euros (~$2.008), o que significa que a TUF Gaming A15 tem que enfrentar a comparação com a concorrência listada abaixo. Você também pode adicionar mais laptops de nosso banco de dados para comparação sob cada seção.
Possible contenders in comparison
Avaliação | Data | Modelo | Peso | Altura | Size | Resolução | Preço |
|---|---|---|---|---|---|---|---|
| 85 % v7 (old) | 07/2021 | Asus TUF Gaming A15 FA506QR-AZ061T R7 5800H, GeForce RTX 3070 Laptop GPU | 2.3 kg | 24 mm | 15.60" | 1920x1080 | |
| 85.9 % v7 (old) | 06/2021 | Asus TUF Gaming F15 FX506HM i7-11800H, GeForce RTX 3060 Laptop GPU | 2.3 kg | 24.9 mm | 15.60" | 1920x1080 | |
| 84.7 % v7 (old) | 06/2021 | Alienware m15 R5 Ryzen Edition R7 5800H, GeForce RTX 3060 Laptop GPU | 2.5 kg | 22.85 mm | 15.60" | 1920x1080 | |
| 86.1 % v7 (old) | 02/2021 | Aorus 15P XC i7-10870H, GeForce RTX 3070 Laptop GPU | 2.2 kg | 27 mm | 15.60" | 1920x1080 | |
| 80.4 % v7 (old) | 03/2021 | MSI GF65 Thin 10UE i7-10750H, GeForce RTX 3060 Laptop GPU | 1.9 kg | 21.7 mm | 15.60" | 1920x1080 |
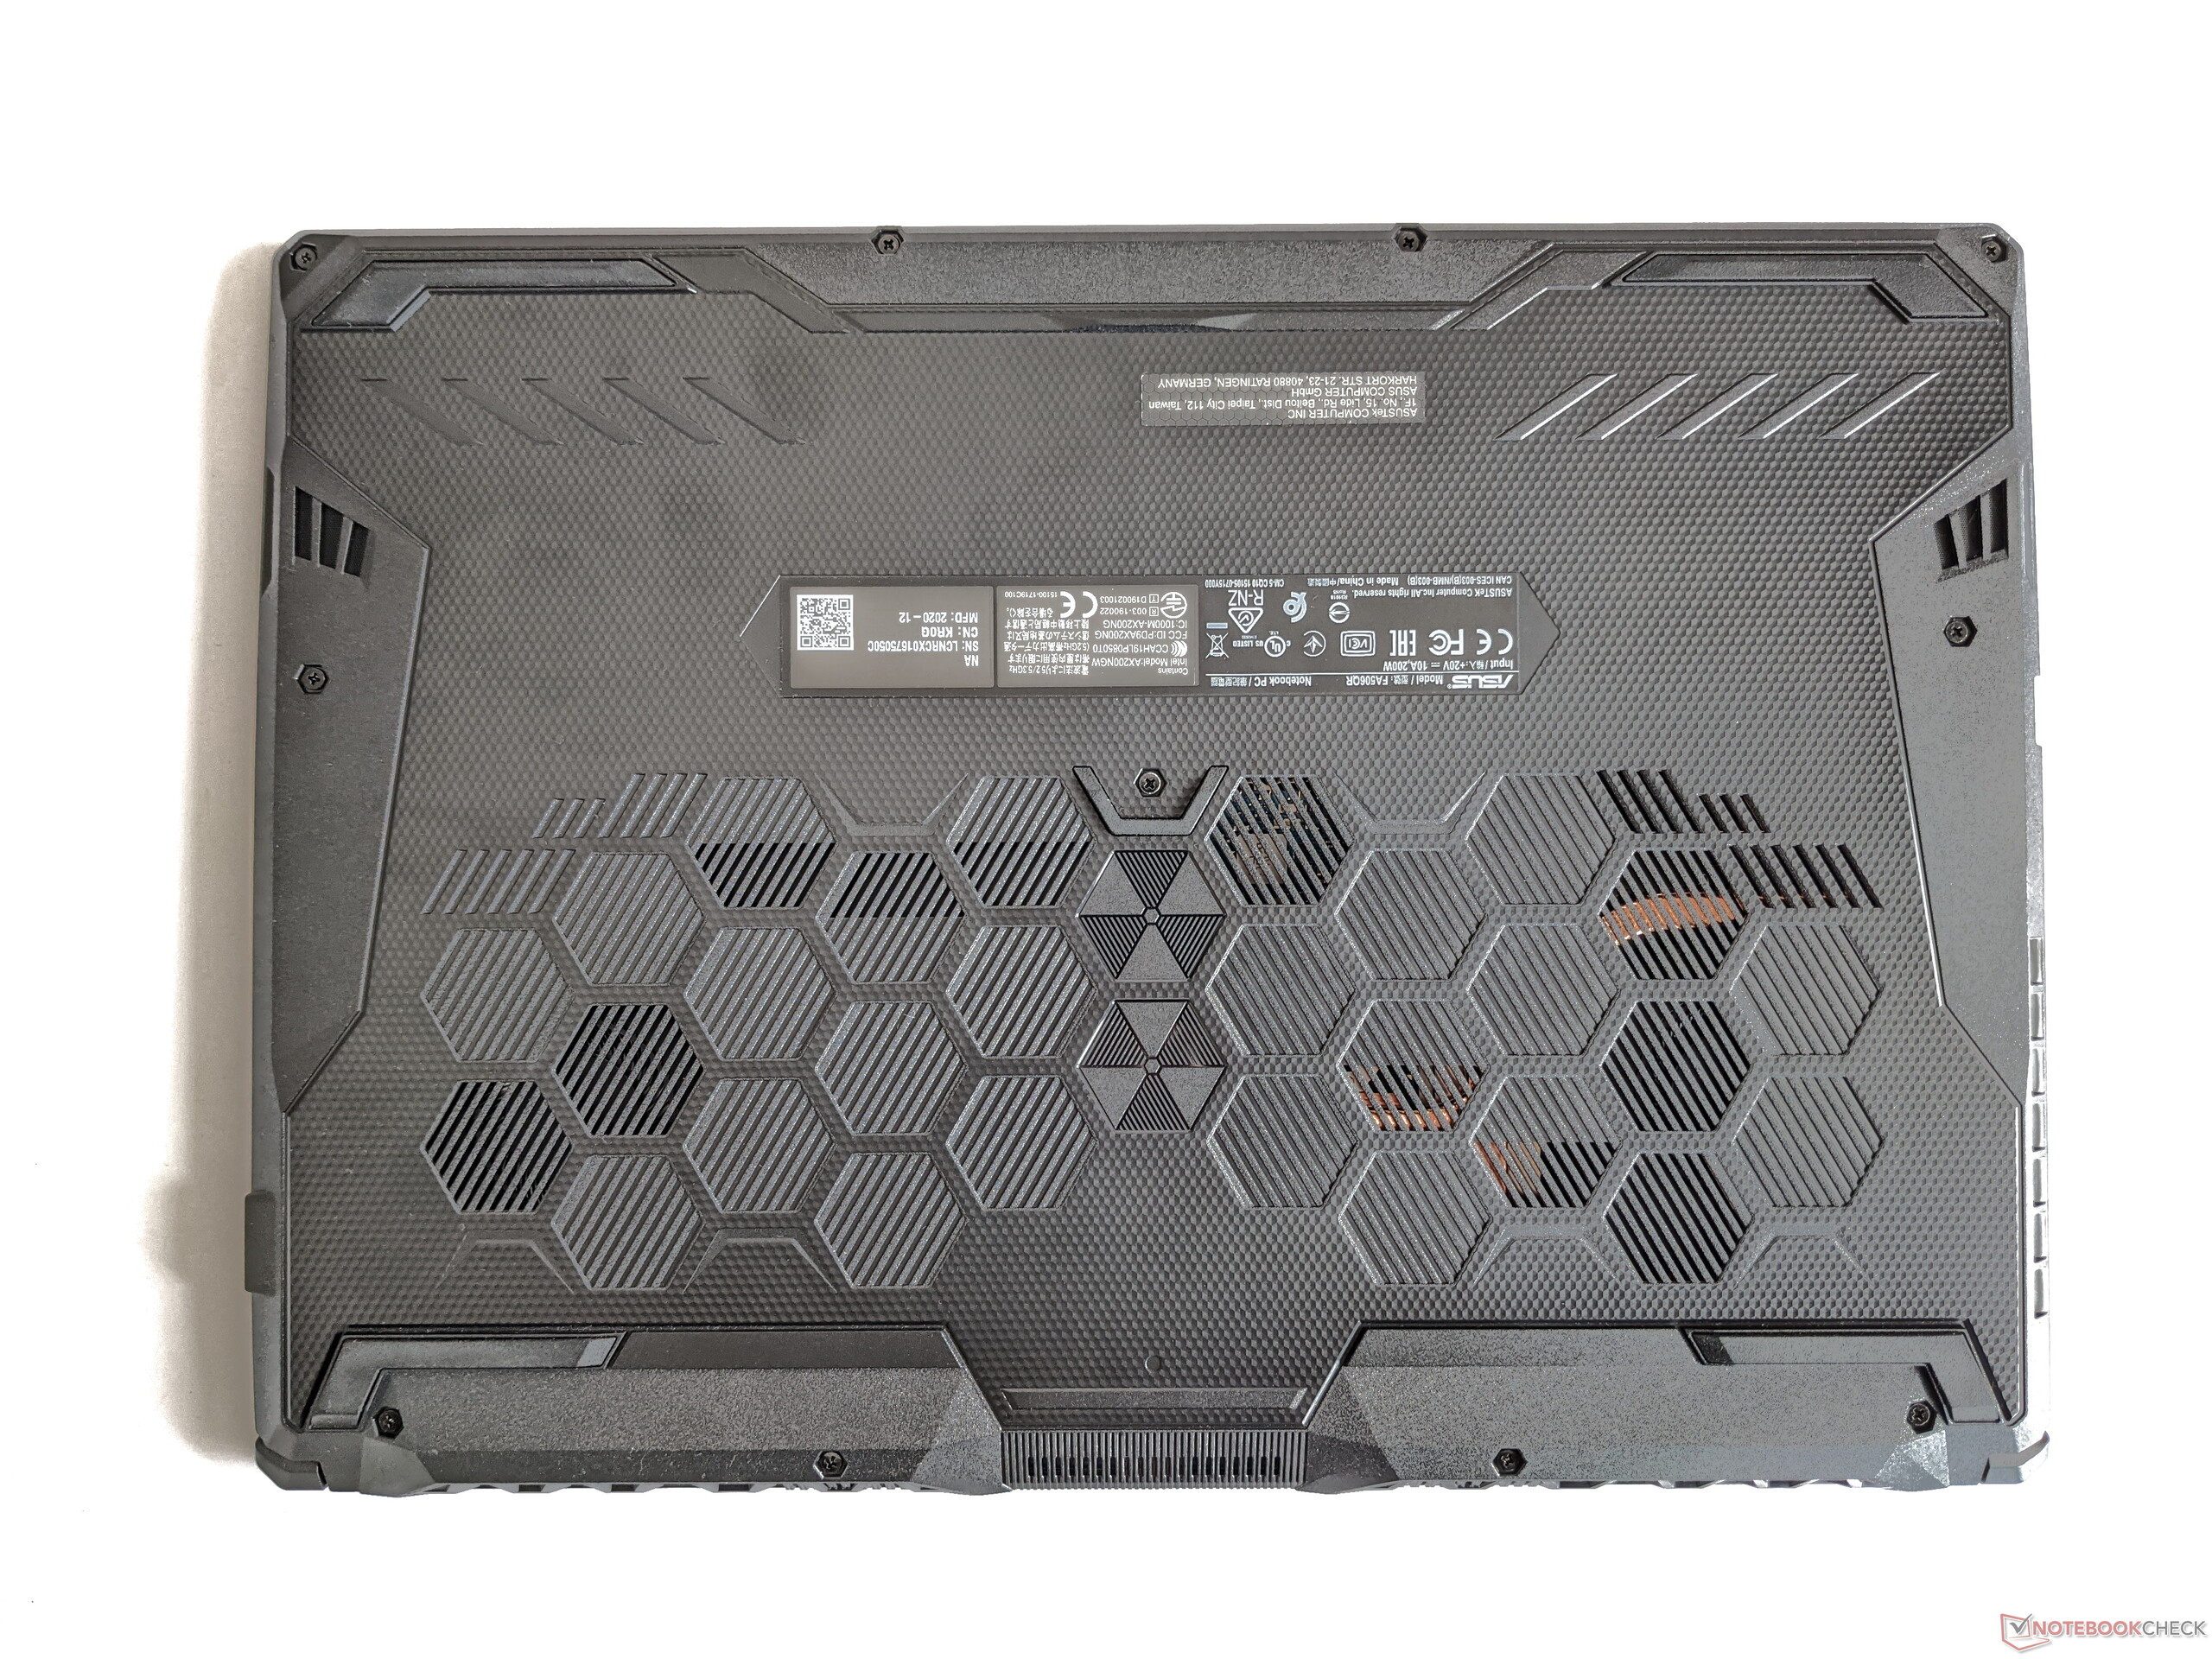
Estojo - Laptop de plástico para jogos sólidos
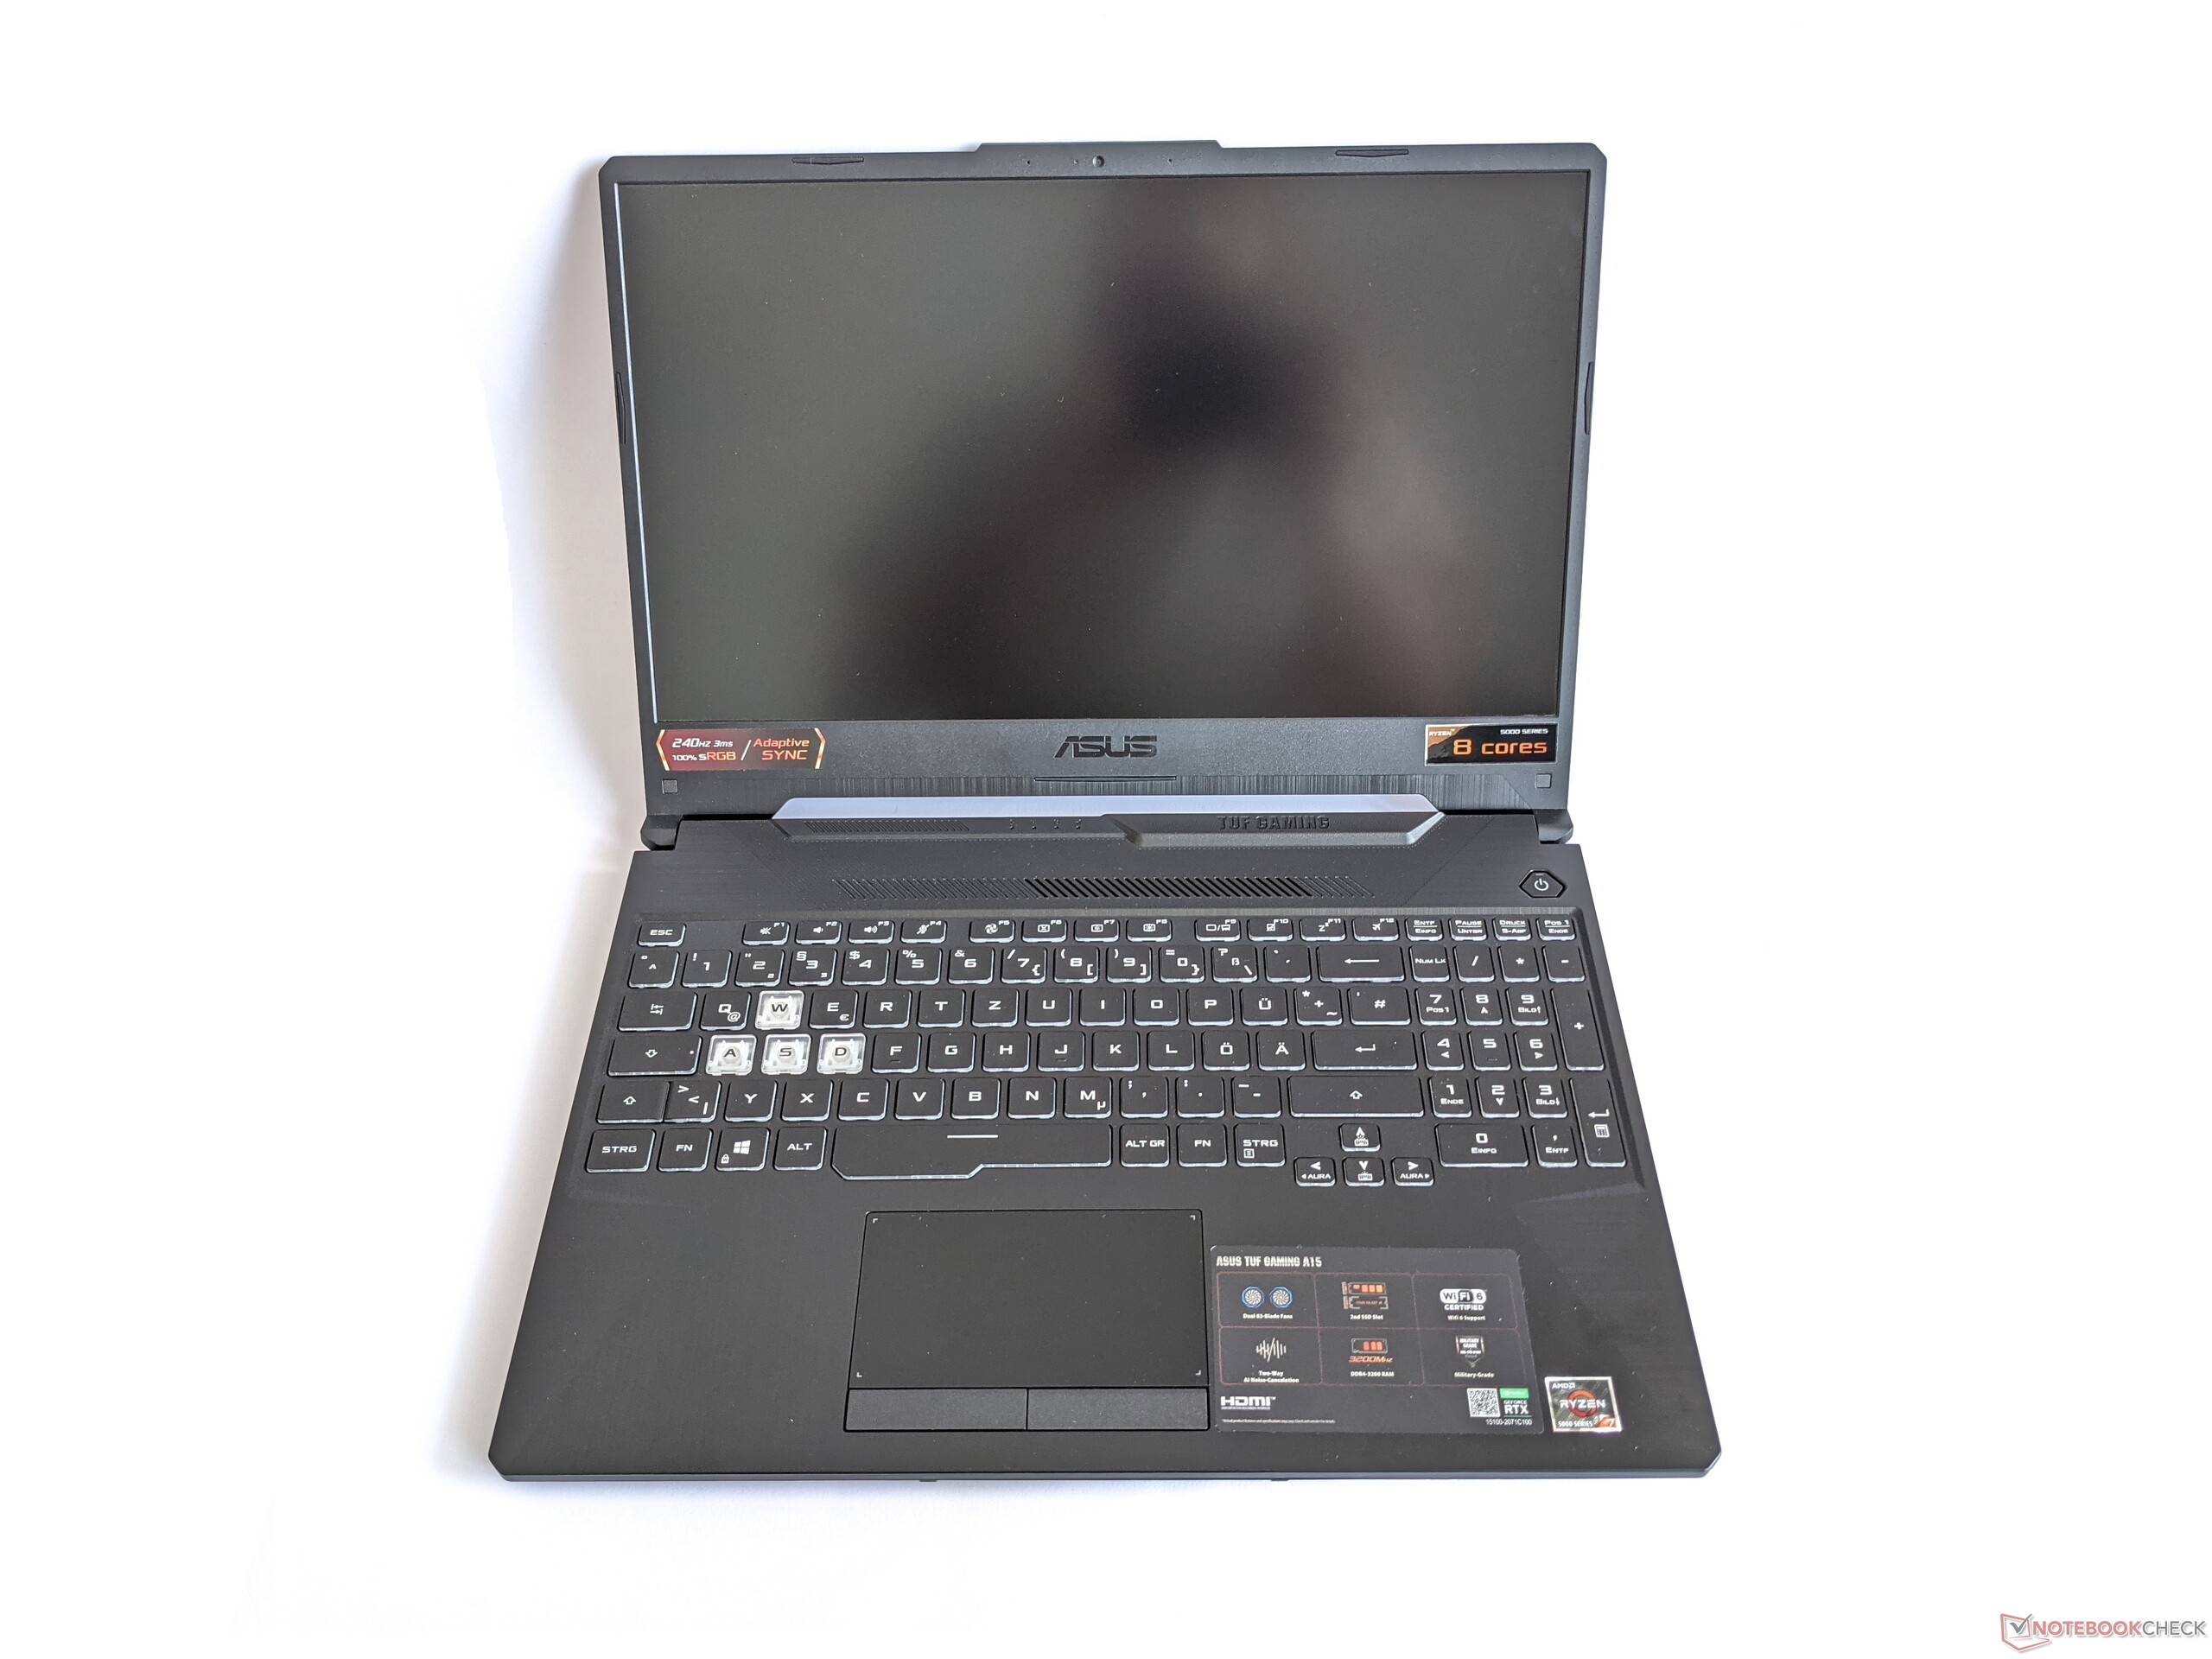
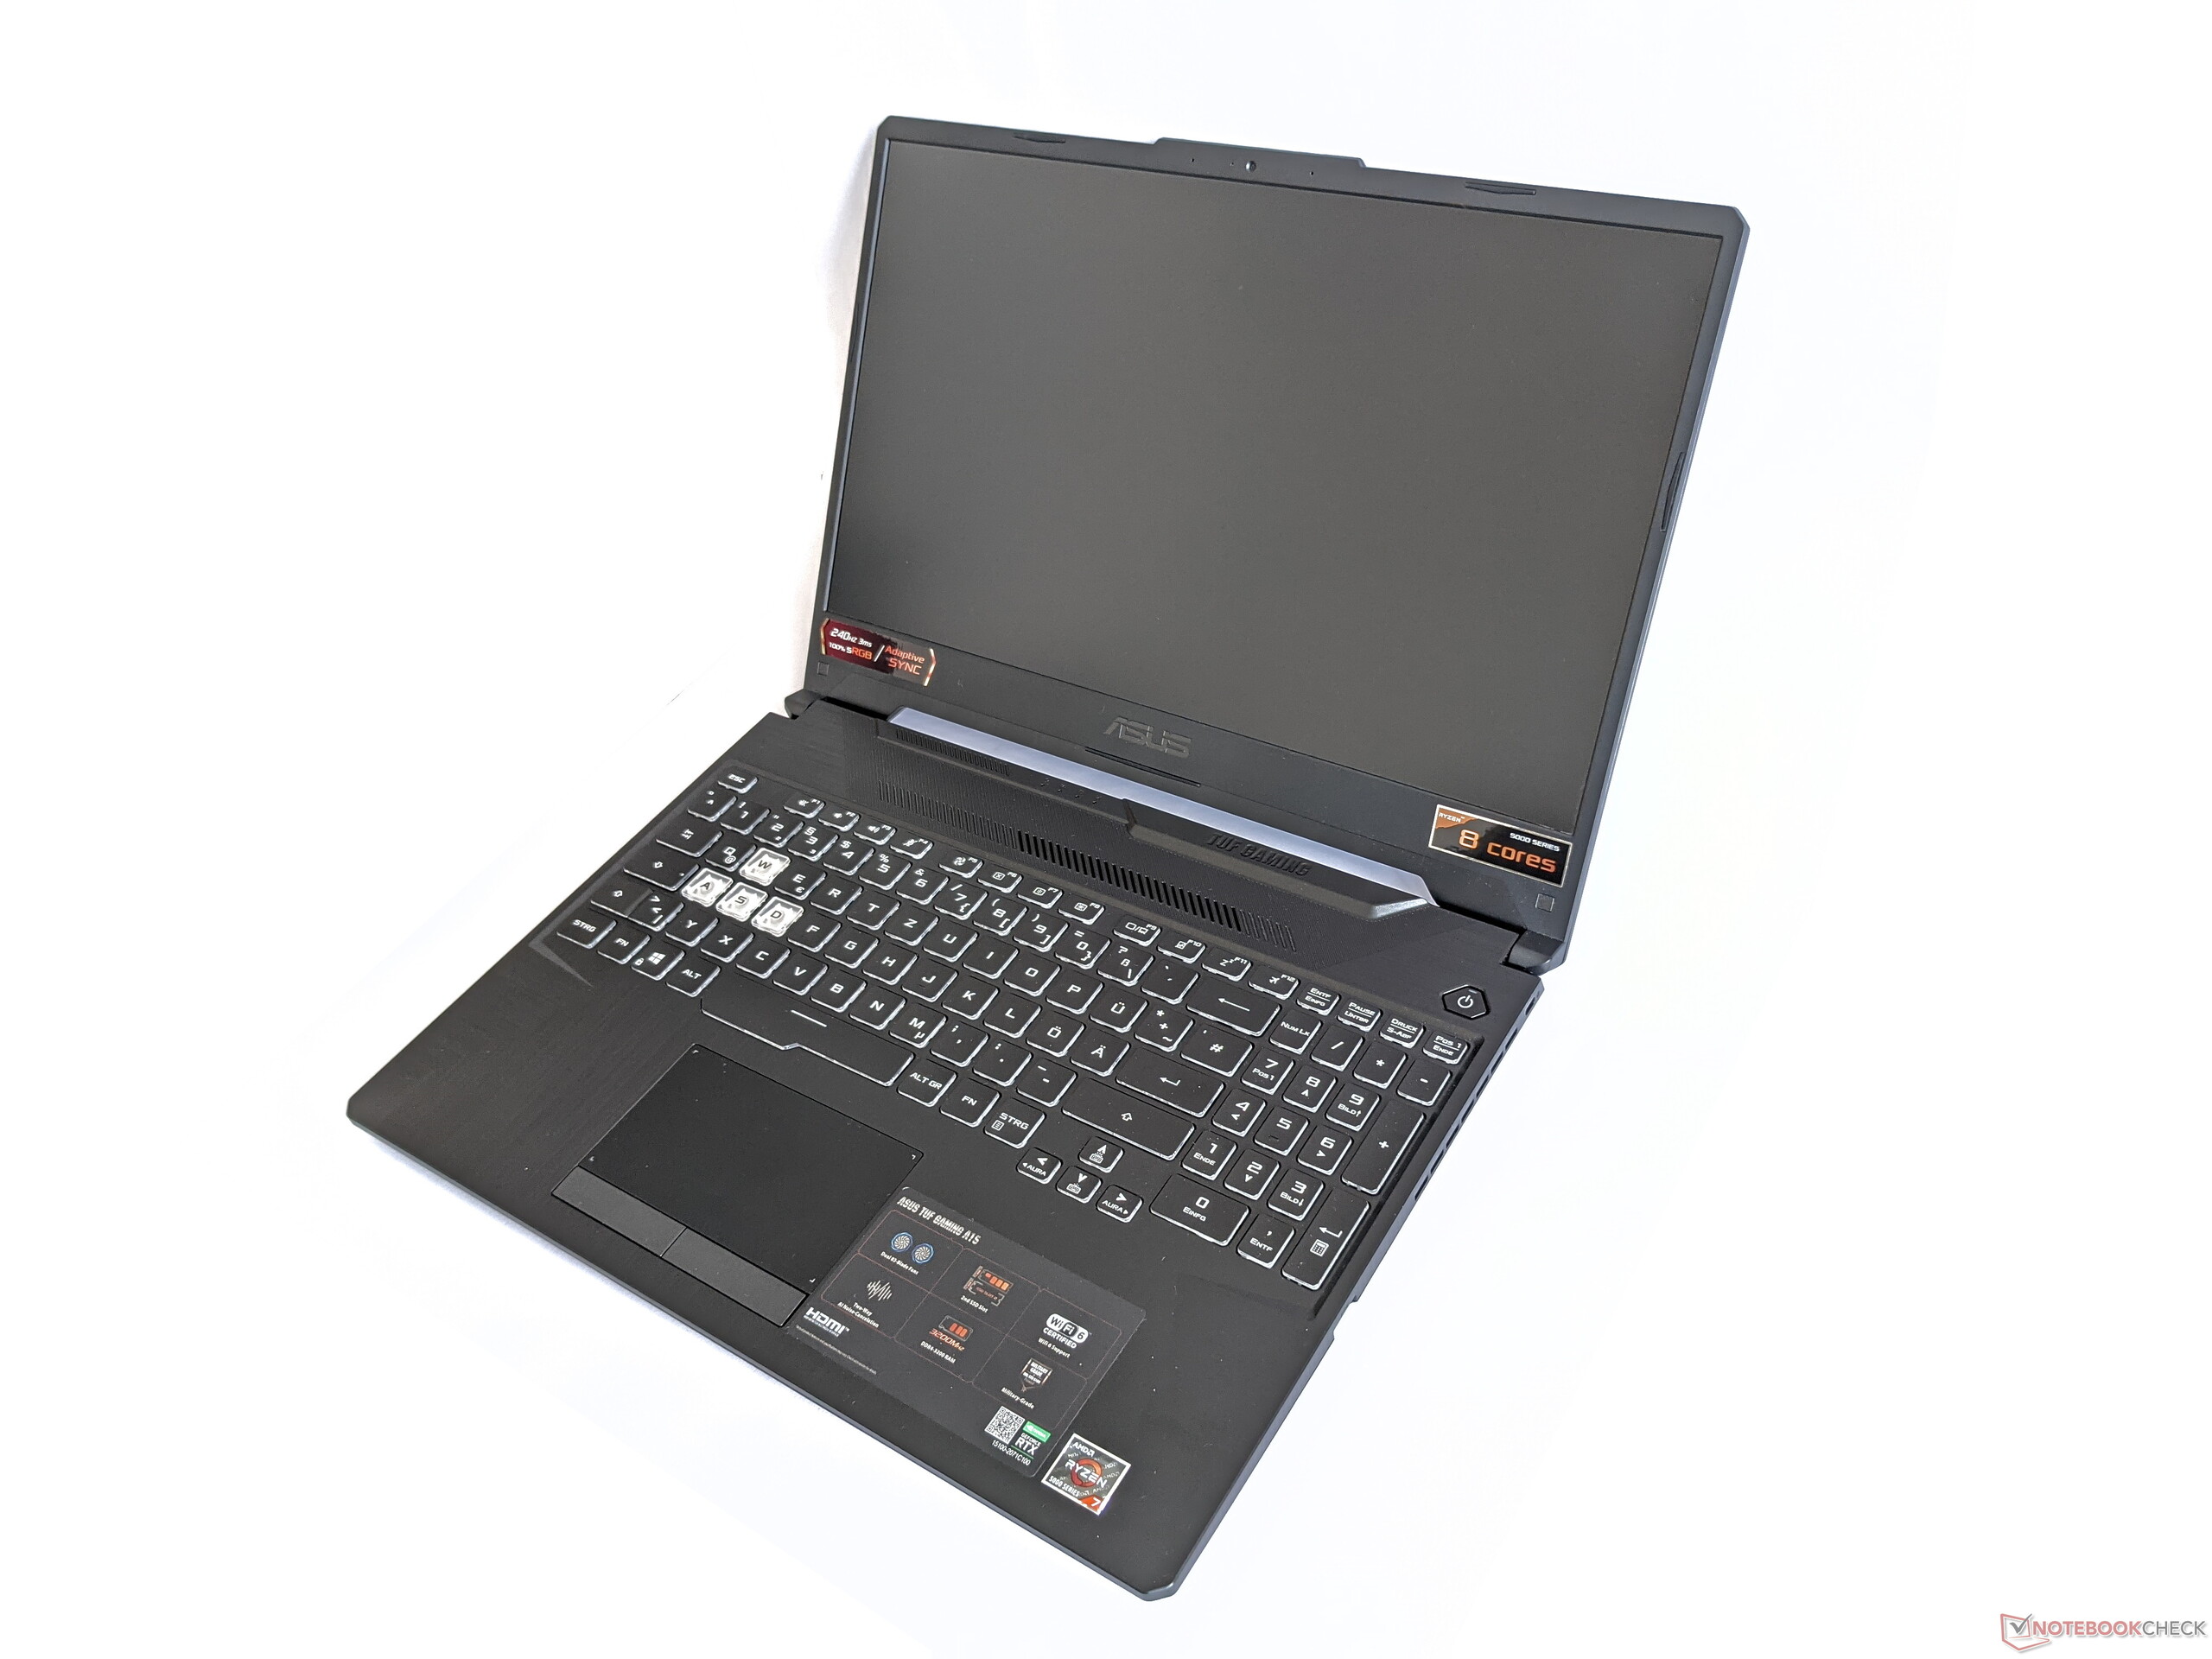
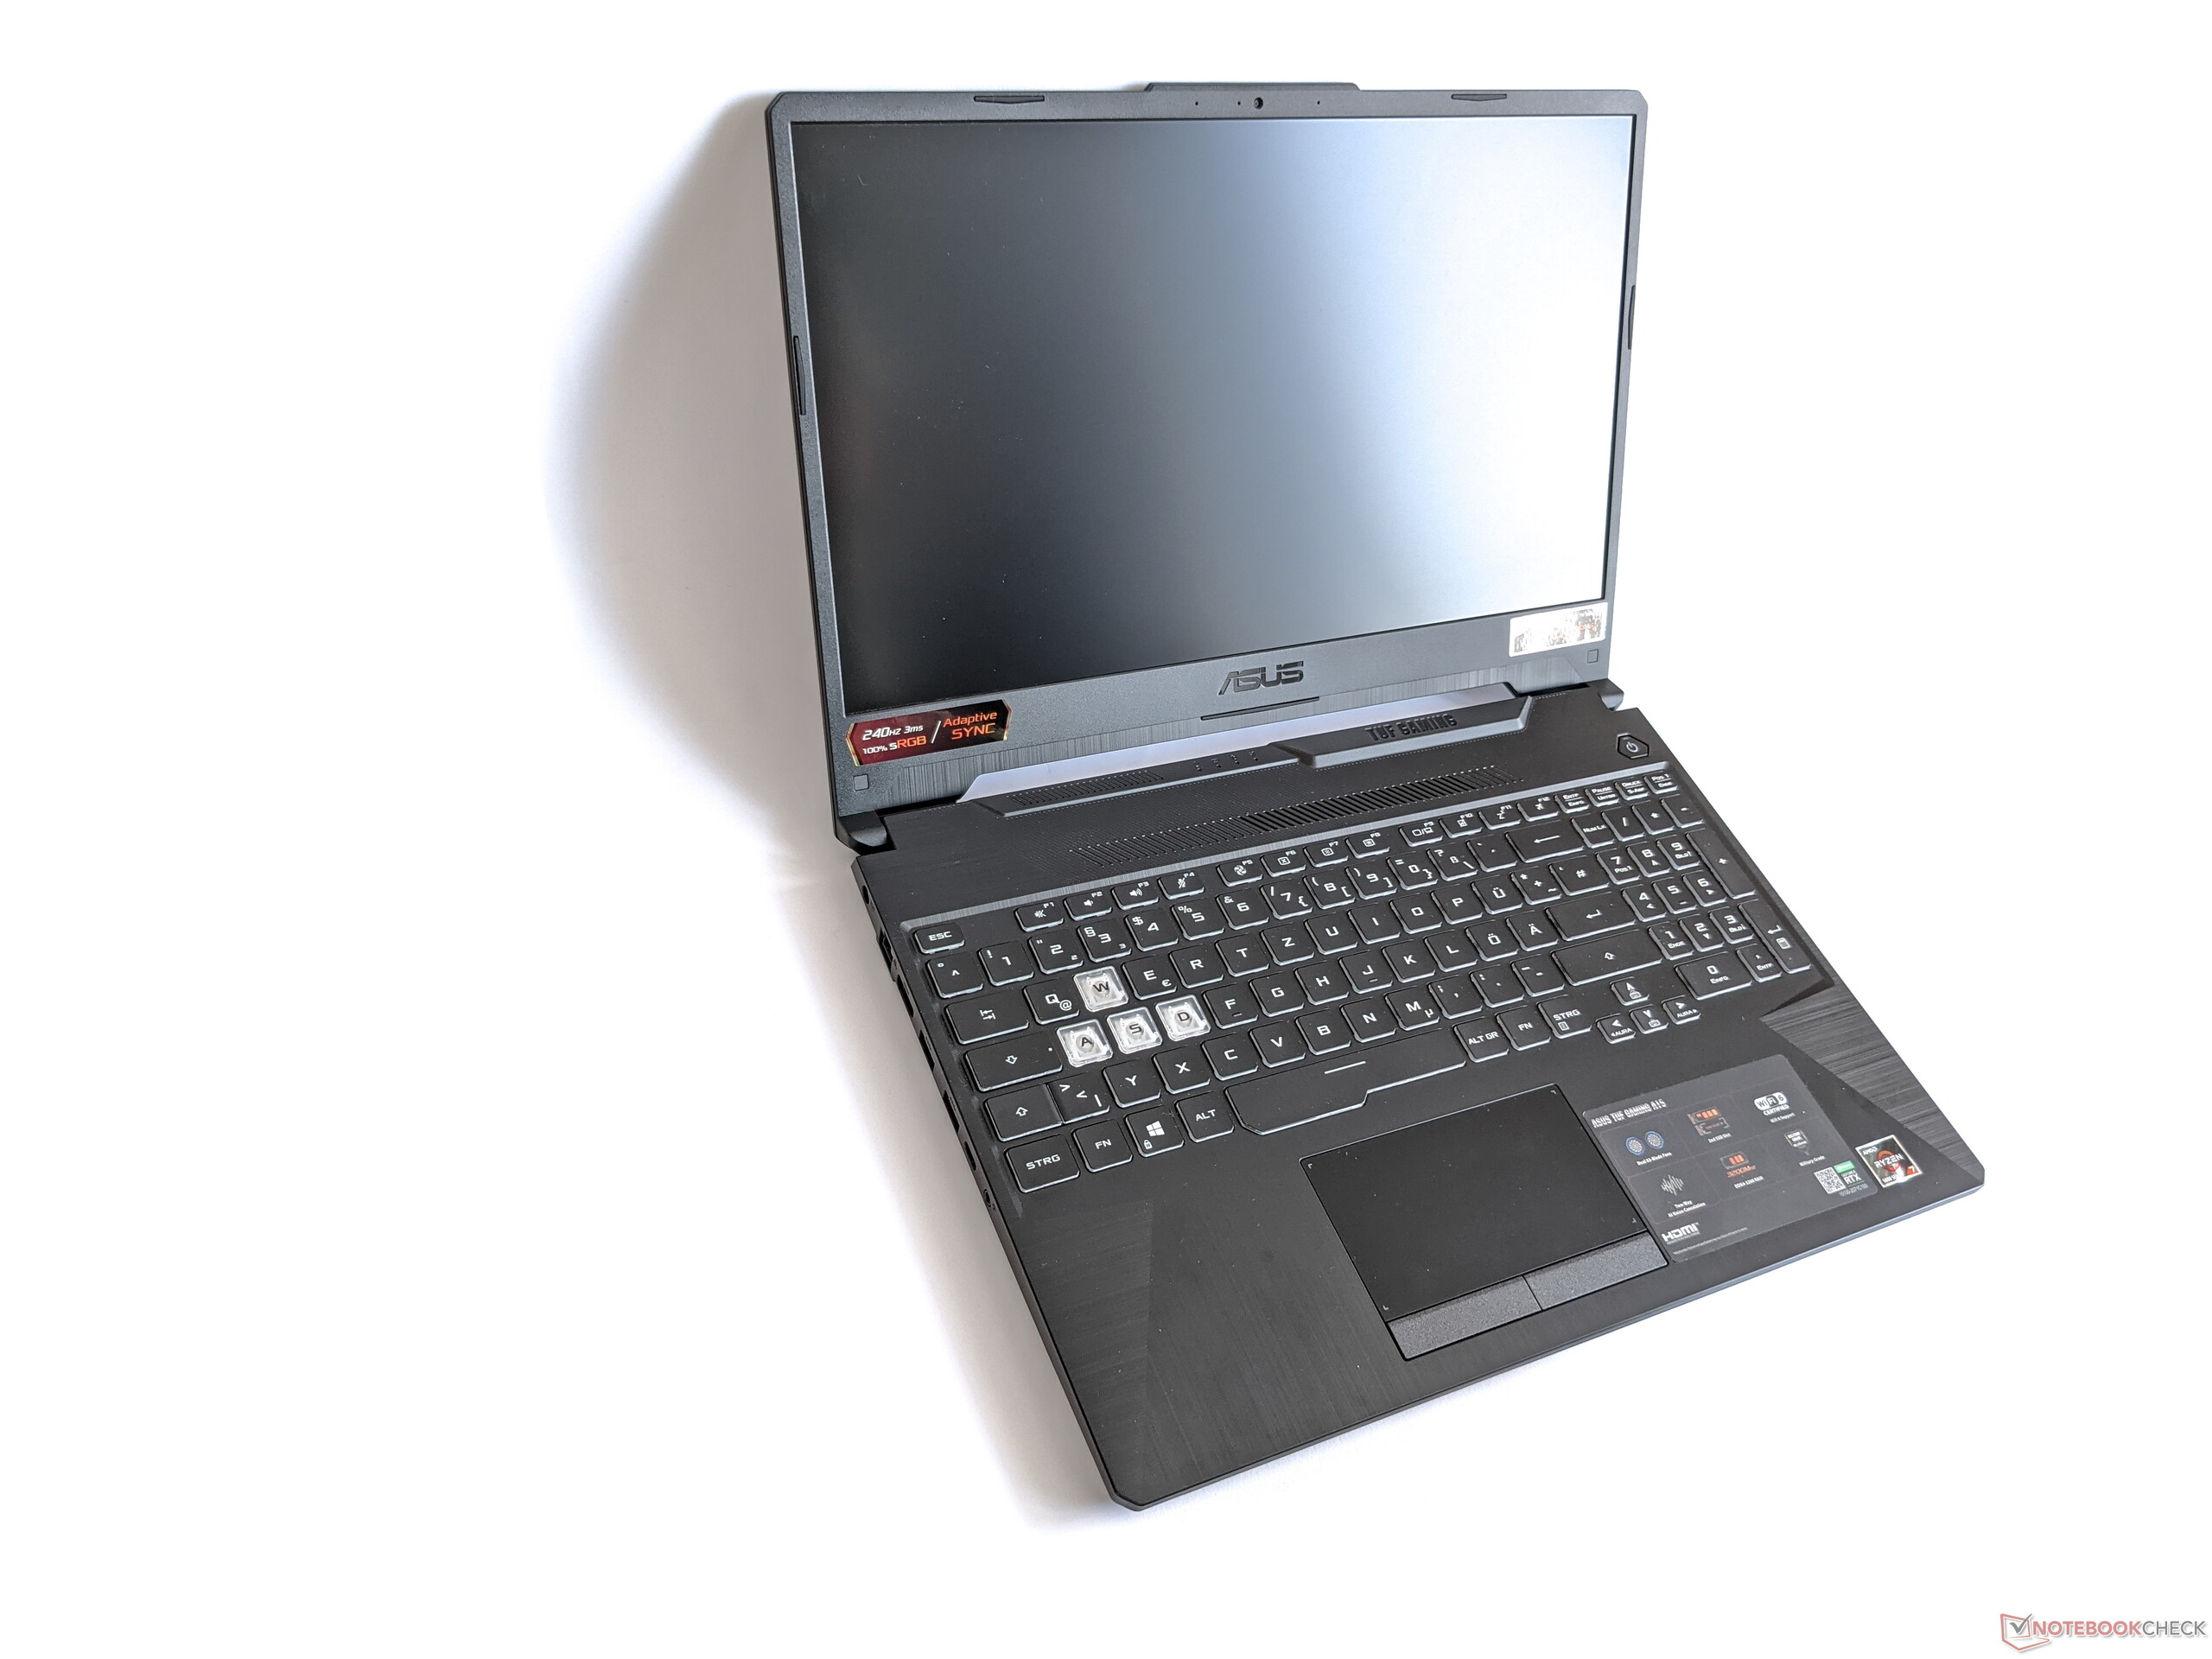
A Asus constrói a caixa do TUF Gaming A15 a partir de um plástico resistente e o decora com uma série de acentos distintos. Por exemplo, a tampa é enfeitada com parafusos simulados, e os apoios da palma apresentam um extenso acabamento escovado. A tela é rodeada por luneta estreita e pode ser aberta até um ângulo de aproximadamente 120 graus. Uma descrição detalhada do design pode ser encontrada na revisão do site Asus TUF Gaming F15
O peso e dimensões do TUF A15 são similares aos de outros laptops de 15 polegadas para jogos. Somente oAlienware m15é mais pesado e tem uma profundidade significativamente maior
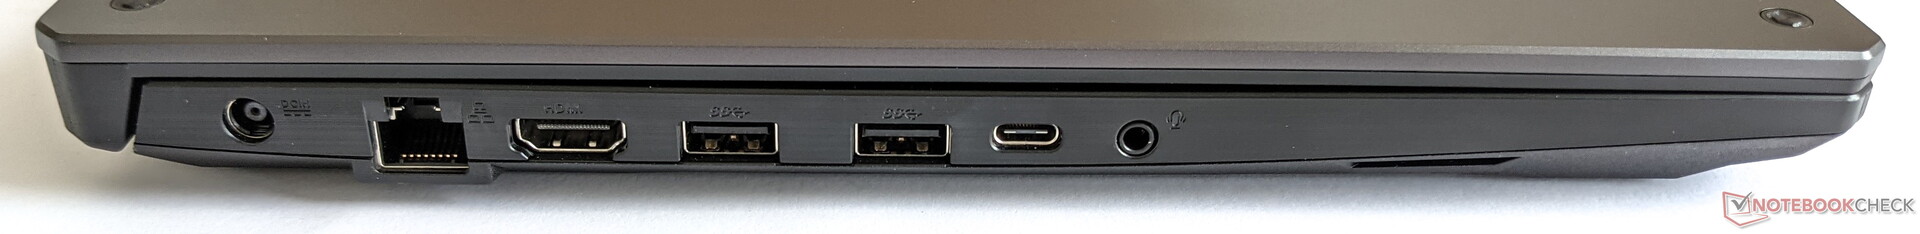
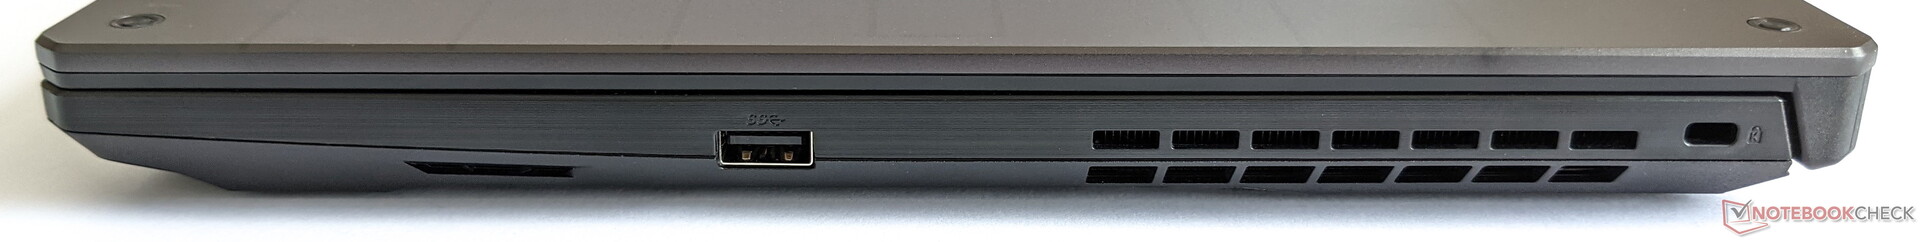
Conectividade - Sem relâmpago, mas rápido WLAN
A configuração da porta do Asus TUF Gaming A15 é versátil, e tudo que é necessário para a maioria das aplicações é fornecido. Em contraste com oTUF Gaming F15 variante Intel, no entanto, você tem que fazer sem Thunderbolt aqui
Comunicação
O Asus TUF Gaming A15 pode se conectar sem fio via Bluetooth 5.2 e Wi-Fi 6. Em combinação com nosso roteador de referência Netgear Nighthawk AX12, são alcançadas velocidades médias de transferência de dados de 1.480 Mb/s e velocidades de recepção de dados de 1.613 Mb/s, o que coloca o A15 em primeiro lugar em nosso campo de teste
Webcam
A webcam na TUF Gaming A15 produz imagens de 0,9 MP e conseqüentemente oferece a mesma baixa resolução que a maioria dos laptops atuais. A qualidade é correspondentemente pobre, mesmo em boas condições de iluminação


Acessórios
Além do próprio laptop, somente o adaptador de energia está incluído na caixa do dispositivo de jogos Asus. Entretanto, acessórios gerais adicionais podem ser comprados no website do fabricante
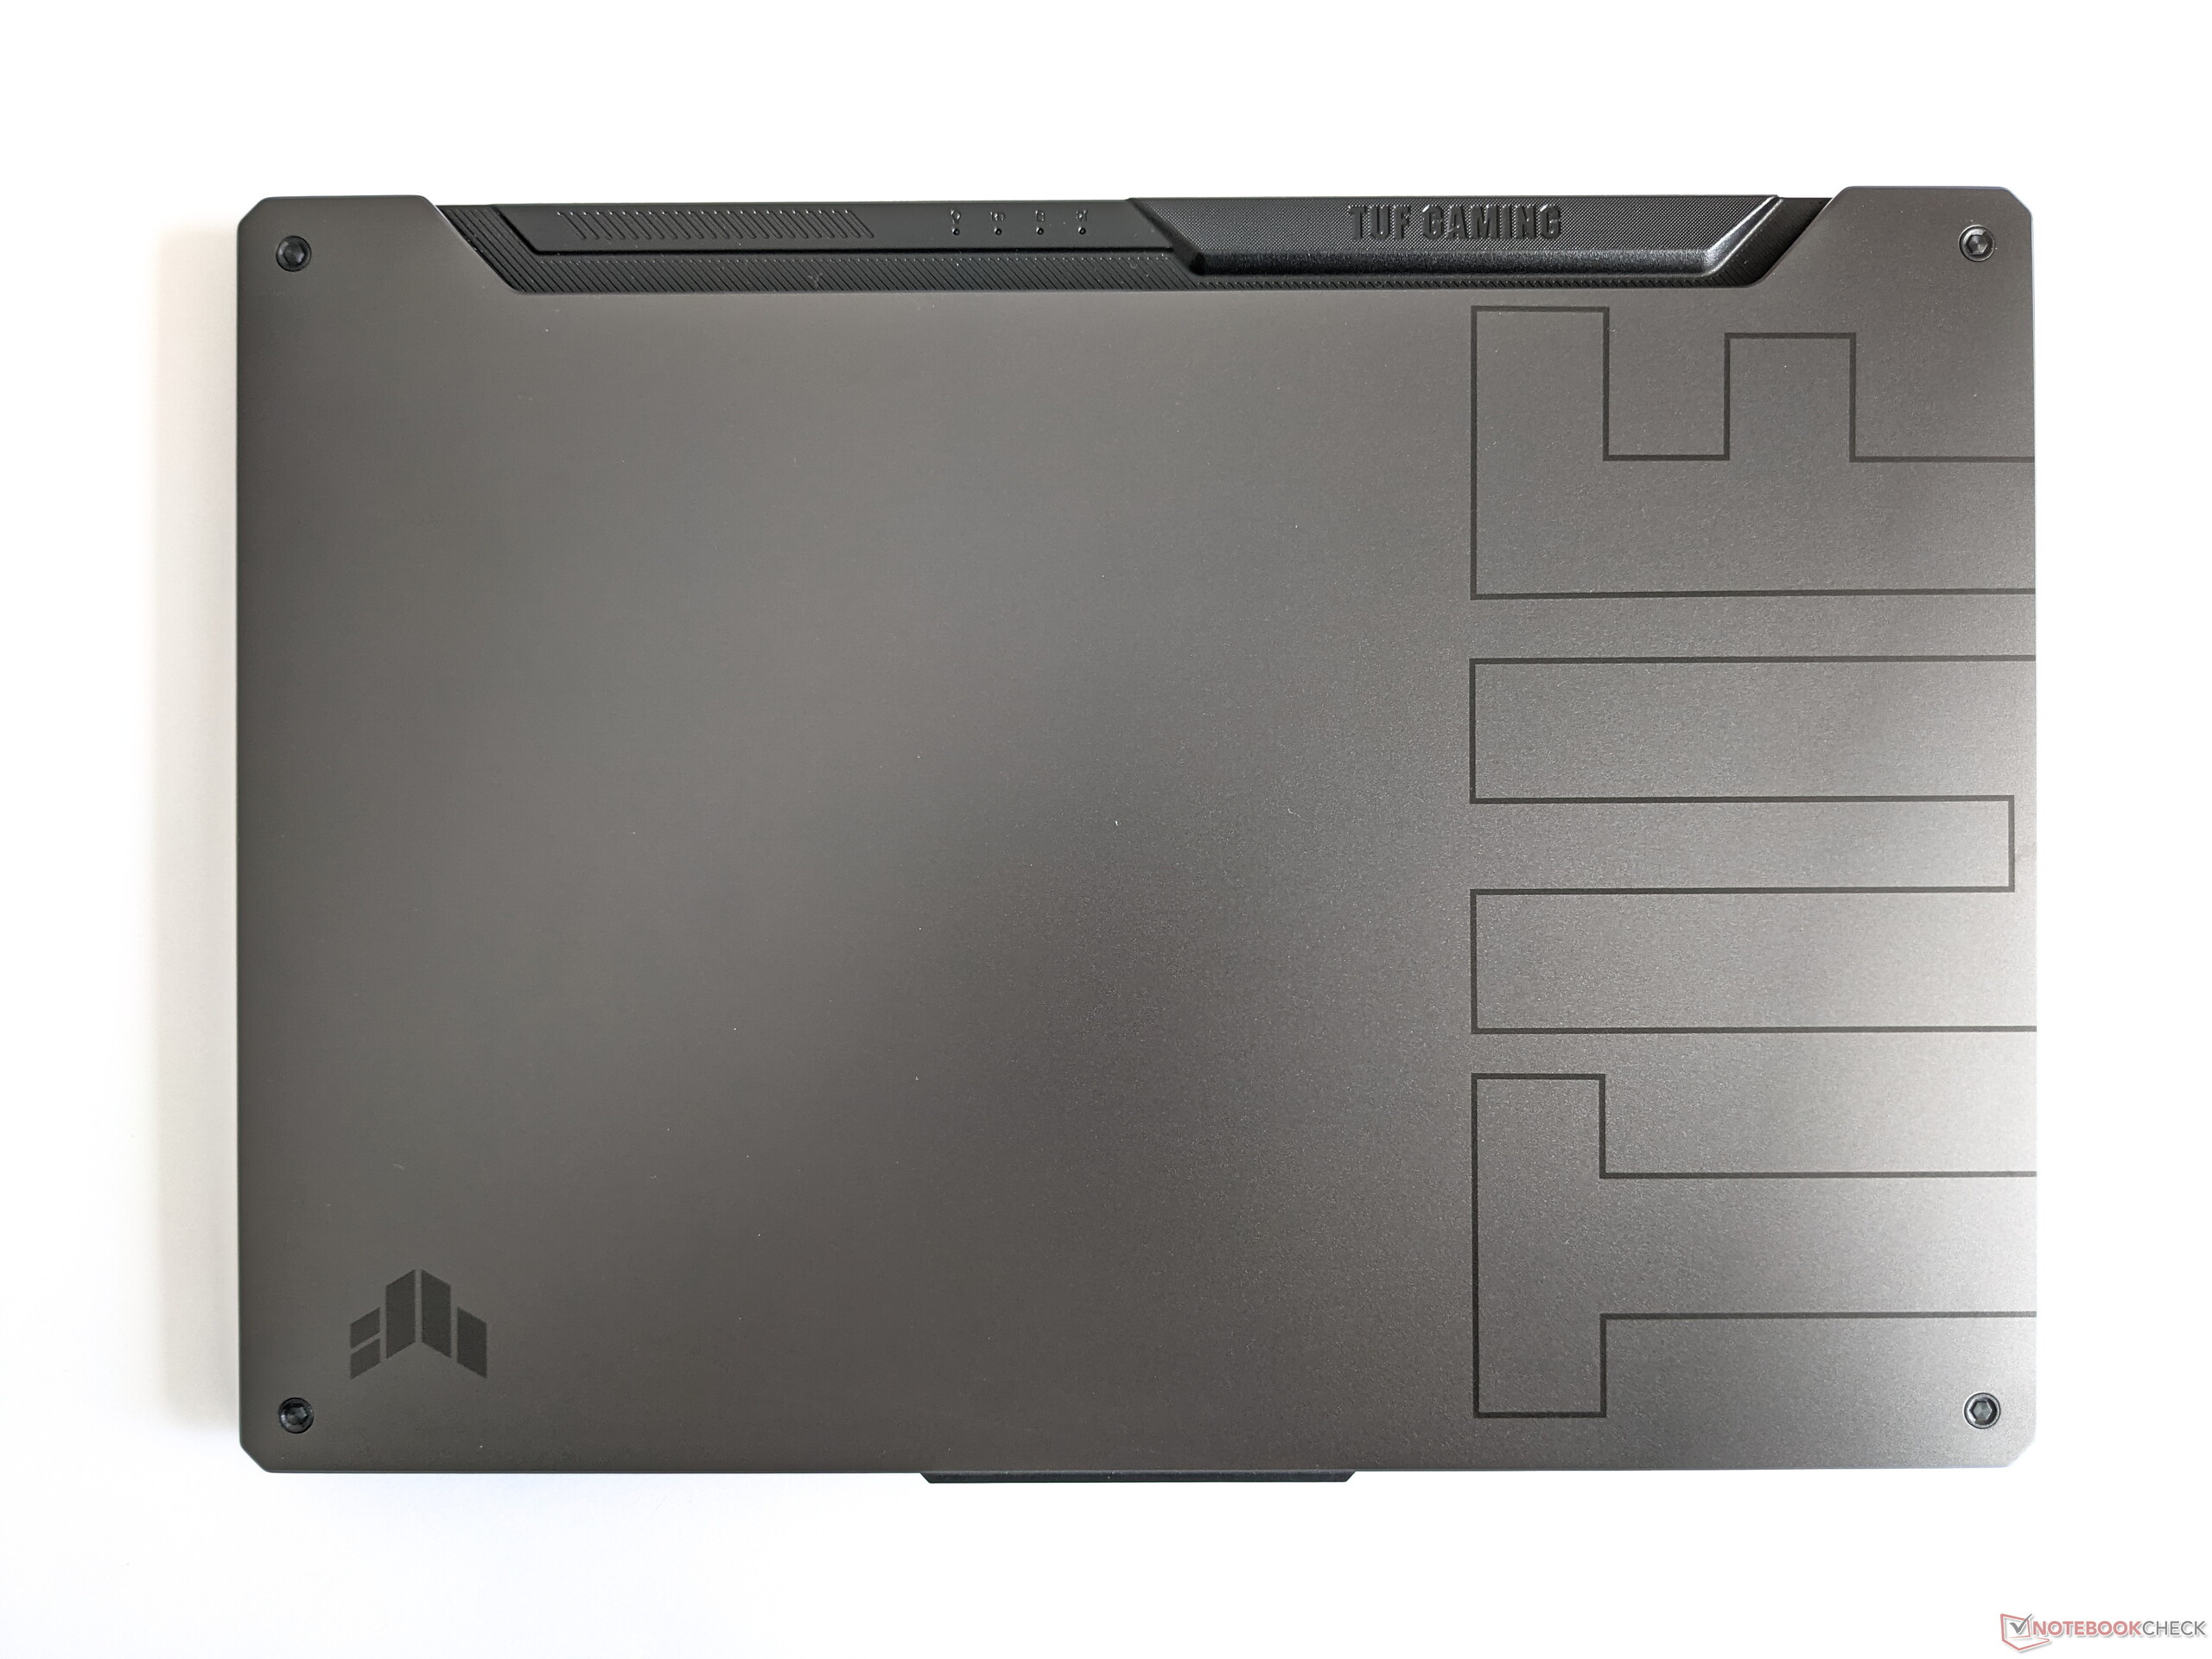
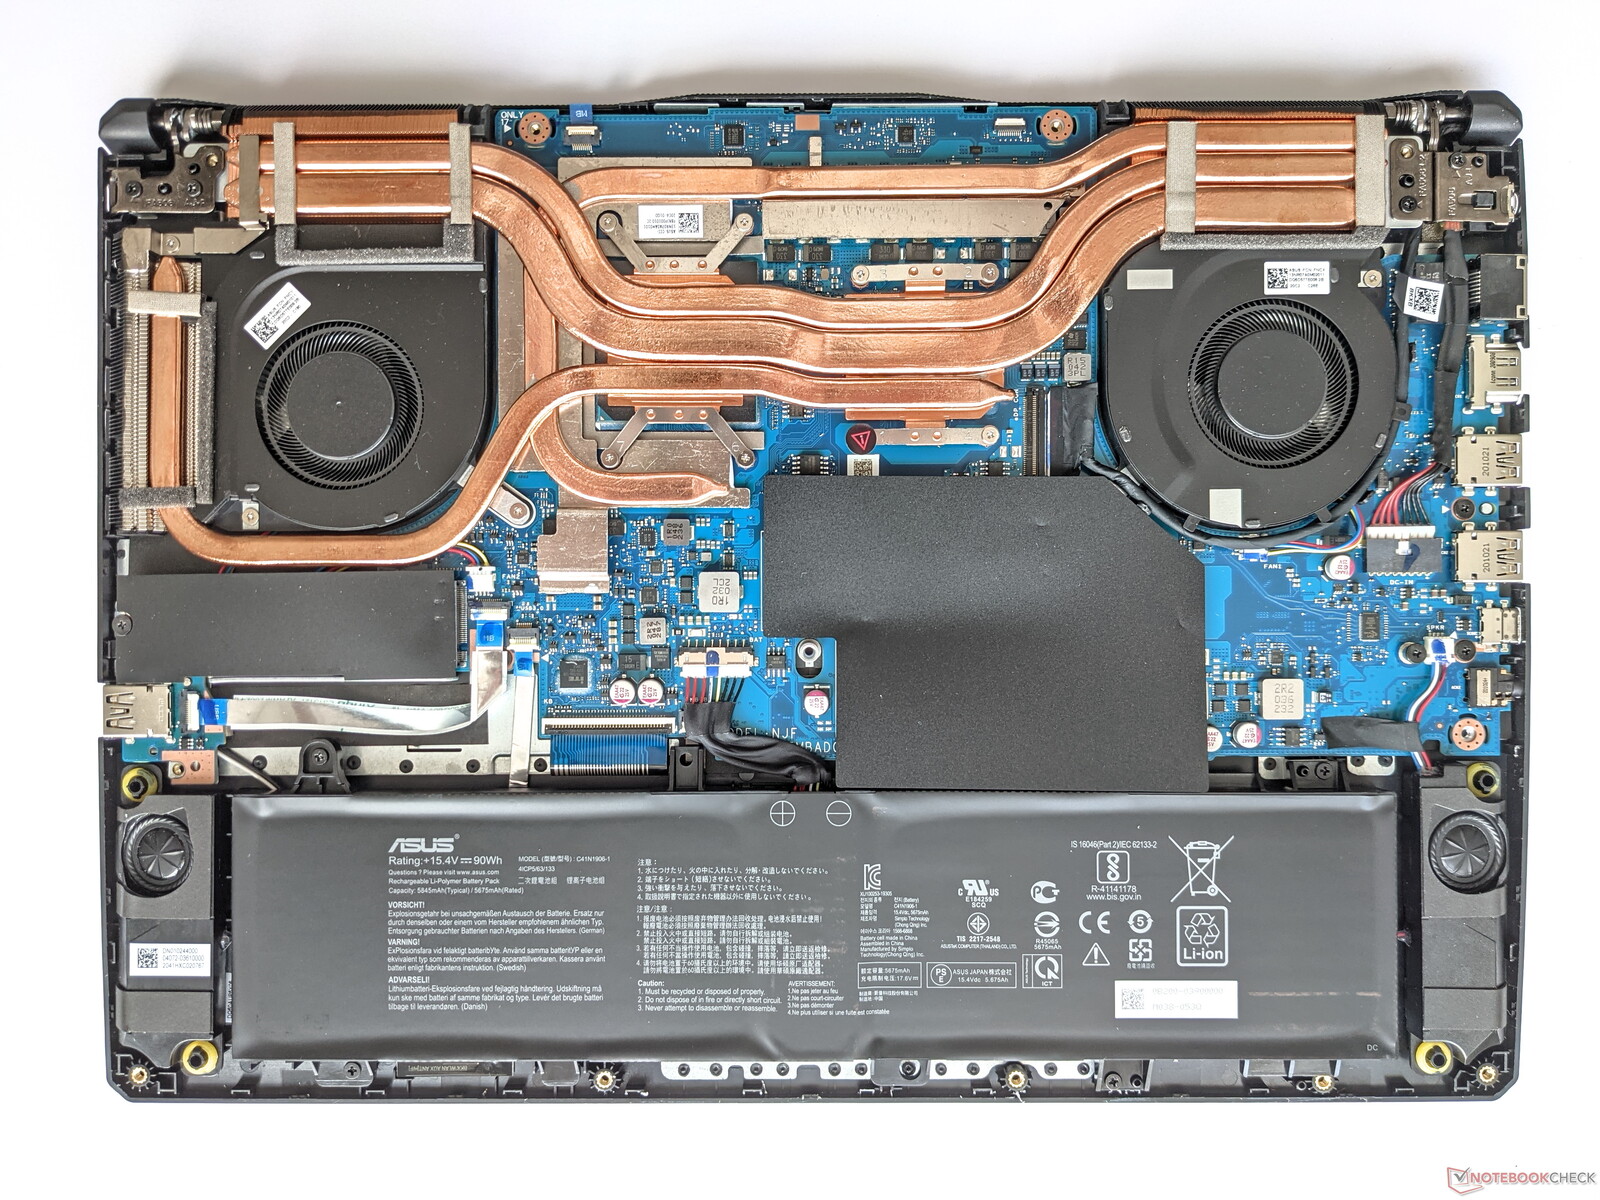
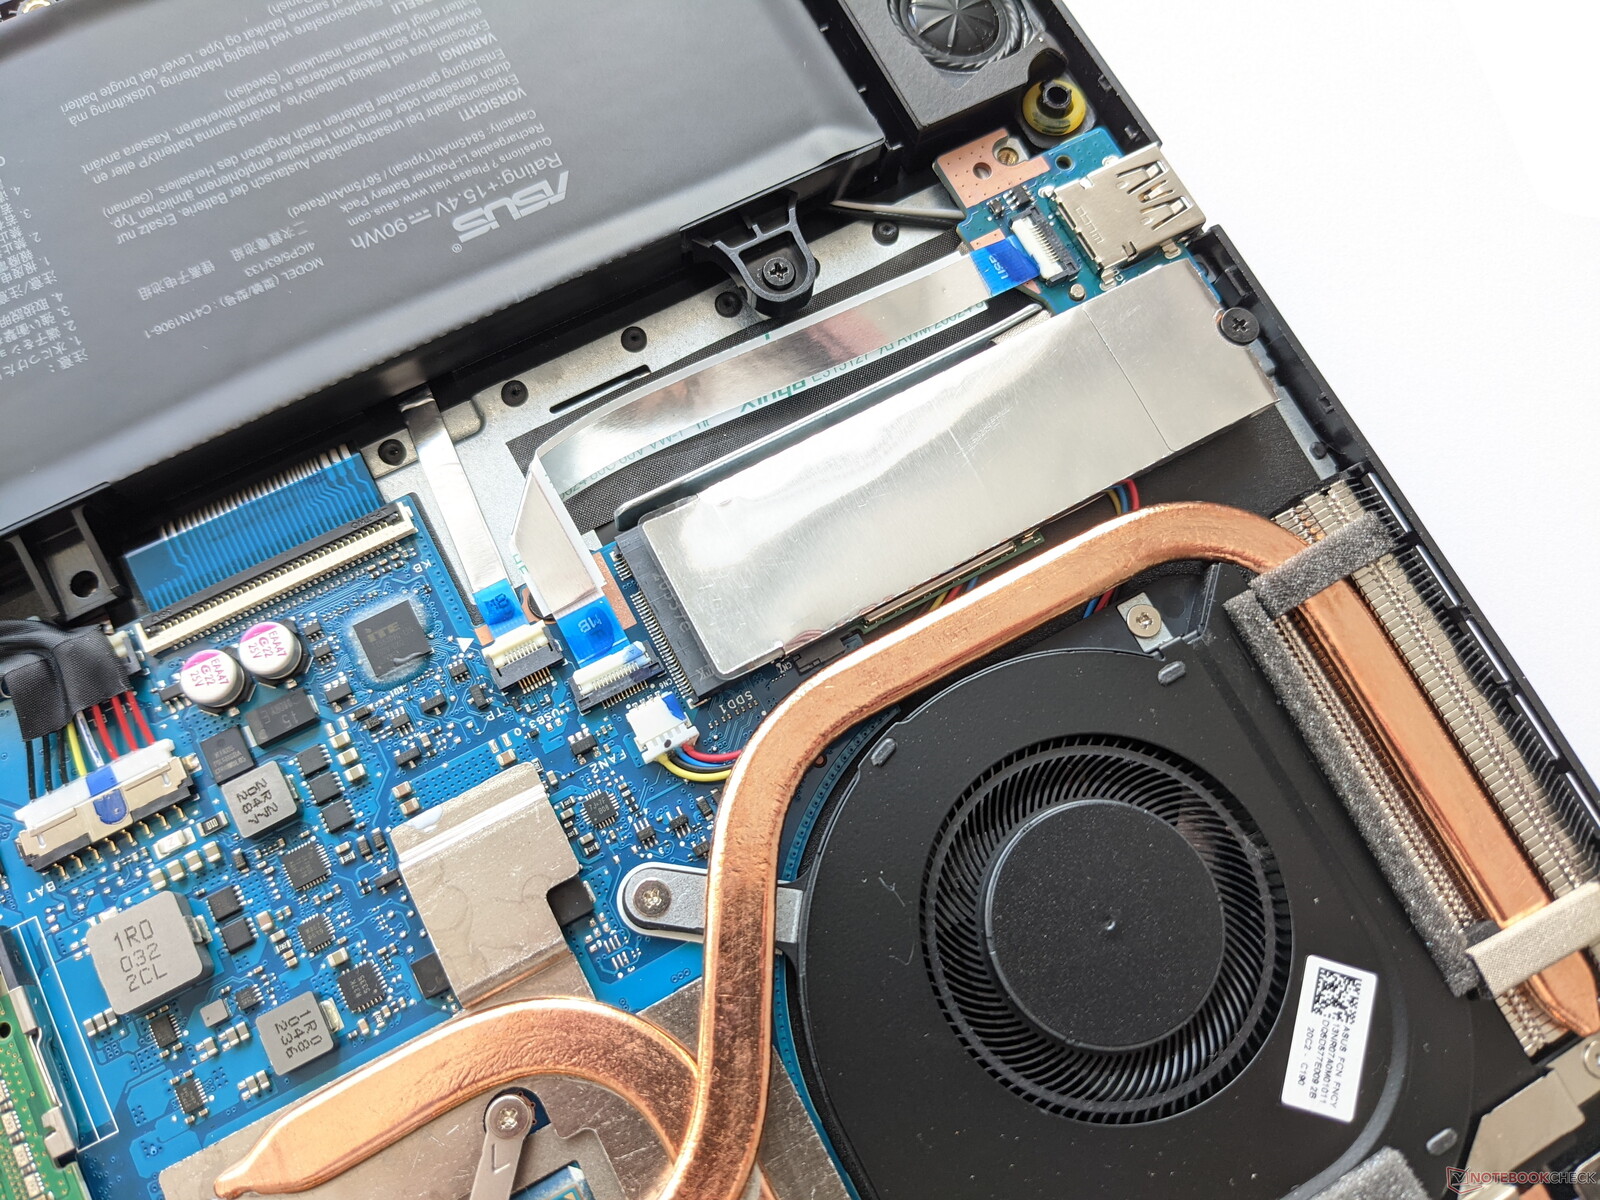
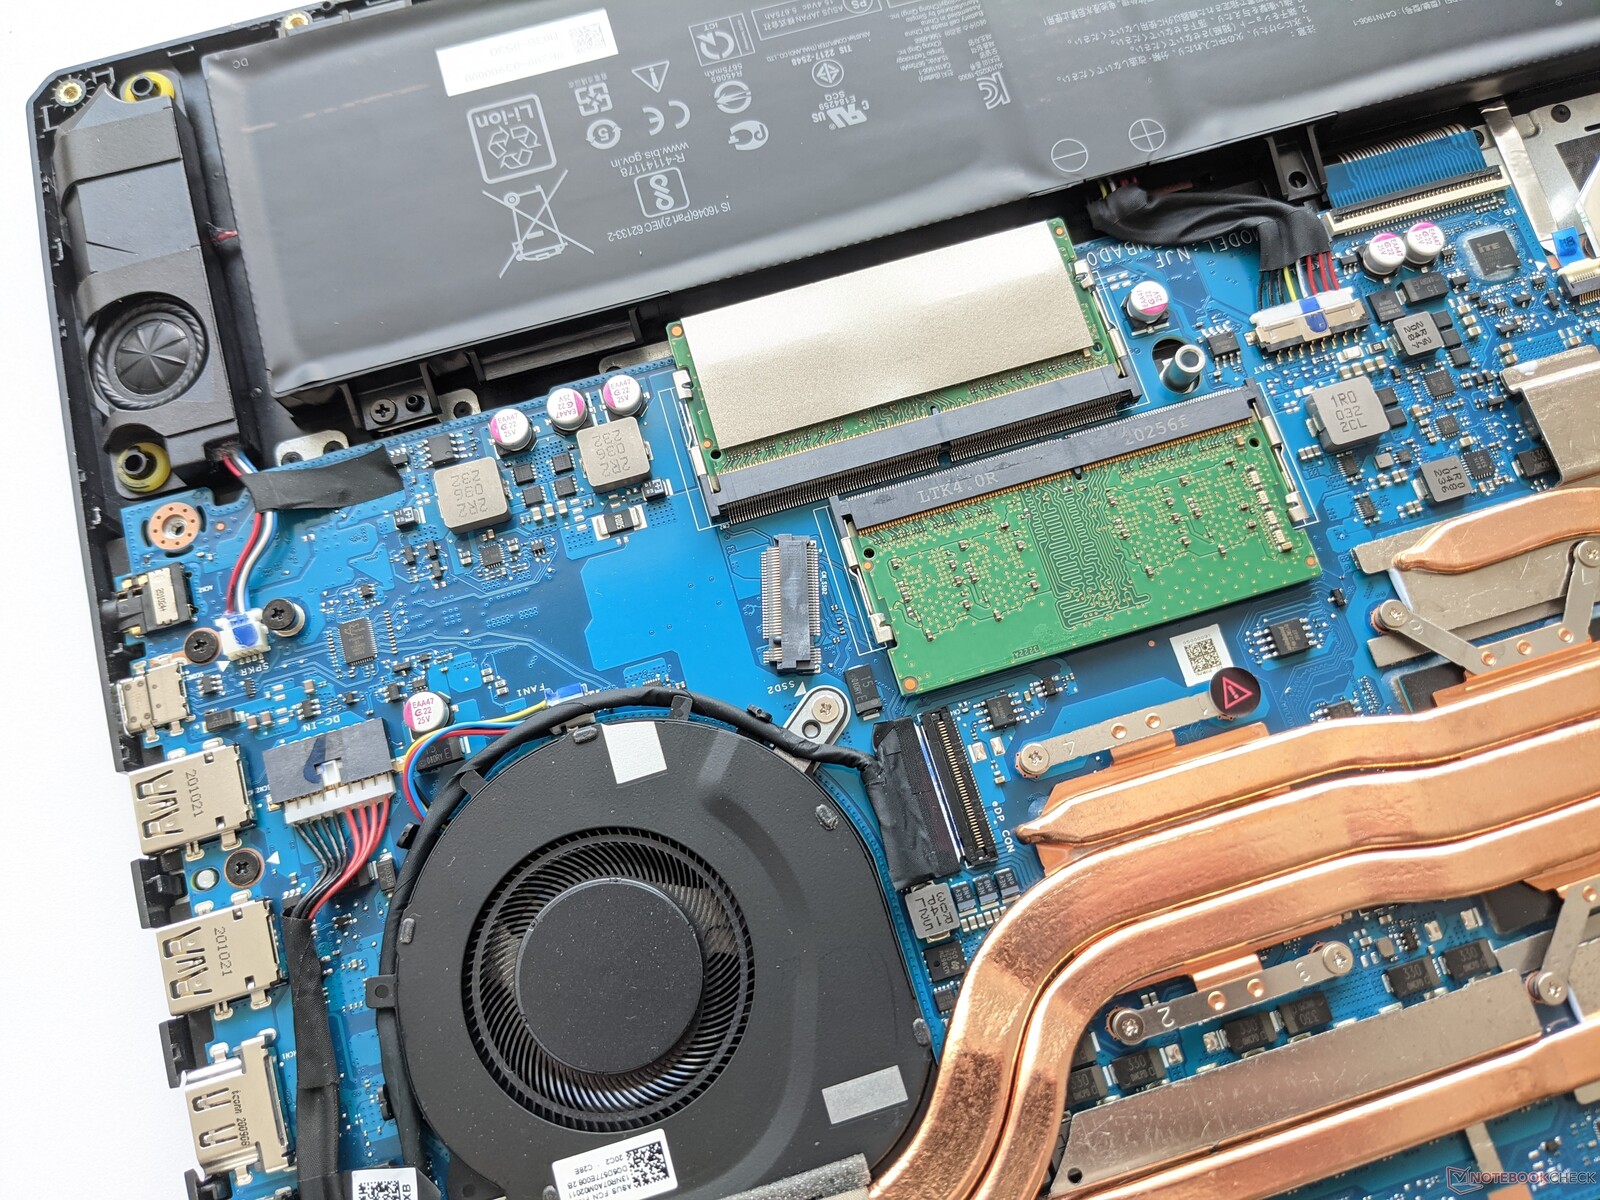
Manutenção
A tampa inferior do Asus TUF Gaming A15 pode ser removida após soltar todos os parafusos na parte inferior. Dois slots de RAM e dois SSD são encontrados no interior, permitindo expandir ou substituir a memória ou o armazenamento em massa. O módulo WLAN abaixo do SSD primário também pode ser acessado desta forma
Garantia
A Asus concede aos compradores da TUF Gaming A15 um período de garantia de 12 meses
Dispositivos de entrada - Nenhuma iluminação de chave individual
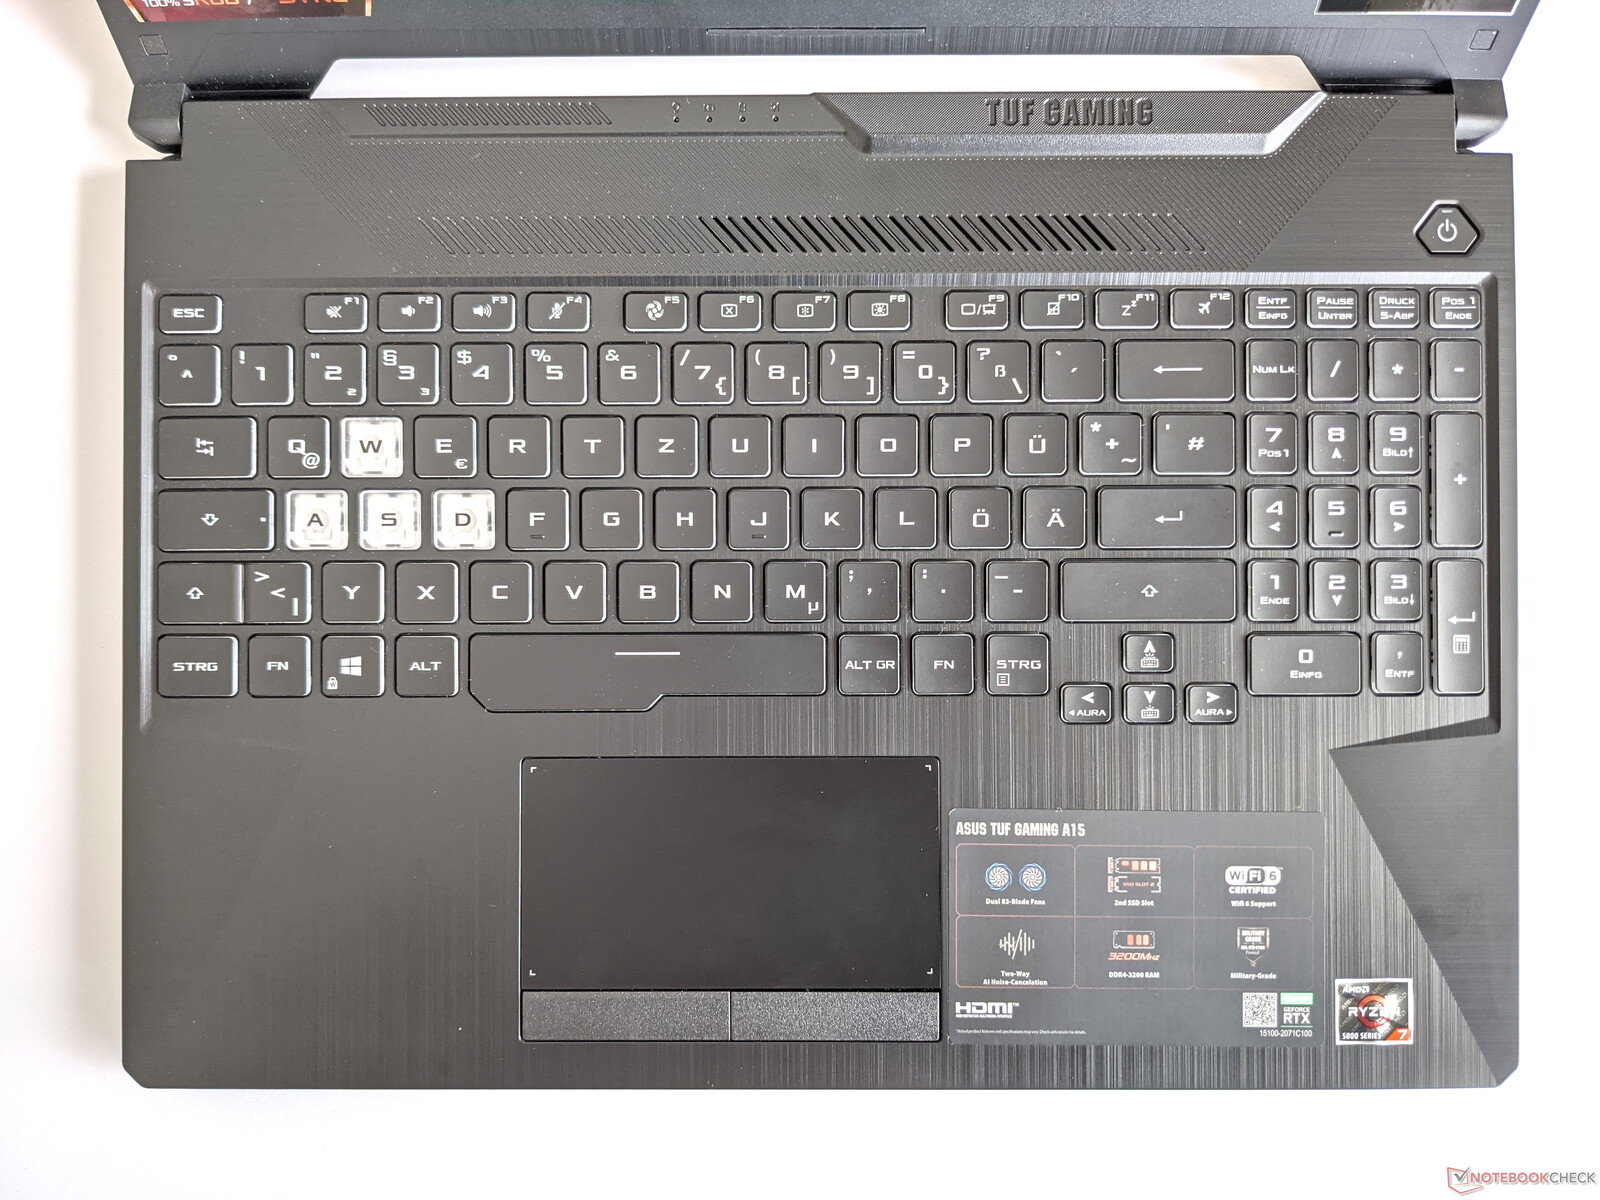
Teclado
As chaves do Asus TUF Gaming A15 oferecem um feedback médio com um ponto de pressão menos facilmente perceptível, mas também são adequadas para digitar textos mais longos após um curto período de familiarização. As teclas WASD se destacam do resto do teclado graças ao seu design transparente, tornando-as mais proeminentes quando se utiliza a iluminação das teclas em três estágios. Esta última pode ser configurada em cores diferentes, mas não oferece iluminação de teclas individuais ou zonas diferentes
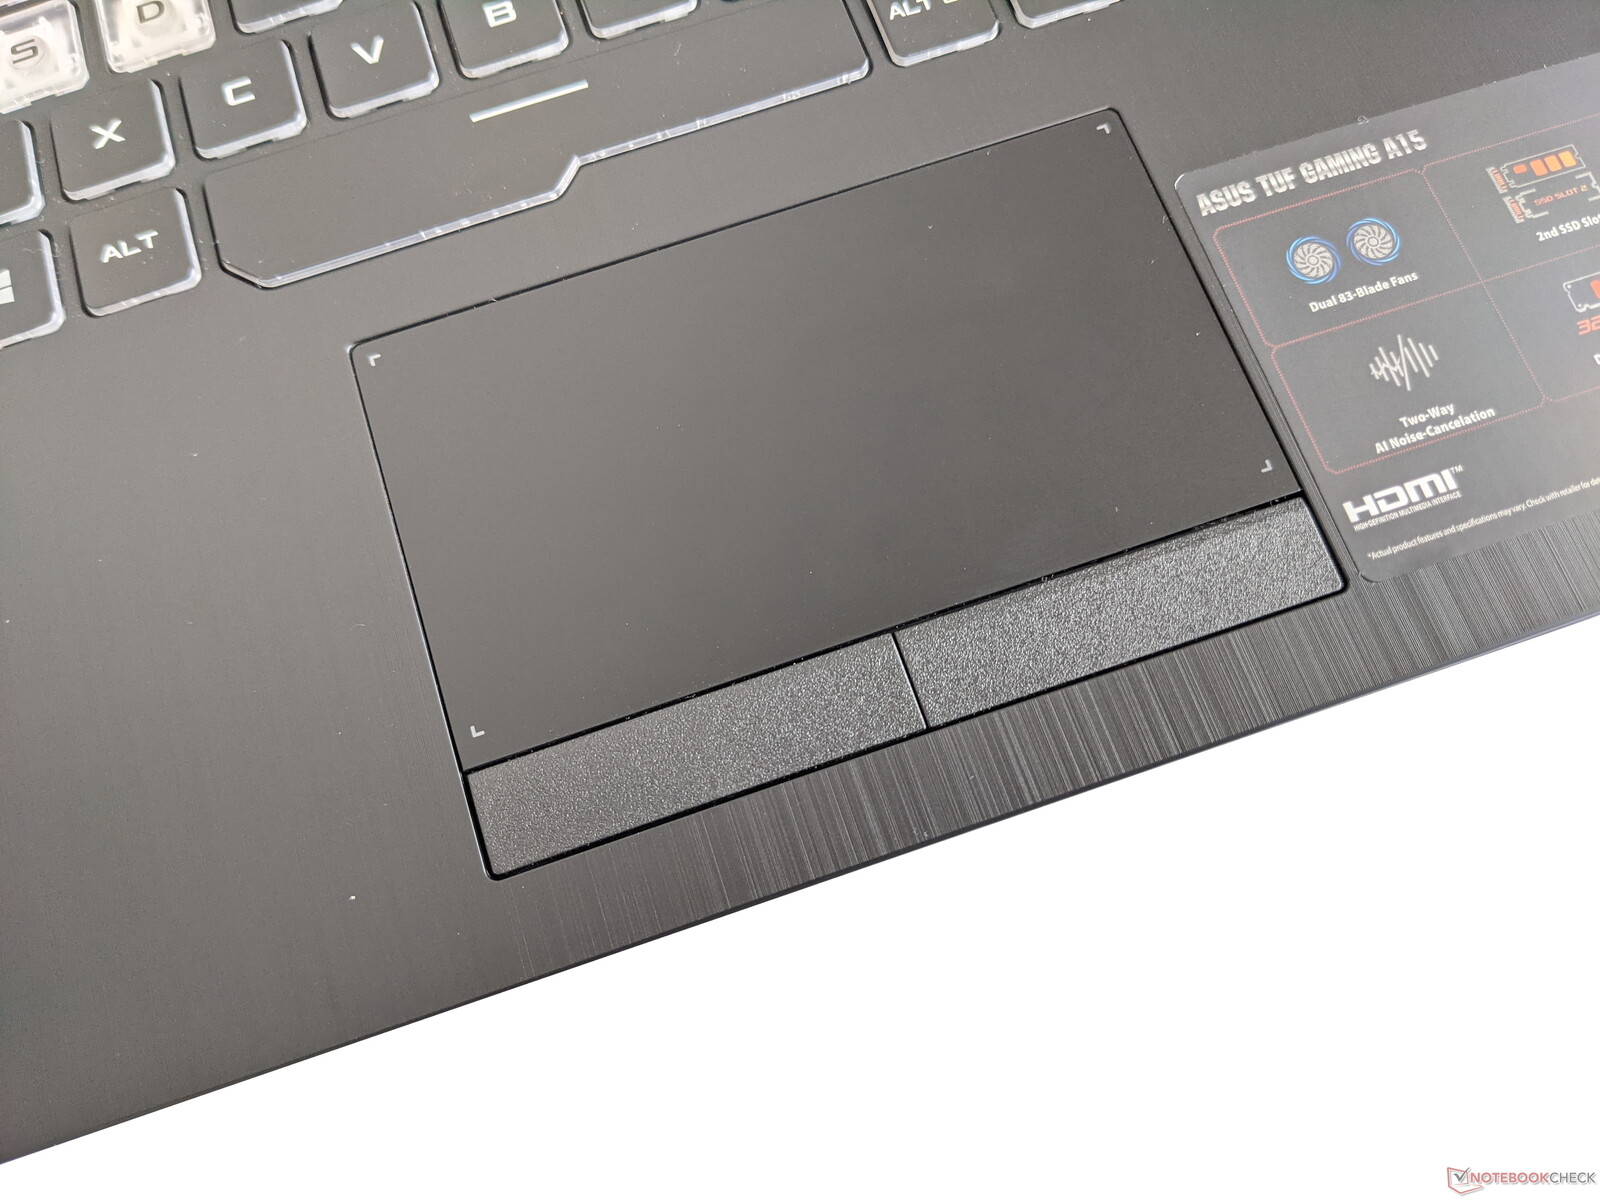
Touchpad
O Asus opta por um touchpad clássico com botões do mouse separados como substituto do mouse. Estes botões têm um ponto de pressão suave, mas acionam de forma confiável. O touchpad também responde com precisão ao toque e é bem adequado para navegar no ponteiro do mouse

Visor - 360 Hz e forte contraste
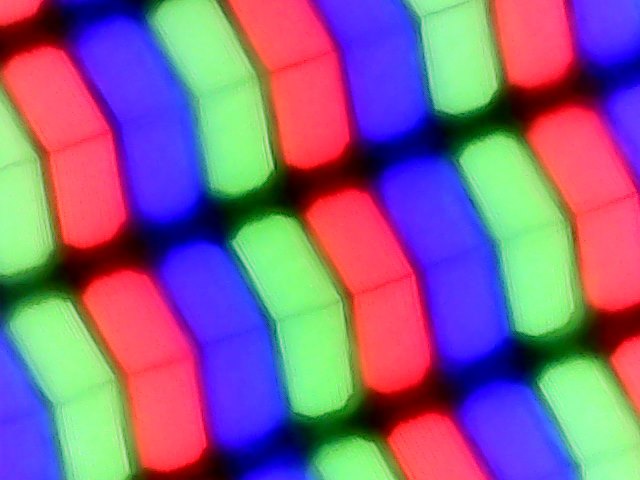
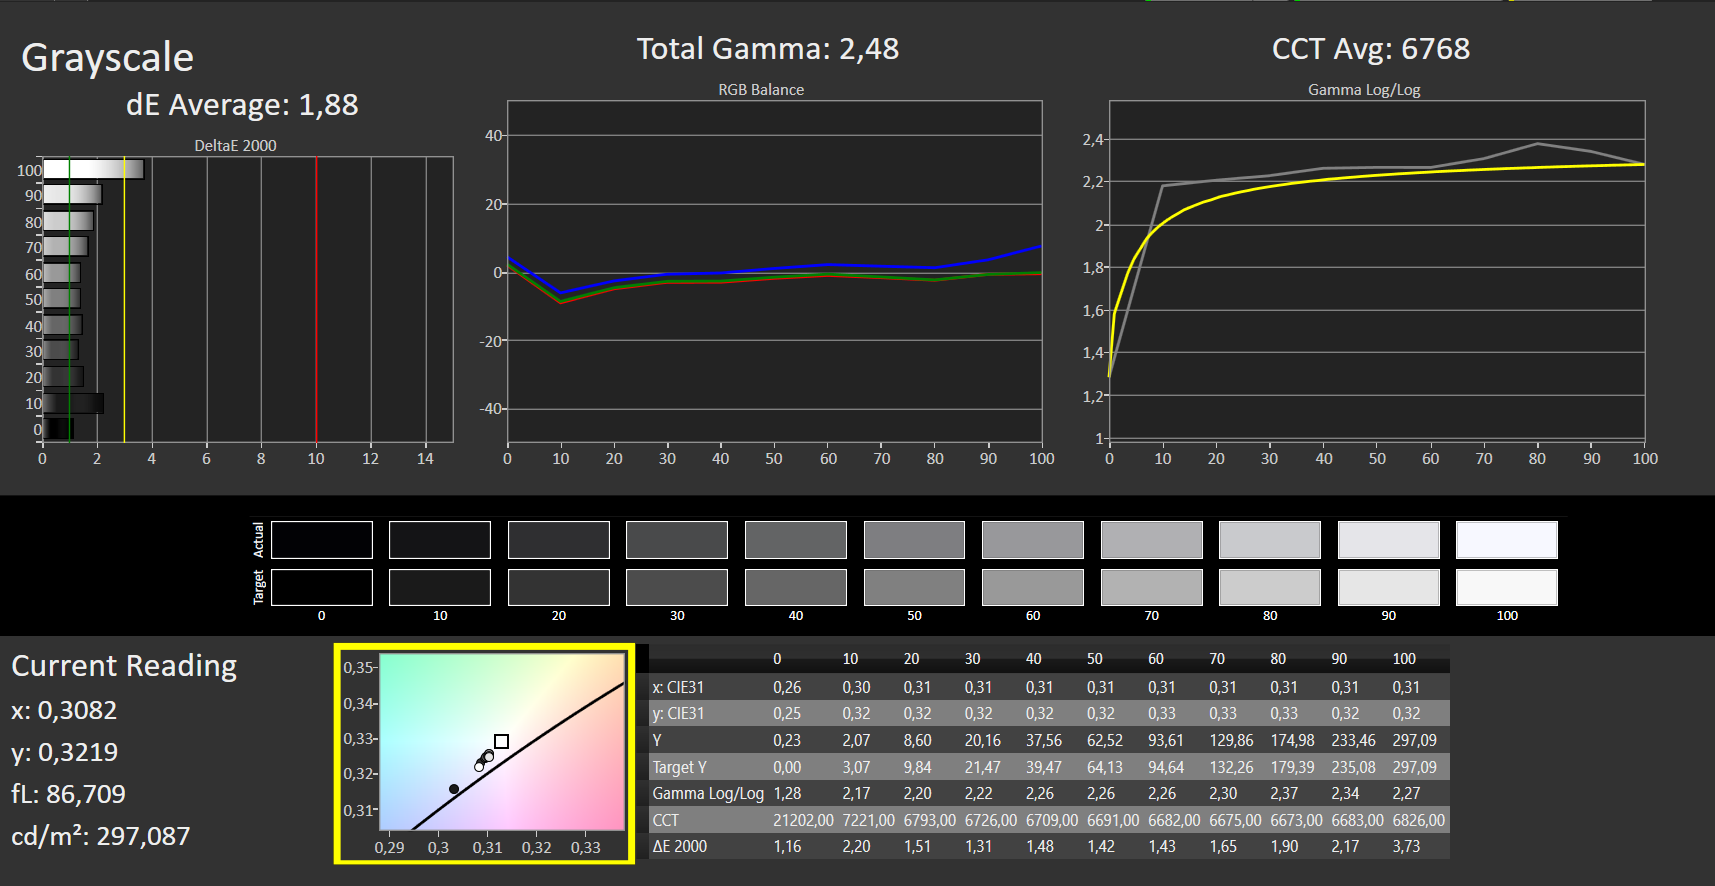
A tela do Asus TUF Gaming A15 consiste em um painel IPS de 15 polegadas que oferece uma resolução de 1920x1080 pixels, assim como uma taxa de atualização de 240 Hz. O Adaptive Sync também é suportado. A luminosidade máxima de 268 cd/m² em média está no meio do nosso campo de teste. O mesmo é válido para a distribuição de brilho de 84%. Outras variantes de exibição não são oferecidas pela Asus.
PWM a uma freqüência de 1.250 MHz é usado para o controle de brilho. Mas como isto só tem efeito a partir de níveis de brilho de 20%, deve ser possível usar o display sem problemas, mesmo com olhos sensíveis.
| |||||||||||||||||||||||||
iluminação: 84 %
iluminação com acumulador: 297 cd/m²
Contraste: 1350:1 (Preto: 0.22 cd/m²)
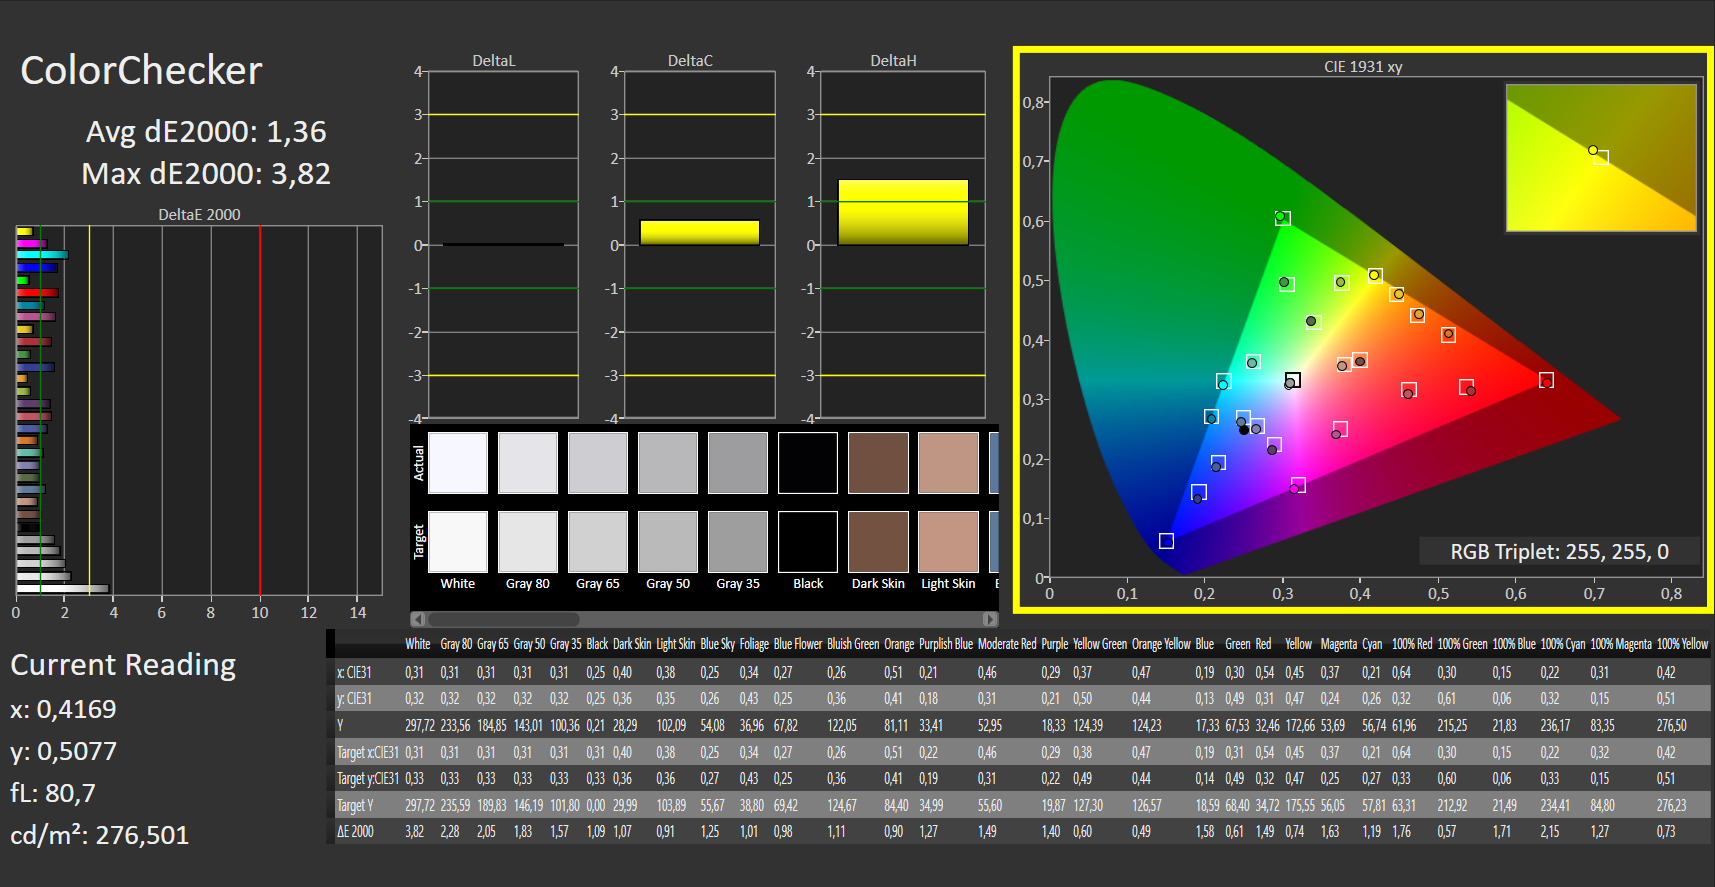
ΔE ColorChecker Calman: 1.36 | ∀{0.5-29.43 Ø4.73}
ΔE Greyscale Calman: 1.88 | ∀{0.09-98 Ø4.97}
99% sRGB (Argyll 1.6.3 3D)
63% AdobeRGB 1998 (Argyll 1.6.3 3D)
Gamma: 2.48
CCT: 6768 K
| Asus TUF Gaming A15 FA506QR-AZ061T Sharp SHP1532, IPS, 1920x1080, 15.6" | Asus TUF Gaming F15 FX506HM Chi Mei N156HRA-EA1, IPS, 1920x1080, 15.6" | Alienware m15 R5 Ryzen Edition B156HAN, IPS, 1920x1080, 15.6" | Aorus 15P XC Sharp LQ156M1JW03, IPS, 1920x1080, 15.6" | MSI GF65 Thin 10UE AU Optronics B156HAN08.4, IPS, 1920x1080, 15.6" | |
|---|---|---|---|---|---|
| Display | |||||
| Display P3 Coverage (%) | 41.9 | 67.2 | 37.65 | ||
| sRGB Coverage (%) | 62.9 | 98.7 | 56.3 | ||
| AdobeRGB 1998 Coverage (%) | 43.3 | 68.6 | 38.9 | ||
| Response Times | -154% | 31% | -7% | -251% | |
| Response Time Grey 50% / Grey 80% * (ms) | 12 ? | 28.4 ? -137% | 4 ? 67% | 11.2 ? 7% | 36.8 ? -207% |
| Response Time Black / White * (ms) | 8 ? | 21.6 ? -170% | 8.4 ? -5% | 9.6 ? -20% | 31.6 ? -295% |
| PWM Frequency (Hz) | 1250 ? | 24040 ? | |||
| Screen | -110% | -14% | 3% | -87% | |
| Brightness middle (cd/m²) | 297 | 268.3 -10% | 329 11% | 298 0% | 266.5 -10% |
| Brightness (cd/m²) | 268 | 257 -4% | 321 20% | 278 4% | 262 -2% |
| Brightness Distribution (%) | 84 | 84 0% | 92 10% | 88 5% | 91 8% |
| Black Level * (cd/m²) | 0.22 | 0.34 -55% | 0.27 -23% | 0.29 -32% | 0.18 18% |
| Contrast (:1) | 1350 | 789 -42% | 1219 -10% | 1028 -24% | 1481 10% |
| Colorchecker dE 2000 * | 1.36 | 5.05 -271% | 2.78 -104% | 0.96 29% | 5.33 -292% |
| Colorchecker dE 2000 max. * | 3.82 | 15.43 -304% | 4.88 -28% | 3.22 16% | 18.28 -379% |
| Greyscale dE 2000 * | 1.88 | 5.5 -193% | 2.5 -33% | 1.3 31% | 4.5 -139% |
| Gamma | 2.48 89% | 2.35 94% | 2.106 104% | 2.242 98% | 2.35 94% |
| CCT | 6768 96% | 7392 88% | 6201 105% | 6519 100% | 6289 103% |
| Color Space (Percent of AdobeRGB 1998) (%) | 63 | 76 21% | 69 10% | 35.6 -43% | |
| Color Space (Percent of sRGB) (%) | 99 | 99 0% | 91 -8% | 55.8 -44% | |
| Colorchecker dE 2000 calibrated * | 3.21 | 1.63 | 0.83 | 4.36 | |
| Média Total (Programa/Configurações) | -132% /
-119% | 9% /
-6% | -2% /
2% | -169% /
-115% |
* ... menor é melhor
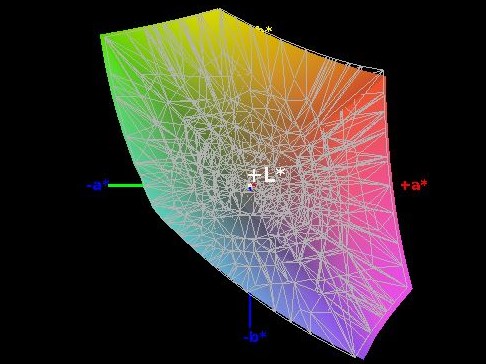
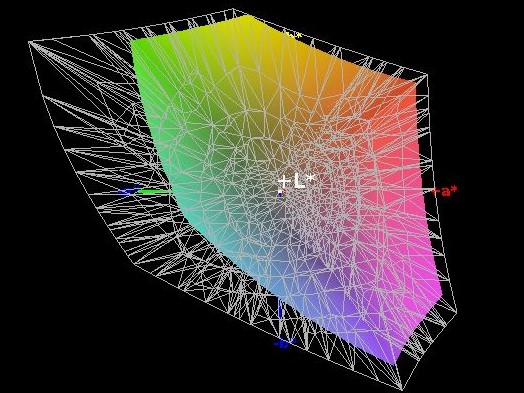
Nossas medidas mostram que a exibição do Asus TUF Gaming A15 tem uma boa relação de contraste de 1.350:1 e um nível de preto apenas ligeiramente elevado de 0,22 cd/m². A cobertura de espaço de cor é muito boa a 99% (sRGB) e 63% (AdobeRGB).
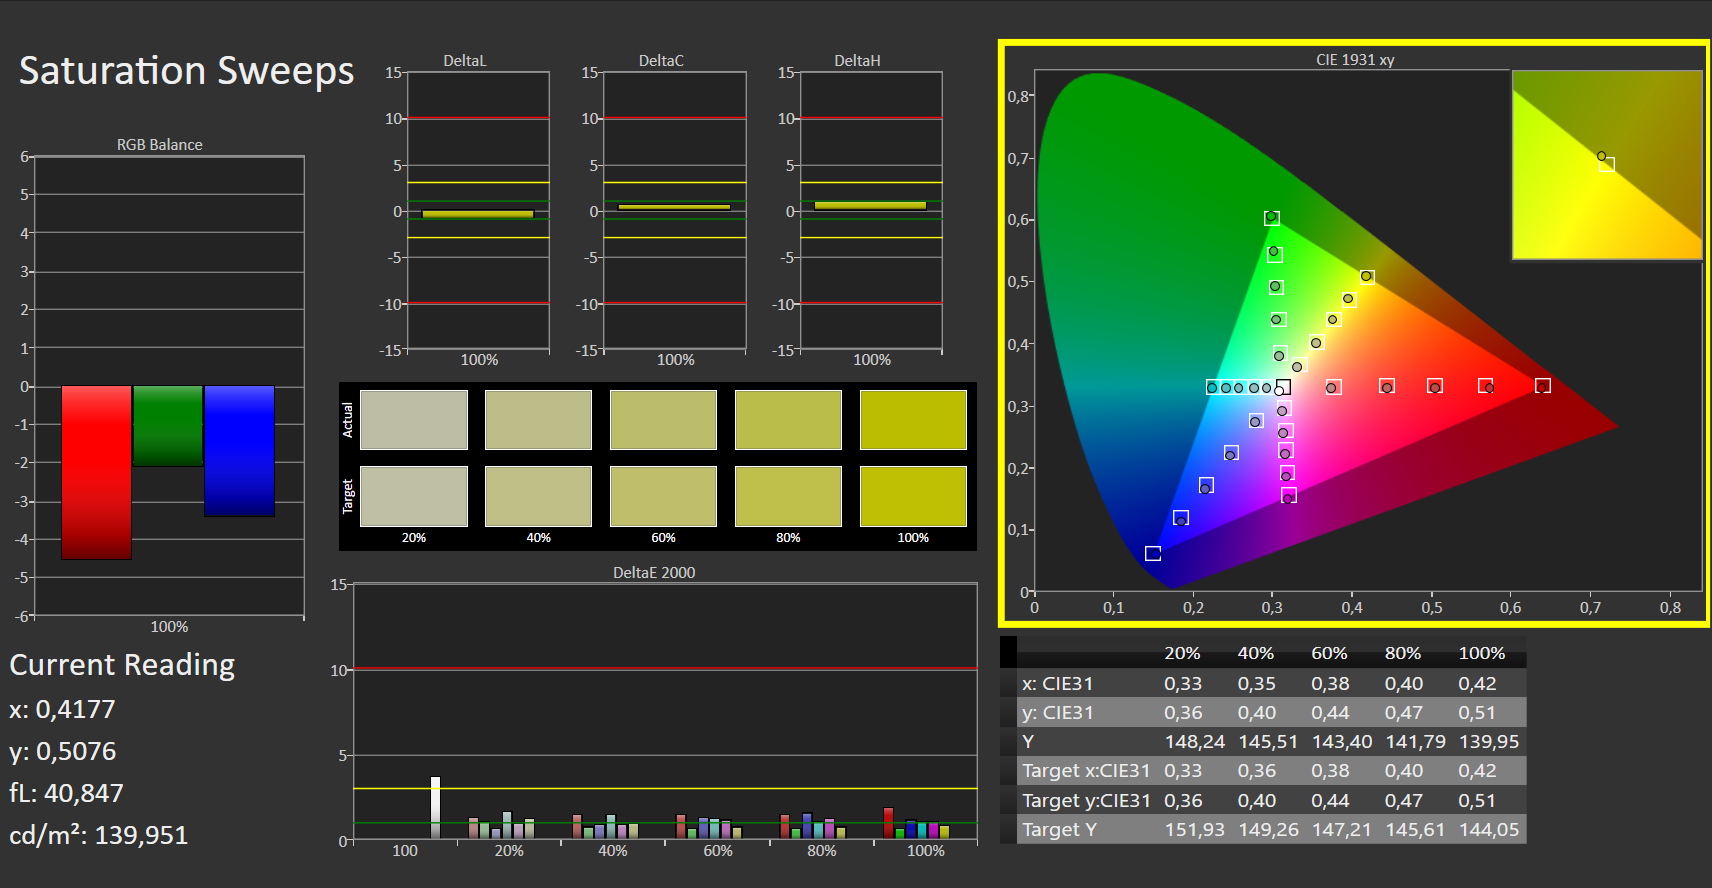
A análise do CalMAN também mostra que a tela já reproduz cores de uma forma muito equilibrada fora da caixa. Conseqüentemente, a calibração leva apenas a uma ligeira melhoria. O arquivo ICC correspondente pode ser baixado na janela localizada na parte superior, à direita do gráfico de distribuição da luminosidade do display
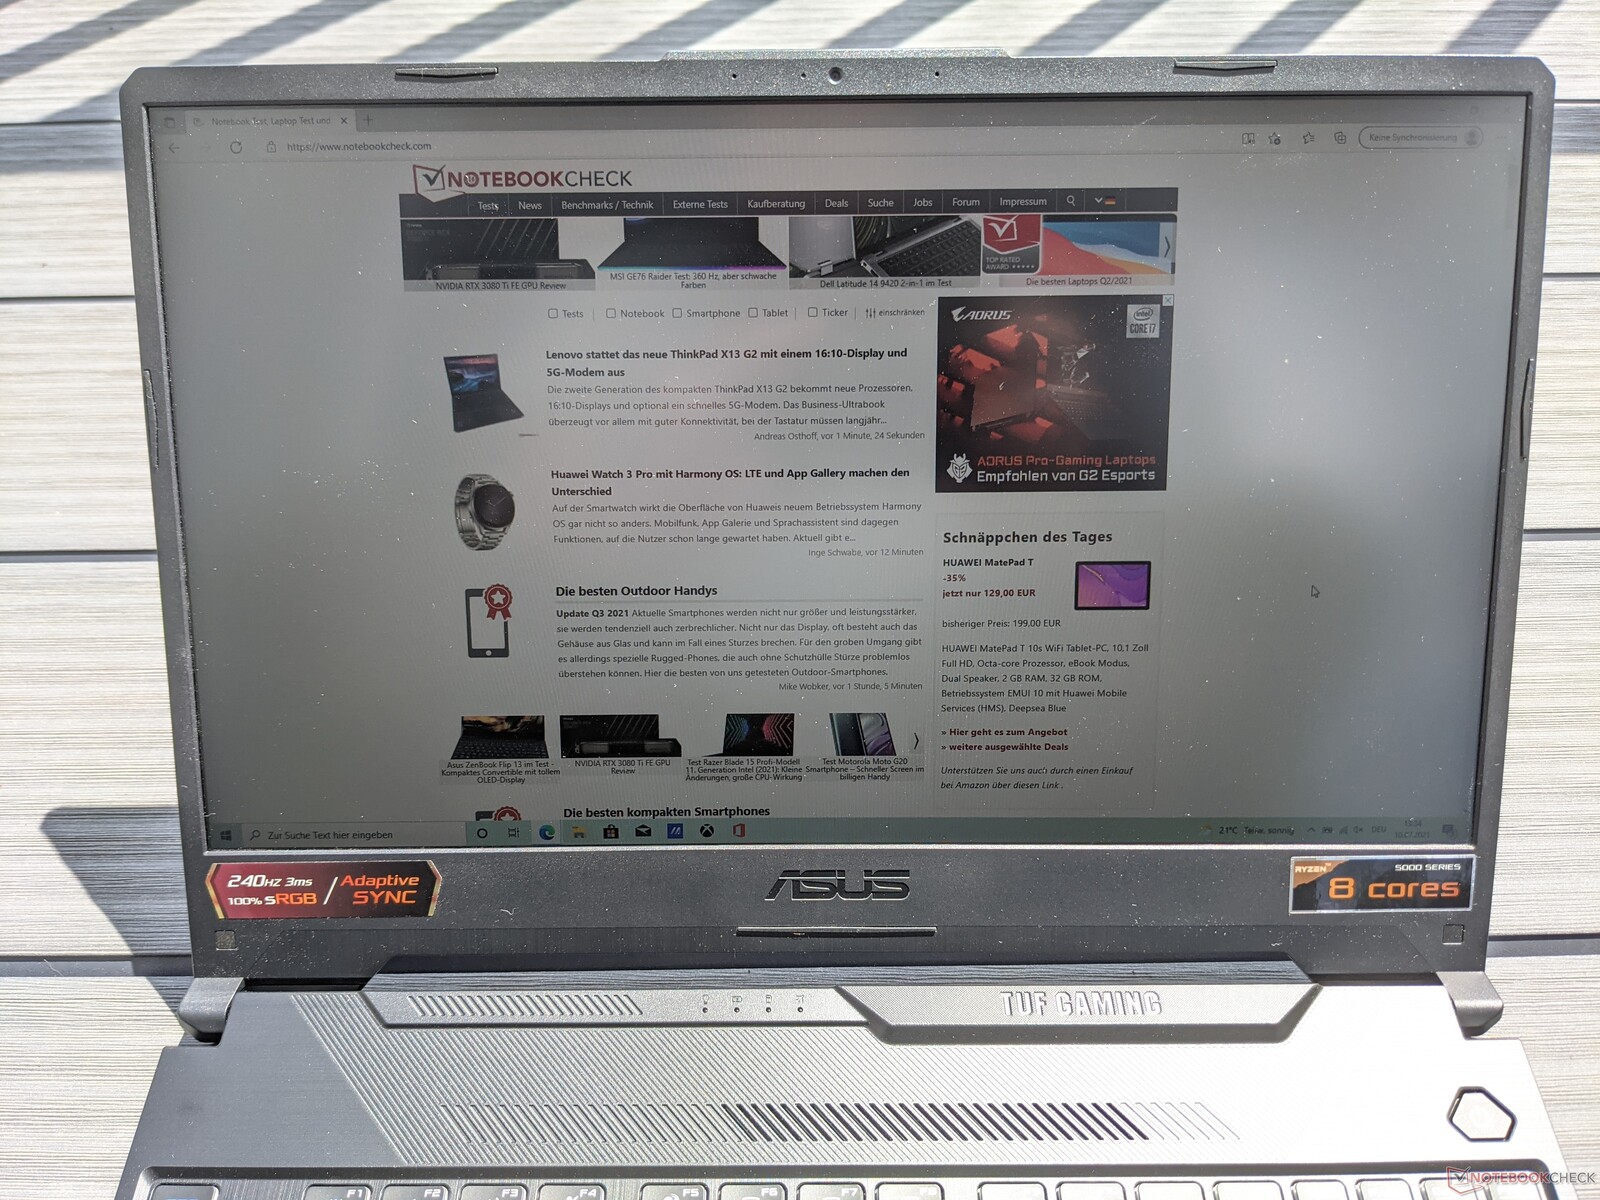
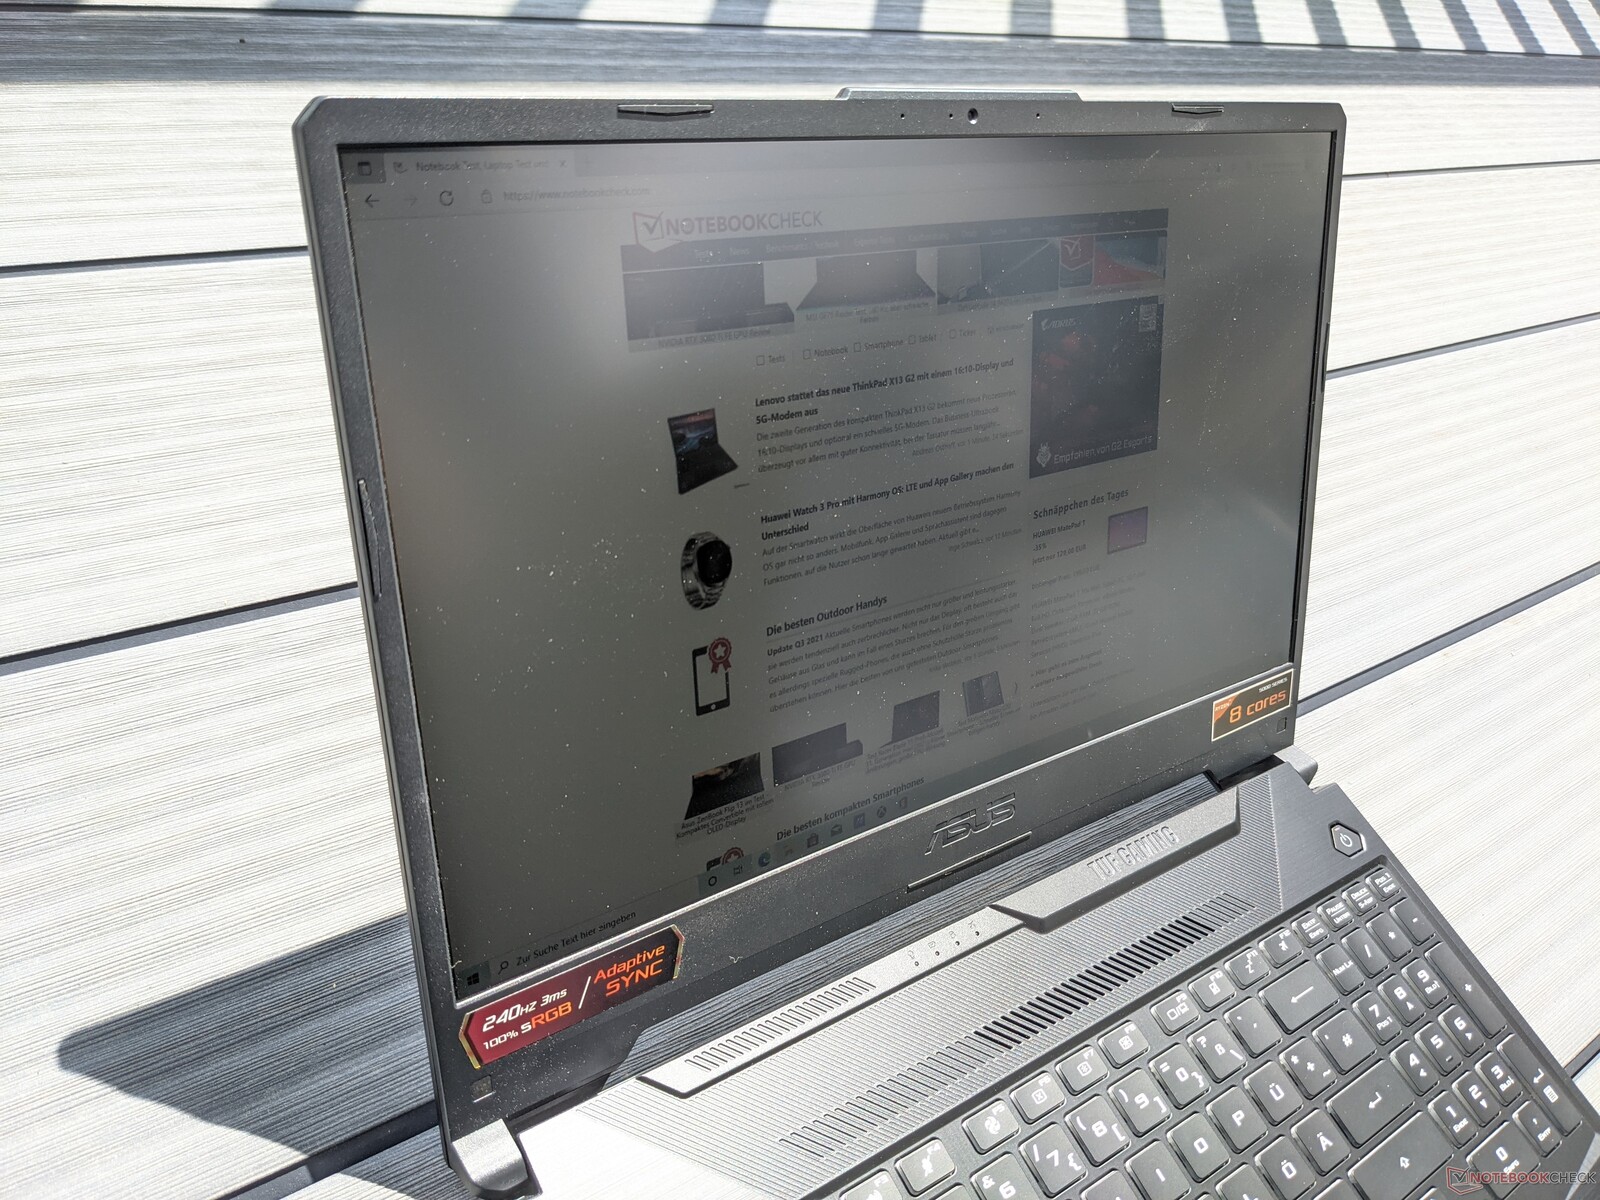
O TUF Gaming A15 pode ser usado ao ar livre desde que os lugares à sombra sejam priorizados. O brilho da tela não é suficiente para exibir o conteúdo de forma legível sob a luz direta do sol
Exibir tempos de resposta
| ↔ Tempo de resposta preto para branco | ||
|---|---|---|
| 8 ms ... ascensão ↗ e queda ↘ combinadas | ↗ 4 ms ascensão |  |
| ↘ 4 ms queda | ||
| A tela mostra taxas de resposta rápidas em nossos testes e deve ser adequada para jogos. Em comparação, todos os dispositivos testados variam de 0.1 (mínimo) a 240 (máximo) ms. » 22 % de todos os dispositivos são melhores. Isso significa que o tempo de resposta medido é melhor que a média de todos os dispositivos testados (19.9 ms). | ||
| ↔ Tempo de resposta 50% cinza a 80% cinza | ||
| 12 ms ... ascensão ↗ e queda ↘ combinadas | ↗ 6 ms ascensão |  |
| ↘ 6 ms queda | ||
| A tela mostra boas taxas de resposta em nossos testes, mas pode ser muito lenta para jogadores competitivos. Em comparação, todos os dispositivos testados variam de 0.165 (mínimo) a 636 (máximo) ms. » 25 % de todos os dispositivos são melhores. Isso significa que o tempo de resposta medido é melhor que a média de todos os dispositivos testados (31.1 ms). | ||
Cintilação da tela / PWM (modulação por largura de pulso)
| Tela tremeluzindo/PWM detectado | 1250 Hz | ≤ 20 % configuração de brilho |  |
A luz de fundo da tela pisca em 1250 Hz (pior caso, por exemplo, utilizando PWM) Cintilação detectada em uma configuração de brilho de 20 % e abaixo. Não deve haver cintilação ou PWM acima desta configuração de brilho. A frequência de 1250 Hz é bastante alta, então a maioria dos usuários sensíveis ao PWM não deve notar nenhuma oscilação. [pwm_comparison] Em comparação: 52 % de todos os dispositivos testados não usam PWM para escurecer a tela. Se PWM foi detectado, uma média de 7794 (mínimo: 5 - máximo: 343500) Hz foi medida. | |||
O painel IPS do computador portátil Asus é muito estável em ângulo de visão. O conteúdo da imagem pode ser lido de quase qualquer ângulo sem parecer distorcido ou mostrar cores incorretas

Desempenho - Poderoso laptop para jogos com processador AMD
A Asus posiciona o TUF Gaming A15 como um laptop de nível básico e o equipam com o hardware correspondente. Embora seja muito bem adequado para jogos modernos, as opções de configuração disponíveis são mais limitadas do que com laptops mais caros. Por exemplo, além da configuração testada aqui, há apenas uma outra variante disponível na forma doAsus TUF Gaming F15 equipado com uma CPU Intel
Processador
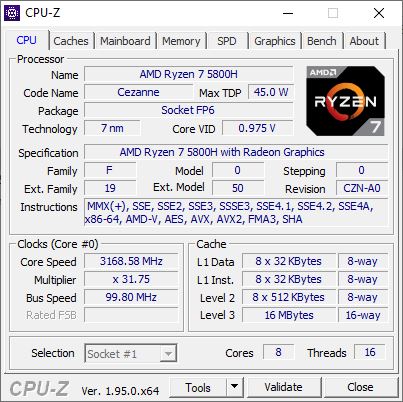
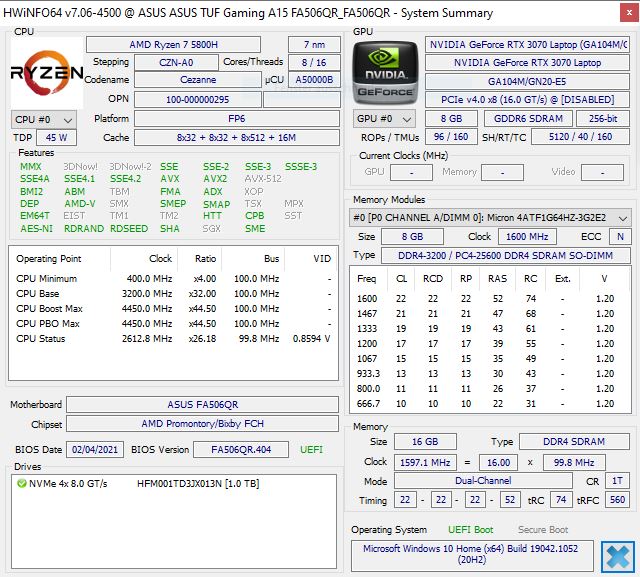
OAMD Ryzen 7 5800Husado aqui é um processador de octa-coro que pode lidar com até 16 tarefas simultaneamente. Suas taxas de relógio estão entre 3,2 e 4,4 GHz, e a duração para a qual as taxas máximas de relógio podem ser mantidas depende muito do sistema de resfriamento. O consumo de energia a curto prazo é configurado a 65 watts, enquanto oRyzen 7 5800Hno
TUF Gaming A15 pode operar a 35 watts em uma base de longo prazo.Como mostra nosso teste de resistência Cinebench R15, a CPU pode manter seu desempenho por um período prolongado de tempo antes que o desempenho caia cerca de 8%. Este não é o caso de dispositivos como oAlienware m15e oTUF Gaming F15quando o desempenho inicial é o mesmo. Nos benchmarks individuais, a CPU atinge taxas dentro da faixa superior do nosso campo de teste.
Cinebench R20: CPU (Single Core) | CPU (Multi Core)
Cinebench R15: CPU Single 64Bit | CPU Multi 64Bit
Blender: v2.79 BMW27 CPU
7-Zip 18.03: 7z b 4 -mmt1 | 7z b 4
Geekbench 5.5: Single-Core | Multi-Core
HWBOT x265 Benchmark v2.2: 4k Preset
LibreOffice : 20 Documents To PDF
R Benchmark 2.5: Overall mean
| Cinebench R23 / Single Core | |
| Média da turma Gaming (1166 - 2356, n=112, últimos 2 anos) | |
| Asus TUF Gaming F15 FX506HM | |
| Alienware m15 R5 Ryzen Edition | |
| Média AMD Ryzen 7 5800H (1294 - 1441, n=29) | |
| MSI GF65 Thin 10UE | |
| Aorus 15P XC | |
| Cinebench R23 / Multi Core | |
| Média da turma Gaming (10488 - 40970, n=112, últimos 2 anos) | |
| Asus TUF Gaming F15 FX506HM | |
| Alienware m15 R5 Ryzen Edition | |
| Média AMD Ryzen 7 5800H (8812 - 13214, n=29) | |
| Aorus 15P XC | |
| MSI GF65 Thin 10UE | |
| Cinebench R20 / CPU (Single Core) | |
| Média da turma Gaming (442 - 895, n=111, últimos 2 anos) | |
| Asus TUF Gaming F15 FX506HM | |
| Alienware m15 R5 Ryzen Edition | |
| Asus TUF Gaming A15 FA506QR-AZ061T | |
| Média AMD Ryzen 7 5800H (502 - 560, n=30) | |
| MSI GF65 Thin 10UE | |
| Aorus 15P XC | |
| Cinebench R20 / CPU (Multi Core) | |
| Média da turma Gaming (4029 - 16108, n=111, últimos 2 anos) | |
| Asus TUF Gaming F15 FX506HM | |
| Alienware m15 R5 Ryzen Edition | |
| Média AMD Ryzen 7 5800H (3430 - 5020, n=31) | |
| Asus TUF Gaming A15 FA506QR-AZ061T | |
| Aorus 15P XC | |
| MSI GF65 Thin 10UE | |
| Cinebench R15 / CPU Single 64Bit | |
| Média da turma Gaming (188.8 - 343, n=111, últimos 2 anos) | |
| Asus TUF Gaming A15 FA506QR-AZ061T | |
| Alienware m15 R5 Ryzen Edition | |
| Asus TUF Gaming F15 FX506HM | |
| Média AMD Ryzen 7 5800H (209 - 234, n=29) | |
| MSI GF65 Thin 10UE | |
| Aorus 15P XC | |
| Cinebench R15 / CPU Multi 64Bit | |
| Média da turma Gaming (1578 - 6271, n=111, últimos 2 anos) | |
| Asus TUF Gaming F15 FX506HM | |
| Asus TUF Gaming A15 FA506QR-AZ061T | |
| Alienware m15 R5 Ryzen Edition | |
| Média AMD Ryzen 7 5800H (1487 - 2119, n=28) | |
| Aorus 15P XC | |
| MSI GF65 Thin 10UE | |
| Blender / v2.79 BMW27 CPU | |
| MSI GF65 Thin 10UE | |
| Aorus 15P XC | |
| Asus TUF Gaming A15 FA506QR-AZ061T | |
| Média AMD Ryzen 7 5800H (237 - 340, n=29) | |
| Alienware m15 R5 Ryzen Edition | |
| Asus TUF Gaming F15 FX506HM | |
| Média da turma Gaming (80 - 330, n=109, últimos 2 anos) | |
| 7-Zip 18.03 / 7z b 4 -mmt1 | |
| Média da turma Gaming (4199 - 7436, n=110, últimos 2 anos) | |
| Asus TUF Gaming F15 FX506HM | |
| Alienware m15 R5 Ryzen Edition | |
| Asus TUF Gaming A15 FA506QR-AZ061T | |
| Média AMD Ryzen 7 5800H (5038 - 5632, n=29) | |
| Aorus 15P XC | |
| MSI GF65 Thin 10UE | |
| 7-Zip 18.03 / 7z b 4 | |
| Média da turma Gaming (33491 - 148086, n=110, últimos 2 anos) | |
| Média AMD Ryzen 7 5800H (45773 - 59986, n=28) | |
| Alienware m15 R5 Ryzen Edition | |
| Asus TUF Gaming A15 FA506QR-AZ061T | |
| Asus TUF Gaming F15 FX506HM | |
| Aorus 15P XC | |
| MSI GF65 Thin 10UE | |
| Geekbench 5.5 / Single-Core | |
| Média da turma Gaming (986 - 2474, n=110, últimos 2 anos) | |
| Alienware m15 R5 Ryzen Edition | |
| Média AMD Ryzen 7 5800H (1336 - 1505, n=28) | |
| Asus TUF Gaming A15 FA506QR-AZ061T | |
| MSI GF65 Thin 10UE | |
| Aorus 15P XC | |
| Geekbench 5.5 / Multi-Core | |
| Média da turma Gaming (6460 - 27010, n=110, últimos 2 anos) | |
| Média AMD Ryzen 7 5800H (6551 - 9062, n=28) | |
| Aorus 15P XC | |
| Asus TUF Gaming A15 FA506QR-AZ061T | |
| Alienware m15 R5 Ryzen Edition | |
| MSI GF65 Thin 10UE | |
| HWBOT x265 Benchmark v2.2 / 4k Preset | |
| Média da turma Gaming (11.5 - 44.3, n=110, últimos 2 anos) | |
| Asus TUF Gaming F15 FX506HM | |
| Alienware m15 R5 Ryzen Edition | |
| Média AMD Ryzen 7 5800H (11.6 - 16.1, n=29) | |
| Asus TUF Gaming A15 FA506QR-AZ061T | |
| Aorus 15P XC | |
| MSI GF65 Thin 10UE | |
| LibreOffice / 20 Documents To PDF | |
| Média AMD Ryzen 7 5800H (47.4 - 113, n=29) | |
| Alienware m15 R5 Ryzen Edition | |
| Aorus 15P XC | |
| Média da turma Gaming (19 - 88.8, n=110, últimos 2 anos) | |
| Asus TUF Gaming A15 FA506QR-AZ061T | |
| MSI GF65 Thin 10UE | |
| Asus TUF Gaming F15 FX506HM | |
| R Benchmark 2.5 / Overall mean | |
| MSI GF65 Thin 10UE | |
| Aorus 15P XC | |
| Asus TUF Gaming F15 FX506HM | |
| Média AMD Ryzen 7 5800H (0.511 - 0.559, n=28) | |
| Alienware m15 R5 Ryzen Edition | |
| Asus TUF Gaming A15 FA506QR-AZ061T | |
| Média da turma Gaming (0.3439 - 0.759, n=111, últimos 2 anos) | |
* ... menor é melhor
Desempenho do sistema
No teste PCMark 10 para avaliar o desempenho do sistema, o Asus TUF Gaming A15 ocupa o primeiro lugar em nosso campo de teste. Nas disciplinas individuais, ele pontua o maior resultado no teste "Produtividade", enquanto só é superado peloTUF Gaming F15na
pontuação "Essentials". O laptop para jogos proporciona uma operação muito suave no uso diário. Não notamos nenhuma micro gagueira ou algo parecido durante o período do teste.O desempenho que pode ser esperado de outros laptops em comparação pode ser encontrado em nosso artigoCPU Benchmarks article.
| PCMark 10 / Score | |
| Média da turma Gaming (5828 - 11574, n=95, últimos 2 anos) | |
| Asus TUF Gaming A15 FA506QR-AZ061T | |
| Asus TUF Gaming F15 FX506HM | |
| Média AMD Ryzen 7 5800H, NVIDIA GeForce RTX 3070 Laptop GPU (6717 - 6983, n=6) | |
| Alienware m15 R5 Ryzen Edition | |
| Aorus 15P XC | |
| MSI GF65 Thin 10UE | |
| PCMark 10 / Essentials | |
| Média da turma Gaming (8810 - 12600, n=99, últimos 2 anos) | |
| Asus TUF Gaming F15 FX506HM | |
| Asus TUF Gaming A15 FA506QR-AZ061T | |
| Média AMD Ryzen 7 5800H, NVIDIA GeForce RTX 3070 Laptop GPU (9548 - 10226, n=6) | |
| Alienware m15 R5 Ryzen Edition | |
| Aorus 15P XC | |
| MSI GF65 Thin 10UE | |
| PCMark 10 / Productivity | |
| Média da turma Gaming (6845 - 18766, n=97, últimos 2 anos) | |
| Asus TUF Gaming A15 FA506QR-AZ061T | |
| Média AMD Ryzen 7 5800H, NVIDIA GeForce RTX 3070 Laptop GPU (8849 - 9514, n=6) | |
| Alienware m15 R5 Ryzen Edition | |
| Asus TUF Gaming F15 FX506HM | |
| Aorus 15P XC | |
| MSI GF65 Thin 10UE | |
| PCMark 10 / Digital Content Creation | |
| Média da turma Gaming (7602 - 19657, n=97, últimos 2 anos) | |
| Aorus 15P XC | |
| Média AMD Ryzen 7 5800H, NVIDIA GeForce RTX 3070 Laptop GPU (8948 - 10389, n=6) | |
| Asus TUF Gaming F15 FX506HM | |
| Asus TUF Gaming A15 FA506QR-AZ061T | |
| Alienware m15 R5 Ryzen Edition | |
| MSI GF65 Thin 10UE | |
| PCMark 10 Score | 6917 pontos | |
Ajuda | ||
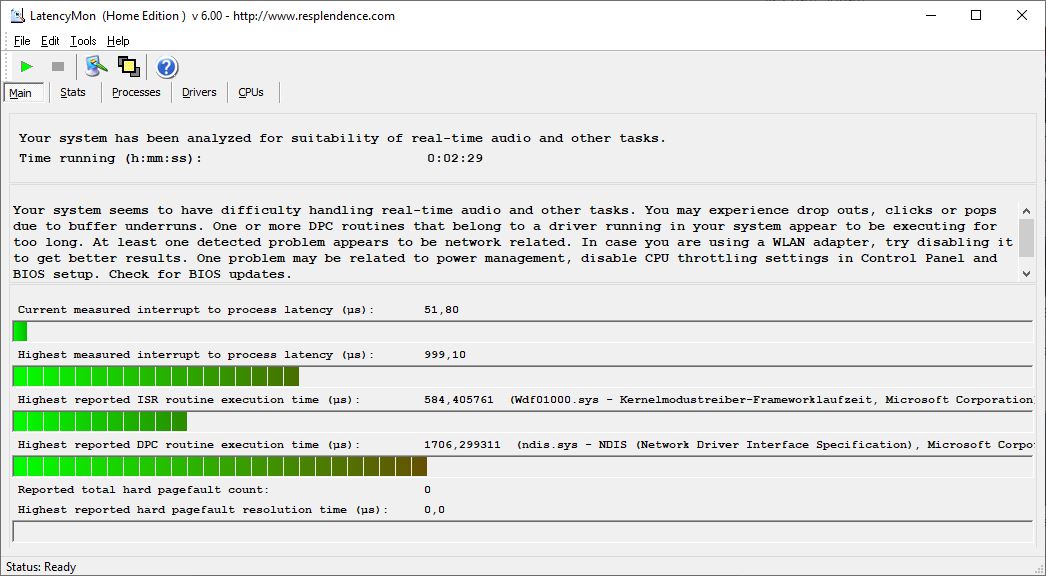
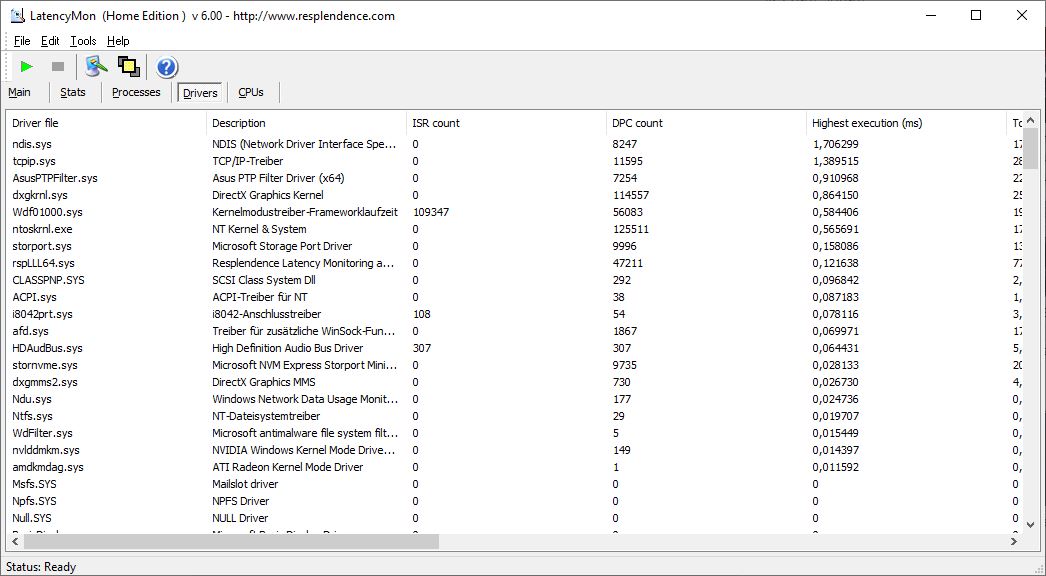
Latências DPC
No teste com LatencyMon, o laptop de jogos da Asus mostra apenas tempos de interrupção levemente elevados. Isto o torna adequado para aplicações em tempo real em uma extensão limitada
| DPC Latencies / LatencyMon - interrupt to process latency (max), Web, Youtube, Prime95 | |
| Asus TUF Gaming F15 FX506HM | |
| Aorus 15P XC | |
| Asus TUF Gaming A15 FA506QR-AZ061T | |
| MSI GF65 Thin 10UE | |
| Alienware m15 R5 Ryzen Edition | |
* ... menor é melhor
Armazenamento
A Asus instala um SSD de 1 TB da SK Hynix no TUF Gaming A15. Atinge velocidades de leitura e escrita muito boas nos pontos de referência de armazenamento, que estão ligeiramente acima do nível da concorrência.
Como outros dispositivos de armazenamento em massa foram capazes de funcionar em comparação está listado em nosso artigoHDD/SSD Benchmarks.
| Asus TUF Gaming A15 FA506QR-AZ061T SK Hynix HFM001TD3JX013N | Asus TUF Gaming F15 FX506HM SK Hynix HFM001TD3JX013N | Alienware m15 R5 Ryzen Edition Toshiba KBG40ZNS512G NVMe | Aorus 15P XC ESR512GTLCG-EAC-4 | MSI GF65 Thin 10UE Samsung SSD PM981 MZVLB1T0HALR | Média SK Hynix HFM001TD3JX013N | |
|---|---|---|---|---|---|---|
| CrystalDiskMark 5.2 / 6 | -6% | -27% | -8% | -11% | -2% | |
| Write 4K (MB/s) | 182.5 | 168.1 -8% | 116.9 -36% | 130.2 -29% | 157.3 -14% | 155.8 ? -15% |
| Read 4K (MB/s) | 73.2 | 65.1 -11% | 44.56 -39% | 45.47 -38% | 46.69 -36% | 57 ? -22% |
| Write Seq (MB/s) | 3005 | 2124 -29% | 1552 -48% | 2269 -24% | 2389 -20% | 3943 ? 31% |
| Read Seq (MB/s) | 2358 | 2204 -7% | 1682 -29% | 1643 -30% | 2196 -7% | 2180 ? -8% |
| Write 4K Q32T1 (MB/s) | 389.5 | 455.3 17% | 497.8 28% | 547 40% | 407.6 5% | 452 ? 16% |
| Read 4K Q32T1 (MB/s) | 463.8 | 465.6 0% | 436.8 -6% | 654 41% | 519 12% | 447 ? -4% |
| Write Seq Q32T1 (MB/s) | 3166 | 2911 -8% | 1461 -54% | 2512 -21% | 2401 -24% | 2859 ? -10% |
| Read Seq Q32T1 (MB/s) | 3590 | 3519 -2% | 2364 -34% | 3382 -6% | 3344 -7% | 3515 ? -2% |
| AS SSD | -22% | -91% | -12% | -27% | -17% | |
| Seq Read (MB/s) | 3133 | 2873 -8% | 2082 -34% | 2694 -14% | 3002 -4% | 2839 ? -9% |
| Seq Write (MB/s) | 2969 | 1619 -45% | 825 -72% | 2327 -22% | 2420 -18% | 1917 ? -35% |
| 4K Read (MB/s) | 55.2 | 57.5 4% | 42.41 -23% | 47.77 -13% | 48.46 -12% | 53 ? -4% |
| 4K Write (MB/s) | 129.7 | 149.6 15% | 98.3 -24% | 98.8 -24% | 114.3 -12% | 127.3 ? -2% |
| 4K-64 Read (MB/s) | 1891 | 1252 -34% | 1255 -34% | 1746 -8% | 1873 -1% | 1369 ? -28% |
| 4K-64 Write (MB/s) | 1795 | 2196 22% | 738 -59% | 2267 26% | 1882 5% | 1939 ? 8% |
| Access Time Read * (ms) | 0.052 | 0.04 23% | 0.109 -110% | 0.079 -52% | 0.045 13% | 0.0468 ? 10% |
| Access Time Write * (ms) | 0.028 | 0.082 -193% | 0.17 -507% | 0.039 -39% | 0.101 -261% | 0.0532 ? -90% |
| Score Read (Points) | 2259 | 1597 -29% | 1506 -33% | 2063 -9% | 2221 -2% | 1706 ? -24% |
| Score Write (Points) | 2221 | 2508 13% | 918 -59% | 2598 17% | 2238 1% | 2258 ? 2% |
| Score Total (Points) | 5630 | 4869 -14% | 3136 -44% | 5698 1% | 5565 -1% | 4797 ? -15% |
| Média Total (Programa/Configurações) | -14% /
-15% | -59% /
-64% | -10% /
-11% | -19% /
-20% | -10% /
-11% |
* ... menor é melhor

Continuous load read: DiskSpd Read Loop, Queue Depth 8
Placa gráfica
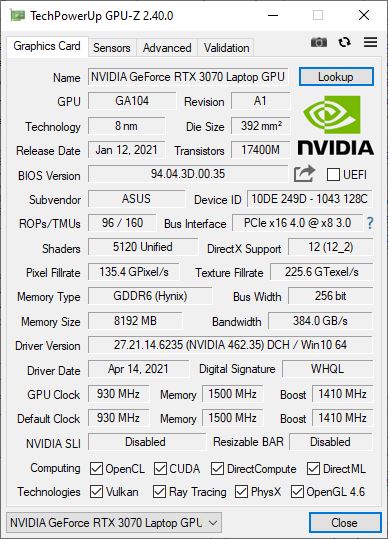
Asus usa umNvidia GeForce RTX 3070no
TUF Gaming A15. Esta placa gráfica é atualmente um dos modelos mais potentes disponíveis para laptops, embora o desempenho real dependa fortemente do TGP configurado. Esta pode chegar a 125 watts, mas é limitada a 90 watts na A15. Isto leva a valores no meio do nosso campo de teste em 3DMark benchmarks, o que fala por um bom desempenho nesta faixa de preço.O desempenho oferecido por outras placas gráficas pode ser encontrado em nosso artigoGPU Benchmarks.
| 3DMark 11 Performance | 23459 pontos | |
| 3DMark Cloud Gate Standard Score | 46591 pontos | |
| 3DMark Fire Strike Score | 20237 pontos | |
| 3DMark Time Spy Score | 8446 pontos | |
Ajuda | ||
Desempenho do jogo
ONvidia GeForce RTX 3070 construído aqui é muito bem adequado para jogos. Os últimos títulos são renderizados suavemente com resolução Full HD e configurações de alto detalhamento com altas taxas de quadros. Somente jogos muito exigentes, como o Cyberpunk 2077, podem experimentar taxas de quadros abaixo de 60 fps em configurações gráficas altas.
NossoartigoGPU Games mostra a performance que pode ser esperada em outros títulos.
| The Witcher 3 - 1920x1080 Ultra Graphics & Postprocessing (HBAO+) | |
| Média da turma Gaming (95 - 240, n=8, últimos 2 anos) | |
| Aorus 15P XC | |
| Média NVIDIA GeForce RTX 3070 Laptop GPU (34.9 - 109, n=52) | |
| Asus TUF Gaming A15 FA506QR-AZ061T | |
| Alienware m15 R5 Ryzen Edition | |
| Asus TUF Gaming F15 FX506HM | |
| MSI GF65 Thin 10UE | |
| Cyberpunk 2077 1.0 - 1920x1080 Ultra Preset | |
| Aorus 15P XC | |
| Média NVIDIA GeForce RTX 3070 Laptop GPU (50 - 70.5, n=11) | |
| Asus TUF Gaming A15 FA506QR-AZ061T | |
| Alienware m15 R5 Ryzen Edition | |
| Final Fantasy XV Benchmark - 1920x1080 High Quality | |
| Média da turma Gaming (41 - 215, n=103, últimos 2 anos) | |
| Média NVIDIA GeForce RTX 3070 Laptop GPU (27.9 - 107, n=49) | |
| Asus TUF Gaming A15 FA506QR-AZ061T | |
| Alienware m15 R5 Ryzen Edition | |
| Asus TUF Gaming F15 FX506HM | |
| MSI GF65 Thin 10UE | |
| Strange Brigade - 1920x1080 ultra AA:ultra AF:16 | |
| Média da turma Gaming (76.3 - 456, n=93, últimos 2 anos) | |
| Média NVIDIA GeForce RTX 3070 Laptop GPU (36.2 - 194, n=46) | |
| Asus TUF Gaming A15 FA506QR-AZ061T | |
| Alienware m15 R5 Ryzen Edition | |
| Asus TUF Gaming F15 FX506HM | |
| MSI GF65 Thin 10UE | |
O teste de resistência com o The Witcher 3 em configurações gráficas Ultra mostra que, embora o desempenho diminua um pouco com o tempo, o sistema também é capaz de se recuperar desta queda. Portanto, não são de se esperar quedas de desempenho mesmo durante longas sessões de jogo
The Witcher 3 FPS diagram
| baixo | média | alto | ultra | |
|---|---|---|---|---|
| GTA V (2015) | 174 | 141 | 83.1 | |
| The Witcher 3 (2015) | 78 | |||
| Dota 2 Reborn (2015) | 140 | 131 | 115 | 110 |
| Final Fantasy XV Benchmark (2018) | 152 | 106 | 80.1 | |
| X-Plane 11.11 (2018) | 92.7 | 81.4 | 68 | |
| Far Cry 5 (2018) | 127 | 106 | 104 | 100 |
| Strange Brigade (2018) | 272 | 170 | 152 | 139 |
| Cyberpunk 2077 1.0 (2020) | 97.3 | 76.8 | 64.6 | 57 |
Emissões - TUF Gaming A15 tem bons alto-falantes
Emissões sonoras
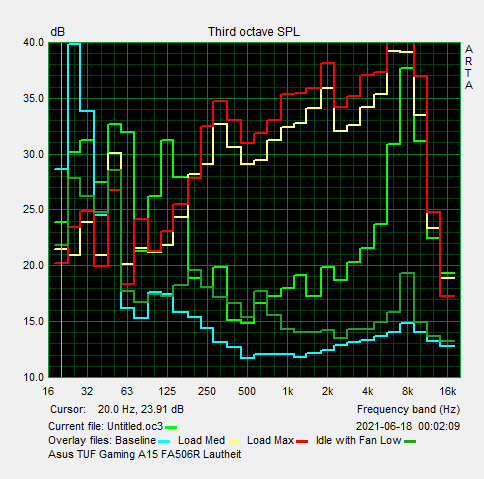
Os ventiladores no Asus TUF Gaming A15 atingem níveis de ruído de até 49 dB(A) e, conseqüentemente, são claramente audíveis sob carga pesada. Um ruído constante é produzido aqui, o que pode ser bem tolerado. A lamentação da bobina ocorreu muito raramente em nosso dispositivo de teste, mas desapareceu rapidamente
Barulho
| Ocioso |
| 26 / 26 / 27.4 dB |
| Carga |
| 46.6 / 49.3 dB |
 | ||
30 dB silencioso 40 dB(A) audível 50 dB(A) ruidosamente alto |
||
min: | ||
Temperatura
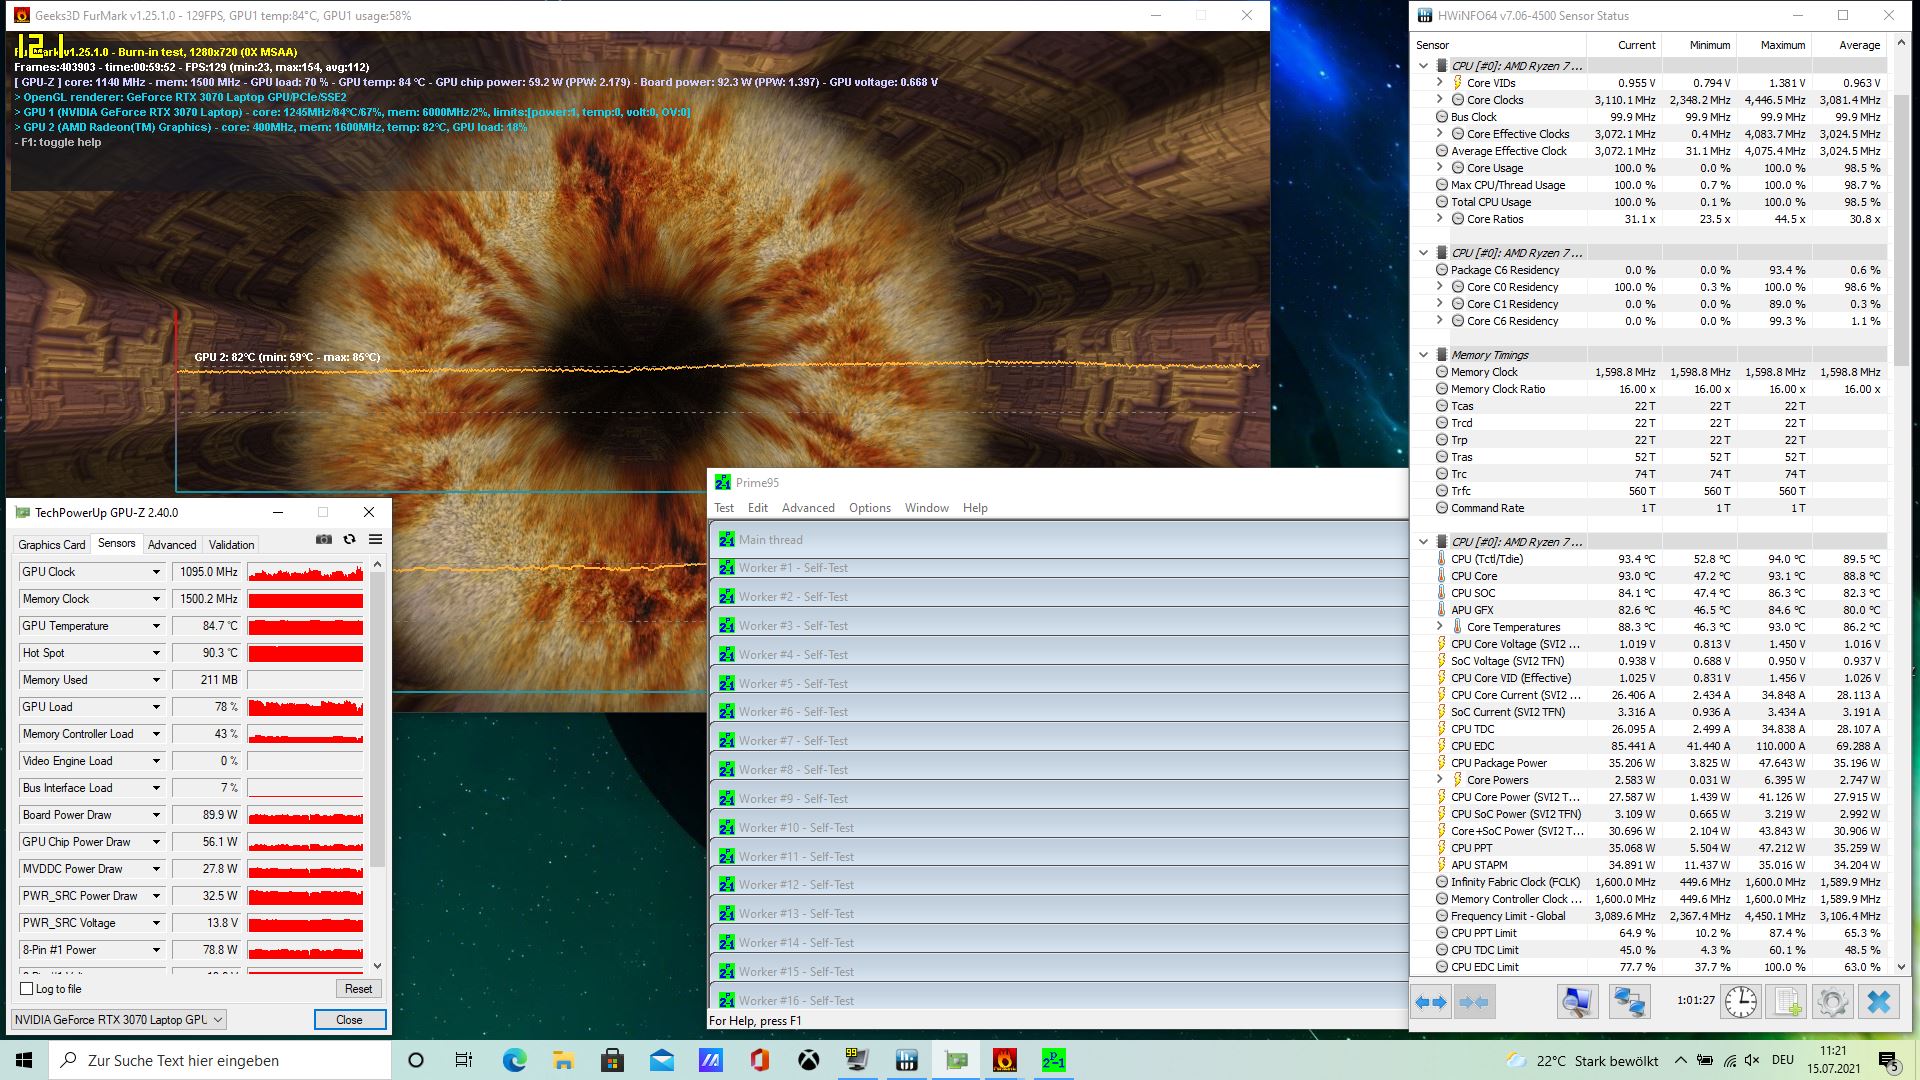
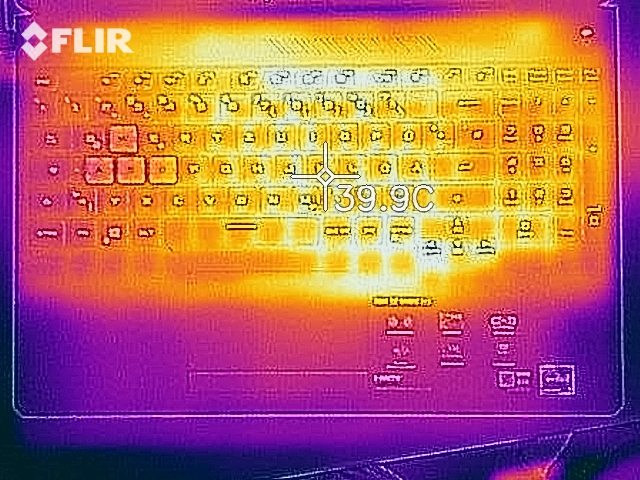
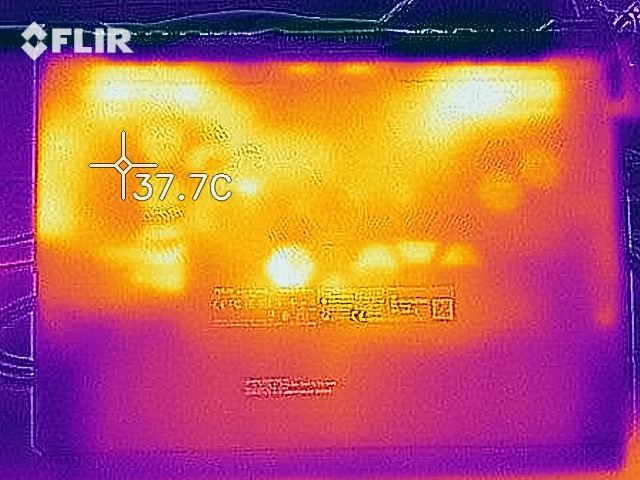
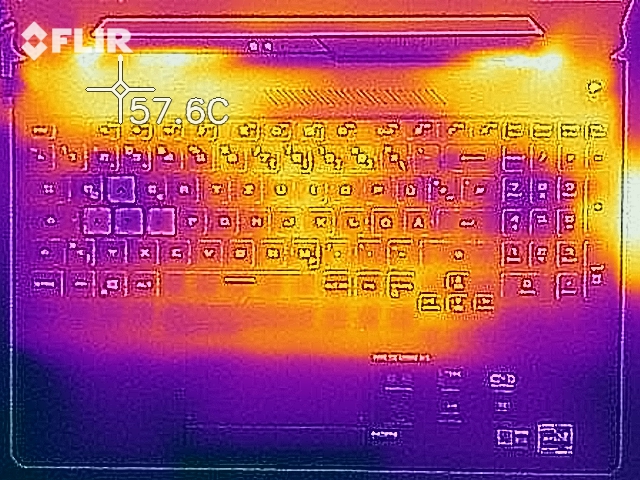
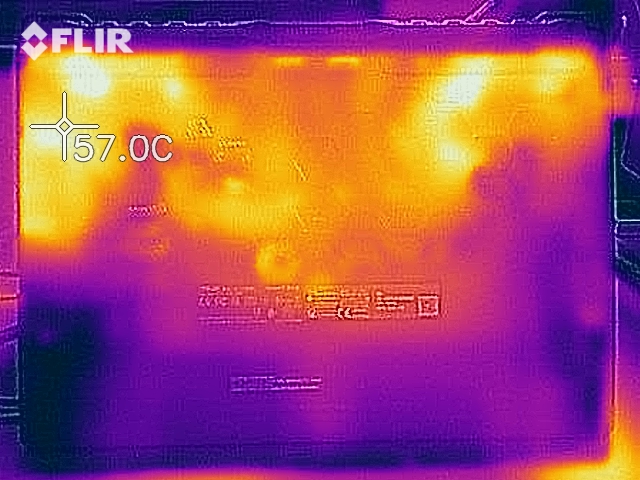
De acordo com nossas medidas, as superfícies do TUF Gaming A15 aquecem até 55,9 °C (~133 °F) sob carga. O ponto mais quente aqui é no canto posterior direito da parte inferior. Os descansos da palma da mão permanecem sempre suficientemente frios a temperaturas abaixo de 30 °C (~86 °F), de modo que o laptop permaneça utilizável o tempo todo
As temperaturas dentro da A15 aumentaram até 94 °C (~201 °F) durante nosso teste de resistência ao estresse de aproximadamente uma hora. No processo, as taxas do relógio caíram para cerca de 2,4 GHz, que está abaixo da velocidade do relógio de base de 3,2 GHz. Entretanto, o sistema ainda pode ser operado sem problemas e se estabilizou rapidamente novamente após o final do teste. Portanto, não são esperadas restrições devido a temperaturas excessivamente altas
(-) A temperatura máxima no lado superior é 46.7 °C / 116 F, em comparação com a média de 40.4 °C / 105 F , variando de 21.2 a 68.8 °C para a classe Gaming.
(-) A parte inferior aquece até um máximo de 55.9 °C / 133 F, em comparação com a média de 43.2 °C / 110 F
(±) Em uso inativo, a temperatura média para o lado superior é 33 °C / 91 F, em comparação com a média do dispositivo de 33.9 °C / ### class_avg_f### F.
(+) Os apoios para as mãos e o touchpad são mais frios que a temperatura da pele, com um máximo de 29.4 °C / 84.9 F e, portanto, são frios ao toque.
(±) A temperatura média da área do apoio para as mãos de dispositivos semelhantes foi 28.8 °C / 83.8 F (-0.6 °C / -1.1 F).
Oradores
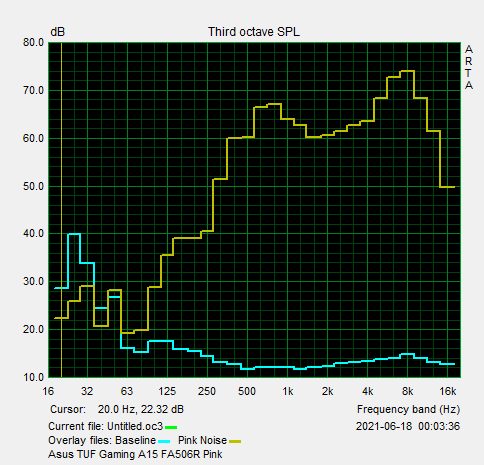
Os alto-falantes do TUF Gaming A15 oferecem um volume moderado e um espectro sonoro bastante amplo. Isto os torna adequados para consumir conteúdo de mídia, mas os alto-falantes externos ou fones de ouvido ainda são recomendados para ouvir música ou jogos
Asus TUF Gaming A15 FA506QR-AZ061T análise de áudio
(±) | o volume do alto-falante é médio, mas bom (###valor### dB)
Graves 100 - 315Hz
(-) | quase nenhum baixo - em média 22.4% menor que a mediana
(±) | a linearidade dos graves é média (10.8% delta para a frequência anterior)
Médios 400 - 2.000 Hz
(+) | médios equilibrados - apenas 2.4% longe da mediana
(+) | médios são lineares (5.9% delta para frequência anterior)
Altos 2 - 16 kHz
(±) | máximos mais altos - em média 5.8% maior que a mediana
(+) | os máximos são lineares (5.6% delta da frequência anterior)
Geral 100 - 16.000 Hz
(±) | a linearidade do som geral é média (20.1% diferença em relação à mediana)
Comparado com a mesma classe
» 71% de todos os dispositivos testados nesta classe foram melhores, 6% semelhantes, 23% piores
» O melhor teve um delta de 6%, a média foi 18%, o pior foi 132%
Comparado com todos os dispositivos testados
» 52% de todos os dispositivos testados foram melhores, 8% semelhantes, 40% piores
» O melhor teve um delta de 4%, a média foi 24%, o pior foi 134%
Aorus 15P XC análise de áudio
(+) | os alto-falantes podem tocar relativamente alto (###valor### dB)
Graves 100 - 315Hz
(-) | quase nenhum baixo - em média 20.8% menor que a mediana
(±) | a linearidade dos graves é média (10.8% delta para a frequência anterior)
Médios 400 - 2.000 Hz
(±) | médios mais altos - em média 7.1% maior que a mediana
(+) | médios são lineares (4.9% delta para frequência anterior)
Altos 2 - 16 kHz
(+) | agudos equilibrados - apenas 1.9% longe da mediana
(+) | os máximos são lineares (4.6% delta da frequência anterior)
Geral 100 - 16.000 Hz
(±) | a linearidade do som geral é média (17% diferença em relação à mediana)
Comparado com a mesma classe
» 45% de todos os dispositivos testados nesta classe foram melhores, 12% semelhantes, 43% piores
» O melhor teve um delta de 6%, a média foi 18%, o pior foi 132%
Comparado com todos os dispositivos testados
» 30% de todos os dispositivos testados foram melhores, 8% semelhantes, 62% piores
» O melhor teve um delta de 4%, a média foi 24%, o pior foi 134%
Gerenciamento de energia - Laptop de jogos com boa duração da bateria
Consumo de energia
Nossas medidas mostram um consumo de energia de até 184 watts sob carga para o computador portátil para jogos Asus. Enquanto o A15 apresenta um baixo consumo de energia no mesmo nível de nosso campo de teste com sua média de 12,8 watts em nosso cenário de inatividade, o valor médio sob carga é comparativamente alto com 120 watts.
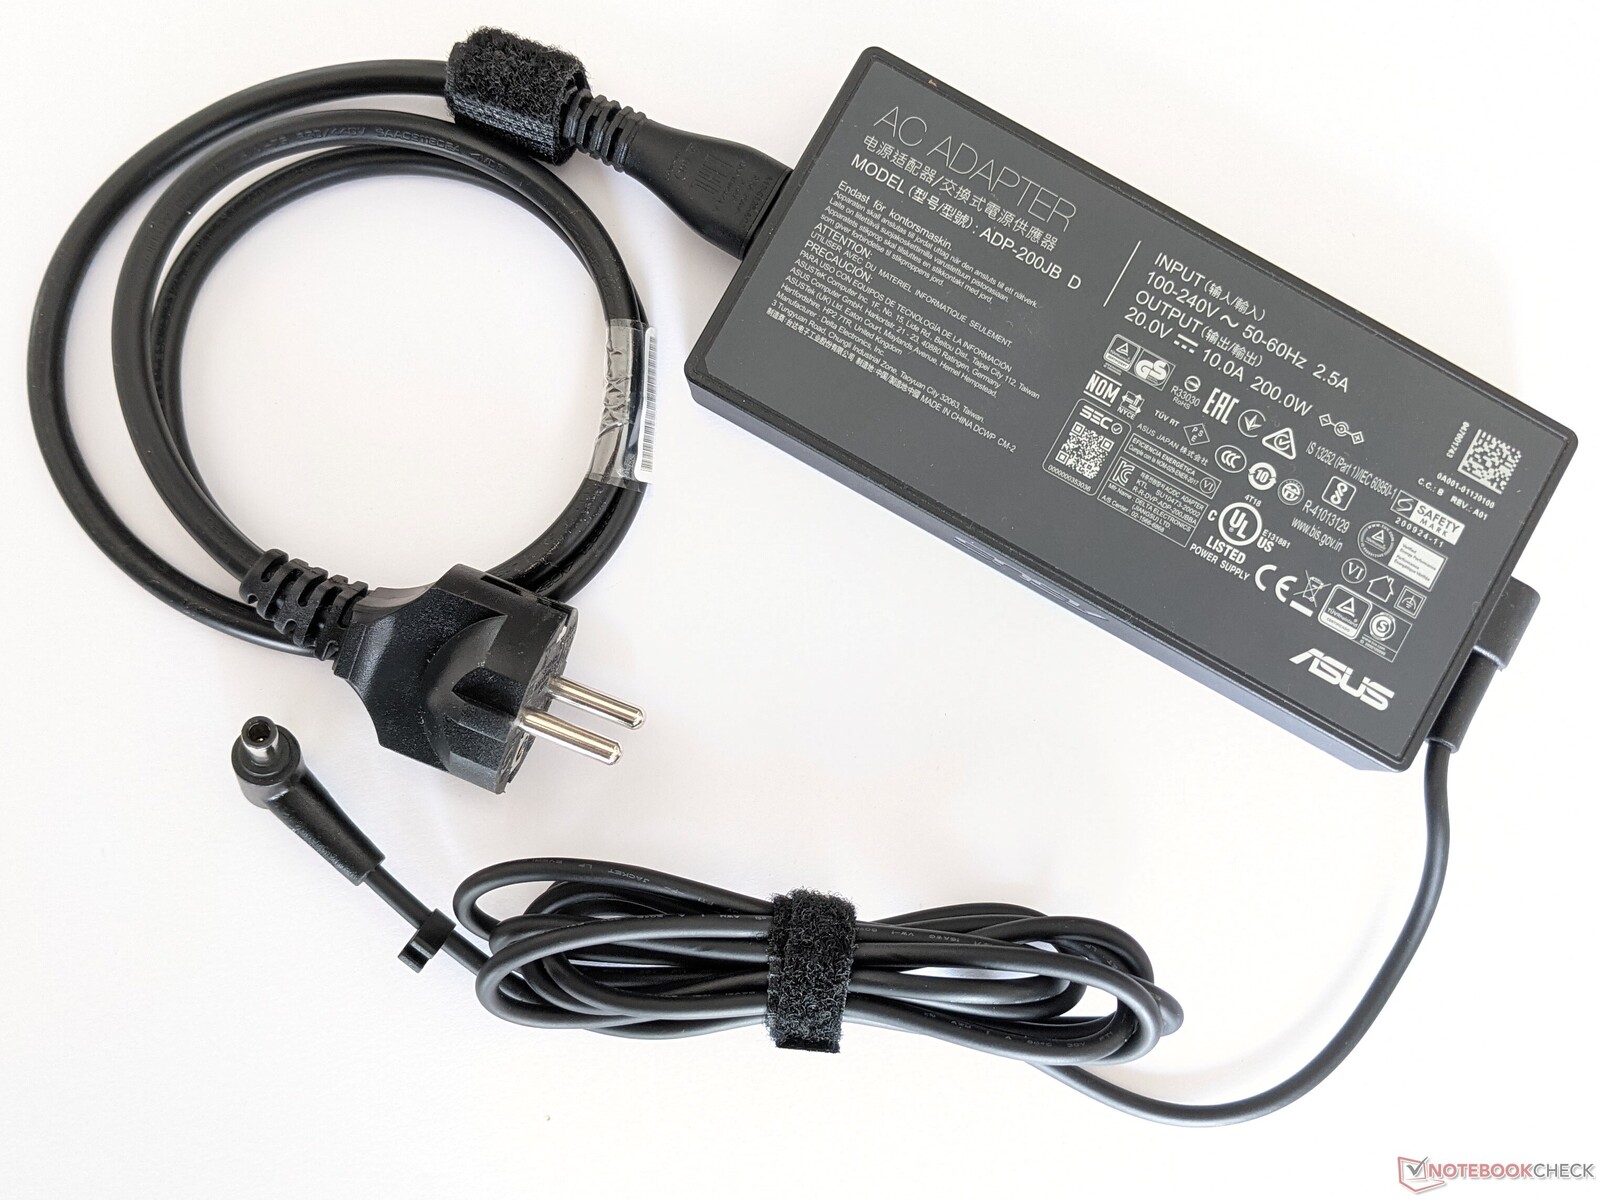
O adaptador de energia incluído tem uma potência suficientemente alta de 200 watts.
| desligado | |
| Ocioso | |
| Carga |
|
Key:
min: | |
| Asus TUF Gaming A15 FA506QR-AZ061T R7 5800H, GeForce RTX 3070 Laptop GPU, SK Hynix HFM001TD3JX013N, IPS, 1920x1080, 15.6" | Asus TUF Gaming F15 FX506HM i7-11800H, GeForce RTX 3060 Laptop GPU, SK Hynix HFM001TD3JX013N, IPS, 1920x1080, 15.6" | Alienware m15 R5 Ryzen Edition R7 5800H, GeForce RTX 3060 Laptop GPU, Toshiba KBG40ZNS512G NVMe, IPS, 1920x1080, 15.6" | Aorus 15P XC i7-10870H, GeForce RTX 3070 Laptop GPU, ESR512GTLCG-EAC-4, IPS, 1920x1080, 15.6" | MSI GF65 Thin 10UE i7-10750H, GeForce RTX 3060 Laptop GPU, Samsung SSD PM981 MZVLB1T0HALR, IPS, 1920x1080, 15.6" | Média NVIDIA GeForce RTX 3070 Laptop GPU | Média da turma Gaming | |
|---|---|---|---|---|---|---|---|
| Power Consumption | -4% | -22% | -39% | 12% | -41% | -32% | |
| Idle Minimum * (Watt) | 10.2 | 9.5 7% | 11 -8% | 14 -37% | 5.4 47% | 15.6 ? -53% | 13.2 ? -29% |
| Idle Average * (Watt) | 12.8 | 12.1 5% | 14 -9% | 17 -33% | 12.8 -0% | 20.1 ? -57% | 18.9 ? -48% |
| Idle Maximum * (Watt) | 15 | 22.5 -50% | 25 -67% | 33 -120% | 19.5 -30% | 29.4 ? -96% | 24.3 ? -62% |
| Load Average * (Watt) | 130 | 99.5 23% | 123 5% | 96 26% | 86.6 33% | 110.8 ? 15% | 108 ? 17% |
| Witcher 3 ultra * (Watt) | 137 | 157 -15% | 176 -28% | 179 -31% | 115.7 16% | ||
| Load Maximum * (Watt) | 184 | 173.5 6% | 226 -23% | 256 -39% | 175.2 5% | 214 ? -16% | 254 ? -38% |
* ... menor é melhor
Energy consumption during The Witcher 3
Duração da bateria
Durante nosso teste Wi-Fi no mundo real, o TUF Gaming A15 atinge um tempo de execução de 11:25 horas. Este é um valor muito bom e fala por uma boa utilização da bateria de 90 Wh. Além disso, é o melhor resultado em nosso campo de teste
| Asus TUF Gaming A15 FA506QR-AZ061T R7 5800H, GeForce RTX 3070 Laptop GPU, 90 Wh | Asus TUF Gaming F15 FX506HM i7-11800H, GeForce RTX 3060 Laptop GPU, 90 Wh | Alienware m15 R5 Ryzen Edition R7 5800H, GeForce RTX 3060 Laptop GPU, 86 Wh | Aorus 15P XC i7-10870H, GeForce RTX 3070 Laptop GPU, 99 Wh | MSI GF65 Thin 10UE i7-10750H, GeForce RTX 3060 Laptop GPU, 51 Wh | Média da turma Gaming | |
|---|---|---|---|---|---|---|
| Duração da bateria | -28% | -44% | -41% | -50% | -42% | |
| Reader / Idle (h) | 17.4 | 11 -37% | 14.7 -16% | 9.5 -45% | 11.1 -36% | 8.71 ? -50% |
| WiFi v1.3 (h) | 11.4 | 7.9 -31% | 5.1 -55% | 6.7 -41% | 4.6 -60% | 7.02 ? -38% |
| Load (h) | 2.4 | 2 -17% | 0.9 -62% | 1.5 -37% | 1.1 -54% | 1.47 ? -39% |
| Witcher 3 ultra (h) | 1.6 |
Pro
Contra
Veredicto - Adequado para jogos de nível básico
O TUF Gaming A15 é um bom laptop para jogos pelo preço estabelecido pela Asus de aproximadamente 1.800 Euros (~$2.126). Apesar do TGP limitado, ele oferece um alto desempenho em jogos, e tanto a velocidade Wi-Fi quanto a qualidade da tela são decentes. O laptop para jogos não precisa se esconder quando comparado com a concorrência, e também pode convencer com um design original.
O Asus TUF Gaming A15 oferece um bom desempenho de jogo dentro do escopo do hardware instalado.
Em uma comparação direta, o AMD Ryzen 7 5800H instalado aqui funciona bem, mas dispositivos como o TUF Gaming F15 e o Alienware m15 estão ligeiramente melhor equipados em termos de desempenho a longo prazo. A duração da bateria do A15 é muito boa também, e é muito melhor do que o resto do nosso campo de testes. As opções de manutenção também são muito boas, com RAM expansível e um segundo slot SSD.
Como resultado, o Asus TUF Gaming A15 não é apenas interessante como um dispositivo de nível básico, mas também atende a exigências mais ambiciosas. Se o preço ainda é muito alto para seu orçamento, vale a pena dar uma olhada no MSI GF65 Fino 10UEque está disponível por menos de 1.200 euros (~$1.417).
Preço e disponibilidade
Asus TUF Gaming A15 FA506QR-AZ061T
- 07/15/2021 v7 (old)
Mike Wobker
Price comparison

