Asus TUF Gaming F15 FX507ZM revisão portátil: Pico GeForce RTX 3060 performance
A Asus atualizou sua série TUF Gaming F15 para 2022, agora que a série de CPU Intel 12th gen está amplamente disponível. Ao invés de uma simples troca de CPU, porém, o fabricante atualizou aspectos significativos do chassi FX506 do ano passado para criar a FX507. Esta revisão revisará todas as principais diferenças entre o FX506 2021 e 2022 FX507, bem como os níveis de desempenho que os usuários podem esperar do FX507.
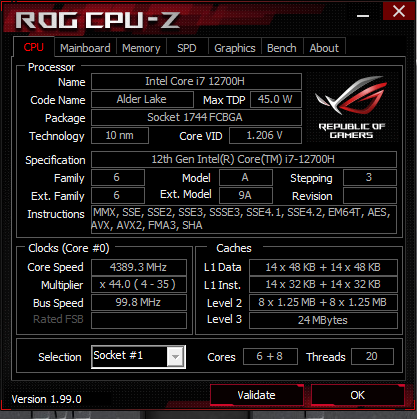
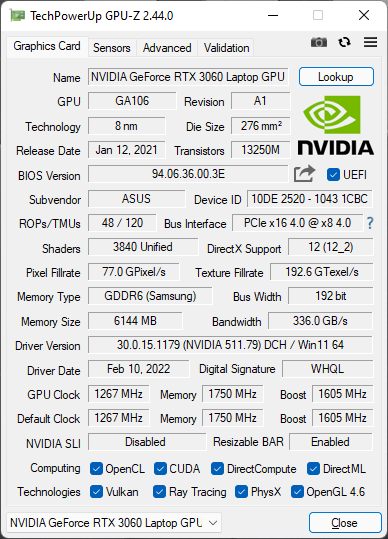
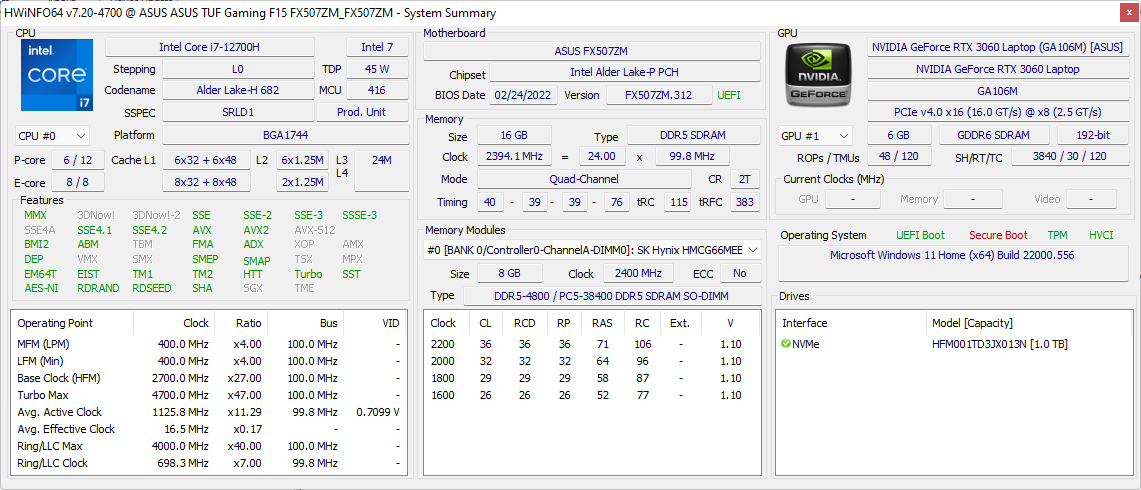
Nossa configuração em revisão vem com a CPU Alder Lake-H Core i7-12700H, GeForce RTX 3060 GPU, painel IPS 300 Hz 1080p, e 90 Wh bateria por aproximadamente $1500 USD a varejo. Outras SKUs com taxas de atualização de tela mais lentas, bateria 56 Wh menor e opções de CPU mais lentas podem estar disponíveis. Note que mesmo que a FX507 venha com a mesma GPU GeForce RTX 3060 como na FX506 mais antiga, a GPU no modelo mais novo visa um TGP muito mais alto para obter mais desempenho (140 W vs. 95 W).
Os concorrentes da FX507 incluem outros laptops de 15,6 polegadas de médio alcance, como o Razer Blade 15 Modelo Base, MSI GP66, Acer Predator Tritonou o Gigabyte série Aorus 5.
Mais revisões do Asus:
Possíveis concorrentes em comparação
Avaliação | Data | Modelo | Peso | Altura | Size | Resolução | Preço |
|---|---|---|---|---|---|---|---|
| 87.2 % v7 (old) | 03/2022 | Asus TUF Gaming F15 FX507ZM i7-12700H, GeForce RTX 3060 Laptop GPU | 2.1 kg | 24.95 mm | 15.60" | 1920x1080 | |
| 85.9 % v7 (old) | 06/2021 | Asus TUF Gaming F15 FX506HM i7-11800H, GeForce RTX 3060 Laptop GPU | 2.3 kg | 24.9 mm | 15.60" | 1920x1080 | |
| 82.4 % v7 (old) | 02/2021 | Asus TUF Dash F15 FX516PR i7-11370H, GeForce RTX 3070 Laptop GPU | 2 kg | 20 mm | 15.60" | 1920x1080 | |
| 86.3 % v7 (old) | 07/2021 | Asus ROG Strix Scar 15 G533QS R9 5900HX, GeForce RTX 3080 Laptop GPU | 2.3 kg | 27.2 mm | 15.60" | 2560x1440 | |
| 82.9 % v7 (old) | 10/2020 | Asus Zephyrus S15 GX502L i7-10875H, GeForce RTX 2070 Super Mobile | 2.1 kg | 19 mm | 15.60" | 1920x1080 | |
| 85.8 % v7 (old) | 06/2021 | Asus ZenBook Pro Duo UX582 LR-1BH2 i7-10870H, GeForce RTX 3070 Laptop GPU | 2.4 kg | 21.5 mm | 15.60" | 3840x2160 |
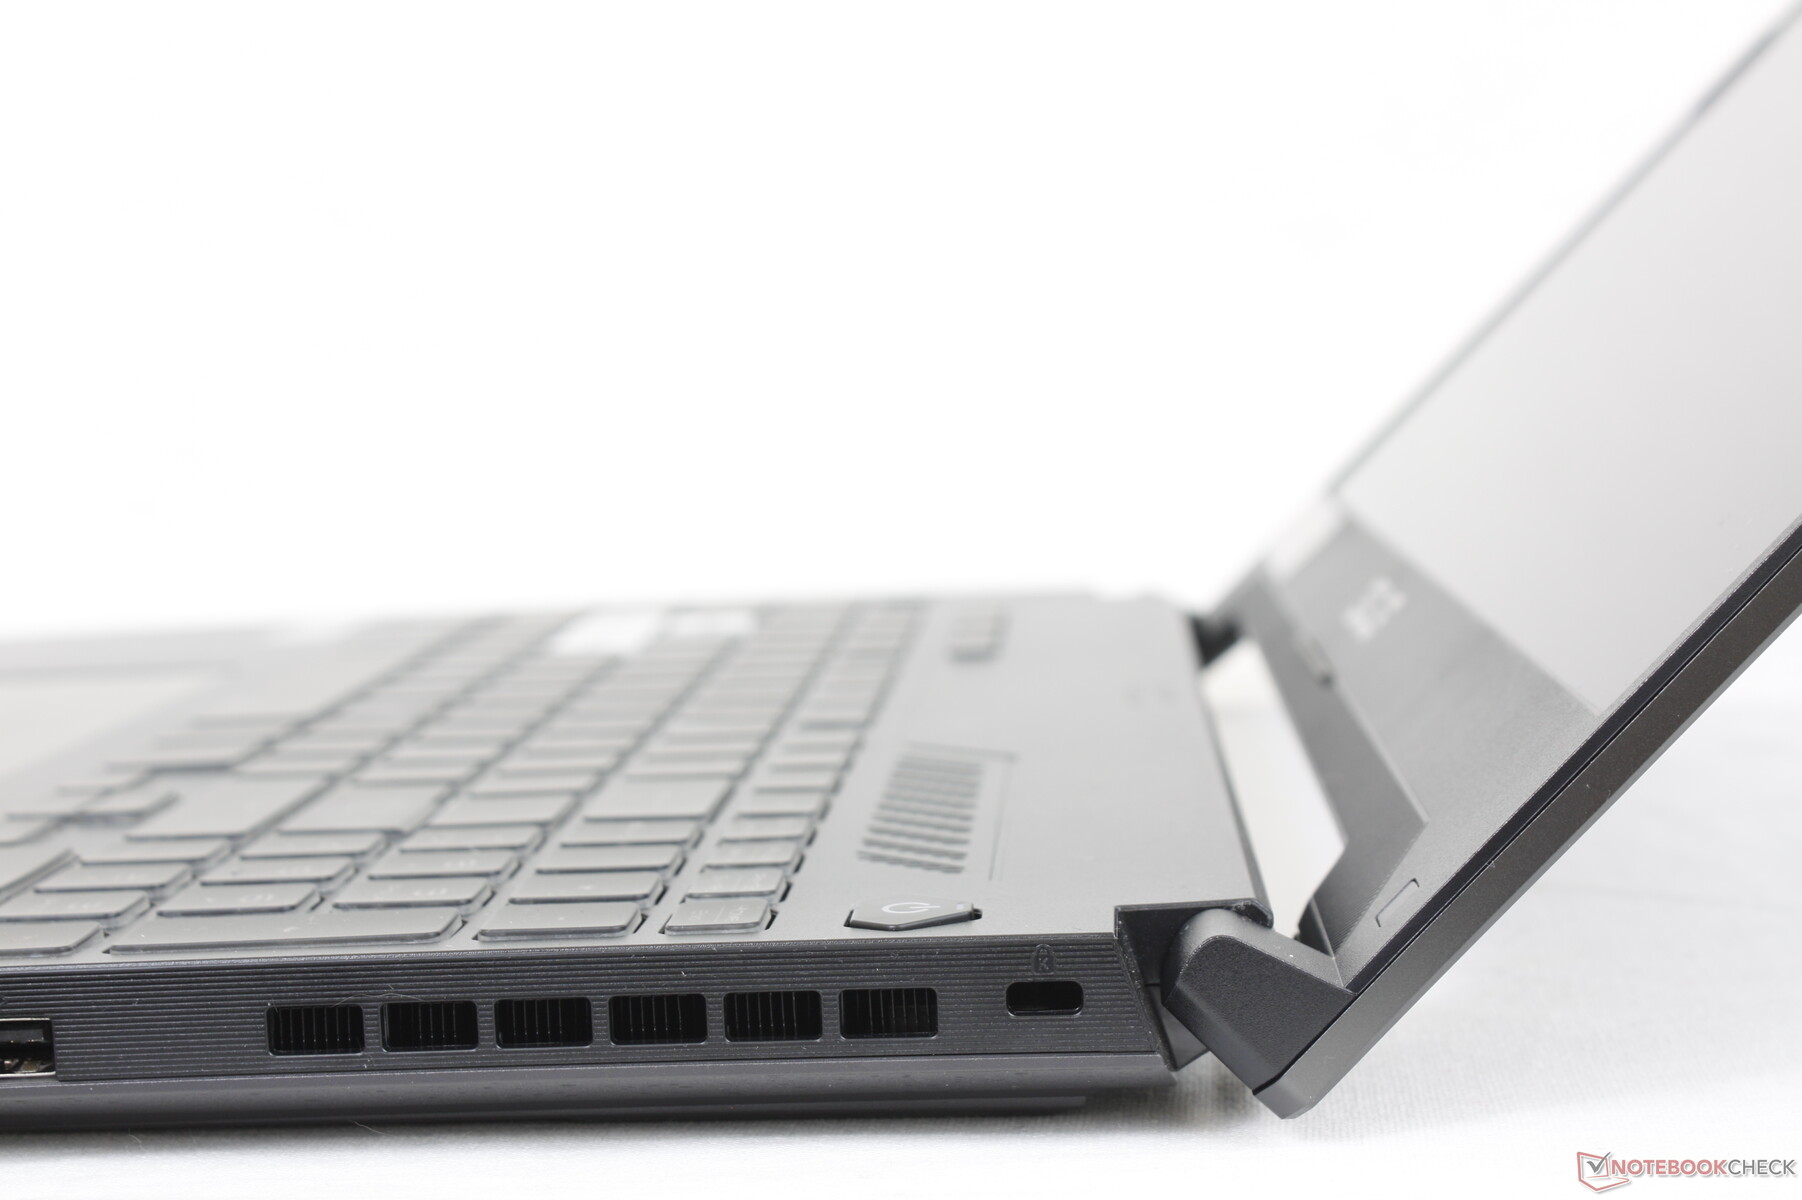
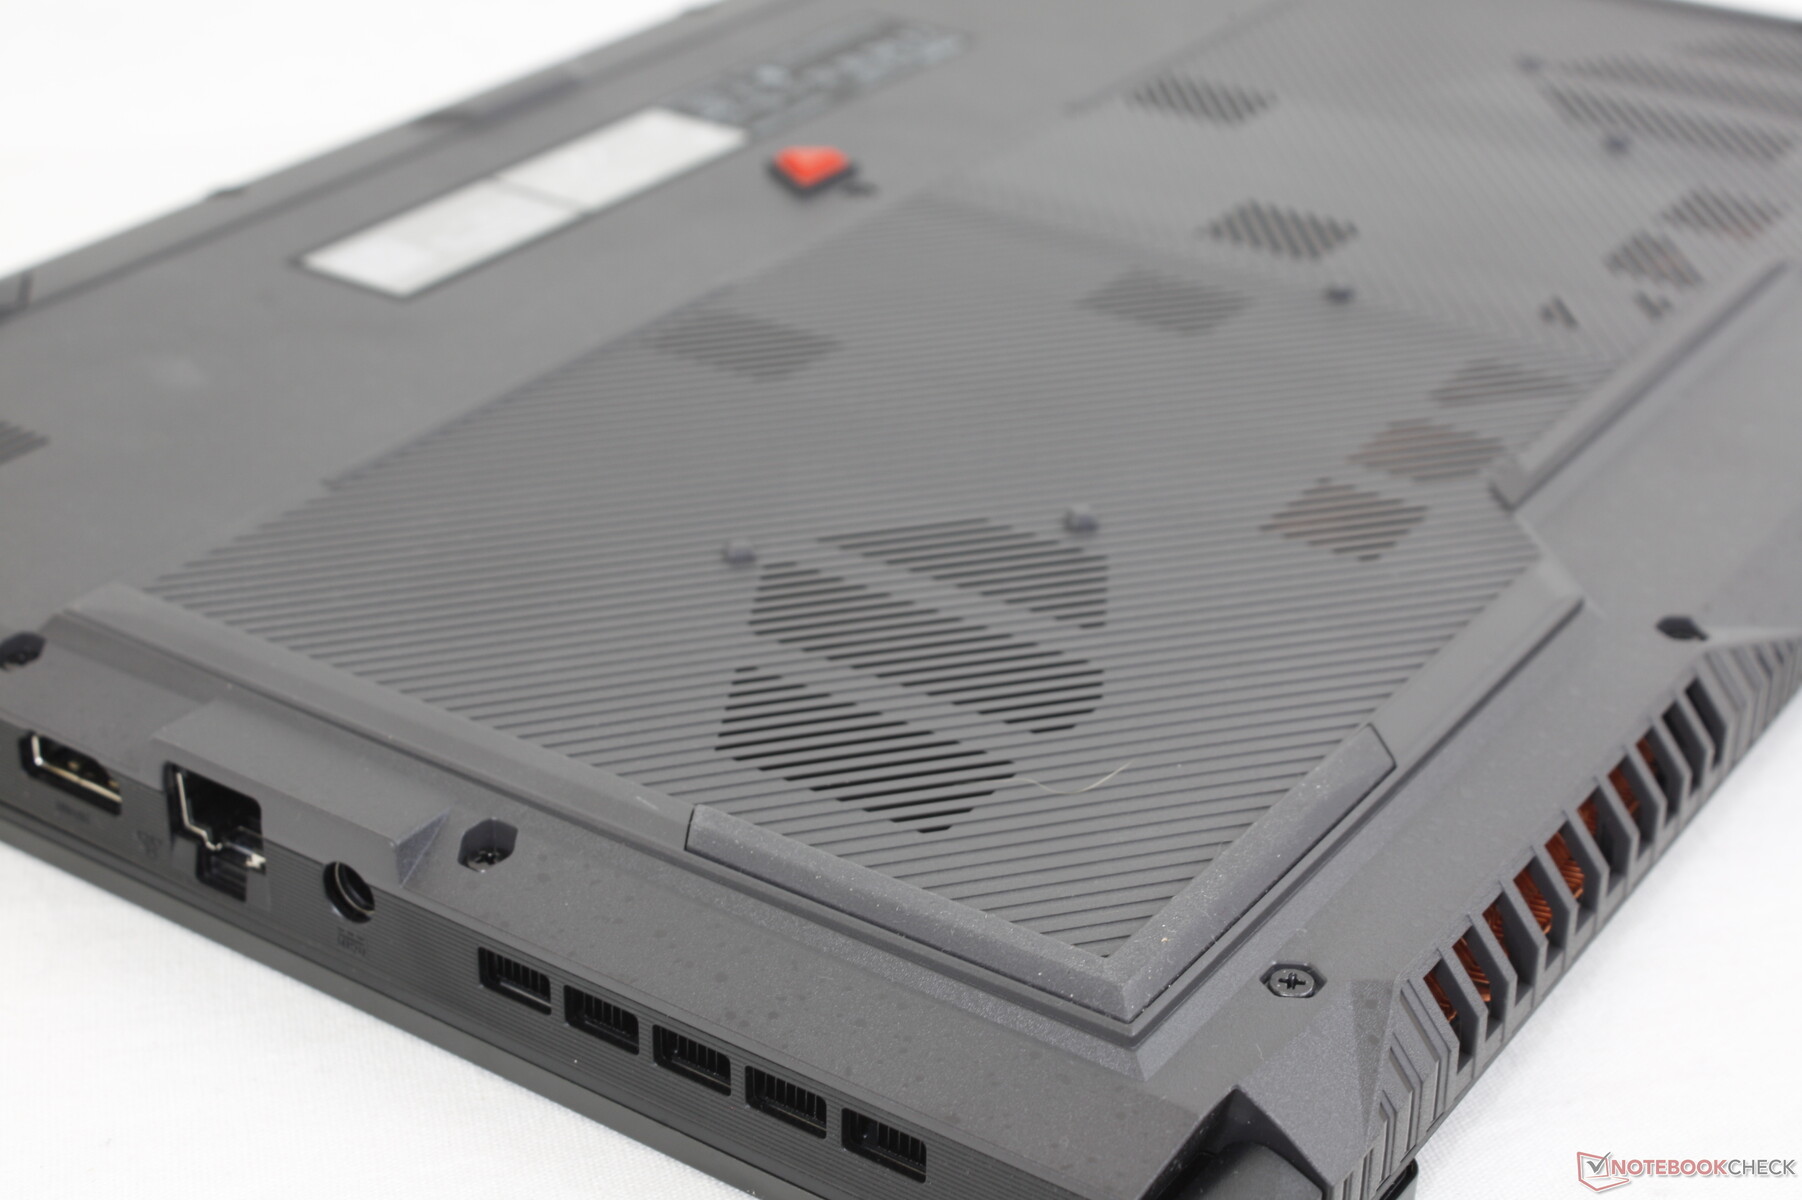
Estojo - Mais pequeno e mais leve
O FX507 pode parecer idêntico ao FX506 à primeira vista, mas na verdade há numerosas pequenas mudanças. Os cantos, por exemplo, são mais afiados do que antes, enquanto que os restos de palma falsa e brilhante são agora uma textura mais lisa e mate. A maioria das saliências e texturas alternadas no FX506 foram removidas para um visual mais limpo e minimalista. Os materiais do chassi parecem ser os mesmos do modelo do ano passado para um nível semelhante de rigidez.
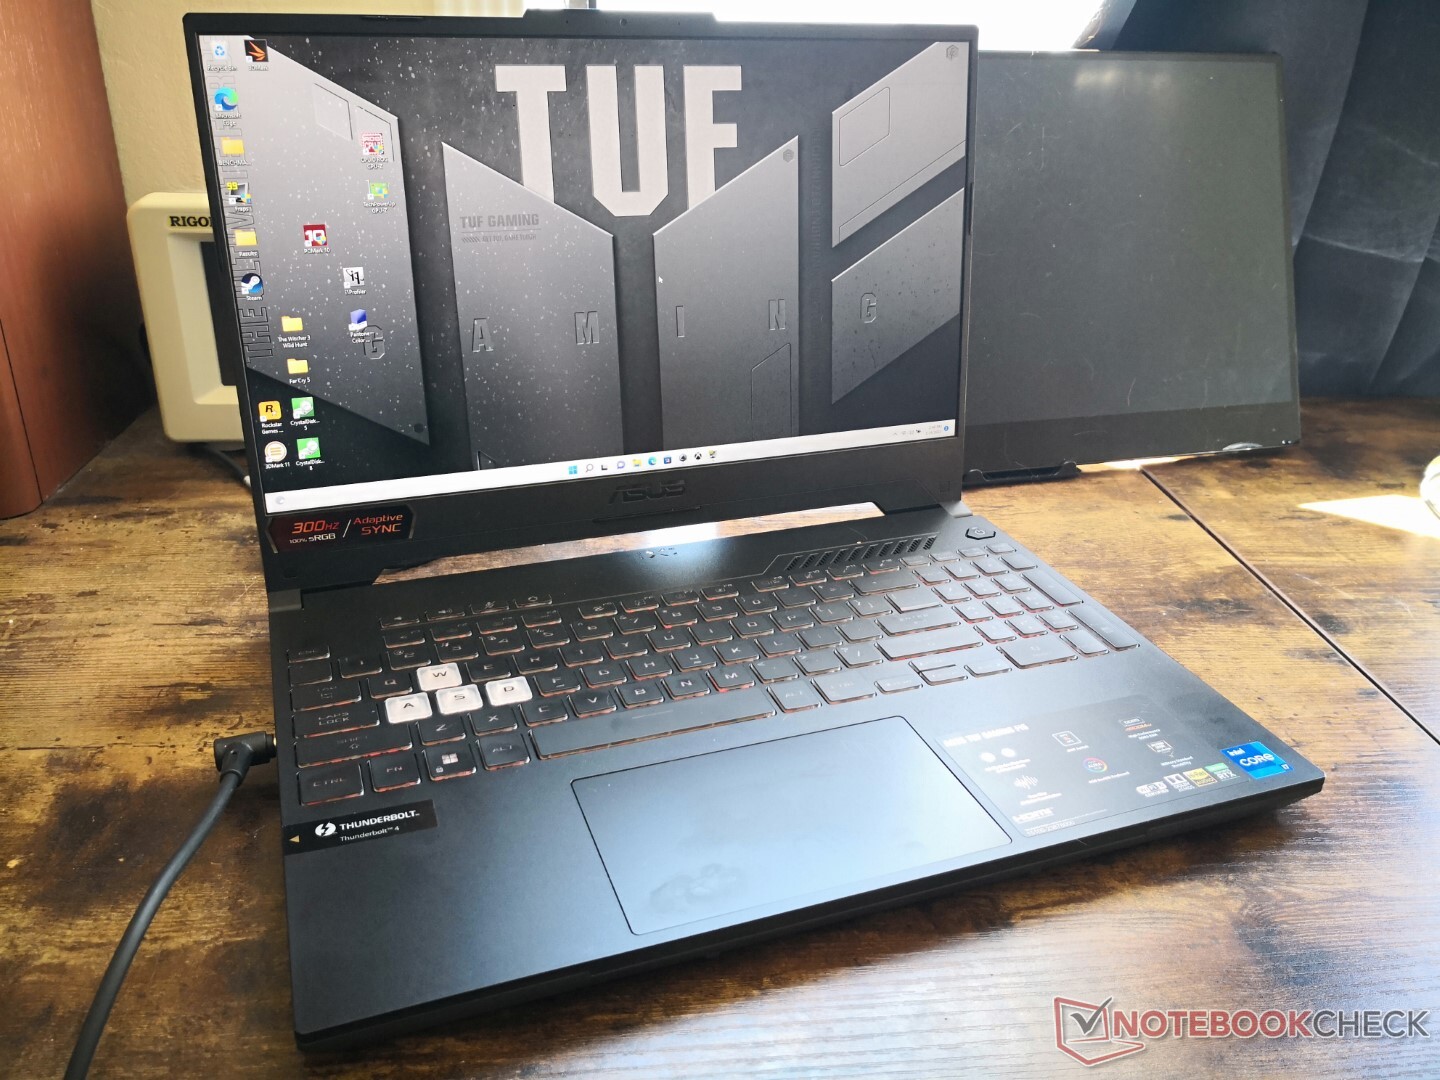
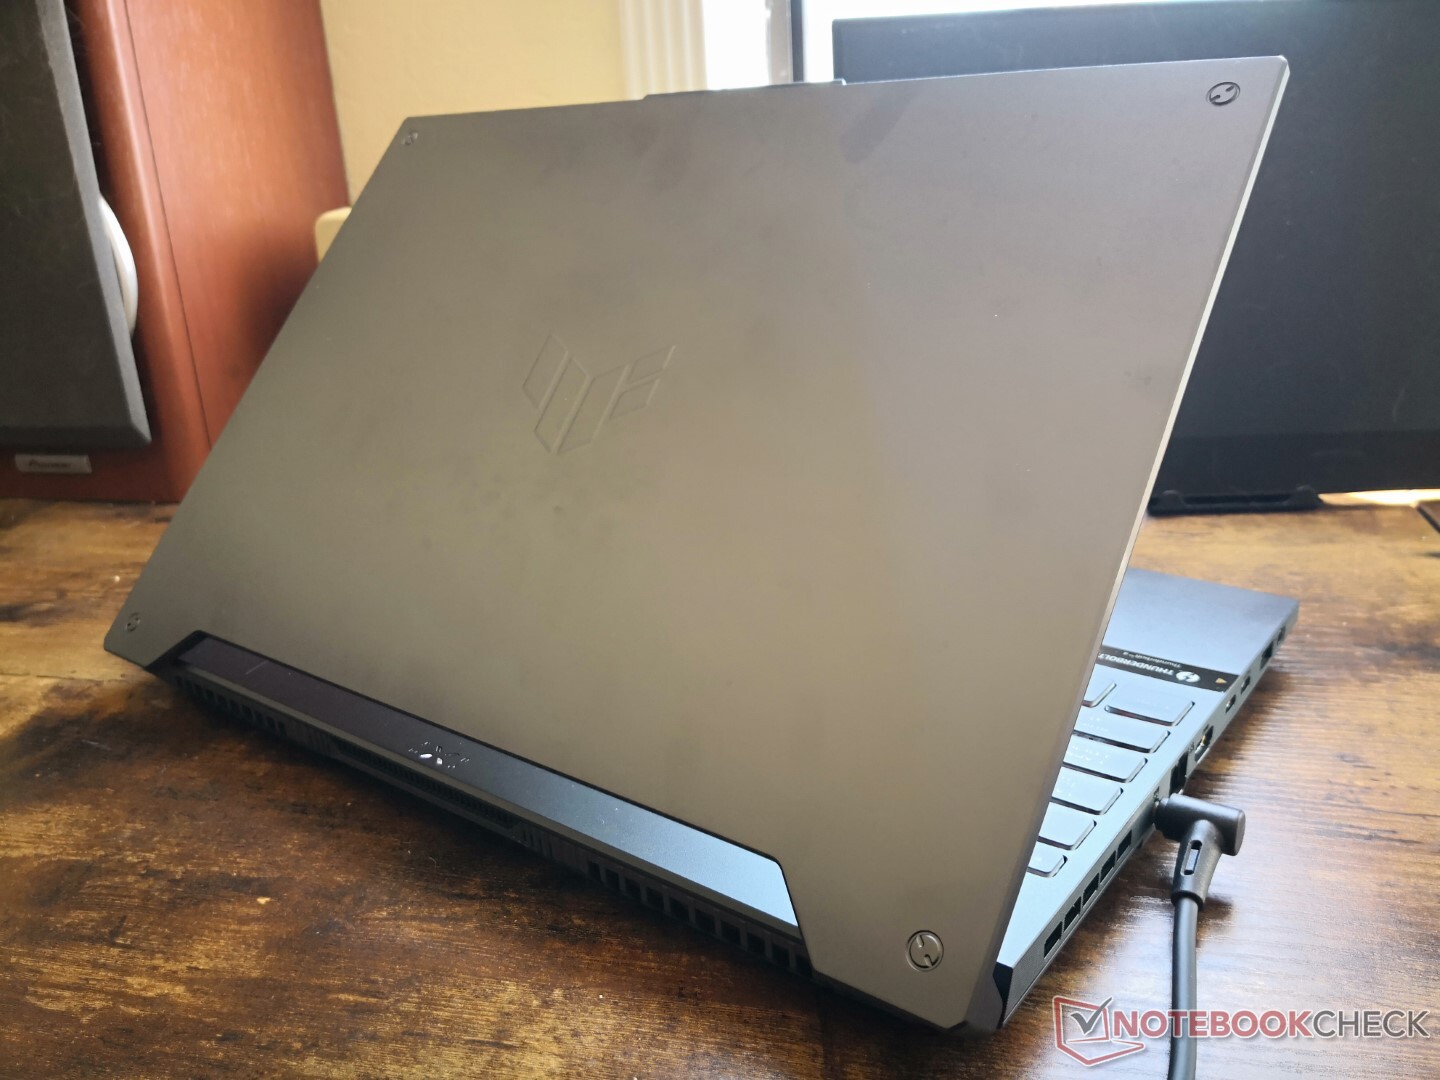
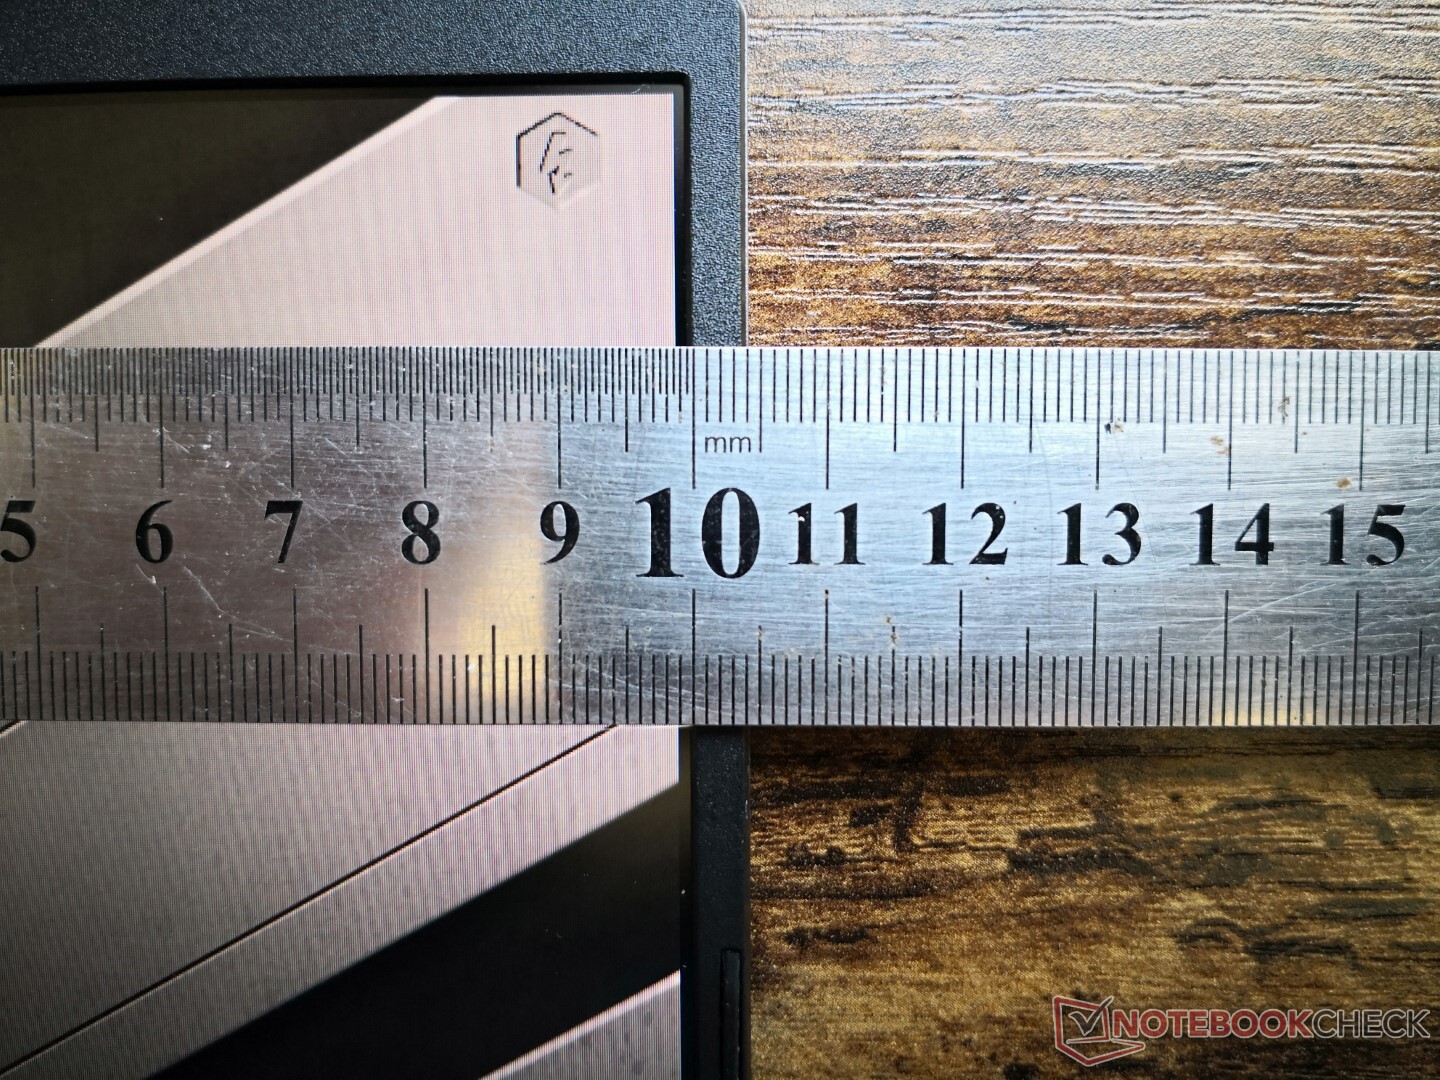
O Asus conseguiu reduzir tanto o tamanho quanto o peso do FX507 quando comparado ao seu predecessor FX506. O modelo mais novo é ligeiramente mais curto (354,9 mm vs. 359,8 mm), ligeiramente mais estreito (251,9 mm x 256 mm) e um pouco mais leve (2,1 kg vs. 2,3 kg) para ser tão leve quanto o modelo mais fino Zephyrus S15.
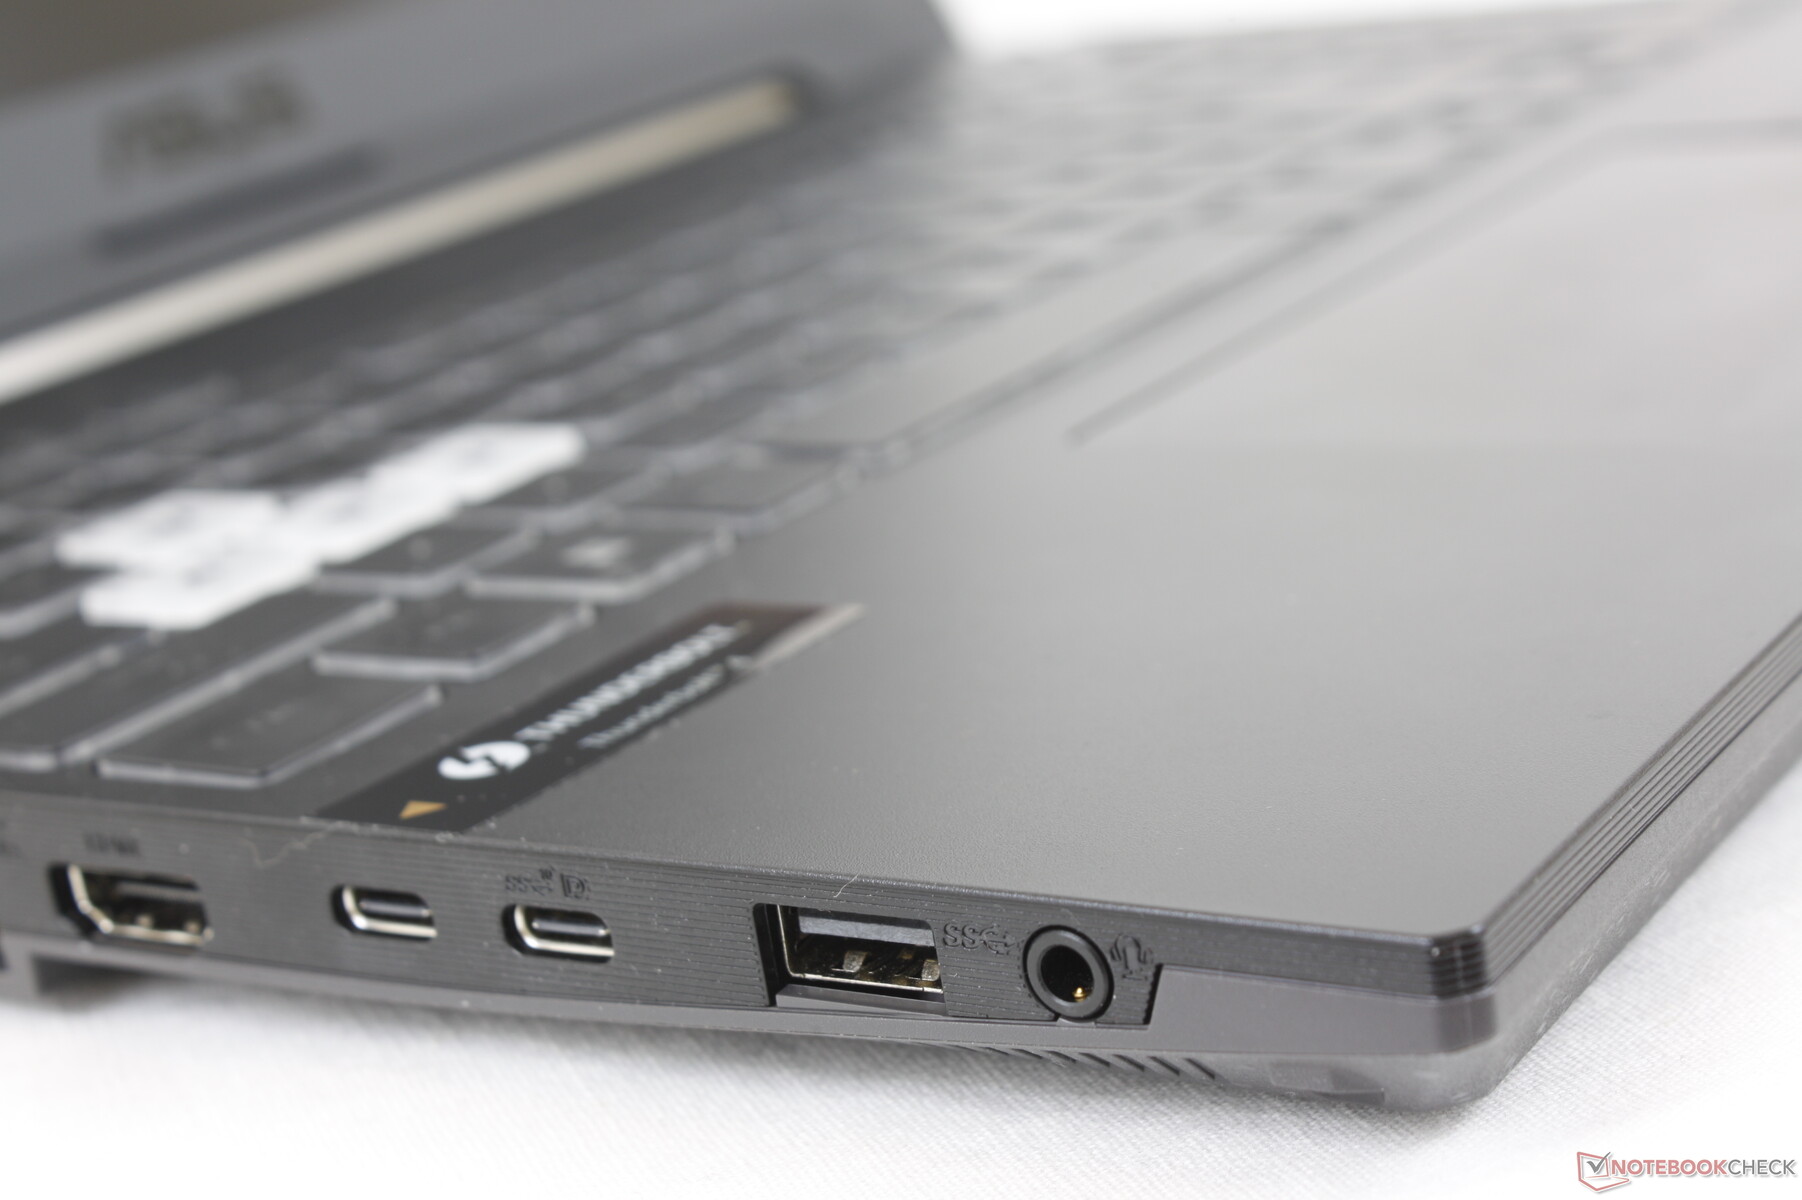
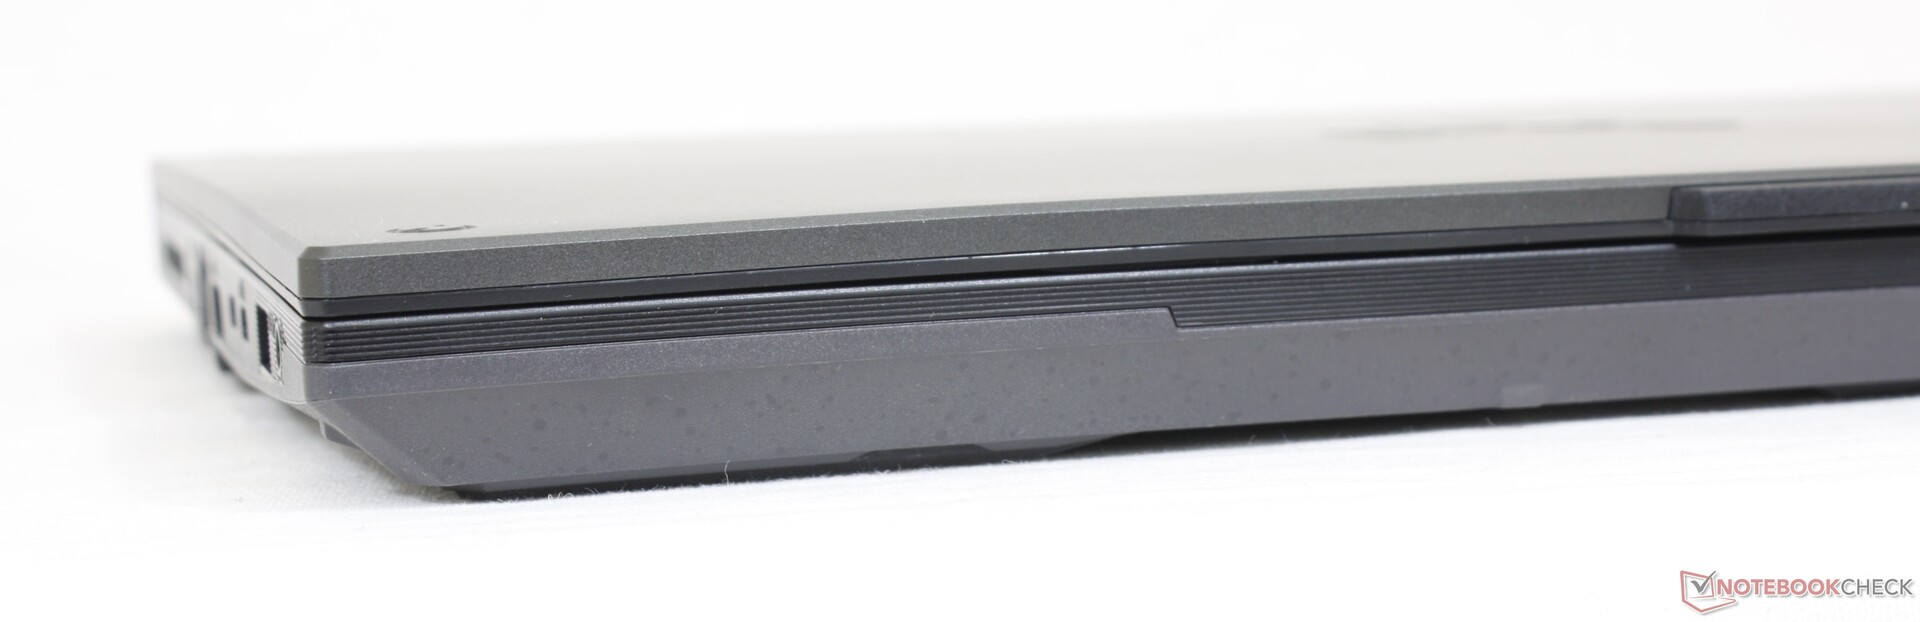
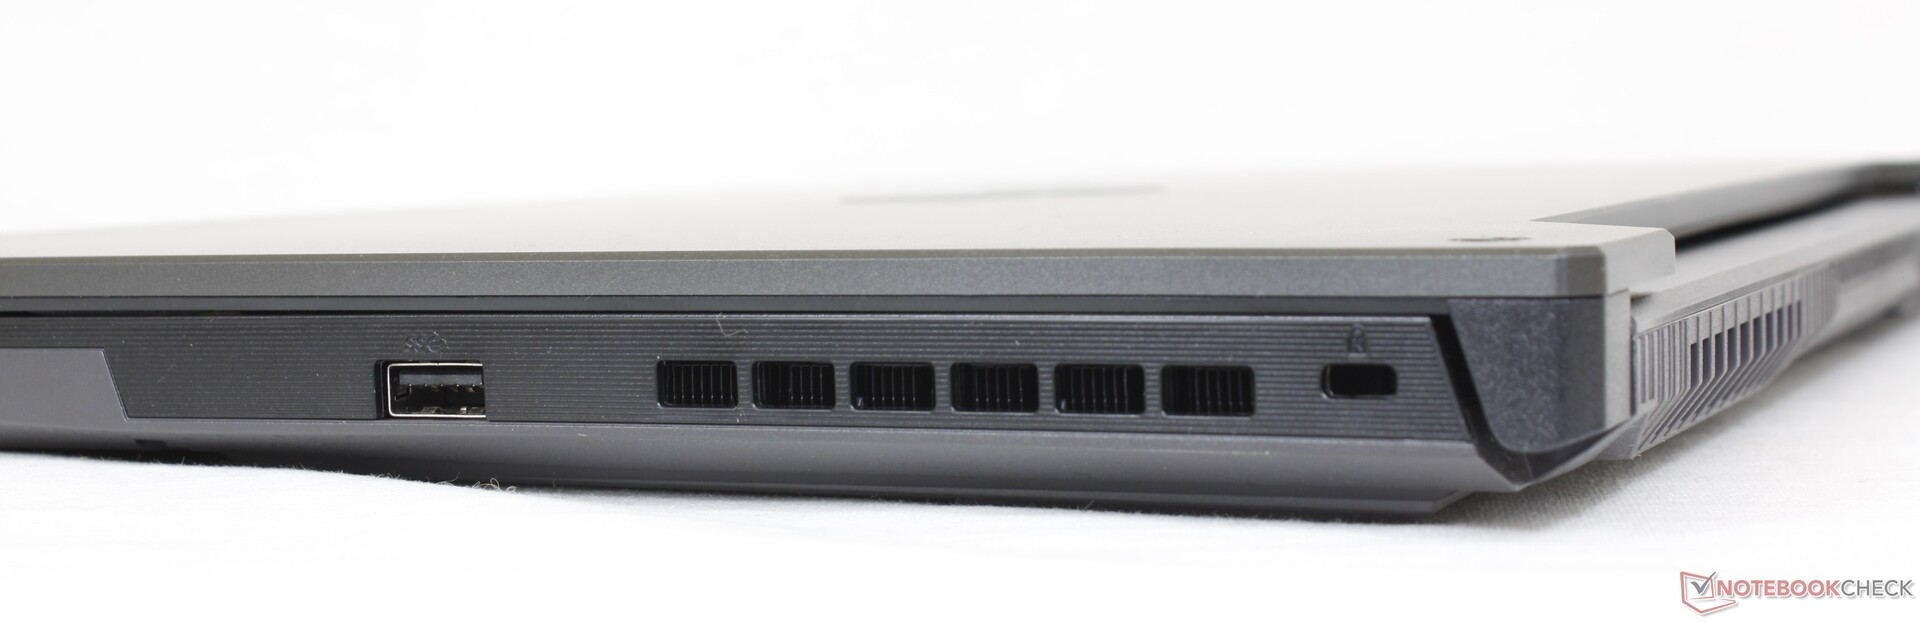
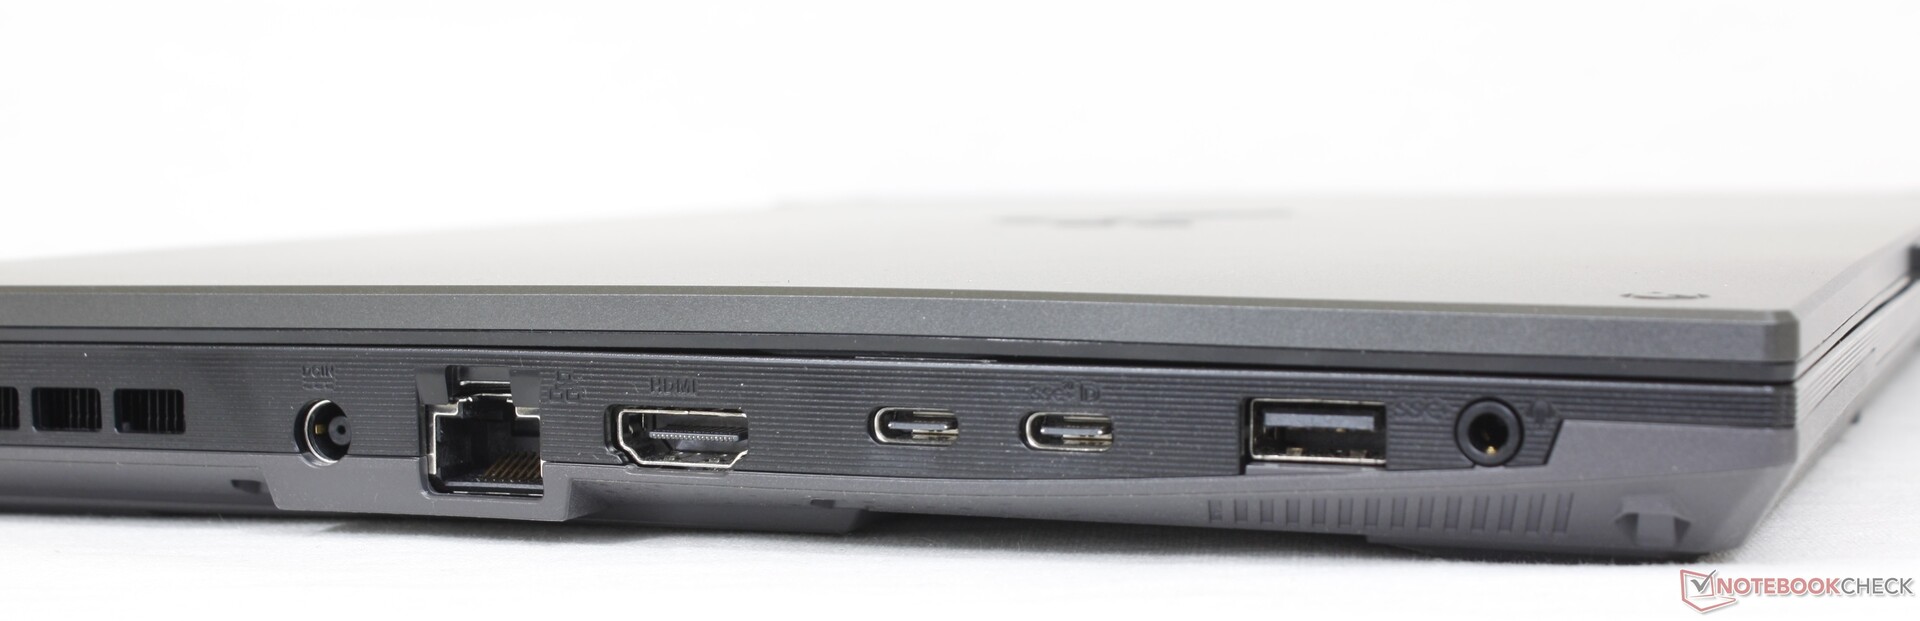
Conectividade - Mais uma porta USB-C
As opções de porta mudaram ligeiramente em relação à FX506. Mais especificamente, a FX507 deixou cair uma porta USB-A para uma segunda porta USB-C. Todas as outras portas são de outra forma idênticas.
Tenha em mente que o laptop deve estar no modo MSHybrid se conectar qualquer dispositivo Thunderbolt 4. Esta é uma limitação para todos os laptops rodando em CPUs do 12º gênero Alder Lake-H até o momento.
Comunicação
Webcam
A qualidade da câmera é ruim com a webcam de 720p. Também não há obturador de privacidade ou suporte ao Windows Olá.


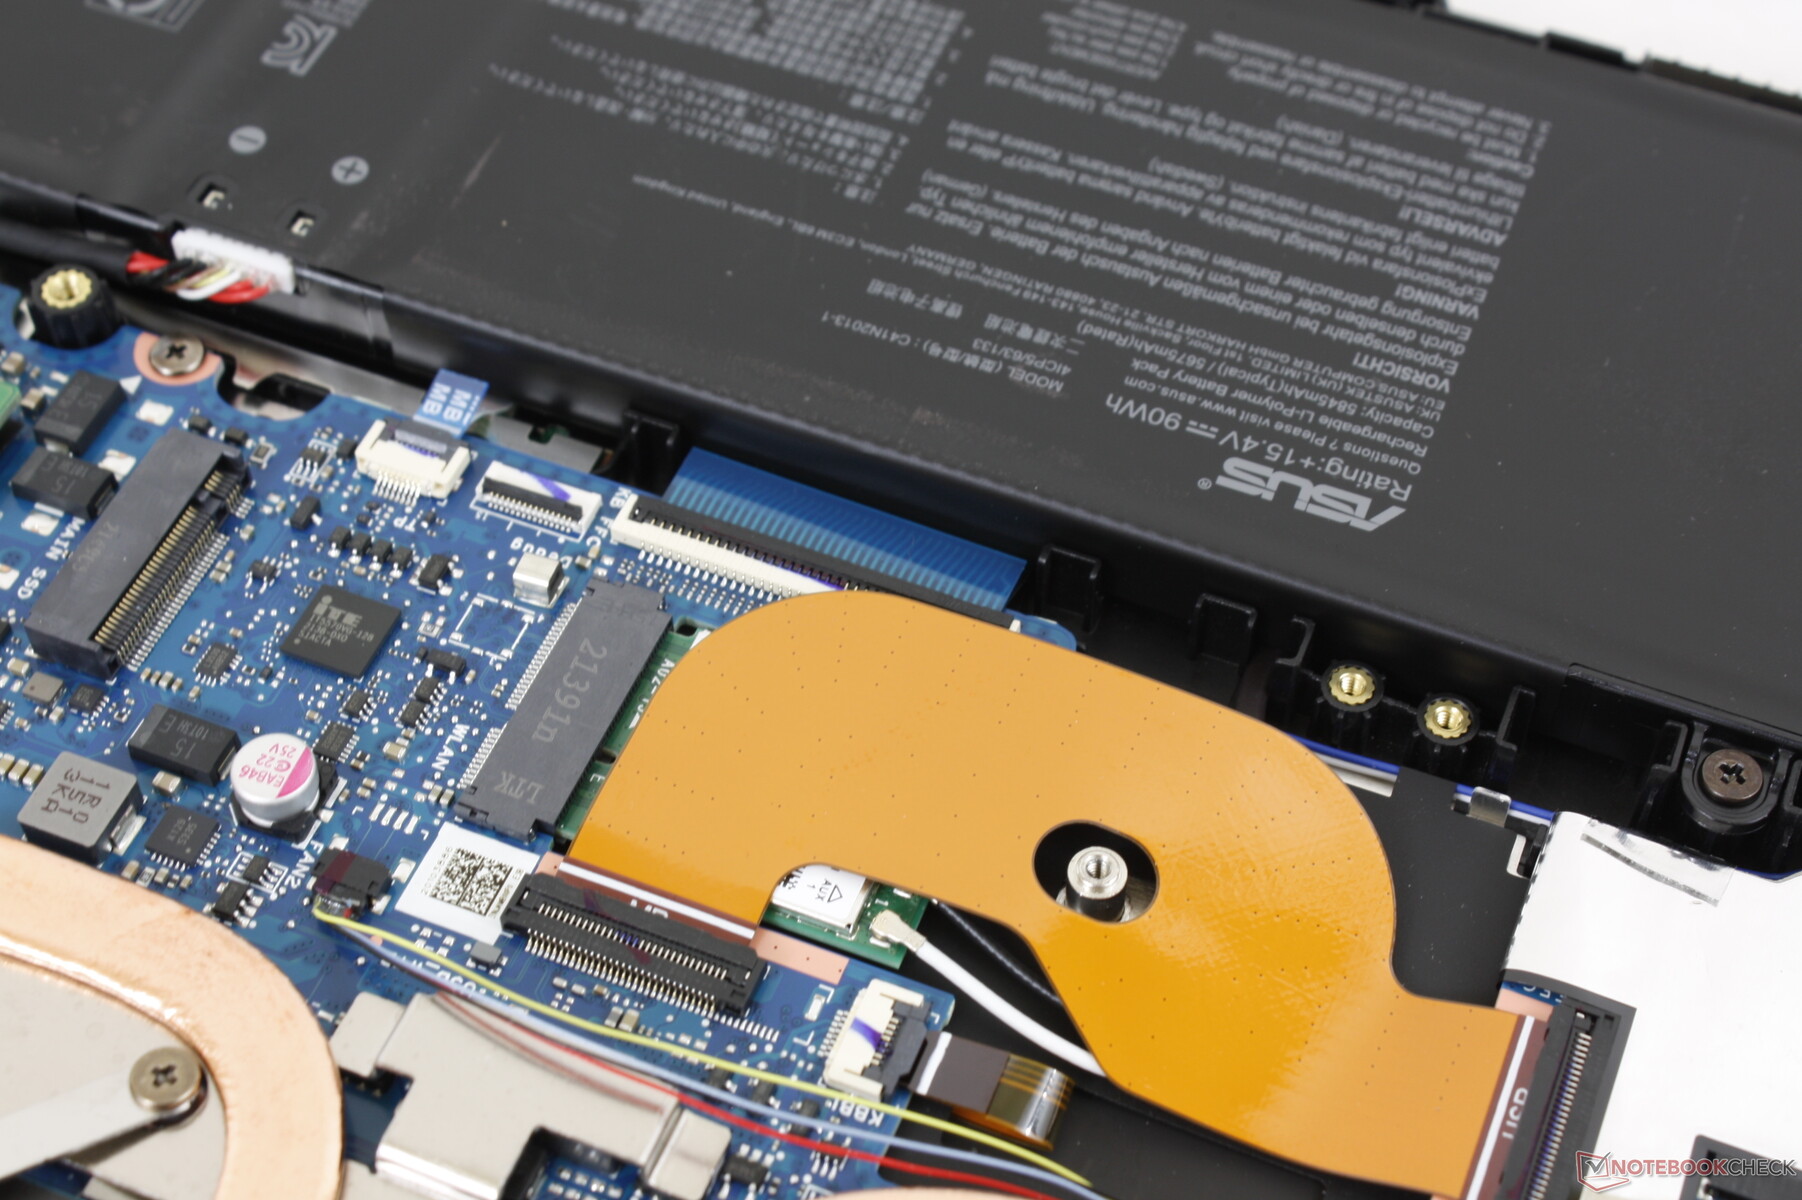
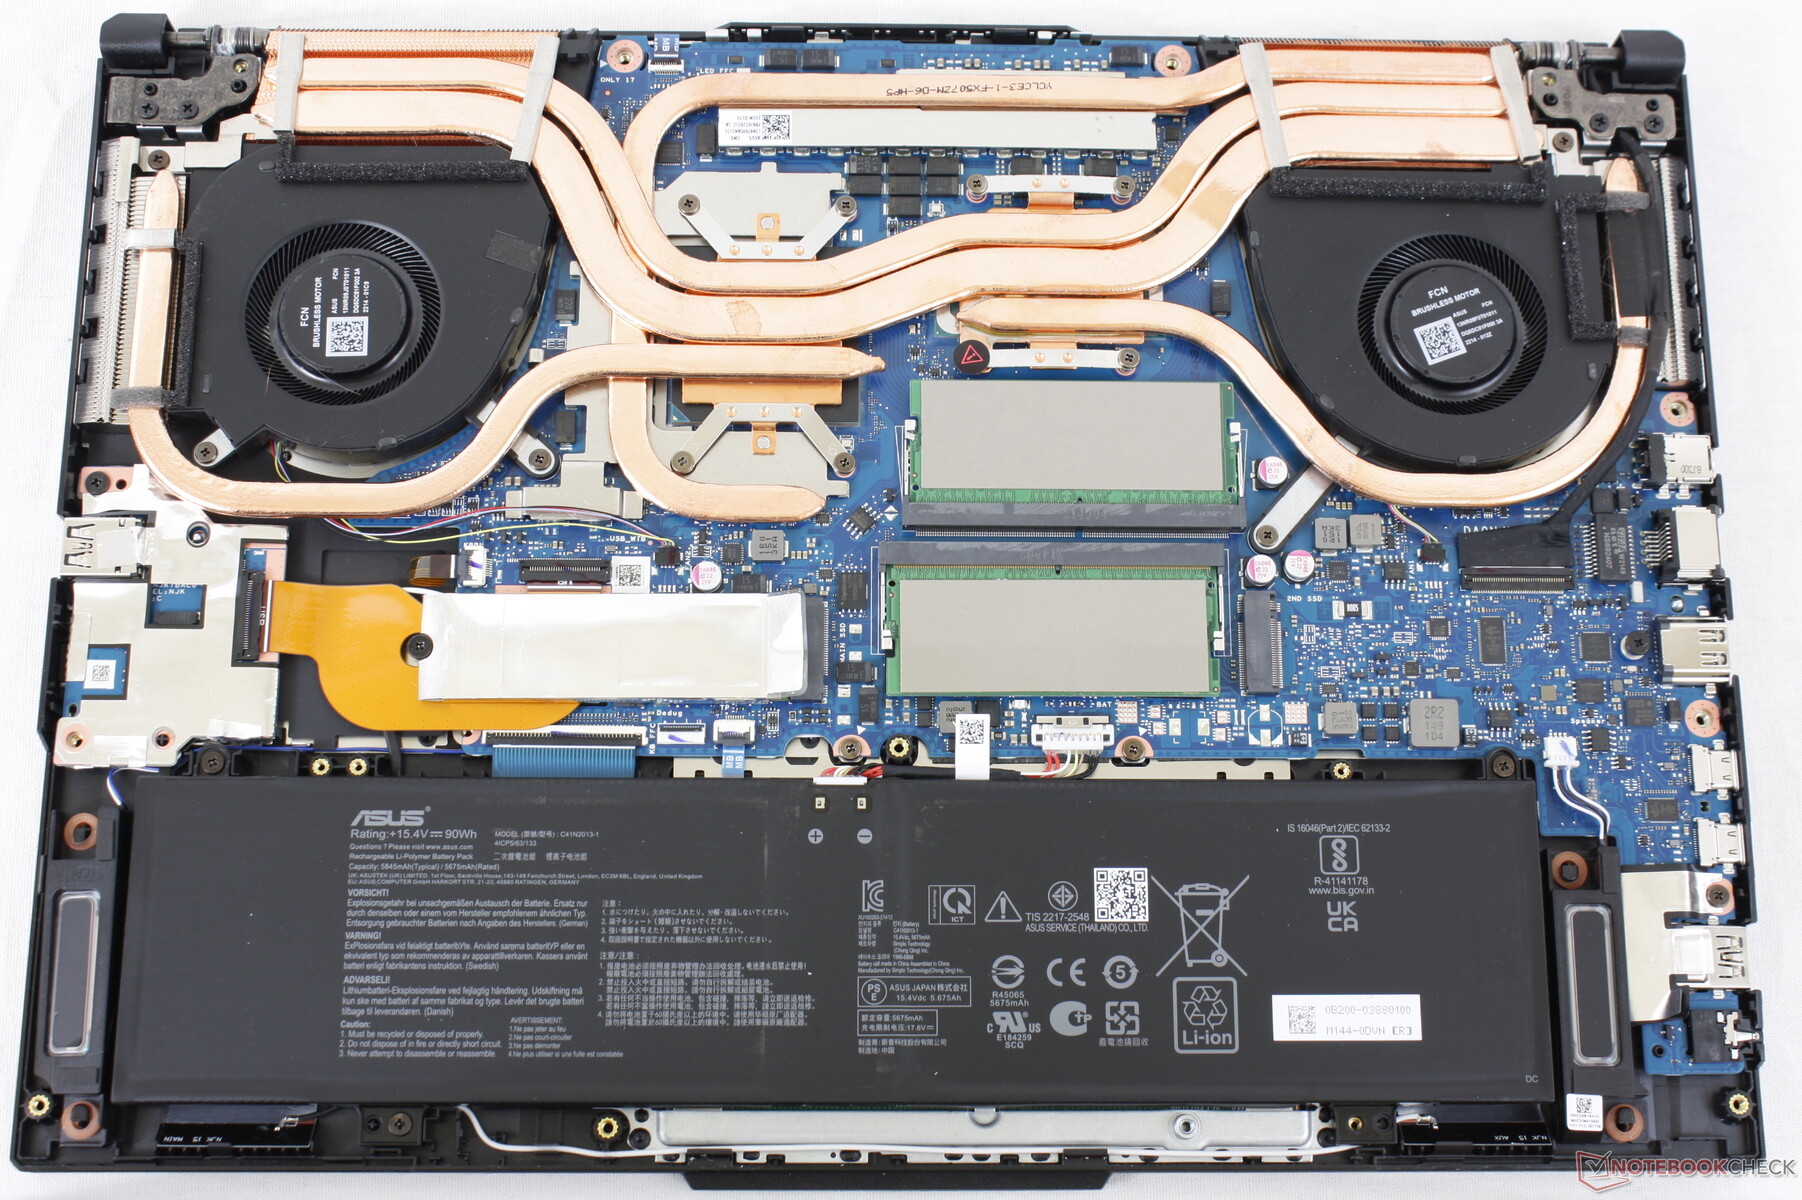
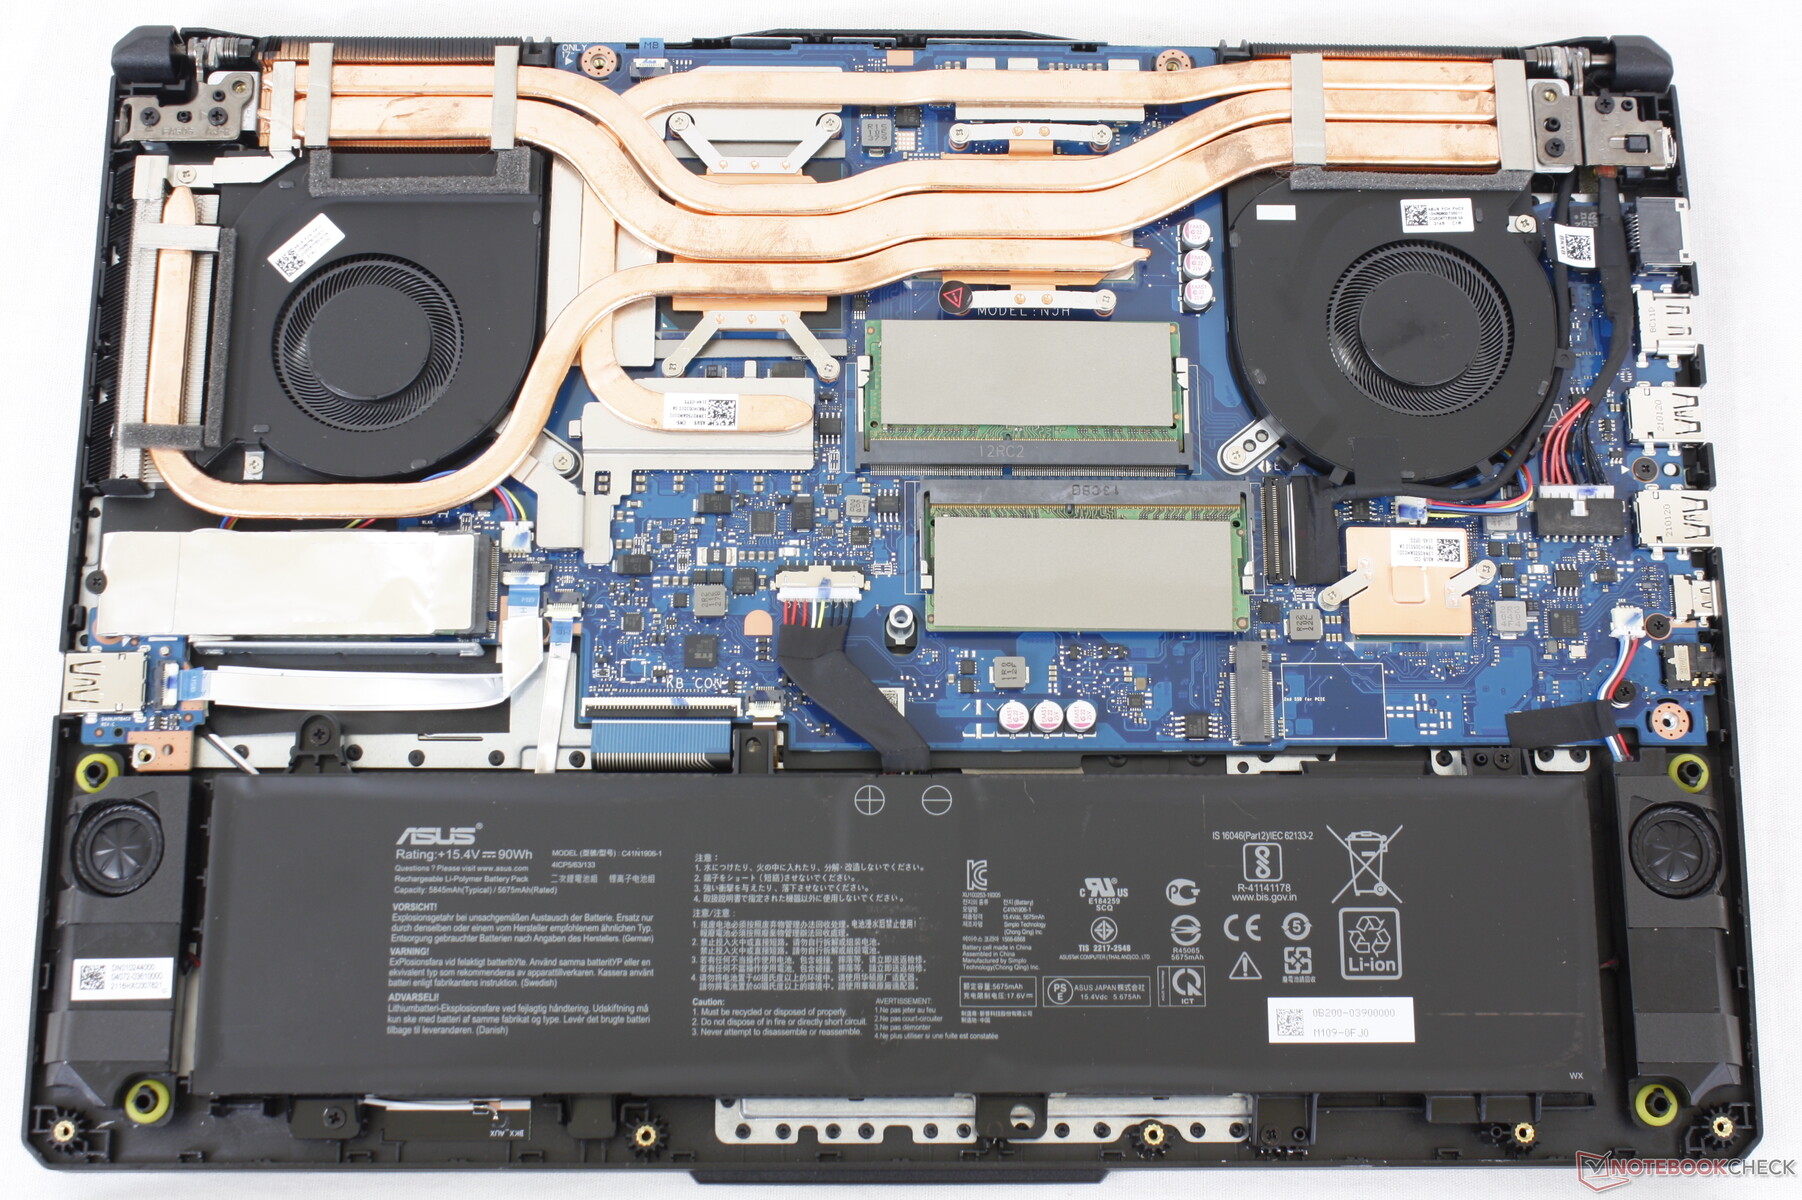
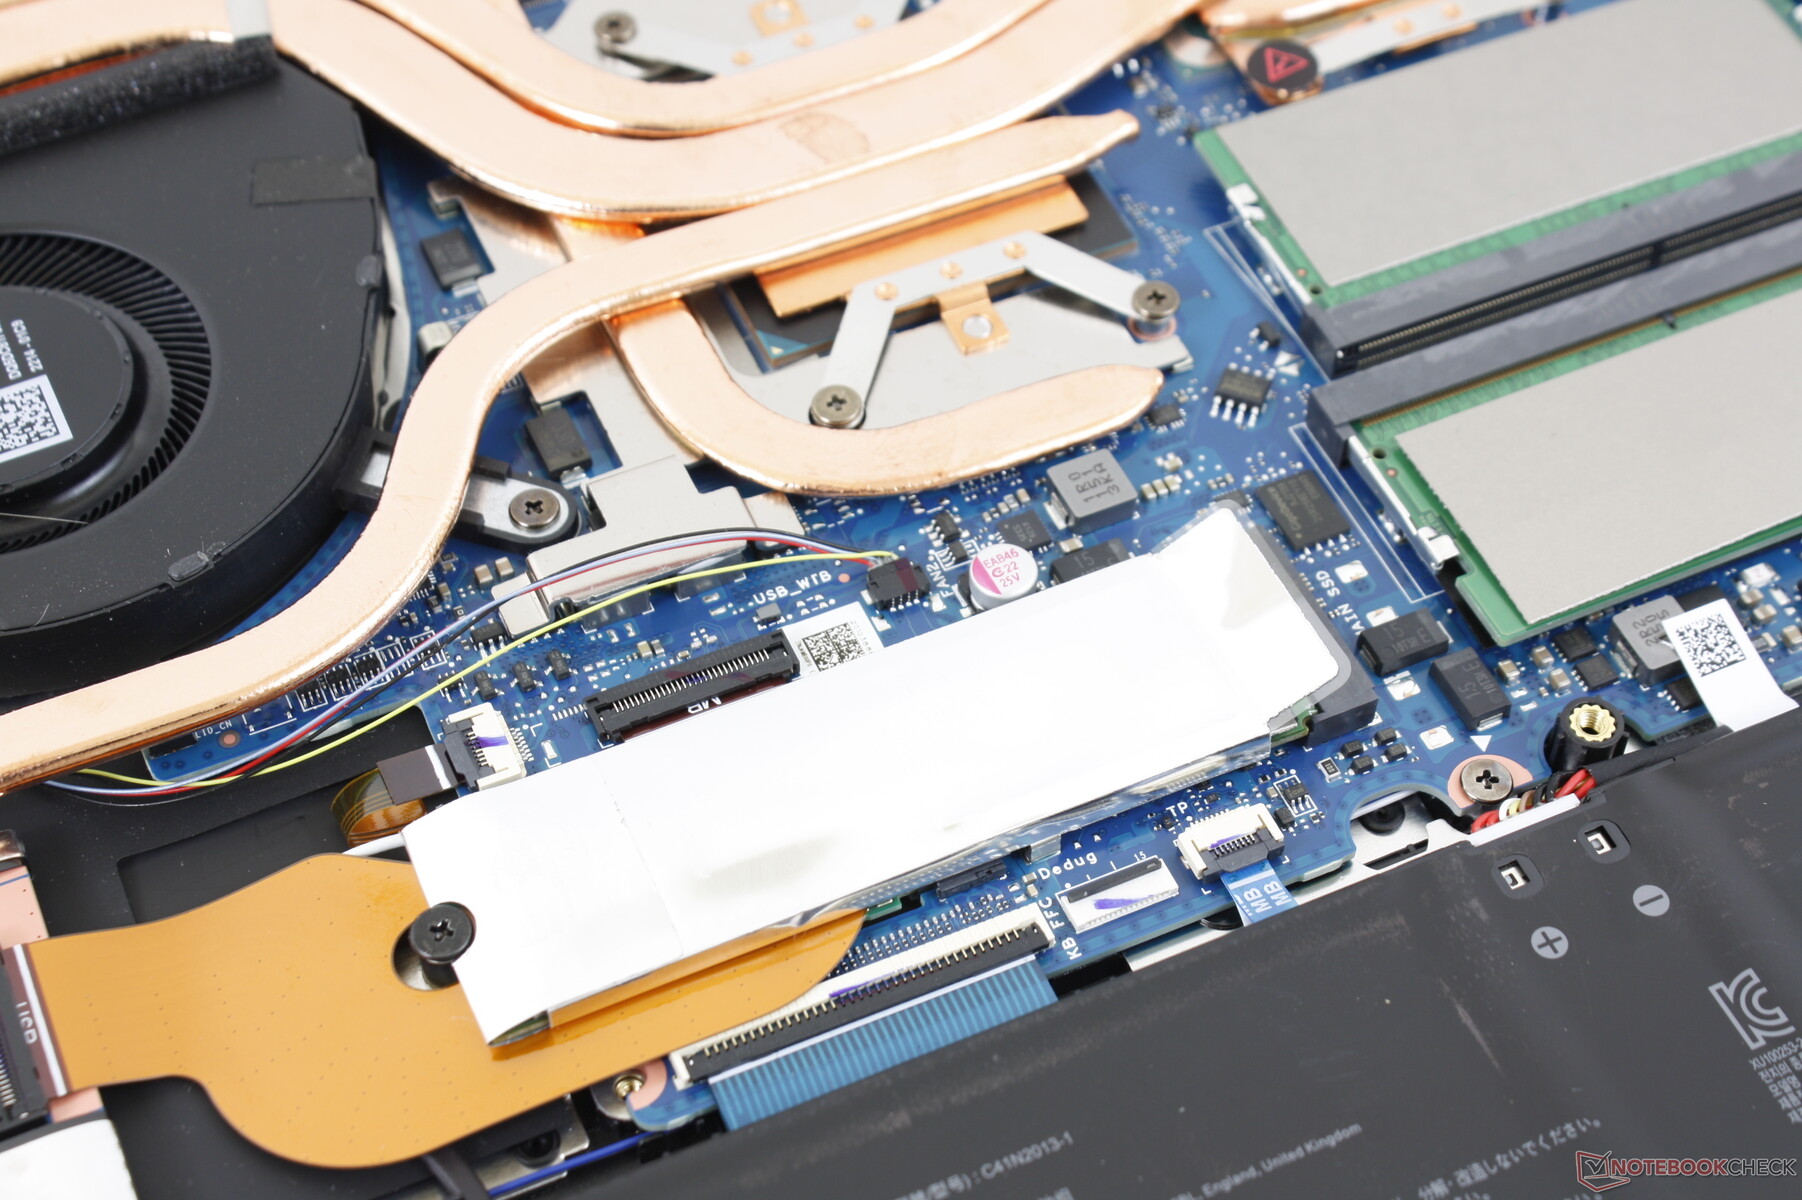
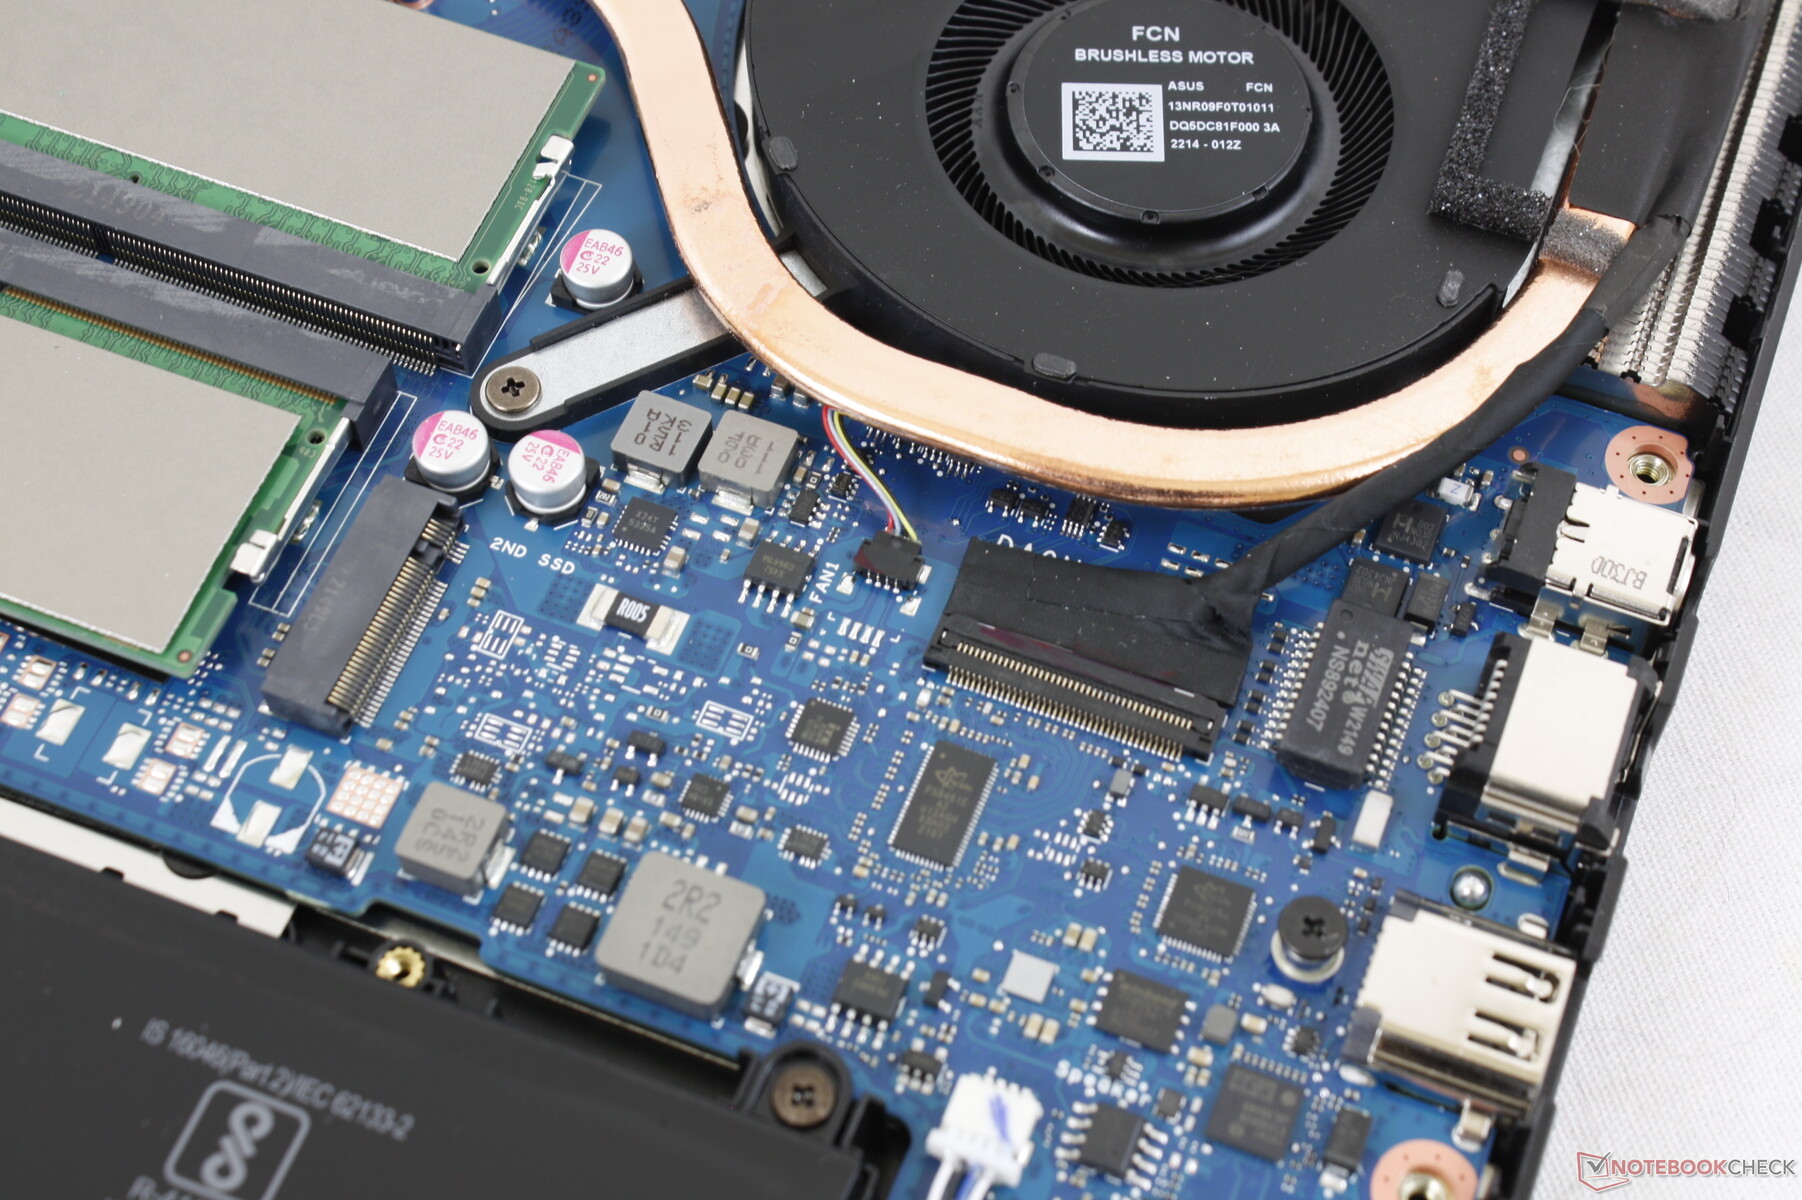
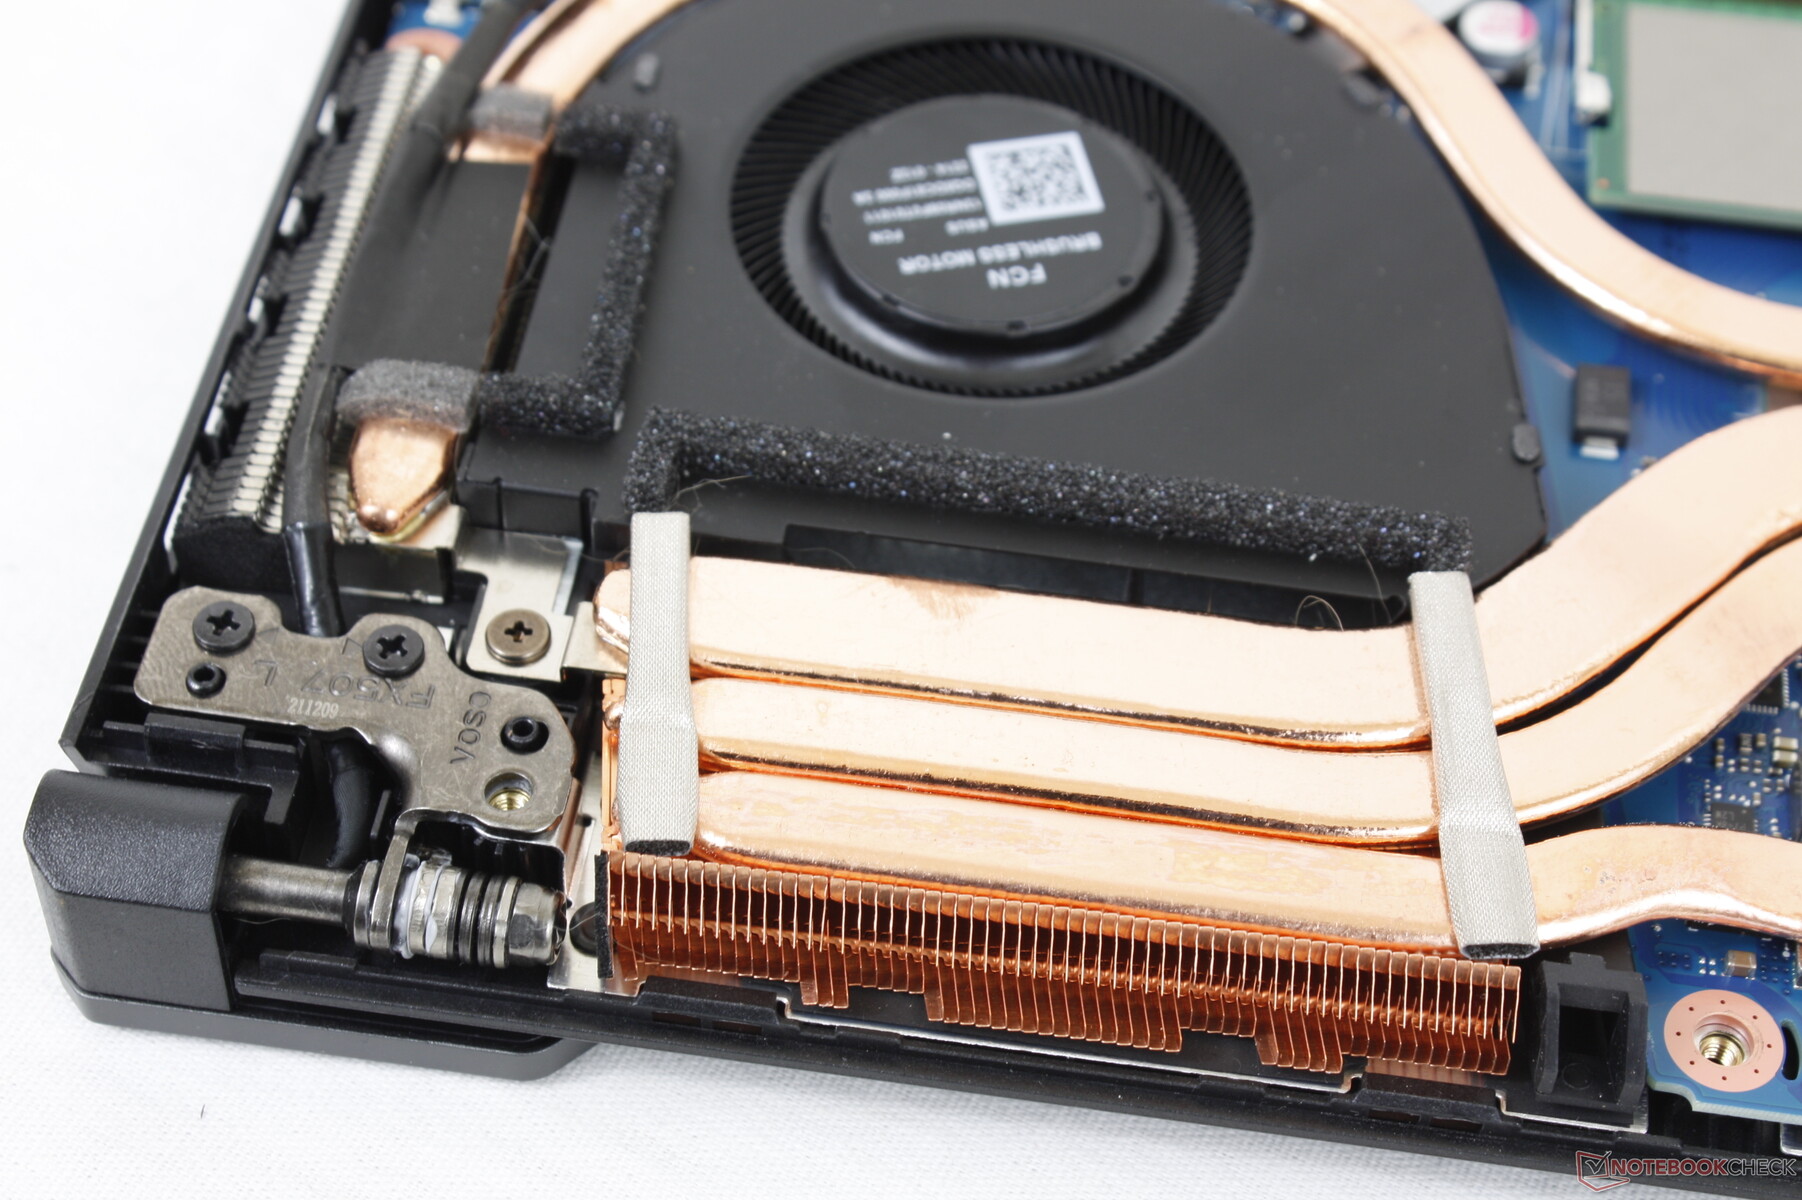
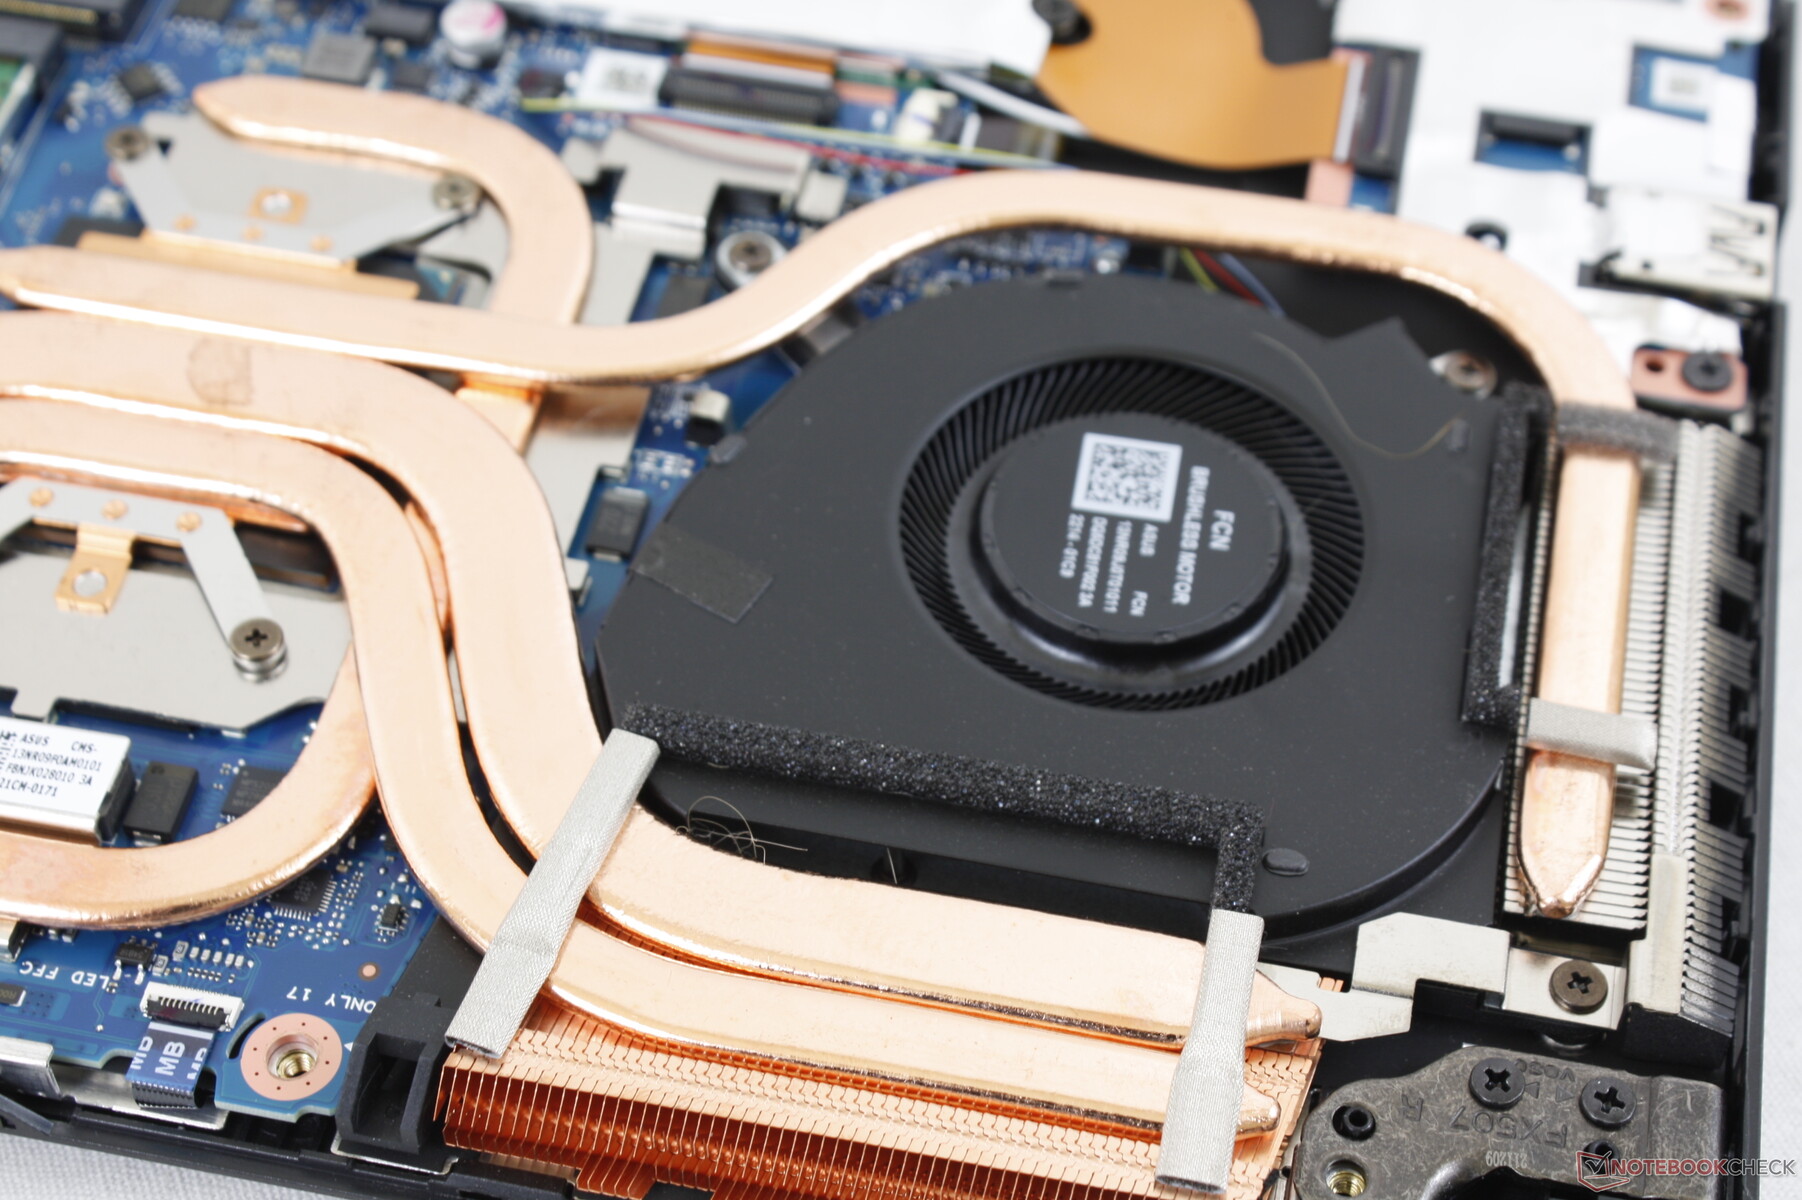
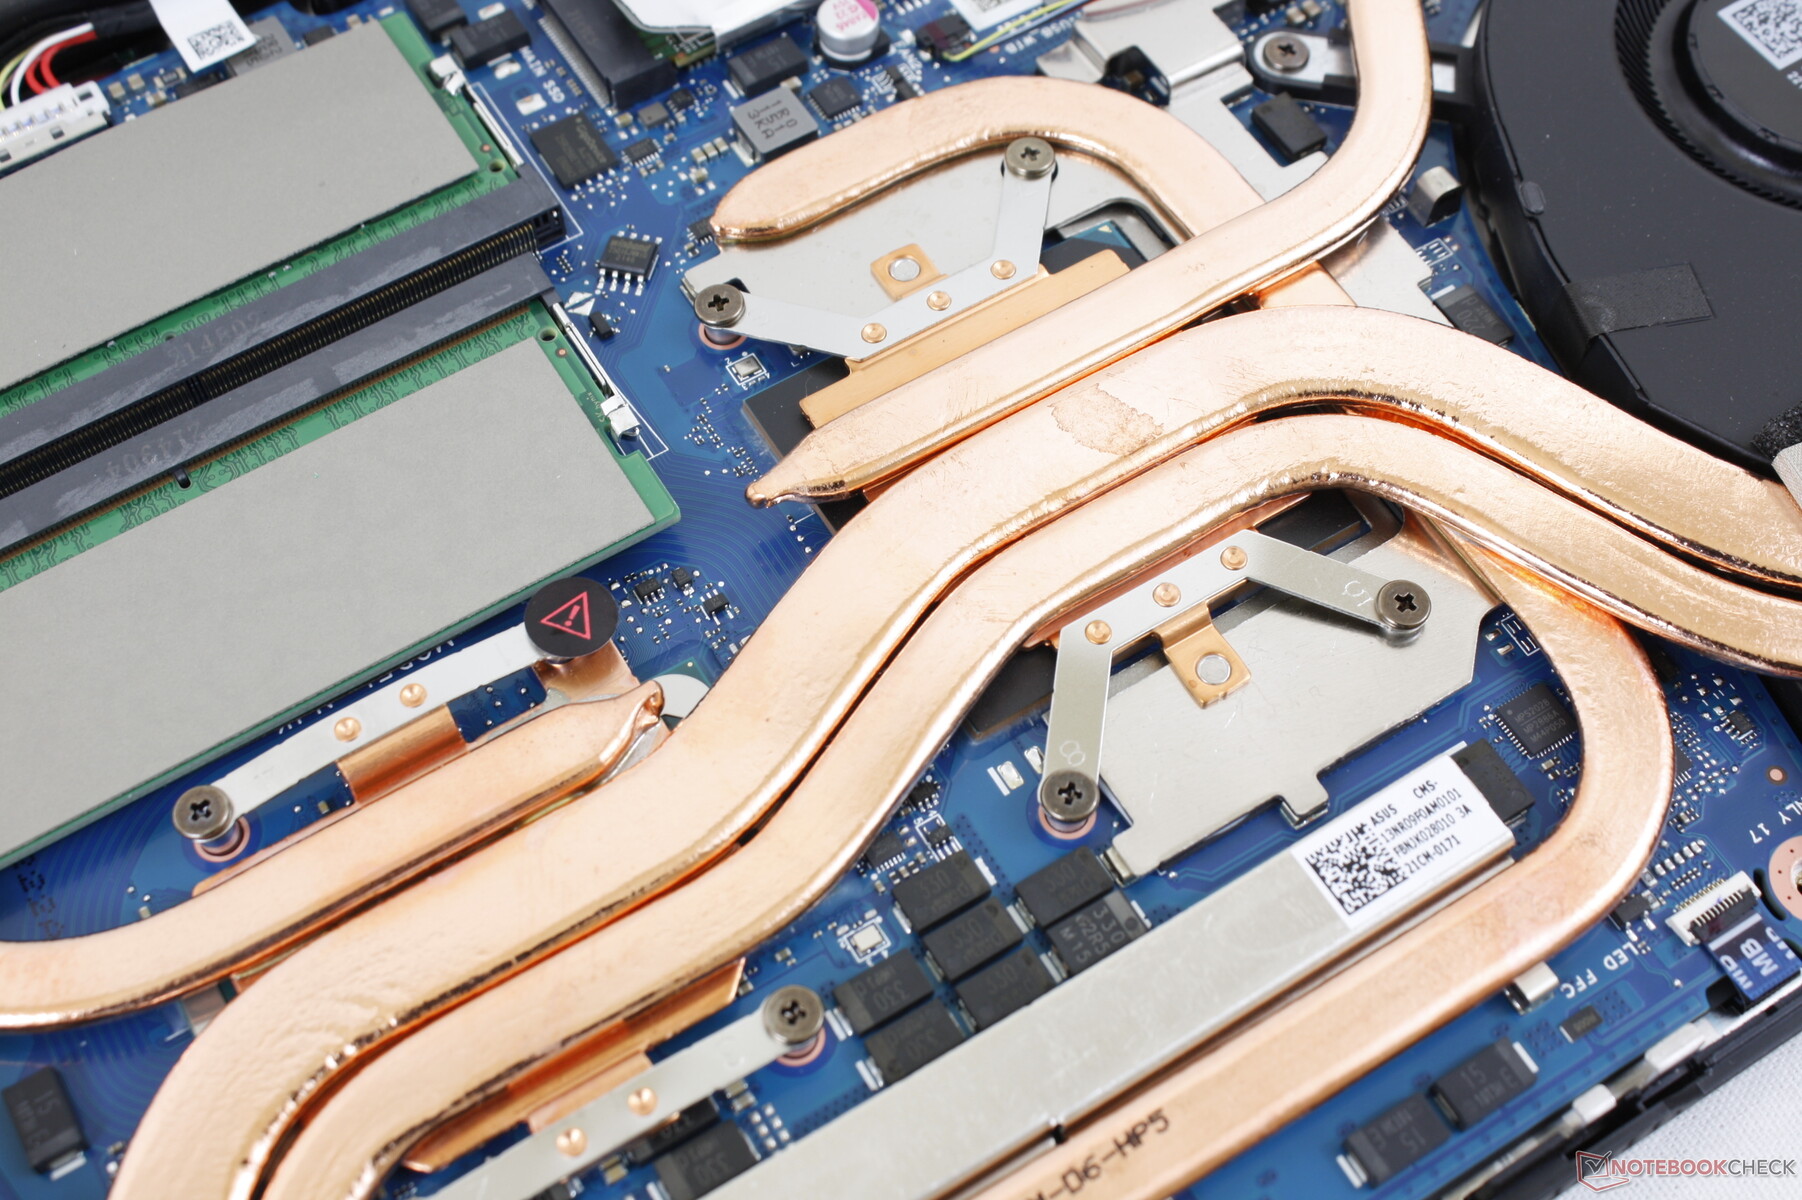
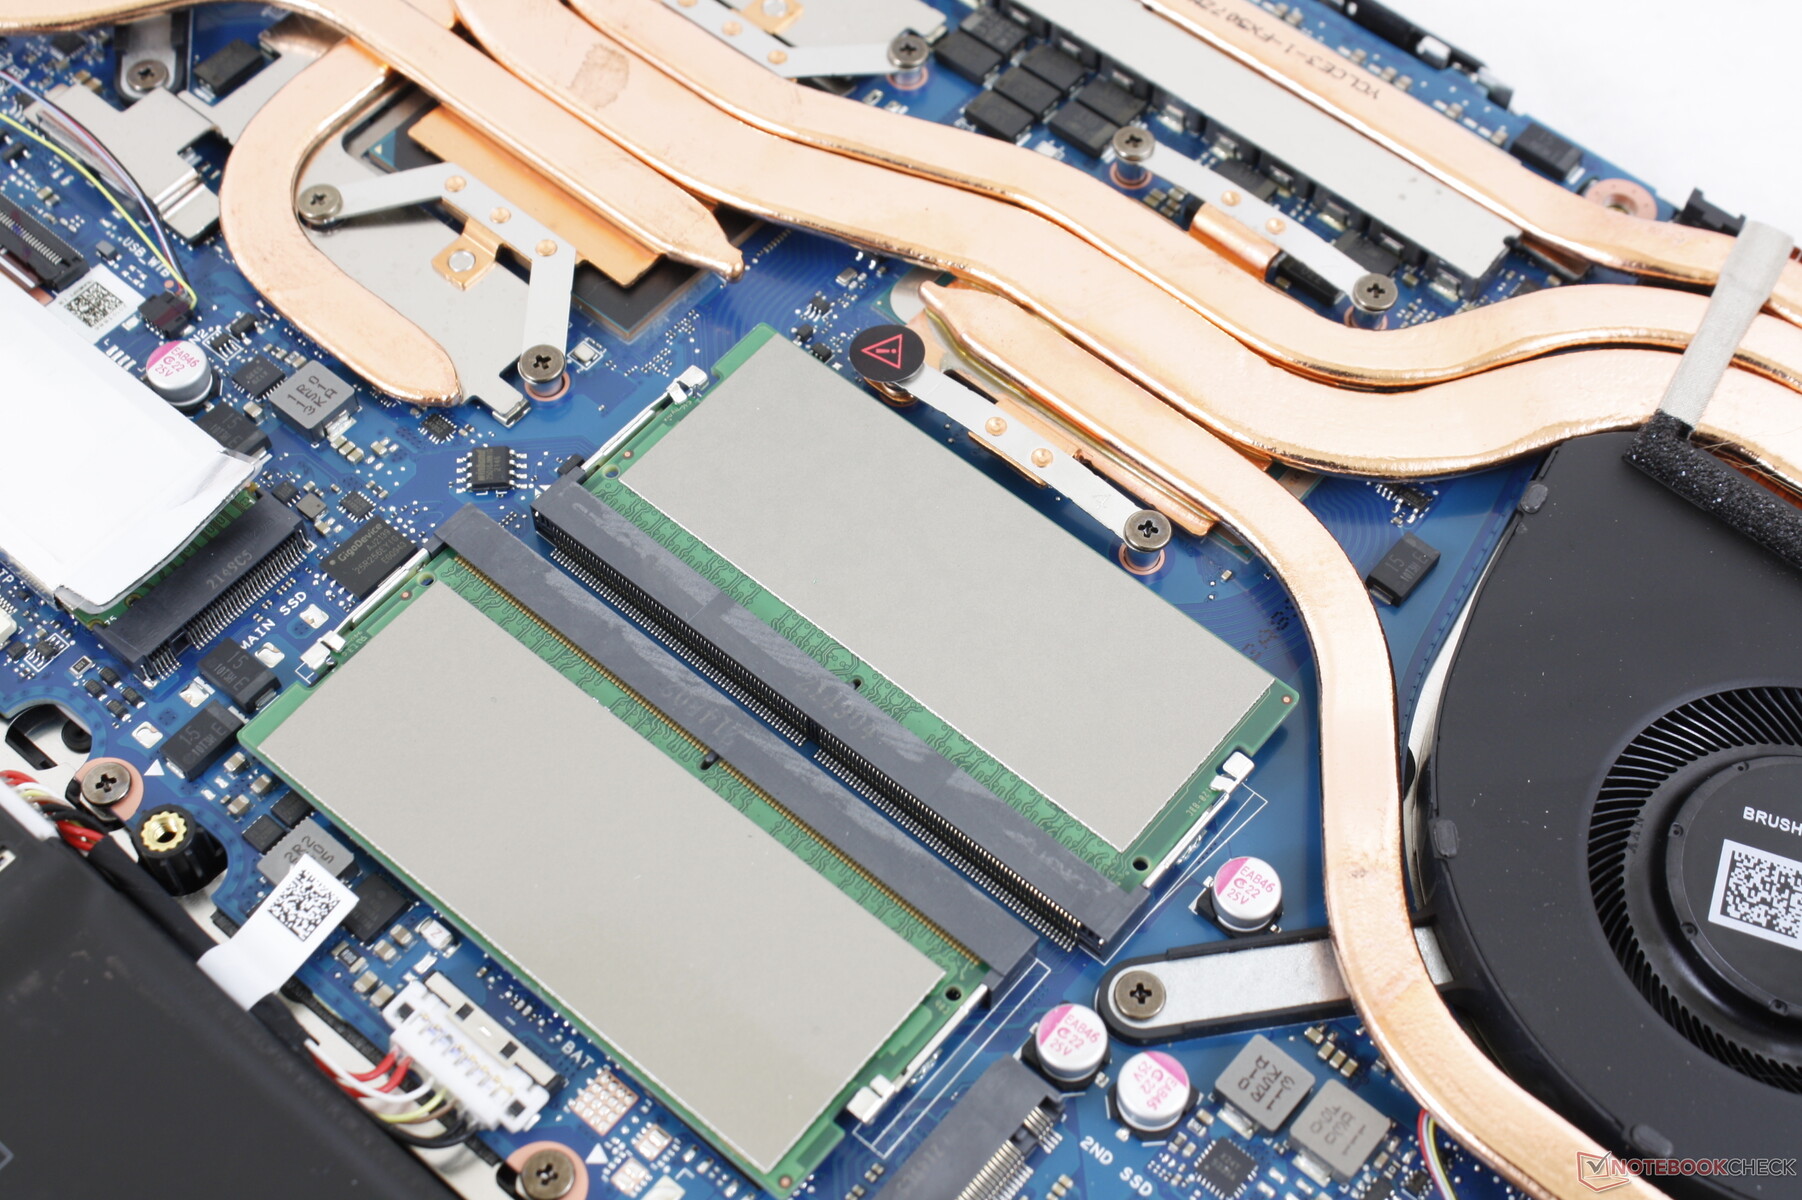
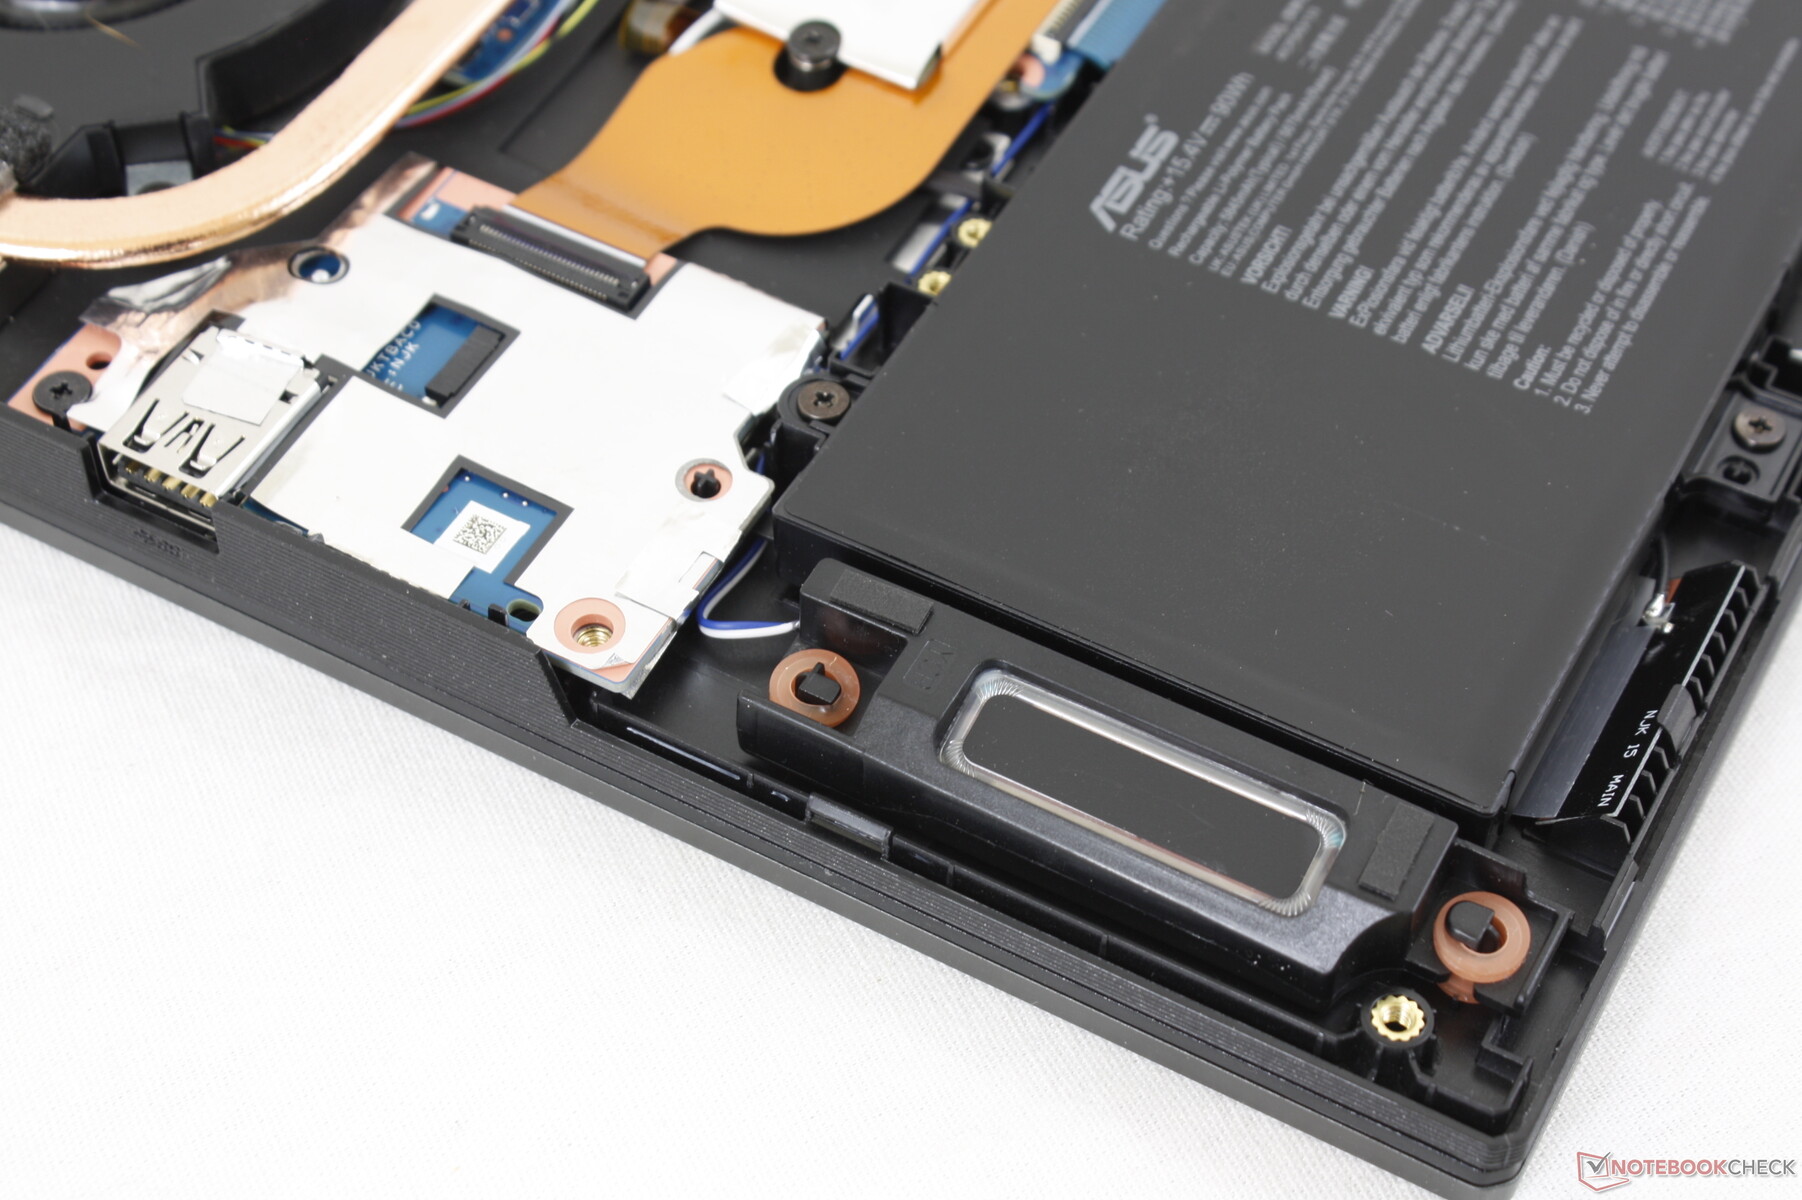
Manutenção
O painel inferior é relativamente fácil de remover com uma chave de fenda Philips e borda plana. Os internos foram reformulados como mostram as imagens de comparação abaixo, mas os 2x slots SODIMM, 2x slots M.2 SSD, e o módulo WLAN removível permanecem.
Acessórios e Garantia
Não há extras na caixa além do habitual adaptador AC e papelada. Aplica-se a típica garantia de um ano do fabricante.
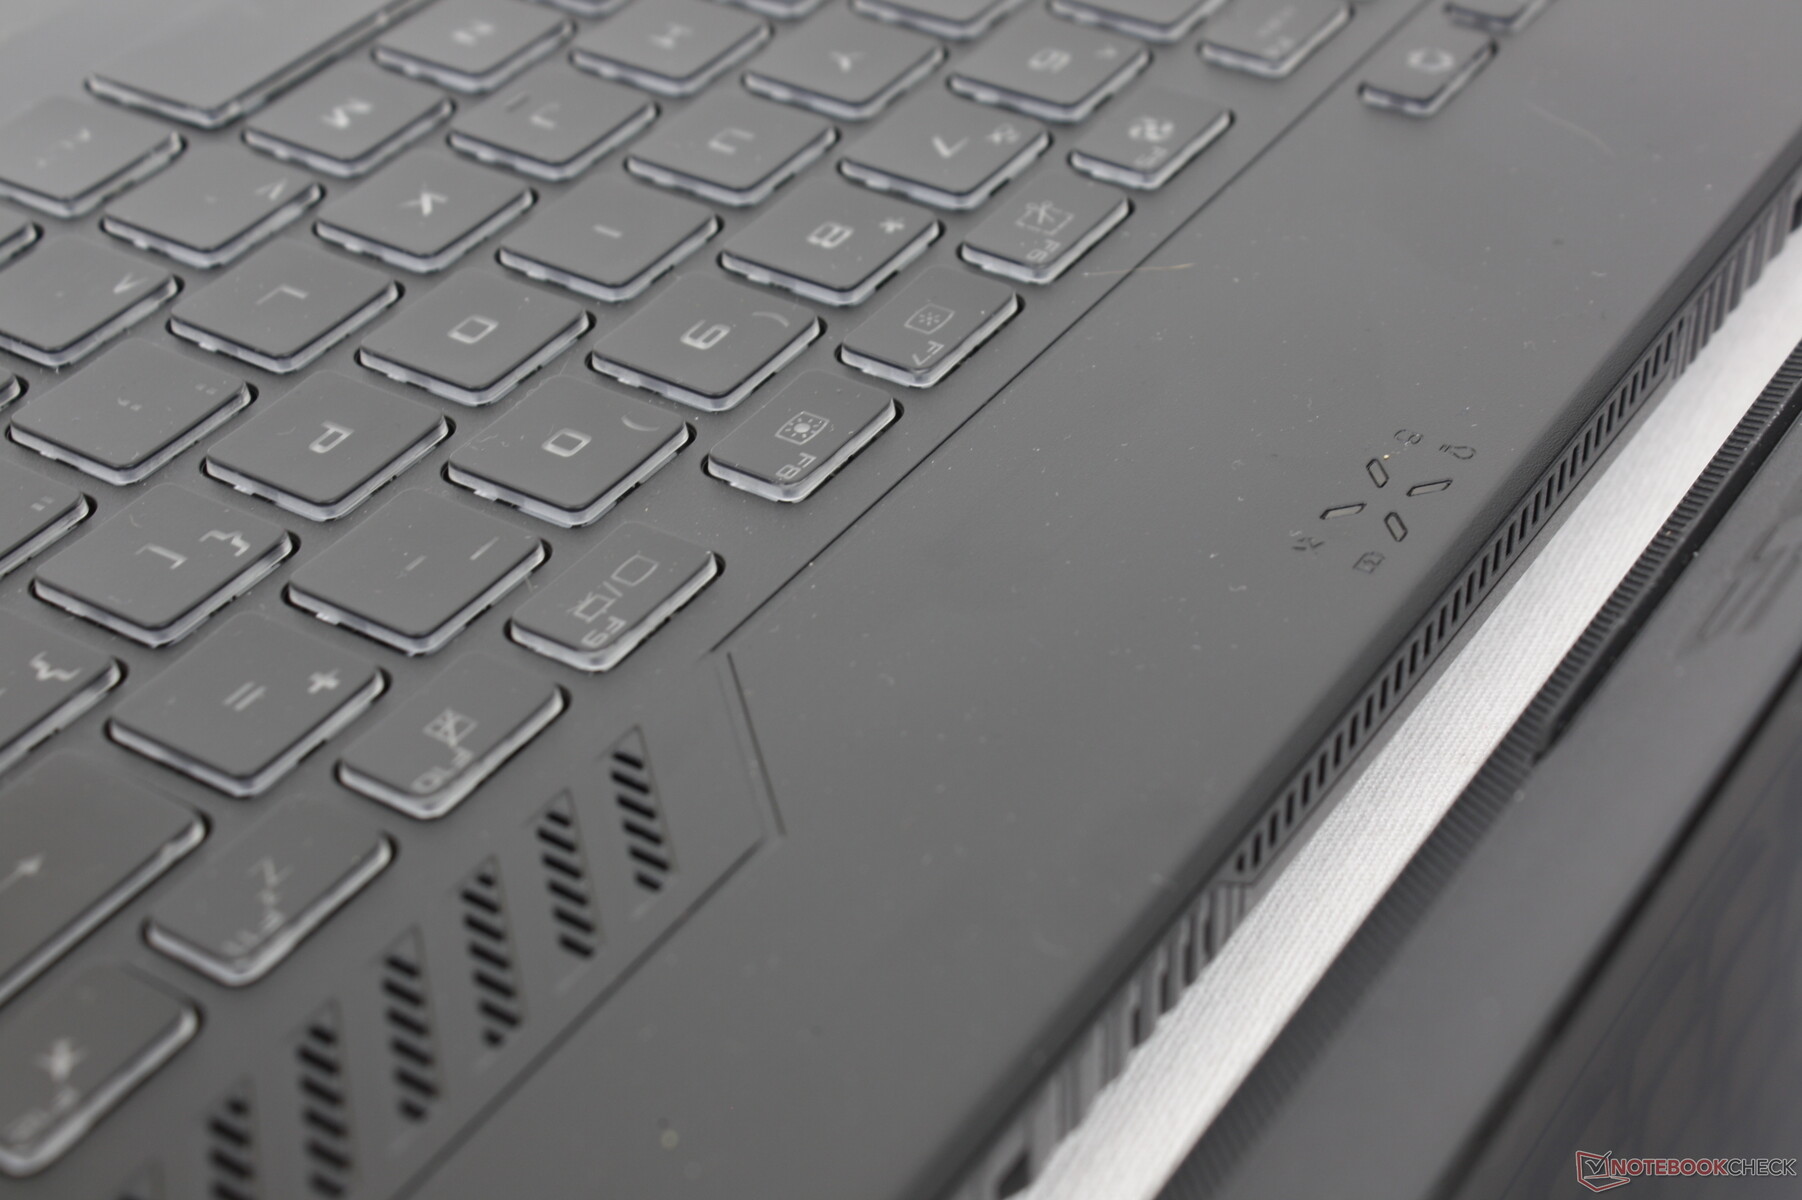
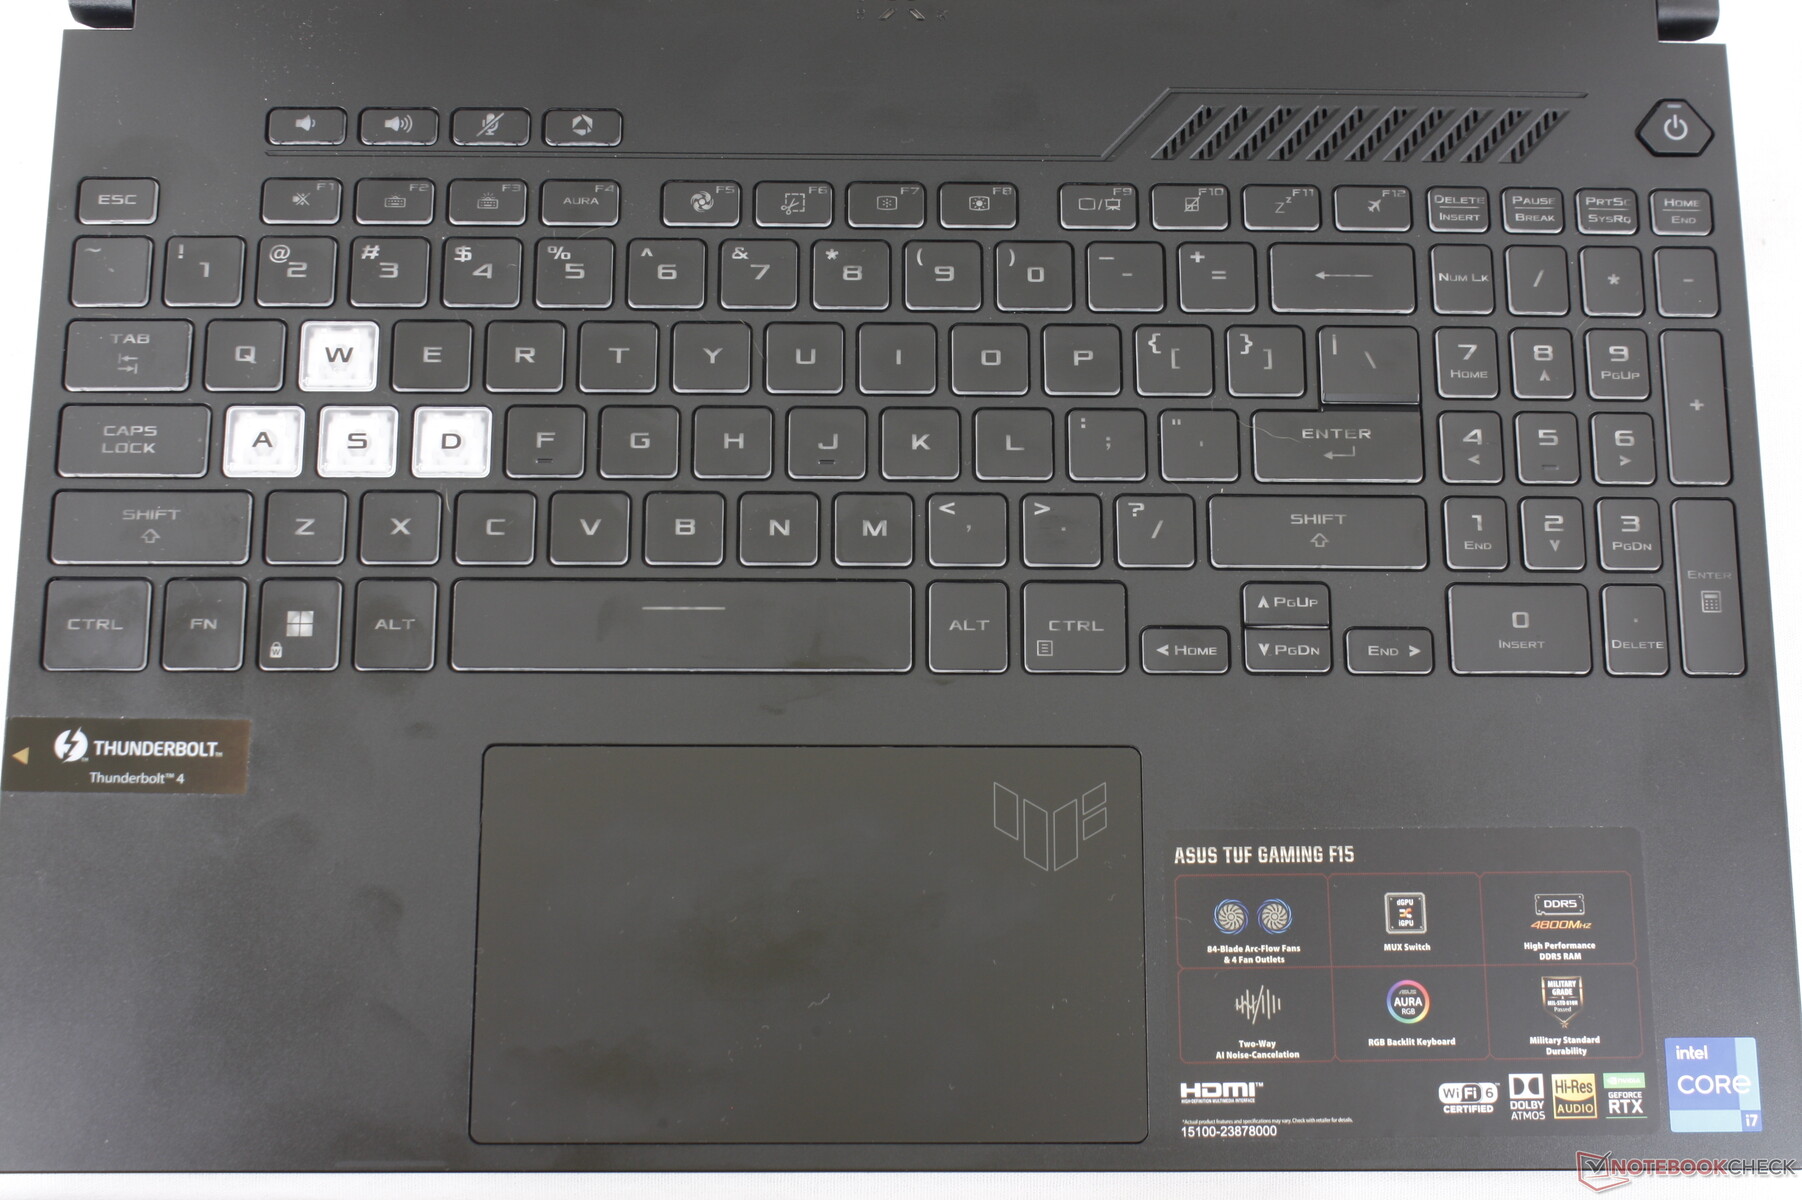
Dispositivos de entrada - Diferentes mas não necessariamente melhores
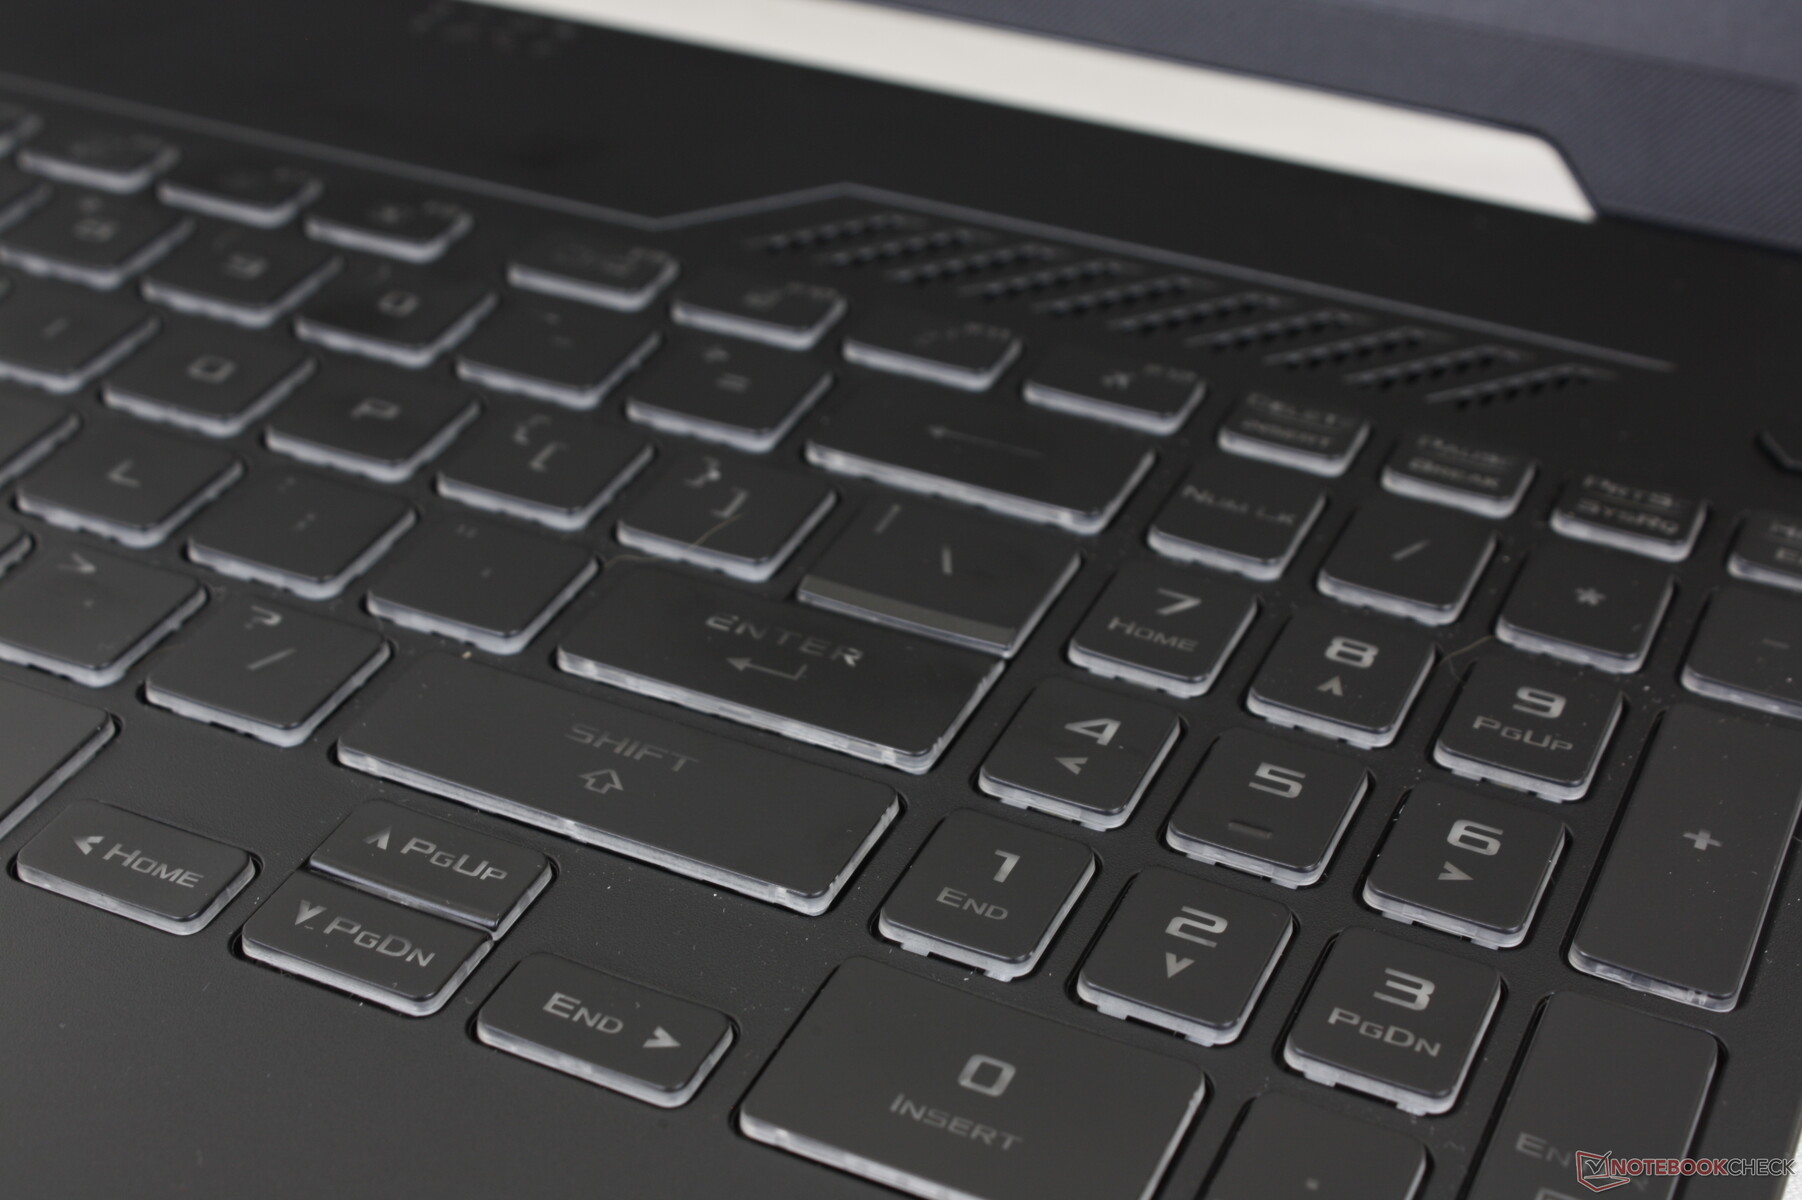
Teclado
O Asus revisou o layout do teclado quando comparado com o FX506. Algumas das teclas auxiliares estão agora em sua própria fileira perto da parte superior esquerda, enquanto as teclas de seta agora são ligeiramente mais longas em comprimento. A fonte em cada tecla também é mais escura e cinza, o que infelizmente torna a leitura mais difícil.
Tanto o feedback das teclas como a luz de fundo RGB de uma zona permanecem idênticos ano após ano. Encontramos as teclas para o lado mais claro e mais suave quando comparadas com as teclas no Eurocom RX315 enquanto que, na maioria dos modelos Zephyrus S, estão muito próximos dos teclados.
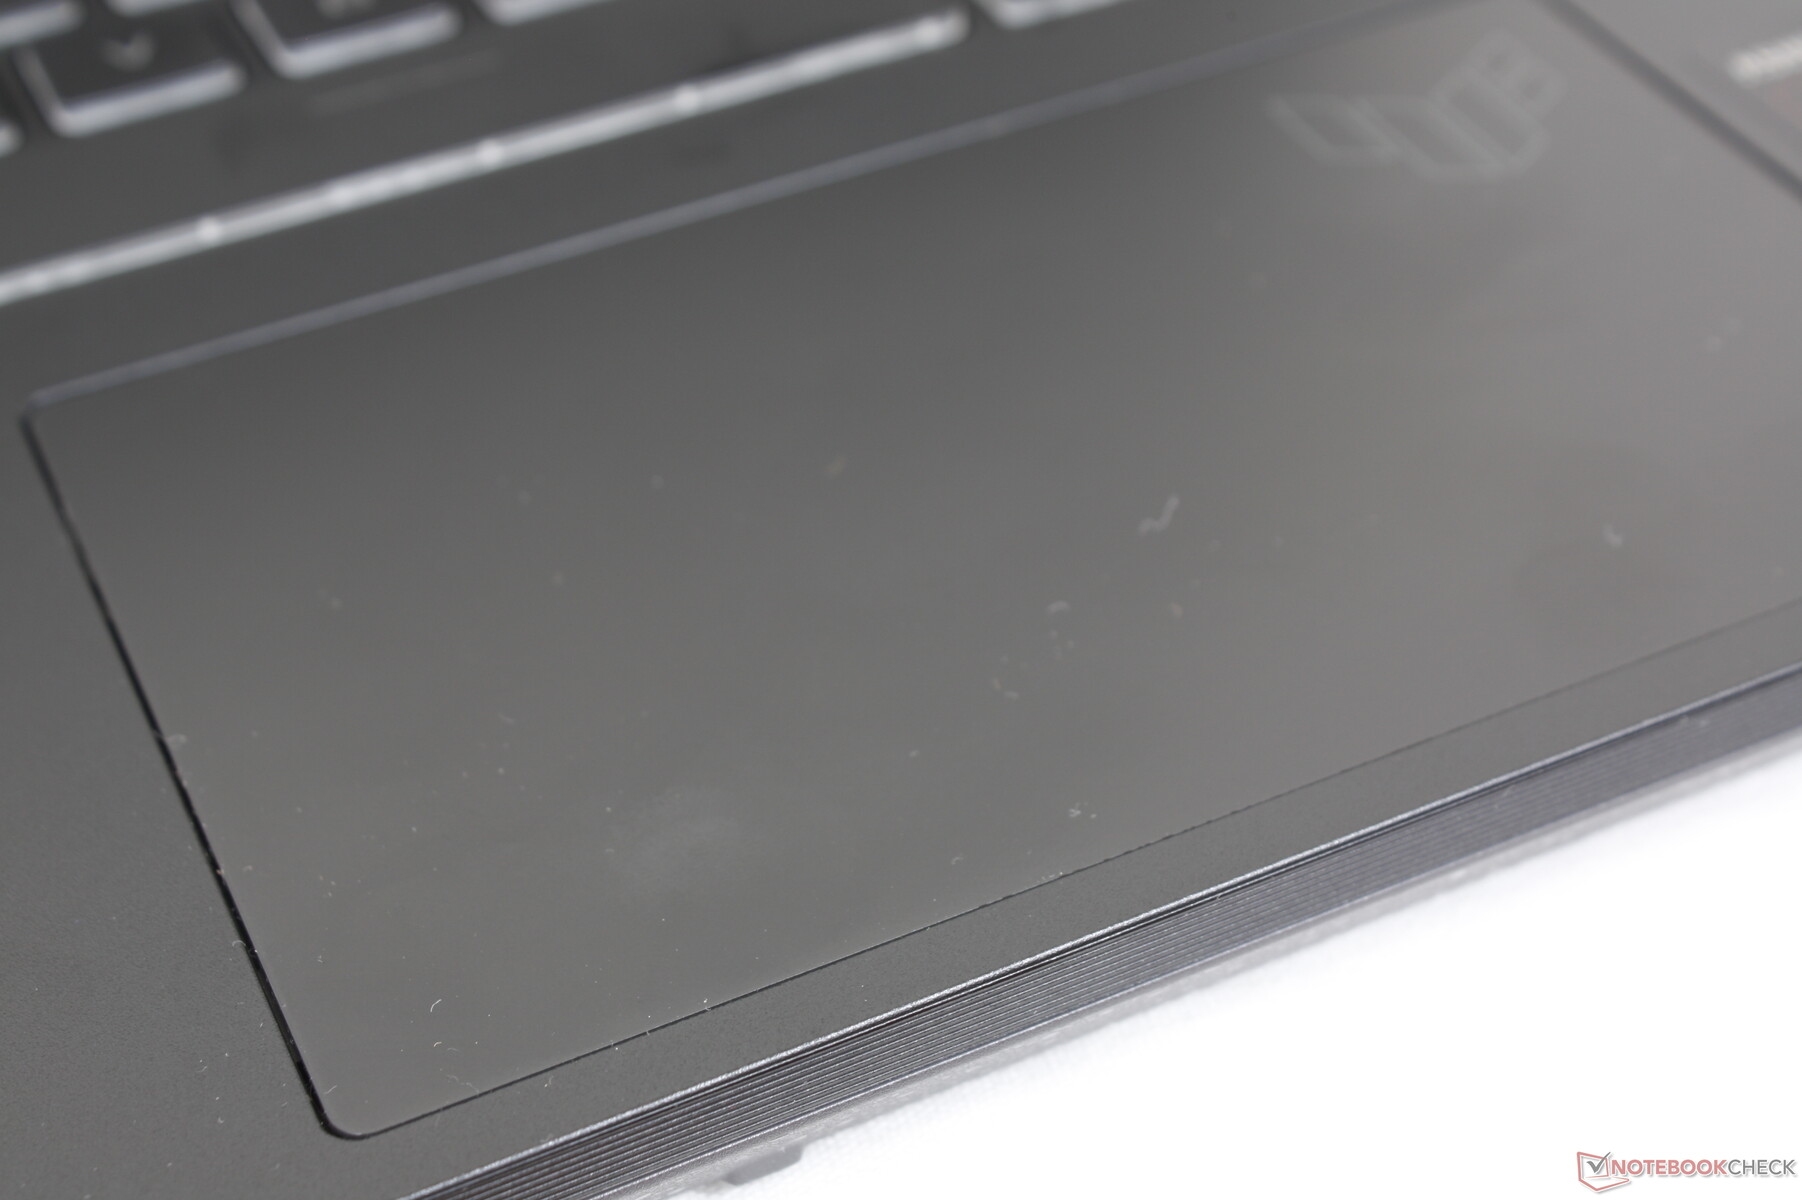
Touchpad
O FX507 deixou cair os botões dedicados do mouse sobre o FX506 para uma maior superfície de clickpad (13 x 7,8 cm vs. 10,6 x 8,0 cm). O deslizamento é suave em todas as velocidades com muito pouca aderência, mas o feedback é fraco e um pouco esponjoso quando da entrada dos cliques. As ações de arrastar e arrastar não são, portanto, tão confortáveis como na antiga FX506.

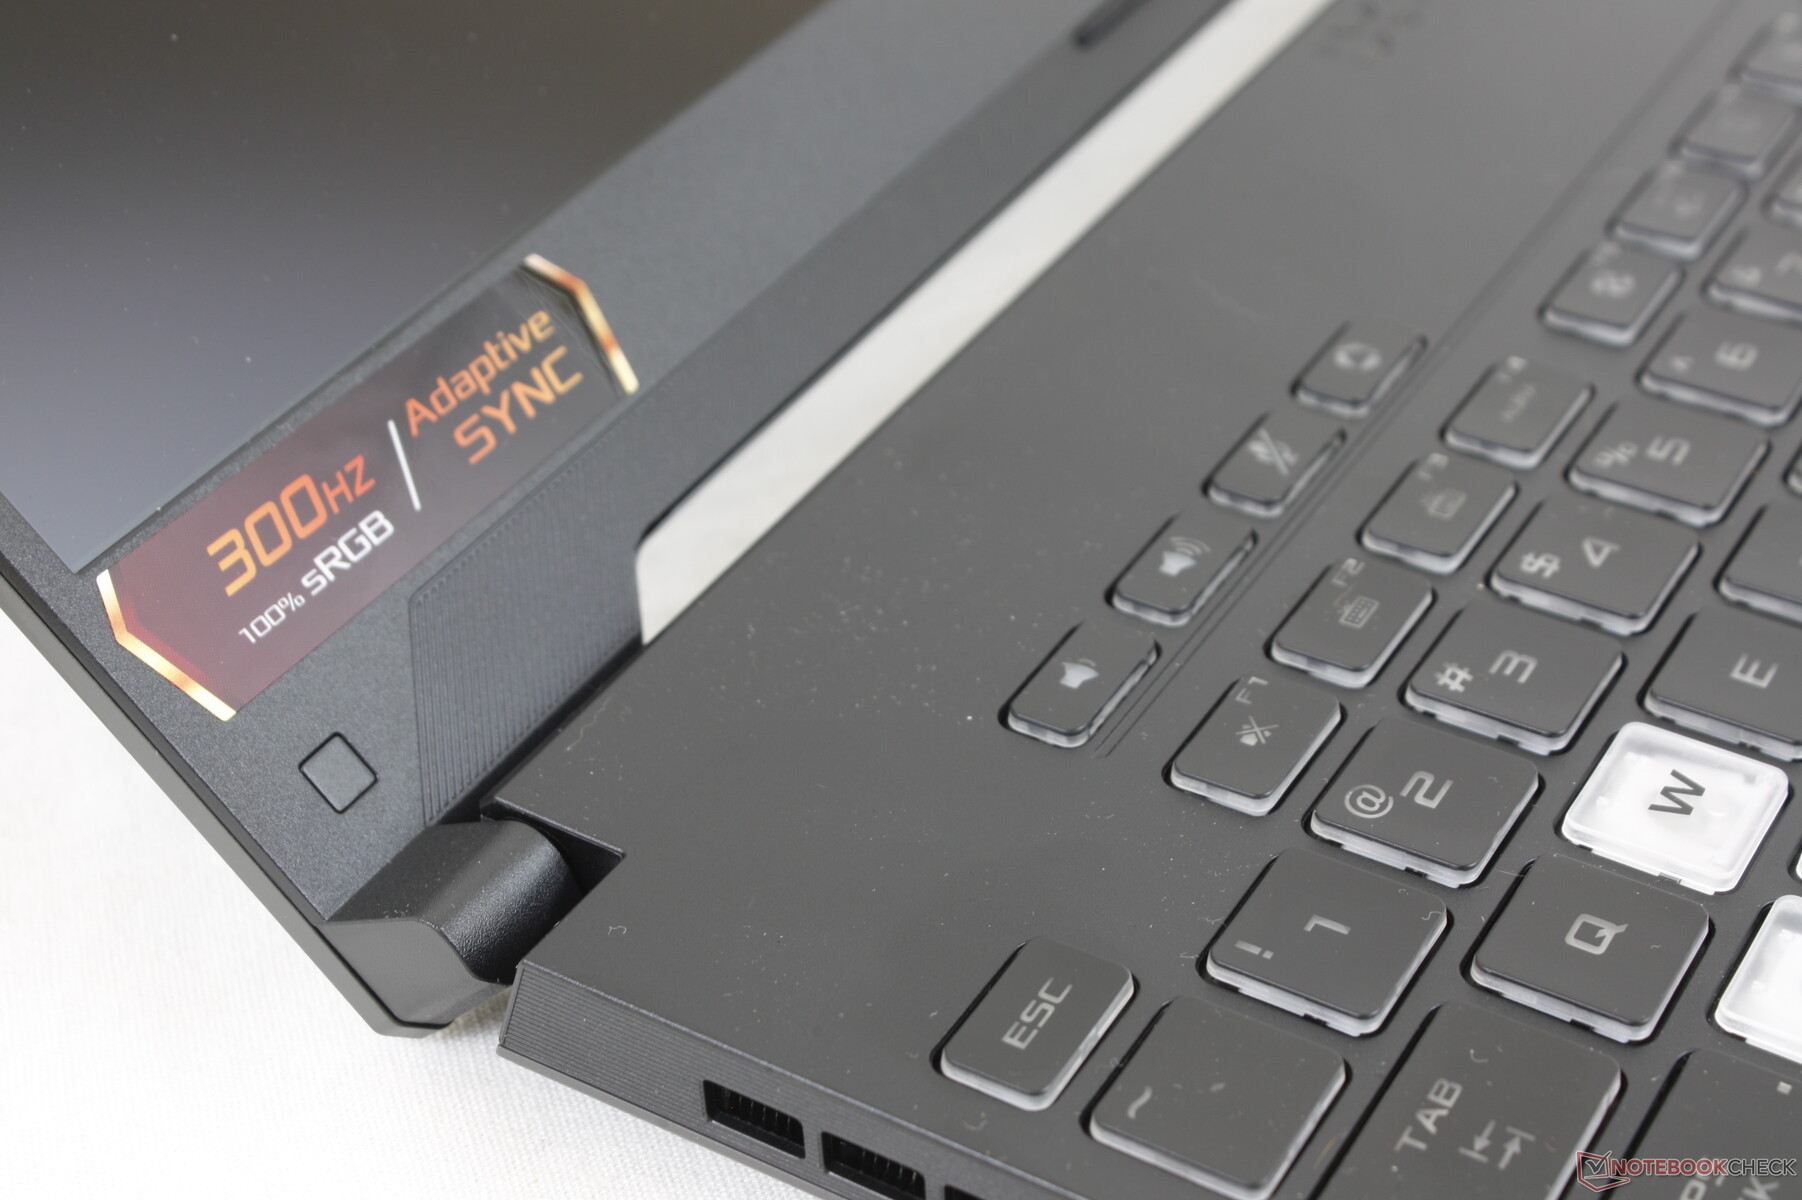
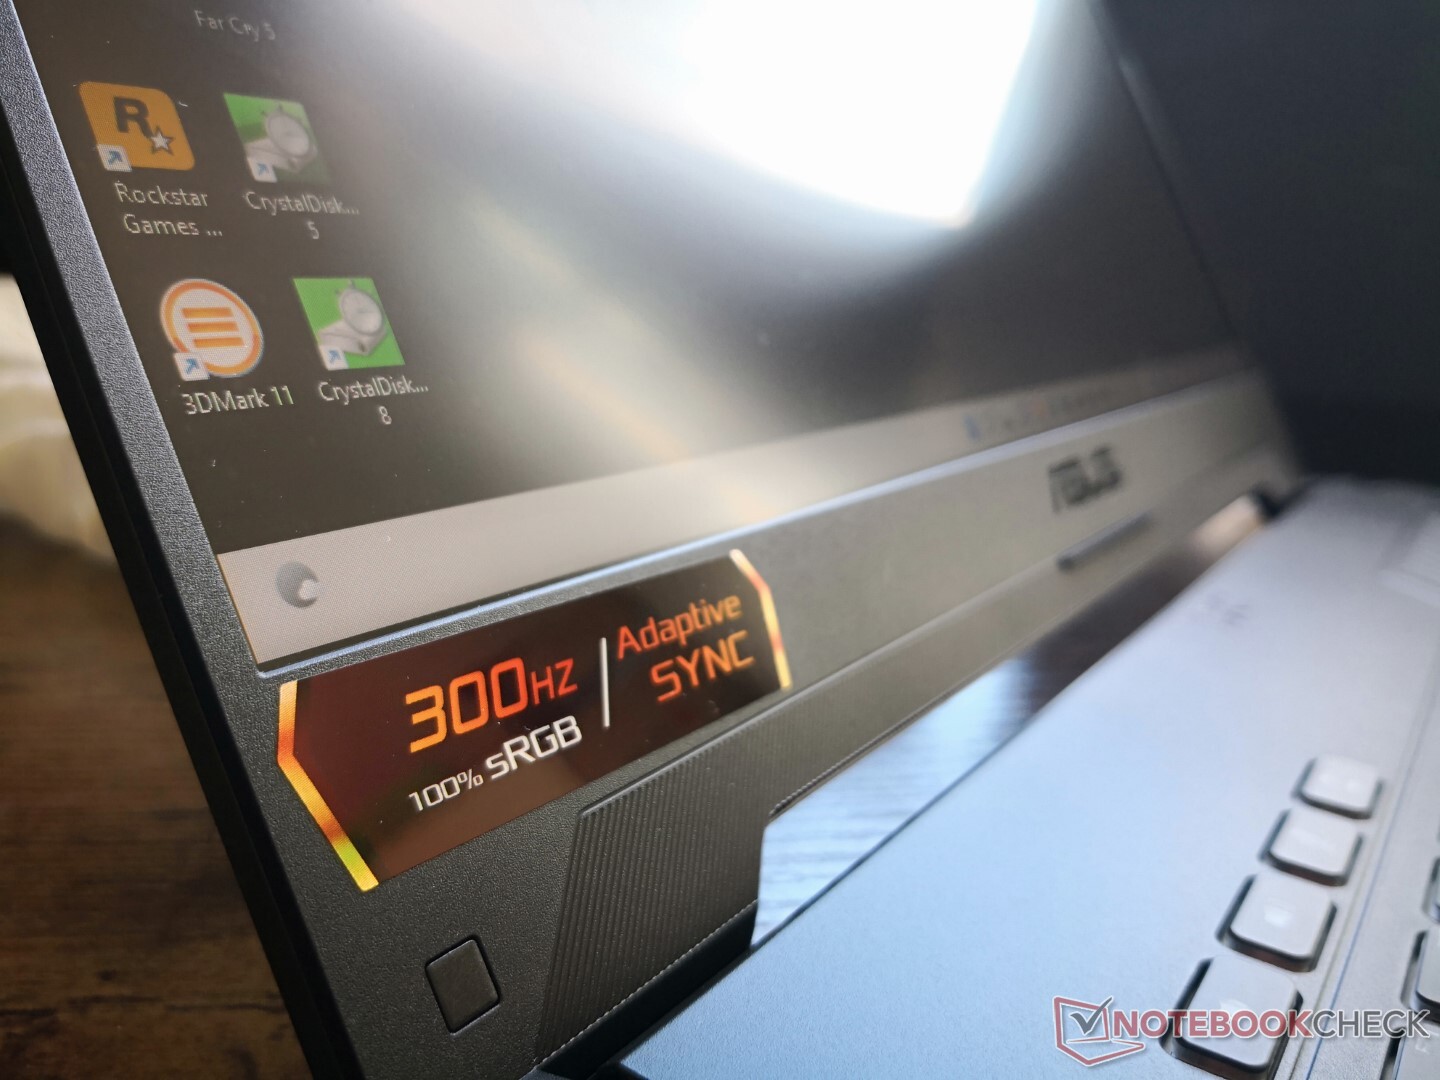
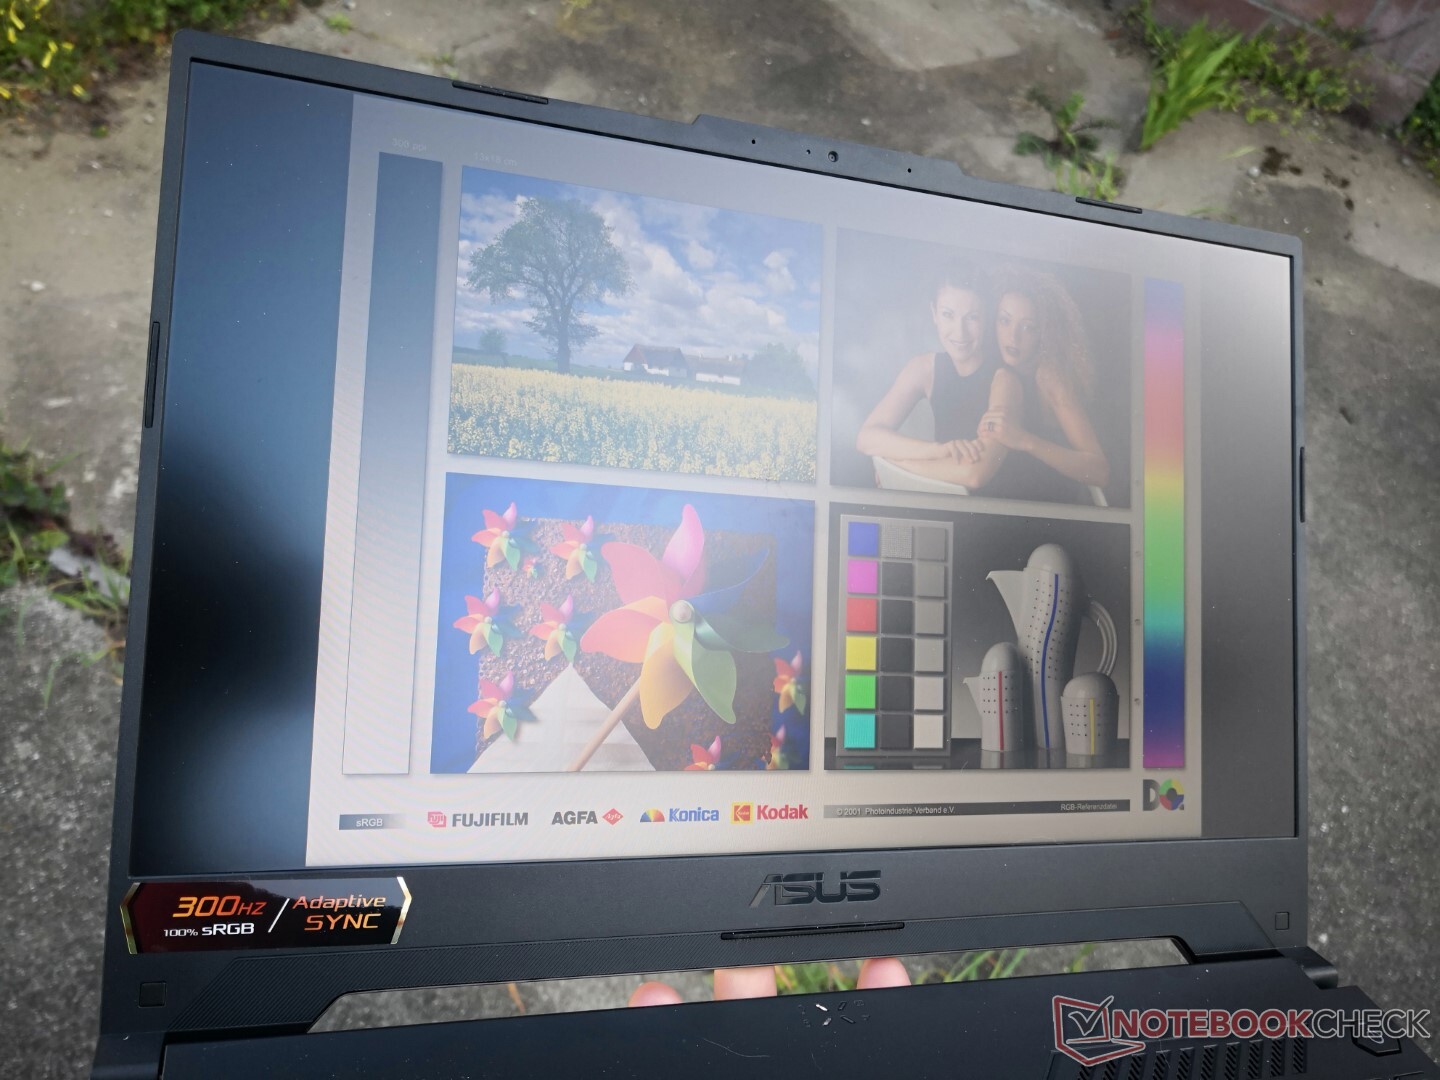
Mostrador - 300 Hz com Adaptive Sync
Asus atualizou o painel IPS LQ156M1JW26 Sharp de 240 Hz no antigo FX516PR para um painel IPS mais rápido TL156VDXP0101 de 300 Hz Sharp na FX507. Além da maior taxa de atualização, o painel mais novo também oferece tempos de resposta cinza mais rápidos e uma luz de fundo mais brilhante, mantendo aproximadamente a mesma relação de contraste e gama que na FX516PR.
Estamos felizes em ver que o Asus deixou cair o horrível painel Chi Mei no FX506, que tinha cores e tempos de resposta significativamente inferiores.

| |||||||||||||||||||||||||
iluminação: 89 %
iluminação com acumulador: 353.7 cd/m²
Contraste: 1040:1 (Preto: 0.34 cd/m²)
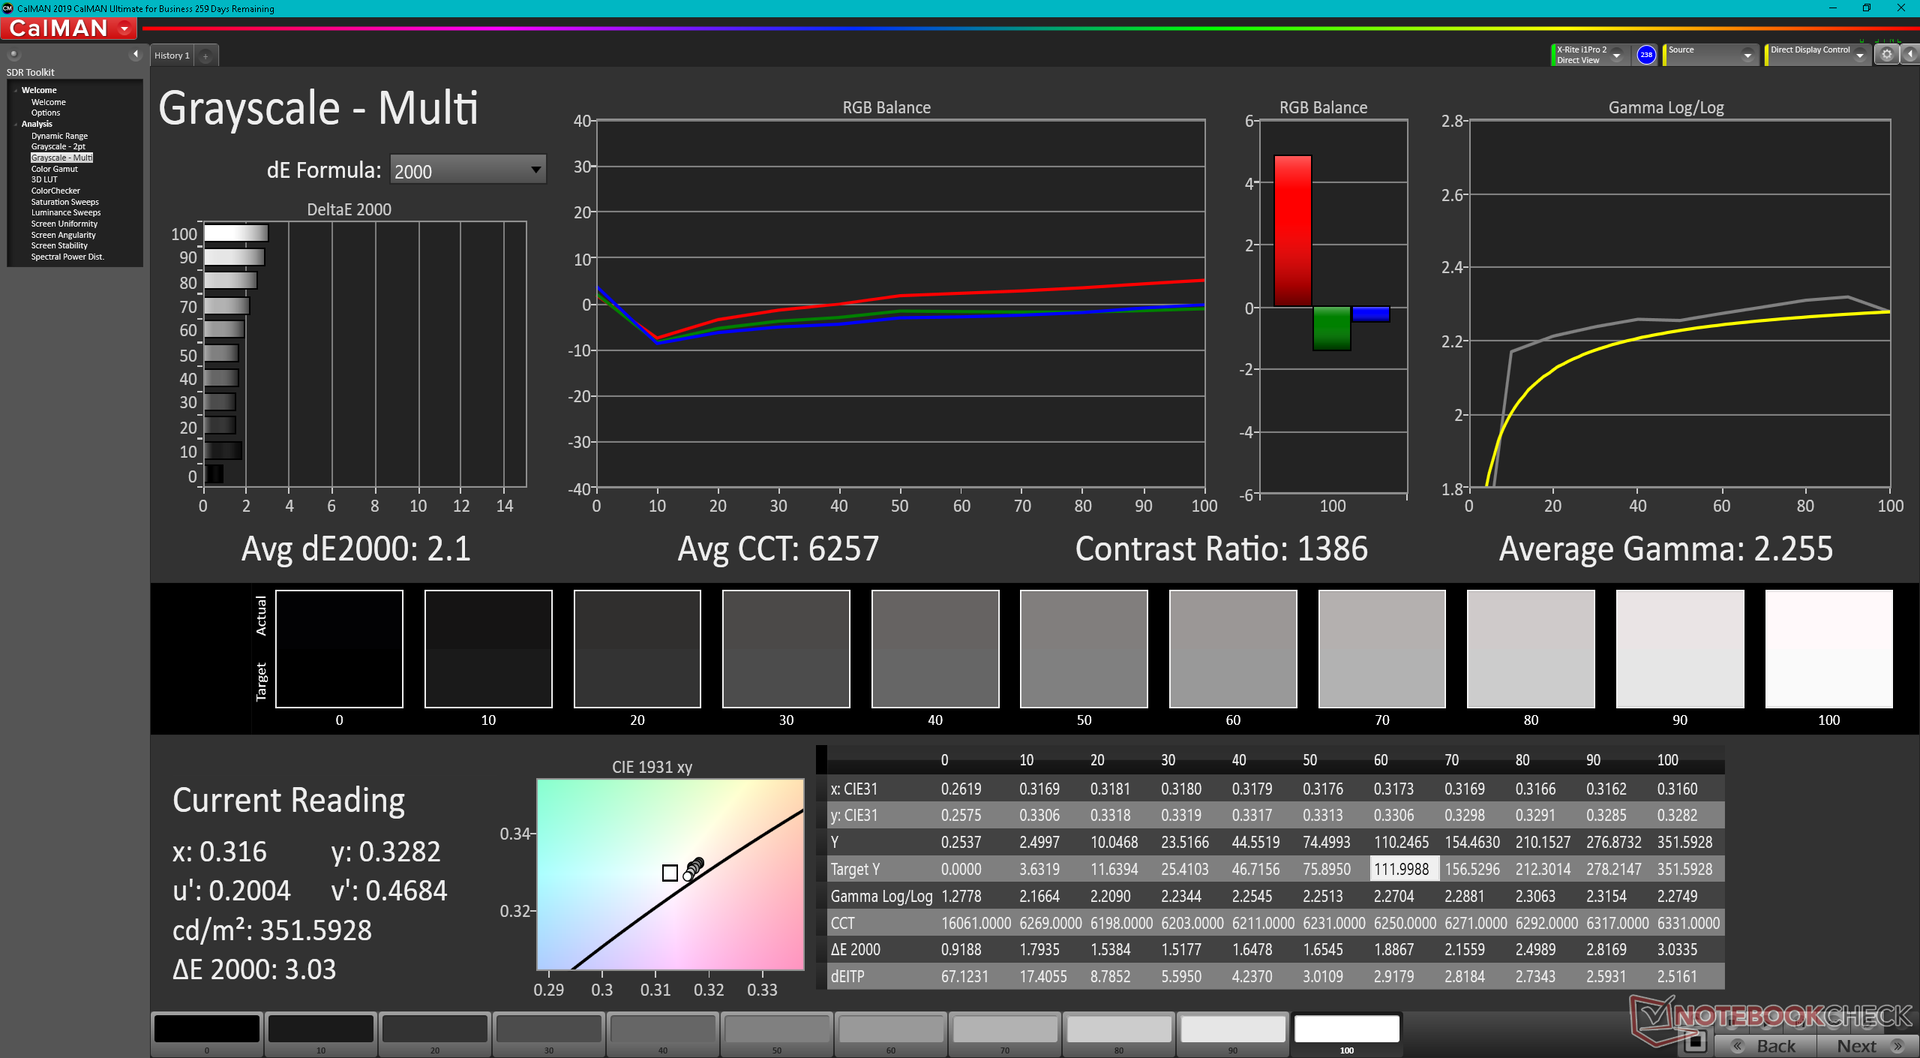
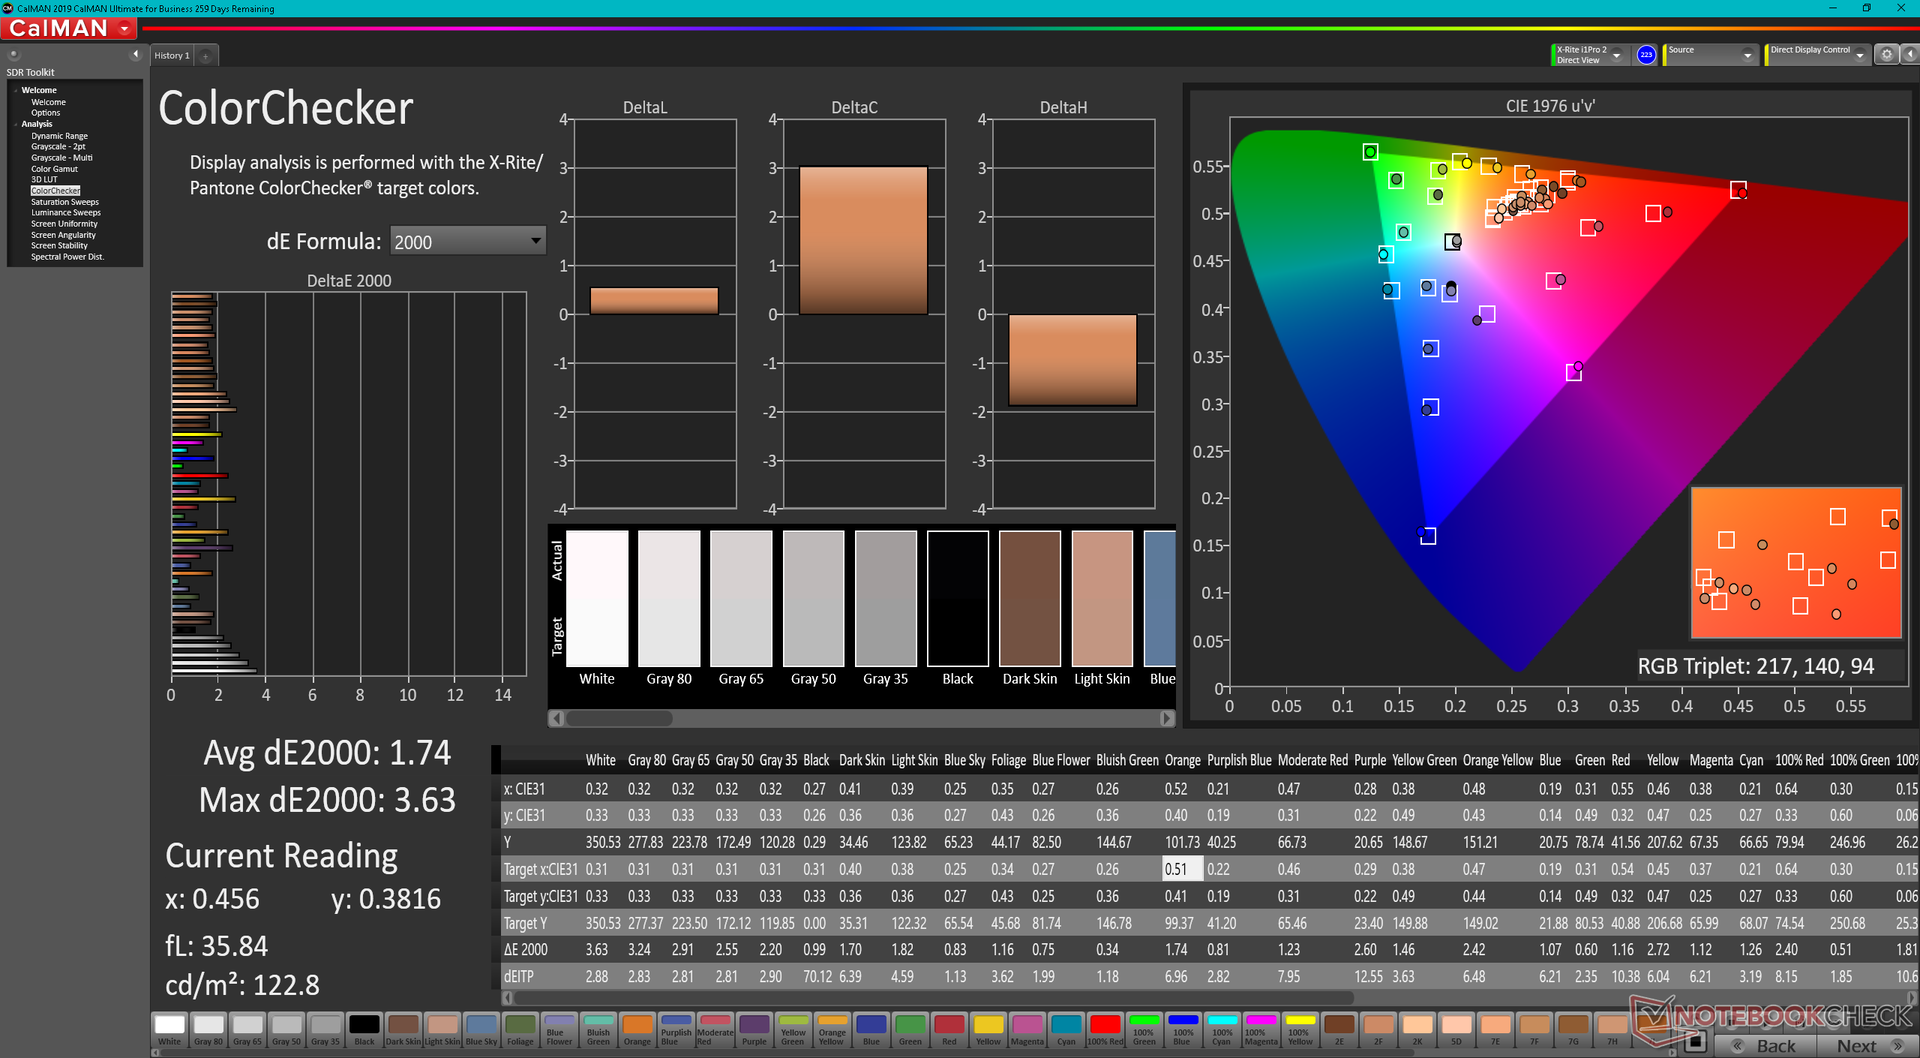
ΔE ColorChecker Calman: 1.74 | ∀{0.5-29.43 Ø4.71}
calibrated: 0.5
ΔE Greyscale Calman: 2.1 | ∀{0.09-98 Ø4.96}
68.5% AdobeRGB 1998 (Argyll 3D)
97% sRGB (Argyll 3D)
66.4% Display P3 (Argyll 3D)
Gamma: 2.3
CCT: 6257 K
| Asus TUF Gaming F15 FX507ZM TL156VDXP0101, IPS, 1920x1080, 15.6" | Asus TUF Gaming F15 FX506HM Chi Mei N156HRA-EA1, IPS, 1920x1080, 15.6" | Asus TUF Dash F15 FX516PR LQ156M1JW26 (SHP1532), IPS, 1920x1080, 15.6" | Asus ROG Strix Scar 15 G533QS BOE CQ NE156QHM-NY1, IPS, 2560x1440, 15.6" | Asus Zephyrus S15 GX502L B156HAN12.0 (AUOBC8C), IPS, 1920x1080, 15.6" | Asus ZenBook Pro Duo UX582 LR-1BH2 SDC4143, OLED + IPS, 3840x2160, 15.6" | |
|---|---|---|---|---|---|---|
| Display | -36% | 0% | 25% | 4% | 33% | |
| Display P3 Coverage (%) | 66.4 | 41.9 -37% | 66.9 1% | 97.6 47% | 69.7 5% | 99.9 50% |
| sRGB Coverage (%) | 97 | 62.9 -35% | 98.1 1% | 99.9 3% | 99.7 3% | 100 3% |
| AdobeRGB 1998 Coverage (%) | 68.5 | 43.3 -37% | 67.9 -1% | 85.3 25% | 71.1 4% | 99.7 46% |
| Response Times | -238% | -46% | -74% | -63% | 69% | |
| Response Time Grey 50% / Grey 80% * (ms) | 5.6 ? | 28.4 ? -407% | 12 ? -114% | 14 ? -150% | 14 ? -150% | 2.4 ? 57% |
| Response Time Black / White * (ms) | 12.8 ? | 21.6 ? -69% | 10 ? 22% | 12.4 ? 3% | 9.6 ? 25% | 2.4 ? 81% |
| PWM Frequency (Hz) | 23580 ? | 59.5 ? | ||||
| Screen | -144% | -27% | -70% | -29% | -87% | |
| Brightness middle (cd/m²) | 353.7 | 268.3 -24% | 286 -19% | 304.3 -14% | 283 -20% | 345 -2% |
| Brightness (cd/m²) | 340 | 257 -24% | 275 -19% | 286 -16% | 289 -15% | 332 -2% |
| Brightness Distribution (%) | 89 | 84 -6% | 91 2% | 76 -15% | 90 1% | 87 -2% |
| Black Level * (cd/m²) | 0.34 | 0.34 -0% | 0.25 26% | 0.33 3% | 0.24 29% | |
| Contrast (:1) | 1040 | 789 -24% | 1144 10% | 922 -11% | 1179 13% | |
| Colorchecker dE 2000 * | 1.74 | 5.05 -190% | 2.43 -40% | 2.76 -59% | 2.26 -30% | 3.3 -90% |
| Colorchecker dE 2000 max. * | 3.63 | 15.43 -325% | 6.33 -74% | 5.57 -53% | 5.64 -55% | 7.2 -98% |
| Colorchecker dE 2000 calibrated * | 0.5 | 3.21 -542% | 0.83 -66% | 2.38 -376% | 1.11 -122% | 2.6 -420% |
| Greyscale dE 2000 * | 2.1 | 5.5 -162% | 3.5 -67% | 4 -90% | 3.4 -62% | 2 5% |
| Gamma | 2.3 96% | 2.35 94% | 2.32 95% | 2.14 103% | 2.228 99% | 2.01 109% |
| CCT | 6257 104% | 7392 88% | 7145 91% | 6844 95% | 7249 90% | 6566 99% |
| Color Space (Percent of AdobeRGB 1998) (%) | 68 | 71 | 89.2 | |||
| Color Space (Percent of sRGB) (%) | 91 | 93 | 100 | |||
| Média Total (Programa/Configurações) | -139% /
-134% | -24% /
-24% | -40% /
-50% | -29% /
-27% | 5% /
-31% |
* ... menor é melhor
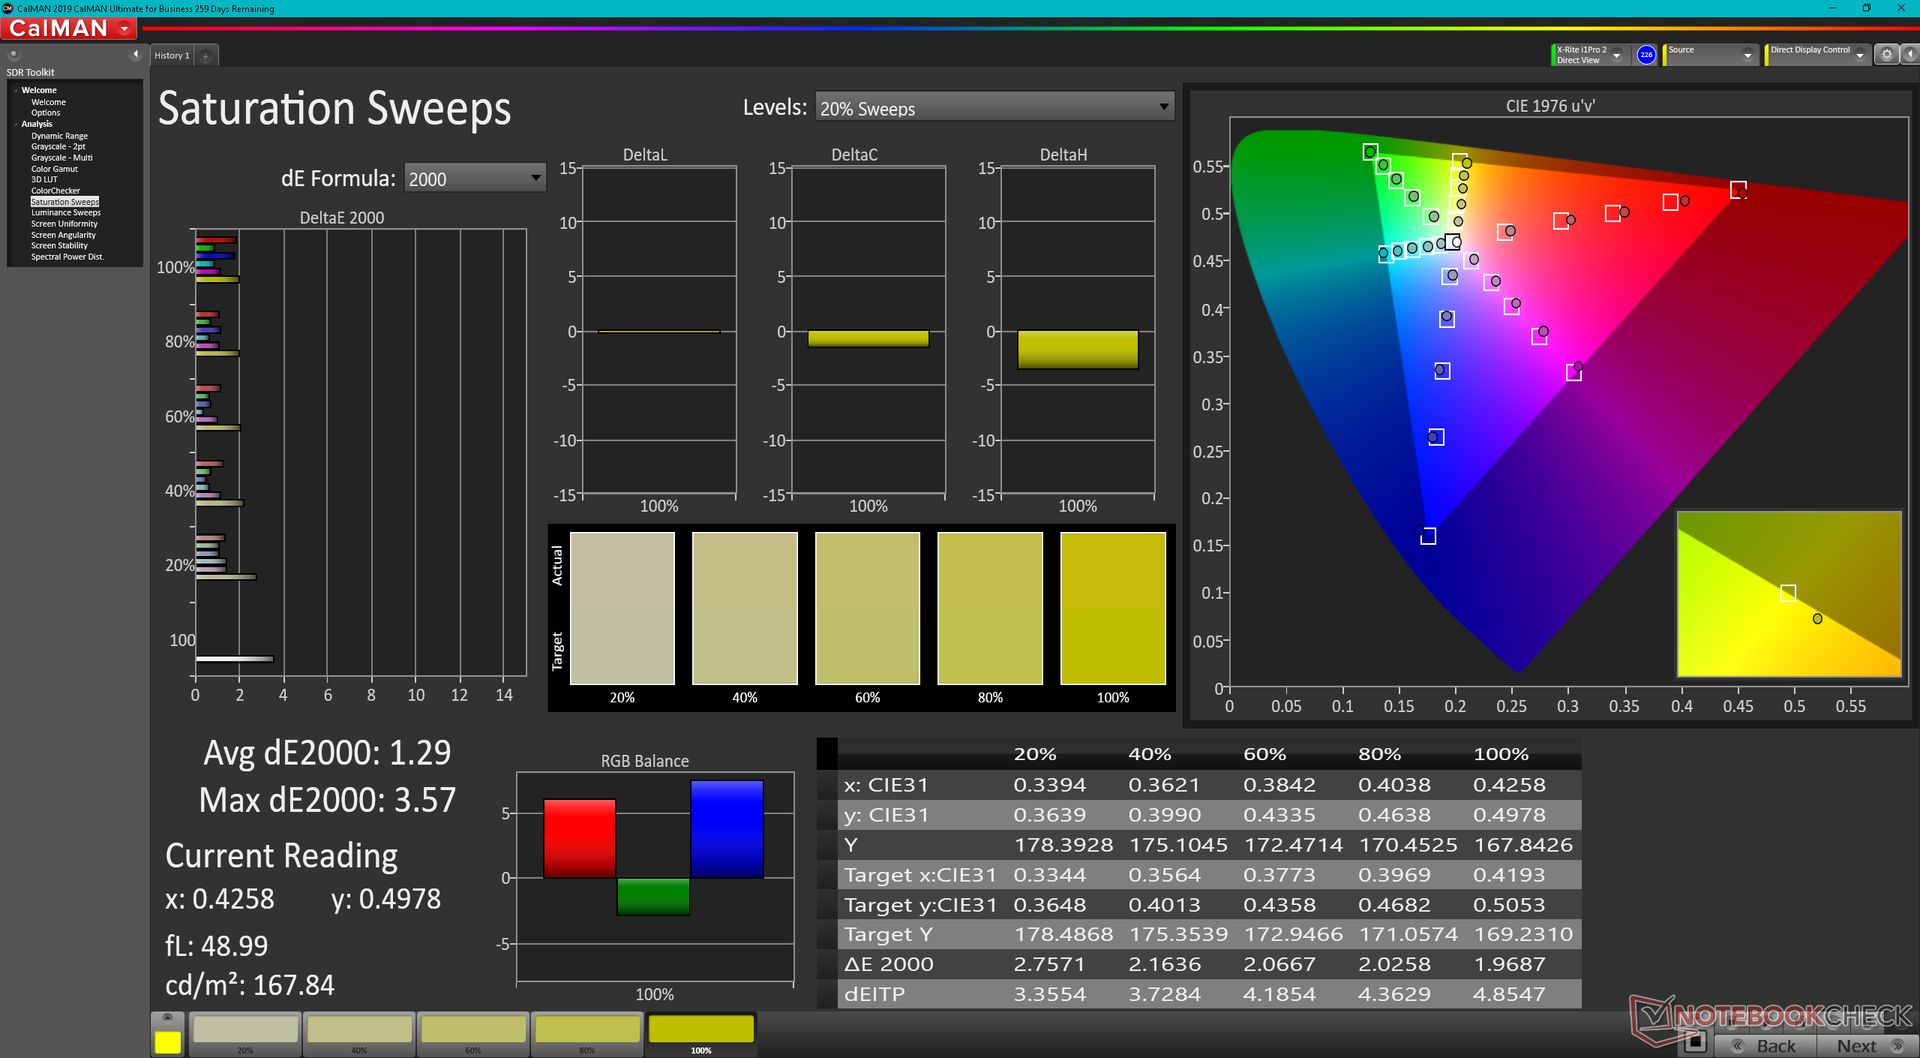
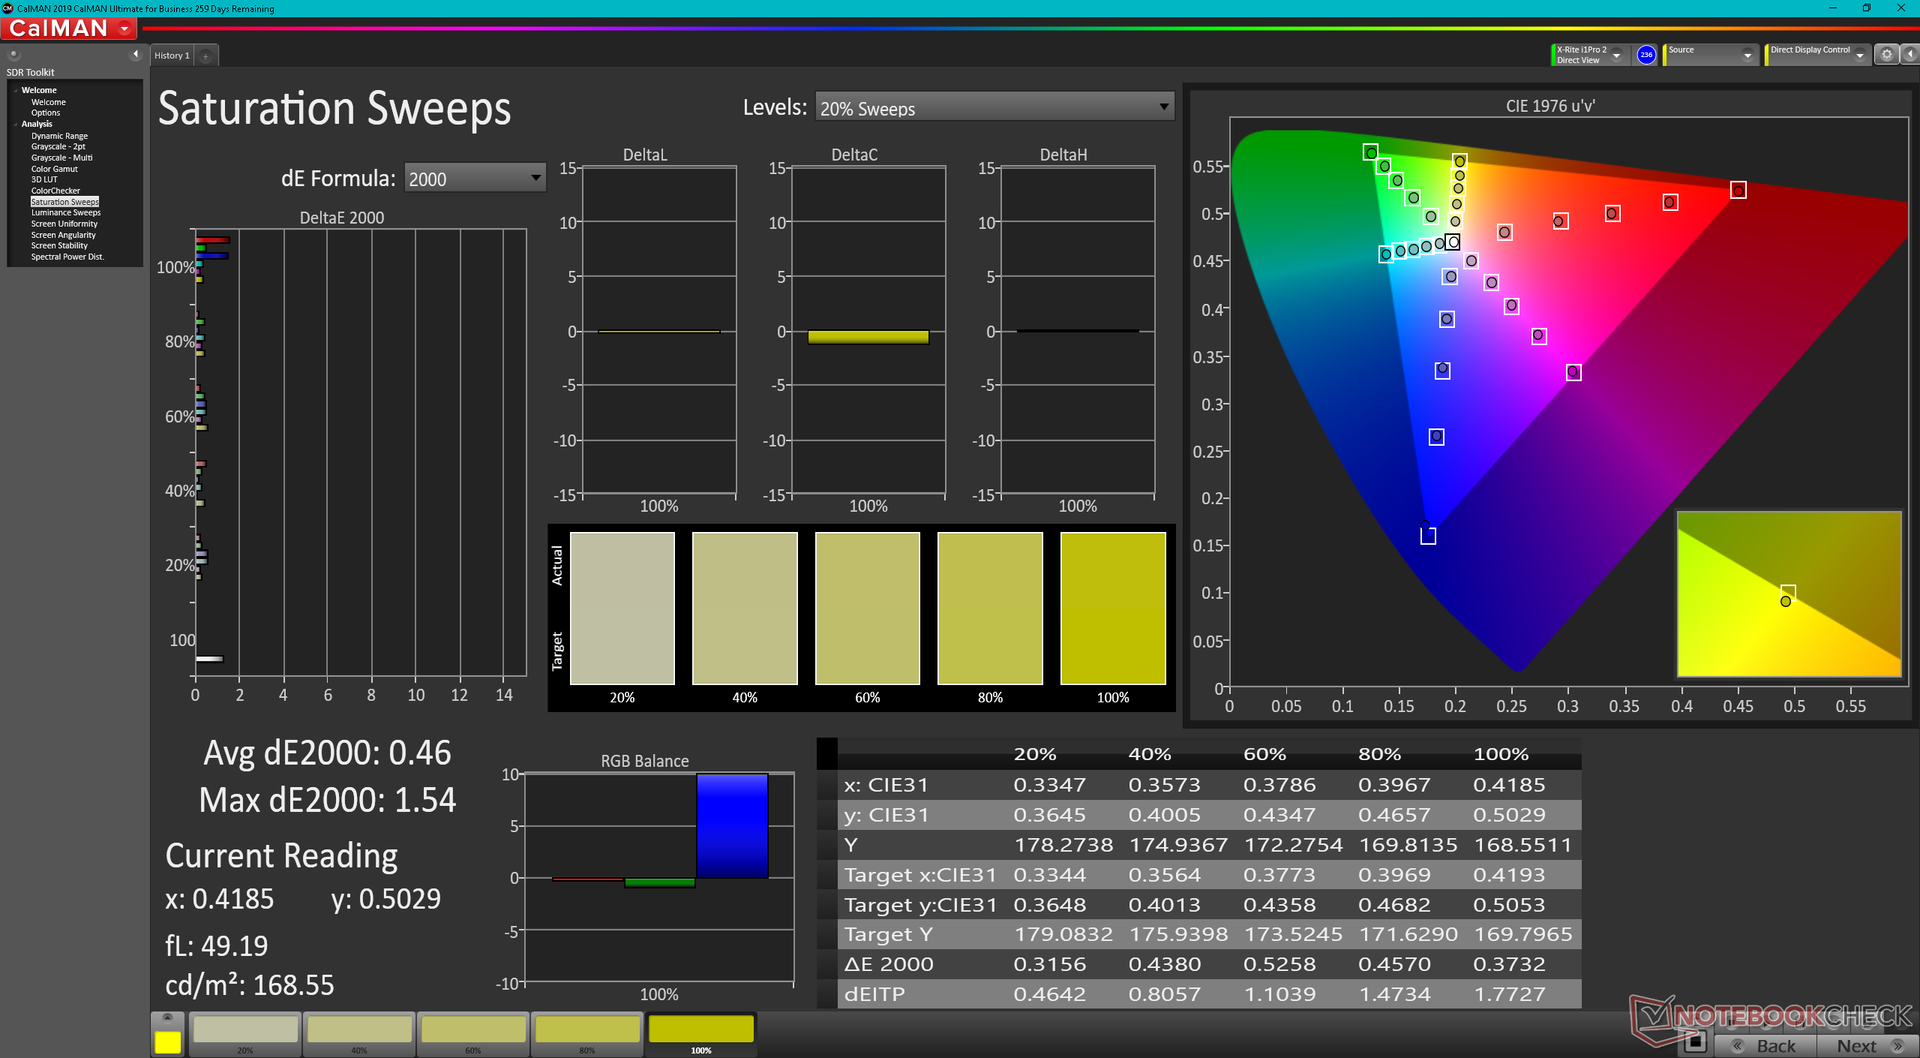
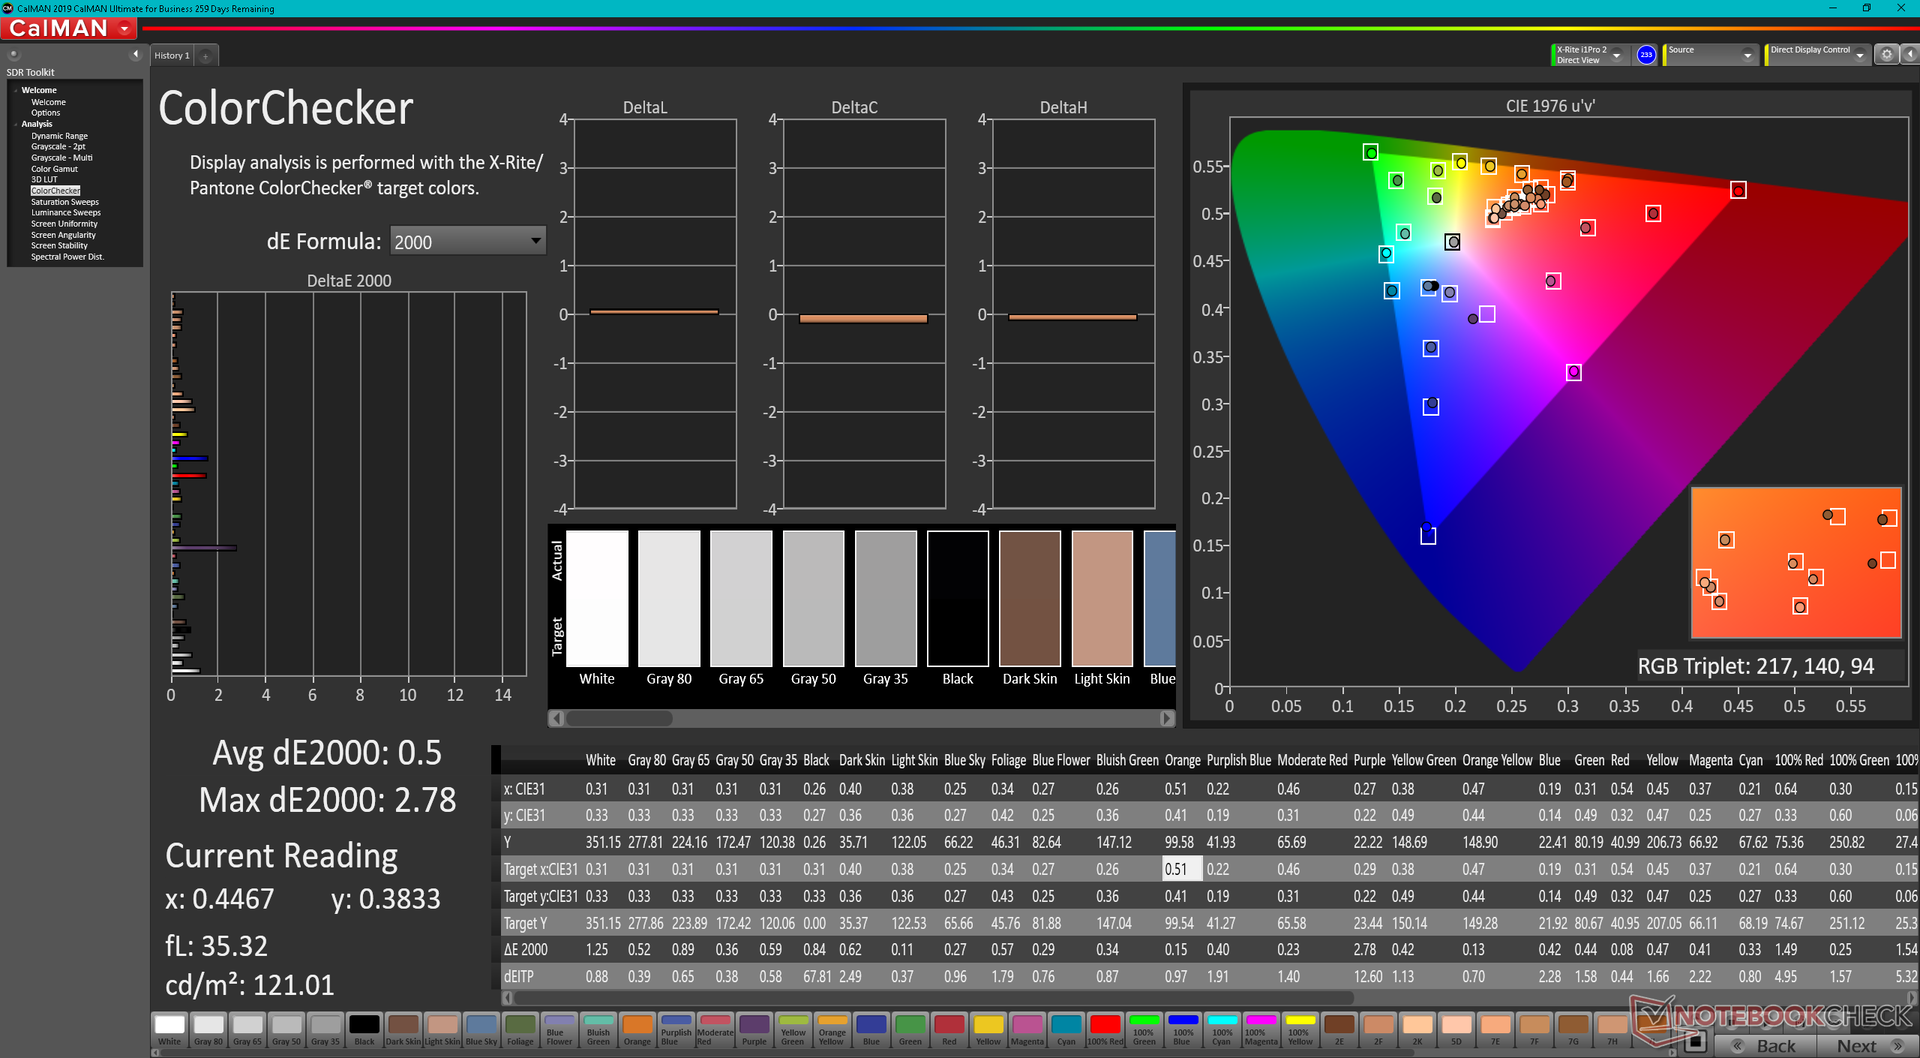
Não há mudanças significativas no espaço de cor entre a FX506 e a FX507. A Asus não oferece nenhuma opção de cobertura AdobeRGB ou DCI-P3 para sua série FX507, ao contrário do que acontece na Lâmina Razer 15 série ou série ZenBook profissional.
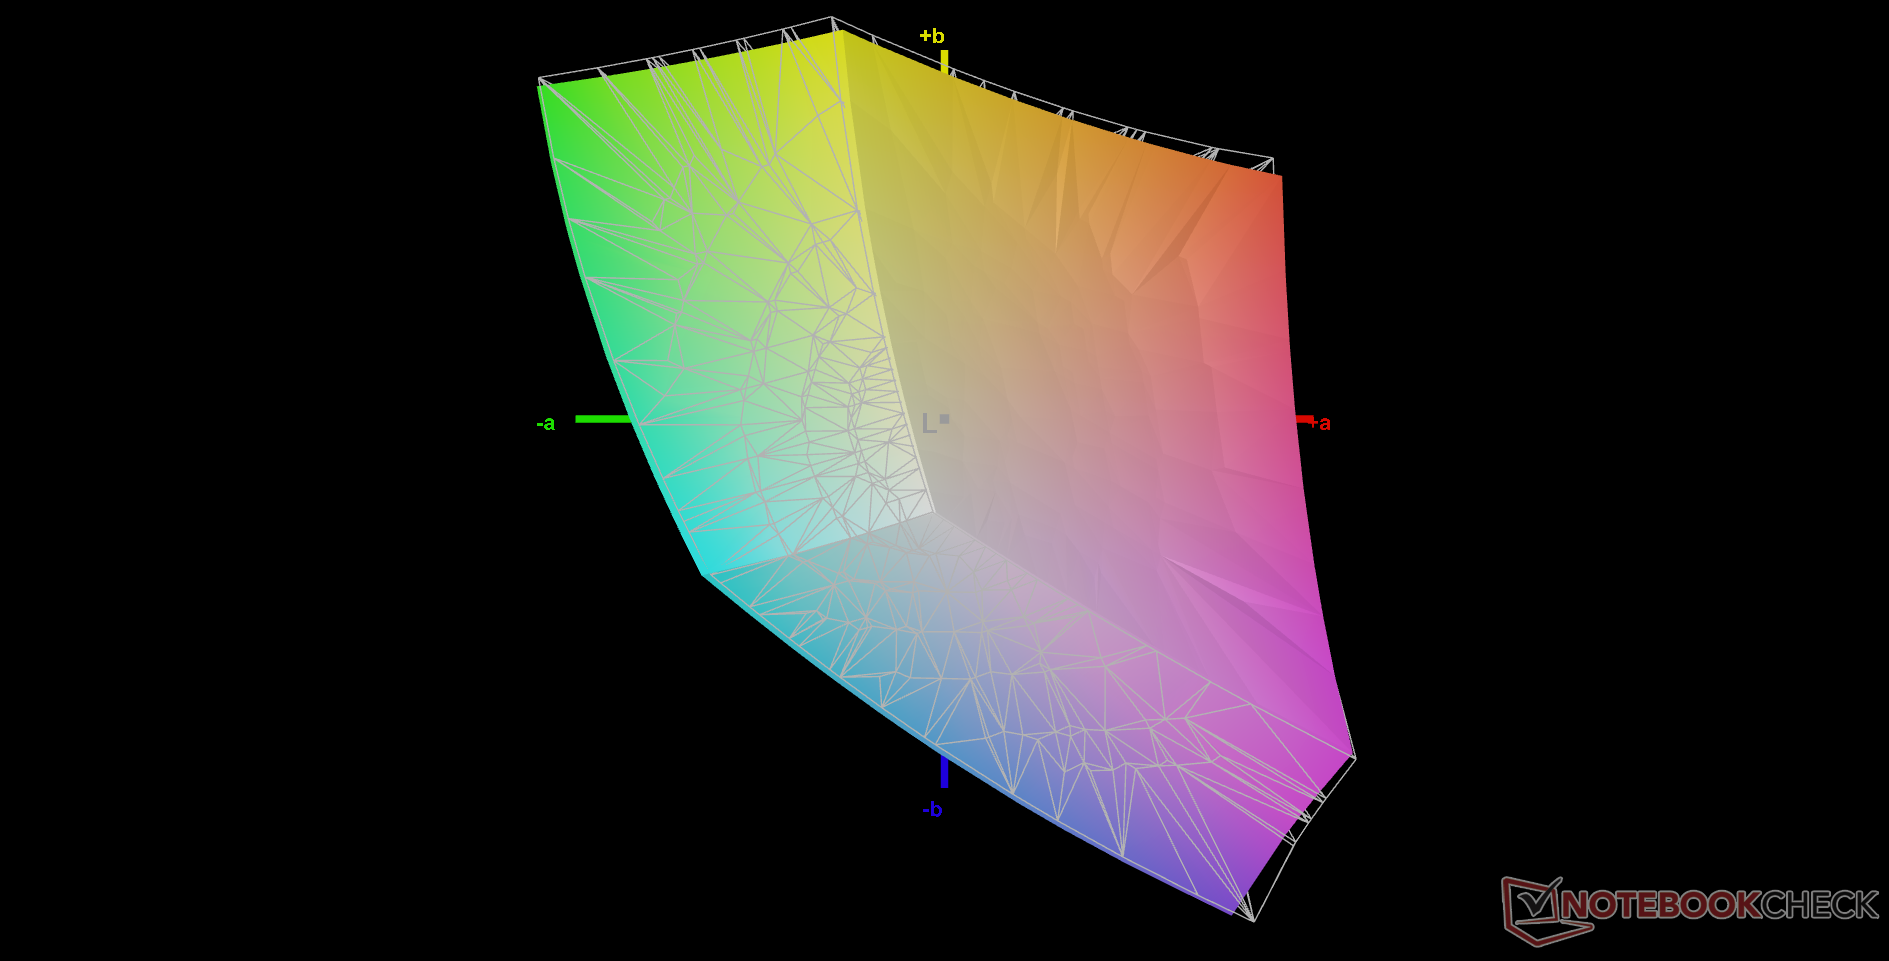
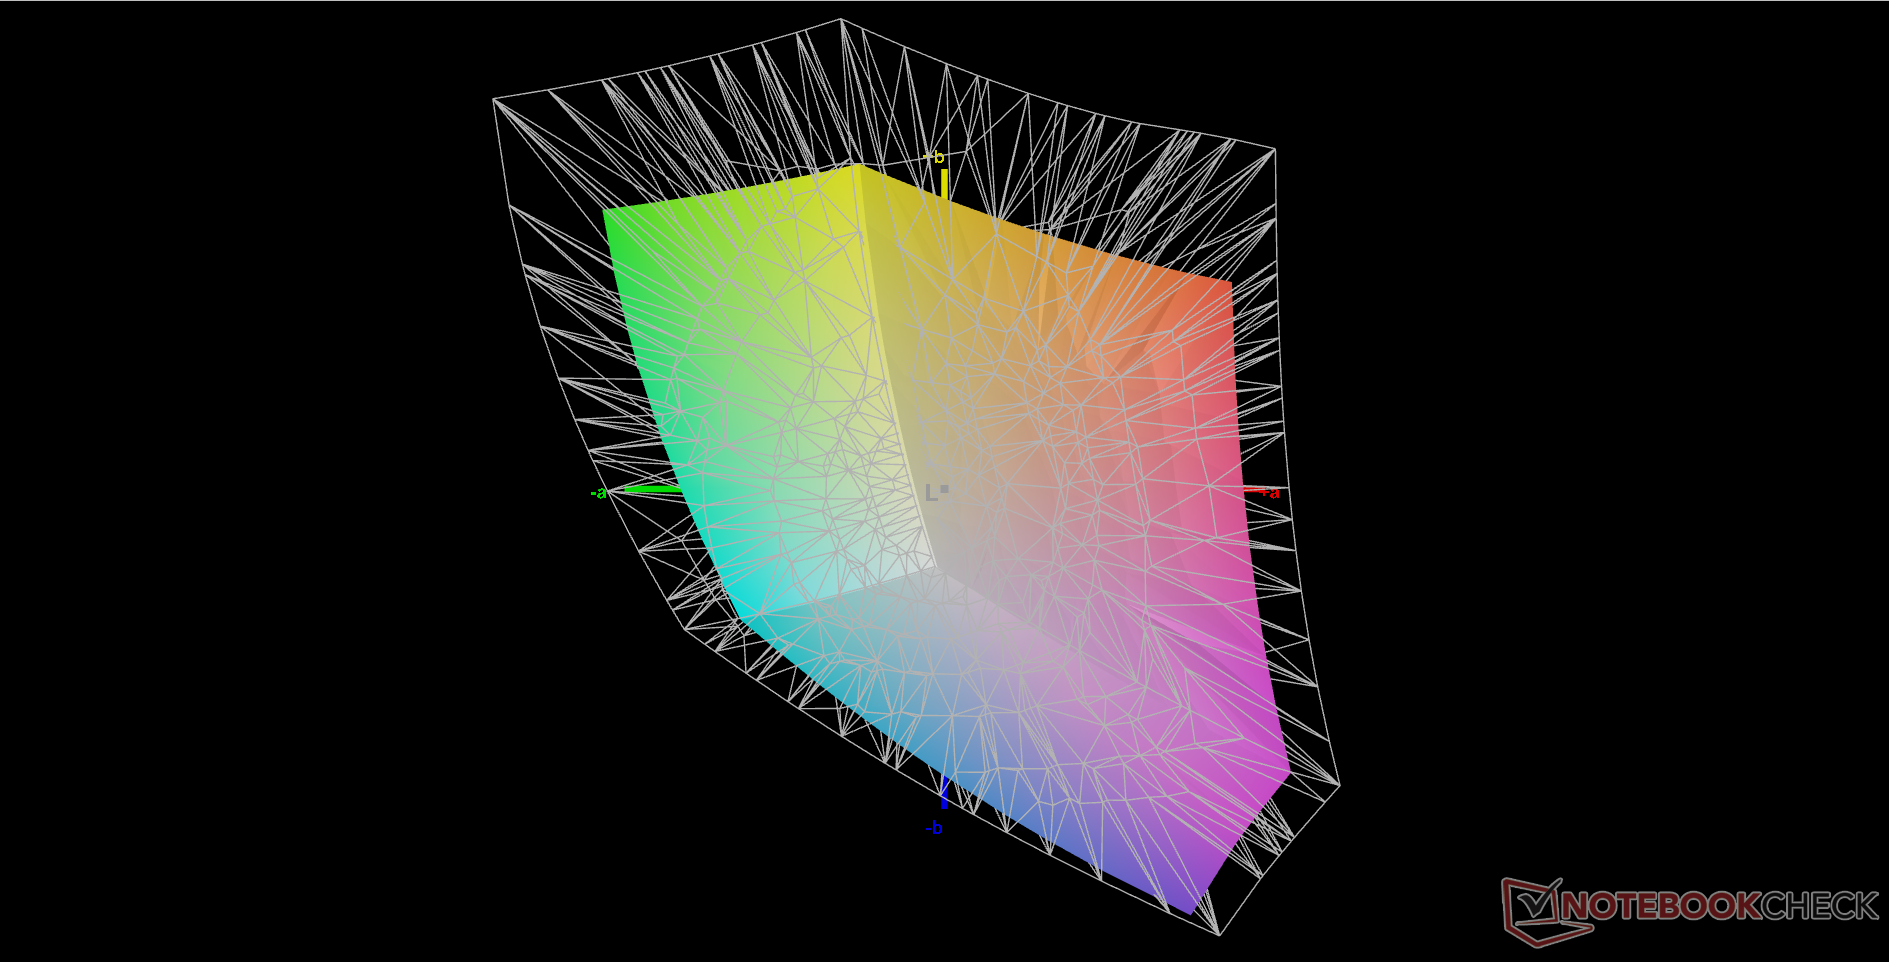
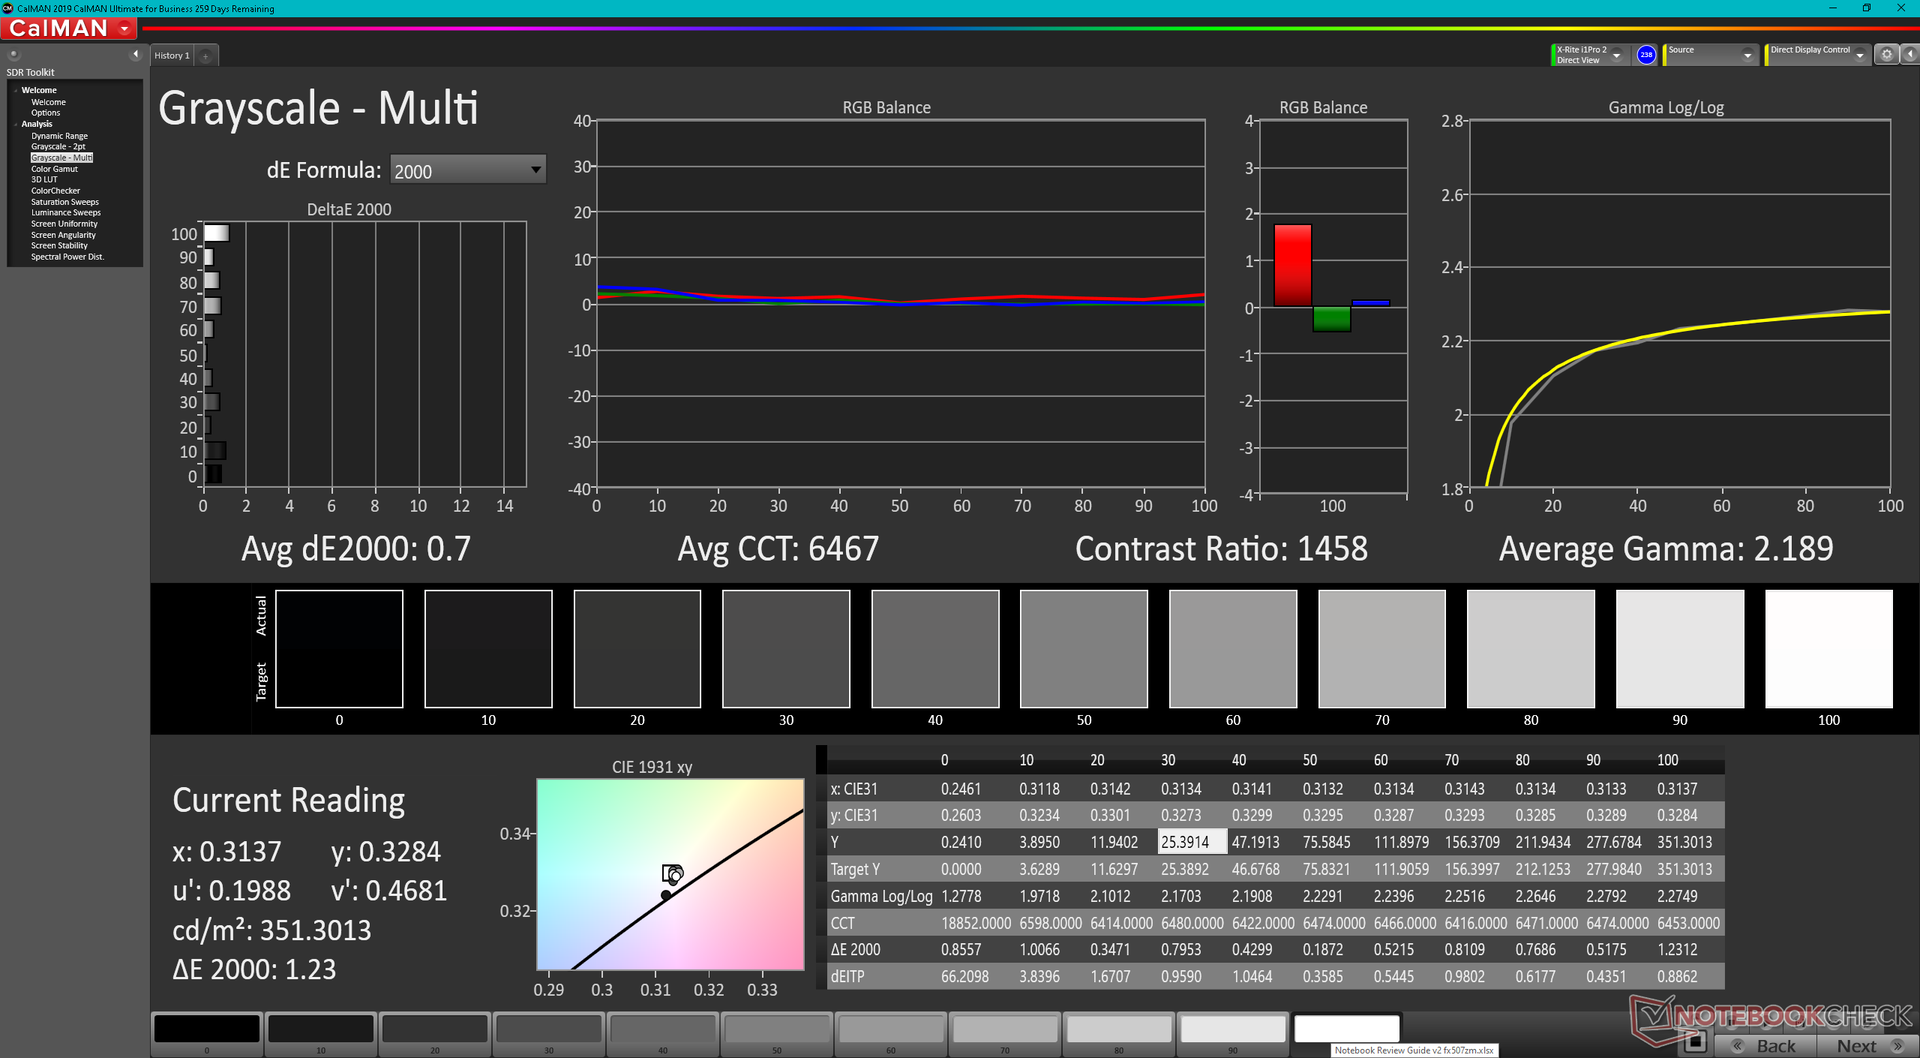
O display é bem calibrado fora da caixa com valores médios de escala de cinza e deltaE de cor de apenas 2,1 e 1,74, respectivamente. Calibrar ainda mais o display com um colorímetro X-Rite melhoraria ainda mais o deltaE para menos de 1 cada.
Exibir tempos de resposta
| ↔ Tempo de resposta preto para branco | ||
|---|---|---|
| 12.8 ms ... ascensão ↗ e queda ↘ combinadas | ↗ 6.8 ms ascensão | 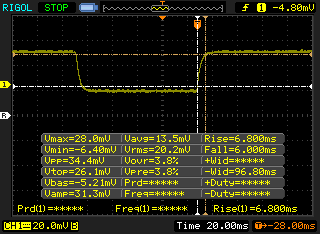 |
| ↘ 6 ms queda | ||
| A tela mostra boas taxas de resposta em nossos testes, mas pode ser muito lenta para jogadores competitivos. Em comparação, todos os dispositivos testados variam de 0.1 (mínimo) a 240 (máximo) ms. » 33 % de todos os dispositivos são melhores. Isso significa que o tempo de resposta medido é melhor que a média de todos os dispositivos testados (19.8 ms). | ||
| ↔ Tempo de resposta 50% cinza a 80% cinza | ||
| 5.6 ms ... ascensão ↗ e queda ↘ combinadas | ↗ 3.2 ms ascensão | 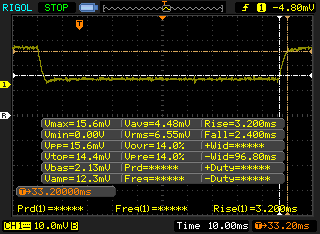 |
| ↘ 2.4 ms queda | ||
| A tela mostra taxas de resposta muito rápidas em nossos testes e deve ser muito adequada para jogos em ritmo acelerado. Em comparação, todos os dispositivos testados variam de 0.165 (mínimo) a 636 (máximo) ms. » 18 % de todos os dispositivos são melhores. Isso significa que o tempo de resposta medido é melhor que a média de todos os dispositivos testados (31 ms). | ||
Cintilação da tela / PWM (modulação por largura de pulso)
| Tela tremeluzindo / PWM não detectado | 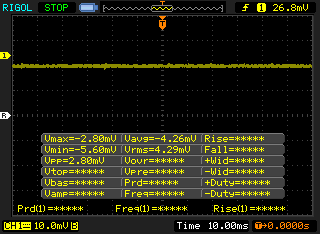 | ||
[pwm_comparison] Em comparação: 52 % de todos os dispositivos testados não usam PWM para escurecer a tela. Se PWM foi detectado, uma média de 7757 (mínimo: 5 - máximo: 343500) Hz foi medida. | |||

Desempenho - A diferença Intel 12th Gen
Condições de teste
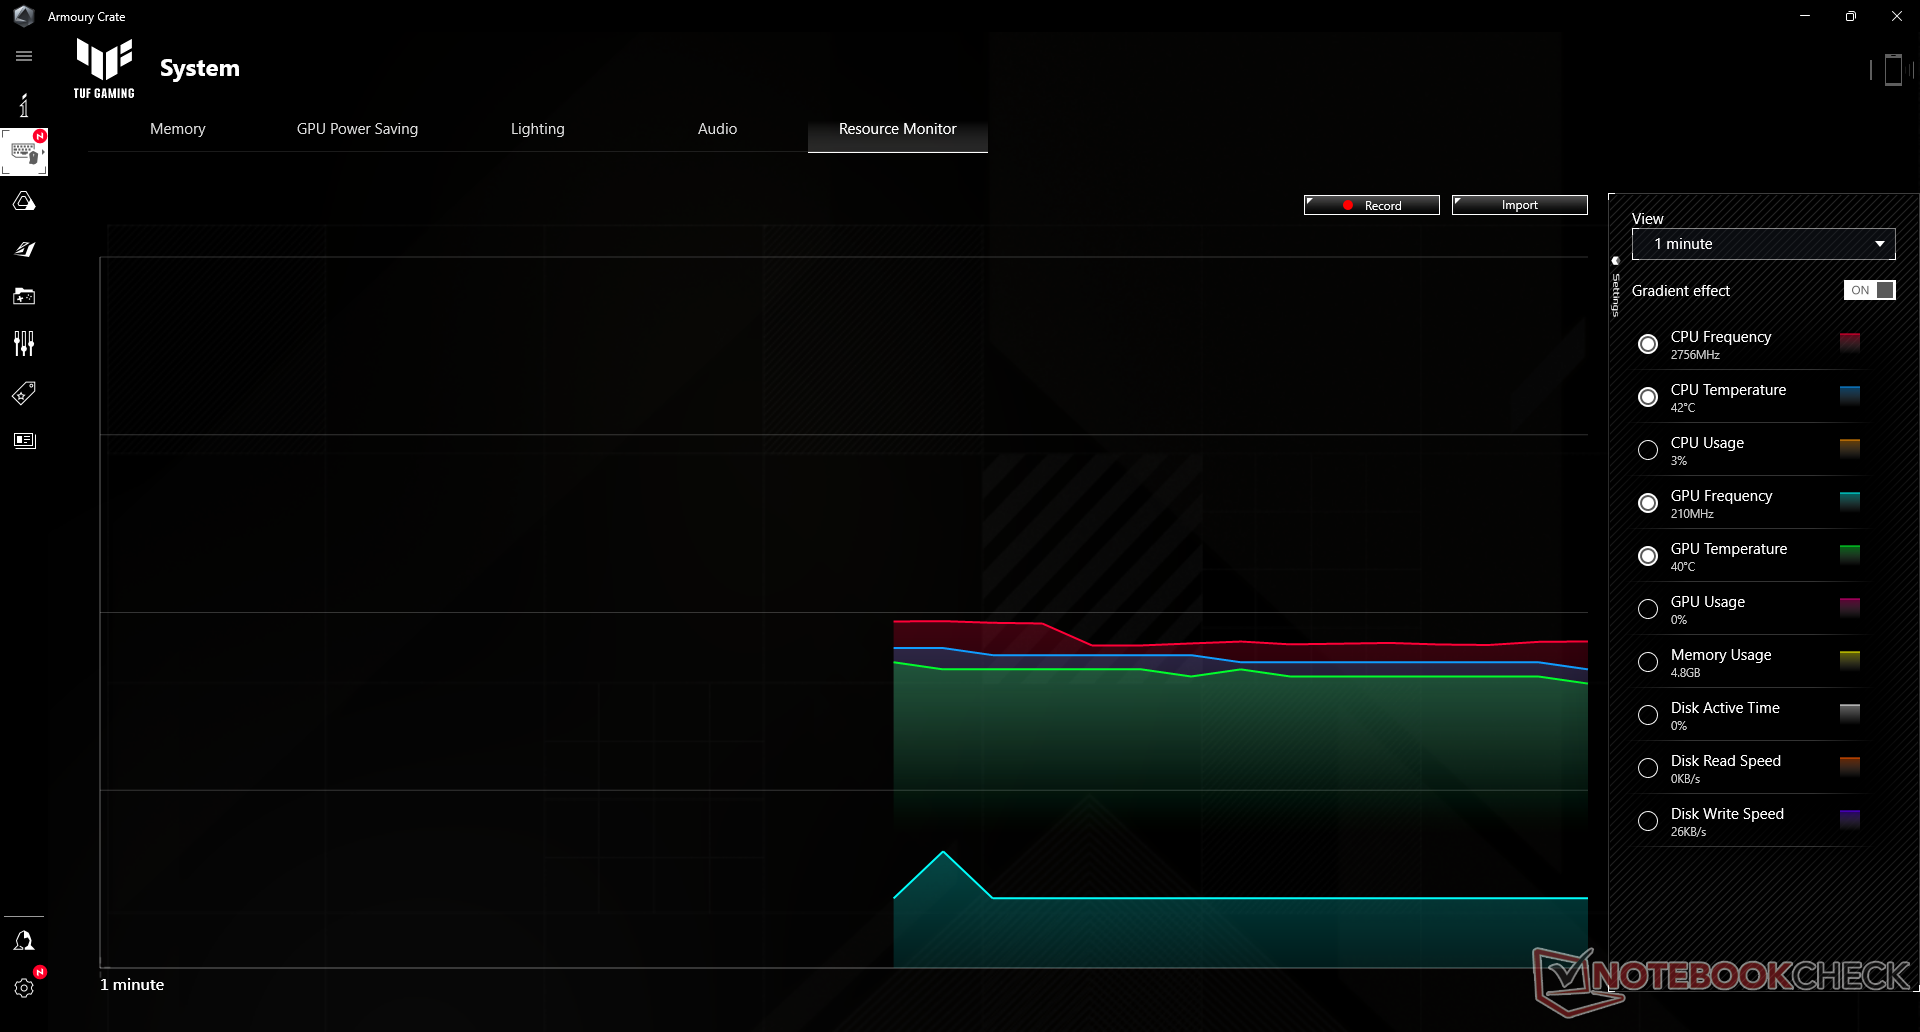
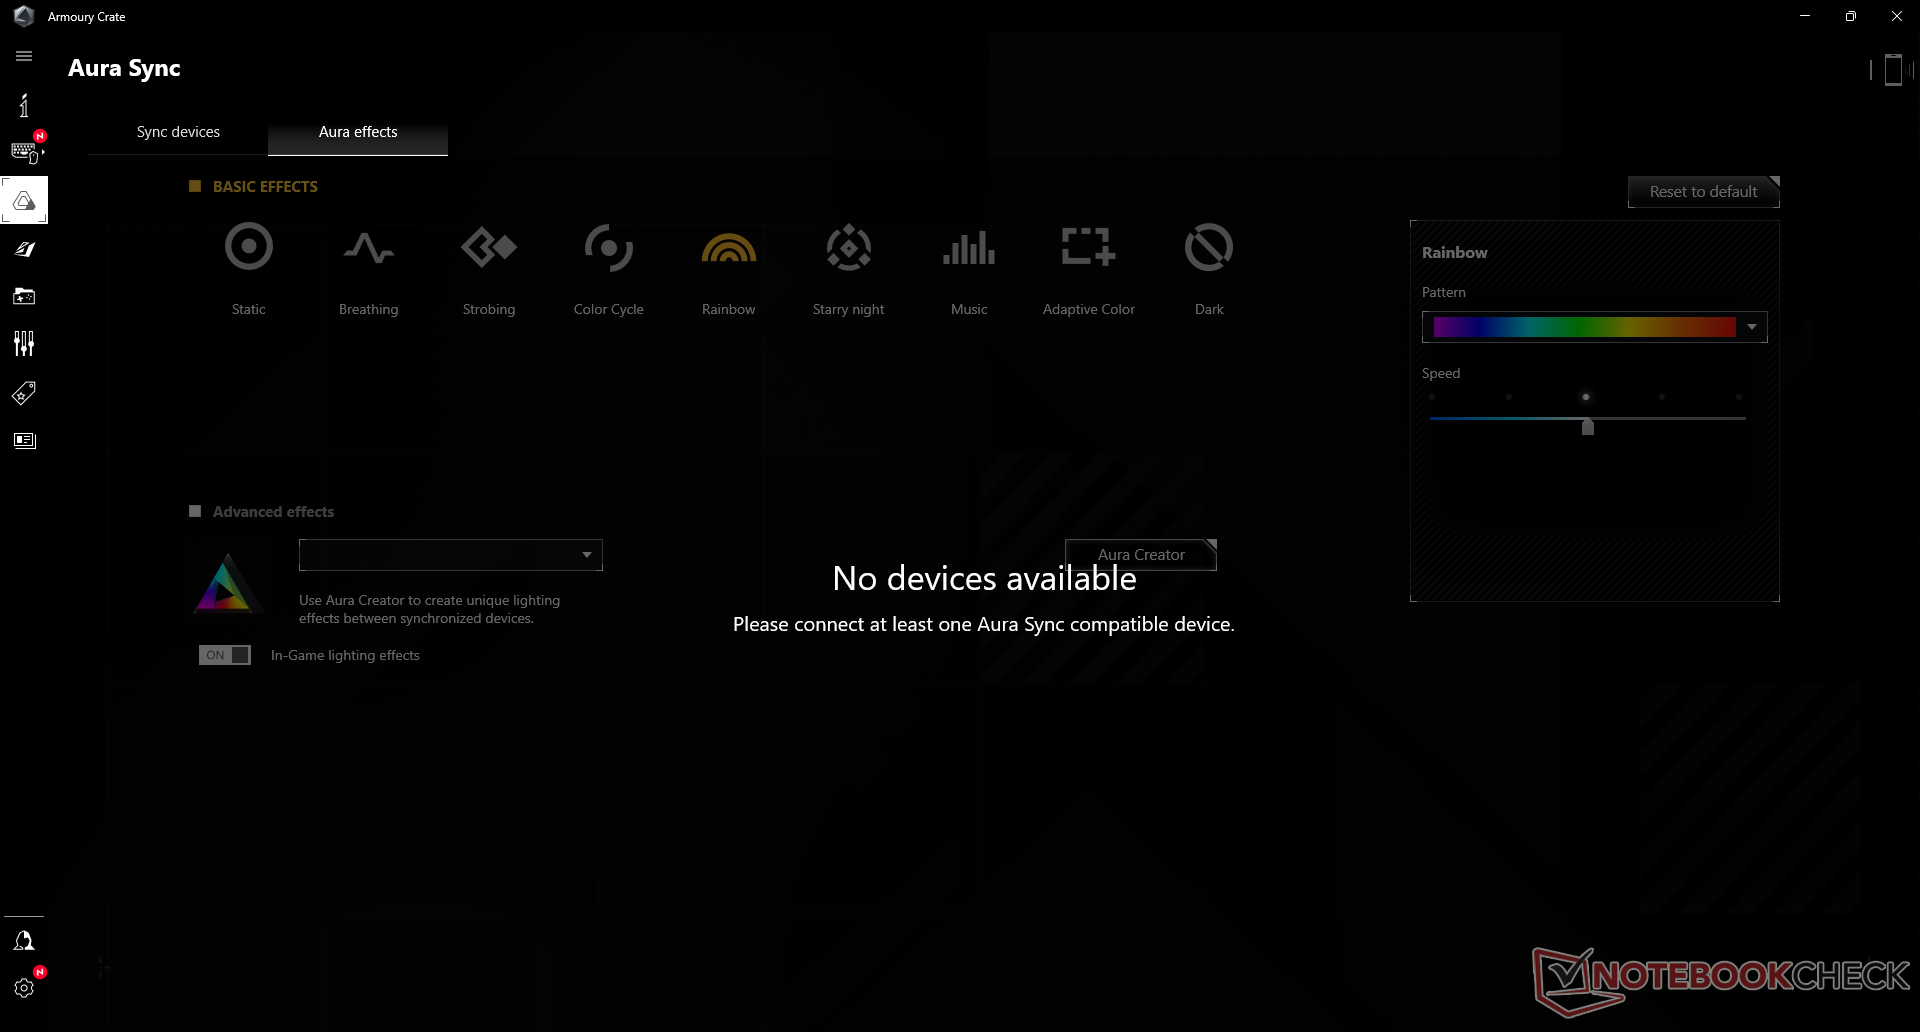
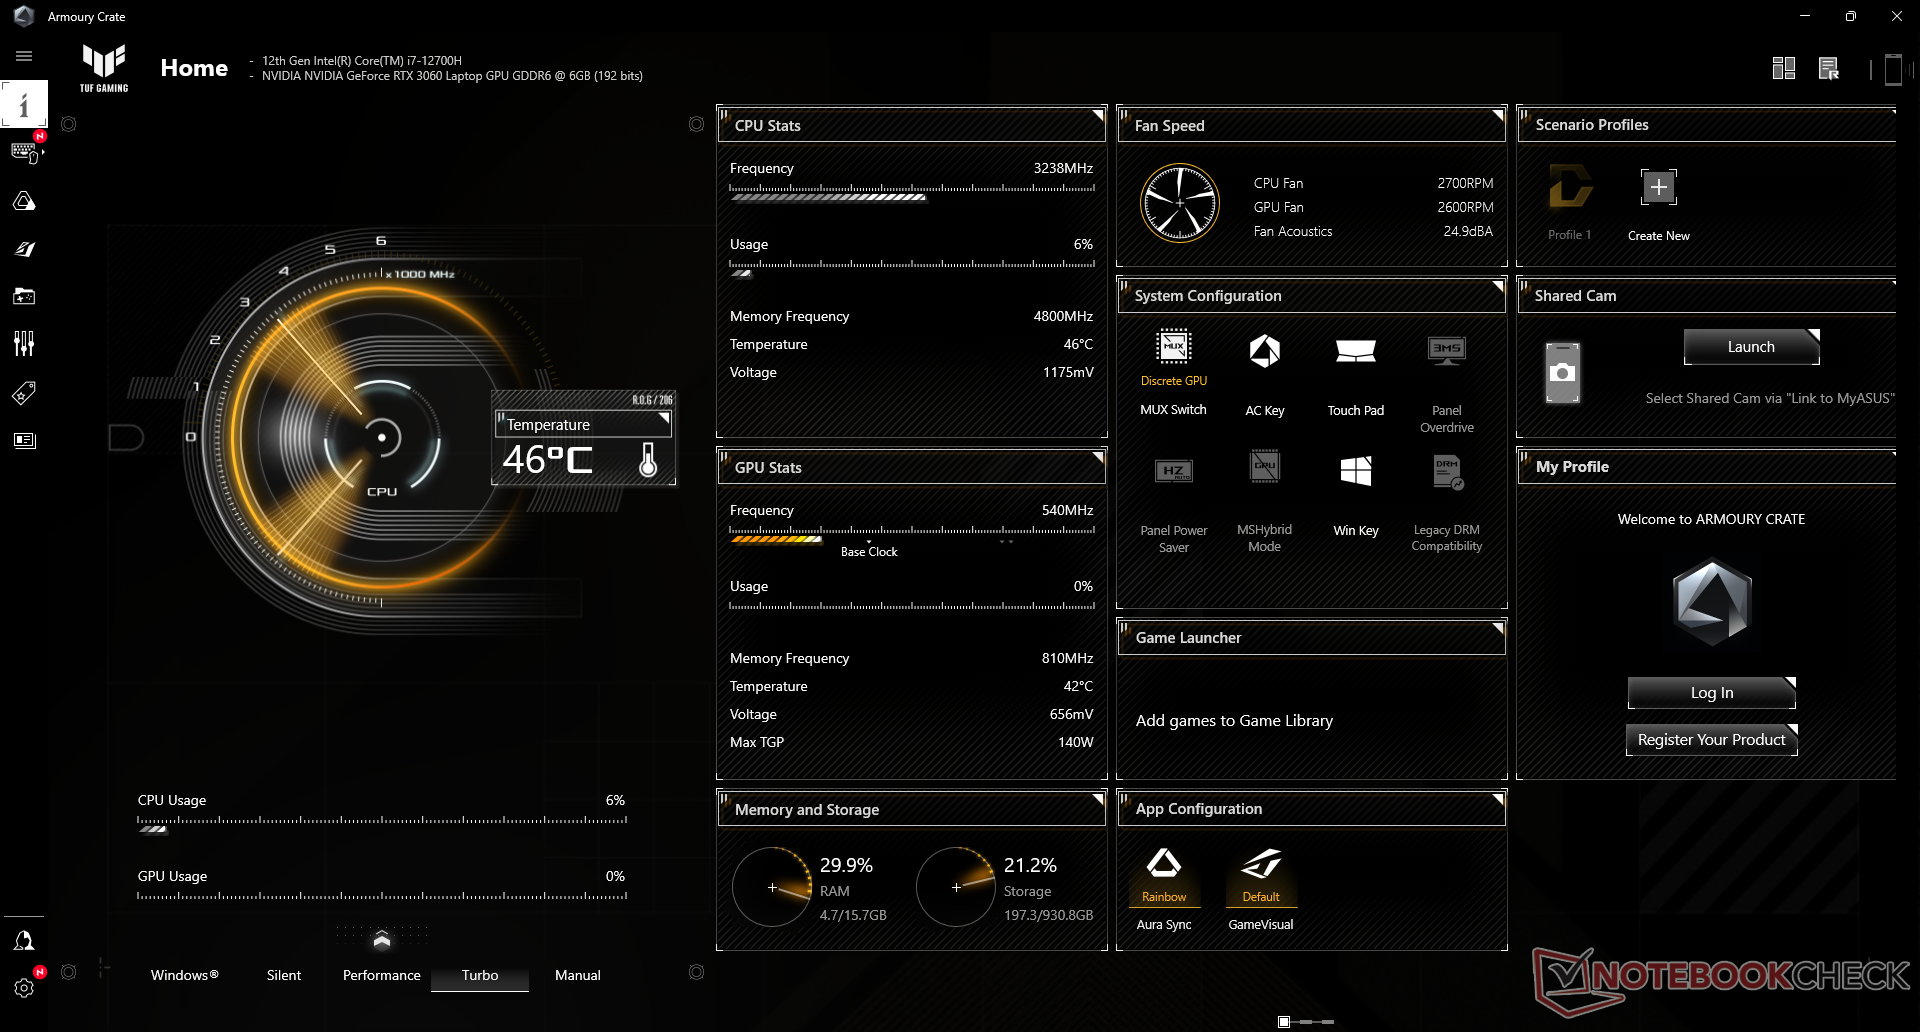
Nossa unidade foi configurada para modo Turbo e modo GPU discreto através do perfil Armoury Crate pré-instalado, antes de executar quaisquer benchmarks de desempenho abaixo. É recomendado que os proprietários se familiarizem com este software, pois ele serve como o centro para monitorar o desempenho, alternar características auxiliares e alternar entre perfis de desempenho. Mais notavelmente, os usuários podem alternar entre os modos gráficos MSHybrid ou MUX diretamente através do software. O modelo anterior FX506 não tinha uma chave MUX
O Advanced Optimus não é suportado, o que significa que uma reinicialização suave é necessária ao alternar entre gráficos discretos ou Optimus. Para que o Adaptive Sync funcione na tela interna, os usuários devem rodar no modo MSHybrid, pois o modo dGPU MUX não suporta o Adaptive Sync. G-Sync e FreeSync podem ser habilitados em um monitor externo suportado independentemente do modo GPU, desde que seja conectado via USB-C DisplayPort e não HDMI.
Os alvos TDP da CPU e TGP da GPU variam dependendo do perfil de potência do Armoury Crate, conforme detalhado na tabela abaixo. Assim, os proprietários devem executar o sistema nos modos Turbo ou Manual para tirar o máximo proveito da potência do FX507.
| Perfil de potência | Silencioso | Desempenho | Turbo | Manual |
| CPU alvo PL1 | 45 W | 70 W | 90 W | 100 W |
| CPU PL2 alvo | 60 W | 105 W | 115 W | 135 W |
| GPU TGP alvo | <115 W (WhisperMode 2.0 on) | 100 W + 15 W | 115 W + 25 W | 115 W + 25 W |
| Meta Max TDP+TGP | 25 W + <100 W (WhisperMode 2.0 on) | 35 W + 100 W | 45 W + 115 W | 45 W + 115 W |
| Meta dB(A) (Fabricante Fornecido) | <35 dB(A) | 40 dB(A) | 48 dB(A) | 52 dB(A) |
Processador
O desempenho da CPU é excelente e exatamente onde esperamos que seja relativo a outros laptops com exatamente a mesma CPU. Quando comparado com a Núcleo i7-11800H na FX506 do ano passado, o Núcleo i7-12700H pode oferecer cerca de 17% e 30% mais rápido de desempenho de rosca única e rosca múltipla, respectivamente. O desempenho geral é essencialmente igual ao desempenho mais caro Núcleo i9-12900H enquanto estiver à frente do Núcleo i7-12800H como encontrado no Lâmina Razer 15
A sustentabilidade do Turbo Boost é boa, pois nossa pontuação inicial de 2735 pontos cairia apenas em alguns pontos percentuais ao executar o CineBench R15 xT em um loop.
Cinebench R15 Multi Loop
Cinebench R23: Multi Core | Single Core
Cinebench R15: CPU Multi 64Bit | CPU Single 64Bit
Blender: v2.79 BMW27 CPU
7-Zip 18.03: 7z b 4 | 7z b 4 -mmt1
Geekbench 5.5: Multi-Core | Single-Core
HWBOT x265 Benchmark v2.2: 4k Preset
LibreOffice : 20 Documents To PDF
R Benchmark 2.5: Overall mean
* ... menor é melhor
AIDA64: FP32 Ray-Trace | FPU Julia | CPU SHA3 | CPU Queen | FPU SinJulia | FPU Mandel | CPU AES | CPU ZLib | FP64 Ray-Trace | CPU PhotoWorxx
| Performance rating | |
| Asus ROG Strix Scar 15 G533QS | |
| Média Intel Core i7-12700H | |
| Asus Zephyrus S15 GX502L | |
| Asus TUF Gaming F15 FX507ZM | |
| Asus ZenBook Pro Duo UX582 LR-1BH2 | |
| Asus TUF Dash F15 FX516PR | |
| Asus TUF Gaming F15 FX506HM -9! | |
| AIDA64 / FP32 Ray-Trace | |
| Asus ROG Strix Scar 15 G533QS | |
| Asus Zephyrus S15 GX502L | |
| Asus ZenBook Pro Duo UX582 LR-1BH2 | |
| Média Intel Core i7-12700H (2585 - 17957, n=64) | |
| Asus TUF Gaming F15 FX507ZM | |
| Asus TUF Dash F15 FX516PR | |
| AIDA64 / FPU Julia | |
| Asus ROG Strix Scar 15 G533QS | |
| Asus Zephyrus S15 GX502L | |
| Asus ZenBook Pro Duo UX582 LR-1BH2 | |
| Média Intel Core i7-12700H (12439 - 90760, n=64) | |
| Asus TUF Gaming F15 FX507ZM | |
| Asus TUF Dash F15 FX516PR | |
| AIDA64 / CPU SHA3 | |
| Asus ROG Strix Scar 15 G533QS | |
| Asus TUF Gaming F15 FX507ZM | |
| Asus Zephyrus S15 GX502L | |
| Média Intel Core i7-12700H (833 - 4242, n=64) | |
| Asus ZenBook Pro Duo UX582 LR-1BH2 | |
| Asus TUF Dash F15 FX516PR | |
| AIDA64 / CPU Queen | |
| Asus ROG Strix Scar 15 G533QS | |
| Asus TUF Gaming F15 FX507ZM | |
| Média Intel Core i7-12700H (57923 - 103202, n=63) | |
| Asus Zephyrus S15 GX502L | |
| Asus ZenBook Pro Duo UX582 LR-1BH2 | |
| Asus TUF Dash F15 FX516PR | |
| AIDA64 / FPU SinJulia | |
| Asus ROG Strix Scar 15 G533QS | |
| Asus Zephyrus S15 GX502L | |
| Asus TUF Gaming F15 FX507ZM | |
| Asus ZenBook Pro Duo UX582 LR-1BH2 | |
| Média Intel Core i7-12700H (3249 - 9939, n=64) | |
| Asus TUF Dash F15 FX516PR | |
| AIDA64 / FPU Mandel | |
| Asus ROG Strix Scar 15 G533QS | |
| Asus Zephyrus S15 GX502L | |
| Asus ZenBook Pro Duo UX582 LR-1BH2 | |
| Média Intel Core i7-12700H (7135 - 44760, n=64) | |
| Asus TUF Gaming F15 FX507ZM | |
| Asus TUF Dash F15 FX516PR | |
| AIDA64 / CPU AES | |
| Asus ROG Strix Scar 15 G533QS | |
| Média Intel Core i7-12700H (31839 - 144360, n=64) | |
| Asus TUF Dash F15 FX516PR | |
| Asus TUF Gaming F15 FX507ZM | |
| Asus Zephyrus S15 GX502L | |
| Asus ZenBook Pro Duo UX582 LR-1BH2 | |
| AIDA64 / CPU ZLib | |
| Asus TUF Gaming F15 FX507ZM | |
| Média Intel Core i7-12700H (305 - 1171, n=64) | |
| Asus ROG Strix Scar 15 G533QS | |
| Asus Zephyrus S15 GX502L | |
| Asus ZenBook Pro Duo UX582 LR-1BH2 | |
| Asus TUF Dash F15 FX516PR | |
| Asus TUF Gaming F15 FX506HM | |
| AIDA64 / FP64 Ray-Trace | |
| Asus ROG Strix Scar 15 G533QS | |
| Asus Zephyrus S15 GX502L | |
| Asus ZenBook Pro Duo UX582 LR-1BH2 | |
| Média Intel Core i7-12700H (1437 - 9692, n=64) | |
| Asus TUF Gaming F15 FX507ZM | |
| Asus TUF Dash F15 FX516PR | |
| AIDA64 / CPU PhotoWorxx | |
| Asus TUF Gaming F15 FX507ZM | |
| Média Intel Core i7-12700H (12863 - 52207, n=64) | |
| Asus ROG Strix Scar 15 G533QS | |
| Asus Zephyrus S15 GX502L | |
| Asus TUF Dash F15 FX516PR | |
| Asus ZenBook Pro Duo UX582 LR-1BH2 | |
Desempenho do sistema
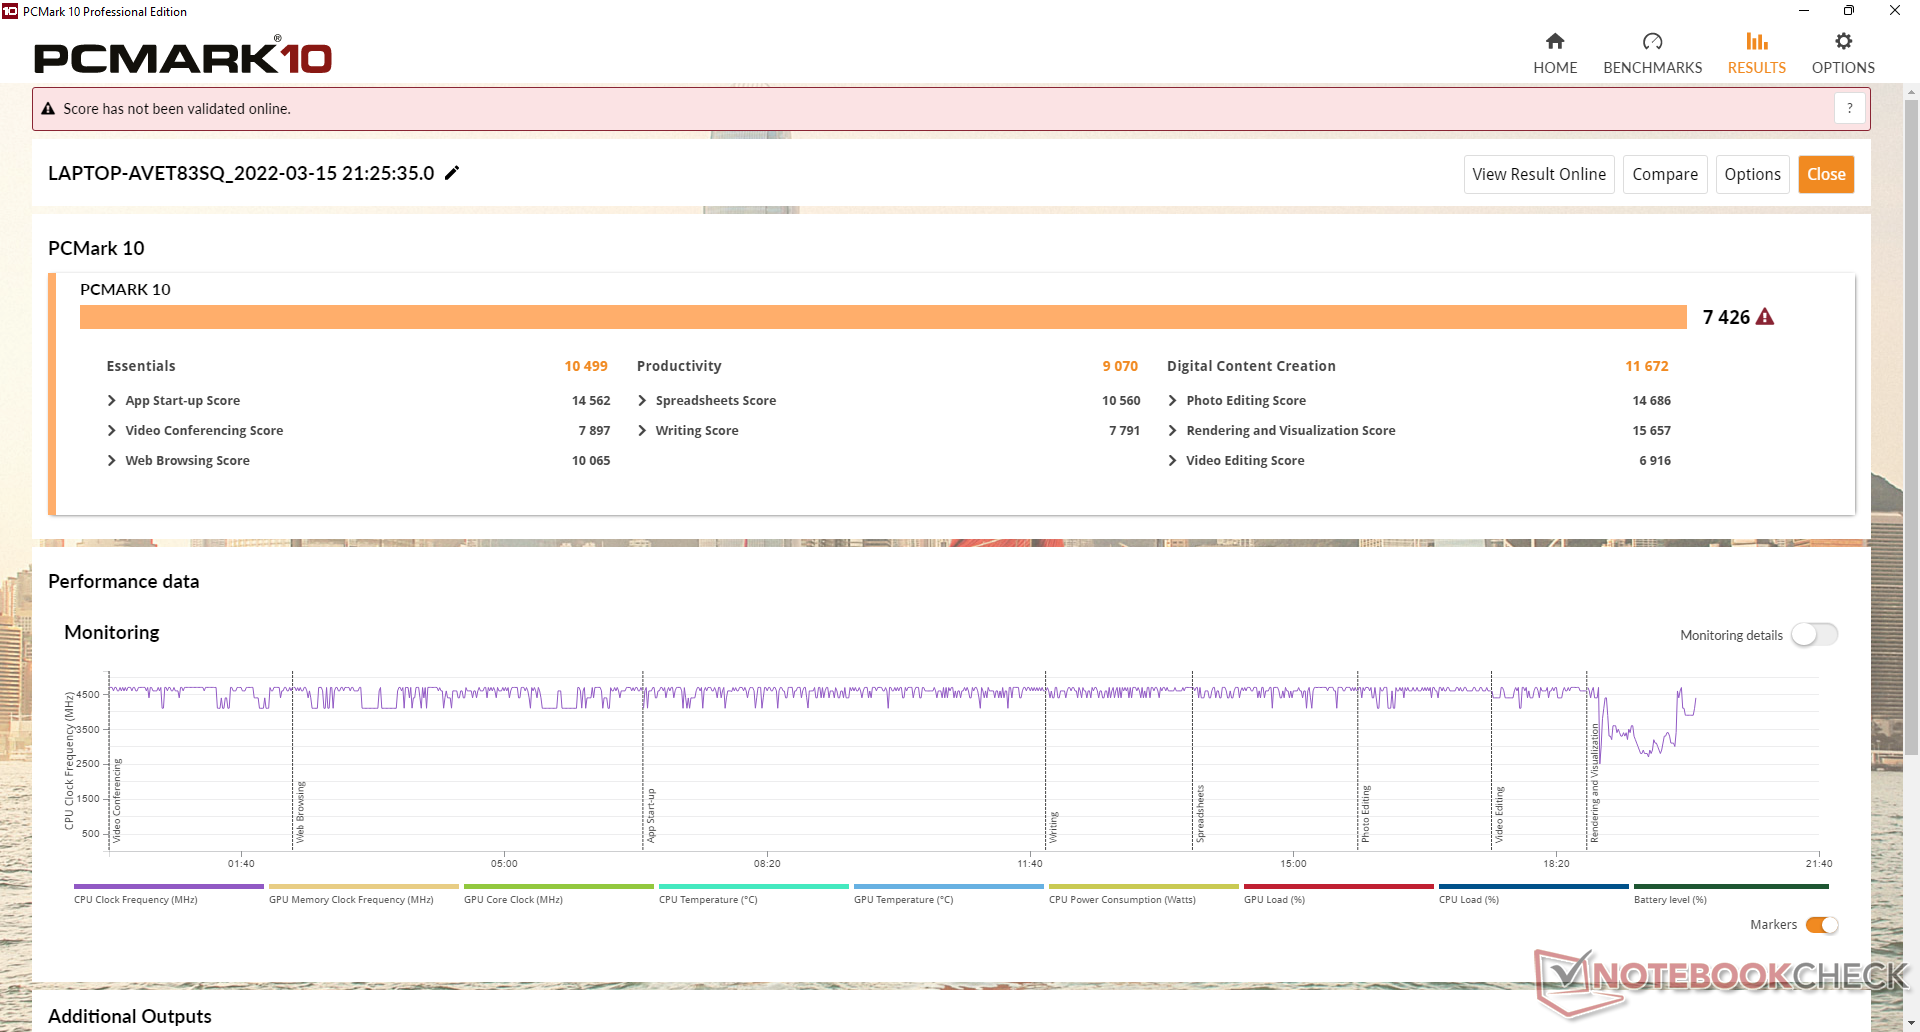
Os resultados da PCMark 10 são essencialmente idênticos aos da FX506, o que significa que as atividades diárias não serão necessariamente mais rápidas, apesar das atualizações da CPU e da GPU. O sub-teste de Criação de Conteúdo Digital é visivelmente mais alto, no entanto, provavelmente devido às taxas de relógio mais rápidas da GPU sobre o RTX 3060 mais antigo.
| PCMark 10 / Score | |
| Asus TUF Gaming F15 FX507ZM | |
| Média Intel Core i7-12700H, NVIDIA GeForce RTX 3060 Laptop GPU (5986 - 8156, n=12) | |
| Asus ROG Strix Scar 15 G533QS | |
| Asus TUF Gaming F15 FX506HM | |
| Asus TUF Dash F15 FX516PR | |
| Asus ZenBook Pro Duo UX582 LR-1BH2 | |
| Asus Zephyrus S15 GX502L | |
| PCMark 10 / Essentials | |
| Média Intel Core i7-12700H, NVIDIA GeForce RTX 3060 Laptop GPU (9289 - 12144, n=12) | |
| Asus TUF Gaming F15 FX506HM | |
| Asus TUF Gaming F15 FX507ZM | |
| Asus ROG Strix Scar 15 G533QS | |
| Asus Zephyrus S15 GX502L | |
| Asus TUF Dash F15 FX516PR | |
| Asus ZenBook Pro Duo UX582 LR-1BH2 | |
| PCMark 10 / Productivity | |
| Asus ROG Strix Scar 15 G533QS | |
| Asus TUF Dash F15 FX516PR | |
| Média Intel Core i7-12700H, NVIDIA GeForce RTX 3060 Laptop GPU (6161 - 10362, n=12) | |
| Asus TUF Gaming F15 FX507ZM | |
| Asus TUF Gaming F15 FX506HM | |
| Asus Zephyrus S15 GX502L | |
| Asus ZenBook Pro Duo UX582 LR-1BH2 | |
| PCMark 10 / Digital Content Creation | |
| Asus TUF Gaming F15 FX507ZM | |
| Média Intel Core i7-12700H, NVIDIA GeForce RTX 3060 Laptop GPU (8950 - 12554, n=12) | |
| Asus ROG Strix Scar 15 G533QS | |
| Asus TUF Gaming F15 FX506HM | |
| Asus ZenBook Pro Duo UX582 LR-1BH2 | |
| Asus TUF Dash F15 FX516PR | |
| Asus Zephyrus S15 GX502L | |
| PCMark 10 Score | 7426 pontos | |
Ajuda | ||
| AIDA64 / Memory Copy | |
| Média Intel Core i7-12700H (25615 - 80511, n=64) | |
| Asus TUF Gaming F15 FX507ZM | |
| Asus ROG Strix Scar 15 G533QS | |
| Asus Zephyrus S15 GX502L | |
| Asus ZenBook Pro Duo UX582 LR-1BH2 | |
| Asus TUF Dash F15 FX516PR | |
| AIDA64 / Memory Read | |
| Asus TUF Gaming F15 FX507ZM | |
| Média Intel Core i7-12700H (25586 - 79442, n=64) | |
| Asus ROG Strix Scar 15 G533QS | |
| Asus Zephyrus S15 GX502L | |
| Asus ZenBook Pro Duo UX582 LR-1BH2 | |
| Asus TUF Dash F15 FX516PR | |
| AIDA64 / Memory Write | |
| Asus TUF Gaming F15 FX507ZM | |
| Média Intel Core i7-12700H (23679 - 88660, n=64) | |
| Asus ROG Strix Scar 15 G533QS | |
| Asus Zephyrus S15 GX502L | |
| Asus ZenBook Pro Duo UX582 LR-1BH2 | |
| Asus TUF Dash F15 FX516PR | |
| AIDA64 / Memory Latency | |
| Asus TUF Dash F15 FX516PR | |
| Asus ROG Strix Scar 15 G533QS | |
| Média Intel Core i7-12700H (76.2 - 133.9, n=62) | |
| Asus Zephyrus S15 GX502L | |
| Asus ZenBook Pro Duo UX582 LR-1BH2 | |
| Asus TUF Gaming F15 FX506HM | |
| Asus TUF Gaming F15 FX507ZM | |
* ... menor é melhor
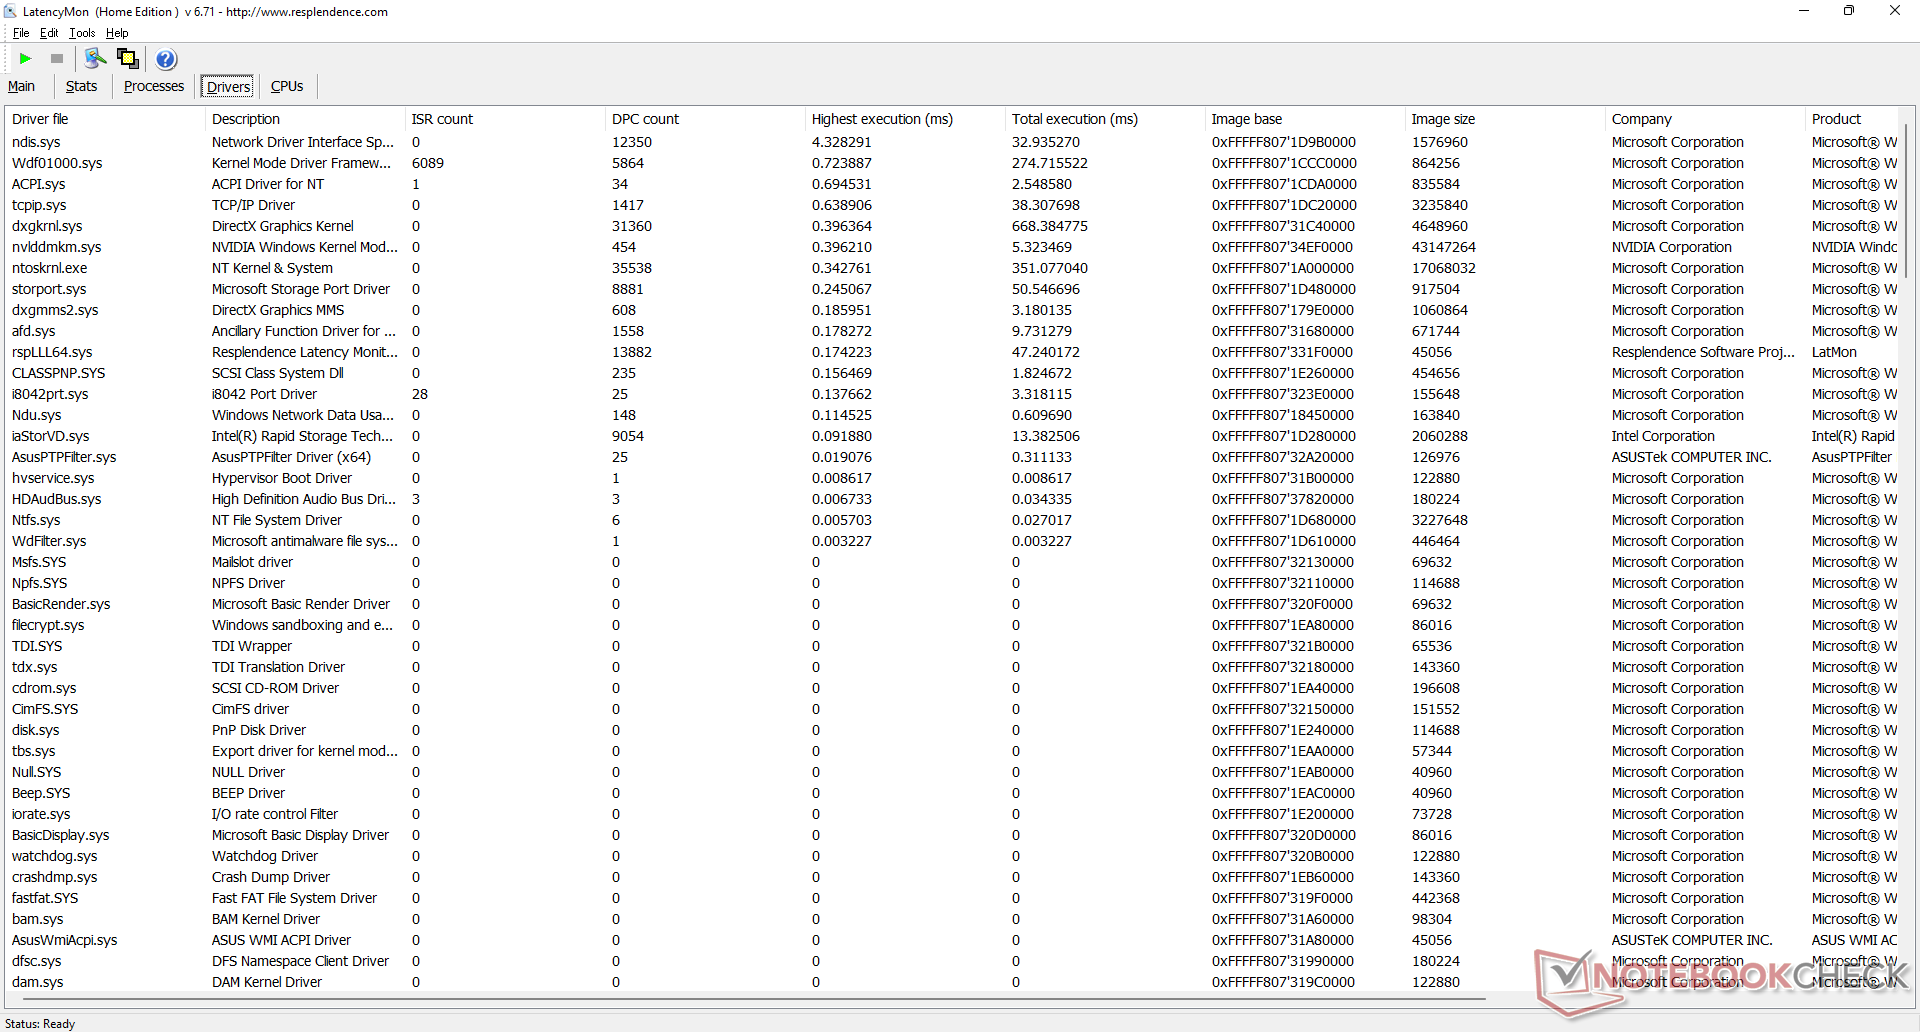
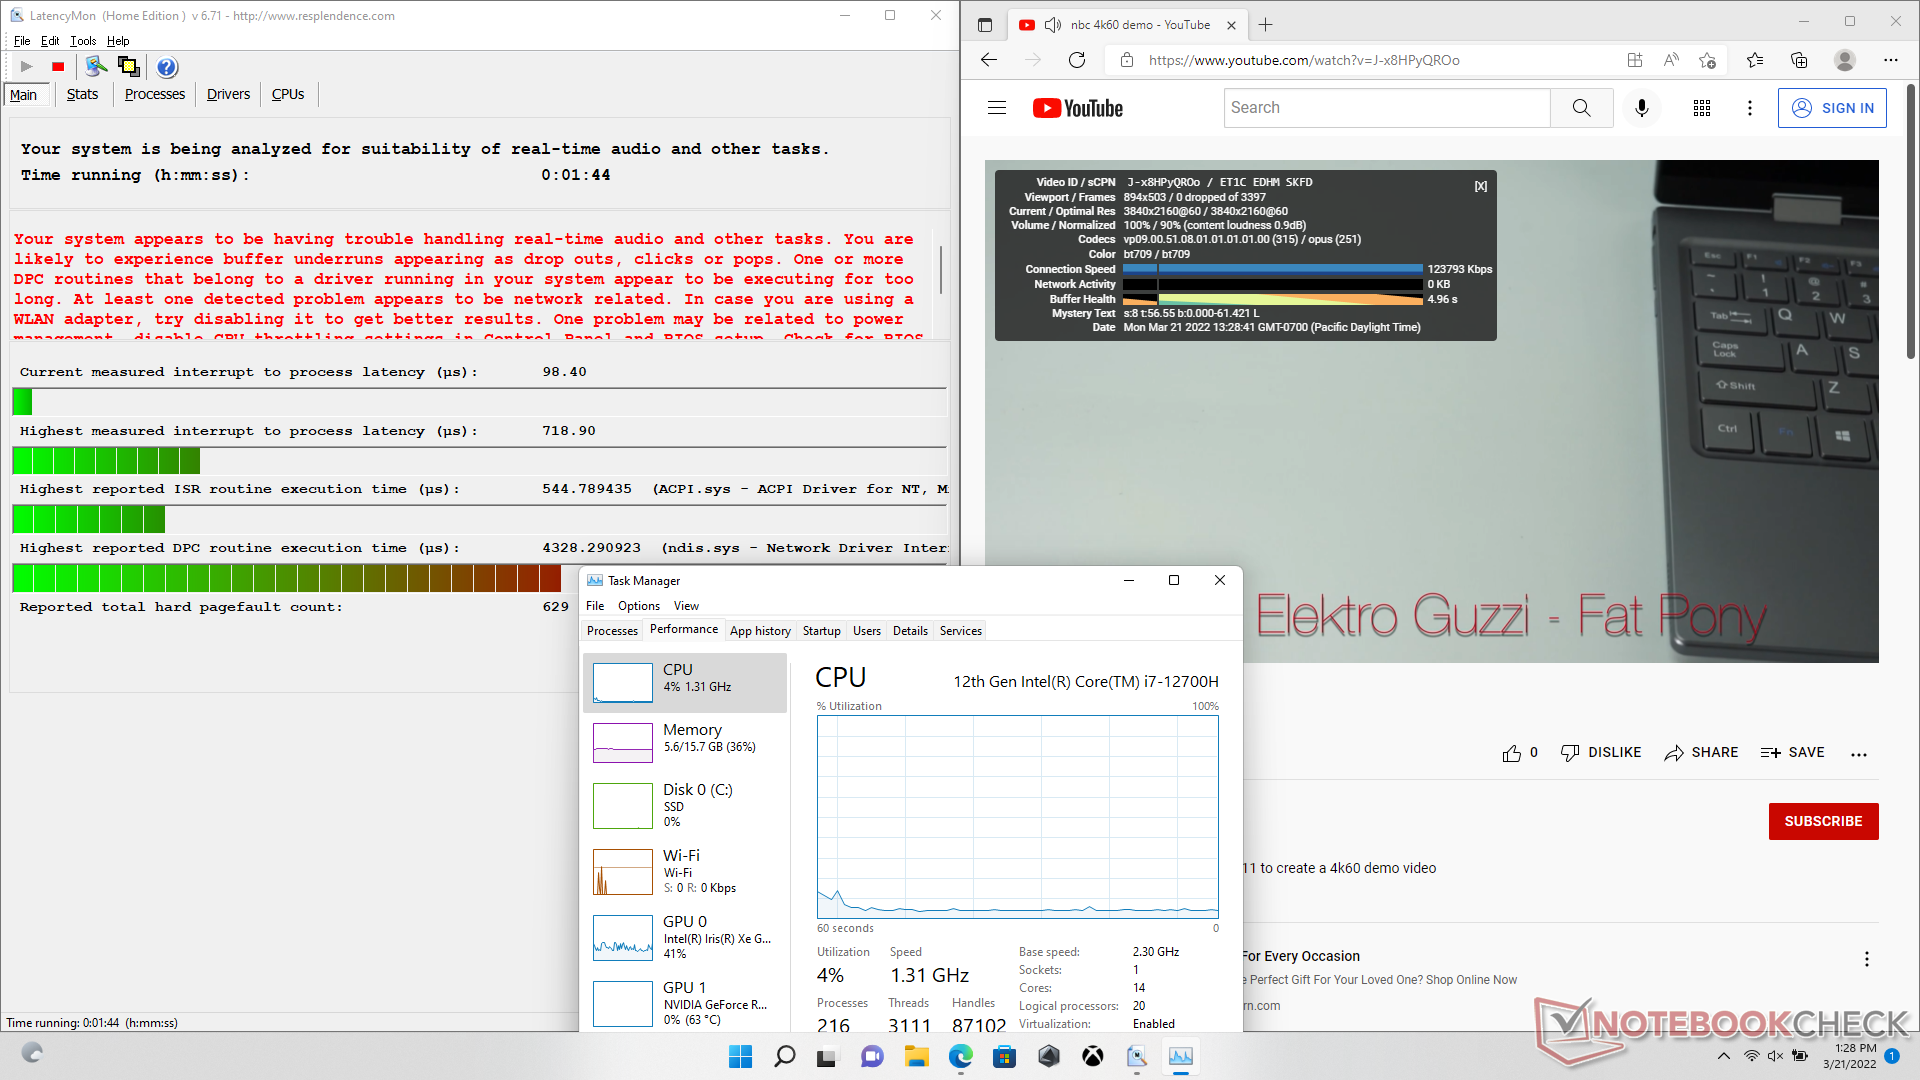
Latência do DPC
LatencyMon revela problemas de DPC ao abrir várias abas do navegador em nossa página inicial. a reprodução de vídeo de 4K a 60 FPS é de outra forma suave e sem queda de quadros.
| DPC Latencies / LatencyMon - interrupt to process latency (max), Web, Youtube, Prime95 | |
| Asus Zephyrus S15 GX502L | |
| Asus TUF Gaming F15 FX506HM | |
| Asus ROG Strix Scar 15 G533QS | |
| Asus TUF Dash F15 FX516PR | |
| Asus ZenBook Pro Duo UX582 LR-1BH2 | |
| Asus TUF Gaming F15 FX507ZM | |
* ... menor é melhor
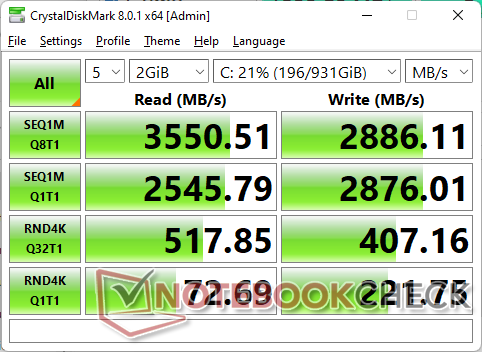
Dispositivos de armazenamento - Até duas unidades M.2 PCIe4 x4
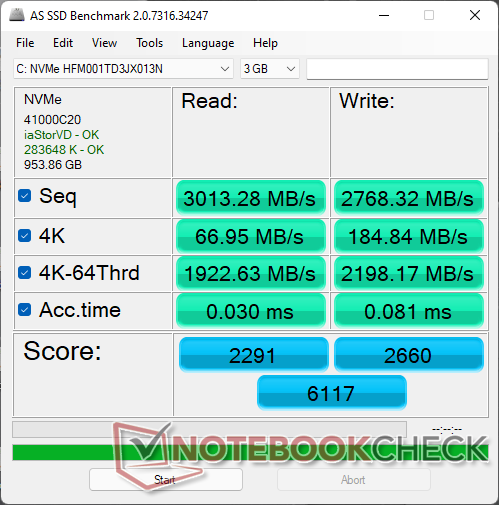
Nossa unidade embarca com o mesmoSK Hynix HFM001TD3JX013N PCIe3 x4 NVMe SSD como no modelo do ano passado. Entretanto, tenha em mente que a FX507 suporta SSDs PCIe4 x4, o que significa que os usuários finais podem instalar unidades ainda mais rápidas se assim o desejarem. A sustentabilidade do desempenho pode ser limitada, uma vez que não há um espalhador de calor no topo dos dois slots M.2.

* ... menor é melhor
Disk Throttling: DiskSpd Read Loop, Queue Depth 8
GPU Performance - Gráficos de 140 W TGP
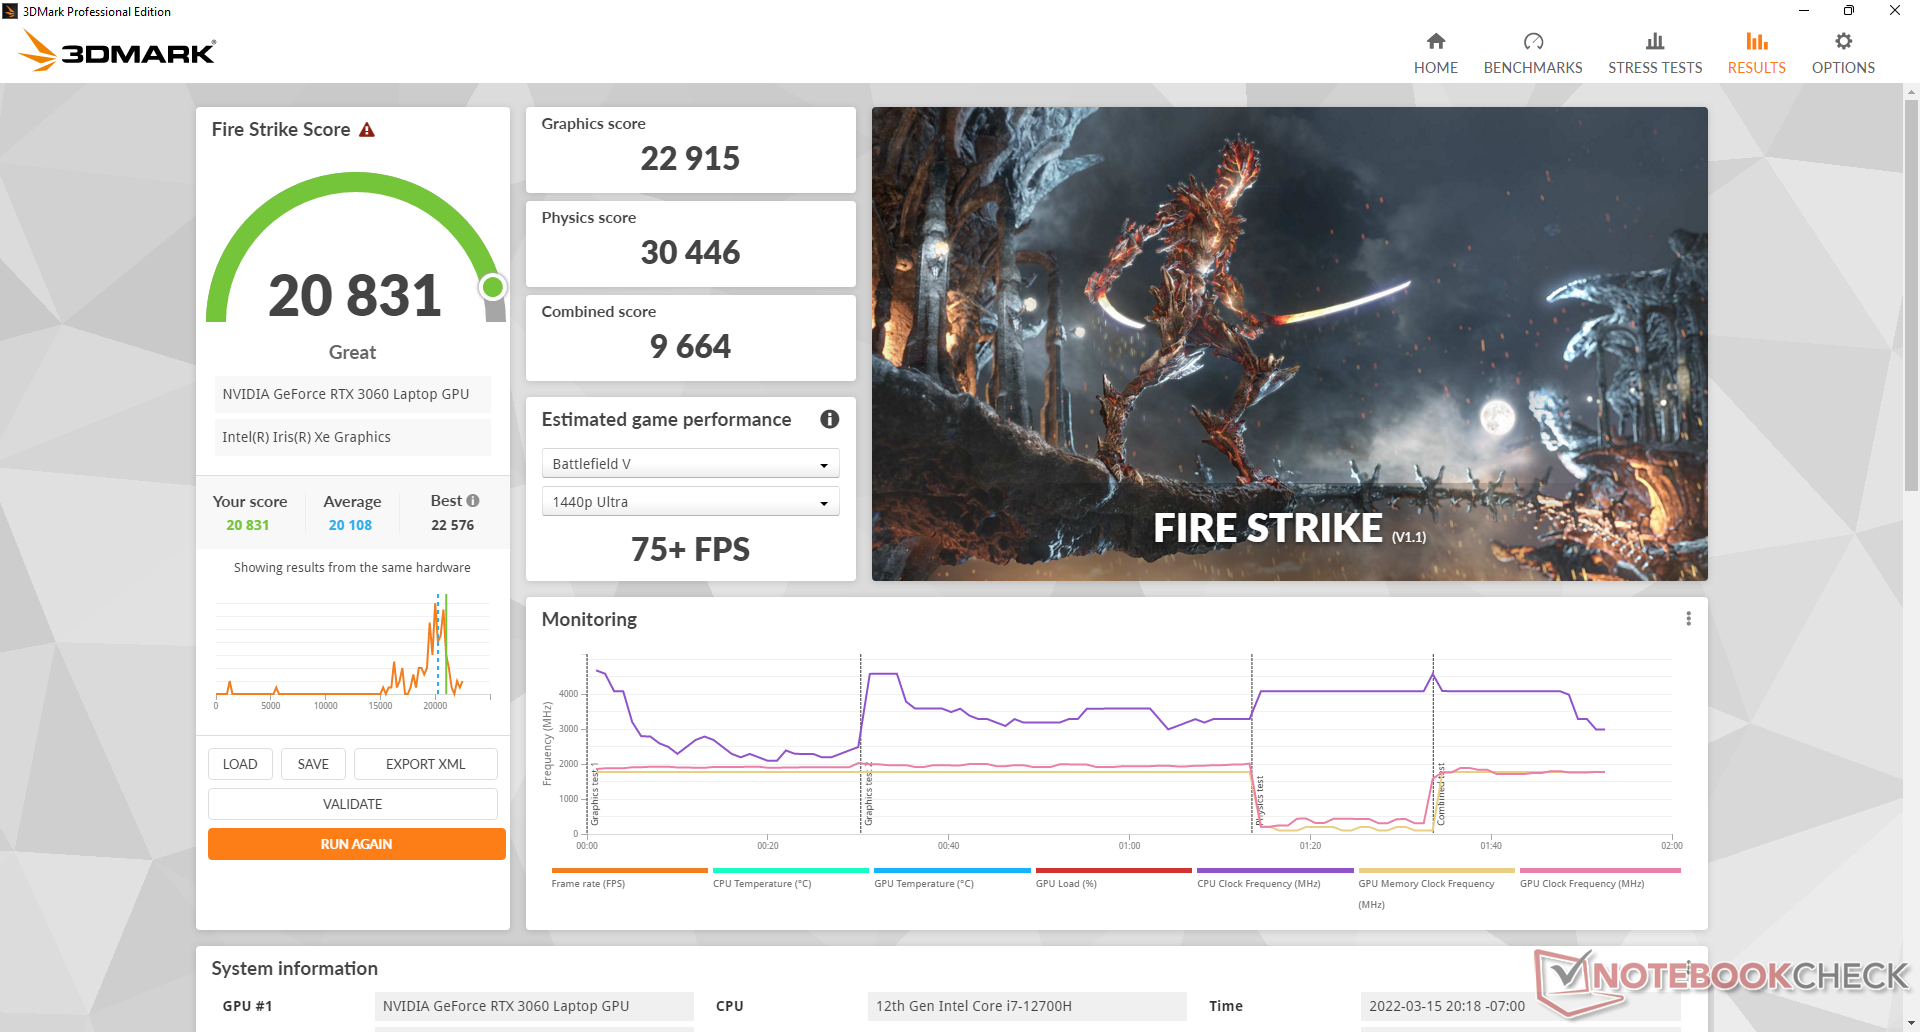
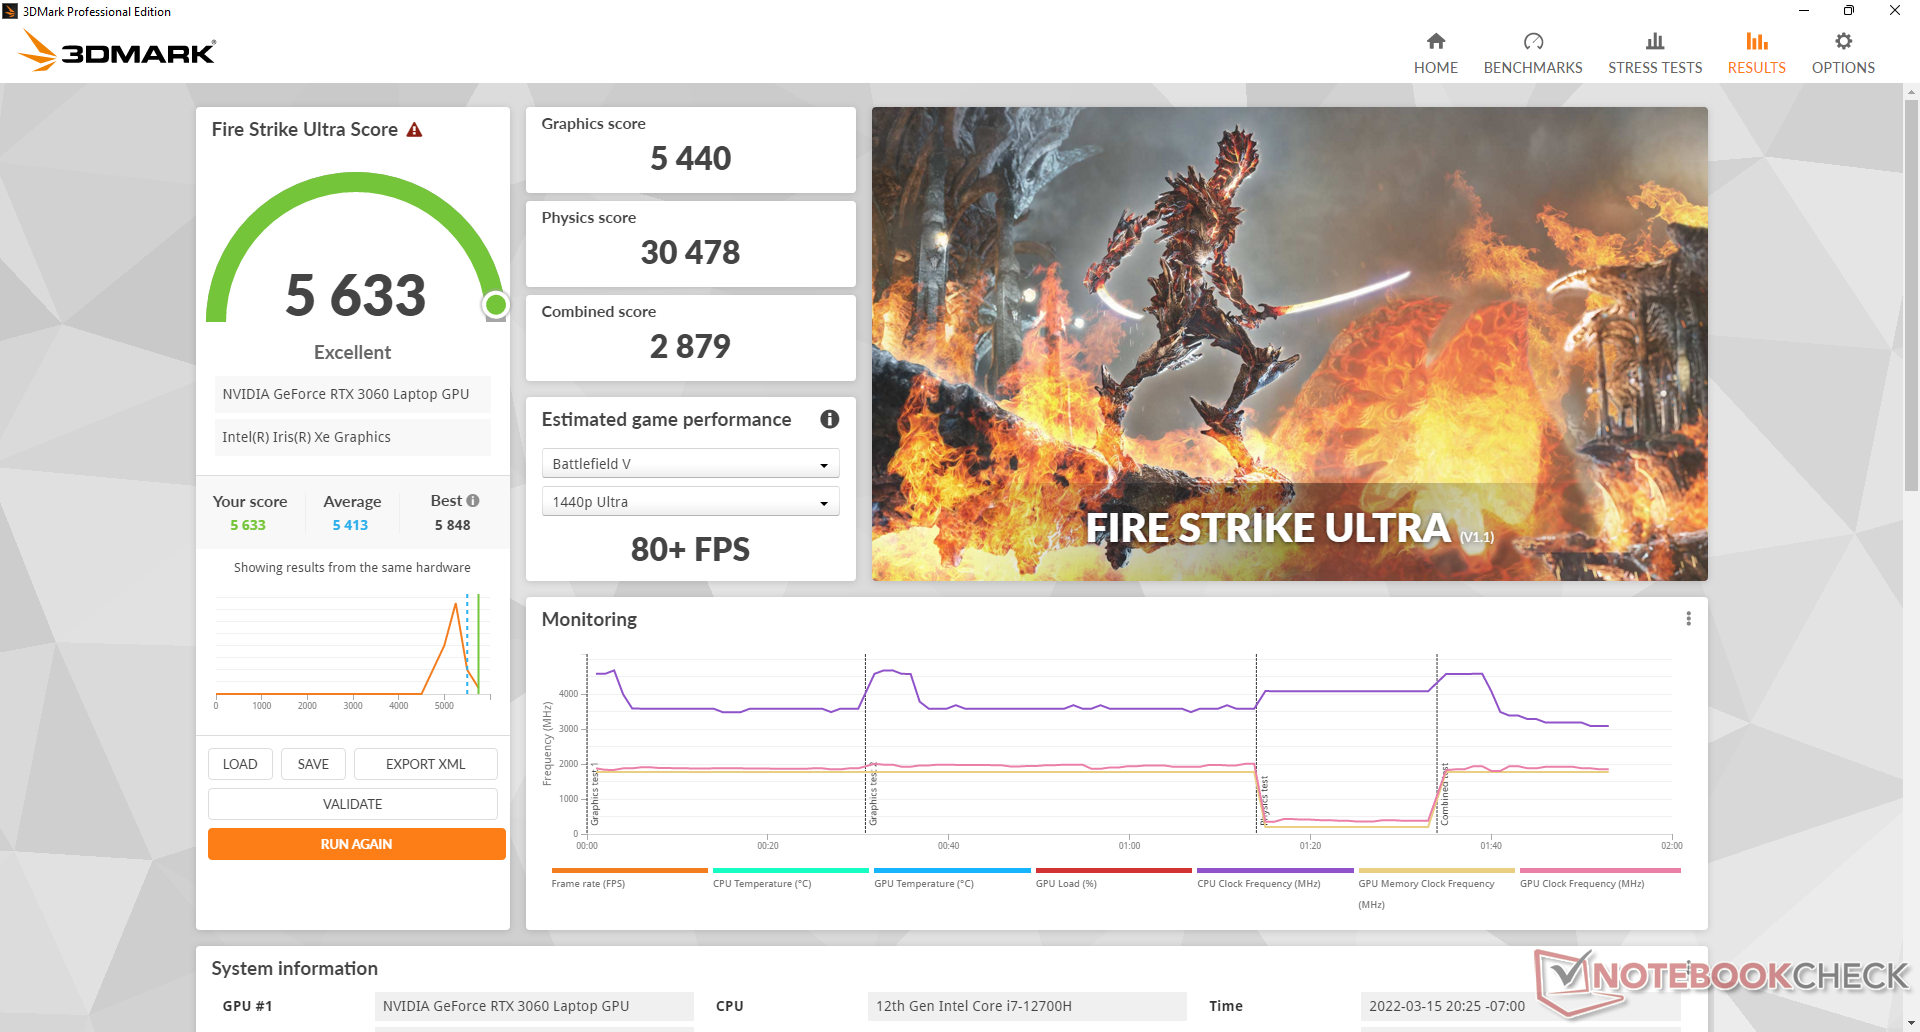
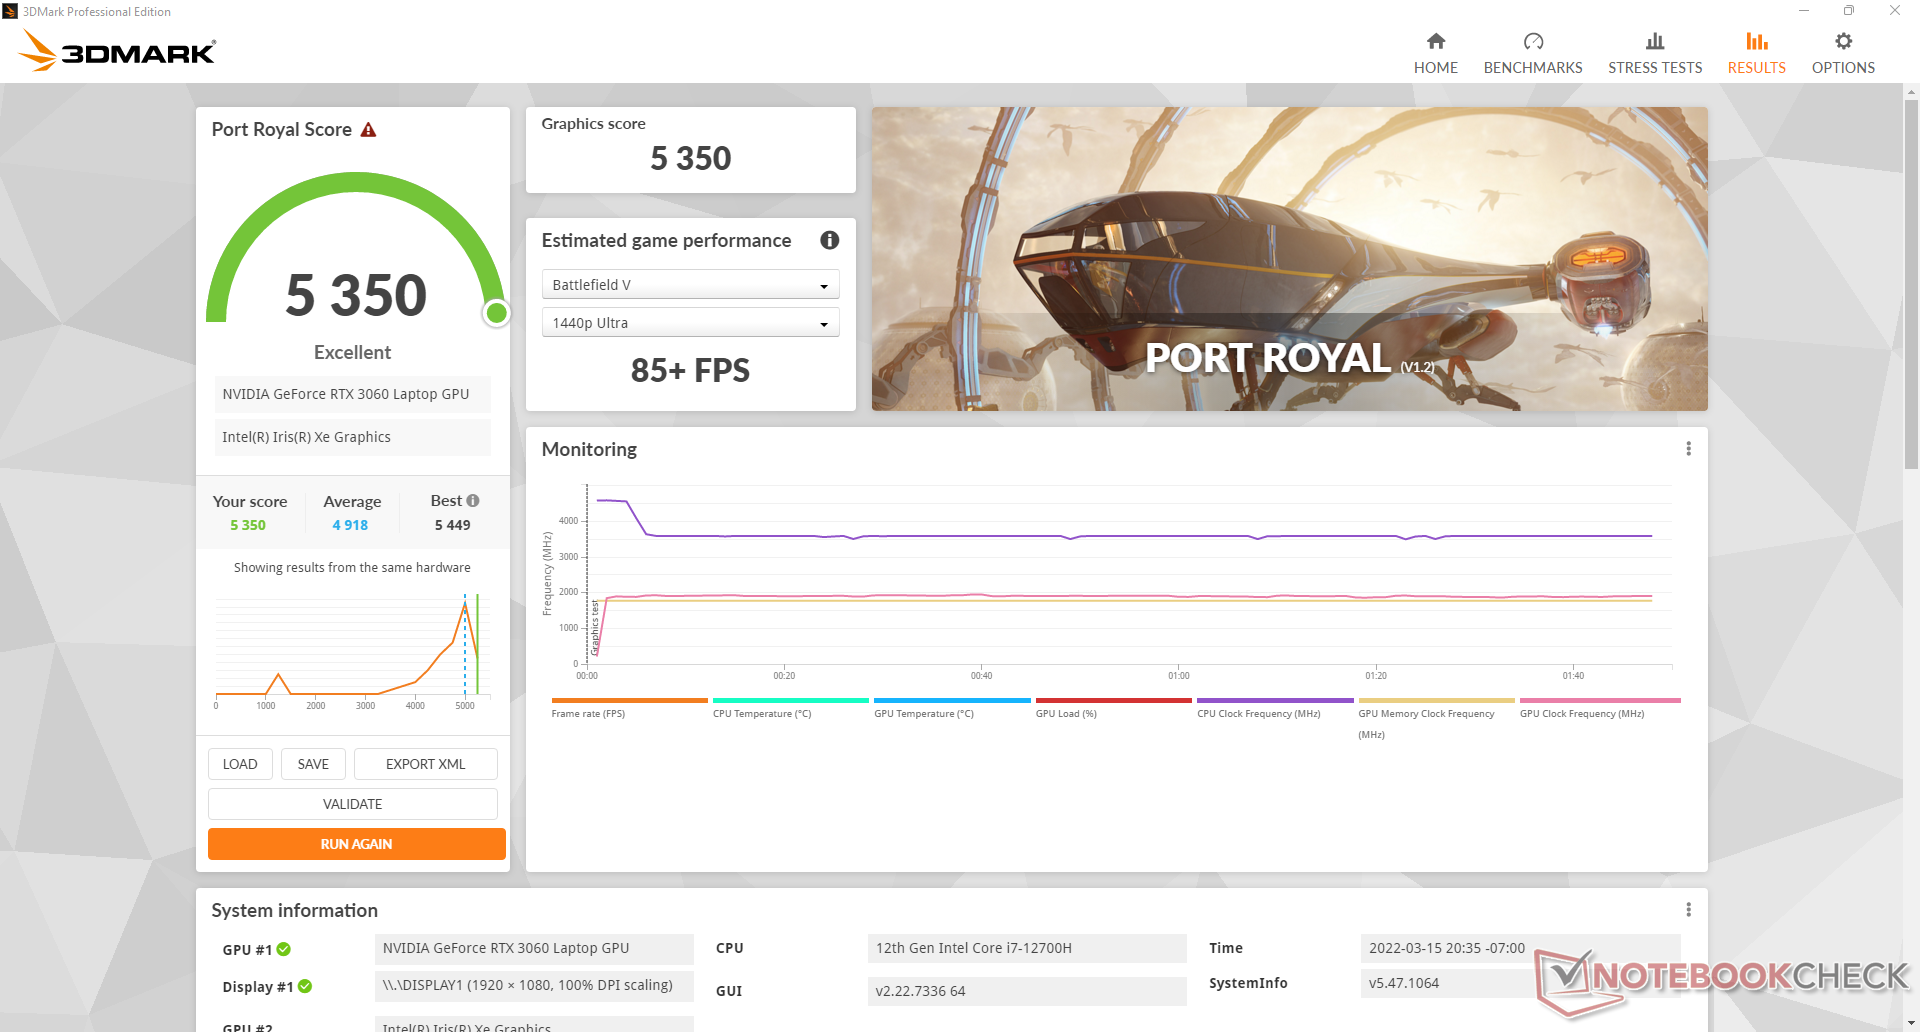
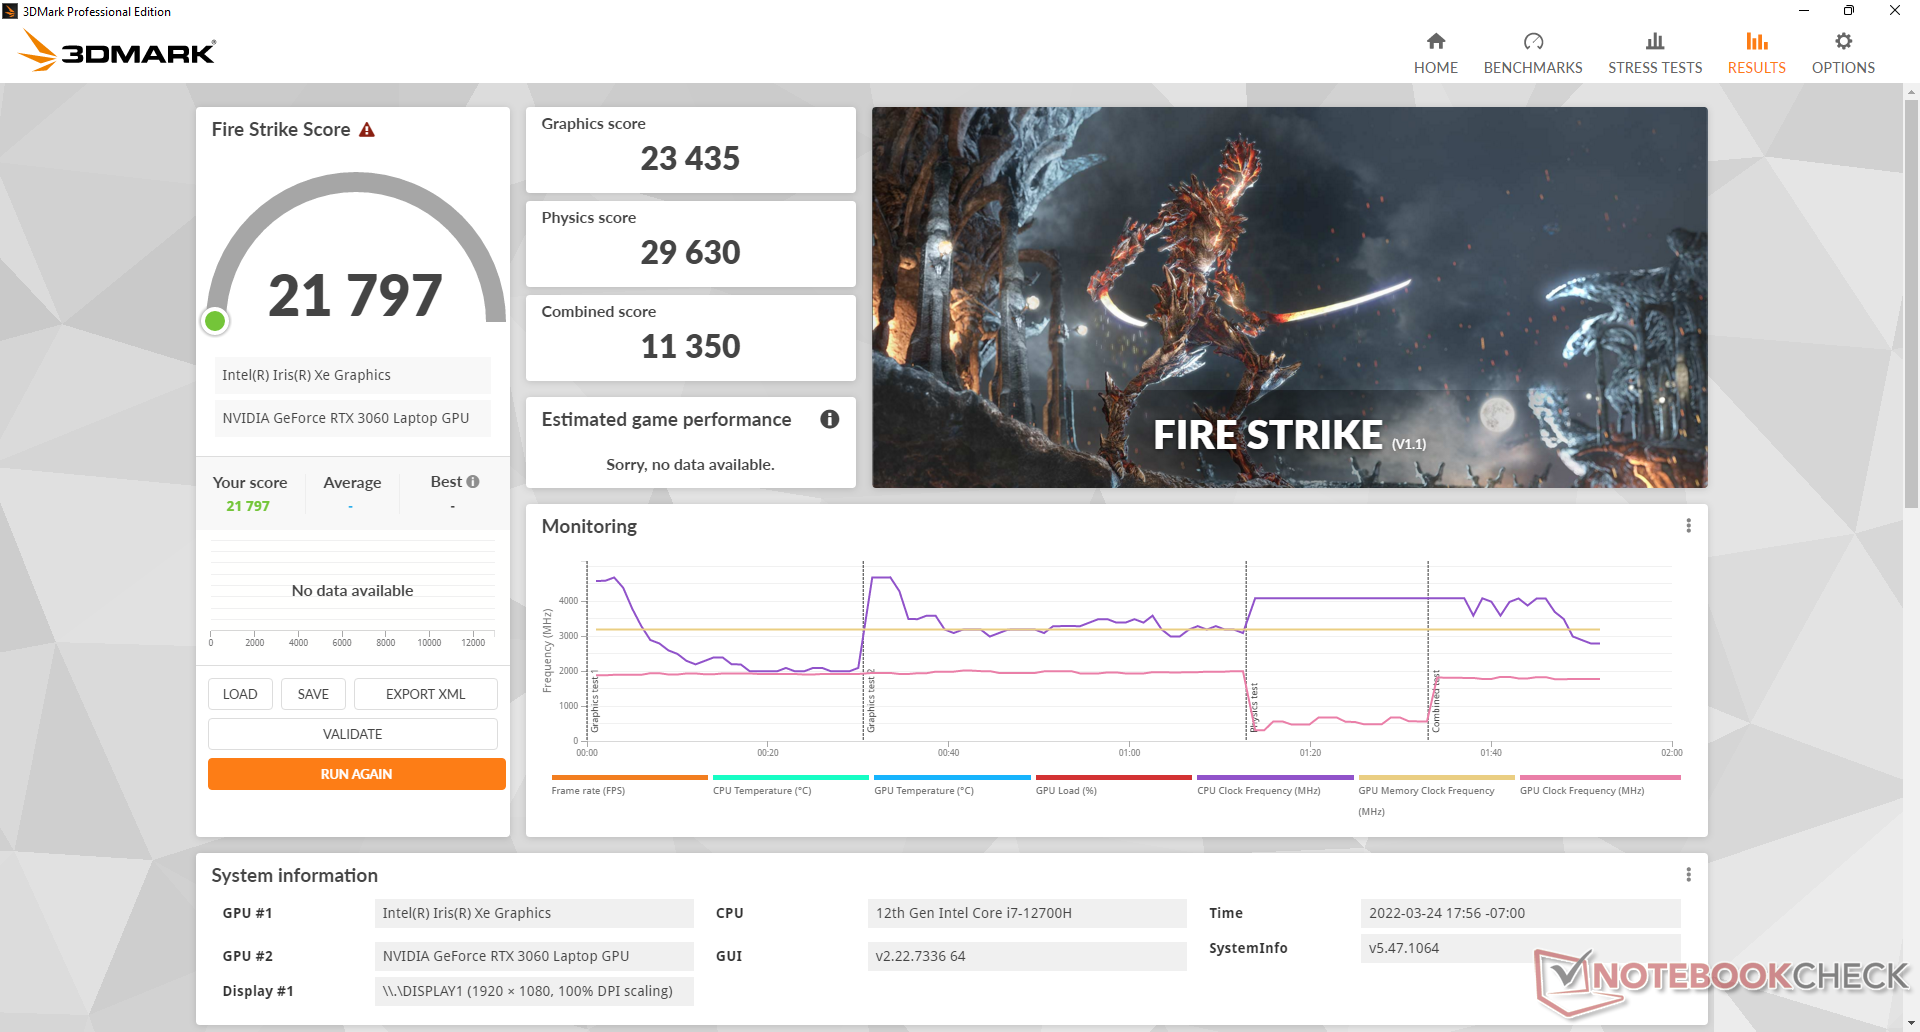
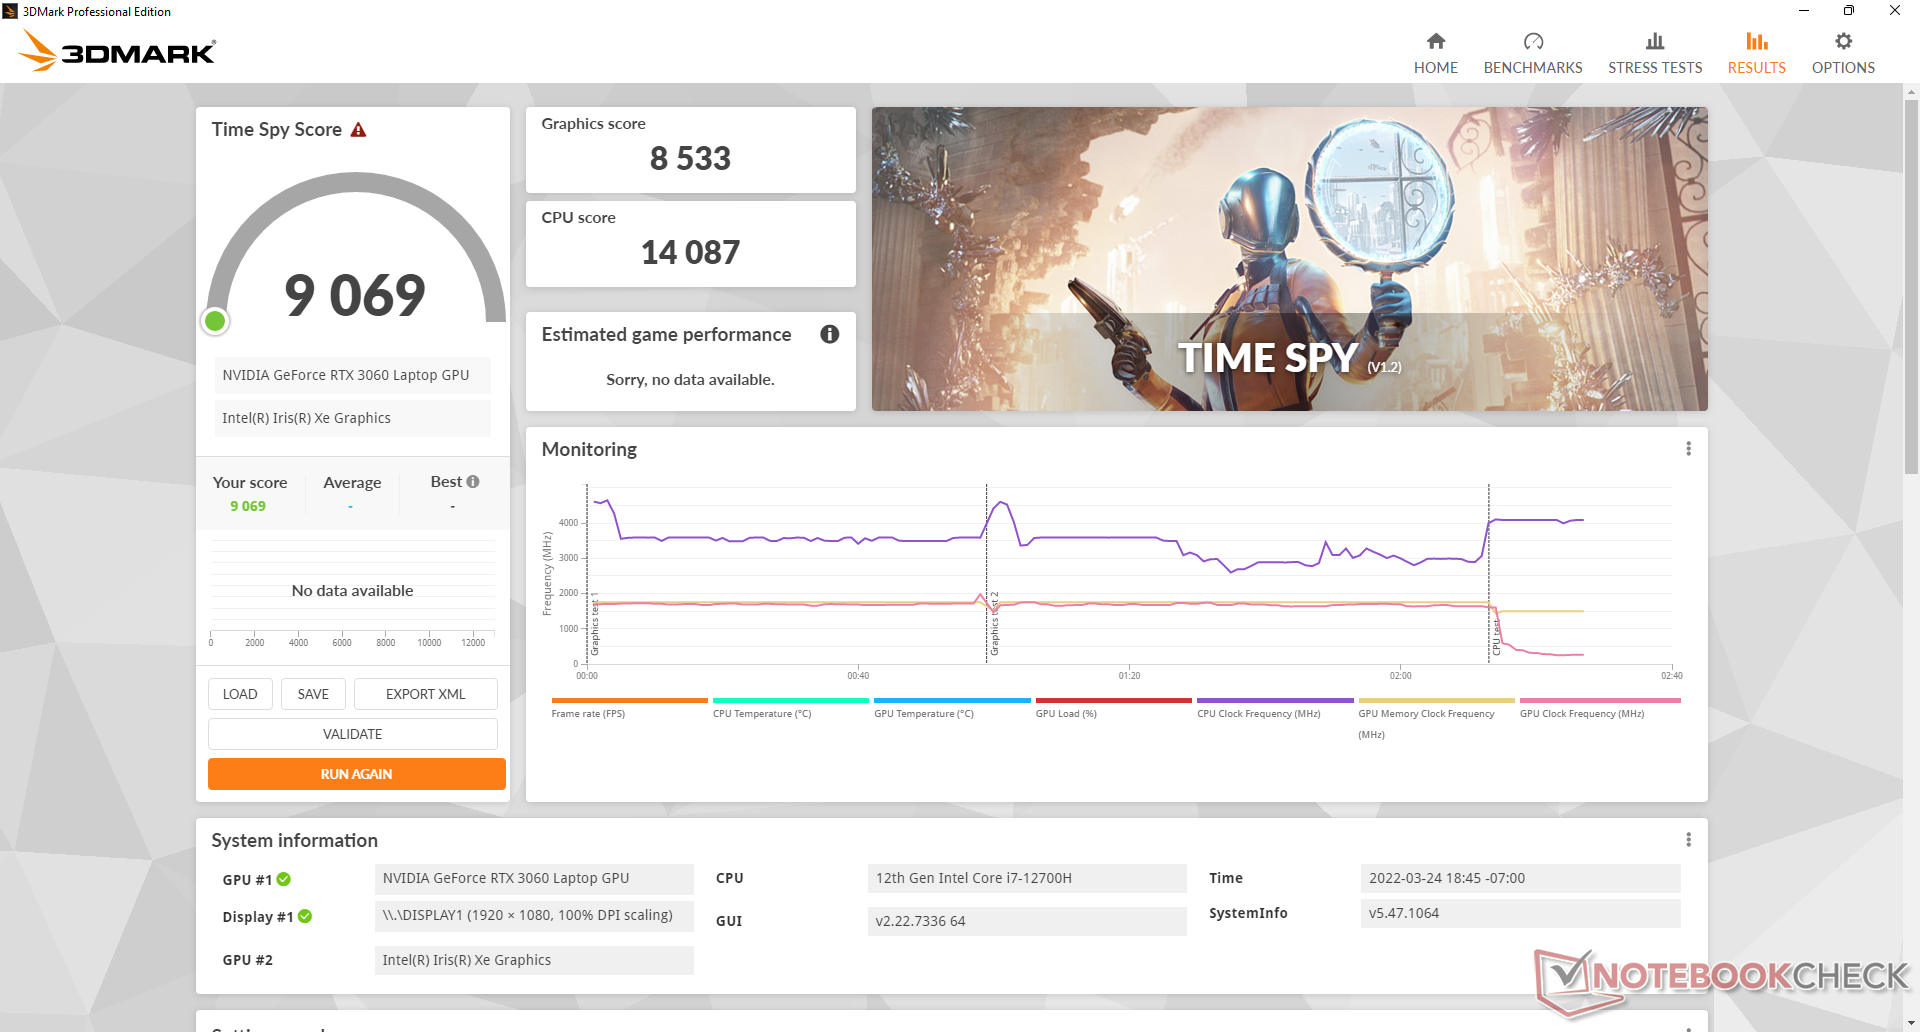
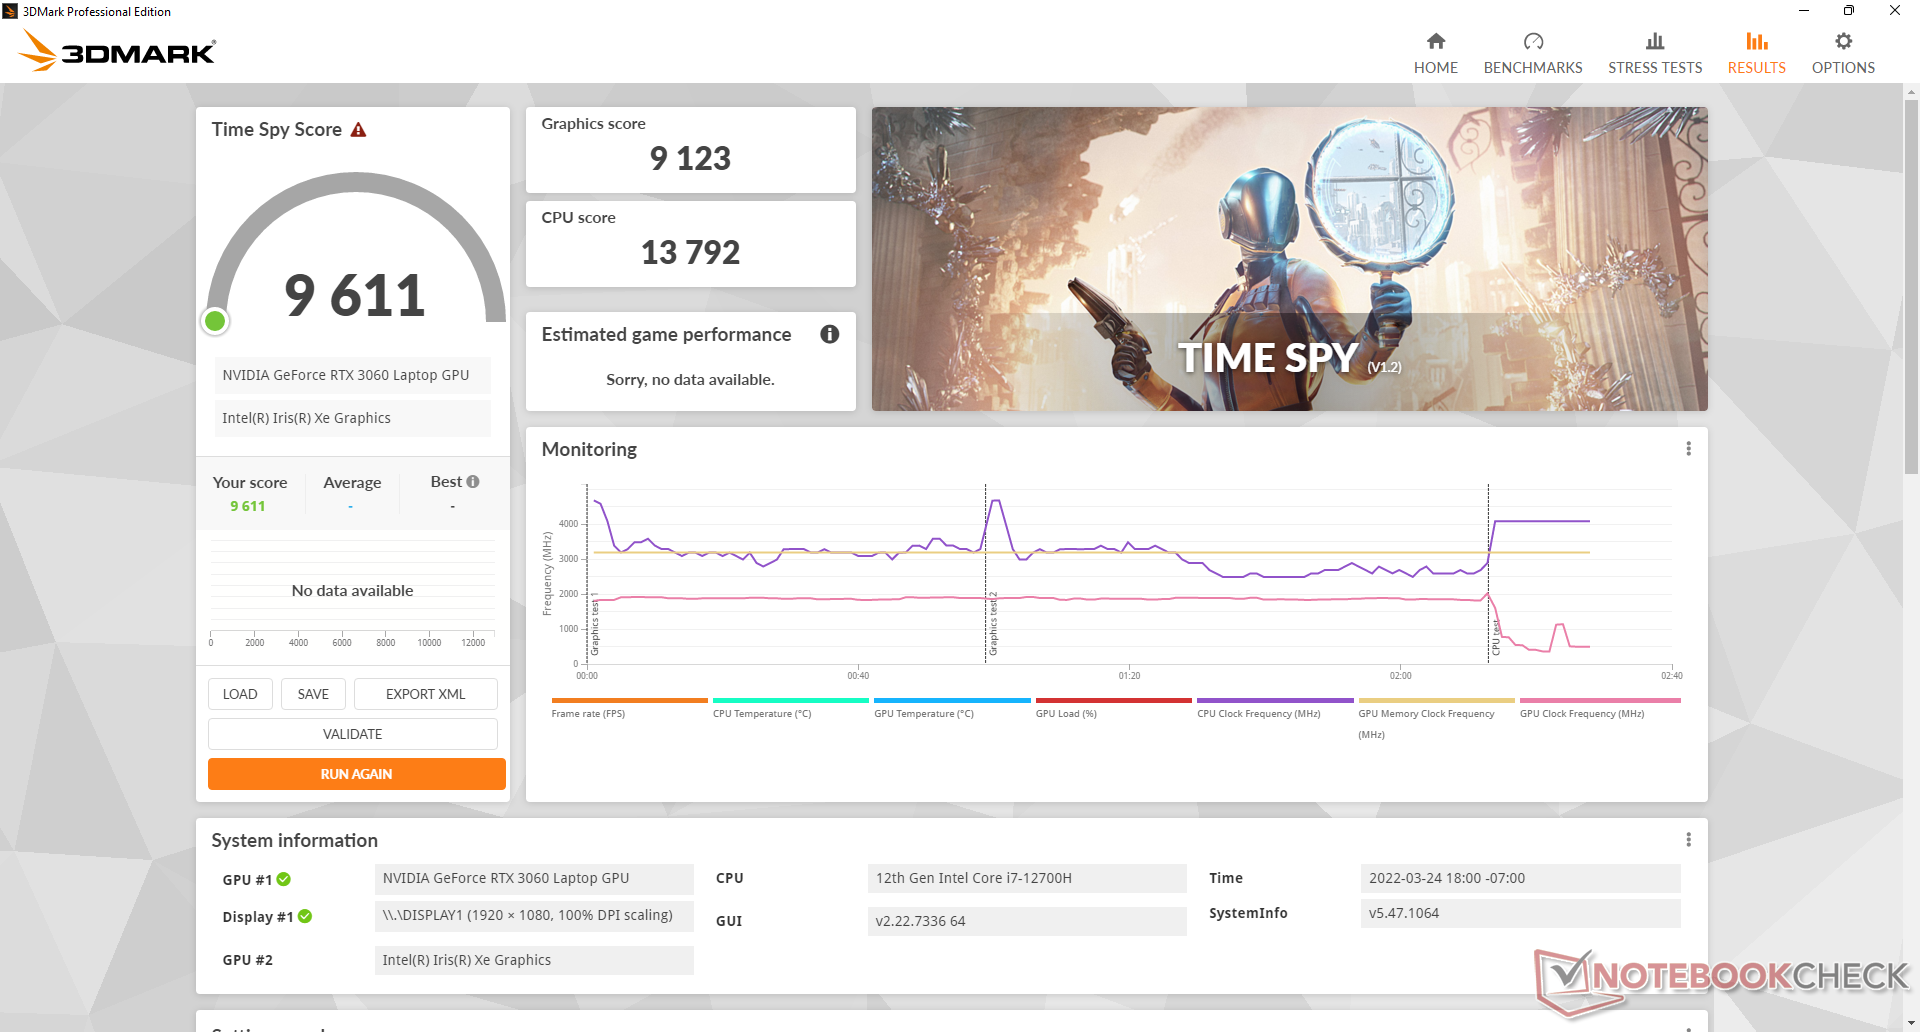
A meta mais alta GeForce RTX 3060 TGP quando comparada ao modelo do ano passado (140 W vs. 95 W) levou naturalmente a um desempenho gráfico superior. Os usuários podem esperar um aumento de 10% a 20% no desempenho em relação à FX506 equipada com a mesma GPU RTX 3060. De fato, a FX507 é um dos portáteis mais rápidos GeForce RTX 3060 que você pode comprar no momento com resultados que são aproximadamente 15% maiores do que a média dos portáteis equipados com a mesma GPU.
A execução no modo MSHybrid em vez do modo GPU discreto resultaria em déficits de desempenho muito pequenos ou quase nenhum déficit. os resultados do 3DMark seriam quase idênticos entre os dois modos, enquanto as taxas de quadros quando o jogo seria mais lento por apenas alguns pontos percentuais em nossos testes.
A execução no modo de desempenho dGPU ao invés do modo dGPU Turbo resultaria em um déficit de desempenho de 5 a 10 por cento do GPU.
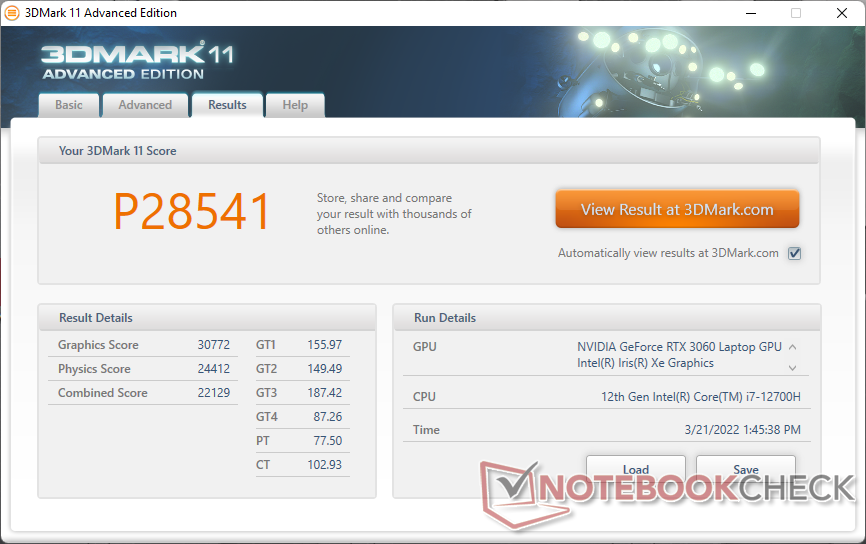

| 3DMark 11 Performance | 28541 pontos | |
| 3DMark Cloud Gate Standard Score | 58475 pontos | |
| 3DMark Fire Strike Score | 20831 pontos | |
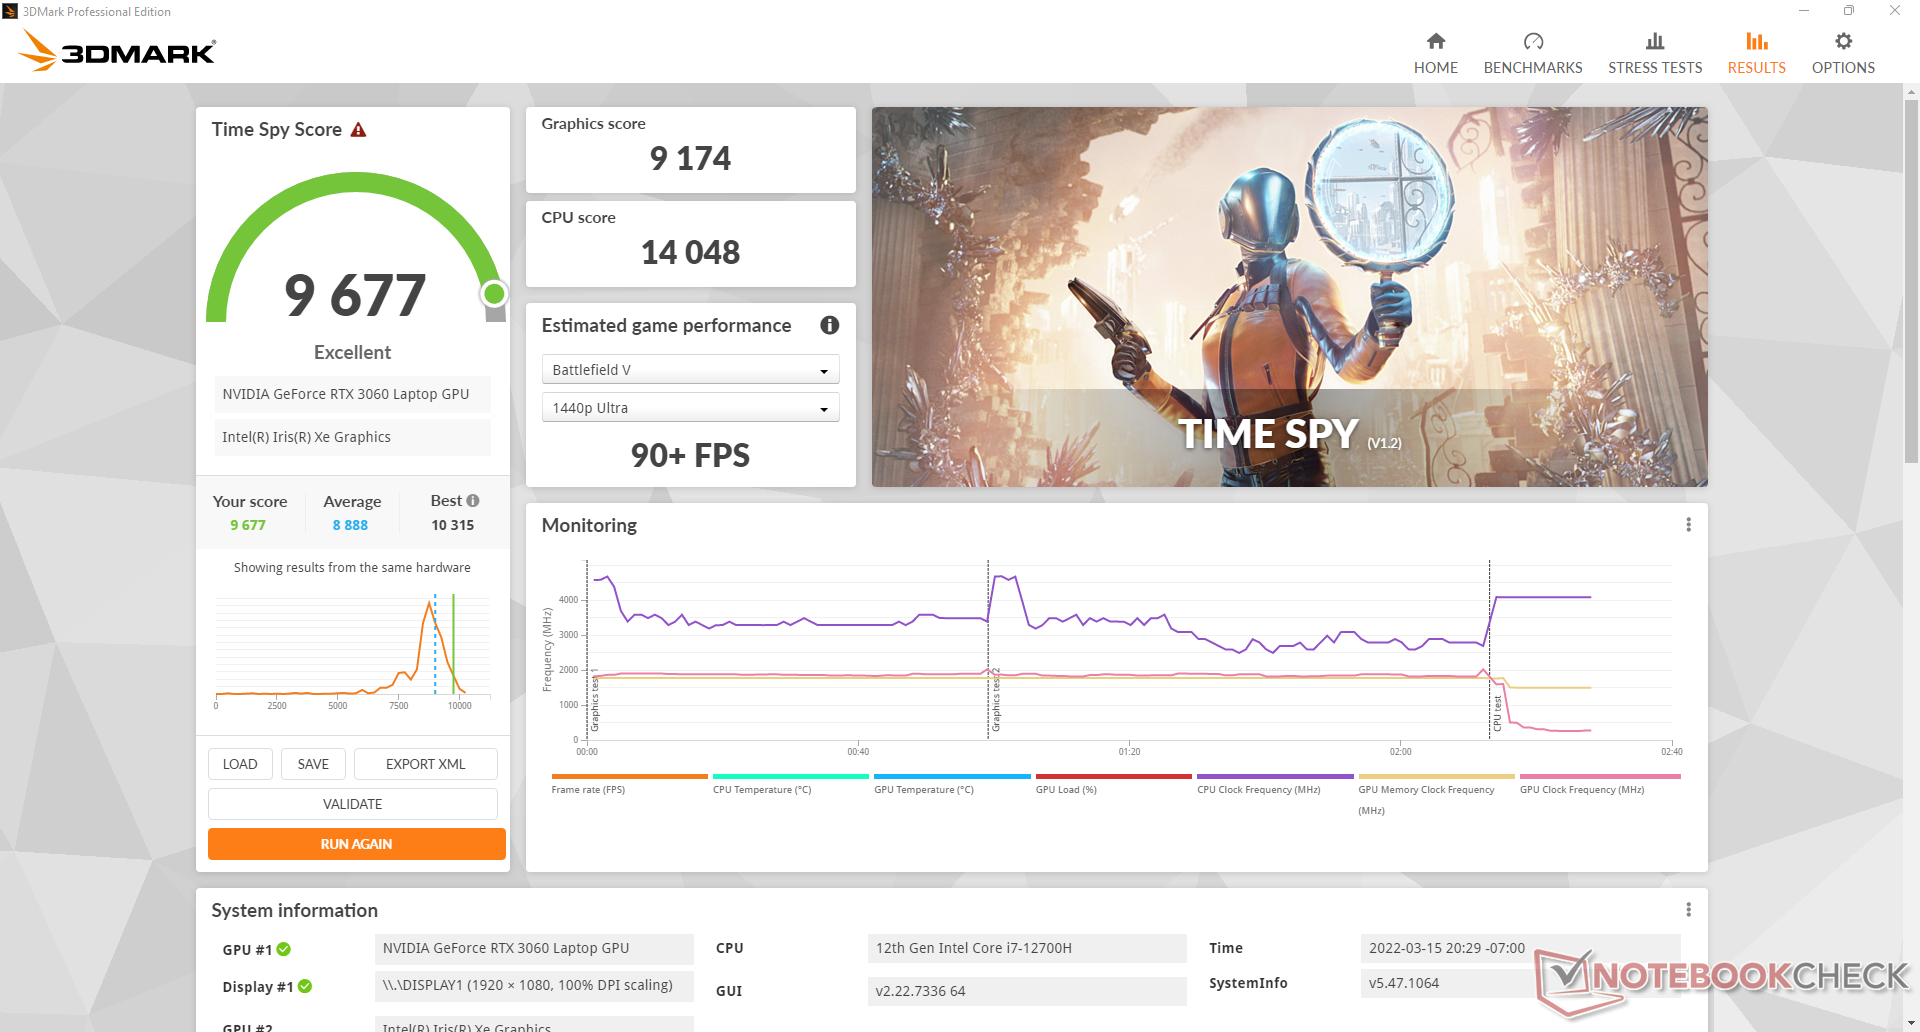
| 3DMark Time Spy Score | 9677 pontos | |
Ajuda | ||
Witcher 3 FPS Chart
| baixo | média | alto | ultra | |
|---|---|---|---|---|
| GTA V (2015) | 186 | 182 | 162 | 97.9 |
| The Witcher 3 (2015) | 395.4 | 291.8 | 186.8 | 91.5 |
| Dota 2 Reborn (2015) | 172 | 161 | 154 | 148 |
| Final Fantasy XV Benchmark (2018) | 161 | 122 | 91.9 | |
| X-Plane 11.11 (2018) | 153 | 136 | 107 | |
| Far Cry 5 (2018) | 156 | 123 | 114 | 114 |
| Strange Brigade (2018) | 345 | 232 | 185 | 160 |
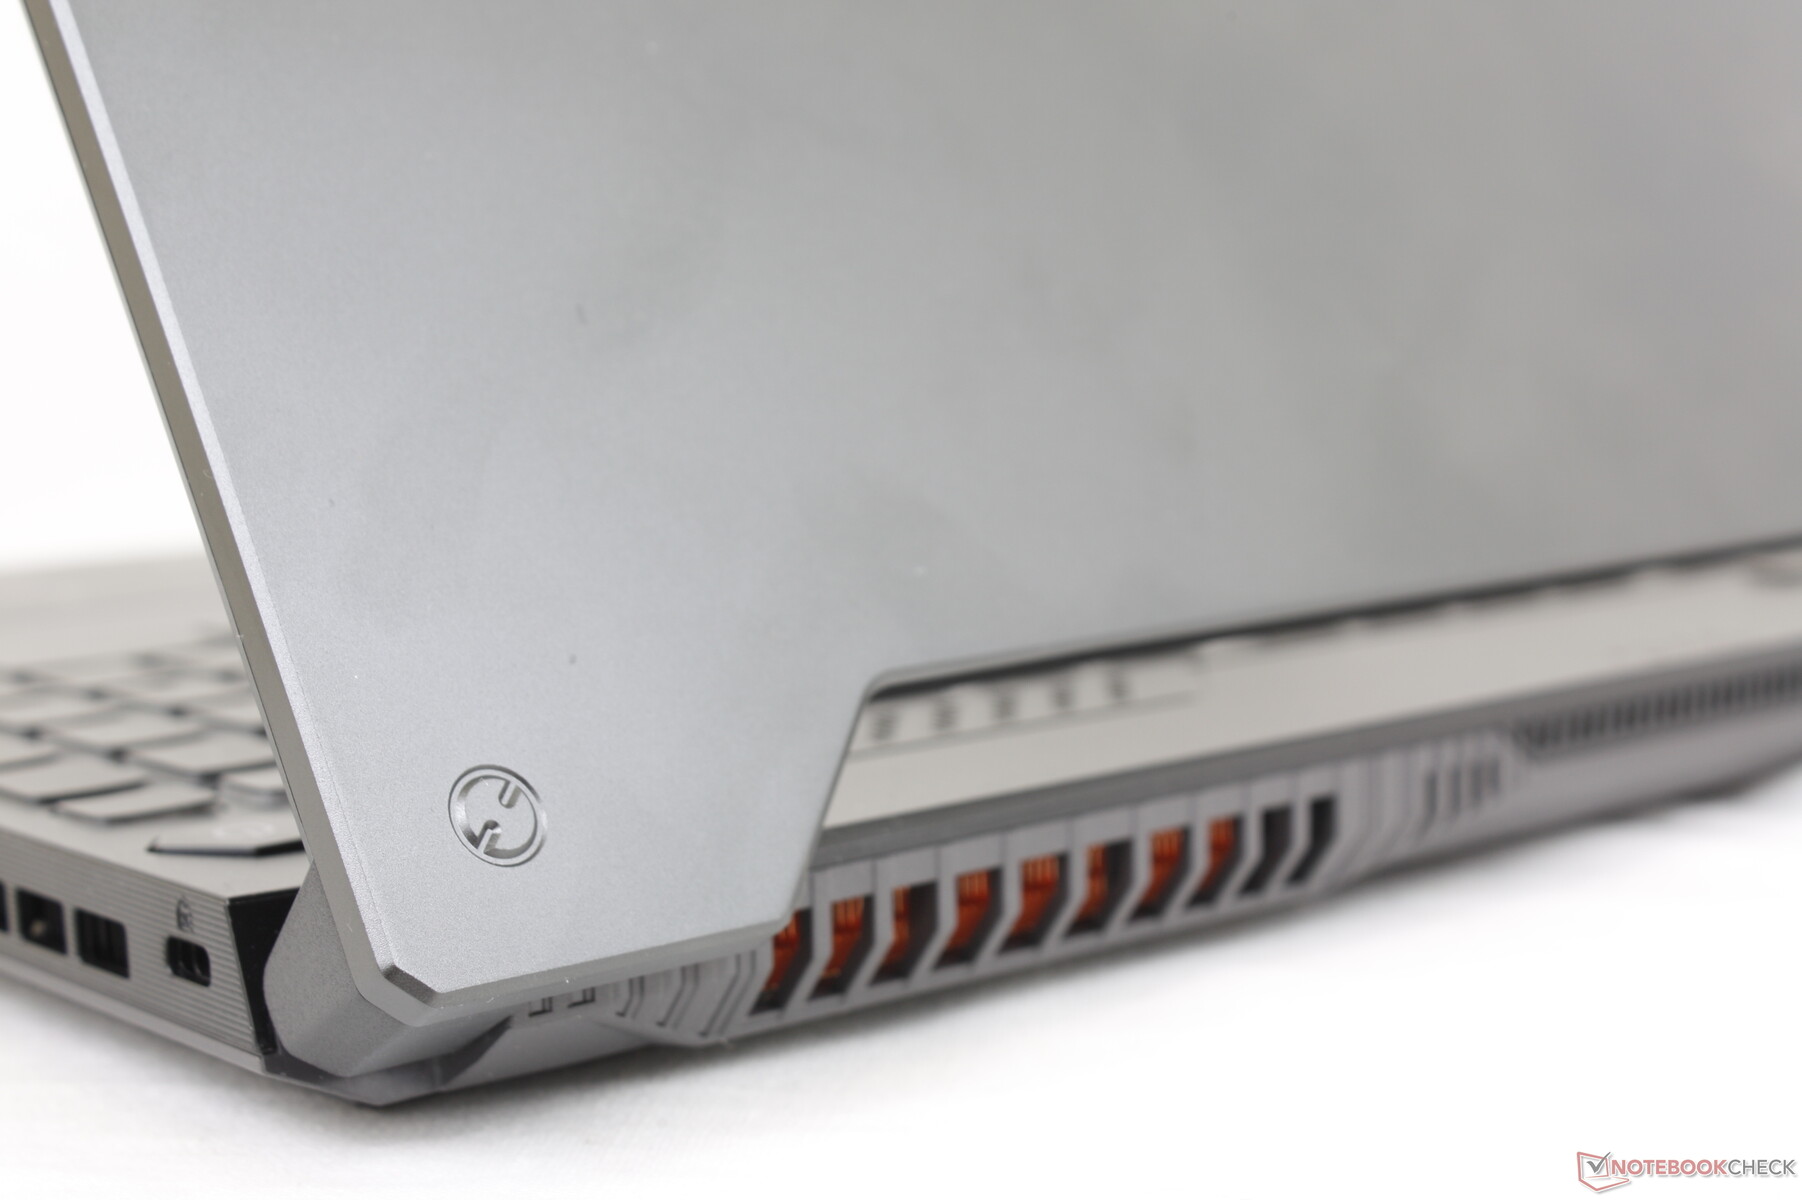
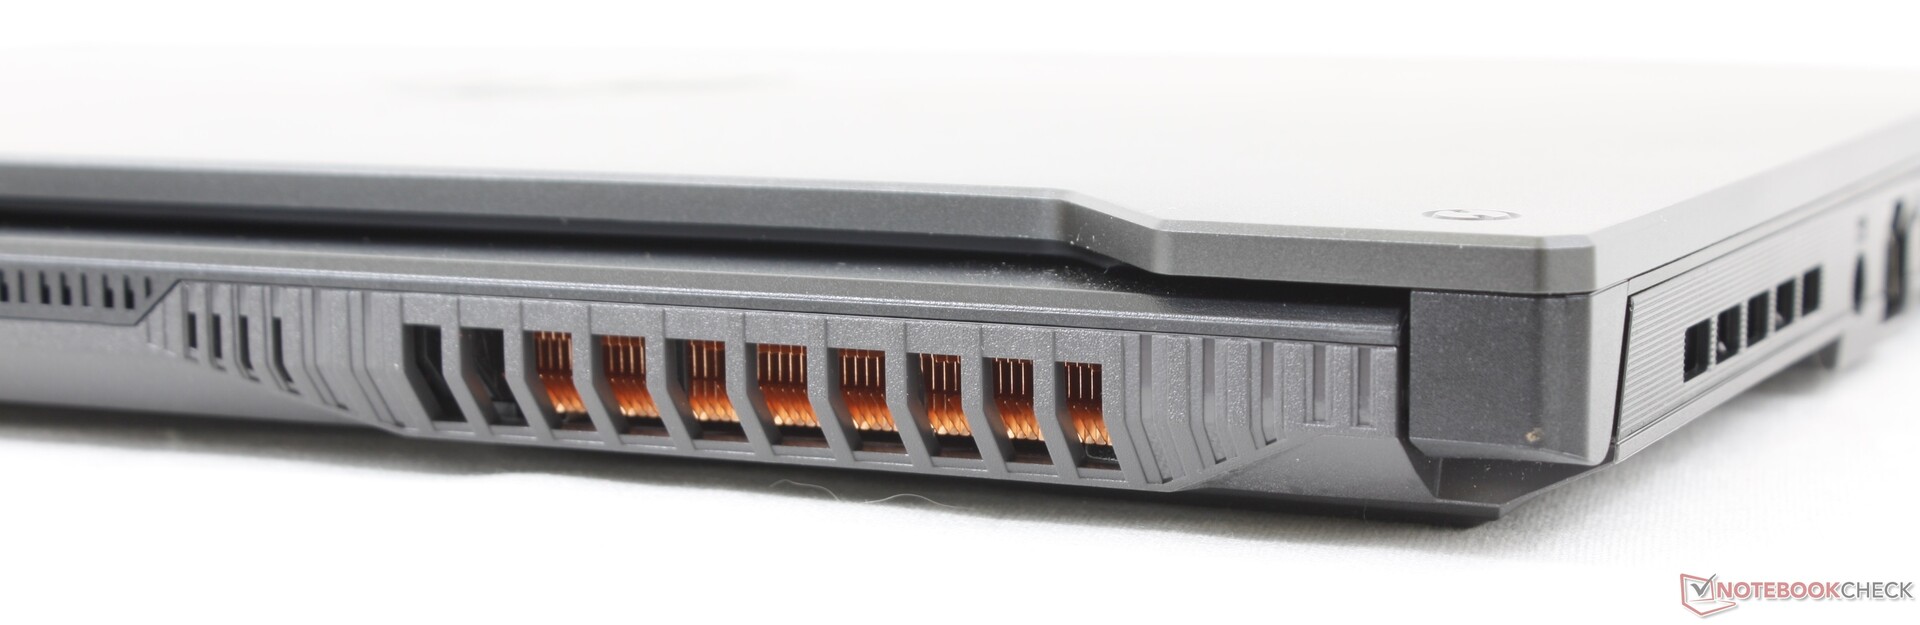
Emissões
Ruído do sistema
O Asus atualizou a solução de resfriamento para a FX507 apesar de seu peso geral mais leve quando comparado com a FX506. Cinco modos de ventiladores estão disponíveis via Armoury Crate: Windows, Silent, Performance, Turbo, e Manual. Windows ou Silent é recomendado ao navegar ou processar palavras para evitar pulsar os ventiladores.
Rodar Witcher 3 no modo Performance e Turbo resultaria em um ruído do ventilador de 45,8 dB(A) e 54,1 dB(A), respectivamente. O menor ruído do ventilador no modo Performance é significativo em relação à pequena redução de 5% a 10% no desempenho gráfico quando comparado ao modo Turbo. Assim, os usuários podem querer considerar os jogos no modo Performance se o ruído do ventilador for uma preocupação.
Barulho
| Ocioso |
| 23.6 / 23.6 / 25.4 dB |
| Carga |
| 38 / 57.2 dB |
 | ||
30 dB silencioso 40 dB(A) audível 50 dB(A) ruidosamente alto |
||
min: | ||
| Asus TUF Gaming F15 FX507ZM GeForce RTX 3060 Laptop GPU, i7-12700H, SK Hynix HFM001TD3JX013N | Asus TUF Gaming F15 FX506HM GeForce RTX 3060 Laptop GPU, i7-11800H, SK Hynix HFM001TD3JX013N | Asus TUF Dash F15 FX516PR GeForce RTX 3070 Laptop GPU, i7-11370H, SK Hynix HFM001TD3JX013N | Asus ROG Strix Scar 15 G533QS GeForce RTX 3080 Laptop GPU, R9 5900HX, ADATA Swordfish 2 TB | Asus Zephyrus S15 GX502L GeForce RTX 2070 Super Mobile, i7-10875H, WDC PC SN730 SDBPNTY-1T00 | Asus ZenBook Pro Duo UX582 LR-1BH2 GeForce RTX 3070 Laptop GPU, i7-10870H, Samsung PM981a MZVLB1T0HBLR | |
|---|---|---|---|---|---|---|
| Noise | 6% | -14% | -8% | -21% | -1% | |
| desligado / ambiente * (dB) | 23.2 | 24.8 -7% | 24 -3% | 25.5 -10% | 25 -8% | 24.6 -6% |
| Idle Minimum * (dB) | 23.6 | 24.6 -4% | 25 -6% | 25.5 -8% | 28 -19% | 24.6 -4% |
| Idle Average * (dB) | 23.6 | 24.9 -6% | 30 -27% | 25.5 -8% | 31 -31% | 24.6 -4% |
| Idle Maximum * (dB) | 25.4 | 24.9 2% | 35 -38% | 37.1 -46% | 36 -42% | 25.9 -2% |
| Load Average * (dB) | 38 | 27.1 29% | 53 -39% | 39.2 -3% | 56 -47% | 39.6 -4% |
| Witcher 3 ultra * (dB) | 54.1 | 46.4 14% | 48 11% | 50.5 7% | 55 -2% | 49.8 8% |
| Load Maximum * (dB) | 57.2 | 49 14% | 54 6% | 51.8 9% | 57 -0% | 54.2 5% |
* ... menor é melhor
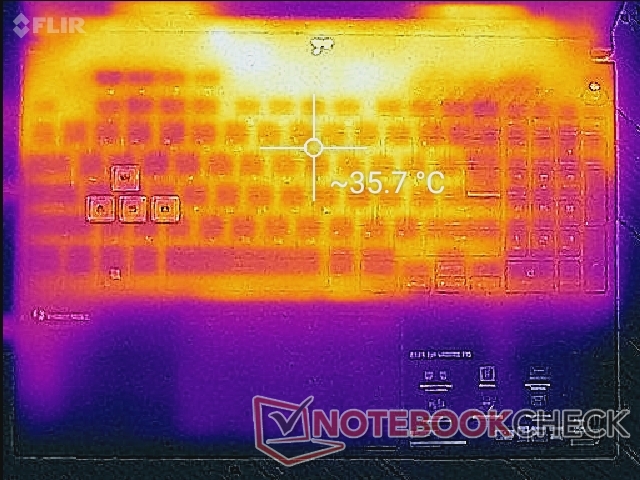
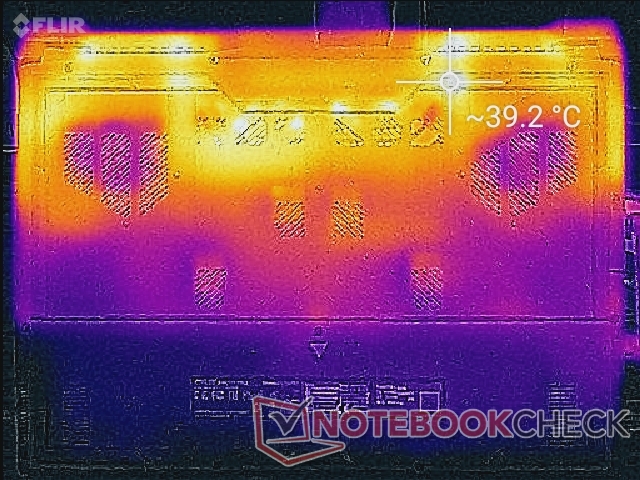
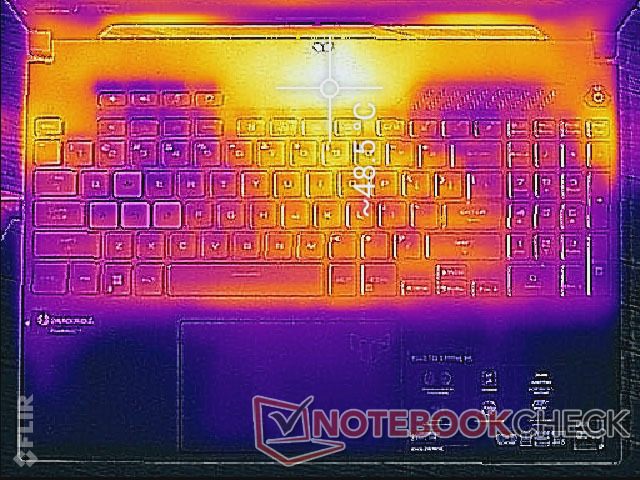
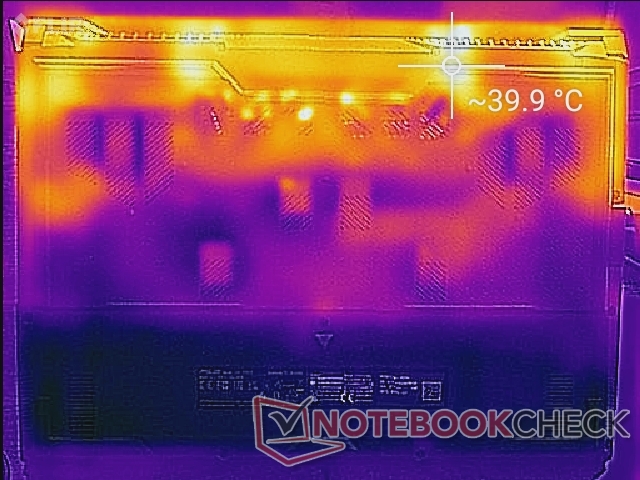
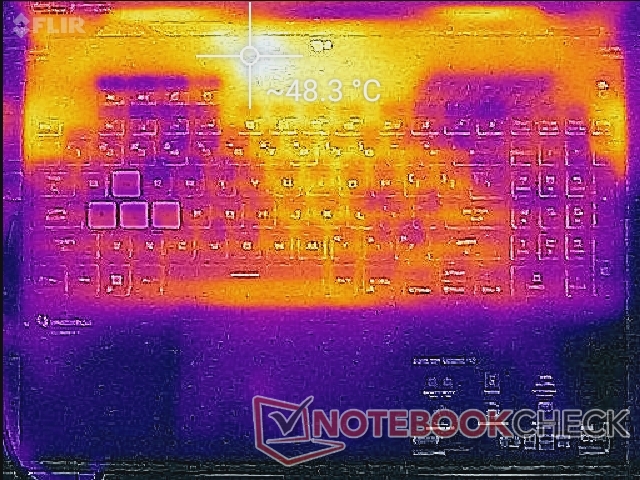
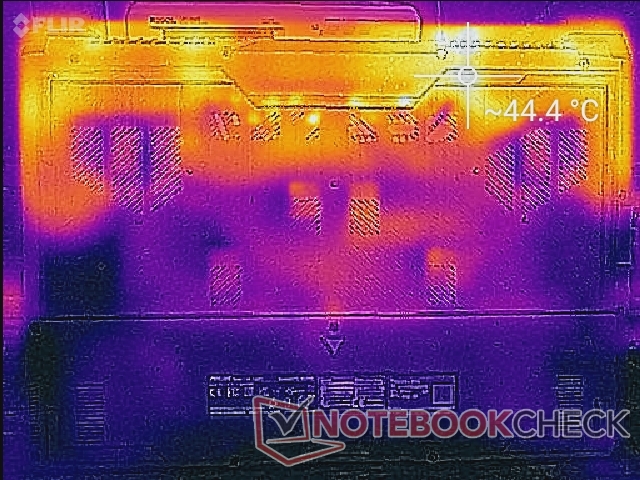
Temperatura
Os pontos quentes da temperatura da superfície são mais quentes do que o que registramos no modelo do ano passado. Ao funcionar Witcher 3por exemplo, o ponto mais quente na FX507 pode ser tão quente quanto 49 C em comparação com apenas 37 C na FX506. Entretanto, a solução melhorada de resfriamento da FX507 afastou o ponto quente das teclas do teclado para manter as palmas das mãos e os dedos frios, não importando a carga na tela
As temperaturas de superfície são mais quentes do que o esperado mesmo quando ociosas na área de trabalho, mas isso se deve ao fato de que os ventiladores tendem a ficar ociosos ou a funcionar em velocidades muito baixas quando a atividade é baixa. Consideramos isto uma troca aceitável, especialmente quando em salas de aula ou quando tocando vídeo ou música.
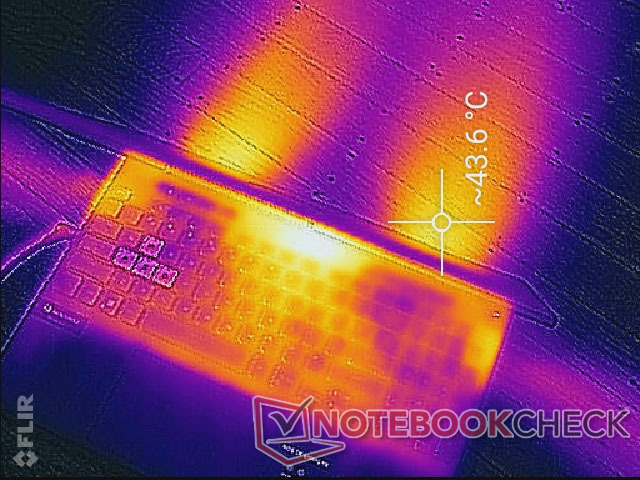
(±) A temperatura máxima no lado superior é 44.4 °C / 112 F, em comparação com a média de 40.4 °C / 105 F , variando de 21.2 a 68.8 °C para a classe Gaming.
(-) A parte inferior aquece até um máximo de 48.8 °C / 120 F, em comparação com a média de 43.2 °C / 110 F
(+) Em uso inativo, a temperatura média para o lado superior é 30.2 °C / 86 F, em comparação com a média do dispositivo de 33.9 °C / ### class_avg_f### F.
(+) Jogando The Witcher 3, a temperatura média para o lado superior é 31.4 °C / 89 F, em comparação com a média do dispositivo de 33.9 °C / ## #class_avg_f### F.
(+) Os apoios para as mãos e o touchpad são mais frios que a temperatura da pele, com um máximo de 28 °C / 82.4 F e, portanto, são frios ao toque.
(±) A temperatura média da área do apoio para as mãos de dispositivos semelhantes foi 28.8 °C / 83.8 F (+0.8 °C / 1.4 F).
| Asus TUF Gaming F15 FX507ZM Intel Core i7-12700H, NVIDIA GeForce RTX 3060 Laptop GPU | Asus TUF Gaming F15 FX506HM Intel Core i7-11800H, NVIDIA GeForce RTX 3060 Laptop GPU | Asus TUF Dash F15 FX516PR Intel Core i7-11370H, NVIDIA GeForce RTX 3070 Laptop GPU | Asus ROG Strix Scar 15 G533QS AMD Ryzen 9 5900HX, NVIDIA GeForce RTX 3080 Laptop GPU | Asus Zephyrus S15 GX502L Intel Core i7-10875H, NVIDIA GeForce RTX 2070 Super Mobile | Asus ZenBook Pro Duo UX582 LR-1BH2 Intel Core i7-10870H, NVIDIA GeForce RTX 3070 Laptop GPU | |
|---|---|---|---|---|---|---|
| Heat | 16% | 1% | 4% | 11% | 14% | |
| Maximum Upper Side * (°C) | 44.4 | 46.4 -5% | 55 -24% | 43.4 2% | 51 -15% | 47.7 -7% |
| Maximum Bottom * (°C) | 48.8 | 45.4 7% | 56 -15% | 48.2 1% | 44 10% | 53.8 -10% |
| Idle Upper Side * (°C) | 37.8 | 26 31% | 29 23% | 35.2 7% | 29 23% | 24.4 35% |
| Idle Bottom * (°C) | 39.6 | 27.4 31% | 32 19% | 37 7% | 30 24% | 24.7 38% |
* ... menor é melhor
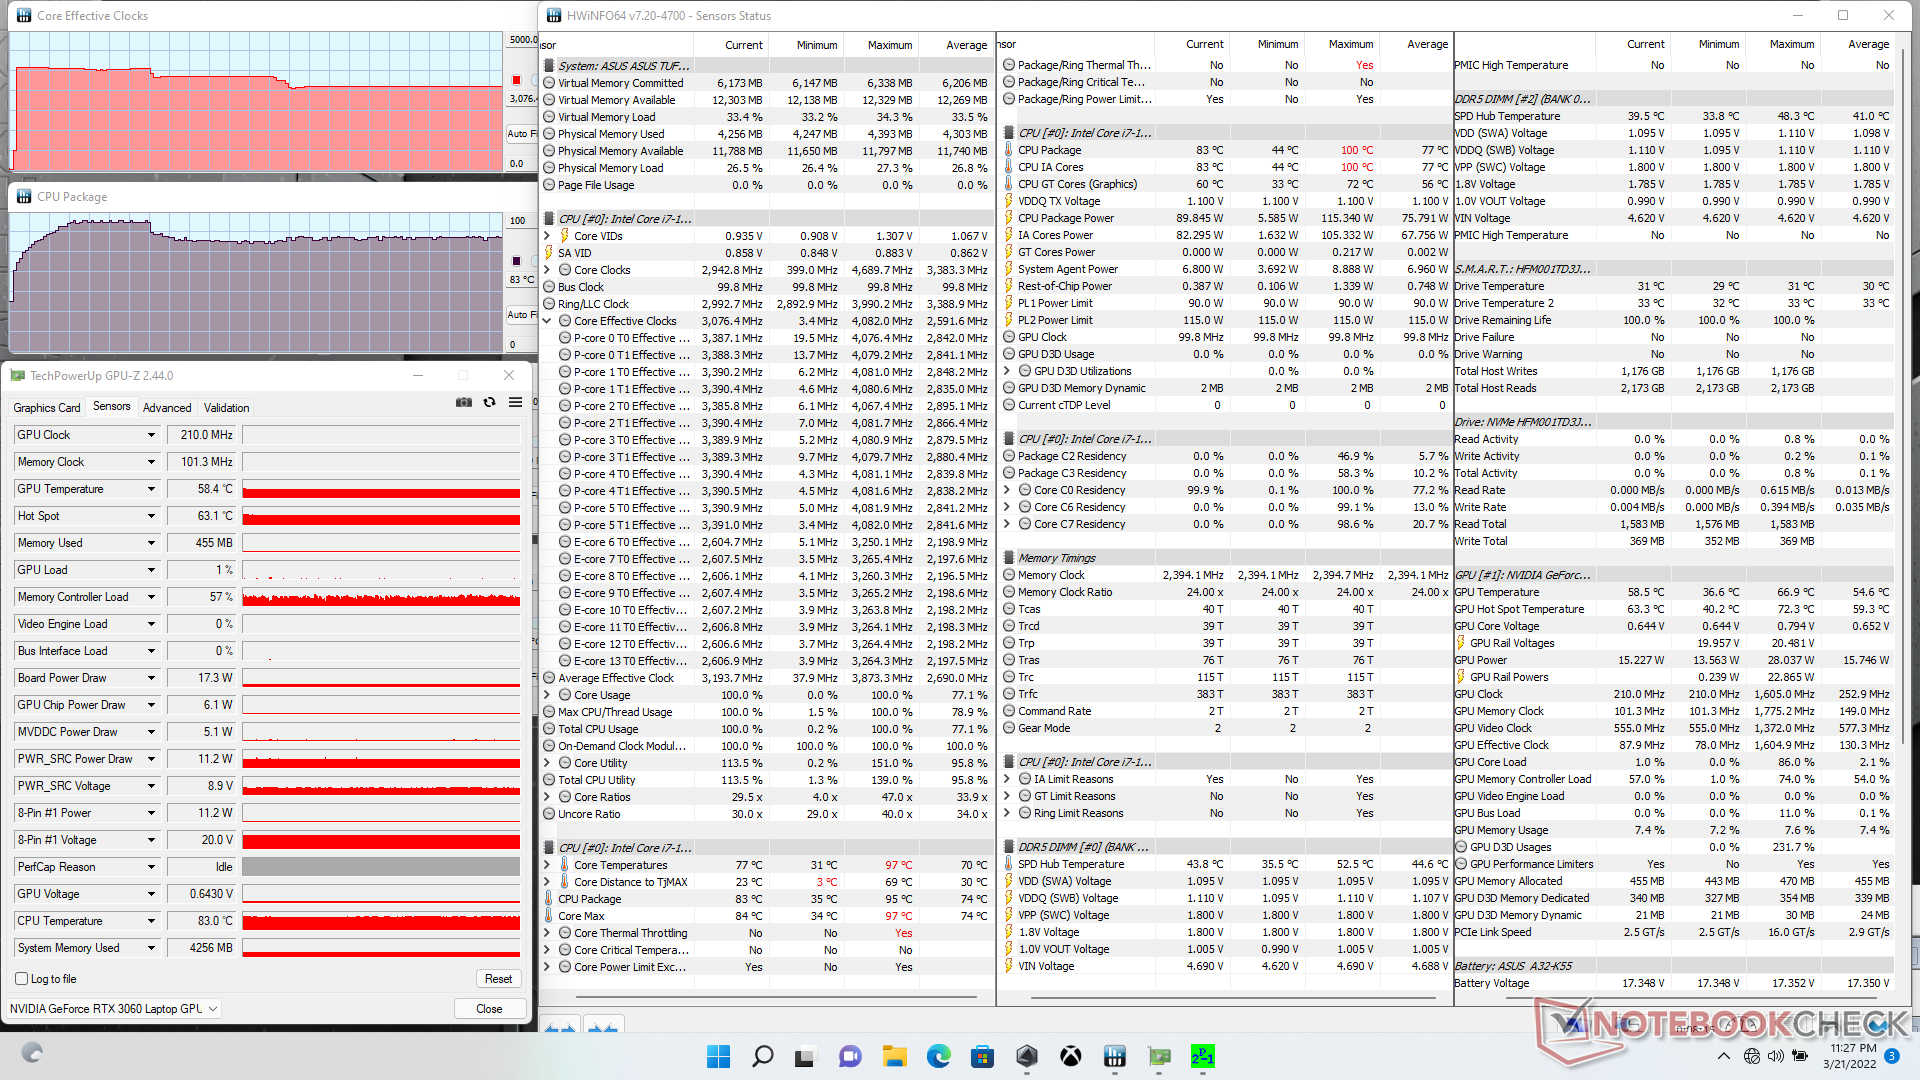
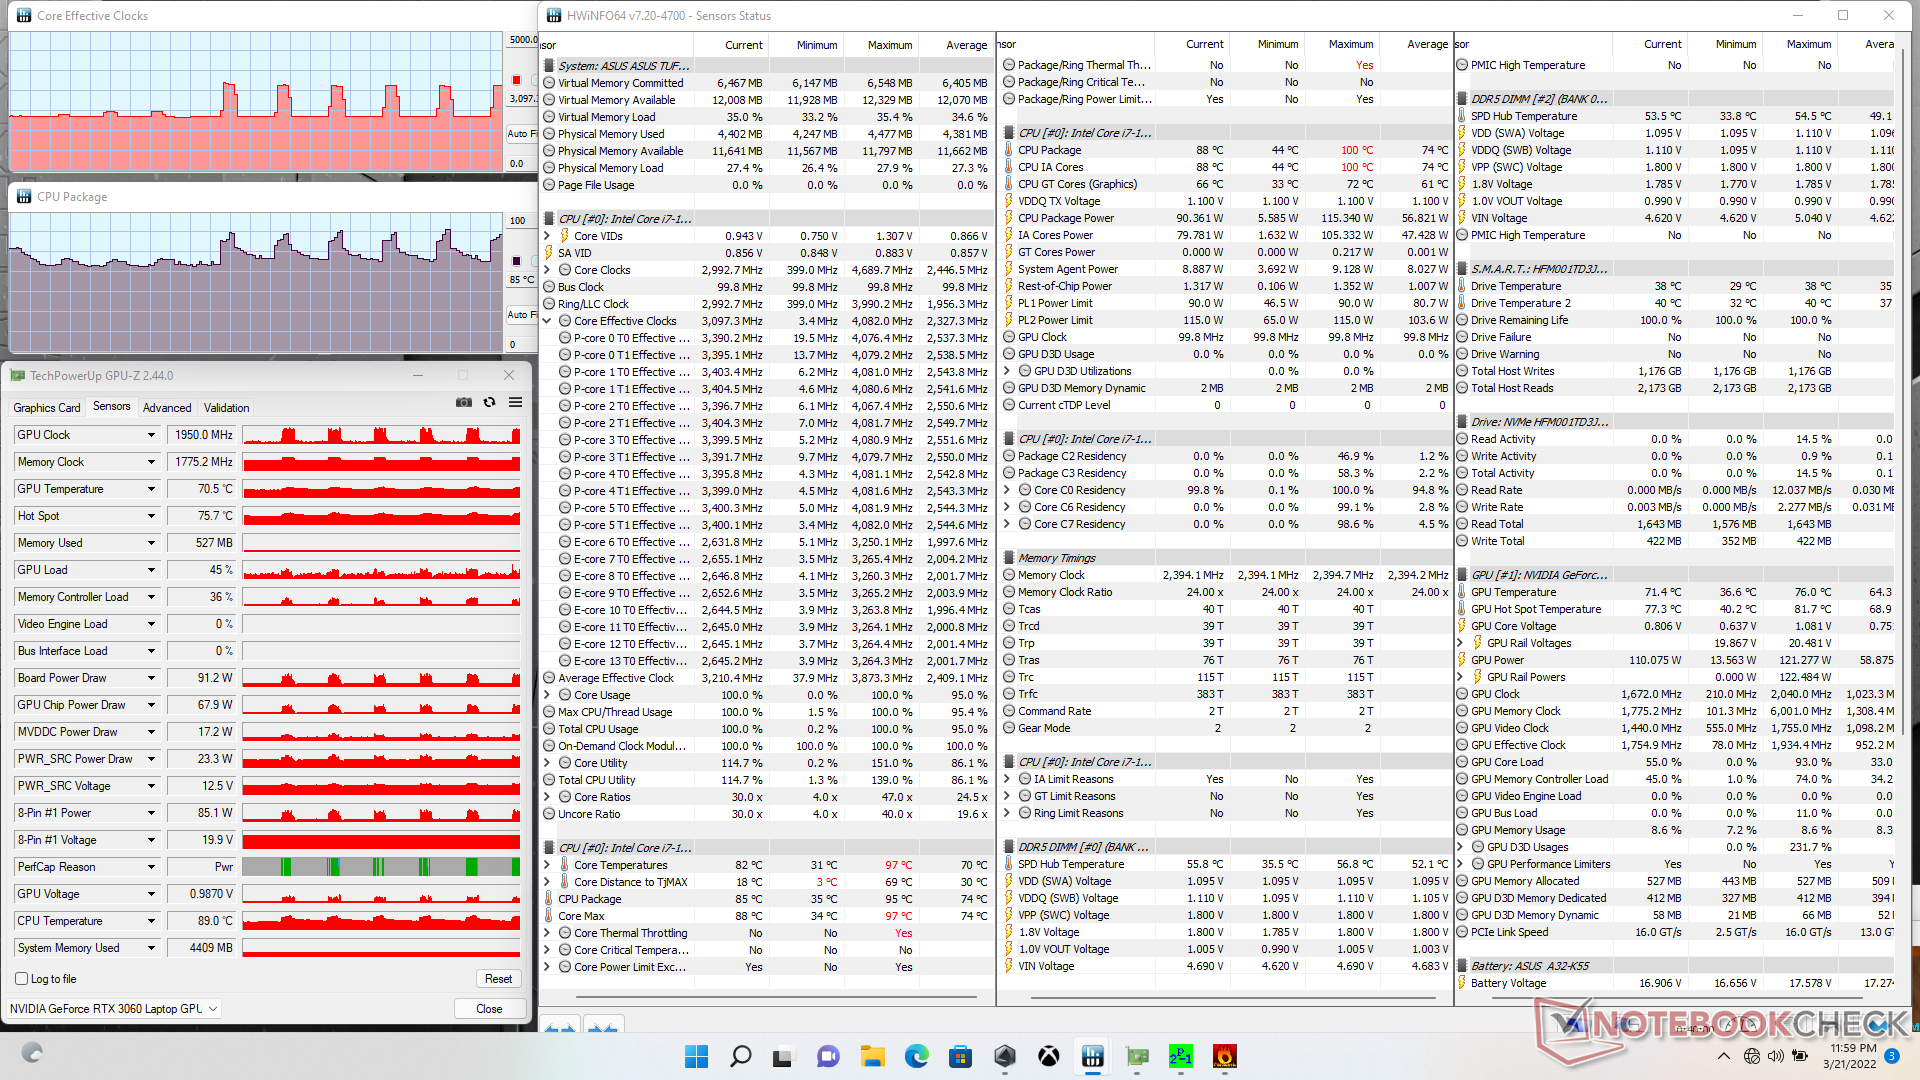
Teste de estresse
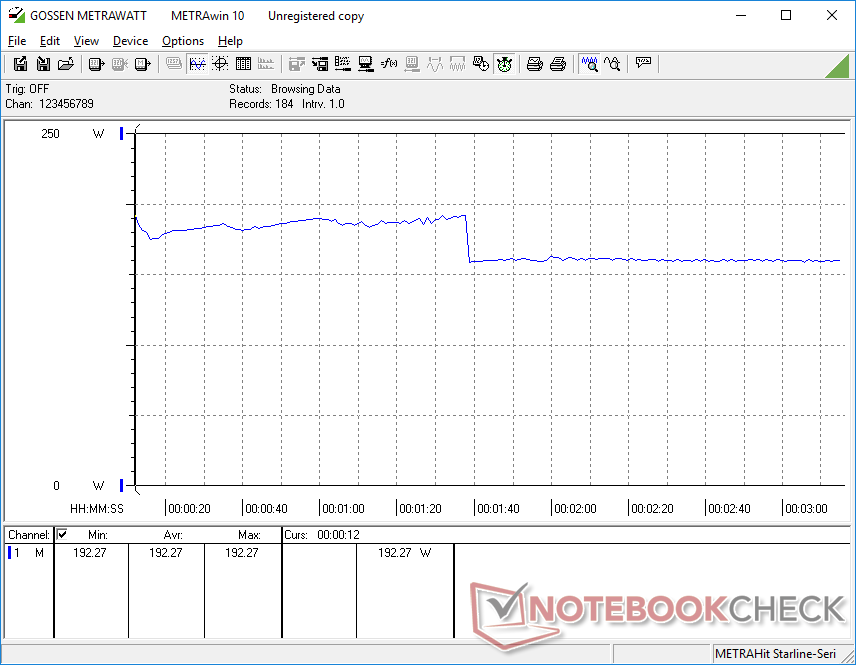
Ao executar Prime95, a CPU aumentaria para 3,8 GHz durante os primeiros 100 segundos e a uma temperatura central de 95 C. As taxas de relógio e a temperatura acabariam caindo e se estabilizando em 3,1 GHz e 83 C, respectivamente. A potência do pacote também cairia de 115 W para 90 W durante este tempo, de acordo com a HWiNFO.
Quando em funcionamento Witcher 3 para representar o estresse típico dos jogos, as temperaturas de CPU e GPU se estabilizariam em 69 C e 77 C, respectivamente, com a GPU em 1927 MHz e um consumo de energia da placa de 133,4 W. Executando este mesmo teste na FX506 veria temperaturas mais quentes de CPU e GPU de 75 C e 81 C, respectivamente, mas uma taxa de clock GPU mais lenta de 1717 MHz e um consumo de energia da placa mais baixa de 90,4 W.
Funcionando com o desempenho dos limites de potência da bateria. Um teste Fire Strike nas baterias retornaria pontuações de Física e Gráficos de 21169 e 15715 pontos, respectivamente, em comparação com 30446 e 22915 pontos quando em rede elétrica.
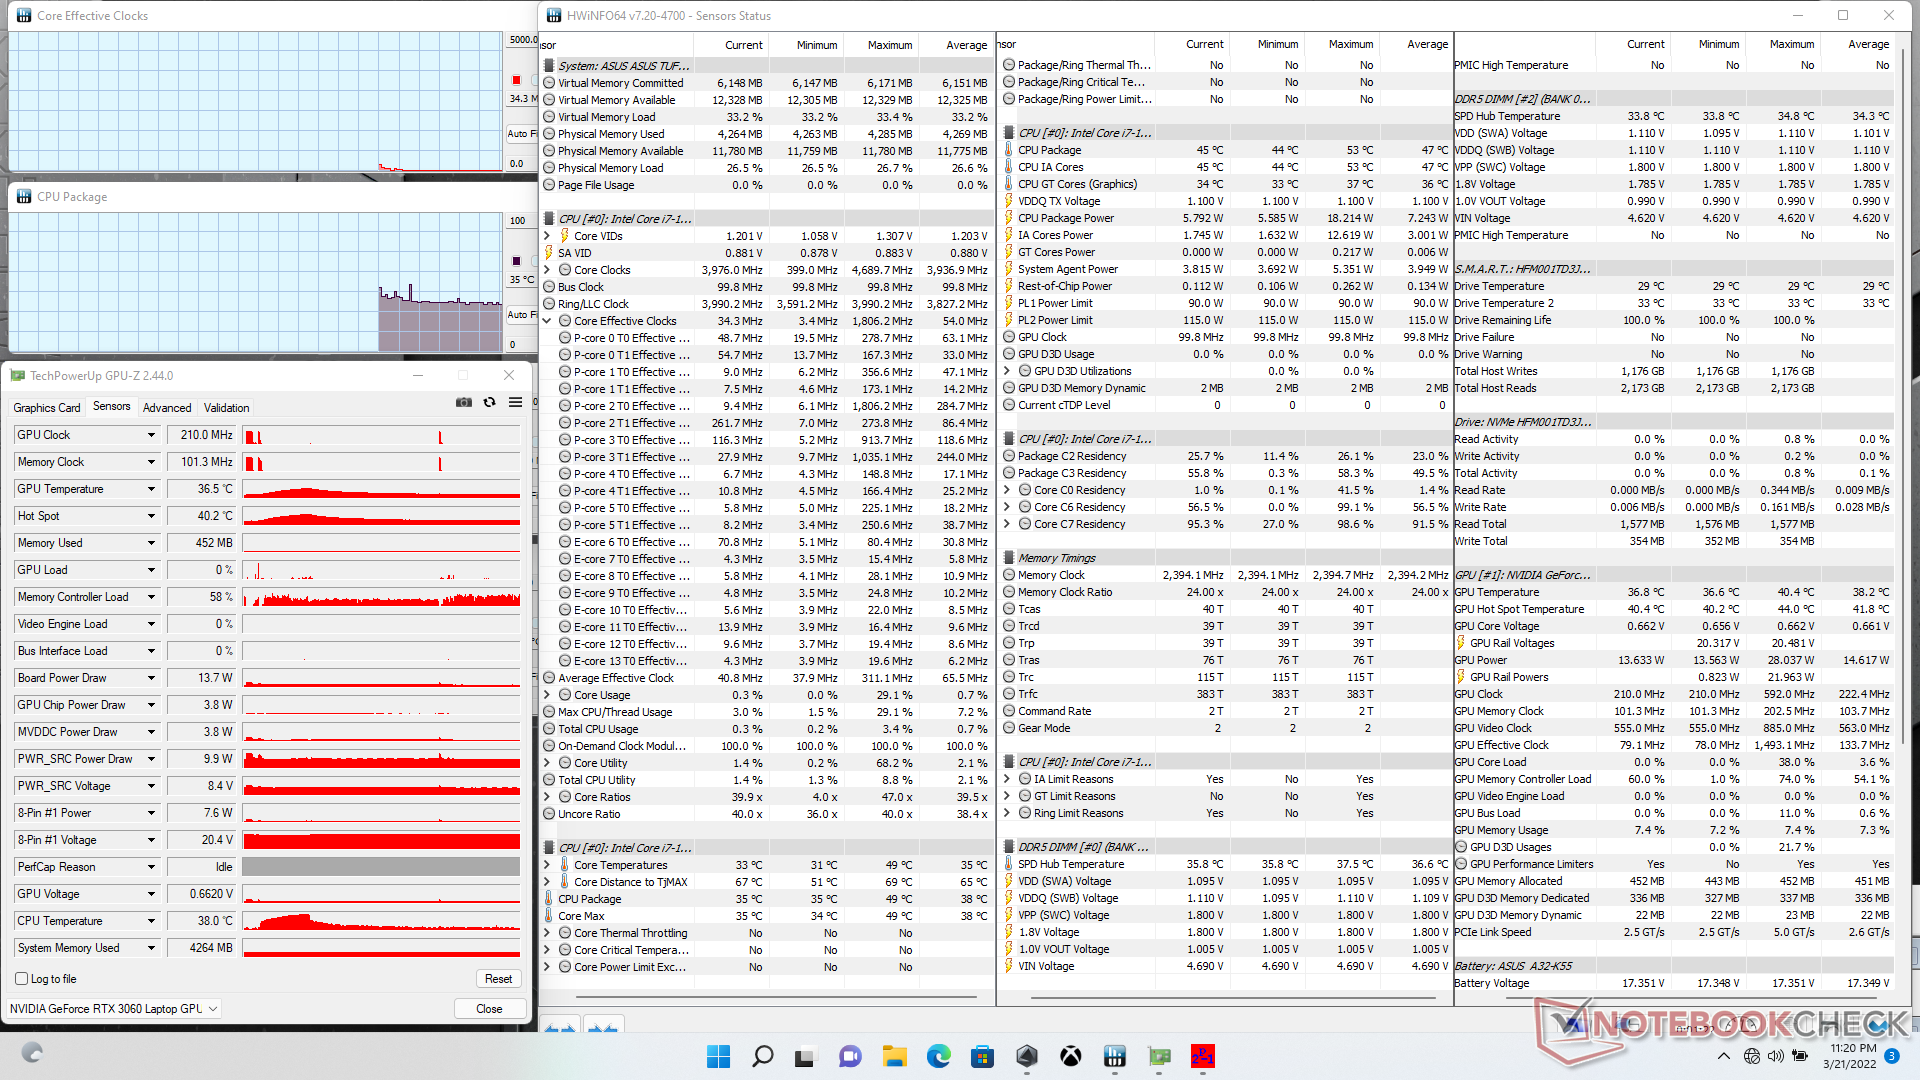
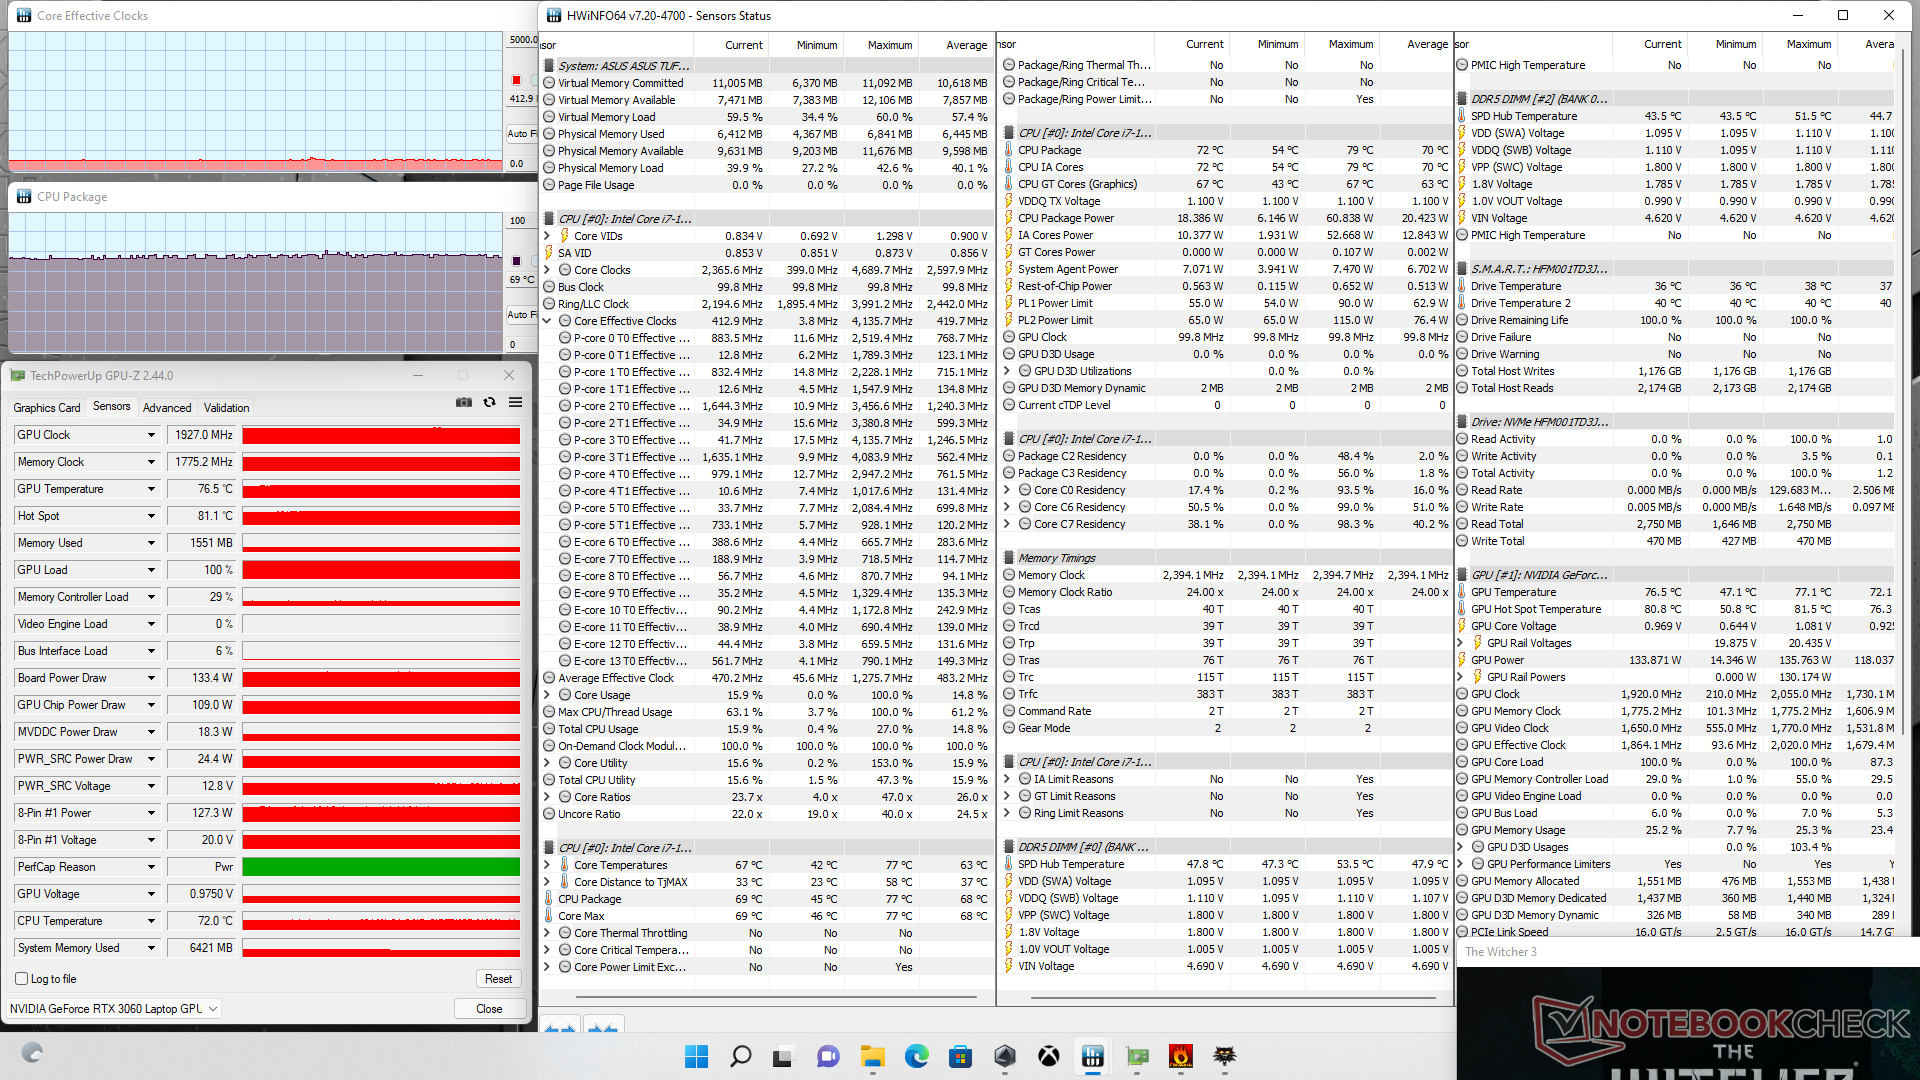
| Relógio CPU (GHz) | Relógio GPU (MHz) | Temperatura média da CPU (°C) | Temperatura média da GPU (°C) | |
| System Idle | -- | -- | 35 | 37 |
| Prime95 Stress | 3.1 | -- | 83 | 58 |
| Prime95 + FurMark Stress | 2.0 - 3.0 | 450 - 2000 | 66 - 89 | 58 - 72 |
| Witcher 3 Stress | 0.412 | 1927 | 69 | 77 |
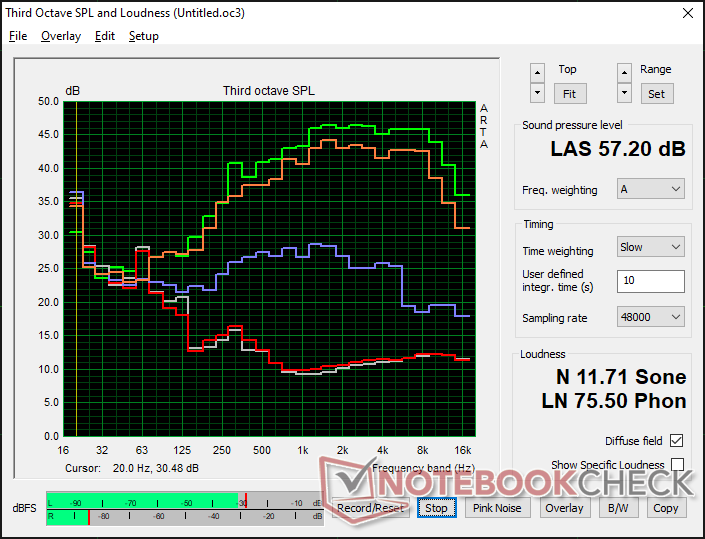
Oradores
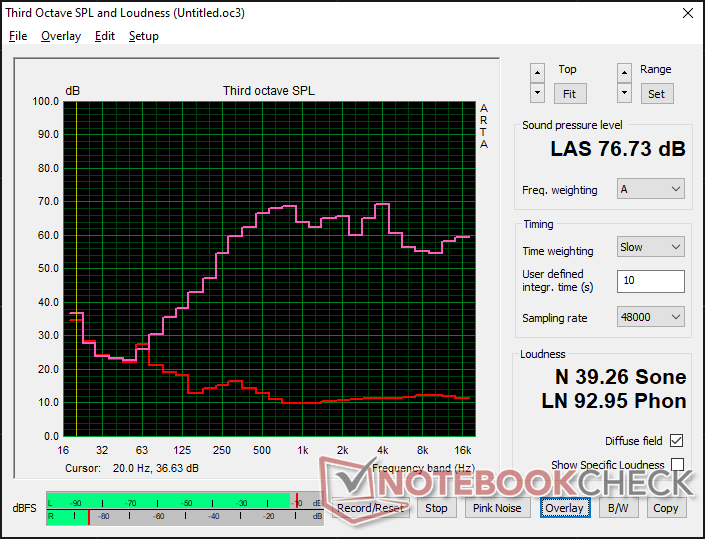
Asus TUF Gaming F15 FX507ZM análise de áudio
(±) | o volume do alto-falante é médio, mas bom (###valor### dB)
Graves 100 - 315Hz
(±) | graves reduzidos - em média 13.7% menor que a mediana
(±) | a linearidade dos graves é média (10.1% delta para a frequência anterior)
Médios 400 - 2.000 Hz
(±) | médios mais altos - em média 5.2% maior que a mediana
(+) | médios são lineares (4.9% delta para frequência anterior)
Altos 2 - 16 kHz
(+) | agudos equilibrados - apenas 4.1% longe da mediana
(±) | a linearidade dos máximos é média (8.6% delta para frequência anterior)
Geral 100 - 16.000 Hz
(±) | a linearidade do som geral é média (15.9% diferença em relação à mediana)
Comparado com a mesma classe
» 38% de todos os dispositivos testados nesta classe foram melhores, 7% semelhantes, 56% piores
» O melhor teve um delta de 6%, a média foi 18%, o pior foi 132%
Comparado com todos os dispositivos testados
» 25% de todos os dispositivos testados foram melhores, 5% semelhantes, 70% piores
» O melhor teve um delta de 4%, a média foi 23%, o pior foi 134%
Apple MacBook Pro 16 2021 M1 Pro análise de áudio
(+) | os alto-falantes podem tocar relativamente alto (###valor### dB)
Graves 100 - 315Hz
(+) | bons graves - apenas 3.8% longe da mediana
(+) | o baixo é linear (5.2% delta para a frequência anterior)
Médios 400 - 2.000 Hz
(+) | médios equilibrados - apenas 1.3% longe da mediana
(+) | médios são lineares (2.1% delta para frequência anterior)
Altos 2 - 16 kHz
(+) | agudos equilibrados - apenas 1.9% longe da mediana
(+) | os máximos são lineares (2.7% delta da frequência anterior)
Geral 100 - 16.000 Hz
(+) | o som geral é linear (4.6% diferença em relação à mediana)
Comparado com a mesma classe
» 0% de todos os dispositivos testados nesta classe foram melhores, 0% semelhantes, 100% piores
» O melhor teve um delta de 5%, a média foi 17%, o pior foi 45%
Comparado com todos os dispositivos testados
» 0% de todos os dispositivos testados foram melhores, 0% semelhantes, 100% piores
» O melhor teve um delta de 4%, a média foi 23%, o pior foi 134%
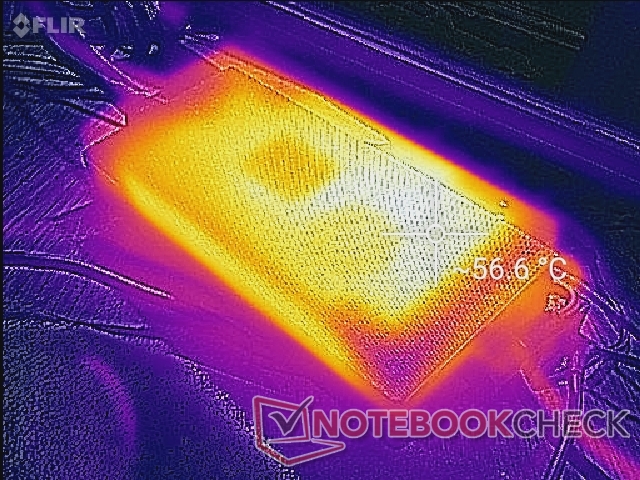
Gerenciamento de energia - Ferragens mais exigentes em toda a diretoria
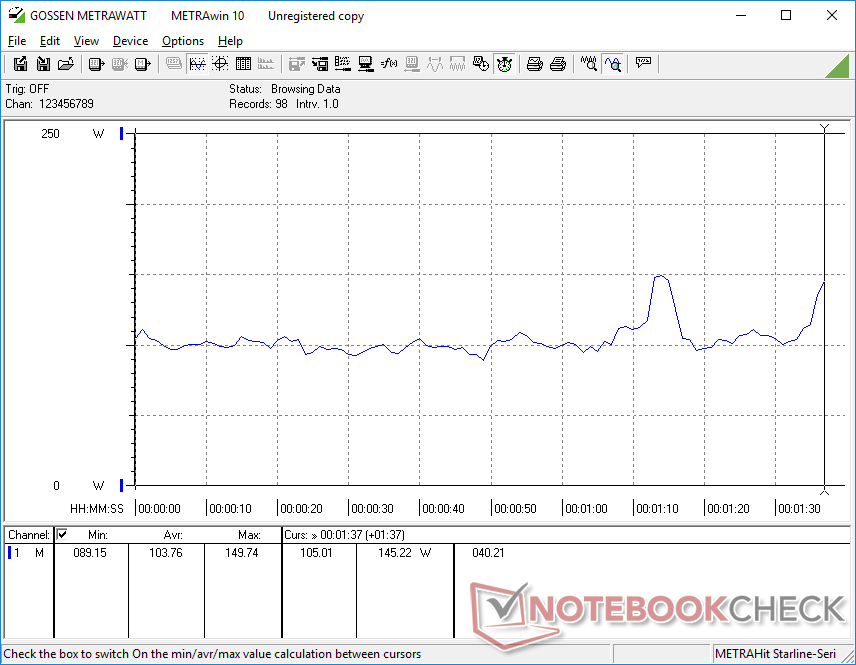
Consumo de energia
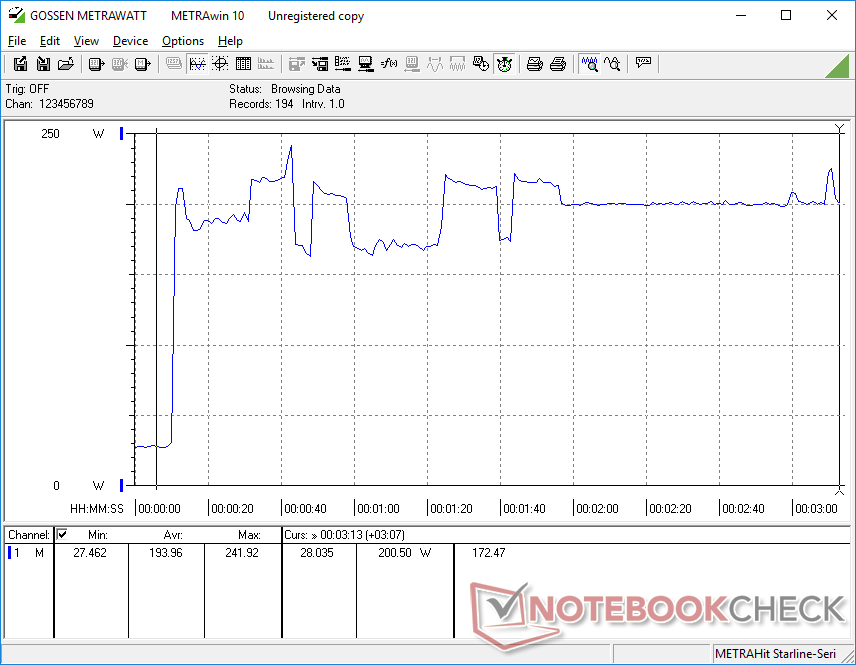
O consumo total é superior ao que foi registrado no modelo do ano anterior. Isto é esperado devido à maior demanda de energia da nova CPU Intel de 12ª geração, a maior RTX 3060 TGP e a maior solução de resfriamento interno da FX507. Rodando Witcher 3 consome cerca de 20% mais energia ano após ano para um aumento de 10% a 20% no desempenho gráfico em relação ao Asus FX506 de 2021
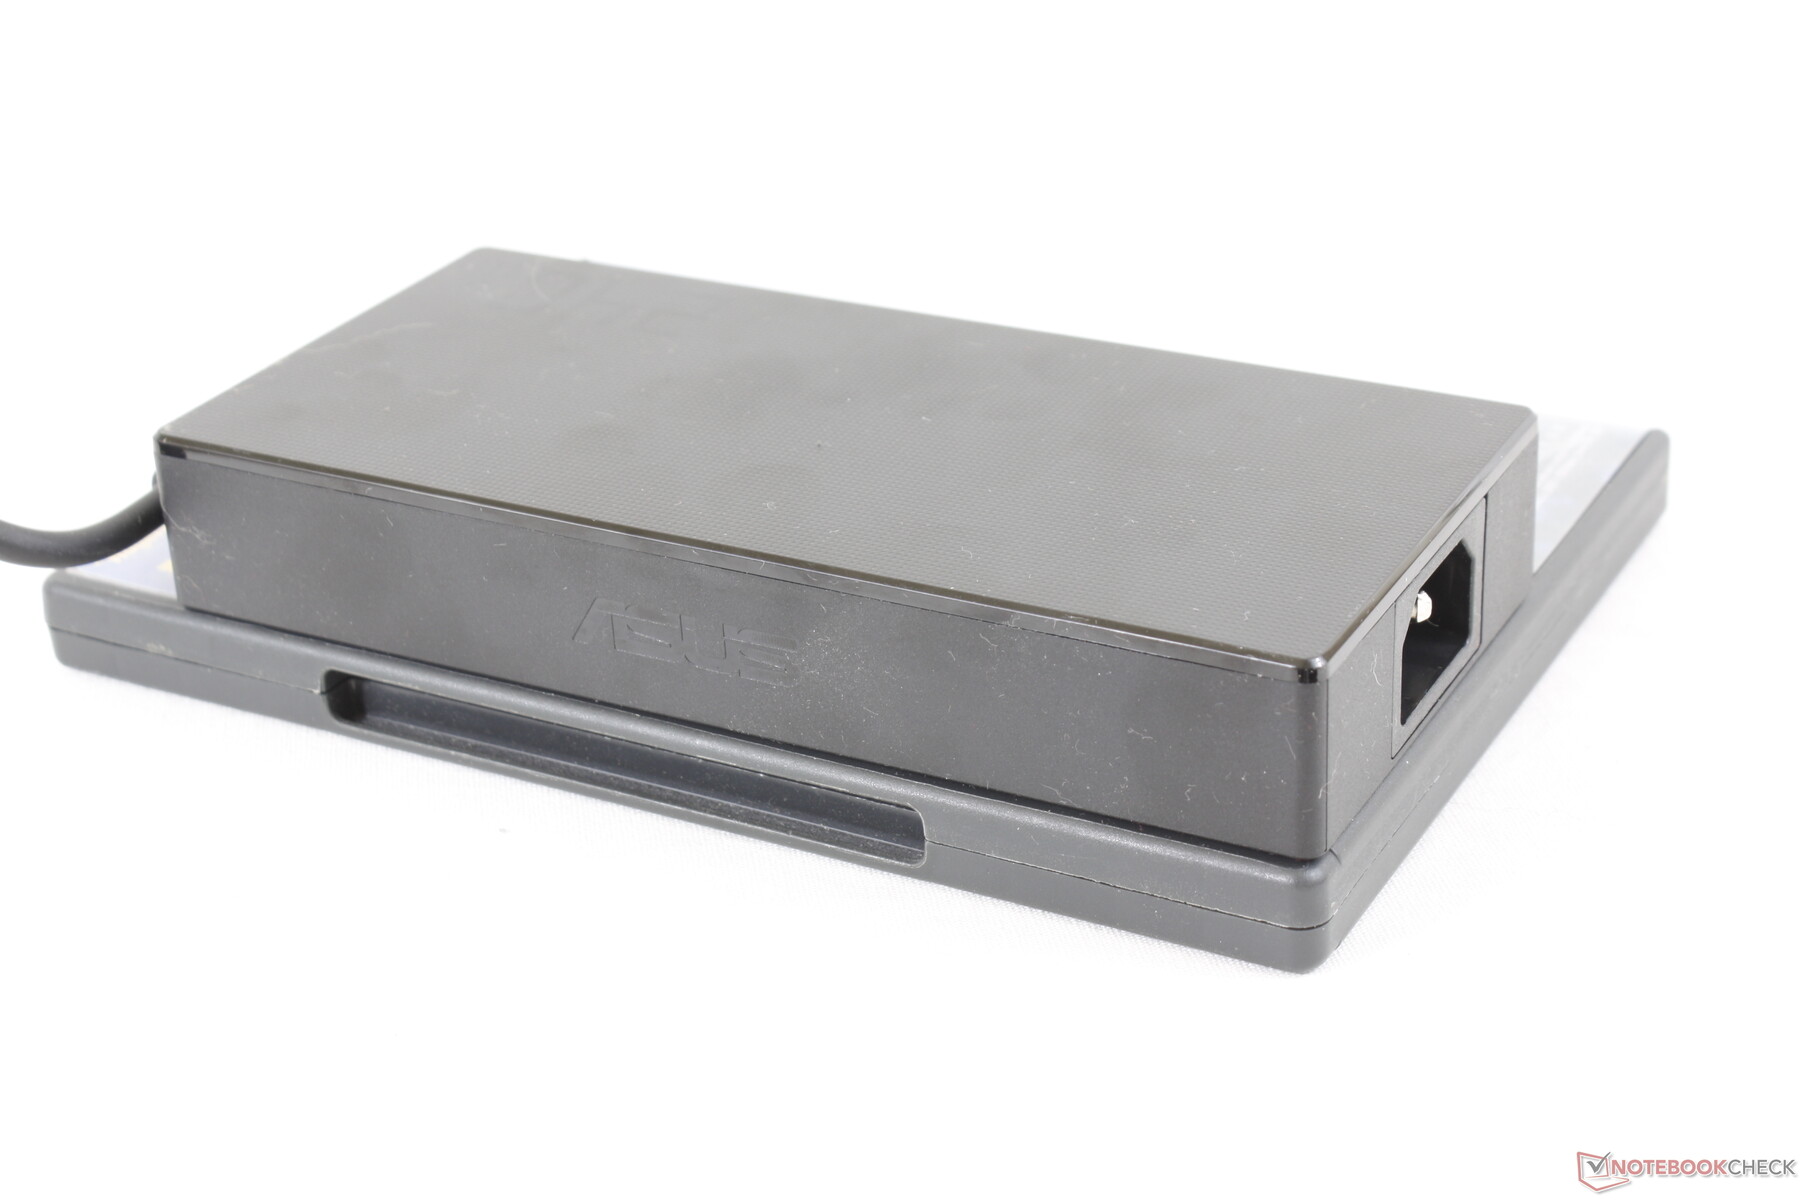
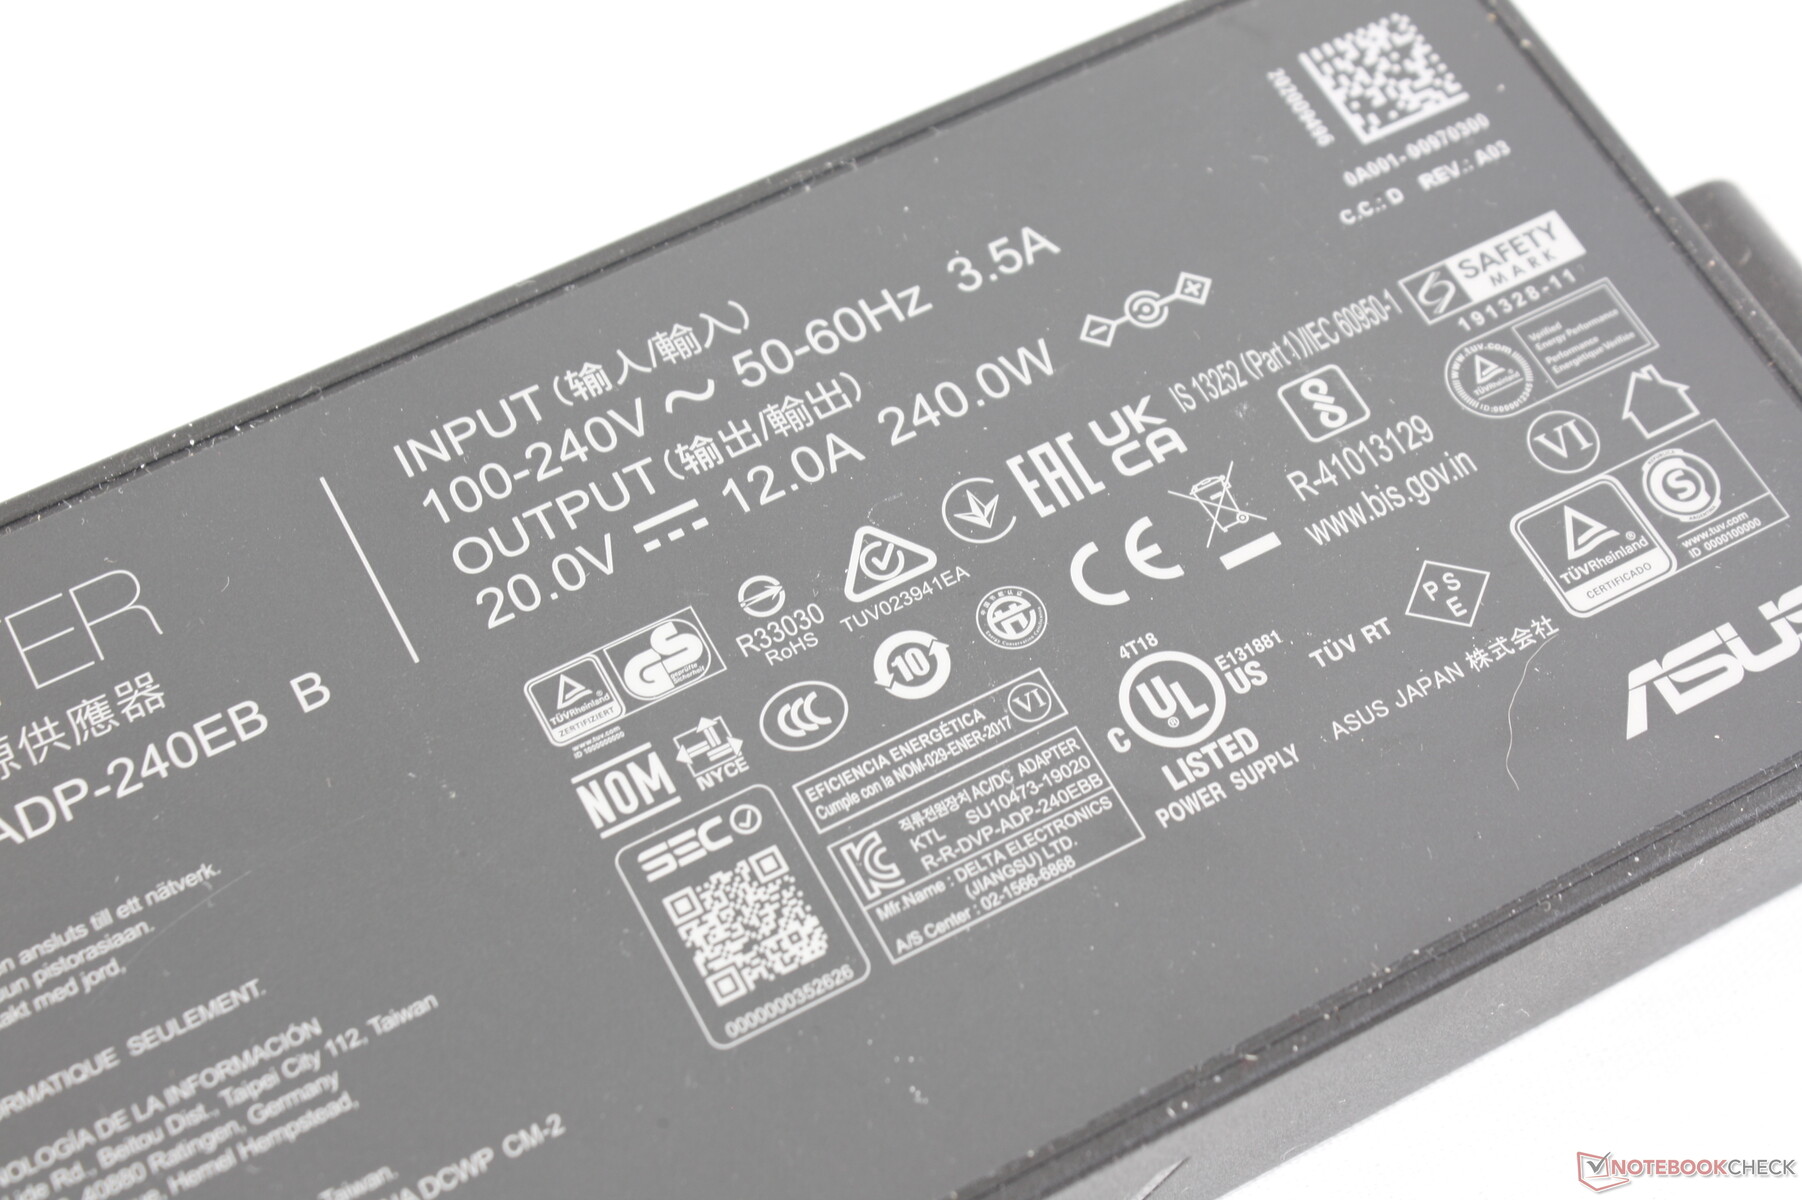
O FX507 é fornecido com um adaptador AC de 240 W de potência superior em comparação com o adaptador AC de 200 W que é fornecido com o FX506 para melhor acomodar os internos mais ávidos de energia. O novo adaptador é posteriormente maior que o adaptador mais antigo (~16,5 x 7,6 x 2,6 cm vs. ~15,1 x 7,2 x 2,3 cm).
| desligado | |
| Ocioso | |
| Carga |
|
Key:
min: | |
| Asus TUF Gaming F15 FX507ZM i7-12700H, GeForce RTX 3060 Laptop GPU, SK Hynix HFM001TD3JX013N, IPS, 1920x1080, 15.6" | Asus TUF Gaming F15 FX506HM i7-11800H, GeForce RTX 3060 Laptop GPU, SK Hynix HFM001TD3JX013N, IPS, 1920x1080, 15.6" | Asus TUF Dash F15 FX516PR i7-11370H, GeForce RTX 3070 Laptop GPU, SK Hynix HFM001TD3JX013N, IPS, 1920x1080, 15.6" | Asus ROG Strix Scar 15 G533QS R9 5900HX, GeForce RTX 3080 Laptop GPU, ADATA Swordfish 2 TB, IPS, 2560x1440, 15.6" | Asus Zephyrus S15 GX502L i7-10875H, GeForce RTX 2070 Super Mobile, WDC PC SN730 SDBPNTY-1T00, IPS, 1920x1080, 15.6" | Asus ZenBook Pro Duo UX582 LR-1BH2 i7-10870H, GeForce RTX 3070 Laptop GPU, Samsung PM981a MZVLB1T0HBLR, OLED + IPS, 3840x2160, 15.6" | |
|---|---|---|---|---|---|---|
| Power Consumption | -2% | 9% | -24% | -12% | -4% | |
| Idle Minimum * (Watt) | 6.3 | 9.5 -51% | 9 -43% | 11.2 -78% | 7 -11% | 9 -43% |
| Idle Average * (Watt) | 9.8 | 12.1 -23% | 11 -12% | 16.4 -67% | 13 -33% | 14 -43% |
| Idle Maximum * (Watt) | 26.5 | 22.5 15% | 16 40% | 29.4 -11% | 25 6% | 15 43% |
| Load Average * (Watt) | 103.8 | 99.5 4% | 107 -3% | 106.2 -2% | 148 -43% | 107.2 -3% |
| Witcher 3 ultra * (Watt) | 189 | 157 17% | 121 36% | 189 -0% | 175 7% | 156 17% |
| Load Maximum * (Watt) | 241.9 | 173.5 28% | 162 33% | 213.6 12% | 232 4% | 235 3% |
* ... menor é melhor
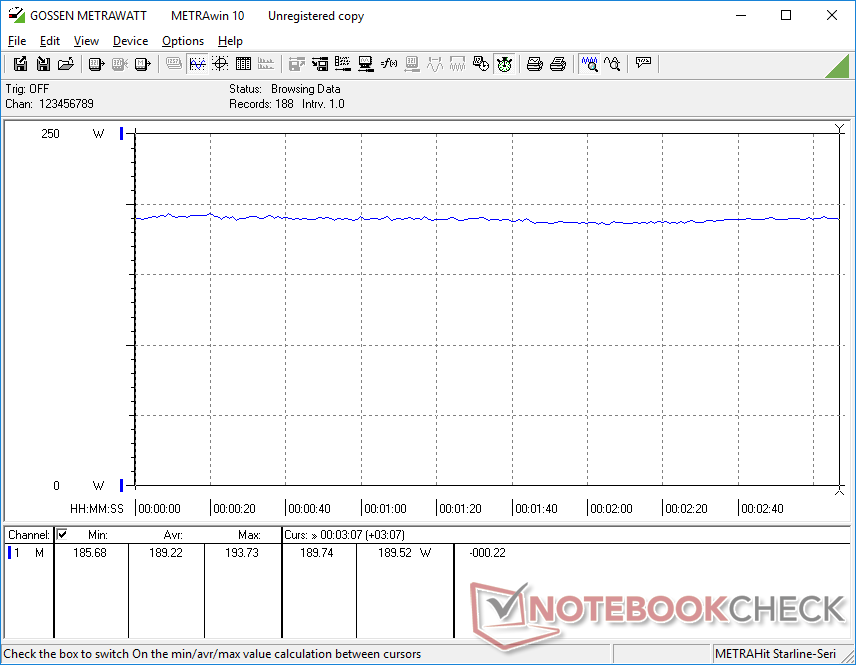
Power Consumption Witcher 3 / Stresstest
Power Consumption external Monitor
Vida útil da bateria - Modelo mais curto que o da última geração
O tempo de funcionamento da WLAN é menor do que o registrado no modelo do ano passado em várias horas, apesar de carregar a mesma bateria de 90 Wh de capacidade entre eles. Testamos isso duas vezes no perfil Balanced power com MSHybrid ativo e obtivemos os mesmos resultados. Os tempos de execução WLAN mais curtos de ano para ano são consistentes com o que observamos entre o 2021 Lâmina Razer 15 e 2022 Lâmina Razer 15.
O carregamento do vazio para a capacidade total com o adaptador AC incluído leva cerca de 90 minutos. Infelizmente, este modelo não suporta carregamento USB-C ao contrário da série Razer Blade ou da série MSI GS.
| Asus TUF Gaming F15 FX507ZM i7-12700H, GeForce RTX 3060 Laptop GPU, 90 Wh | Asus TUF Gaming F15 FX506HM i7-11800H, GeForce RTX 3060 Laptop GPU, 90 Wh | Asus TUF Dash F15 FX516PR i7-11370H, GeForce RTX 3070 Laptop GPU, 76 Wh | Asus ROG Strix Scar 15 G533QS R9 5900HX, GeForce RTX 3080 Laptop GPU, 90 Wh | Asus Zephyrus S15 GX502L i7-10875H, GeForce RTX 2070 Super Mobile, 76 Wh | Asus ZenBook Pro Duo UX582 LR-1BH2 i7-10870H, GeForce RTX 3070 Laptop GPU, 92 Wh | |
|---|---|---|---|---|---|---|
| Duração da bateria | 39% | 46% | 16% | -15% | 36% | |
| Reader / Idle (h) | 15.8 | 11 -30% | 16 1% | 11.1 -30% | 8.7 -45% | |
| WiFi v1.3 (h) | 4.8 | 7.9 65% | 9.1 90% | 7.3 52% | 3 -37% | 7.4 54% |
| Load (h) | 1.1 | 2 82% | 1.4 27% | 1.5 36% | 1.3 18% | |
| H.264 (h) | 8.2 |
Pro
Contra
Veredicto - 140 W GeForce RTX 3060 Gráficos
Além de todas as atualizações de chassis, a FX507 é mais notável por sua meta TGP muito mais alta de 140 W em comparação a apenas 95 W na FX506. Os fabricantes de PCs em todos os lugares estão usando as mesmas GeForce GPUs este ano, uma vez que a Nvidia ainda não lançou o sucessor da série móvel RTX 3000. Assim, para oferecer melhor desempenho gráfico a partir da mesma GPU, a FX507 deve consumir mais energia do que a FX506. O resultado é um GeForce RTX 3060 laptop é mais rápido do que a maioria dos outros laptops atualmente disponíveis equipados com a mesma GPU.
Para aliviar algumas das conseqüências de um sistema mais ávido de energia, o Asus atualizou a solução de resfriamento para manter a temperatura e o ruído dos ventiladores sob controle. A FX507 posteriormente não é significativamente mais quente ou mais alta do que sua antecessora, apesar de seu peso geral mais leve.
Os processadores mais exigentes da FX507 tiveram impacto direto na vida útil da bateria e no tamanho do adaptador AC. Não espere que o tempo de funcionamento seja maior do que na FX506 na maioria das condições e esteja preparado para transportar um adaptador CA ainda maior do que antes. É lamentável que o sistema não possa ser recarregado através de adaptadores USB-C de terceiros.
As mudanças no teclado e clickpad são uma bolsa mista, considerando que a fonte cinza escuro contrasta mal com as teclas escuras. As ações de arrastar e soltar são mais fáceis no modelo de última geração por causa de seus botões dedicados do mouse.
Preço e Disponibilidade
O Asus TUF Gaming F15 FX507ZM como revisado está disponível em agora na Amazon por $1750 USD.
Asus TUF Gaming F15 FX507ZM
- 03/26/2022 v7 (old)
Allen Ngo
Price comparison

