




Por que pode valer a pena deixar de lado o XPS 13 Wildcat em favor do próximo modelo Panther Lake
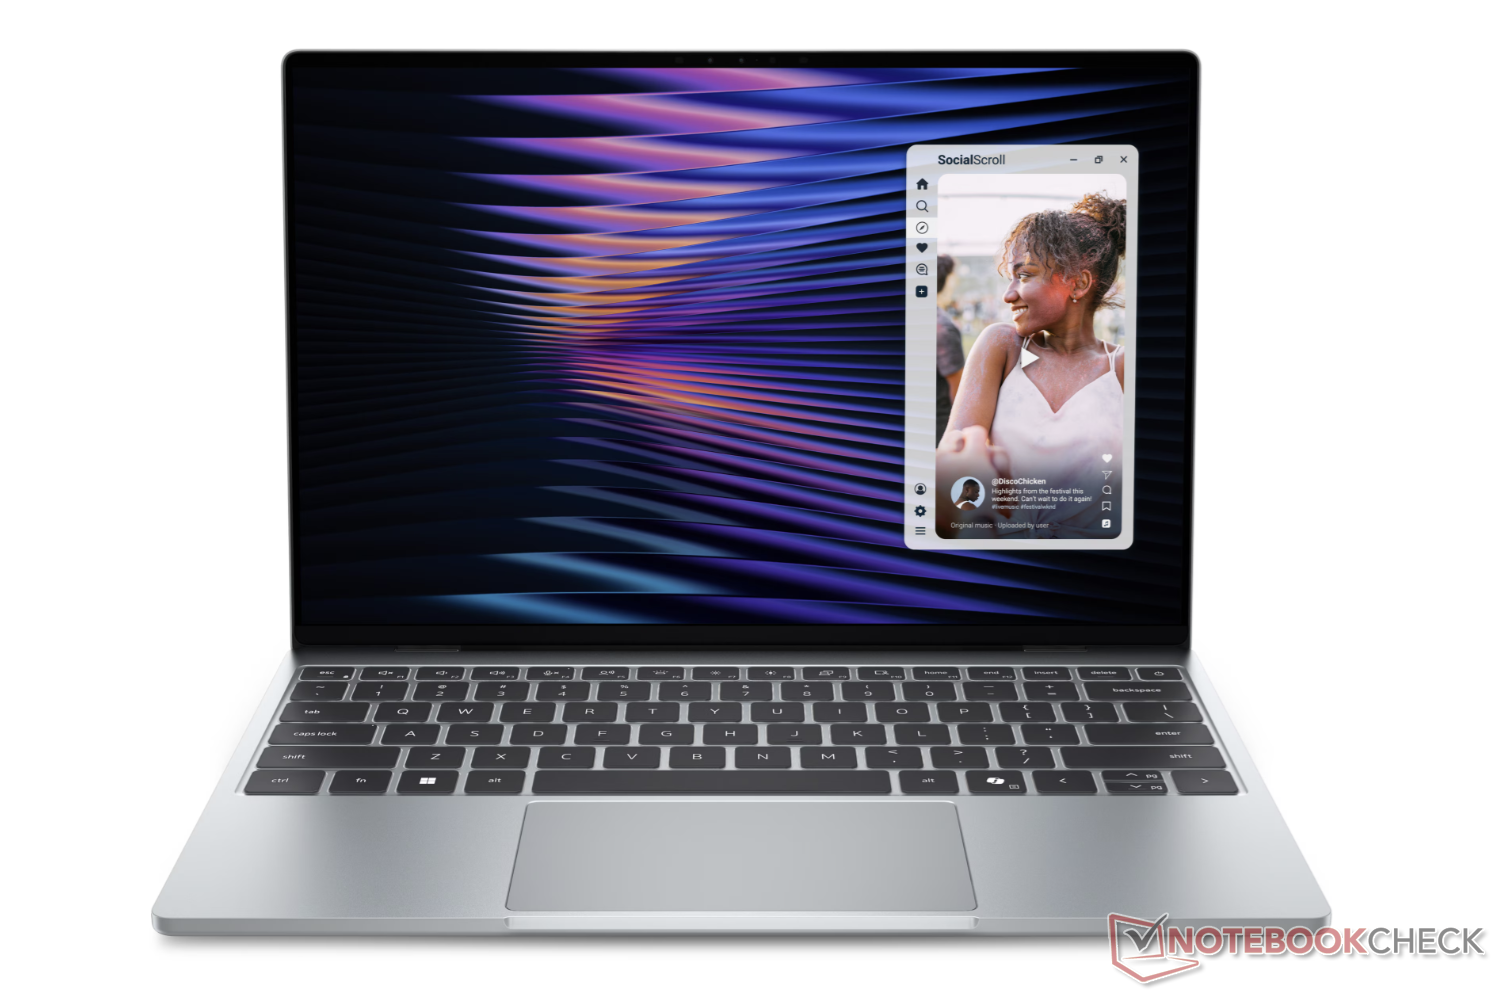
O Dell XPS 13 com Intel Wildcat Lake está atualmente à venda a partir de US$ 700, ou até mesmo US$ 600 para quem se qualifica para o desconto educacional. Conforme detalhado em nossa análise do modelo, o sistema é um dos mais impressionantes que já vimos em termos de design e qualidade de tela para o preço, mas o desempenho geral da CPU pode ficar um pouco aquém para a maioria das tarefas além da navegação na internet e do processamento de texto. No entanto, uma solução pode estar a caminho.
Embora todas as configurações, no momento, sejam fornecidas com o mesmo processador Wildcat Lake Core 5 320, a Dell planeja lançar modelos com o Panther Lake Core Ultra 7 355, muito mais rápido, nos próximos meses. Essa última CPU é significativamente mais rápida do que a opção Wildcat — quase o dobro — em termos de desempenho bruto da CPU e da GPU, com base em nossos testes com o XPS 14. Além disso, por ser um processador da classe Core Ultra, a CPU mais rápida também oferece suporte nativo ao Copilot+ para IA local aprimorada. Essa potência adicional torna o futuro XPS 13 com Panther Lake muito mais versátil para cenários que vão além da navegação na web, como a edição ocasional de fotos ou multitarefas intensas.
É claro que o XPS 13 com Panther Lake será, sem dúvida, lançado a preços mais elevados do que o XPS 13 com Wildcat Lake. Este último é vendido atualmente por US$ 700 e US$ 900 para as versões de 8 GB e 16 GB, respectivamente. Com base nos padrões habituais de modelos da Dell, é improvável que o XPS 13 Panther Lake seja oferecido com 8 GB de RAM, o que significa que deve-se esperar um preço inicial de pelo menos US$ 1.000 ou US$ 1.100. Mesmo assim, o processador muito mais potente pode justificar os preços mais elevados, especialmente quando se leva em conta que a maioria dos outros notebooks com a CPU Core Ultra 7 355 geralmente custa a partir de US$ 1.500 ou mais.
Cinebench R23: Multi Core | Single Core
Cinebench R20: CPU (Multi Core) | CPU (Single Core)
Cinebench R15: CPU Multi 64Bit | CPU Single 64Bit
Blender: v2.79 BMW27 CPU
7-Zip 18.03: 7z b 4 | 7z b 4 -mmt1
Geekbench 6.7: Multi-Core | Single-Core
Geekbench 5.5: Multi-Core | Single-Core
HWBOT x265 Benchmark v2.2: 4k Preset
LibreOffice : 20 Documents To PDF
R Benchmark 2.5: Overall mean
| CPU Performance rating | |
| Dell XPS 14 Core Ultra 7 355 | |
| Média Intel Core 5 320 | |
| Dell XPS 13 DX13260 | |
| Cinebench R23 / Multi Core | |
| Dell XPS 14 Core Ultra 7 355 | |
| Dell XPS 13 DX13260 | |
| Média Intel Core 5 320 (n=1) | |
| Cinebench R23 / Single Core | |
| Dell XPS 14 Core Ultra 7 355 | |
| Dell XPS 13 DX13260 | |
| Média Intel Core 5 320 (n=1) | |
| Cinebench R20 / CPU (Multi Core) | |
| Dell XPS 14 Core Ultra 7 355 | |
| Dell XPS 13 DX13260 | |
| Média Intel Core 5 320 (n=1) | |
| Cinebench R20 / CPU (Single Core) | |
| Dell XPS 14 Core Ultra 7 355 | |
| Dell XPS 13 DX13260 | |
| Média Intel Core 5 320 (n=1) | |
| Cinebench R15 / CPU Multi 64Bit | |
| Dell XPS 14 Core Ultra 7 355 | |
| Dell XPS 13 DX13260 | |
| Média Intel Core 5 320 (n=1) | |
| Cinebench R15 / CPU Single 64Bit | |
| Dell XPS 14 Core Ultra 7 355 | |
| Dell XPS 13 DX13260 | |
| Média Intel Core 5 320 (n=1) | |
| Blender / v2.79 BMW27 CPU | |
| Dell XPS 13 DX13260 | |
| Média Intel Core 5 320 (n=1) | |
| Dell XPS 14 Core Ultra 7 355 | |
| 7-Zip 18.03 / 7z b 4 | |
| Dell XPS 14 Core Ultra 7 355 | |
| Dell XPS 13 DX13260 | |
| Média Intel Core 5 320 (n=1) | |
| 7-Zip 18.03 / 7z b 4 -mmt1 | |
| Dell XPS 14 Core Ultra 7 355 | |
| Dell XPS 13 DX13260 | |
| Média Intel Core 5 320 (n=1) | |
| Geekbench 6.7 / Multi-Core | |
| Dell XPS 14 Core Ultra 7 355 | |
| Média Intel Core 5 320 (7888 - 8122, n=3) | |
| Dell XPS 13 DX13260 | |
| Geekbench 6.7 / Single-Core | |
| Dell XPS 14 Core Ultra 7 355 | |
| Média Intel Core 5 320 (2564 - 2600, n=3) | |
| Dell XPS 13 DX13260 | |
| Geekbench 5.5 / Multi-Core | |
| Dell XPS 14 Core Ultra 7 355 | |
| Dell XPS 13 DX13260 | |
| Média Intel Core 5 320 (n=1) | |
| Geekbench 5.5 / Single-Core | |
| Dell XPS 14 Core Ultra 7 355 | |
| Dell XPS 13 DX13260 | |
| Média Intel Core 5 320 (n=1) | |
| HWBOT x265 Benchmark v2.2 / 4k Preset | |
| Dell XPS 14 Core Ultra 7 355 | |
| Dell XPS 13 DX13260 | |
| Média Intel Core 5 320 (n=1) | |
| LibreOffice / 20 Documents To PDF | |
| Dell XPS 13 DX13260 | |
| Média Intel Core 5 320 (n=1) | |
| Dell XPS 14 Core Ultra 7 355 | |
| R Benchmark 2.5 / Overall mean | |
| Dell XPS 13 DX13260 | |
| Média Intel Core 5 320 (n=1) | |
| Dell XPS 14 Core Ultra 7 355 | |
* ... menor é melhor
| 3DMark Performance rating - Percent | |
| Dell XPS 14 Core Ultra 7 355 | |
| Média Intel Graphics 2 Xe3 Wildcat Lake iGPU | |
| Dell XPS 13 DX13260 | |
| 3DMark 11 - 1280x720 Performance GPU | |
| Dell XPS 14 Core Ultra 7 355 | |
| Dell XPS 13 DX13260 | |
| Média Intel Graphics 2 Xe3 Wildcat Lake iGPU (3749 - 3822, n=2) | |
| 3DMark | |
| 1920x1080 Fire Strike Graphics | |
| Dell XPS 14 Core Ultra 7 355 | |
| Média Intel Graphics 2 Xe3 Wildcat Lake iGPU (3485 - 3642, n=2) | |
| Dell XPS 13 DX13260 | |
| 2560x1440 Time Spy Graphics | |
| Dell XPS 14 Core Ultra 7 355 | |
| Média Intel Graphics 2 Xe3 Wildcat Lake iGPU (1343 - 1401, n=2) | |
| Dell XPS 13 DX13260 | |
| 2560x1440 Time Spy Score | |
| Dell XPS 14 Core Ultra 7 355 | |
| Média Intel Graphics 2 Xe3 Wildcat Lake iGPU (1513 - 1576, n=2) | |
| Dell XPS 13 DX13260 | |
 Add as a preferred source on Google


