

Notebookcheck Logo
Teaser

Análise do Dell XPS 13 Wildcat Lake: redefinindo a categoria de computadores Windows de baixo custo

Luxo por um preço acessível.

O XPS 13 custa agora uma fração do preço, a fim de atrair usuários com orçamentos mais apertados. Será que os inevitáveis cortes de custos mancham a reputação da marca XPS ou este é o novo laptop abaixo de US$ 1.000 a ser batido?
Allen Ngo, 👁 Allen Ngo (traduzido por DeepL / Ninh Duy) Publicado 🇺🇸 🇳🇱 ...
Laptop / Notebook XPS Wildcat Lake Intel

Veredicto — Aparência sofisticada sem o preço de luxo

A escolha de um laptop Windows de baixo custo muitas vezes implica em concessões significativas, incluindo designs pouco atraentes e telas de qualidade inferior. O novo XPS 13 resolve diretamente essas preocupações, tornando-se facilmente um dos laptops Windows de 13 polegadas mais elegantes na categoria abaixo de US$ 1.000. O modelo transmite uma sensação e uma aparência mais sofisticadas do que realmente é, superando com facilidade rivais diretos como o HP Pavilion ou o Lenovo IdeaPad 3 ou 5, cujos designs podem parecer uma consideração secundária, com o objetivo de valorizar suas alternativas mais atraentes e caras. A tela do Dell é realmente surpreendente, já que você não encontrará uma tela sensível ao toque de 2,5K com gama de cores P3 completa dessa qualidade em nenhum outro laptop por menos de US$ 700.

Pode-se argumentar que as duas maiores limitações do novo XPS 13 dizem respeito ao desempenho e à rigidez do chassi. O processador Core 5 320 de baixo consumo de energia e os limitados 8 GB de RAM apresentam dificuldades ao executar a maioria dos aplicativos que não sejam navegadores, processadores de texto ou planilhas. Recomendamos considerar a configuração de 16 GB para uma autonomia maior, o que, felizmente, ainda mantém o modelo abaixo de US$ 1.000. O novo design, embora ainda seja mais leve e melhor do que a maioria dos outros PCs com Windows nessa faixa de preço, parece mais frágil do que o design tradicionalmente robusto do antigo XPS 13. Mesmo assim, o XPS 13 nunca pareceu tão atraente para as necessidades básicas de estudantes e de multimídia.

Pro

+ leve e atraente, especialmente pelo preço;
+ excelente tela sensível ao toque de 120 Hz com cores P3;
+ padrões Wi-Fi 7 e Bluetooth 6;
+ bateria de longa duração; baixo consumo de energia;
+ preço acessível, bem abaixo de US$ 1.000

Contra

- 8 GB de RAM de canal único, não atualizável, limitam a versatilidade
- o chassi é mais frágil do que os modelos anteriores do XPS 13
- tempos de resposta preto-branco relativamente lentos
- desempenho gráfico muito limitado
- a tecla de espaço pode parecer esponjosa

Preço e disponibilidade

A Dell está atualmente comercializando o XPS 13, conforme configurado nesta análise, por apenas US$ 700.

Amazon Logo
$1,399.99
Dell XPS 14 Premium Laptop DA14250-14.5-inch Touch 3.2K OLED 48-120Hz Display, Intel Core Ultra 7 255H, Intel Arc Graphics, 32GB Memory, 1TB SSD, Backlit English Keyboard with Fingerprint Reader

Ao contrário do XPS 14 e do XPS 16, o XPS 13 2026 foi totalmente redesenhado, apresentando um preço inicial significativamente mais baixo: apenas US$ 699 ou até US$ 599 com descontos para o setor educacional. Essa mudança é especialmente notável, pois a série XPS sempre abrigou modelos prosumer mais caros, frequentemente vendidos por 2x ou 3x mais.

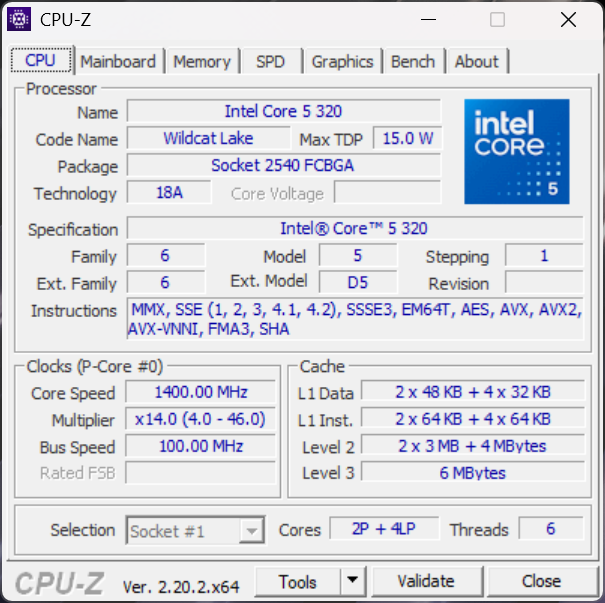
Nossa unidade de teste é a configuração mais básica, com o processador Intel Wildcat Core 5 320 e 8 GB de RAM soldada. Duplicar a memória RAM aumenta o preço em US$ 200, mas todas as unidades disponíveis no momento vêm com memória de canal único e a mesma tela sensível ao toque IPS de 120 Hz com resolução de 2560 x 1600. Espera-se que a opção mais rápida, o Core Ultra 7 355, esteja disponível em configurações futuras.

O Intel Wildcat XPS 13 foi projetado para ser a alternativa do Windows ao popular MacBook Neo. Outros concorrentes incluem modelos voltados para o público com orçamento limitado, como a série Lenovo IdeaPad 3, a série HP Pavilion e outros notebooks econômicos vendidos por menos de US$ 1.000.

Mais análises da Dell:

Especificações

Dell XPS 13 DX13260
Processador
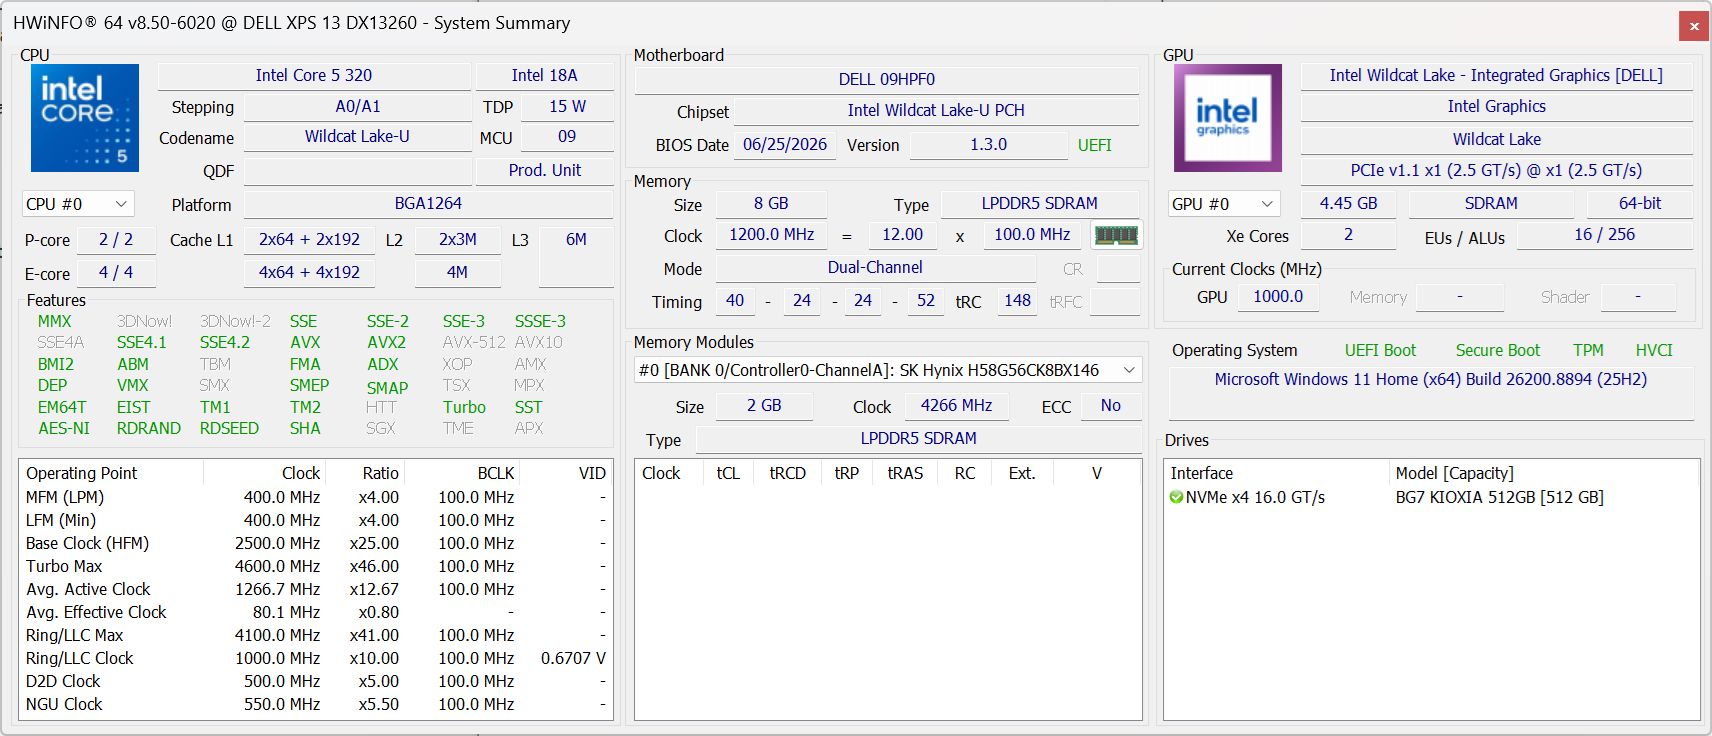
Intel Core 5 320 6c/6t, 2 x 4.6 GHz Intel Cougar Cove P-Core, 4 x 3.4 GHz Intel Darkmont LP E-Core, 37 W PL2 / Short Burst, 18 W PL1 / Sustained, Wildcat Lake
Placa gráfica
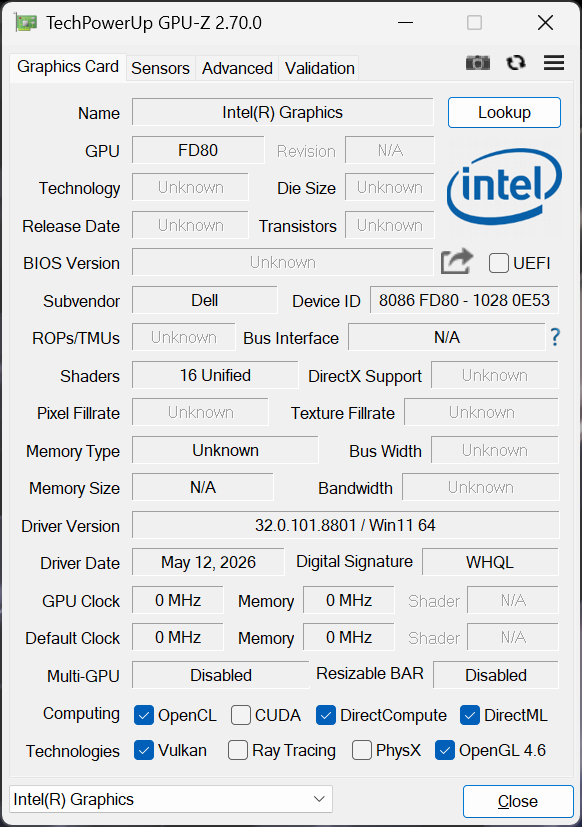
Intel Graphics 2 Xe3 Wildcat Lake iGPU, Análises do: 2500 MHz, LPDDR5x, 32.0.101.8801
Memória
8 GB 
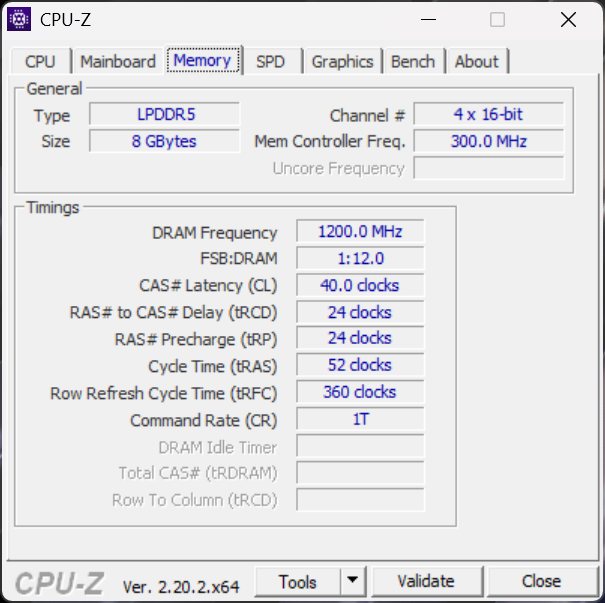
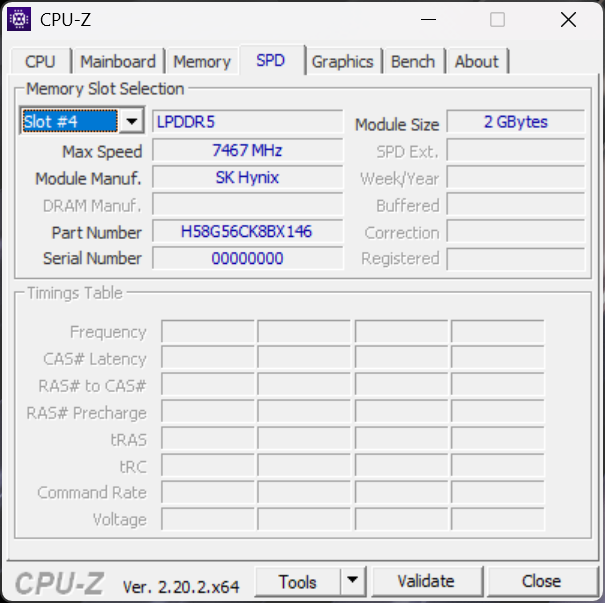
, LPDDR5x-7467, Single-Channel, Soldered
Pantalha
13.40 polegadas 16:10, 2560 x 1600 pixel 225 PPI, 10-point capacitive, LG Philips LP134WQ, IPS, Dell P/N: RNYV4, Brilhante: não, 120 Hz
placa mãe
Intel Wildcat Lake-U PCH
Placa de Som
Intel Wildcat Lake-U PCH - High Definition Audio - AVS (Audio, Video, Speech)
Conexões
2 USB 3.1 Gen2, USB-C Power Delivery (PD), 2 DisplayPort, Sensor de brilho
Funcionamento em rede
Intel Wi-Fi 7 BE213 160MHz ( be = Wi-Fi 7), Bluetooth 6.0
Tamanho
altura x largura x profundidade (em mm): 12.7 x 296.9 x 200.66
Bateria
52 Wh Lítio-Polímero
Sistema Operativo
Microsoft Windows 11 Home
Câmera
Webcam: 1080p30, IR
Câmera principal: 2 MPix
Características adicionais
Alto falantes: Quad (2x 2 W main + 2x 2 W tweeter), Teclado: Chiclet, Iluminação do Teclado: sim, Dell Optimizer, 12 Meses Garantia
peso
1.062 kg, Suprimento de energia: 166 g
Preço
700 USD
Amazon
Nota: O fabricante pode utilizar componentes de diferentes fornecedores, incluindo painéis de exibição, unidades ou cartões de memória com especificações semelhantes.


Caso

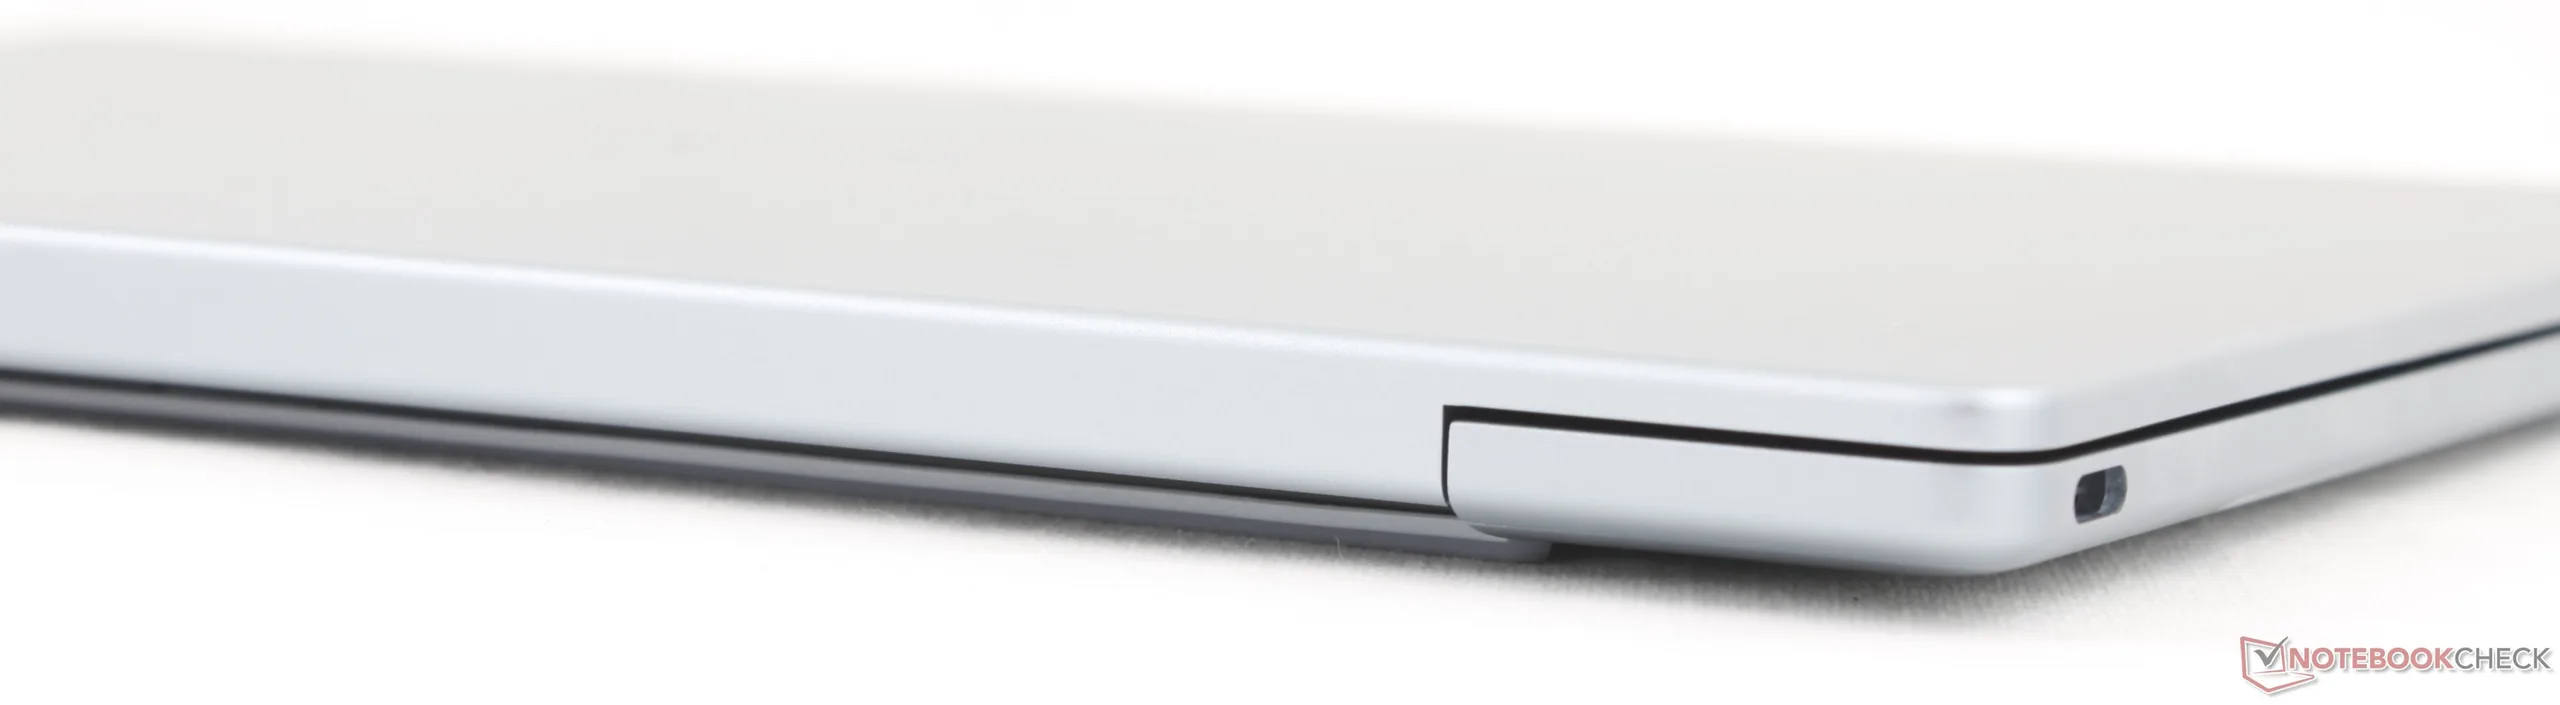
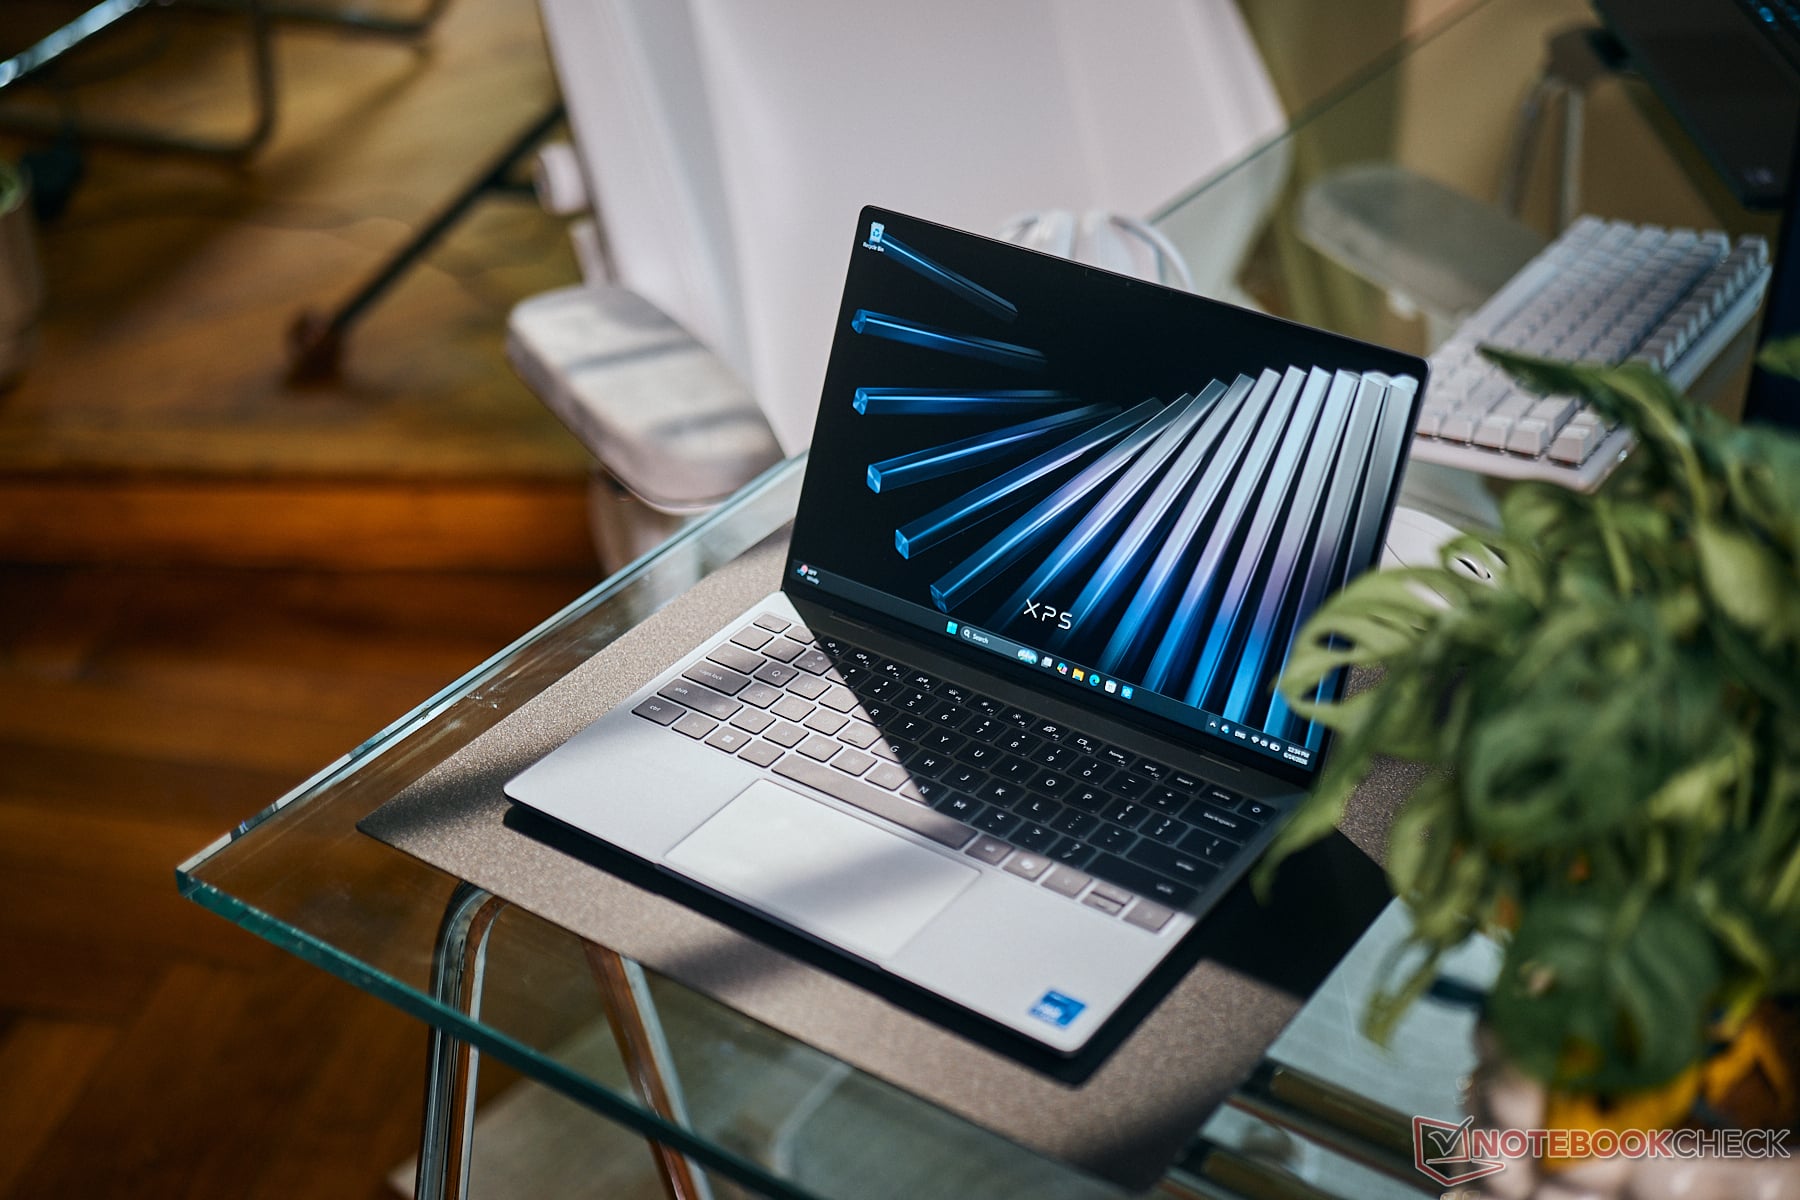
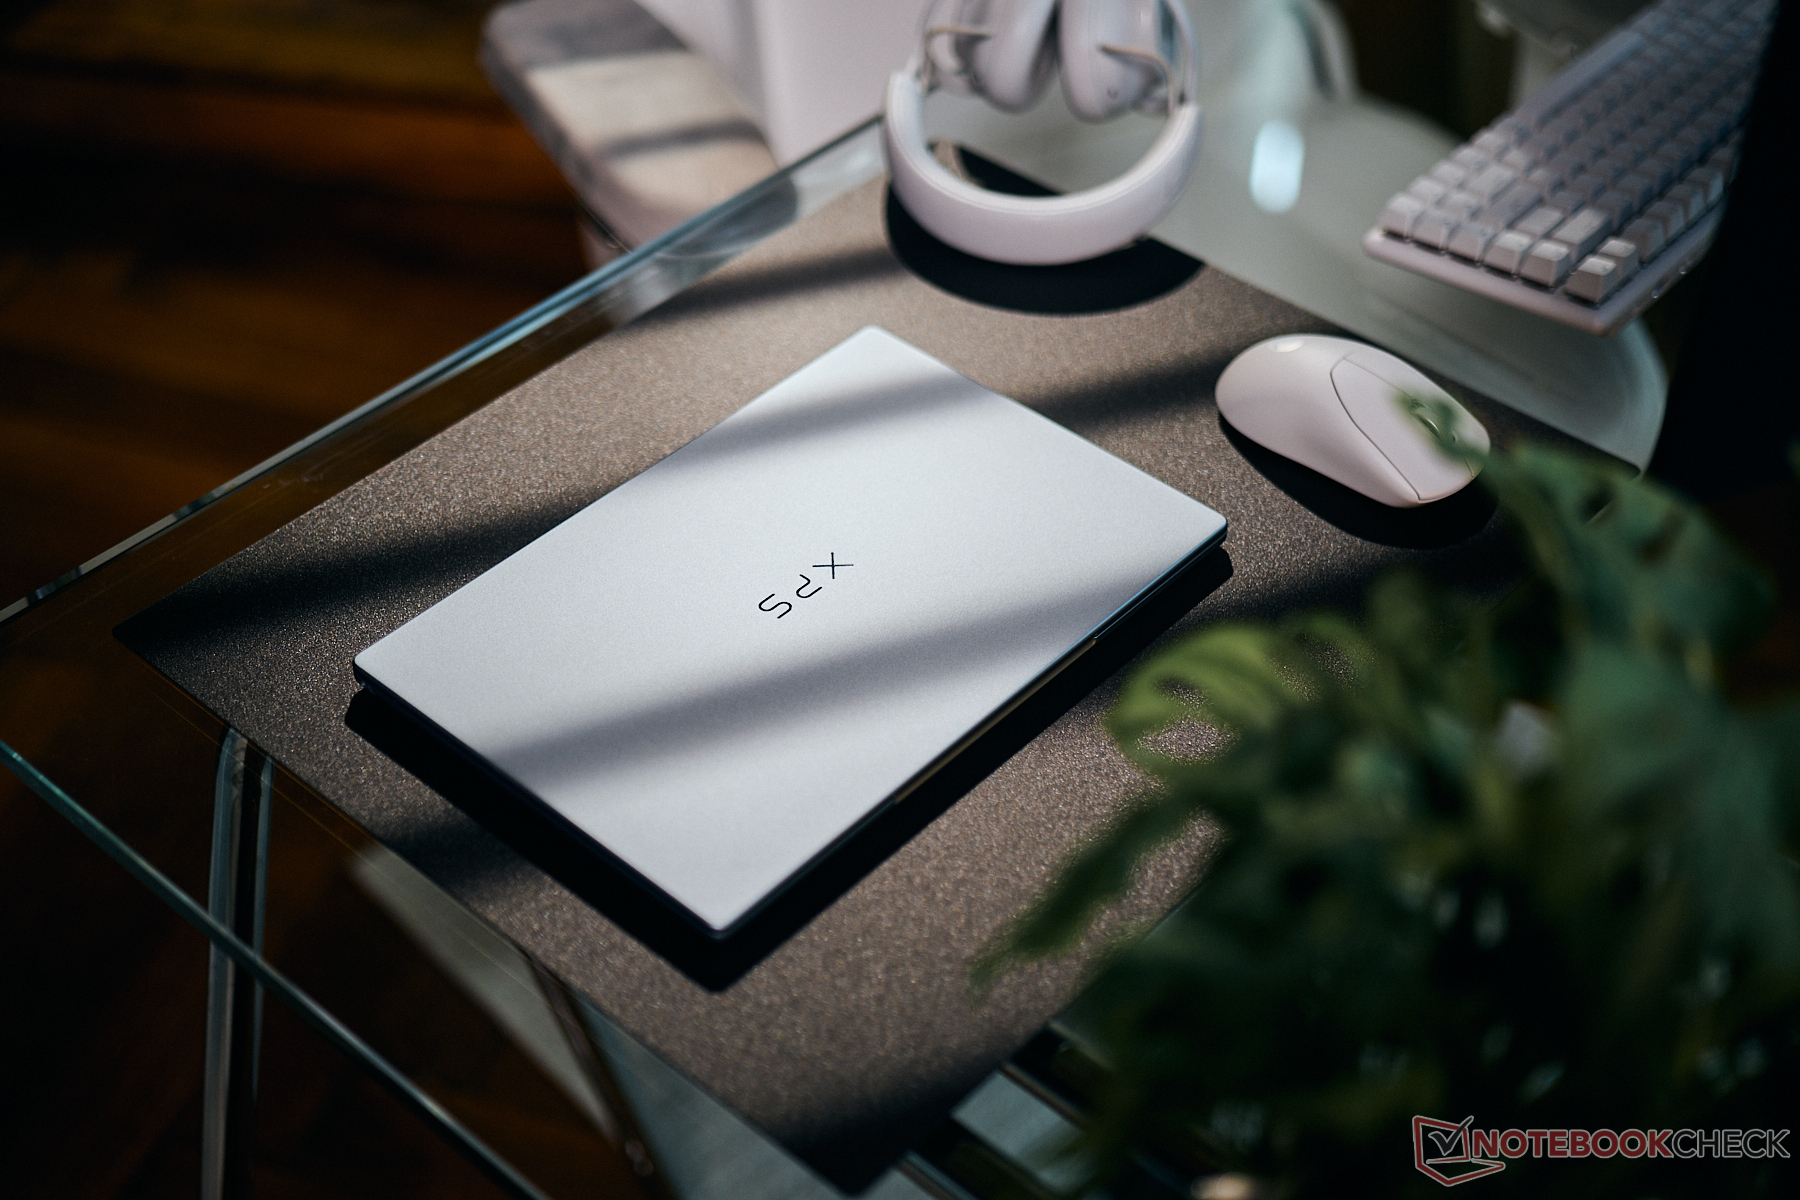
O XPS 13 de 2026 é ainda mais fino e leve do que o XPS 13 de 2024. Quando fechado, parece uma versão em miniatura do recente redesenho do XPS 16. Os modelos mais antigos e pesados do XPS 13 são, no entanto, menos suscetíveis a entortar do que esta última versão; portanto, pode-se argumentar que a redução no tamanho e no peso afetou a rigidez.
Comparação de tamanhos

313.5 mm 219.3 mm 16.8 mm 1.1 kg309.52 mm 209.71 mm 14.62 mm 1.4 kg297 mm 211 mm 17.6 mm 1 kg295.3 mm 199.1 mm 15.3 mm 1.2 kg297.5 mm 206.4 mm 12.7 mm 1.2 kg296.9 mm 200.66 mm 12.7 mm 1.1 kg297 mm 210 mm 1 mm 5.7 g

Conectividade

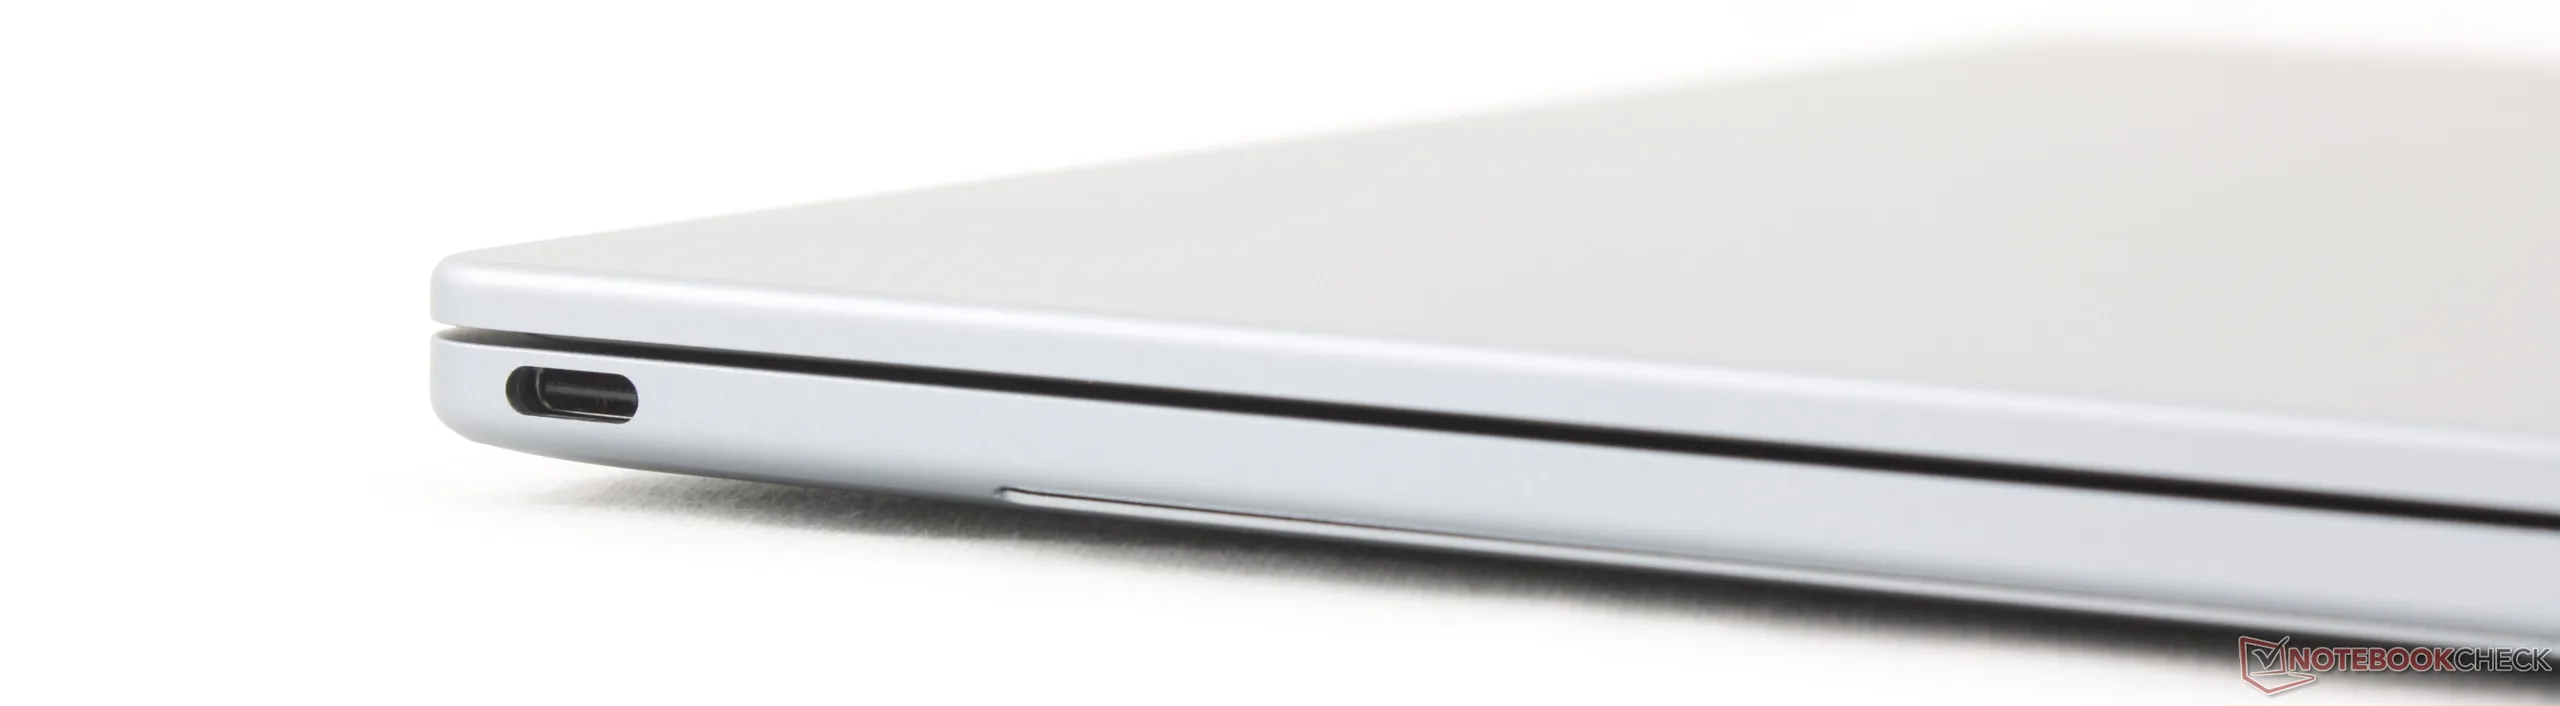
Os SKUs com Core Ultra contam com Thunderbolt 4 a 40 Gbps, enquanto os SKUs de gama mais baixa, sem Core Ultra, contam apenas com USB-C 3.2 a 10 Gbps.
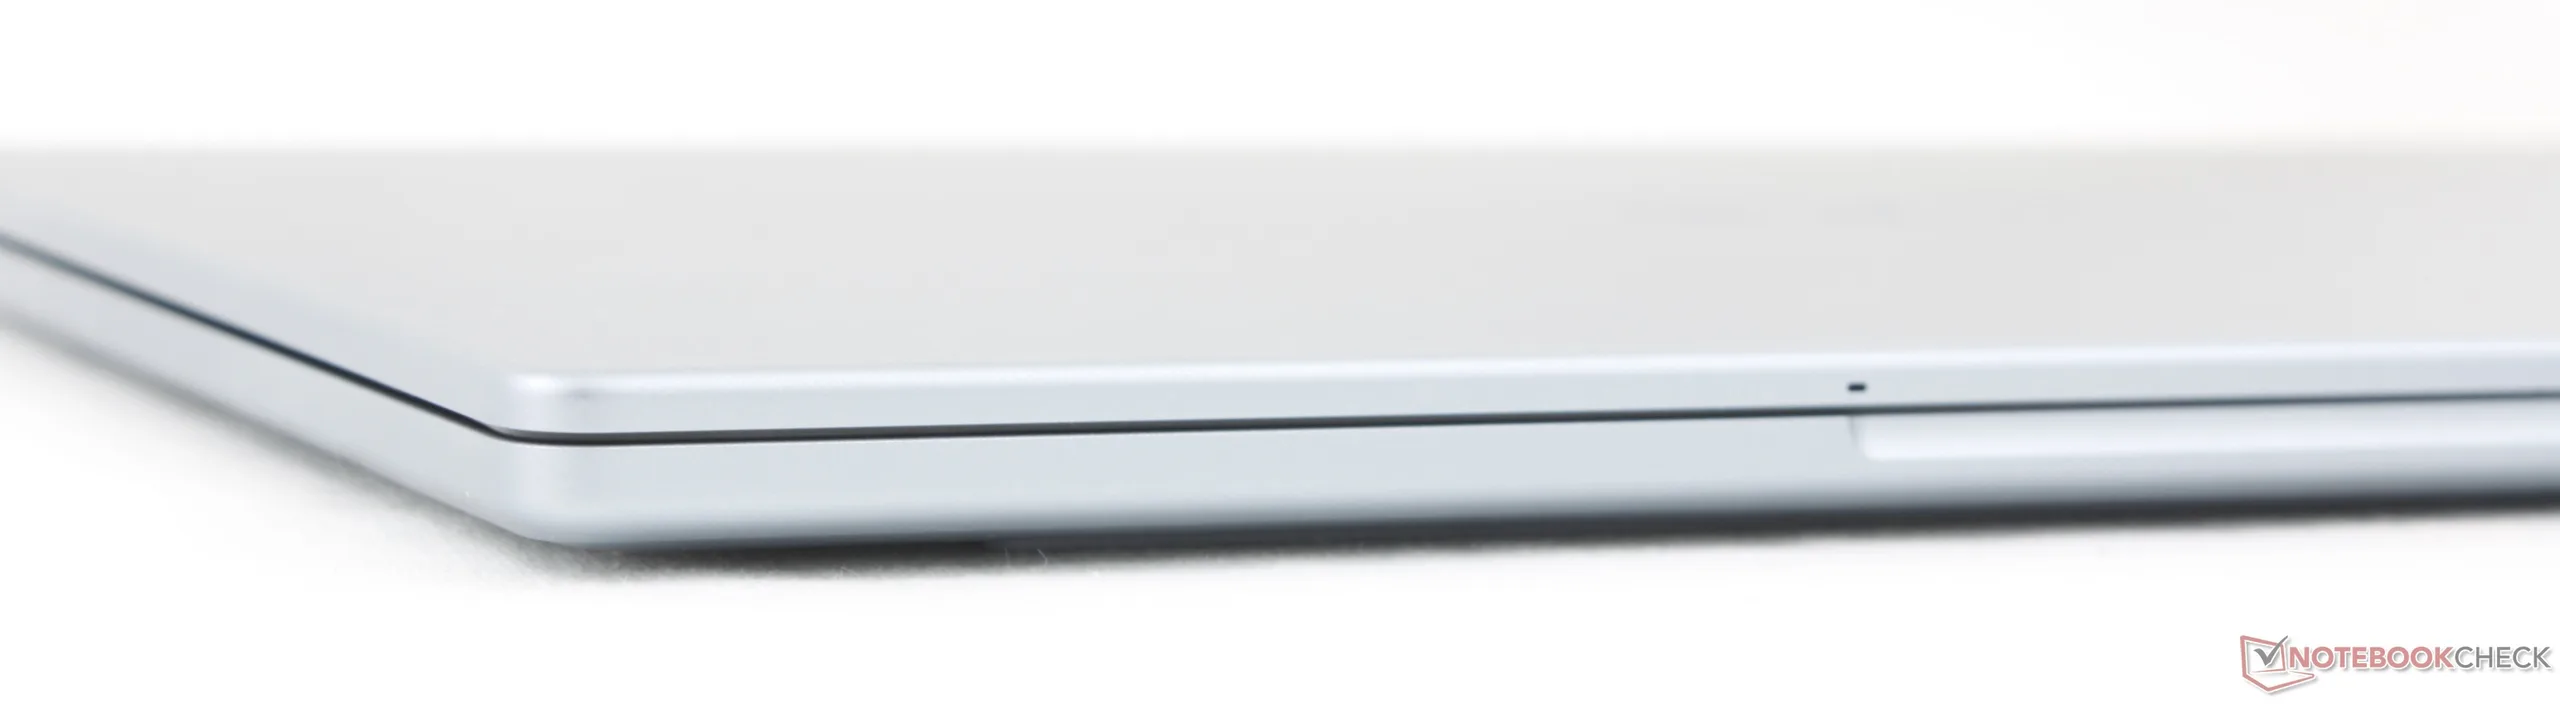
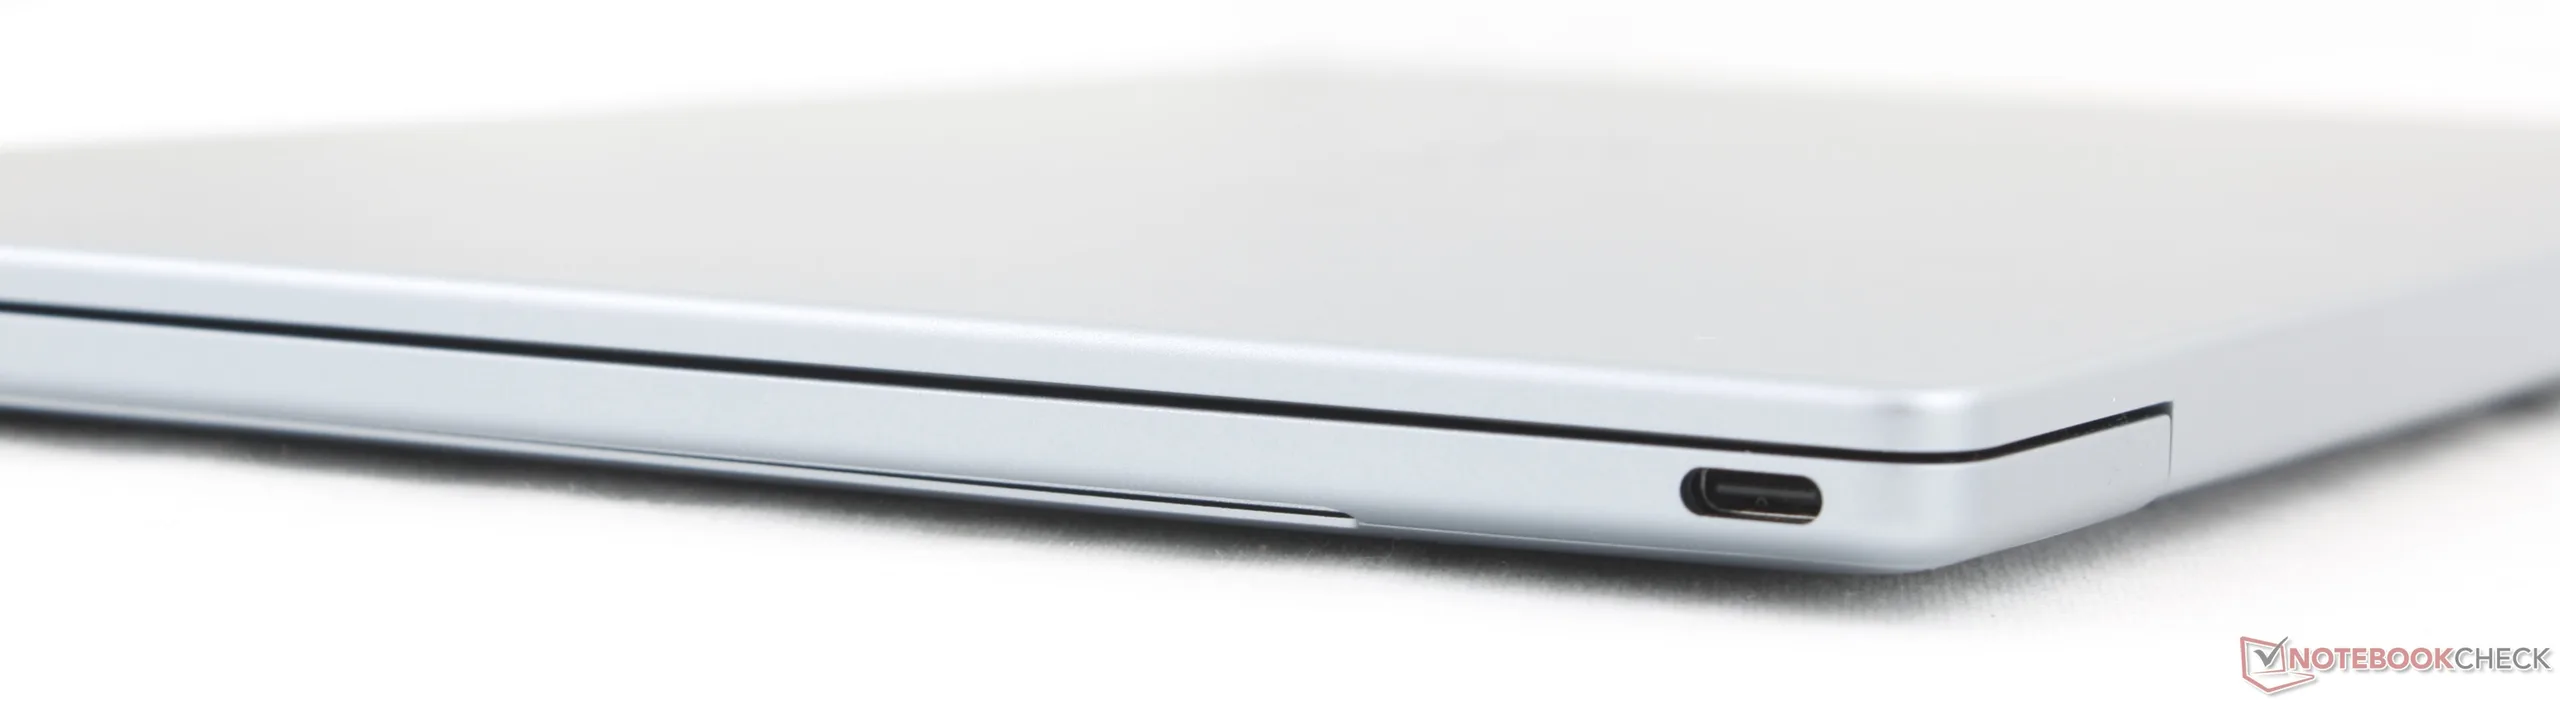
Parte frontal: Sem portas
Correto: USB-C 3.2 Gen. 2 com DisplayPort 2.1 + Power Delivery
Parte traseira: Sem portas
À esquerda: USB-C 3.2 Gen. 2 com DisplayPort 2.1 + Power Delivery

Comunicação

Networking
iperf3 transmit Wi-Fi6/7 RT-BE96U
Lenovo ThinkPad X1 Carbon Gen 14 21V70075GE
Intel Wi-Fi 7 BE211 320MHz
4557 (4450min - 4688max) MBit/s
iperf3 receive Wi-Fi6/7 RT-BE96U
Lenovo ThinkPad X1 Carbon Gen 14 21V70075GE
Intel Wi-Fi 7 BE211 320MHz
3244 (3047min - 3285max) MBit/s
iperf3 receive AXE11000 6GHz
Dell XPS 14 Core Ultra X7 358H
Intel Wi-Fi 7 BE211 320MHz
1740 (1711min - 1757max) MBit/s +16%
Dell XPS 13 9350
Intel BE201 320MHz
1620 (1578min - 1652max) MBit/s +8%
Dell XPS 13 DX13260
Intel Wi-Fi 7 BE213 160MHz
1498 (1435min - 1602max) MBit/s
iperf3 transmit AXE11000 6GHz
Dell XPS 13 DX13260
Intel Wi-Fi 7 BE213 160MHz
1500 (1399min - 1613max) MBit/s
Dell XPS 14 Core Ultra X7 358H
Intel Wi-Fi 7 BE211 320MHz
1440 (1053min - 1526max) MBit/s -4%
Dell XPS 13 9350
Intel BE201 320MHz
1127 (1037min - 1292max) MBit/s -25%
01002003004005006007008009001000110012001300140015001600Tooltip
Dell XPS 13 DX13260; iperf3 receive AXE11000 6GHz; iperf 3.1.3: Ø1498 (1435-1602) MBit/s
Dell XPS 13 DX13260; iperf3 transmit AXE11000 6GHz; iperf 3.1.3: Ø1500 (1399-1613) MBit/s

Webcam

 Embora o IR venha de fábrica com suporte ao Windows Hello, ainda não há obturador de privacidade, seja físico ou de outro tipo.

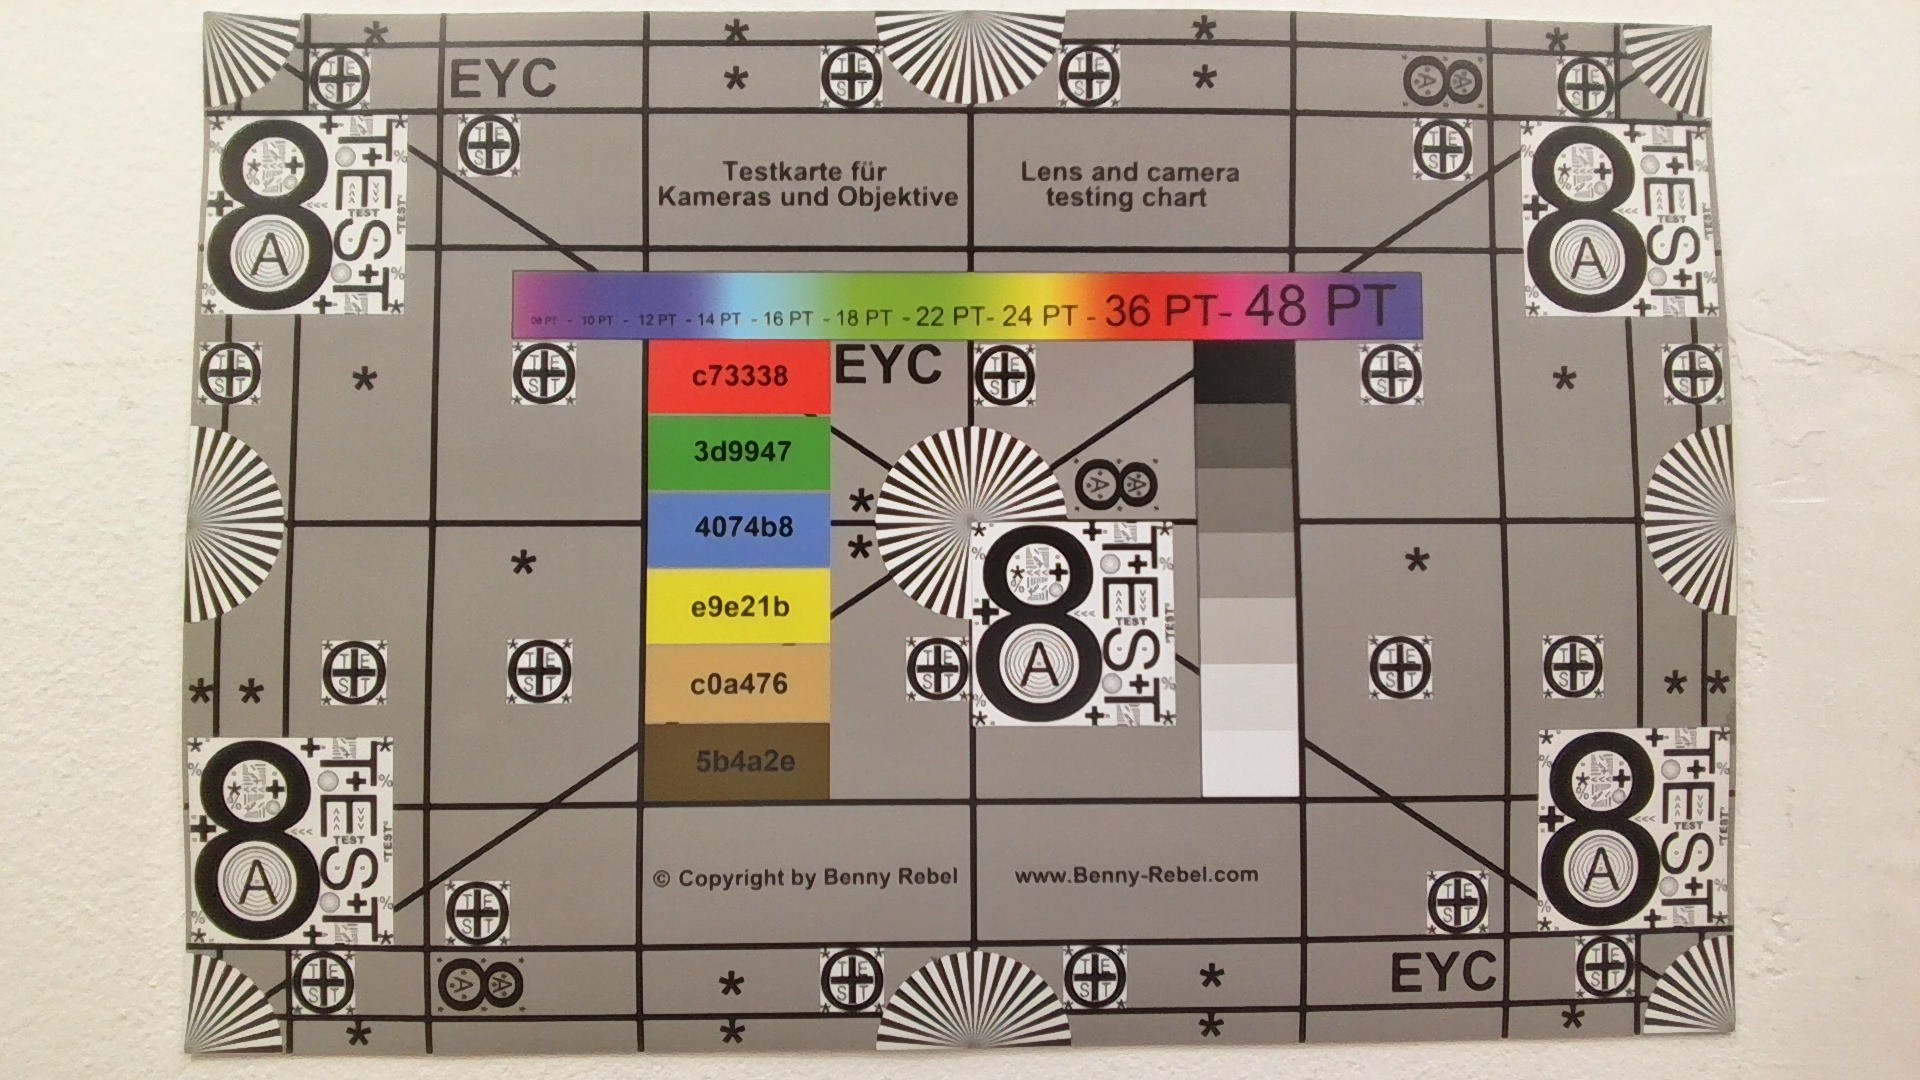
ColorChecker
11 ∆E
13 ∆E
14.1 ∆E
21.3 ∆E
15.8 ∆E
17.9 ∆E
8.1 ∆E
10.2 ∆E
13.9 ∆E
7.6 ∆E
15.3 ∆E
17.7 ∆E
4.6 ∆E
18.5 ∆E
19.8 ∆E
13.1 ∆E
13.8 ∆E
20.3 ∆E
7.8 ∆E
9.9 ∆E
15 ∆E
15 ∆E
12.3 ∆E
3.2 ∆E
ColorChecker Dell XPS 13 DX13260: 13.29 ∆E min: 3.2 - max: 21.3 ∆E

Manutenção

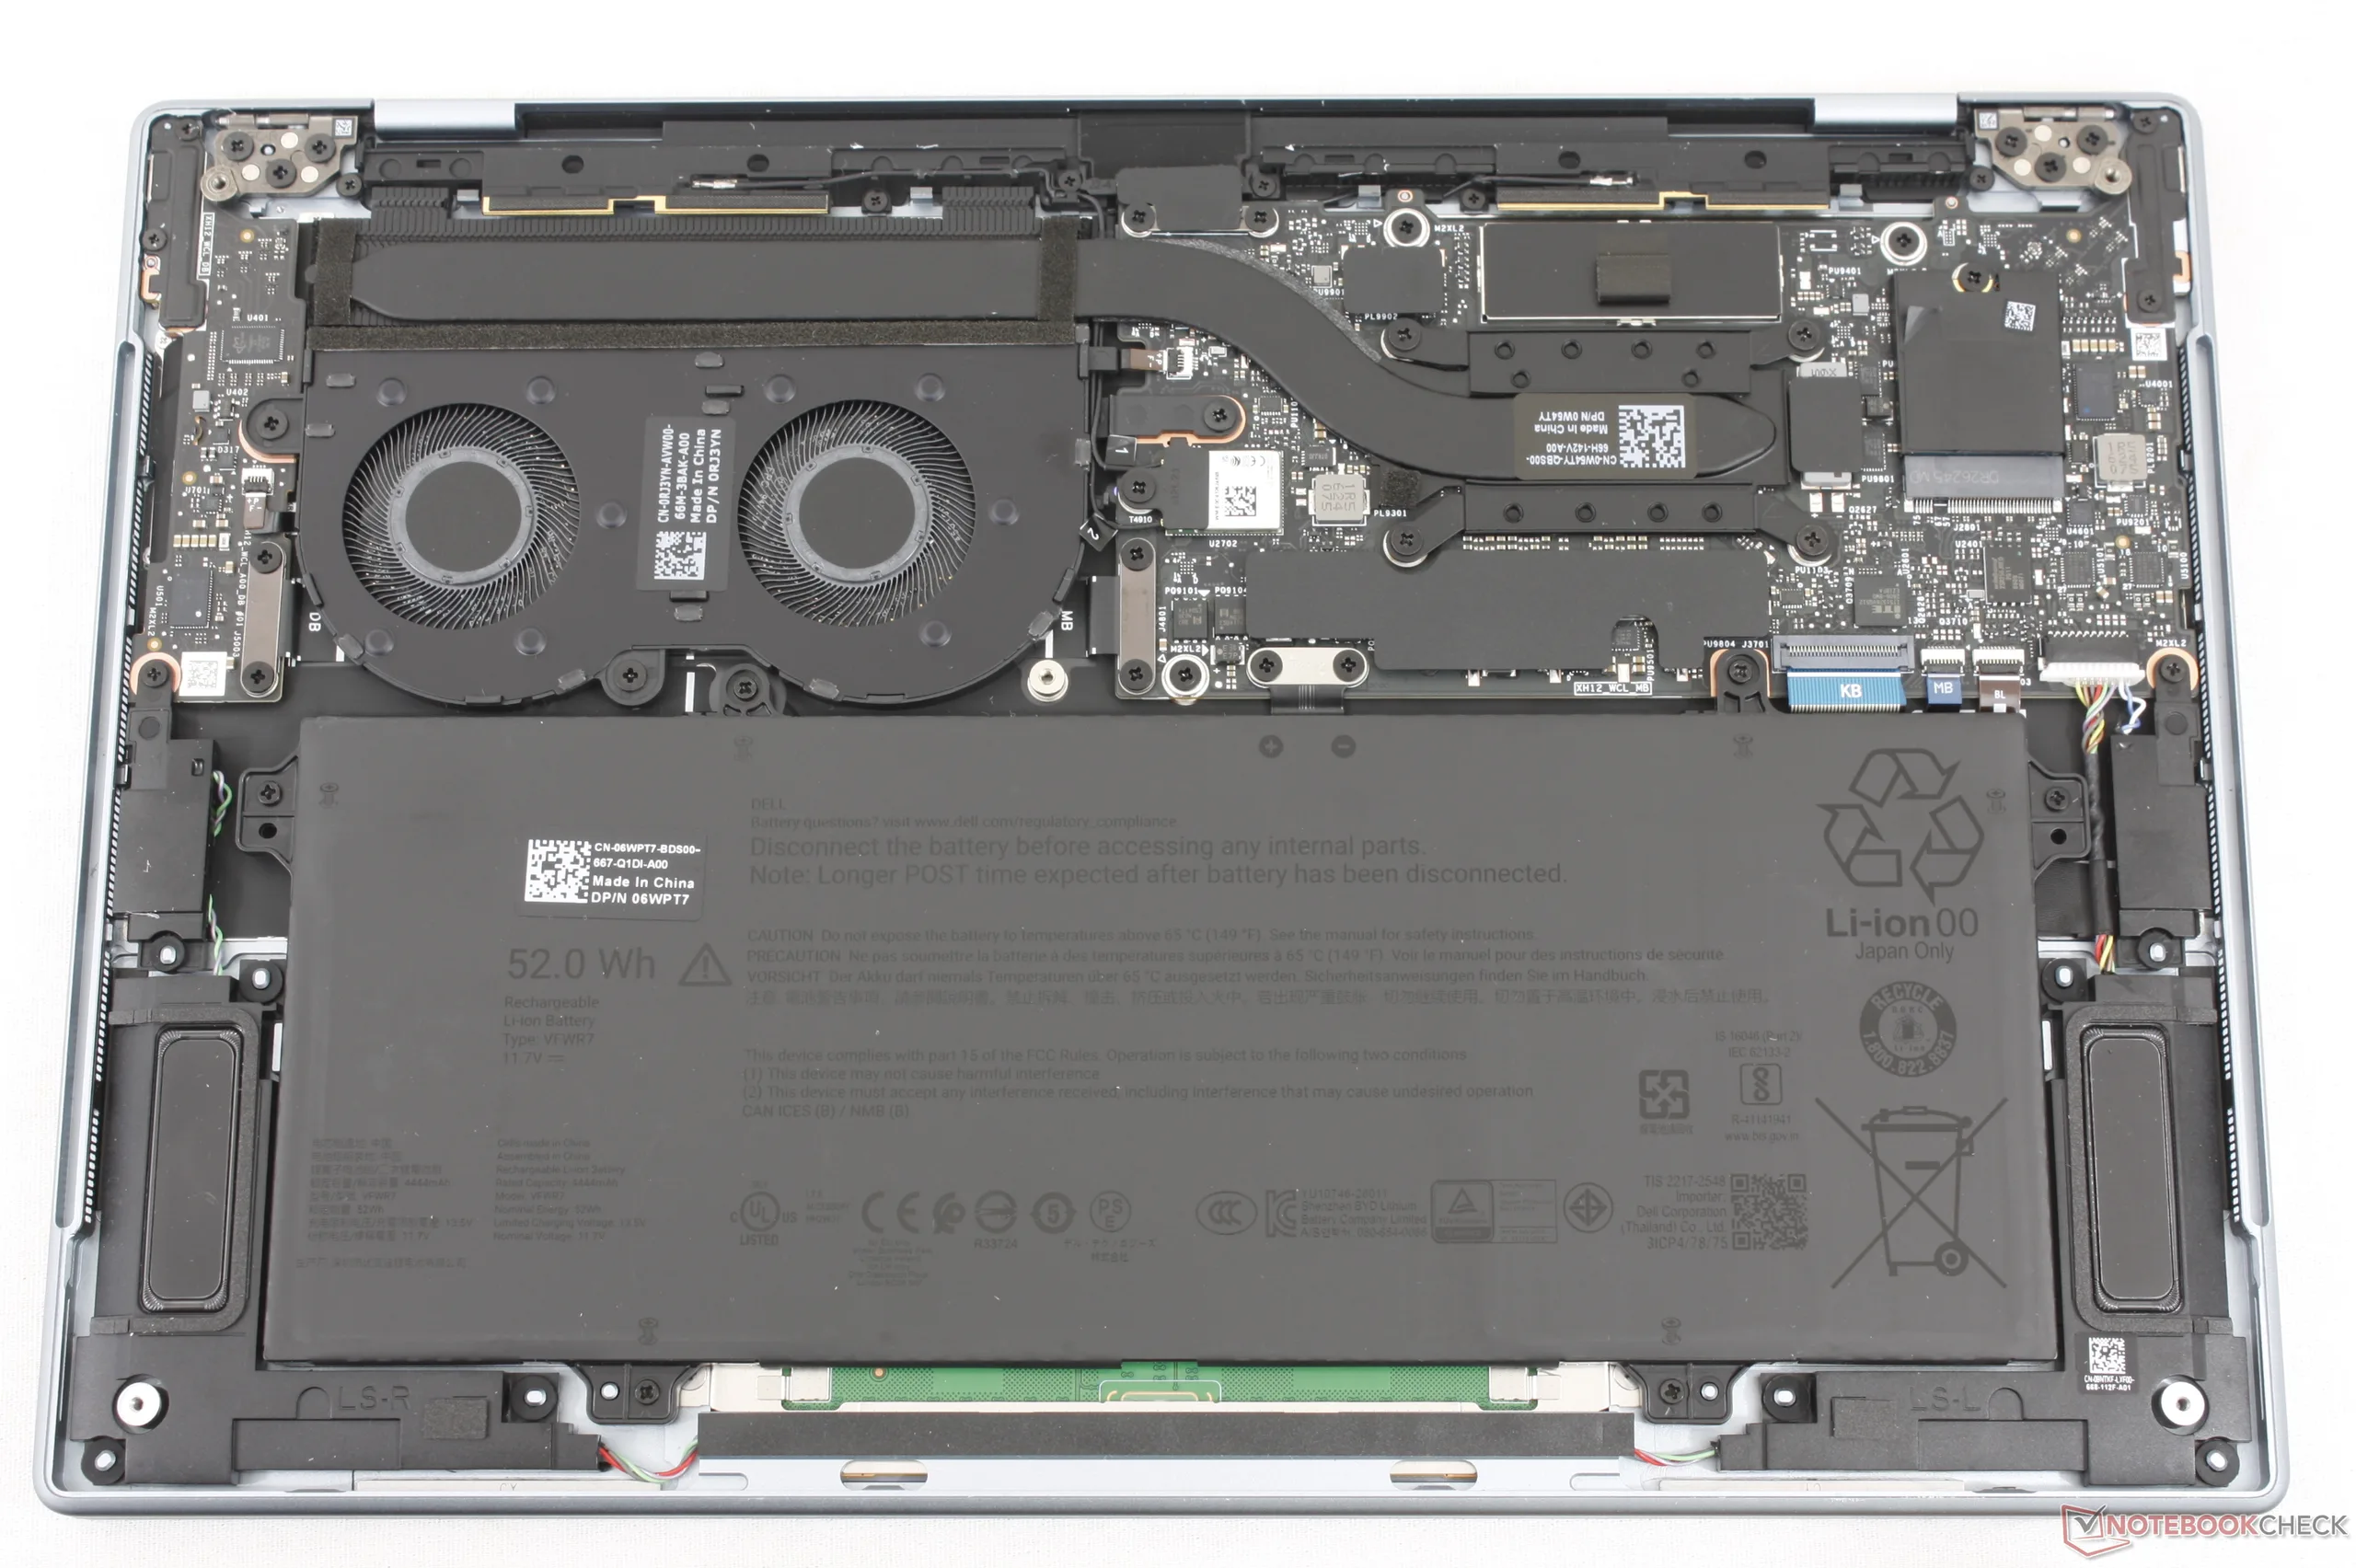
Placa-mãe do XPS 13 Wildcat. Apenas a bateria e o SSD M.2 2242 são removíveis

Sustentabilidade

O chassi é composto por até 75% de alumínio reciclado na tampa superior e nos apoios para as mãos, até 50% de cobalto reciclado na bateria e até 90% de aço reciclado nas teclas. A embalagem é totalmente reciclável e não contém plásticos.

Dispositivos de entrada

O teclado mais tradicional é, sem dúvida, mais fácil de digitar do que o teclado sem grade do XPS 14, que é maior. No entanto, embora o retorno tátil seja preciso, o curso das teclas é muito curto, especialmente no que diz respeito à tecla de espaço.
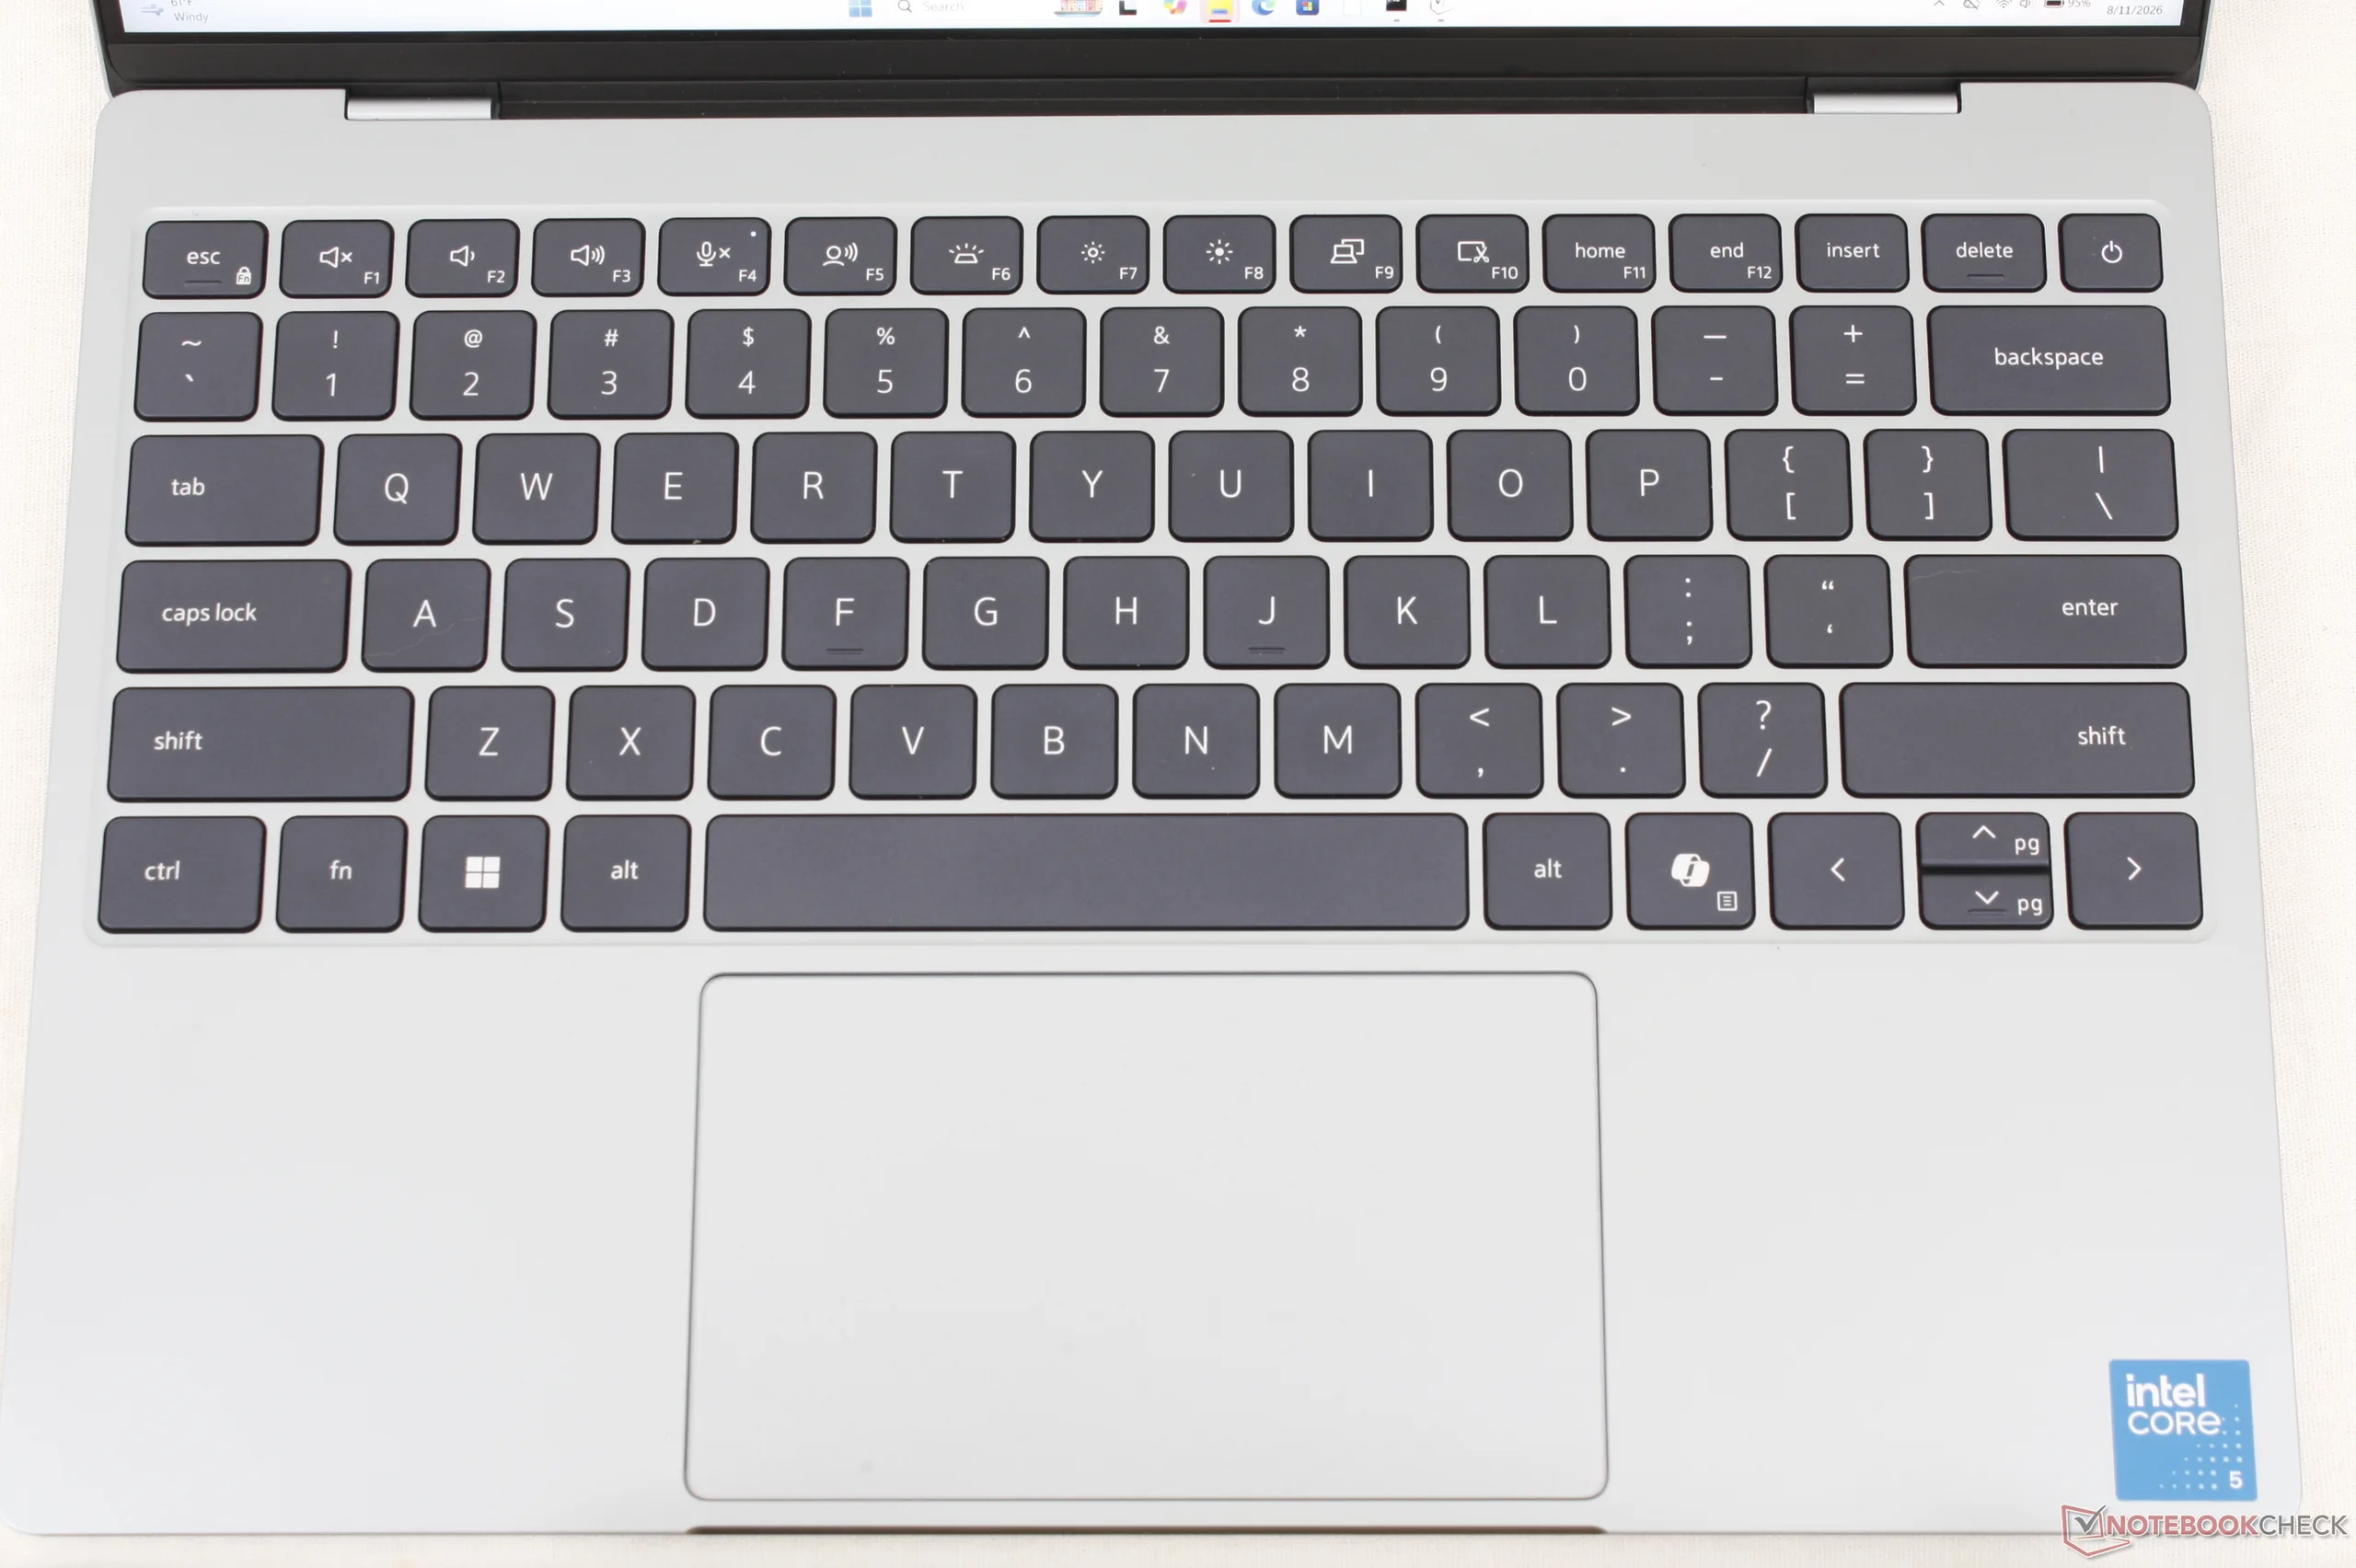
Com aproximadamente 12 x 7 cm, o clickpad pode parecer um pouco apertado, especialmente ao mover o cursor na vertical

Exibição

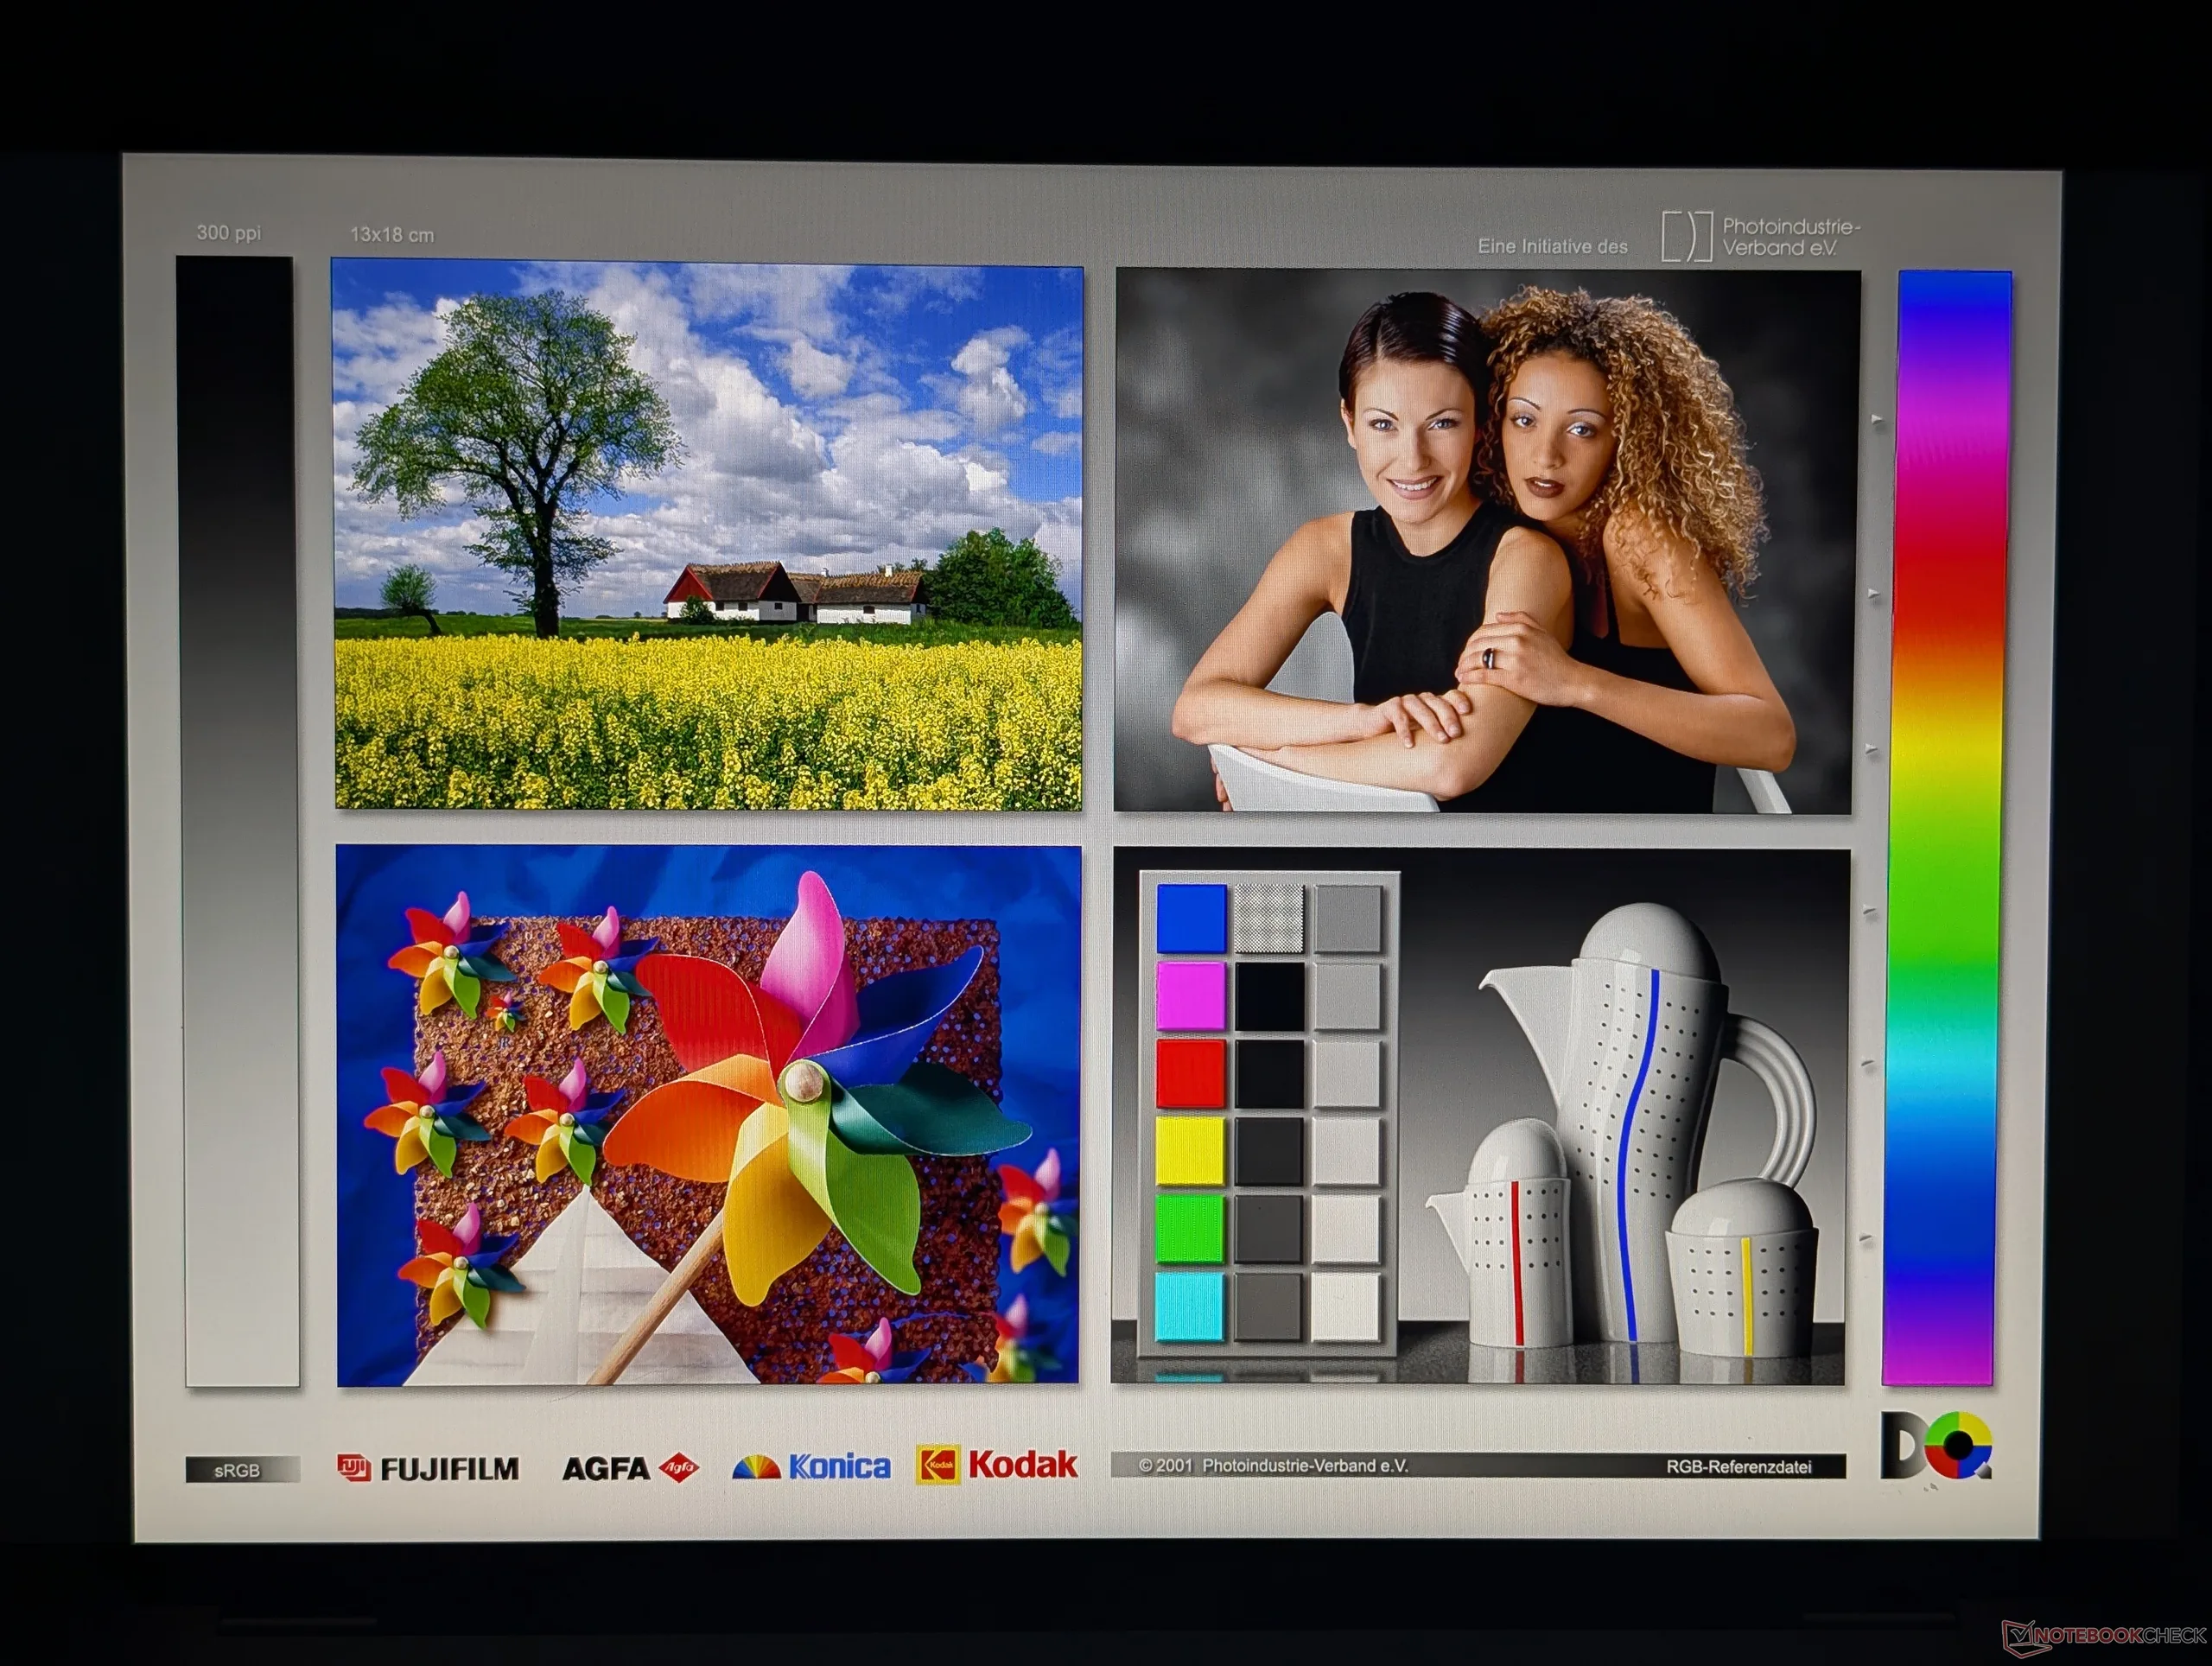
Painel IPS fosco com granulação mínima
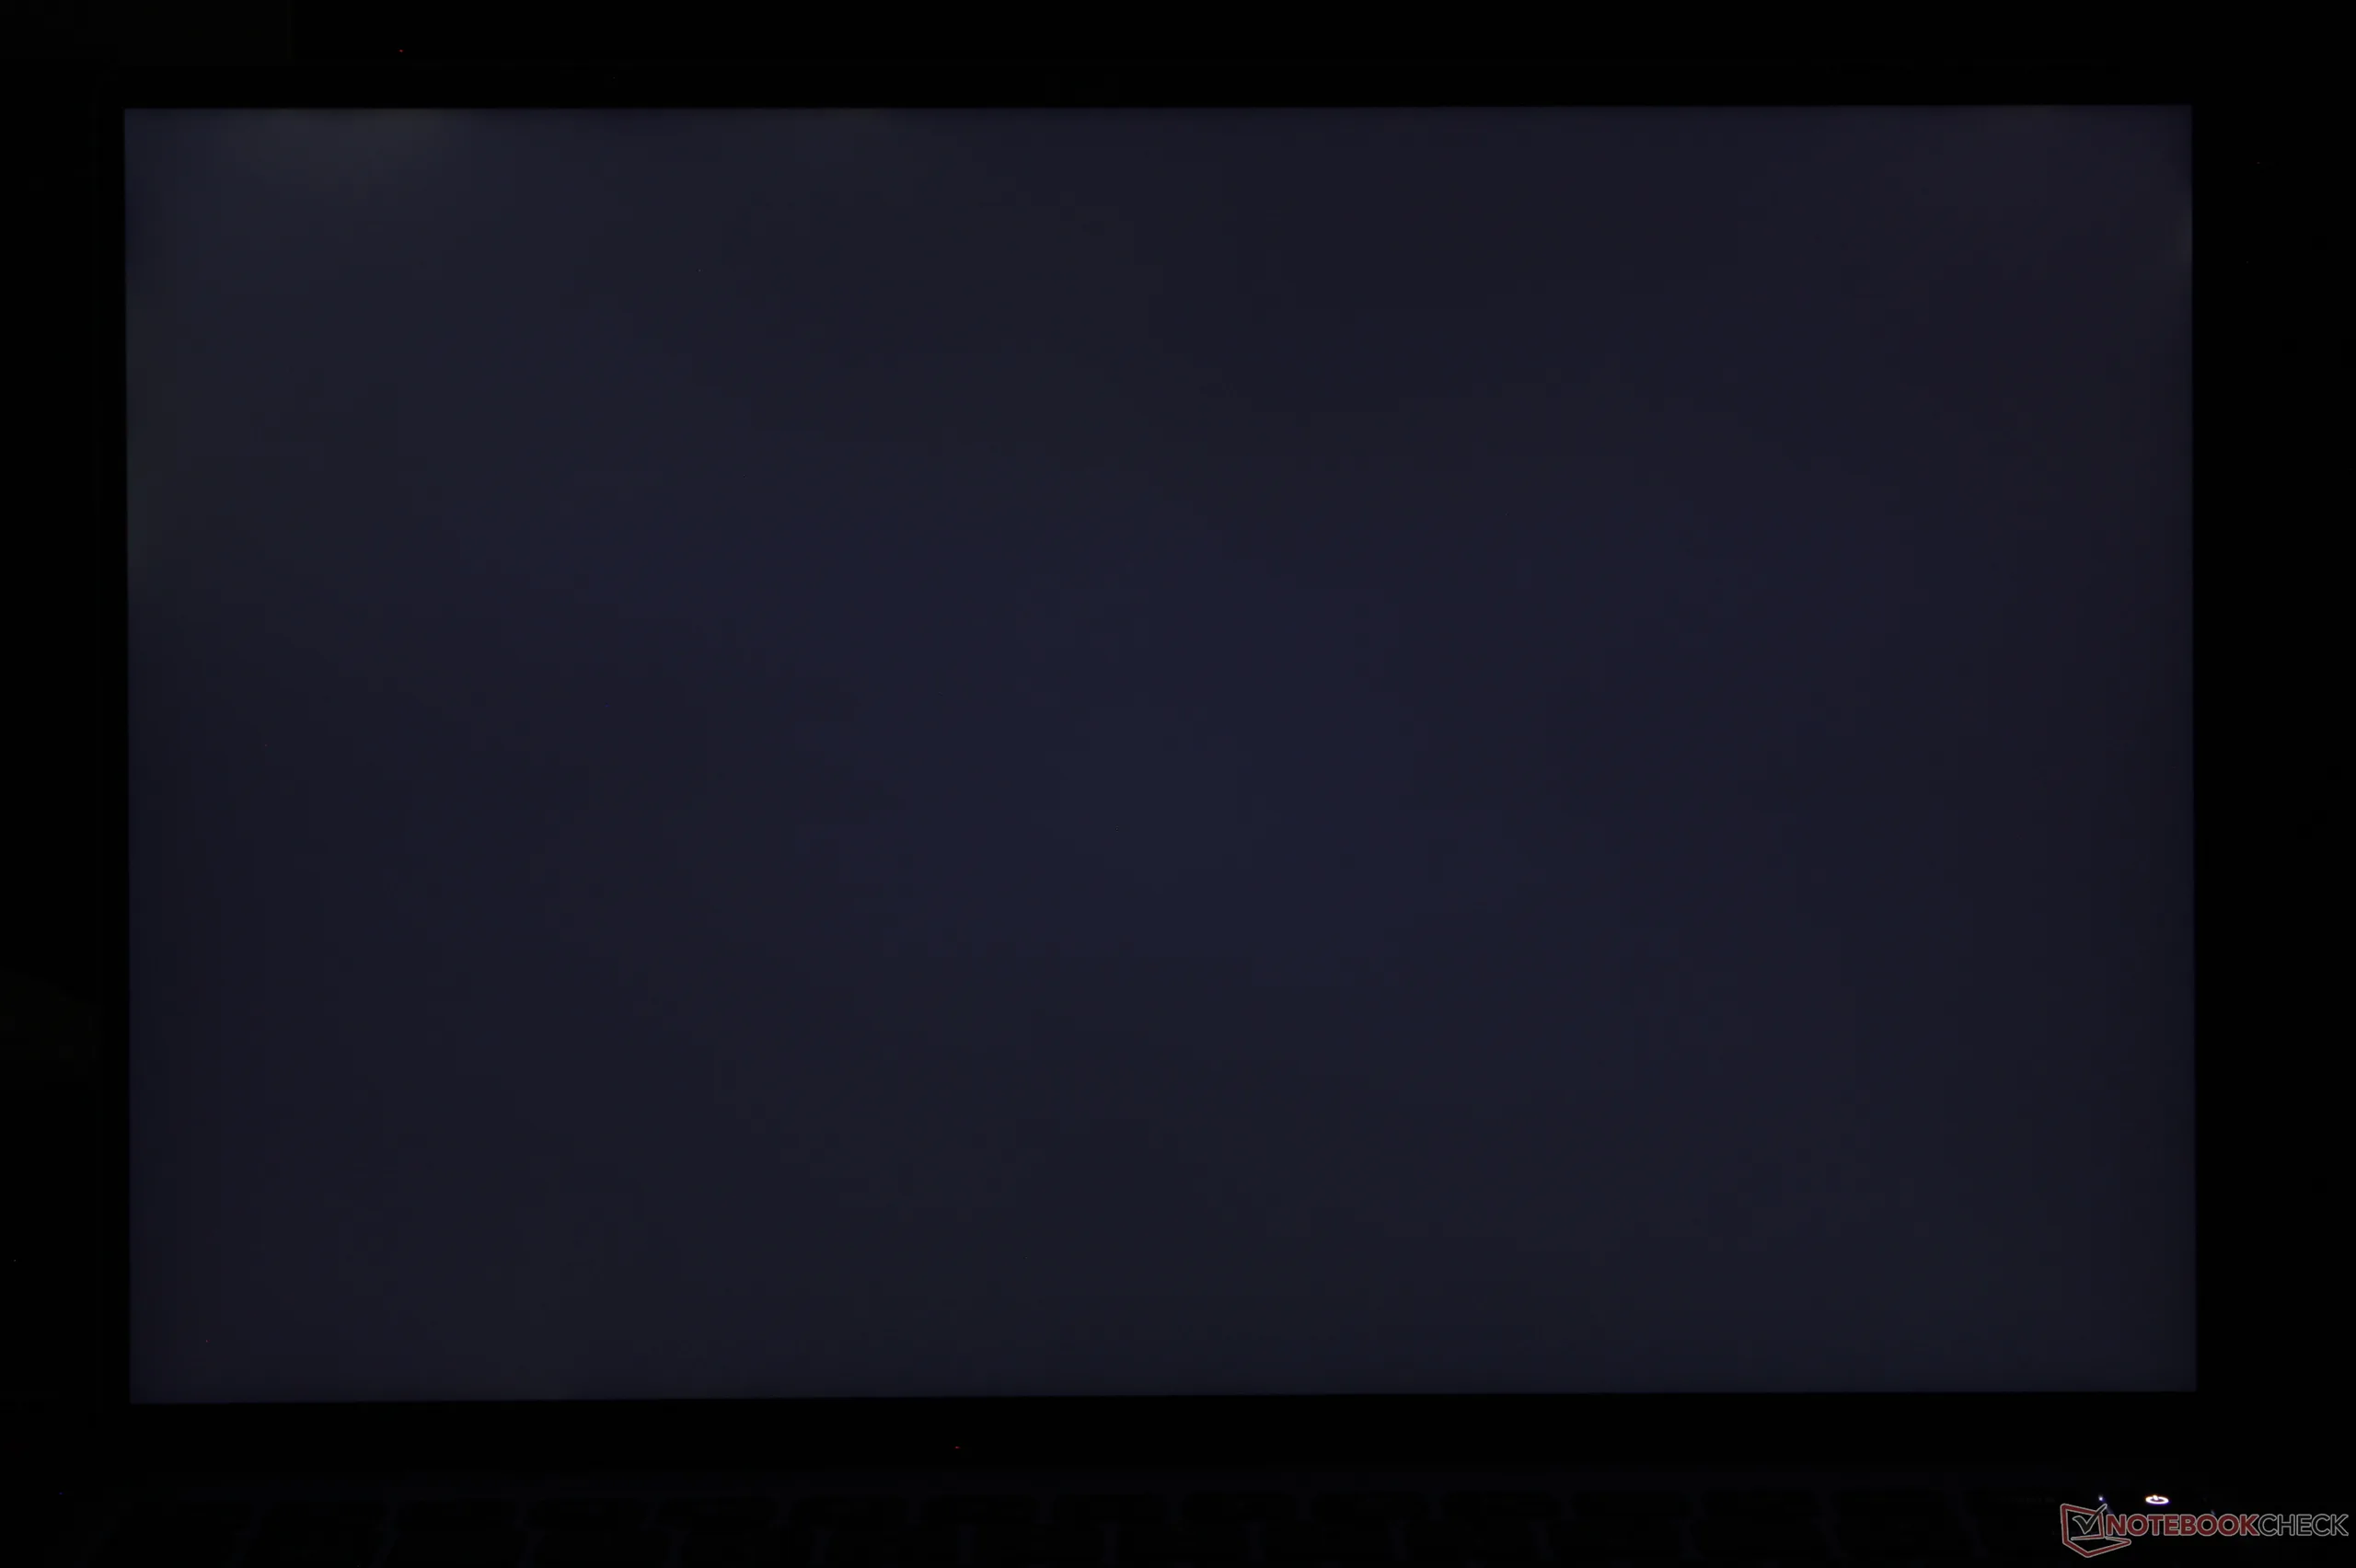
Ligeiro vazamento irregular de luz de fundo ao longo do canto superior esquerdo

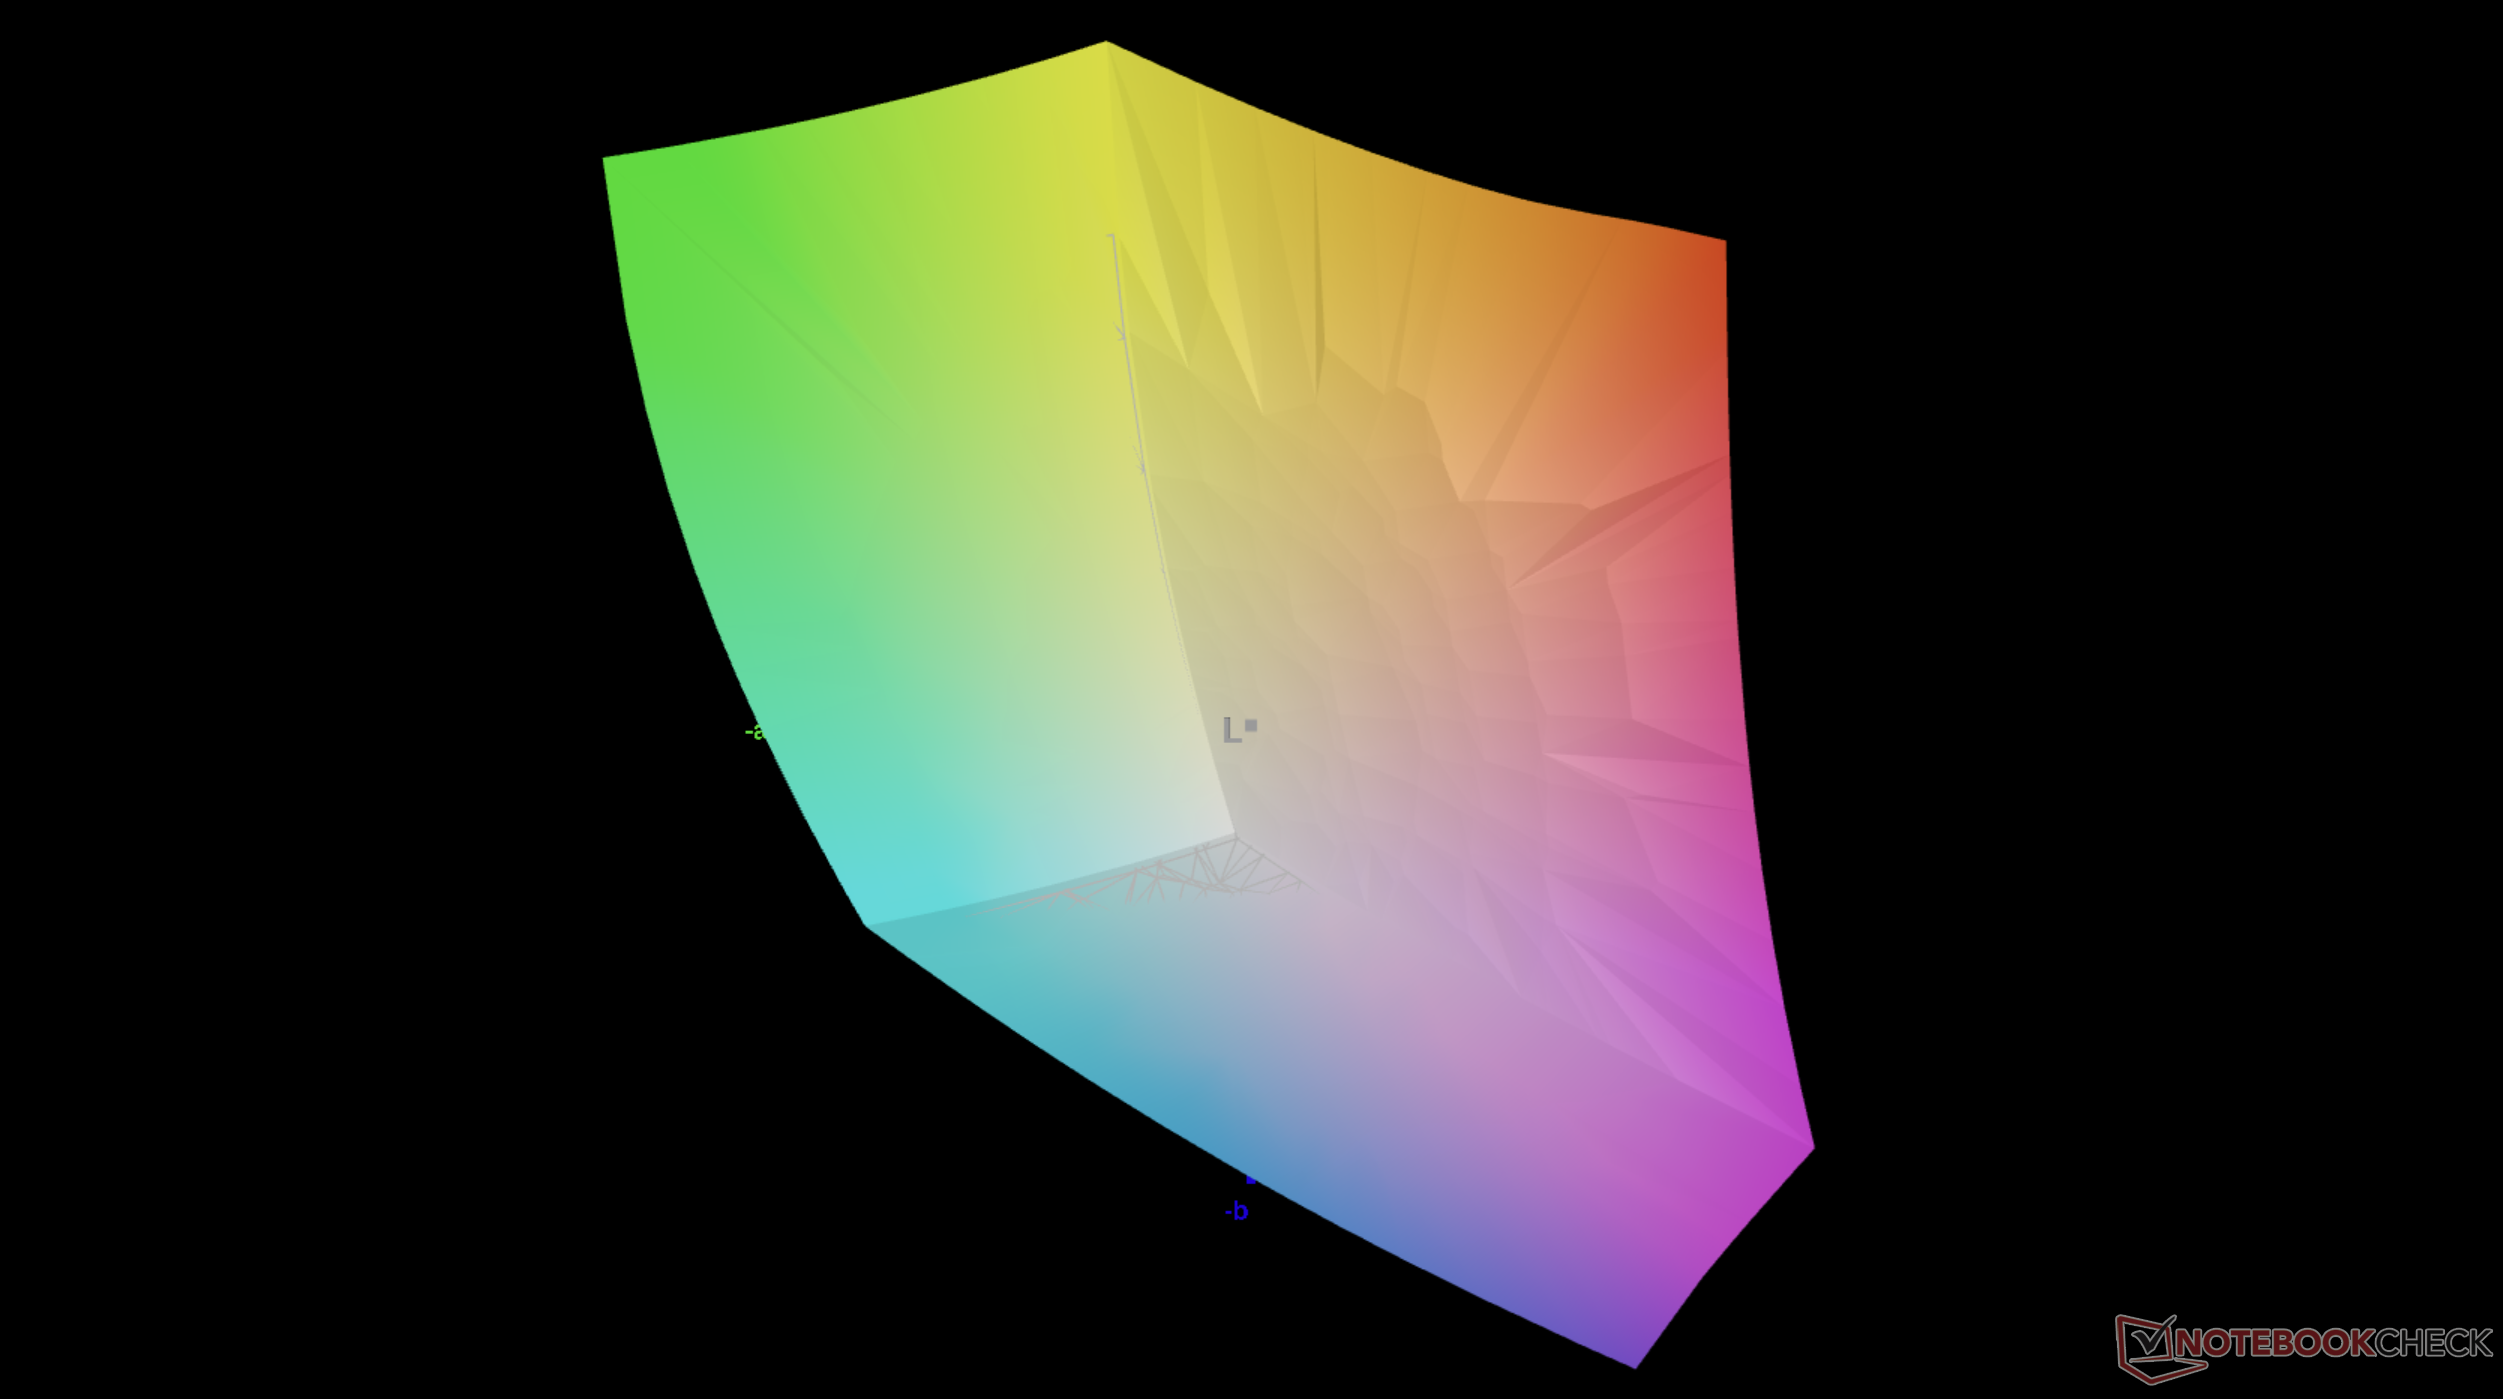
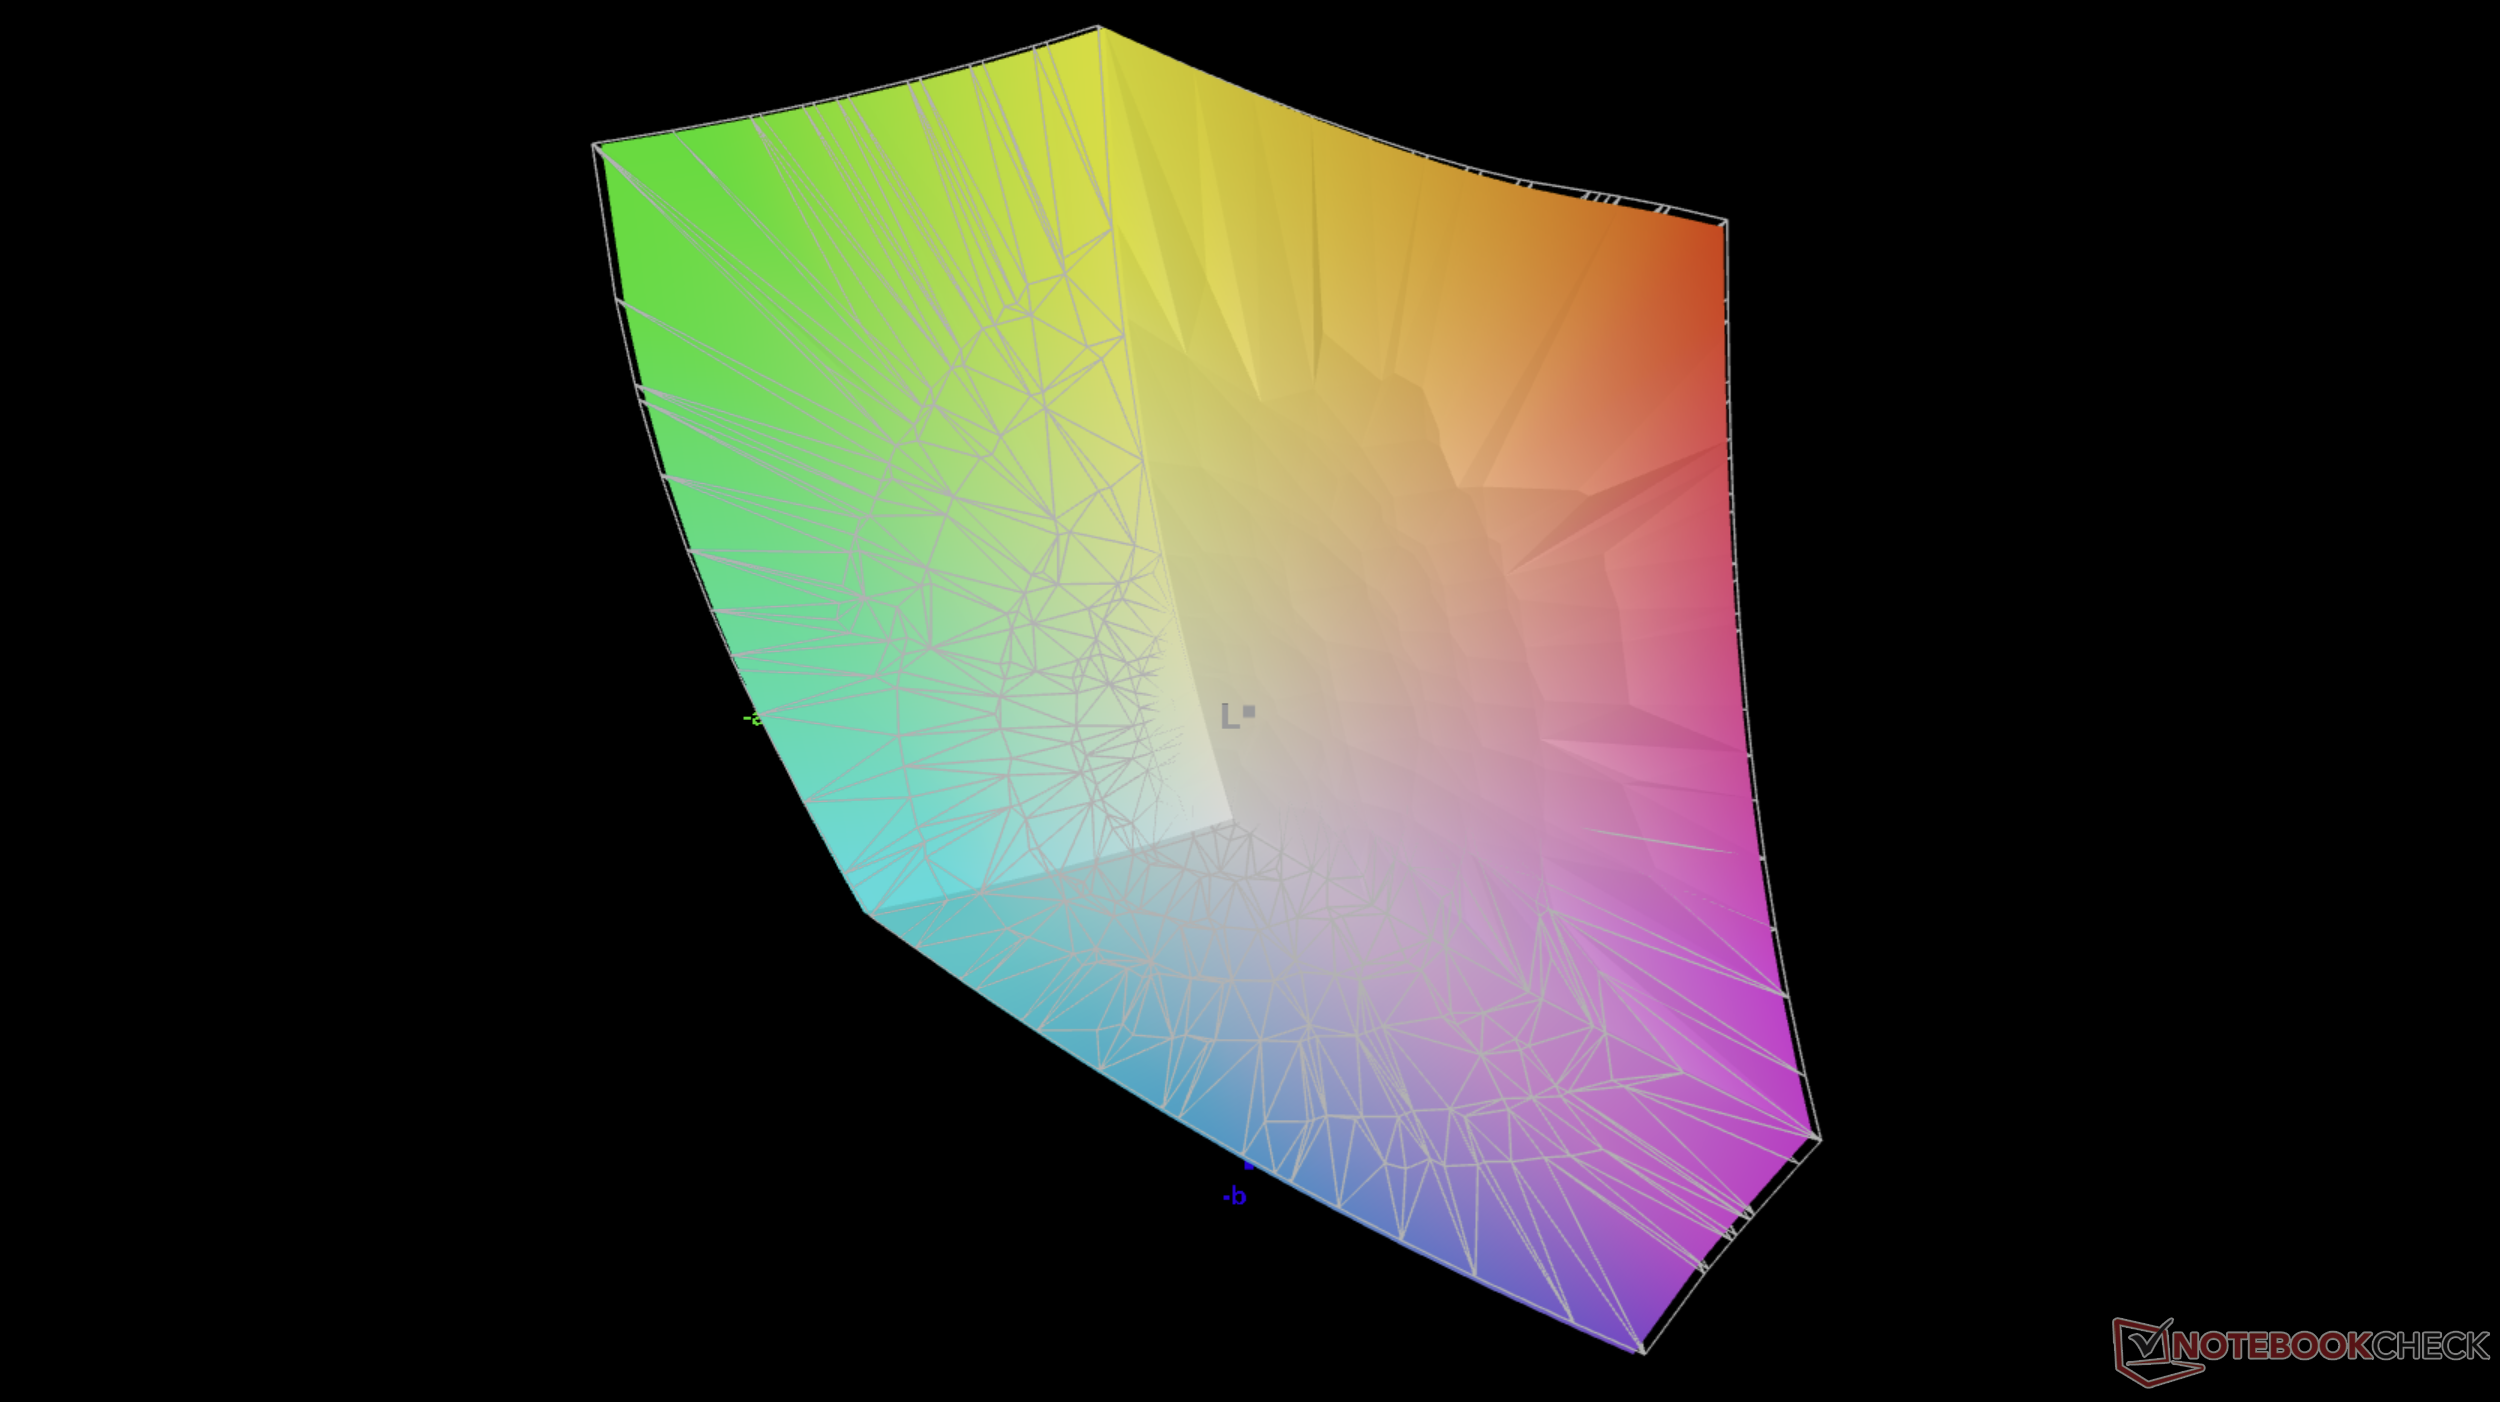
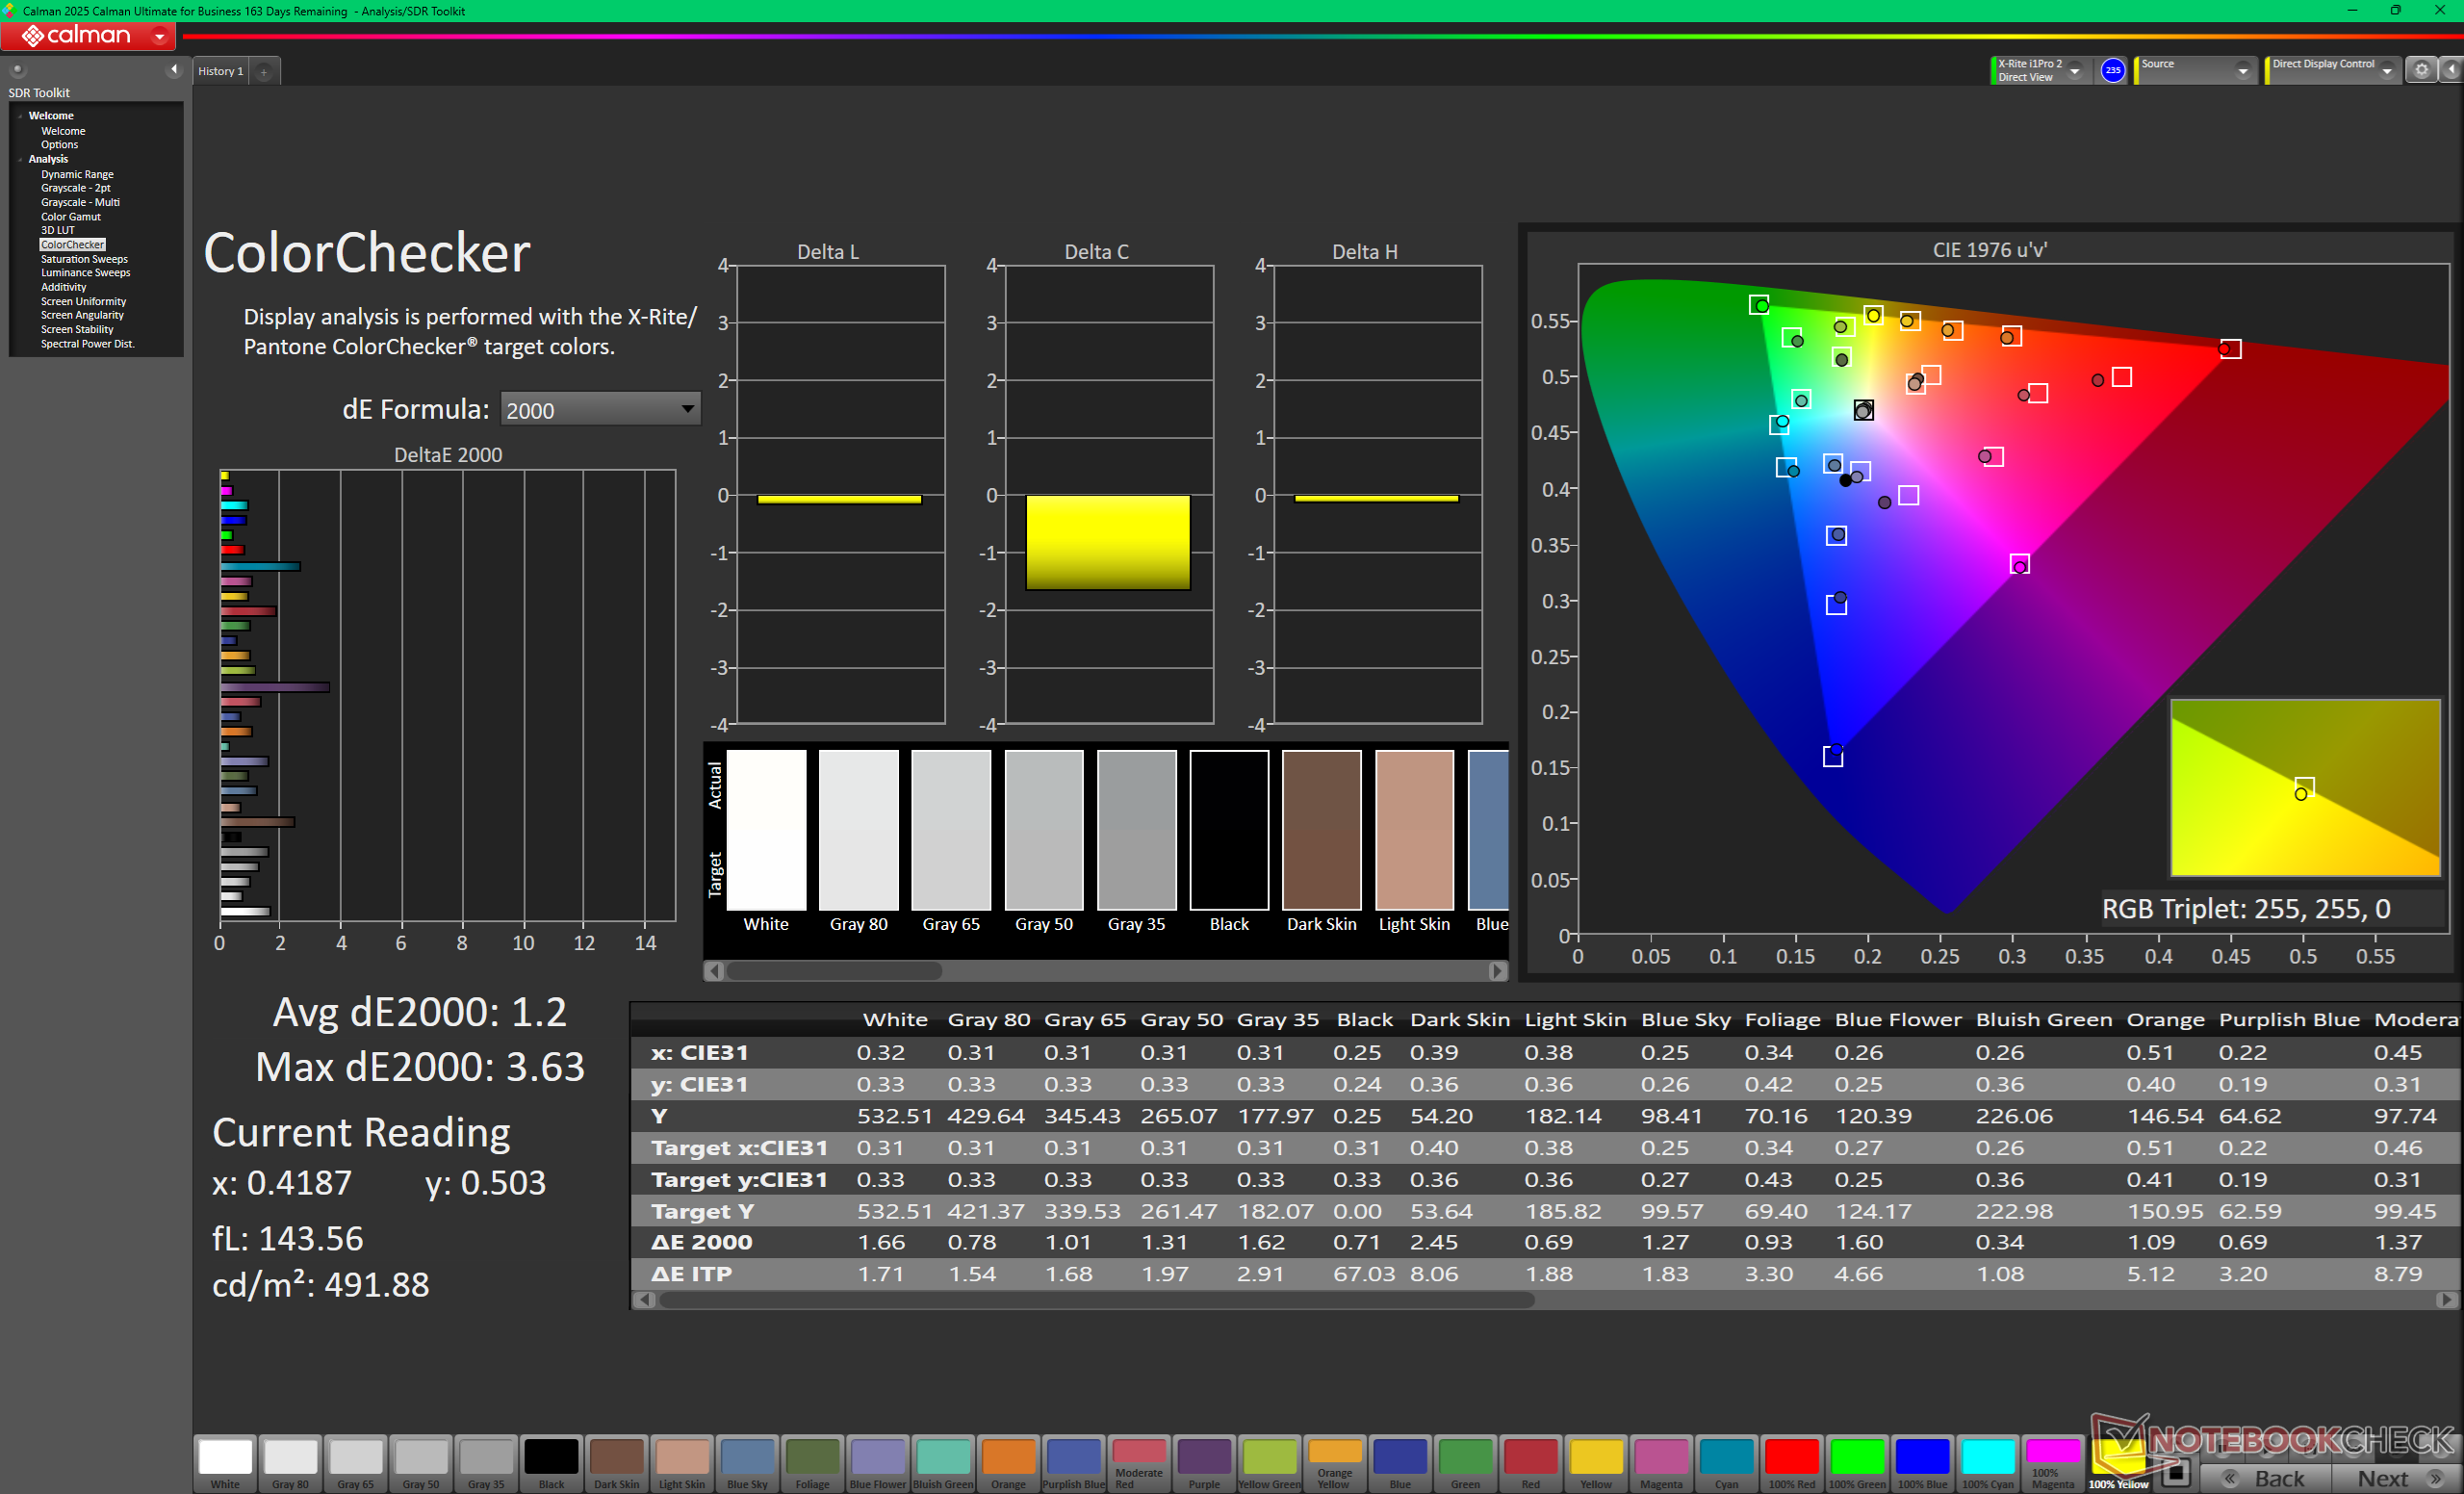
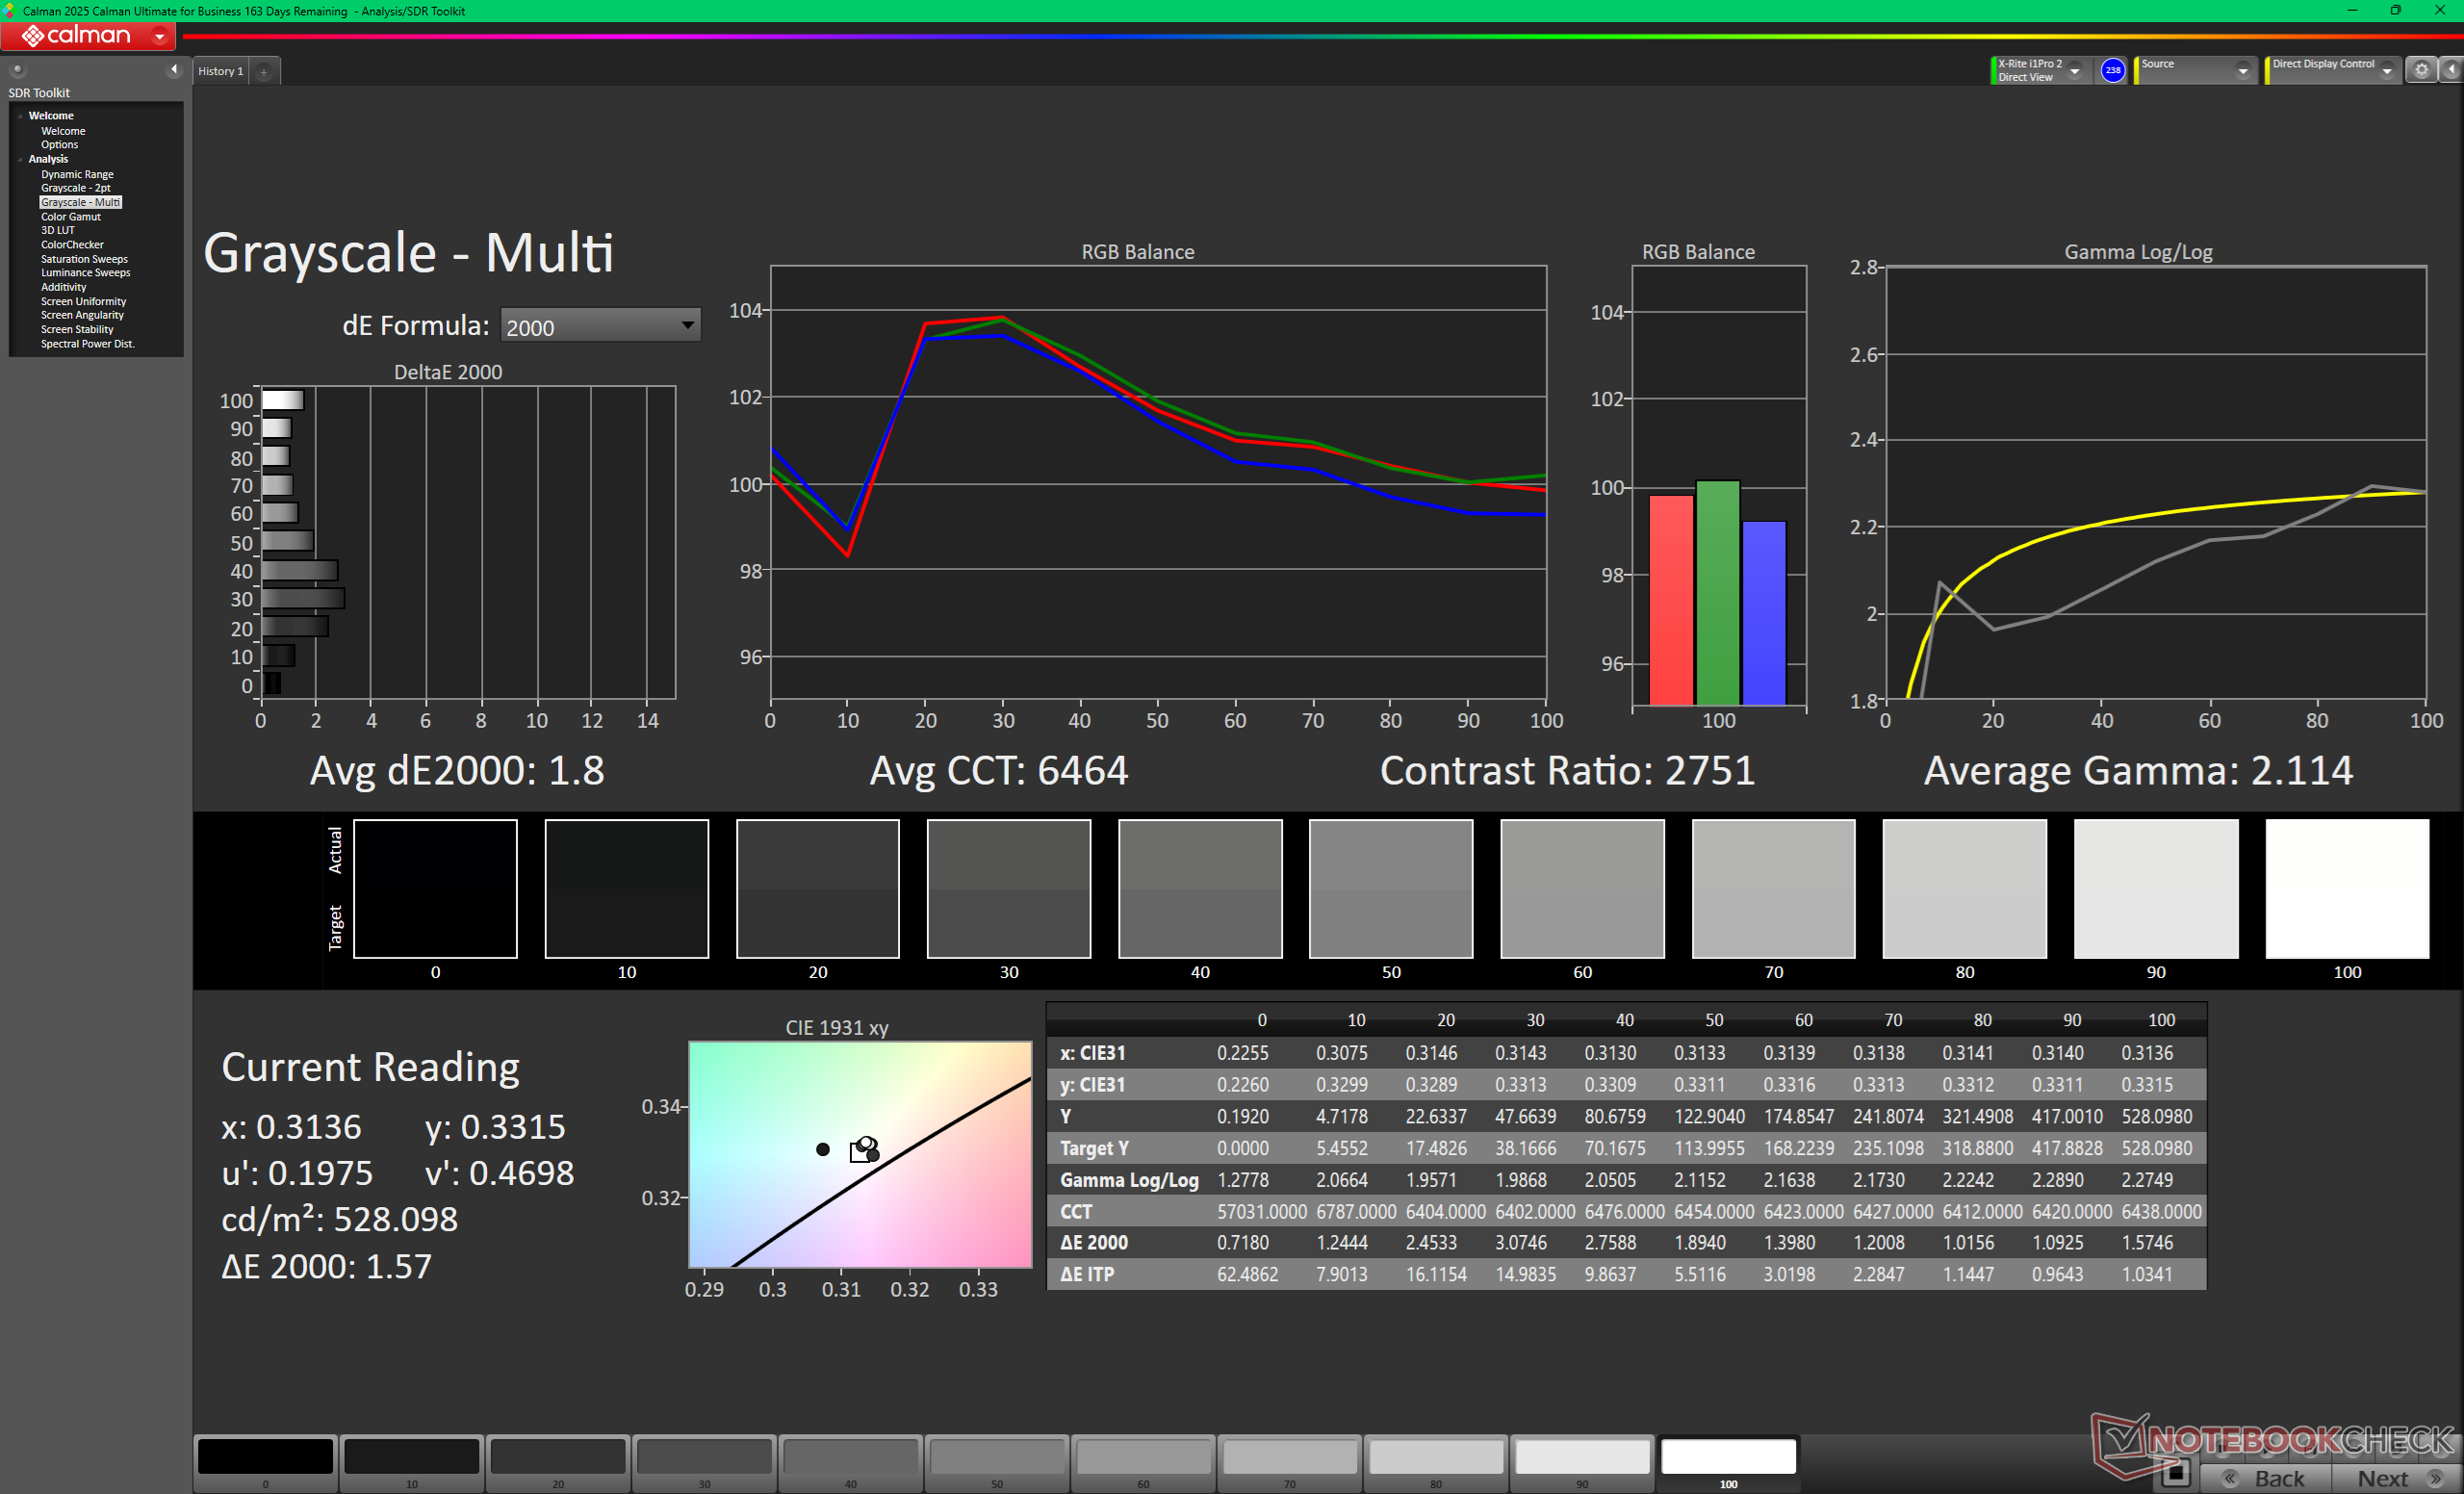
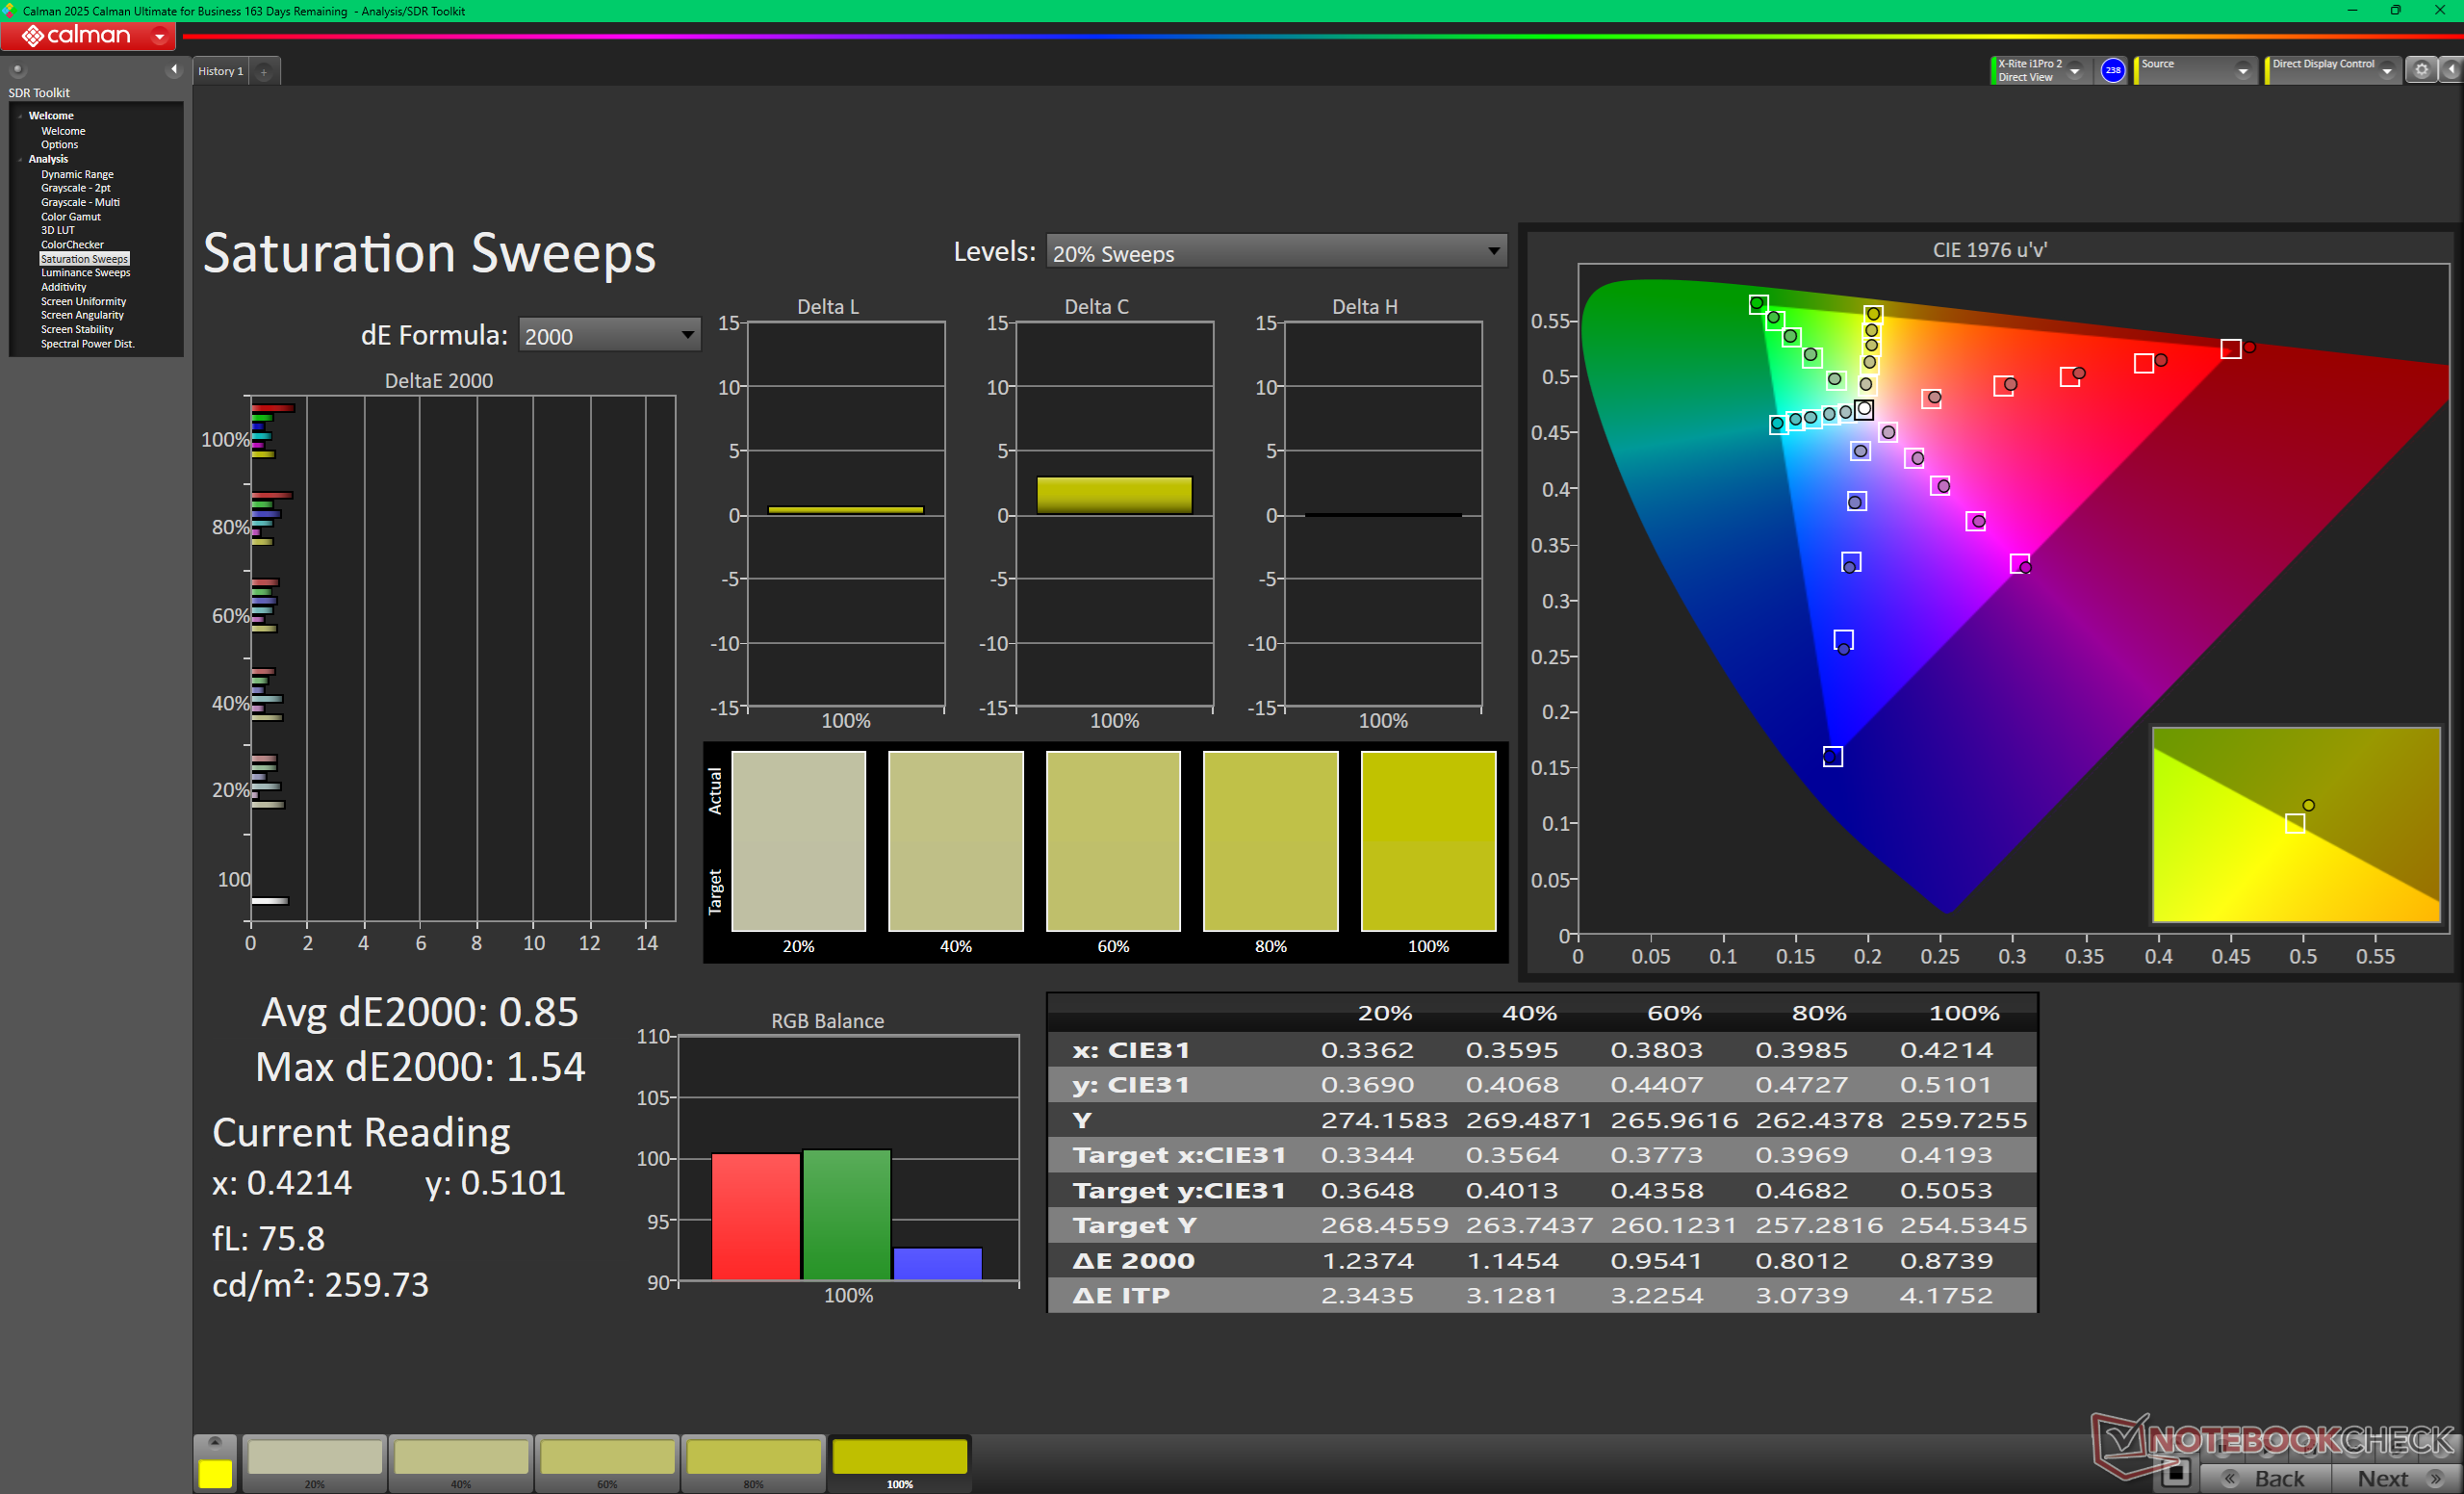
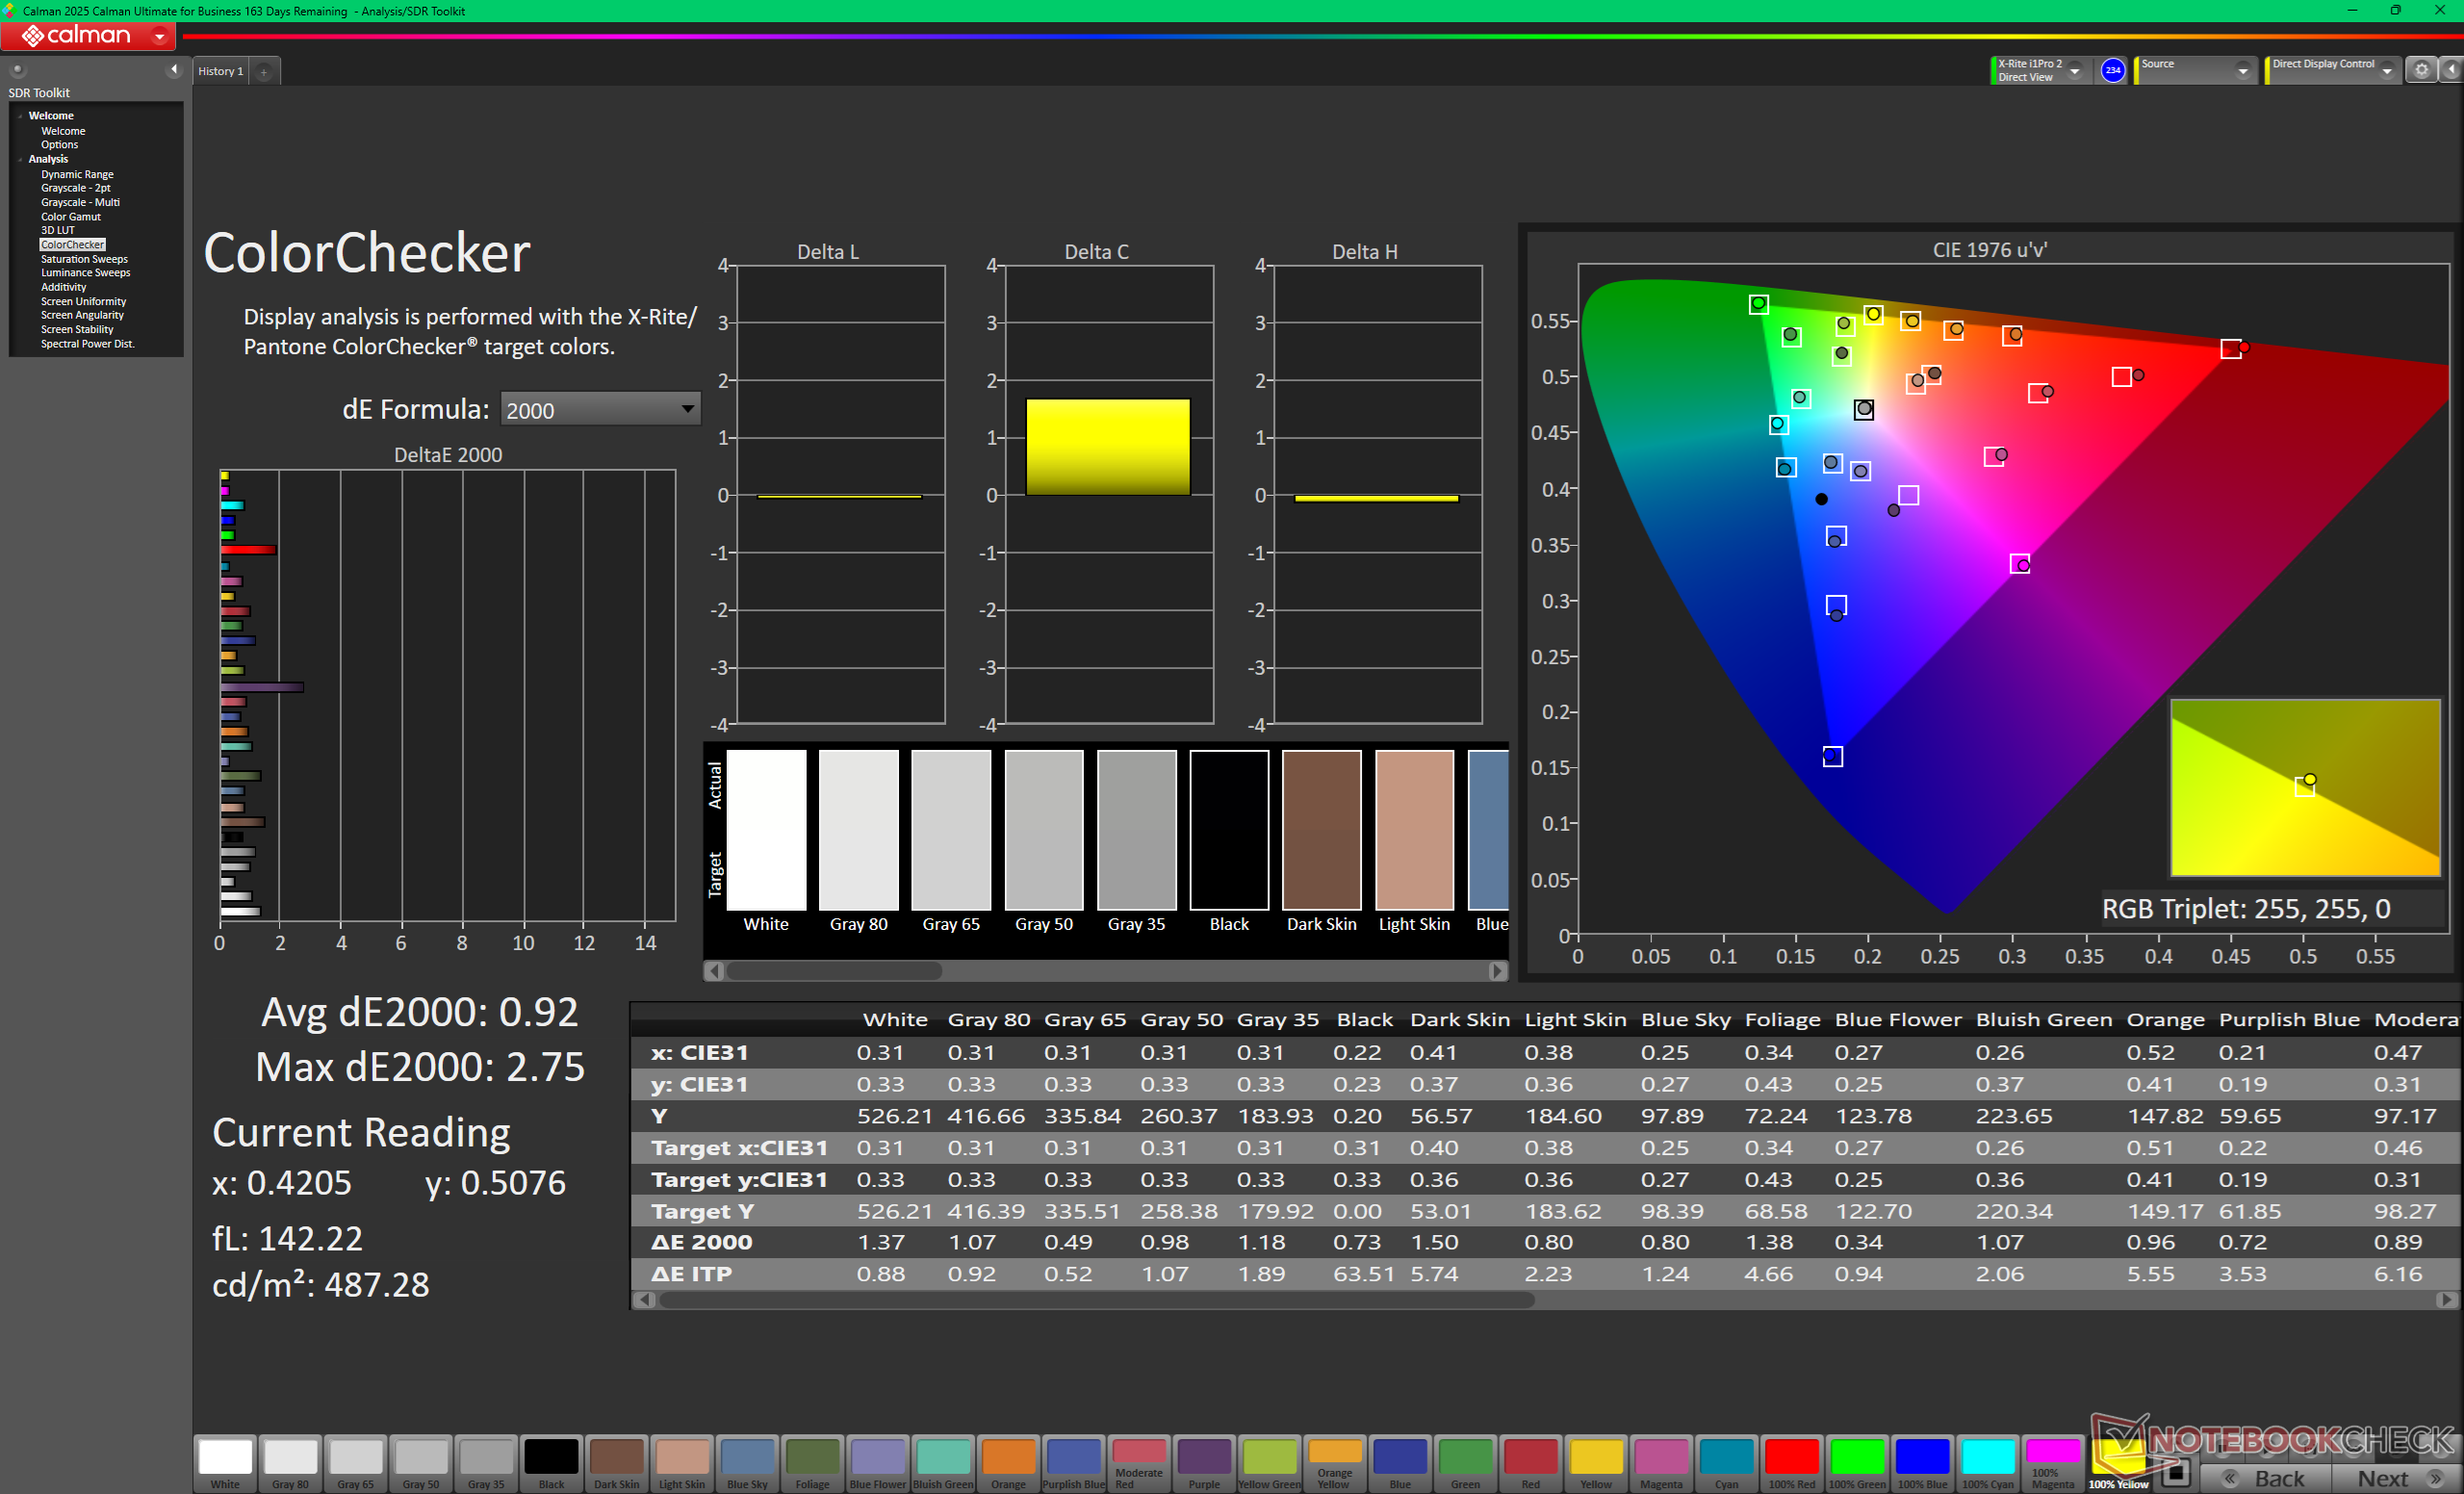
A Dell não economizou na tela sensível ao toque, apesar do baixo preço geral. Na verdade, esta é uma das melhores telas entre todos os subnotebooks de 13 polegadas vendidos por bem menos de US$ 1.000. As cores são calibradas e vibrantes, com cobertura superior a 95% do P3; o contraste é alto para um IPS, em cerca de 2.000:1; e o brilho é excelente, com mais de 500 nits. Seu suporte limitado a HDR e os tempos de resposta lentos entre preto e branco devem ter pouca importância para o público-alvo, composto por usuários de escritório e estudantes.

512.7
cd/m²
482.1
cd/m²
508.7
cd/m²
496.8
cd/m²
539.3
cd/m²
491.6
cd/m²
495.9
cd/m²
510.1
cd/m²
487.6
cd/m²
Distribuição do brilho
LG Philips LP134WQ testado com X-Rite i1Pro 3
Máximo: 539.3 cd/m² (Nits) Médio: 502.8 cd/m² Minimum: 0.64 cd/m²
iluminação: 89 %
iluminação com acumulador: 539.3 cd/m²
Contraste: 2157:1 (Preto: 0.25 cd/m²)
ΔE ColorChecker Calman: 1.2 | ∀{0.5-29.43 Ø4.71}
calibrated: 0.92
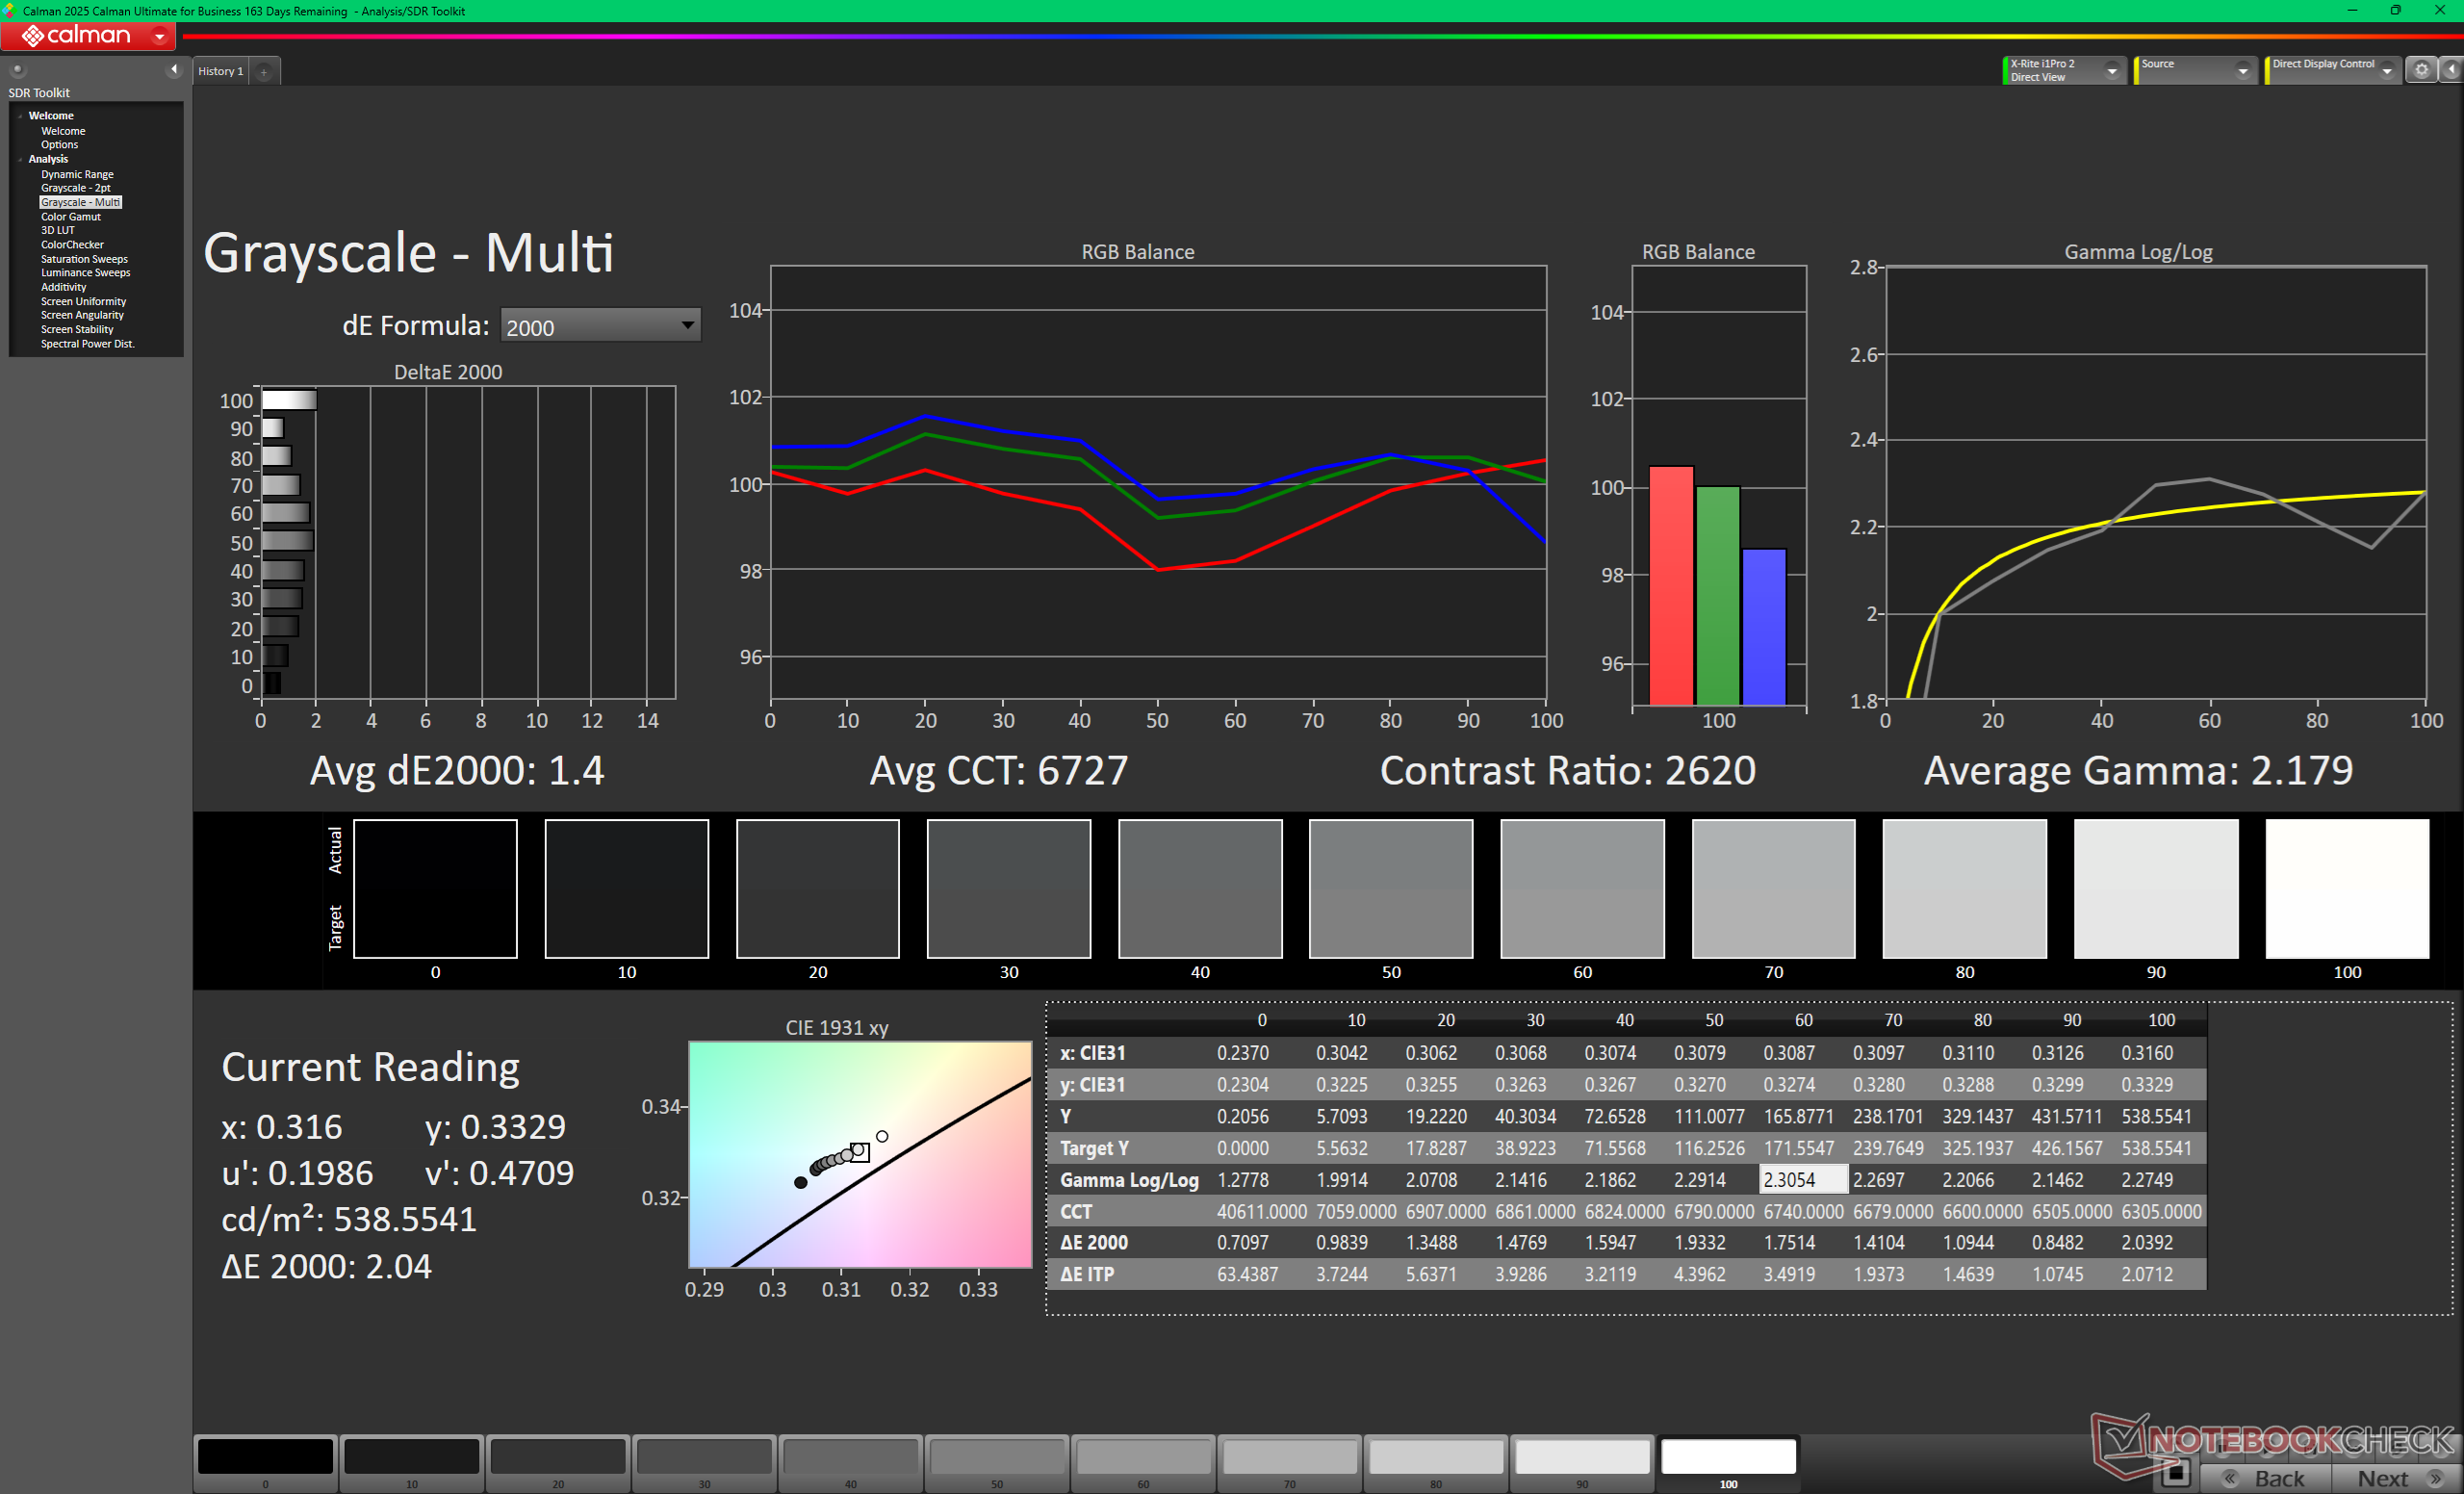
ΔE Greyscale Calman: 1.4 | ∀{0.09-98 Ø4.96}
87.6% AdobeRGB 1998 (Argyll 3D)
99.9% sRGB (Argyll 3D)
98.2% Display P3 (Argyll 3D)
Gamma: 2.2
CCT: 6727 K
Dell XPS 13 DX13260
LG Philips LP134WQ, IPS, 2560x1600, 13.4", 120 Hz
Dell XPS 14 Core Ultra X7 358H
LG Philips 140WT2, OLED, 2880x1800, 14", 120 Hz
Dell XPS 13 9350
LG Philips 134WU2, IPS, 1920x1200, 13.4", 120 Hz
Apple MacBook Neo 256 GB
IPS, 2408x1506, 13", 60 Hz
HP OmniBook 7 Aero 13-bg1077nr
LG Philips LGD0746, IPS, 1920x1200, 13.3", 60 Hz
Lenovo ThinkPad X1 Carbon Gen 14 21V70075GE
B140UAX01.1, IPS, 1920x1200, 14", 60 Hz
Display
5%
-18%
-15%
-19%
-16%
Display P3 Coverage (%)
98.2
99.7
2%
67.3
-31%
72.2
-26%
66.5
-32%
69.8
-29%
sRGB Coverage (%)
99.9
100
0%
99
-1%
97.9
-2%
96.8
-3%
99.1
-1%
AdobeRGB 1998 Coverage (%)
87.6
98.2
12%
68.6
-22%
72.6
-17%
67.3
-23%
72
-18%
Response Times
98%
25%
58%
13%
33%
Response Time Grey 50% / Grey 80% * (ms)
51.2 ?(23.6, 27.6)
0.75 ?(0.43, 0.32)
99%
37.3 ?(17, 20.3)
27%
20.8 ?(9.2, 11.6)
59%
44.7 ?(20.3, 24.4)
13%
42 ?(19.4, 22.6)
18%
Response Time Black / White * (ms)
33.6 ?(14, 19.6)
1.03 ?(0.53, 0.5)
97%
25.9 ?(12.5, 13.4)
23%
14.6 ?(4.3, 10.3)
57%
29.7 ?(14.8, 14.9)
12%
17.7 ?(7.2, 10.5)
47%
PWM Frequency (Hz)
240.62 ?(100)
PWM Amplitude * (%)
29
Screen
-9%
6%
-14%
-94%
-122%
Brightness middle (cd/m²)
539.3
393.8
-27%
462.8
-14%
548
2%
442
-18%
540
0%
Brightness (cd/m²)
503
389
-23%
435
-14%
519
3%
420
-17%
524
4%
Brightness Distribution (%)
89
96
8%
87
-2%
91
2%
88
-1%
93
4%
Black Level * (cd/m²)
0.25
0.19
24%
0.48
-92%
0.3
-20%
0.3
-20%
Contrast (:1)
2157
2436
13%
1142
-47%
1473
-32%
1800
-17%
Colorchecker dE 2000 *
1.2
1.27
-6%
1.92
-60%
1.4
-17%
4.34
-262%
5
-317%
Colorchecker dE 2000 max. *
3.63
3.35
8%
3.45
5%
3.1
15%
9.71
-167%
12.2
-236%
Colorchecker dE 2000 calibrated *
0.92
0.71
23%
0.48
48%
0.4
57%
0.58
37%
1.1
-20%
Greyscale dE 2000 *
1.4
2
-43%
0.6
57%
2.1
-50%
6.5
-364%
8.3
-493%
Gamma
2.2 100%
2.19 100%
2.19 100%
2.24 98%
2.13 103%
2.22 99%
CCT
6727 97%
6379 102%
6539 99%
6870 95%
7466 87%
7068 92%
Média Total (Programa/Configurações)
31% / 13%
4% / 4%
10% / -4%
-33% / -63%
-35% / -77%

* ... menor é melhor

vs. sRGB
vs. sRGB
vs. P3
vs. P3
Escala de cinza antes da calibração
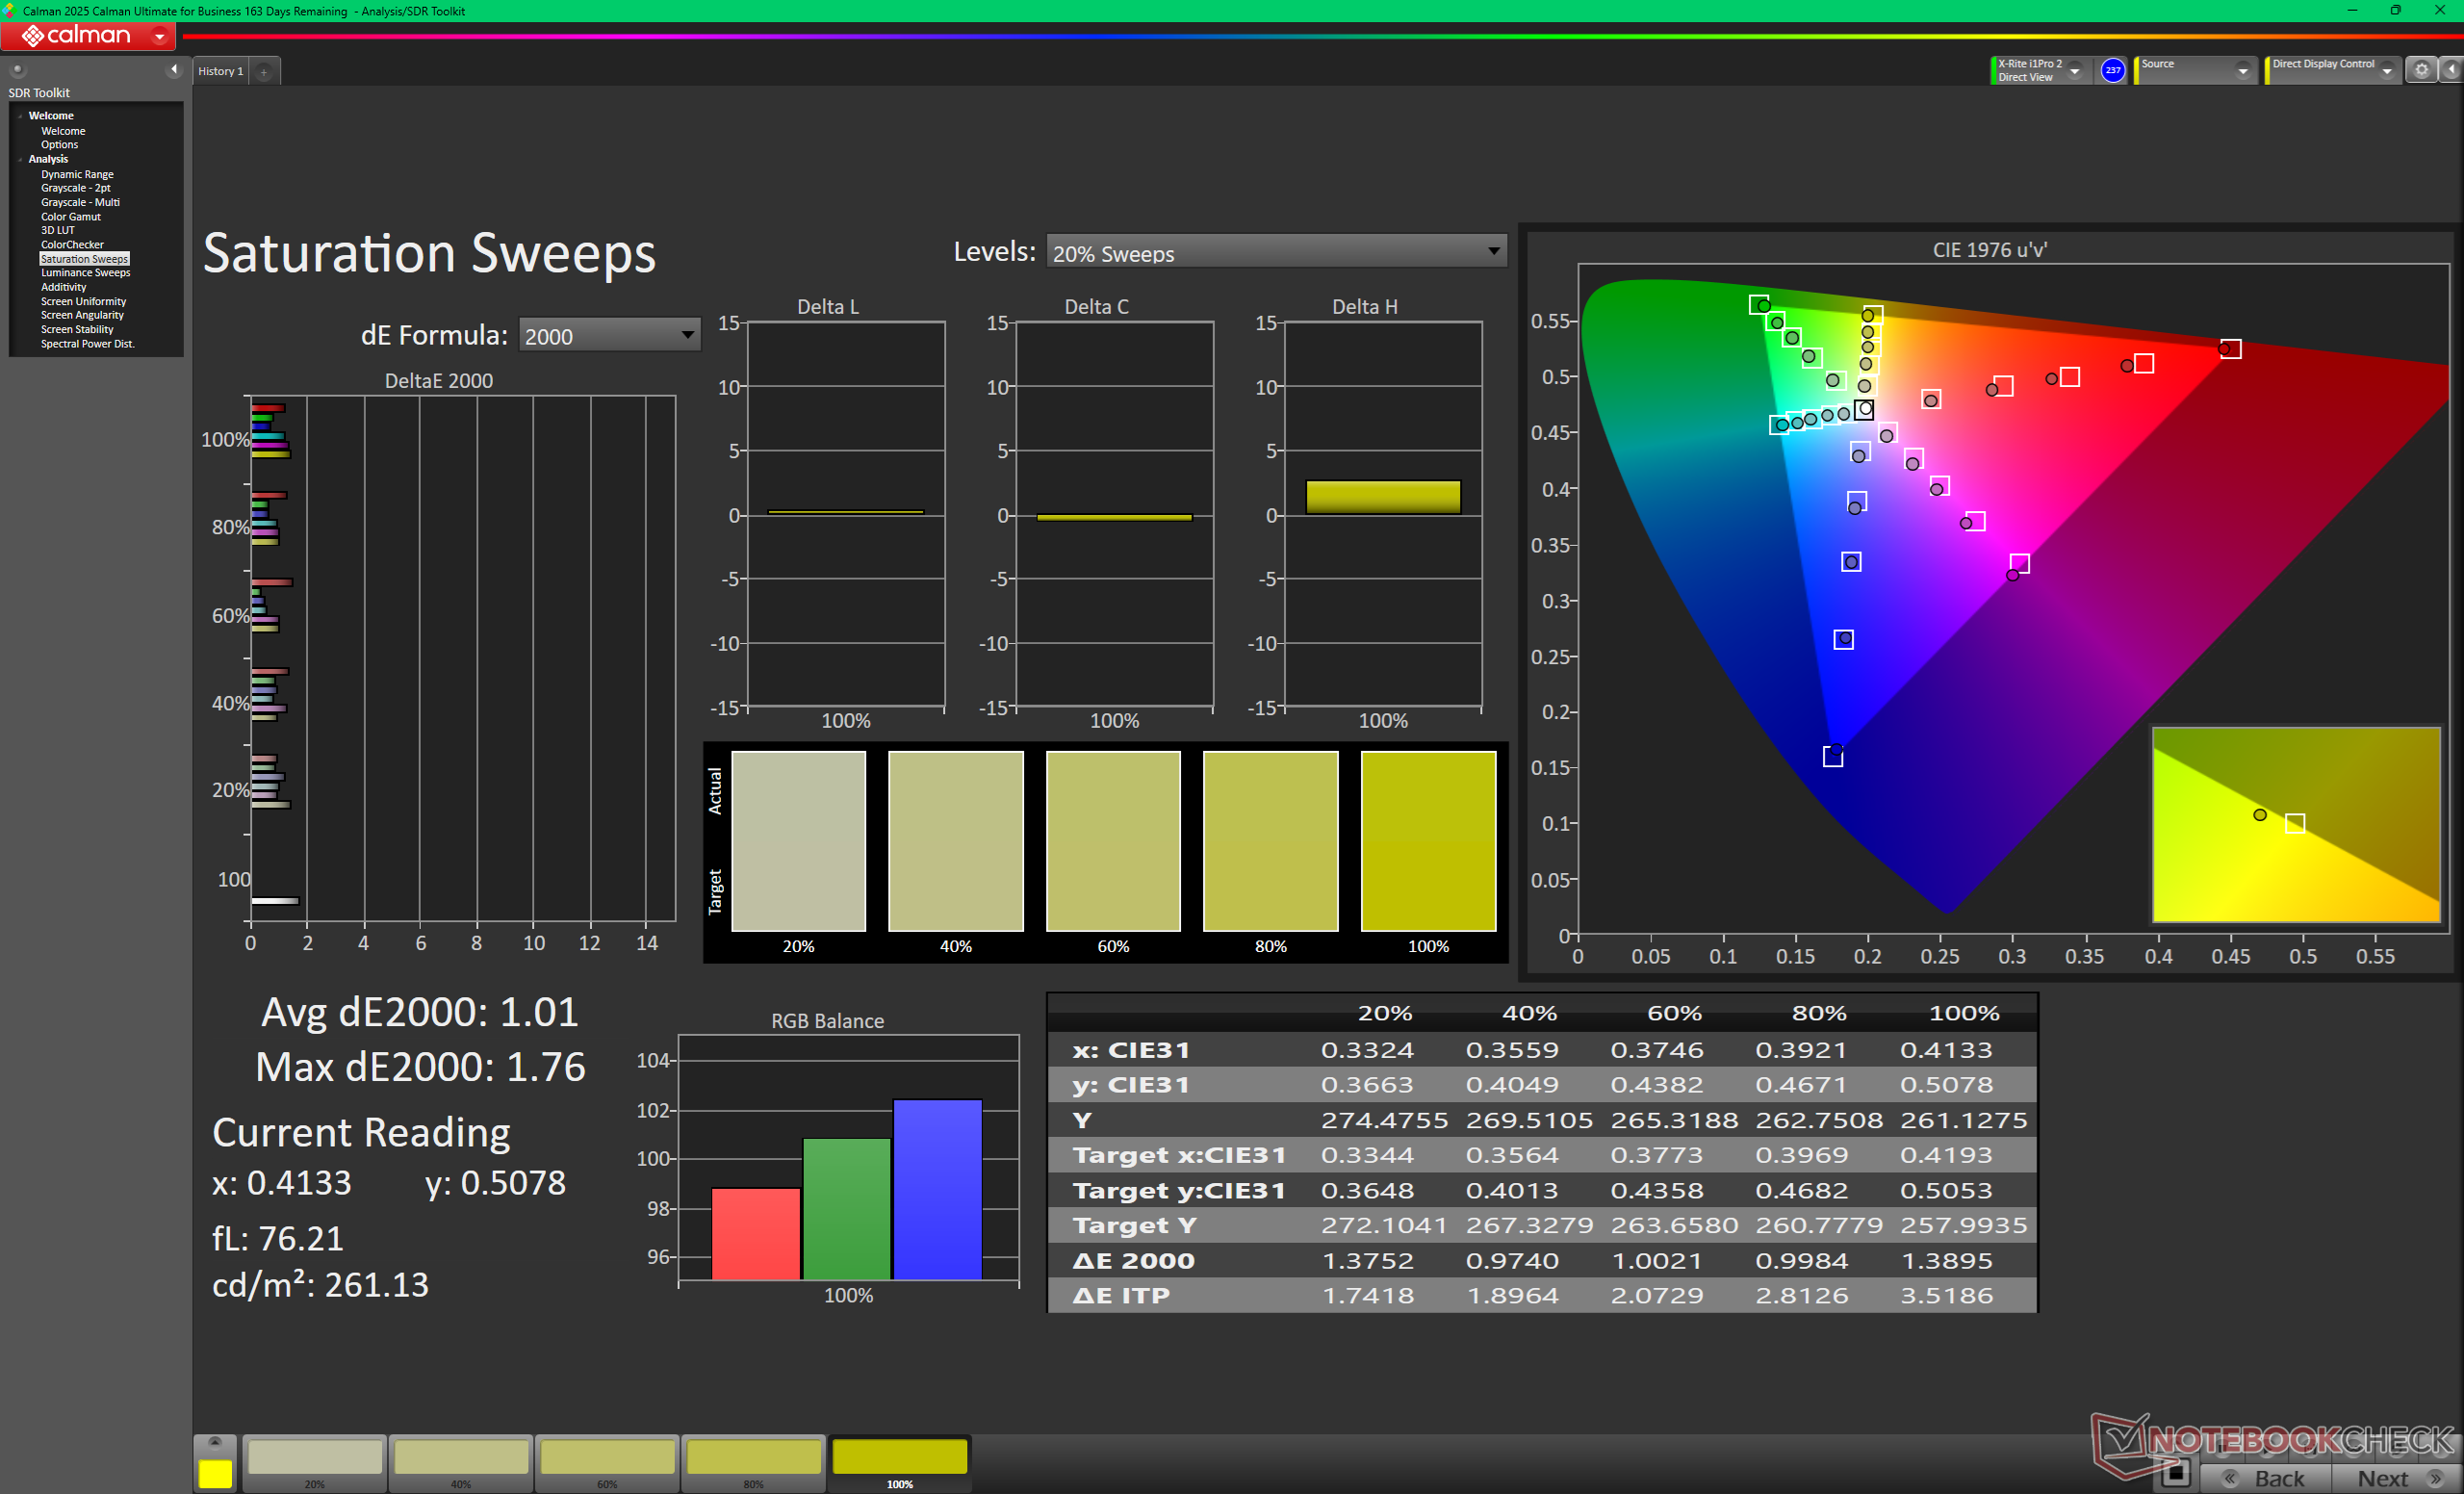
Varreduras de saturação antes da calibração
ColorChecker antes da calibração
Escala de cinza após a calibração
Varreduras de saturação após a calibração
ColorChecker após a calibração

Exibir tempos de resposta

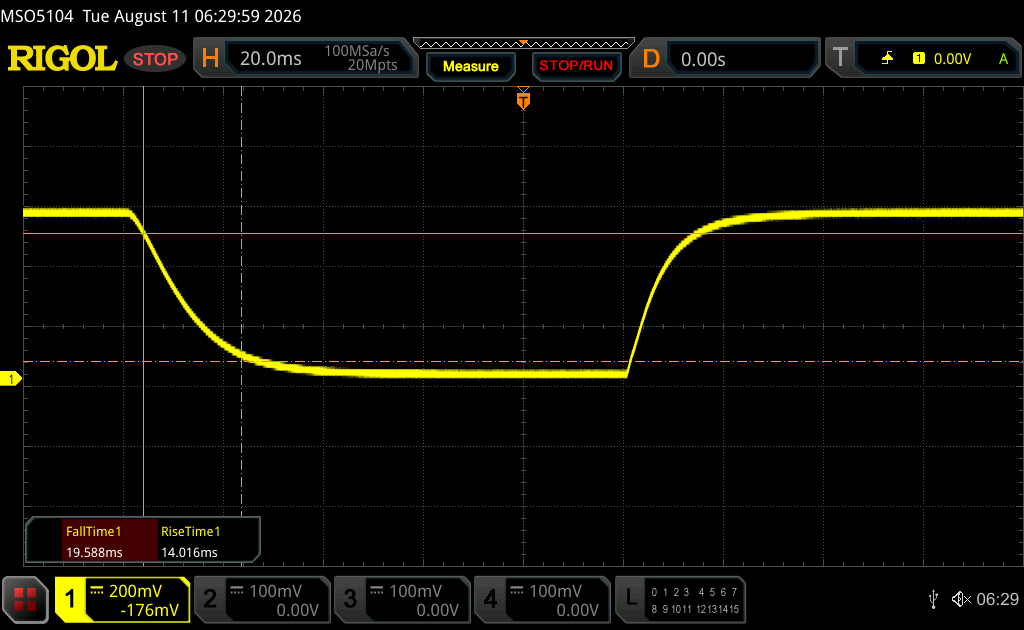
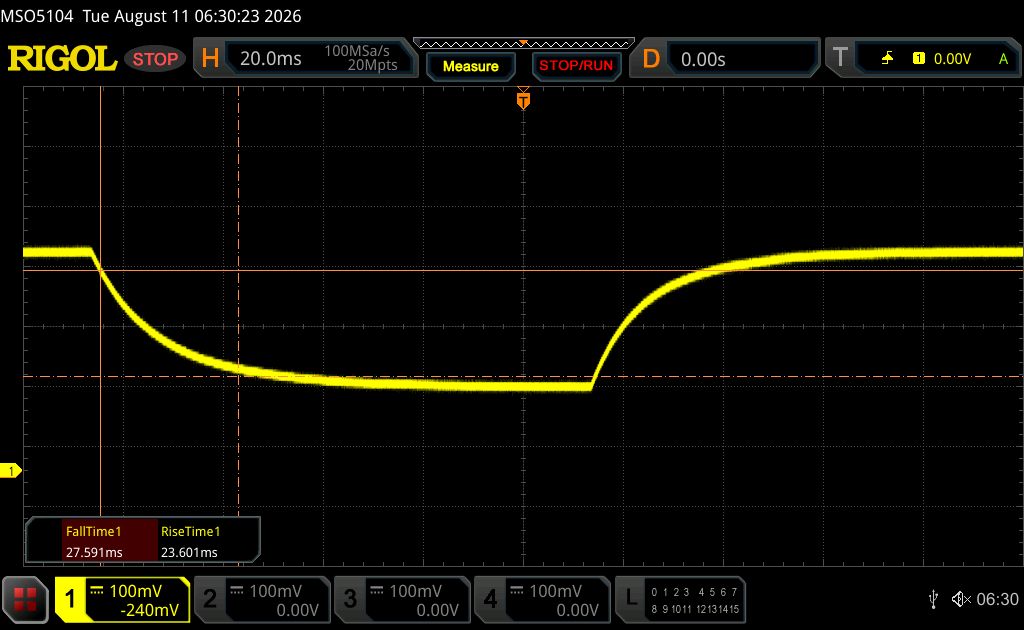
Os tempos de resposta do display mostram a rapidez com que a tela é capaz de mudar de uma cor para outra. Tempos de resposta lentos podem gerar imagens residuais e fazer com que objetos em movimento pareçam desfocados (fantasmas). Os jogadores de títulos 3D de ritmo acelerado devem prestar atenção especial aos tempos de resposta rápidos.
       Tempo de resposta preto para branco
33.6 ms ... ascensão ↗ e queda ↘ combinadas↗ 14 ms ascensão
↘ 19.6 ms queda
A tela mostra taxas de resposta lentas em nossos testes e será insatisfatória para os jogadores.
Em comparação, todos os dispositivos testados variam de 0.1 (mínimo) a 240 (máximo) ms. » 90 % de todos os dispositivos são melhores.
Isso significa que o tempo de resposta medido é pior que a média de todos os dispositivos testados (19.8 ms).
       Tempo de resposta 50% cinza a 80% cinza
51.2 ms ... ascensão ↗ e queda ↘ combinadas↗ 23.6 ms ascensão
↘ 27.6 ms queda
A tela mostra taxas de resposta lentas em nossos testes e será insatisfatória para os jogadores.
Em comparação, todos os dispositivos testados variam de 0.165 (mínimo) a 636 (máximo) ms. » 88 % de todos os dispositivos são melhores.
Isso significa que o tempo de resposta medido é pior que a média de todos os dispositivos testados (30.9 ms).

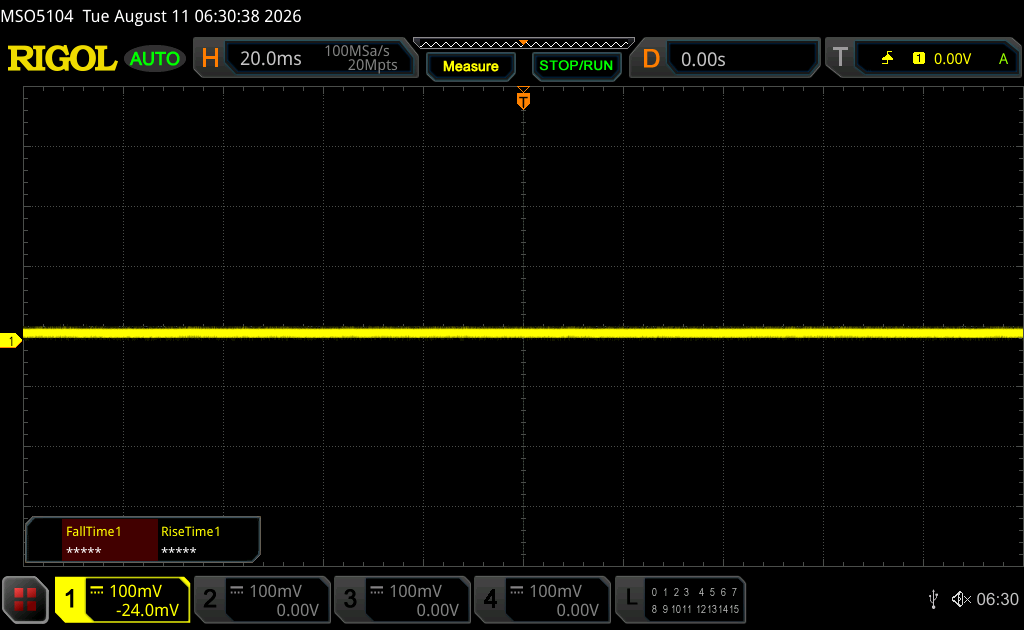
Cintilação da tela / PWM (modulação por largura de pulso)

Para escurecer a tela, alguns notebooks simplesmente ligam e desligam a luz de fundo em rápida sucessão - um método chamado Modulação por Largura de Pulso (PWM). Idealmente, esta frequência de ciclagem deve ser indetectável ao olho humano. Se a frequência for muito baixa, os usuários com olhos sensíveis podem sentir cansaço ou dores de cabeça ou até mesmo notar a oscilação total.
Tela tremeluzindo / PWM não detectado

[pwm_comparison] Em comparação: 52 % de todos os dispositivos testados não usam PWM para escurecer a tela. Se PWM foi detectado, uma média de 7735 (mínimo: 5 - máximo: 343500) Hz foi medida.

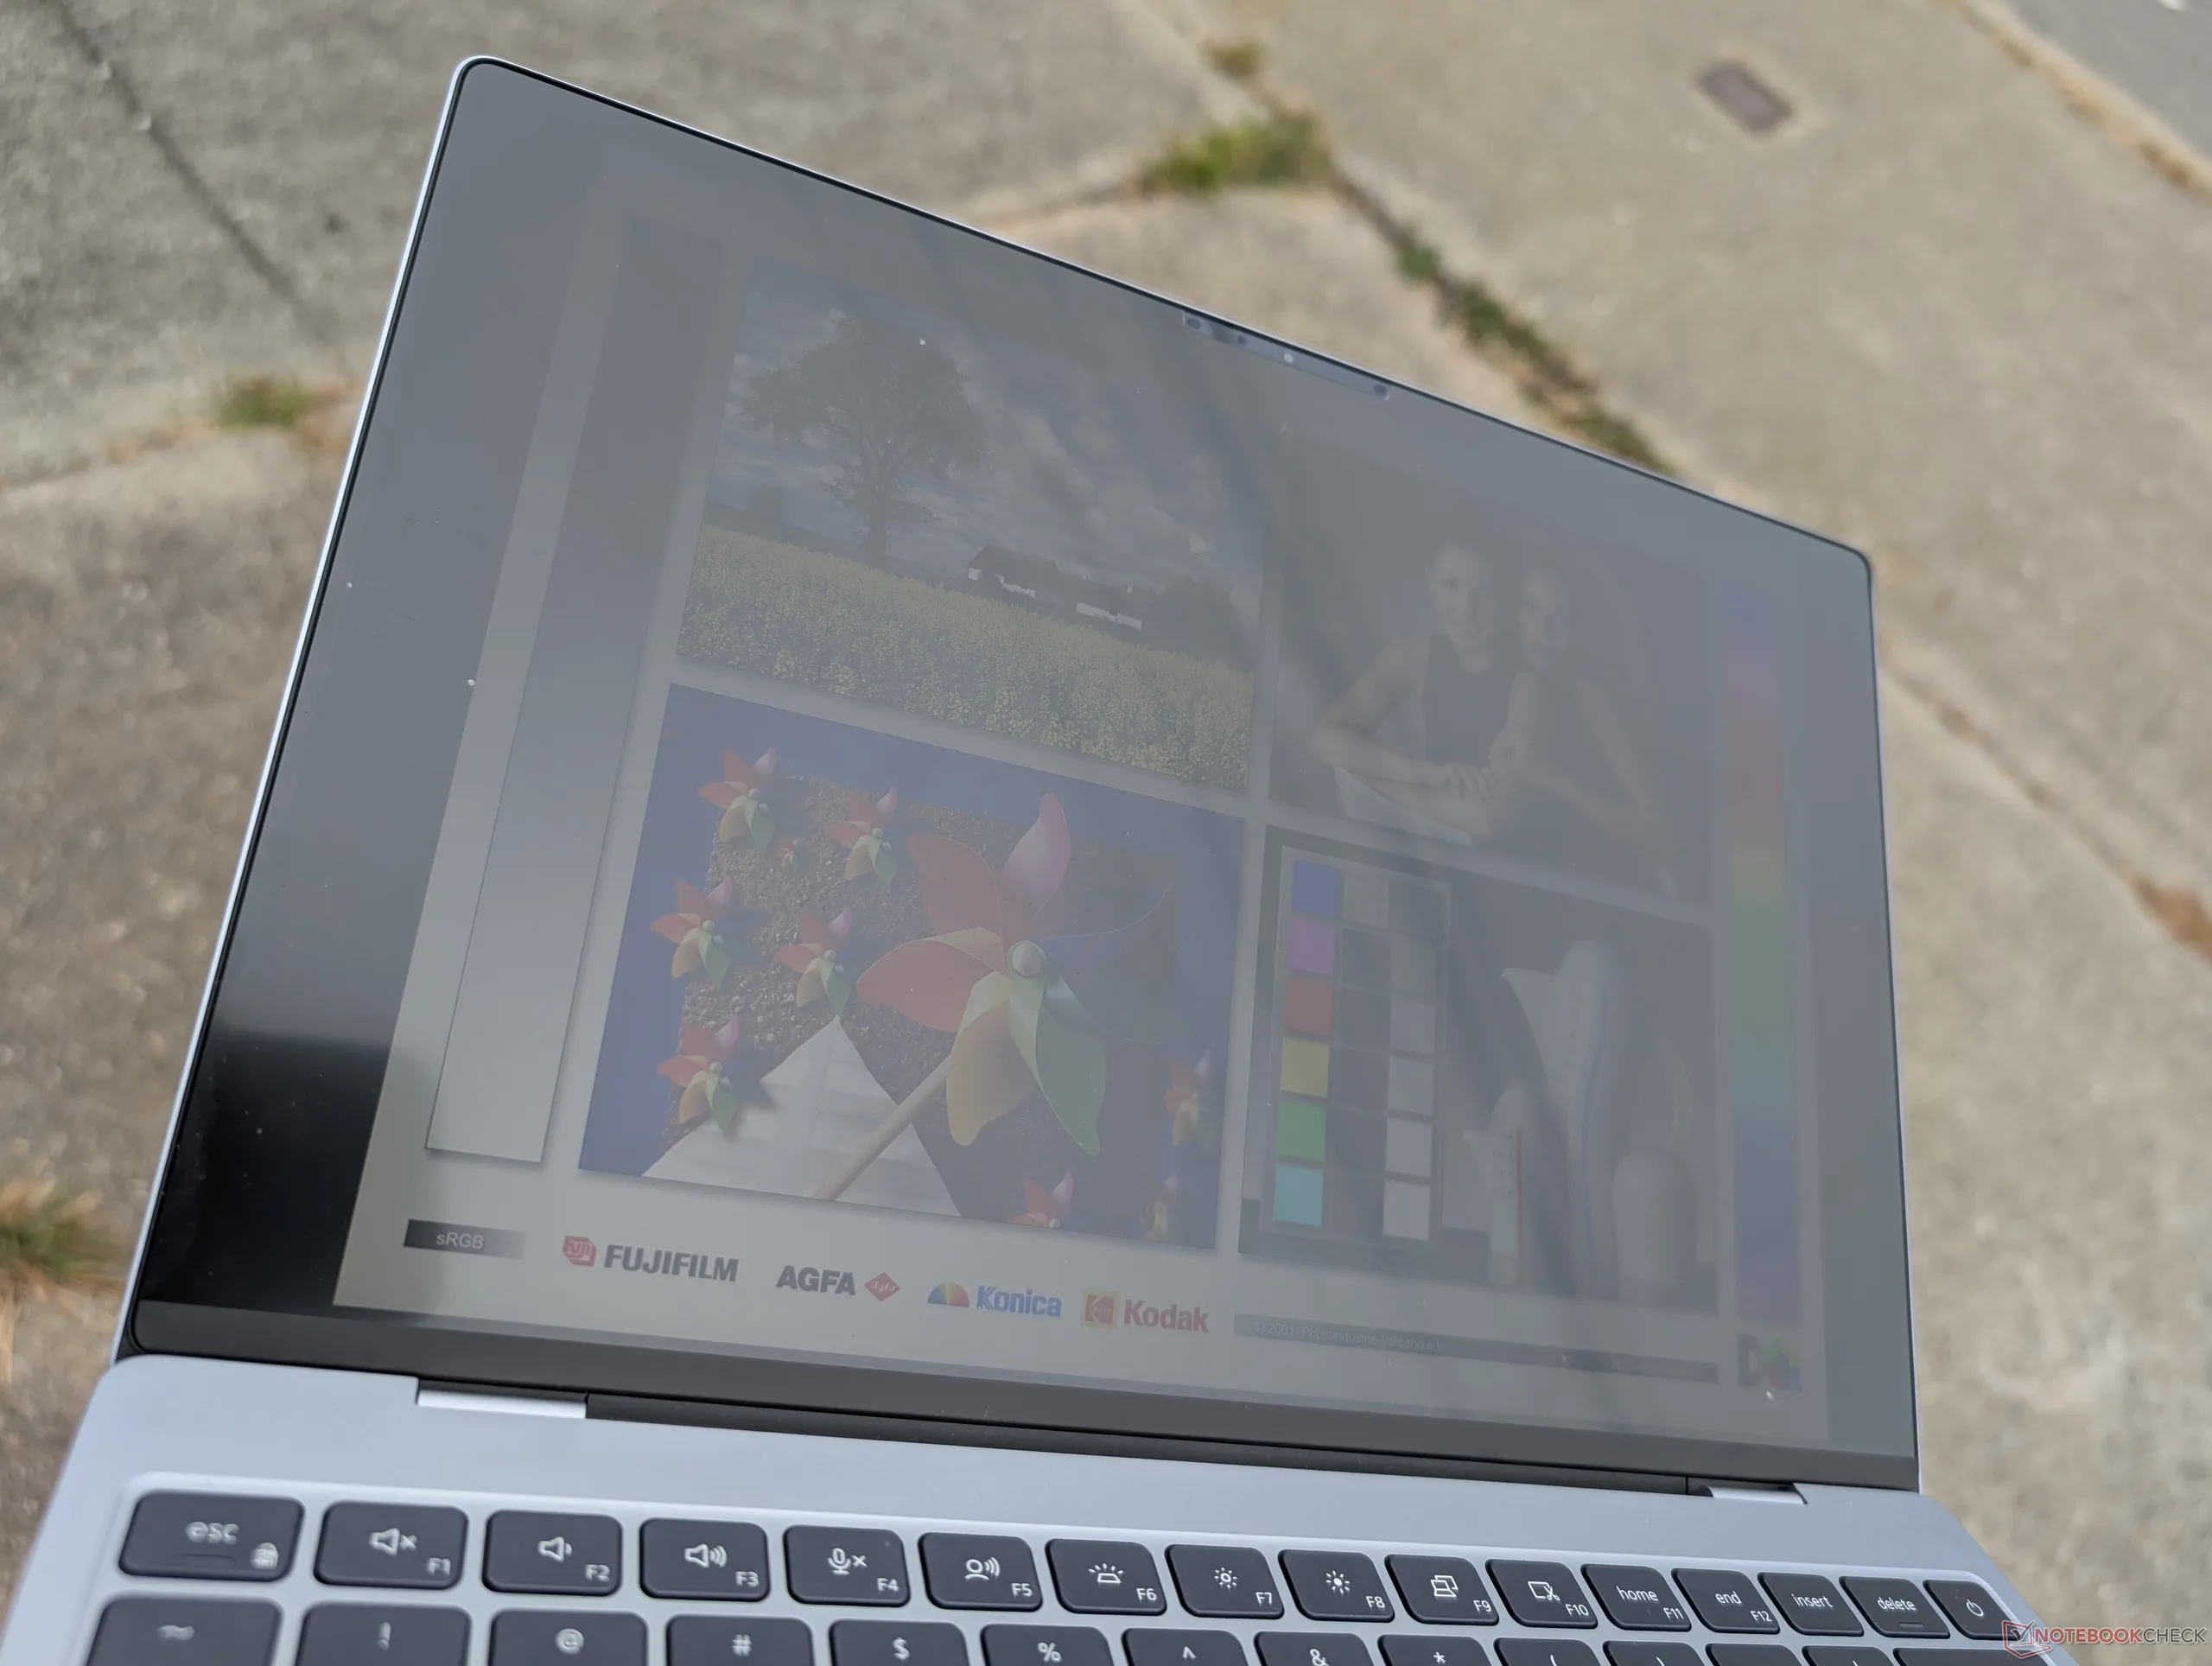
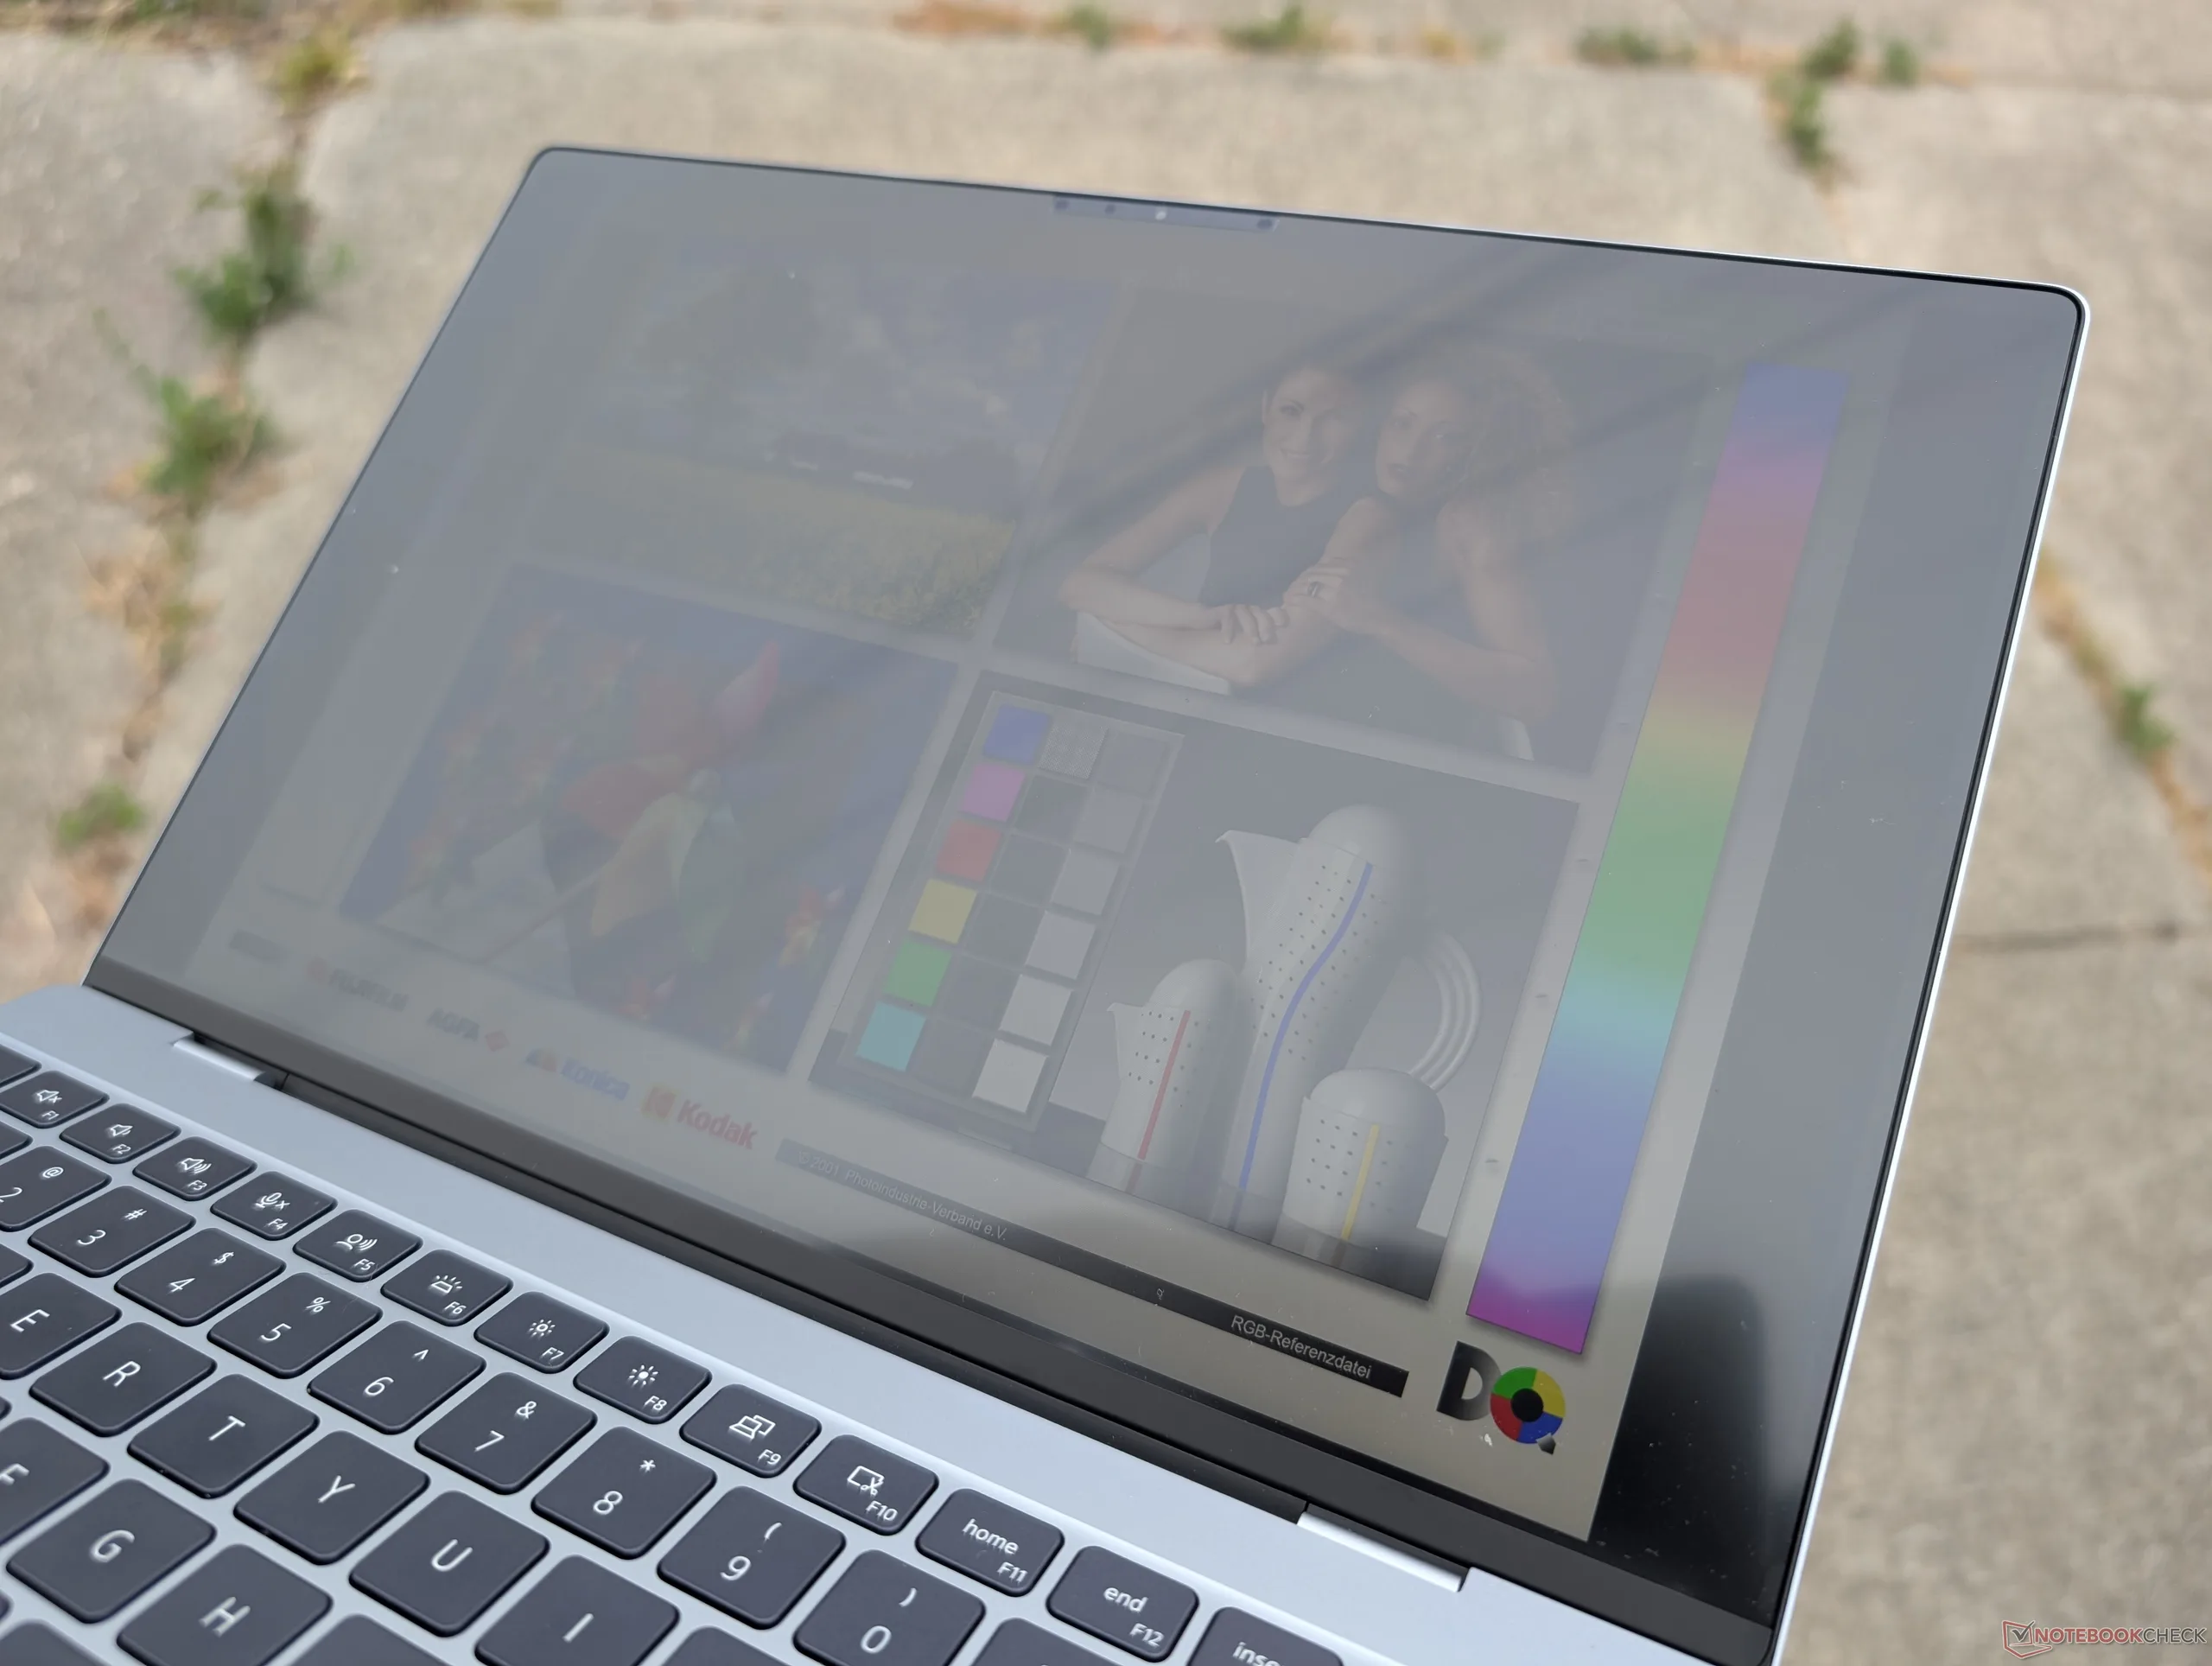
Ao ar livre, sob um céu nublado e claro
Boa visibilidade ao ar livre quando sob sombra
Ao ar livre, sob um céu nublado e claro
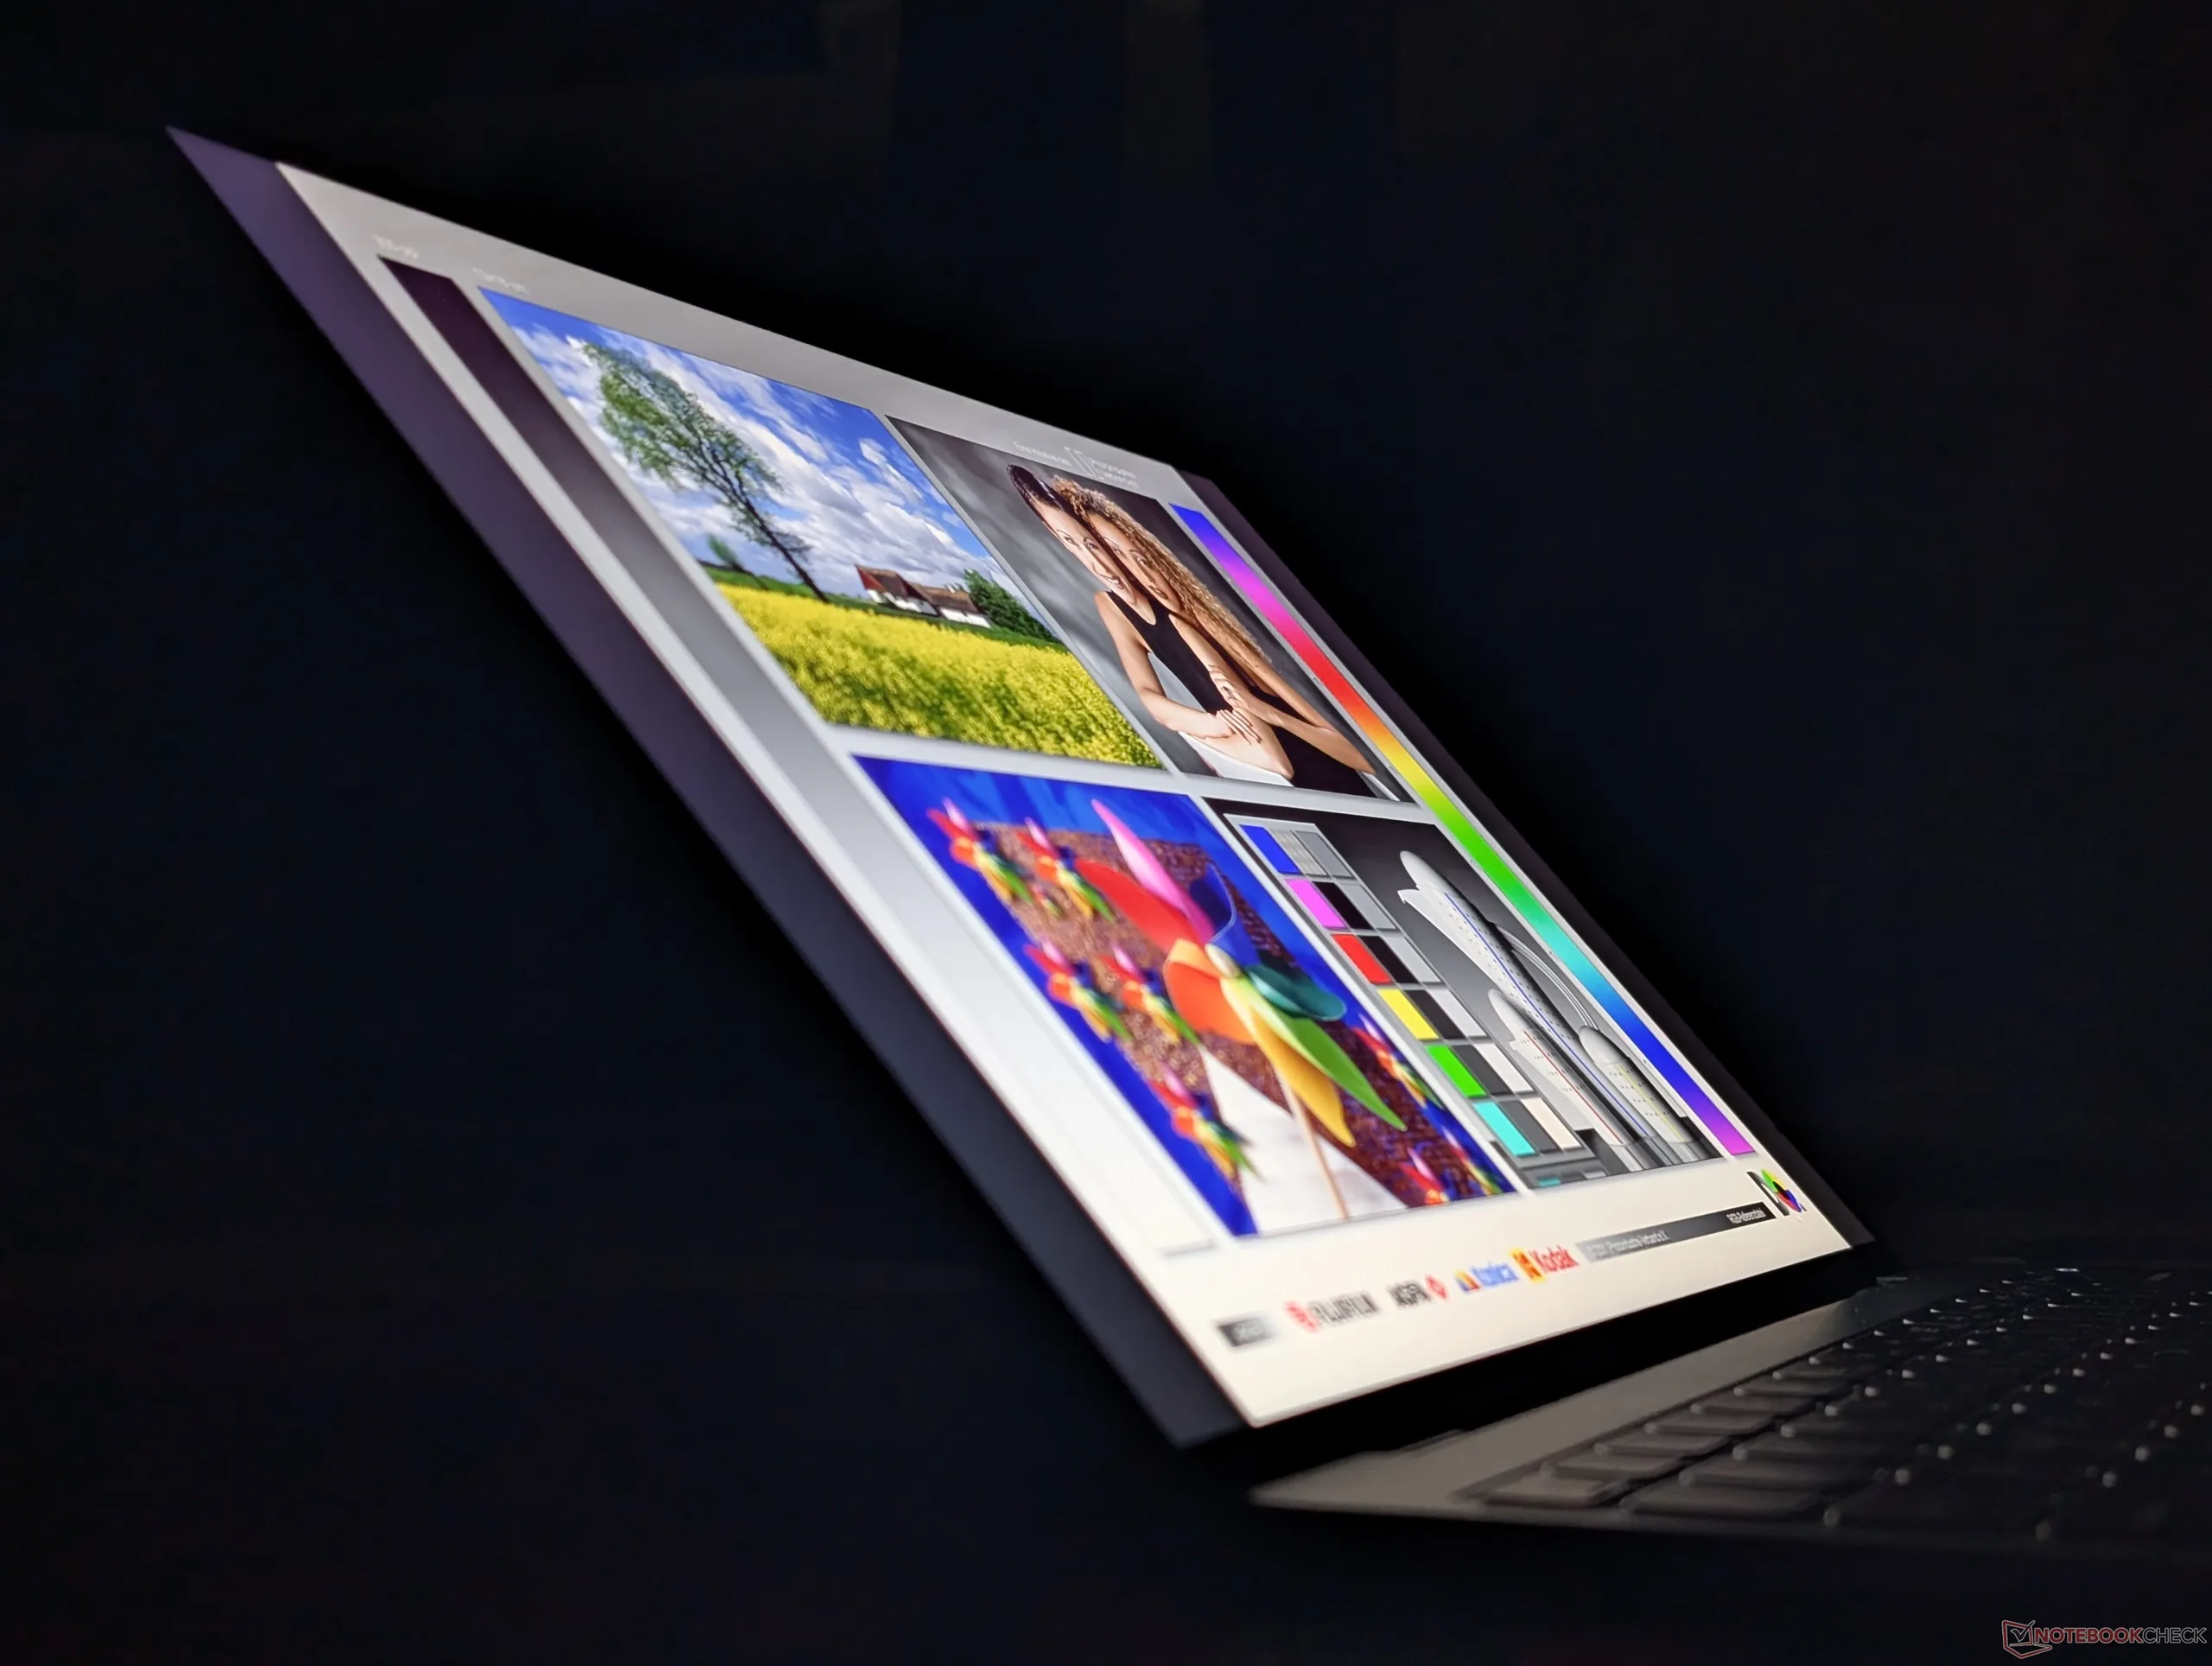
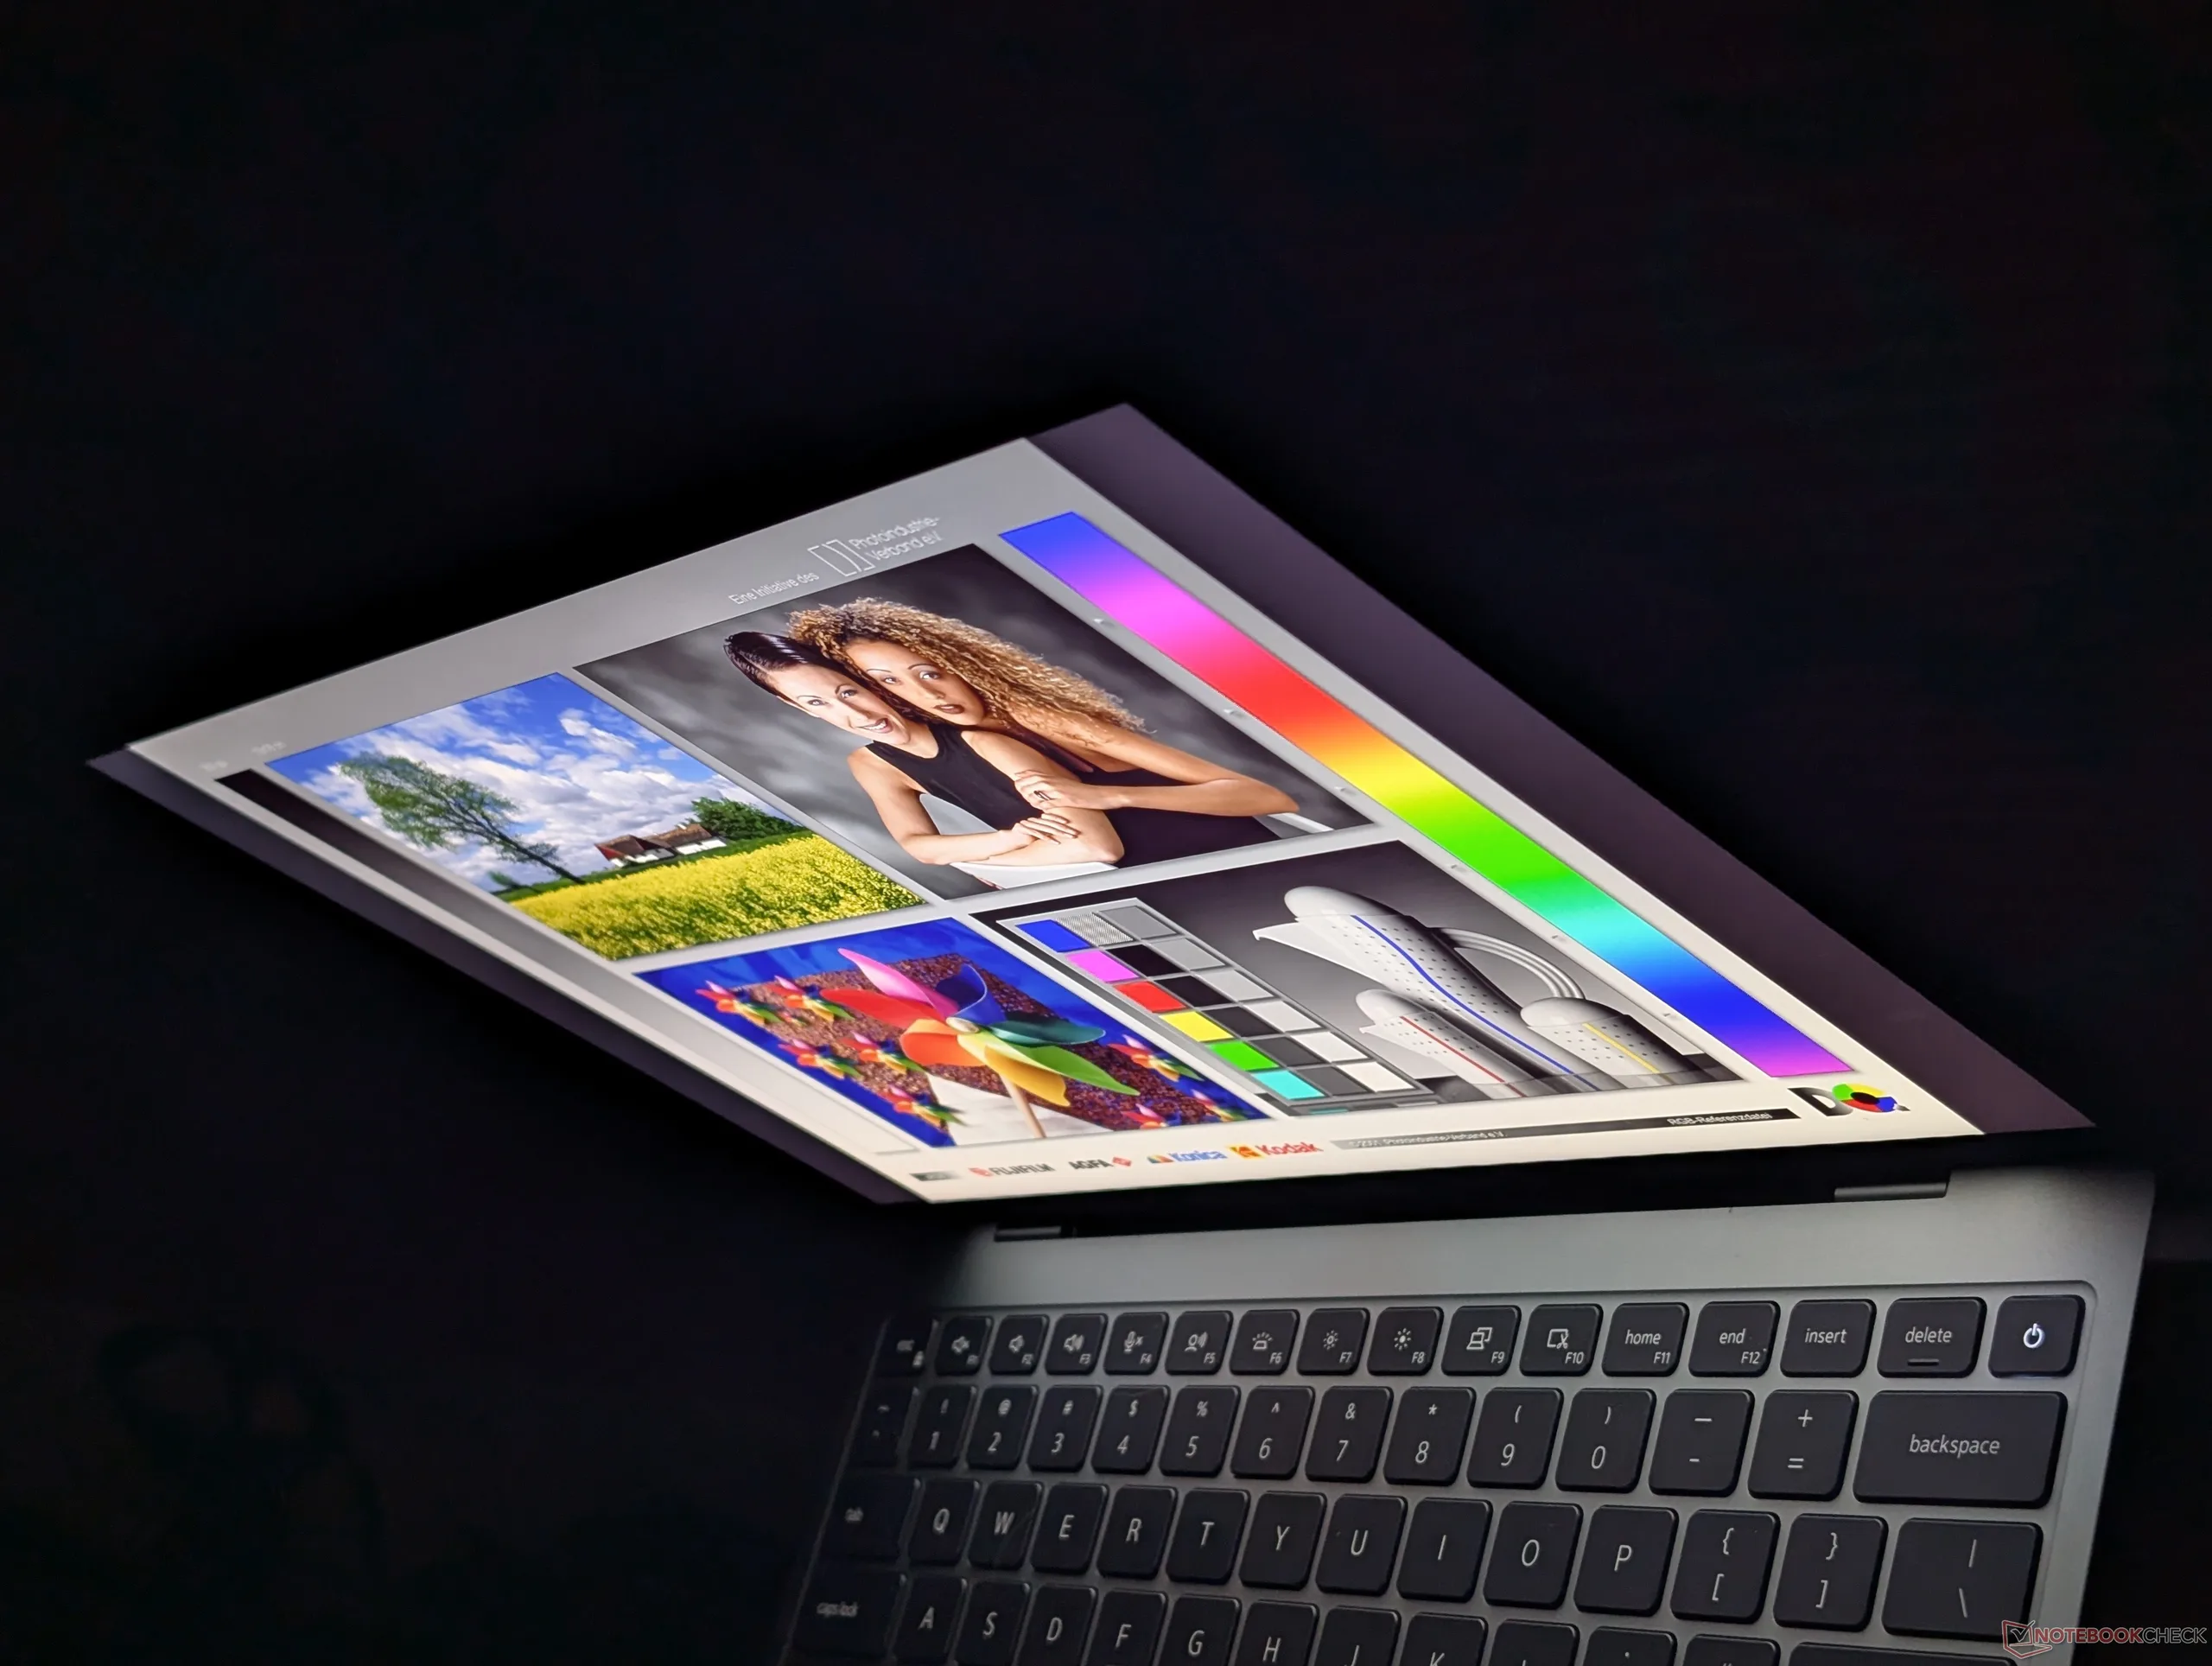
Amplos ângulos de visão IPS

Desempenho

Condições de teste

Configuramos o Windows no modo “Equilibrado”, conforme recomendado pelo fabricante, antes de executar os testes de desempenho abaixo.

Desempenho do processador

O desempenho bruto em multithreading do Core 5 320 é apenas ligeiramente mais rápido do que o do Core i7-1185G7, lançado há cinco anos. A atualização para o Core Ultra 7 355 pode valer a pena para usuários que realizam multitarefas mais exigentes, pois aumentaria significativamente o desempenho em multithreading em mais de 80%.

Cinebench R15 Multi Loop

065130195260325390455520585650715780845910975104011051170123513001365143014951560162516901755182018851950201520802145221022752340240524702535260026652730279528602925299030553120Tooltip
Dell XPS 13 DX13260 Intel Core 5 320: Ø940 (856.35-1053.52) Points
Dell XPS 14 Core Ultra X7 358H Intel Core Ultra X7 358H: Ø2340 (2099.85-3134.55) Points
Dell XPS 13 9350 Intel Core Ultra 7 256V: Ø1415 (1369.16-1569.86) Points
HP OmniBook 7 Aero 13-bg1077nr AMD Ryzen AI 7 350: Ø1989 (1917.36-2037.7) Points
Lenovo ThinkPad X1 Carbon Gen 14 21V70075GE Intel Core Ultra 5 325: Ø1617 (1603.78-1670.43) Points
CPU Performance rating: Percent
Cinebench R23: Multi Core | Single Core
Cinebench R20: CPU (Multi Core) | CPU (Single Core)
Cinebench R15: CPU Multi 64Bit | CPU Single 64Bit
Blender: v2.79 BMW27 CPU
7-Zip 18.03: 7z b 4 | 7z b 4 -mmt1
Geekbench 6.7: Multi-Core | Single-Core
Geekbench 5.5: Multi-Core | Single-Core
HWBOT x265 Benchmark v2.2: 4k Preset
LibreOffice : 20 Documents To PDF
R Benchmark 2.5: Overall mean
CPU Performance rating
Dell XPS 14 Core Ultra X7 358H
Intel Core Ultra X7 358H
87.7 pt
Apple MacBook Neo 256 GB -14!
Apple A18 Pro
76.7 pt
HP OmniBook 7 Aero 13-bg1077nr
AMD Ryzen AI 7 350
73 pt
Dell XPS 14 Core Ultra 7 355
Intel Core Ultra 7 355
66.3 pt
Lenovo ThinkPad X1 Carbon Gen 14 21V70075GE
Intel Core Ultra 5 325
64.9 pt
Dell XPS 13 9350
Intel Core Ultra 7 256V
62.8 pt
HP EliteBook 8 Flip G1i 13
Intel Core Ultra 7 265U
59 pt
Dell Latitude 13 7330 -2!
Intel Core i7-1265U
53.4 pt
Lenovo ThinkPad L13 2in1 G5 21LNS4AM00
Intel Core Ultra 5 125U
53.3 pt
Média Intel Core 5 320
 
51.5 pt
Dell XPS 13 DX13260
Intel Core 5 320
51.4 pt
Alldocube iWork GT Ultra -1!
Intel Core Ultra 5 125H
49.4 pt
Microsoft Surface Pro 8, i7-1185G7 -2!
Intel Core i7-1185G7
41.6 pt
Cinebench R23 / Multi Core
Dell XPS 14 Core Ultra X7 358H
Intel Core Ultra X7 358H
18932 (14811.1min - 18932.2max) Points +206%
HP OmniBook 7 Aero 13-bg1077nr
AMD Ryzen AI 7 350
14244 (12235.7min - 14243.7max) Points +130%
Dell XPS 14 Core Ultra 7 355
Intel Core Ultra 7 355
11348 (10188.4min - 11347.5max) Points +83%
Lenovo ThinkPad X1 Carbon Gen 14 21V70075GE
Intel Core Ultra 5 325
10980 Points +77%
HP EliteBook 8 Flip G1i 13
Intel Core Ultra 7 265U
10623 (8296.55min - 10623.2max) Points +71%
Dell XPS 13 9350
Intel Core Ultra 7 256V
10391 (9371.44min - 10390.8max) Points +68%
Lenovo ThinkPad L13 2in1 G5 21LNS4AM00
Intel Core Ultra 5 125U
10372 Points +67%
Alldocube iWork GT Ultra
Intel Core Ultra 5 125H
8419 Points +36%
Dell Latitude 13 7330
Intel Core i7-1265U
8108 (6277.1min - 8107.56max) Points +31%
Dell XPS 13 DX13260
Intel Core 5 320
6197 (6096.49min - 6196.88max) Points
Média Intel Core 5 320
  (n=1)
6197 Points 0%
Microsoft Surface Pro 8, i7-1185G7
Intel Core i7-1185G7
5668 Points -9%
Cinebench R23 / Single Core
Dell XPS 14 Core Ultra X7 358H
Intel Core Ultra X7 358H
2086 Points +8%
HP OmniBook 7 Aero 13-bg1077nr
AMD Ryzen AI 7 350
1979 Points +3%
Dell XPS 14 Core Ultra 7 355
Intel Core Ultra 7 355
1940 Points +1%
Dell XPS 13 DX13260
Intel Core 5 320
1926 Points
Média Intel Core 5 320
  (n=1)
1926 Points 0%
Lenovo ThinkPad X1 Carbon Gen 14 21V70075GE
Intel Core Ultra 5 325
1892 Points -2%
Dell XPS 13 9350
Intel Core Ultra 7 256V
1875 Points -3%
HP EliteBook 8 Flip G1i 13
Intel Core Ultra 7 265U
1749 Points -9%
Dell Latitude 13 7330
Intel Core i7-1265U
1738 Points -10%
Lenovo ThinkPad L13 2in1 G5 21LNS4AM00
Intel Core Ultra 5 125U
1586 Points -18%
Alldocube iWork GT Ultra
Intel Core Ultra 5 125H
1539 Points -20%
Microsoft Surface Pro 8, i7-1185G7
Intel Core i7-1185G7
1512 Points -21%
Cinebench R20 / CPU (Multi Core)
Dell XPS 14 Core Ultra X7 358H
Intel Core Ultra X7 358H
7437 Points +214%
HP OmniBook 7 Aero 13-bg1077nr
AMD Ryzen AI 7 350
5404 Points +128%
Dell XPS 14 Core Ultra 7 355
Intel Core Ultra 7 355
4359 Points +84%
Lenovo ThinkPad X1 Carbon Gen 14 21V70075GE
Intel Core Ultra 5 325
4250 Points +79%
HP EliteBook 8 Flip G1i 13
Intel Core Ultra 7 265U
4061 Points +71%
Dell XPS 13 9350
Intel Core Ultra 7 256V
4038 Points +70%
Lenovo ThinkPad L13 2in1 G5 21LNS4AM00
Intel Core Ultra 5 125U
3984 Points +68%
Alldocube iWork GT Ultra
Intel Core Ultra 5 125H
3203 Points +35%
Dell Latitude 13 7330
Intel Core i7-1265U
3195 Points +35%
Dell XPS 13 DX13260
Intel Core 5 320
2371 Points
Média Intel Core 5 320
  (n=1)
2371 Points 0%
Microsoft Surface Pro 8, i7-1185G7
Intel Core i7-1185G7
2097 Points -12%
Cinebench R20 / CPU (Single Core)
Dell XPS 14 Core Ultra X7 358H
Intel Core Ultra X7 358H
792 Points +10%
HP OmniBook 7 Aero 13-bg1077nr
AMD Ryzen AI 7 350
774 Points +8%
Dell XPS 14 Core Ultra 7 355
Intel Core Ultra 7 355
733 Points +2%
Dell XPS 13 9350
Intel Core Ultra 7 256V
720 Points 0%
Dell XPS 13 DX13260
Intel Core 5 320
717 Points
Média Intel Core 5 320
  (n=1)
717 Points 0%
Lenovo ThinkPad X1 Carbon Gen 14 21V70075GE
Intel Core Ultra 5 325
713 Points -1%
HP EliteBook 8 Flip G1i 13
Intel Core Ultra 7 265U
678 Points -5%
Dell Latitude 13 7330
Intel Core i7-1265U
651 Points -9%
Lenovo ThinkPad L13 2in1 G5 21LNS4AM00
Intel Core Ultra 5 125U
609 Points -15%
Alldocube iWork GT Ultra
Intel Core Ultra 5 125H
592 Points -17%
Microsoft Surface Pro 8, i7-1185G7
Intel Core i7-1185G7
578 Points -19%
Cinebench R15 / CPU Multi 64Bit
Dell XPS 14 Core Ultra X7 358H
Intel Core Ultra X7 358H
3135 (2099.85min - 3134.55max) Points +197%
HP OmniBook 7 Aero 13-bg1077nr
AMD Ryzen AI 7 350
2038 (1917.36min - 2037.7max) Points +93%
HP EliteBook 8 Flip G1i 13
Intel Core Ultra 7 265U
1736 (1258.93min - 1735.81max) Points +65%
Lenovo ThinkPad X1 Carbon Gen 14 21V70075GE
Intel Core Ultra 5 325
1670 (1603.78min - 1670.43max) Points +58%
Dell XPS 14 Core Ultra 7 355
Intel Core Ultra 7 355
1654 (1489.92min - 1654.26max) Points +57%
Lenovo ThinkPad L13 2in1 G5 21LNS4AM00
Intel Core Ultra 5 125U
1614 (1027.83min - 1613.94max) Points +53%
Dell XPS 13 9350
Intel Core Ultra 7 256V
1570 (1369.16min - 1569.86max) Points +49%
Dell Latitude 13 7330
Intel Core i7-1265U
1420 (1010.48min - 1420.35max) Points +35%
Alldocube iWork GT Ultra
Intel Core Ultra 5 125H
1225 Points +16%
Dell XPS 13 DX13260
Intel Core 5 320
1054 (856.35min - 1053.52max) Points
Média Intel Core 5 320
  (n=1)
1054 Points 0%
Microsoft Surface Pro 8, i7-1185G7
Intel Core i7-1185G7
995 (789.61min - 994.68max) Points -6%
Cinebench R15 / CPU Single 64Bit
Dell XPS 14 Core Ultra X7 358H
Intel Core Ultra X7 358H
312 Points +13%
HP OmniBook 7 Aero 13-bg1077nr
AMD Ryzen AI 7 350
297 Points +8%
Dell XPS 14 Core Ultra 7 355
Intel Core Ultra 7 355
288 Points +4%
Dell XPS 13 9350
Intel Core Ultra 7 256V
285 Points +3%
Lenovo ThinkPad X1 Carbon Gen 14 21V70075GE
Intel Core Ultra 5 325
282 Points +2%
Dell XPS 13 DX13260
Intel Core 5 320
276 Points
Média Intel Core 5 320
  (n=1)
276 Points 0%
Dell Latitude 13 7330
Intel Core i7-1265U
250 Points -9%
HP EliteBook 8 Flip G1i 13
Intel Core Ultra 7 265U
244 Points -12%
Lenovo ThinkPad L13 2in1 G5 21LNS4AM00
Intel Core Ultra 5 125U
230 Points -17%
Microsoft Surface Pro 8, i7-1185G7
Intel Core i7-1185G7
224 Points -19%
Alldocube iWork GT Ultra
Intel Core Ultra 5 125H
217 Points -21%
Blender / v2.79 BMW27 CPU
Microsoft Surface Pro 8, i7-1185G7
Intel Core i7-1185G7
569 Seconds * -15%
Dell XPS 13 DX13260
Intel Core 5 320
494 Seconds *
Média Intel Core 5 320
  (n=1)
494 Seconds * -0%
Dell Latitude 13 7330
Intel Core i7-1265U
413 Seconds * +16%
Alldocube iWork GT Ultra
Intel Core Ultra 5 125H
389 Seconds * +21%
Lenovo ThinkPad L13 2in1 G5 21LNS4AM00
Intel Core Ultra 5 125U
380 Seconds * +23%
Dell XPS 13 9350
Intel Core Ultra 7 256V
339 Seconds * +31%
HP EliteBook 8 Flip G1i 13
Intel Core Ultra 7 265U
335 Seconds * +32%
Lenovo ThinkPad X1 Carbon Gen 14 21V70075GE
Intel Core Ultra 5 325
310 Seconds * +37%
Dell XPS 14 Core Ultra 7 355
Intel Core Ultra 7 355
307 Seconds * +38%
HP OmniBook 7 Aero 13-bg1077nr
AMD Ryzen AI 7 350
230 Seconds * +53%
Dell XPS 14 Core Ultra X7 358H
Intel Core Ultra X7 358H
196 Seconds * +60%
7-Zip 18.03 / 7z b 4
Dell XPS 14 Core Ultra X7 358H
Intel Core Ultra X7 358H
64255 MIPS +173%
HP OmniBook 7 Aero 13-bg1077nr
AMD Ryzen AI 7 350
55010 MIPS +134%
Lenovo ThinkPad L13 2in1 G5 21LNS4AM00
Intel Core Ultra 5 125U
39072 MIPS +66%
HP EliteBook 8 Flip G1i 13
Intel Core Ultra 7 265U
38771 MIPS +65%
Dell XPS 14 Core Ultra 7 355
Intel Core Ultra 7 355
37123 MIPS +58%
Lenovo ThinkPad X1 Carbon Gen 14 21V70075GE
Intel Core Ultra 5 325
36228 MIPS +54%
Dell XPS 13 9350
Intel Core Ultra 7 256V
35950 MIPS +53%
Dell Latitude 13 7330
Intel Core i7-1265U
31869 MIPS +35%
Microsoft Surface Pro 8, i7-1185G7
Intel Core i7-1185G7
24679 MIPS +5%
Dell XPS 13 DX13260
Intel Core 5 320
23550 MIPS
Média Intel Core 5 320
  (n=1)
23550 MIPS 0%
7-Zip 18.03 / 7z b 4 -mmt1
Dell XPS 14 Core Ultra X7 358H
Intel Core Ultra X7 358H
6526 MIPS +23%
HP OmniBook 7 Aero 13-bg1077nr
AMD Ryzen AI 7 350
6025 MIPS +13%
Dell XPS 14 Core Ultra 7 355
Intel Core Ultra 7 355
5764 MIPS +8%
Lenovo ThinkPad X1 Carbon Gen 14 21V70075GE
Intel Core Ultra 5 325
5741 MIPS +8%
Dell XPS 13 9350
Intel Core Ultra 7 256V
5727 MIPS +8%
Dell Latitude 13 7330
Intel Core i7-1265U
5615 MIPS +6%
Dell XPS 13 DX13260
Intel Core 5 320
5319 MIPS
Média Intel Core 5 320
  (n=1)
5319 MIPS 0%
Microsoft Surface Pro 8, i7-1185G7
Intel Core i7-1185G7
5168 MIPS -3%
HP EliteBook 8 Flip G1i 13
Intel Core Ultra 7 265U
5088 MIPS -4%
Alldocube iWork GT Ultra
Intel Core Ultra 5 125H
4671 MIPS -12%
Lenovo ThinkPad L13 2in1 G5 21LNS4AM00
Intel Core Ultra 5 125U
4489 MIPS -16%
Geekbench 6.7 / Multi-Core
Dell XPS 14 Core Ultra X7 358H
Intel Core Ultra X7 358H
17121 Points +117%
HP OmniBook 7 Aero 13-bg1077nr
AMD Ryzen AI 7 350
13083 Points +66%
Dell XPS 14 Core Ultra 7 355
Intel Core Ultra 7 355
11394 Points +44%
Lenovo ThinkPad X1 Carbon Gen 14 21V70075GE
Intel Core Ultra 5 325
11038 Points +40%
Dell XPS 13 9350
Intel Core Ultra 7 256V
10972 Points +39%
HP EliteBook 8 Flip G1i 13
Intel Core Ultra 7 265U
10707 Points +36%
Alldocube iWork GT Ultra
Intel Core Ultra 5 125H
10527 Points +33%
Lenovo ThinkPad L13 2in1 G5 21LNS4AM00
Intel Core Ultra 5 125U
9351 Points +19%
Apple MacBook Neo 256 GB
Apple A18 Pro
9140 Points +16%
Média Intel Core 5 320
  (7888 - 8122, n=3)
7974 Points +1%
Dell XPS 13 DX13260
Intel Core 5 320
7888 Points
Geekbench 6.7 / Single-Core
Apple MacBook Neo 256 GB
Apple A18 Pro
3589 Points +39%
Dell XPS 14 Core Ultra X7 358H
Intel Core Ultra X7 358H
2927 Points +14%
HP OmniBook 7 Aero 13-bg1077nr
AMD Ryzen AI 7 350
2886 Points +12%
Dell XPS 13 9350
Intel Core Ultra 7 256V
2778 Points +8%
Dell XPS 14 Core Ultra 7 355
Intel Core Ultra 7 355
2701 Points +5%
Lenovo ThinkPad X1 Carbon Gen 14 21V70075GE
Intel Core Ultra 5 325
2620 Points +2%
Média Intel Core 5 320
  (2564 - 2600, n=3)
2580 Points 0%
Dell XPS 13 DX13260
Intel Core 5 320
2575 Points
HP EliteBook 8 Flip G1i 13
Intel Core Ultra 7 265U
2477 Points -4%
Lenovo ThinkPad L13 2in1 G5 21LNS4AM00
Intel Core Ultra 5 125U
2150 Points -17%
Alldocube iWork GT Ultra
Intel Core Ultra 5 125H
2134 Points -17%
Geekbench 5.5 / Multi-Core
Dell XPS 14 Core Ultra X7 358H
Intel Core Ultra X7 358H
17028 Points +168%
HP OmniBook 7 Aero 13-bg1077nr
AMD Ryzen AI 7 350
11254 Points +77%
Dell XPS 14 Core Ultra 7 355
Intel Core Ultra 7 355
10011 Points +58%
Lenovo ThinkPad X1 Carbon Gen 14 21V70075GE
Intel Core Ultra 5 325
9990 Points +57%
HP EliteBook 8 Flip G1i 13
Intel Core Ultra 7 265U
9683 Points +52%
Dell XPS 13 9350
Intel Core Ultra 7 256V
9302 Points +46%
Alldocube iWork GT Ultra
Intel Core Ultra 5 125H
8717 Points +37%
Lenovo ThinkPad L13 2in1 G5 21LNS4AM00
Intel Core Ultra 5 125U
8457 Points +33%
Dell Latitude 13 7330
Intel Core i7-1265U
6937 Points +9%
Dell XPS 13 DX13260
Intel Core 5 320
6351 Points
Média Intel Core 5 320
  (n=1)
6351 Points 0%
Microsoft Surface Pro 8, i7-1185G7
Intel Core i7-1185G7
5759 Points -9%
Geekbench 5.5 / Single-Core
Dell XPS 14 Core Ultra X7 358H
Intel Core Ultra X7 358H
2142 Points +19%
HP OmniBook 7 Aero 13-bg1077nr
AMD Ryzen AI 7 350
2132 Points +18%
Dell XPS 13 9350
Intel Core Ultra 7 256V
2010 Points +11%
Dell XPS 14 Core Ultra 7 355
Intel Core Ultra 7 355
1999 Points +11%
Lenovo ThinkPad X1 Carbon Gen 14 21V70075GE
Intel Core Ultra 5 325
1959 Points +8%
HP EliteBook 8 Flip G1i 13
Intel Core Ultra 7 265U
1815 Points 0%
Dell XPS 13 DX13260
Intel Core 5 320
1807 Points
Média Intel Core 5 320
  (n=1)
1807 Points 0%
Dell Latitude 13 7330
Intel Core i7-1265U
1778 Points -2%
Alldocube iWork GT Ultra
Intel Core Ultra 5 125H
1615 Points -11%
Lenovo ThinkPad L13 2in1 G5 21LNS4AM00
Intel Core Ultra 5 125U
1577 Points -13%
Microsoft Surface Pro 8, i7-1185G7
Intel Core i7-1185G7
1548 Points -14%
HWBOT x265 Benchmark v2.2 / 4k Preset
Dell XPS 14 Core Ultra X7 358H
Intel Core Ultra X7 358H
20.7 fps +146%
Dell XPS 14 Core Ultra 7 355
Intel Core Ultra 7 355
14.6 fps +73%
Lenovo ThinkPad X1 Carbon Gen 14 21V70075GE
Intel Core Ultra 5 325
14.3 fps +70%
HP OmniBook 7 Aero 13-bg1077nr
AMD Ryzen AI 7 350
14 fps +66%
Dell XPS 13 9350
Intel Core Ultra 7 256V
13.1 fps +56%
Lenovo ThinkPad L13 2in1 G5 21LNS4AM00
Intel Core Ultra 5 125U
11.4 fps +35%
HP EliteBook 8 Flip G1i 13
Intel Core Ultra 7 265U
11.4 fps +35%
Dell Latitude 13 7330
Intel Core i7-1265U
9.37 fps +11%
Alldocube iWork GT Ultra
Intel Core Ultra 5 125H
8.52 fps +1%
Dell XPS 13 DX13260
Intel Core 5 320
8.42 fps
Média Intel Core 5 320
  (n=1)
8.42 fps 0%
Microsoft Surface Pro 8, i7-1185G7
Intel Core i7-1185G7
6.49 fps -23%
LibreOffice / 20 Documents To PDF
Alldocube iWork GT Ultra
Intel Core Ultra 5 125H
63.9 s * -34%
Lenovo ThinkPad L13 2in1 G5 21LNS4AM00
Intel Core Ultra 5 125U
58.5 s * -23%
HP EliteBook 8 Flip G1i 13
Intel Core Ultra 7 265U
58.1 s * -22%
Dell XPS 13 9350
Intel Core Ultra 7 256V
53.2 s * -12%
HP OmniBook 7 Aero 13-bg1077nr
AMD Ryzen AI 7 350
51.2 s * -7%
Microsoft Surface Pro 8, i7-1185G7
Intel Core i7-1185G7
51.1 s * -7%
Dell Latitude 13 7330
Intel Core i7-1265U
49.1 s * -3%
Dell XPS 13 DX13260
Intel Core 5 320
47.7 s *
Média Intel Core 5 320
  (n=1)
47.7 s * -0%
Dell XPS 14 Core Ultra X7 358H
Intel Core Ultra X7 358H
45.9 s * +4%
Lenovo ThinkPad X1 Carbon Gen 14 21V70075GE
Intel Core Ultra 5 325
43.6 s * +9%
Dell XPS 14 Core Ultra 7 355
Intel Core Ultra 7 355
43.1 s * +10%
R Benchmark 2.5 / Overall mean
Microsoft Surface Pro 8, i7-1185G7
Intel Core i7-1185G7
0.568 sec * -20%
Lenovo ThinkPad L13 2in1 G5 21LNS4AM00
Intel Core Ultra 5 125U
0.558 sec * -18%
Alldocube iWork GT Ultra
Intel Core Ultra 5 125H
0.546 sec * -15%
HP EliteBook 8 Flip G1i 13
Intel Core Ultra 7 265U
0.492 sec * -4%
Dell Latitude 13 7330
Intel Core i7-1265U
0.4772 sec * -1%
Dell XPS 13 DX13260
Intel Core 5 320
0.4748 sec *
Média Intel Core 5 320
  (n=1)
0.4748 sec * -0%
Dell XPS 13 9350
Intel Core Ultra 7 256V
0.4578 sec * +4%
HP OmniBook 7 Aero 13-bg1077nr
AMD Ryzen AI 7 350
0.4555 sec * +4%
Lenovo ThinkPad X1 Carbon Gen 14 21V70075GE
Intel Core Ultra 5 325
0.4545 sec * +4%
Dell XPS 14 Core Ultra 7 355
Intel Core Ultra 7 355
0.4435 sec * +7%
Dell XPS 14 Core Ultra X7 358H
Intel Core Ultra X7 358H
0.4127 sec * +13%
CPU Performance rating: Percent
Cinebench R23: Multi Core | Single Core
Cinebench R20: CPU (Multi Core) | CPU (Single Core)
Cinebench R15: CPU Multi 64Bit | CPU Single 64Bit
Blender: v2.79 BMW27 CPU
7-Zip 18.03: 7z b 4 | 7z b 4 -mmt1
Geekbench 6.7: Multi-Core | Single-Core
Geekbench 5.5: Multi-Core | Single-Core
HWBOT x265 Benchmark v2.2: 4k Preset
LibreOffice : 20 Documents To PDF
R Benchmark 2.5: Overall mean

* ... menor é melhor

Cinebench R15 CPU Multi 64Bit
1054 Points
Cinebench R15 OpenGL 64Bit
102 fps
Cinebench R15 Ref. Match 64Bit
97.8 %
Cinebench R15 CPU Single 64Bit
276 Points
Cinebench R20 CPU (Multi Core)
2371 Points
Cinebench R20 CPU (Single Core)
717 Points
Cinebench R23 Single Core
1926 Points
Cinebench R23 Multi Core
6197 Points
Ajuda
Performance rating
HP OmniBook 7 Aero 13-bg1077nr -1!
AMD Ryzen AI 7 350, Radeon 860M
90.1 pt
Dell XPS 14 Core Ultra X7 358H
Intel Core Ultra X7 358H, Arc B390 Panther Lake iGPU
85.8 pt
Lenovo ThinkPad X1 Carbon Gen 14 21V70075GE -1!
Intel Core Ultra 5 325, Intel Graphics 4 Xe3 PTL
59.2 pt
Dell XPS 13 9350 -1!
Intel Core Ultra 7 256V, Arc 140V
59 pt
Dell XPS 13 DX13260 -1!
Intel Core 5 320, Intel Graphics 2 Xe3 WCL
12.7 pt
Média Intel Core 5 320 -1!
 
12.7 pt
AIDA64 / FP32 Ray-Trace
HP OmniBook 7 Aero 13-bg1077nr
AMD Ryzen AI 7 350, Radeon 860M (v6.92.6600)
22443 KRay/s +782%
Dell XPS 14 Core Ultra X7 358H
Intel Core Ultra X7 358H, Arc B390 Panther Lake iGPU (v8.20.8100)
14318 KRay/s +463%
Dell XPS 13 9350
Intel Core Ultra 7 256V, Arc 140V (v6.92.6600)
12287 KRay/s +383%
Lenovo ThinkPad X1 Carbon Gen 14 21V70075GE
Intel Core Ultra 5 325, Intel Graphics 4 Xe3 PTL (v8.20.8100)
12020 KRay/s +372%
Dell XPS 13 DX13260
Intel Core 5 320, Intel Graphics 2 Xe3 WCL (v8.20.8100)
2545 KRay/s
Média Intel Core 5 320
  (n=1)
2545 KRay/s 0%
AIDA64 / FPU Julia
HP OmniBook 7 Aero 13-bg1077nr
AMD Ryzen AI 7 350, Radeon 860M (v6.92.6600)
84517 Points +534%
Dell XPS 14 Core Ultra X7 358H
Intel Core Ultra X7 358H, Arc B390 Panther Lake iGPU (v8.20.8100)
77086 Points +479%
Lenovo ThinkPad X1 Carbon Gen 14 21V70075GE
Intel Core Ultra 5 325, Intel Graphics 4 Xe3 PTL (v8.20.8100)
61597 Points +362%
Dell XPS 13 9350
Intel Core Ultra 7 256V, Arc 140V (v6.92.6600)
61131 Points +359%
Dell XPS 13 DX13260
Intel Core 5 320, Intel Graphics 2 Xe3 WCL (v8.20.8100)
13325 Points
Média Intel Core 5 320
  (n=1)
13325 Points 0%
AIDA64 / CPU SHA3
Dell XPS 14 Core Ultra X7 358H
Intel Core Ultra X7 358H, Arc B390 Panther Lake iGPU (v8.20.8100)
4033 MB/s +525%
HP OmniBook 7 Aero 13-bg1077nr
AMD Ryzen AI 7 350, Radeon 860M (v6.92.6600)
3669 MB/s +469%
Dell XPS 13 9350
Intel Core Ultra 7 256V, Arc 140V (v6.92.6600)
2713 MB/s +321%
Lenovo ThinkPad X1 Carbon Gen 14 21V70075GE
Intel Core Ultra 5 325, Intel Graphics 4 Xe3 PTL (v8.20.8100)
2694 MB/s +318%
Dell XPS 13 DX13260
Intel Core 5 320, Intel Graphics 2 Xe3 WCL (v8.20.8100)
645 MB/s
Média Intel Core 5 320
  (n=1)
645 MB/s 0%
AIDA64 / CPU Queen
HP OmniBook 7 Aero 13-bg1077nr
AMD Ryzen AI 7 350, Radeon 860M (v6.92.6600)
72463 Points
Dell XPS 14 Core Ultra X7 358H
Intel Core Ultra X7 358H, Arc B390 Panther Lake iGPU (v6.92.6600)
63827 Points
Dell XPS 13 9350
Intel Core Ultra 7 256V, Arc 140V (v6.92.6600)
49622 Points
AIDA64 / FPU SinJulia
HP OmniBook 7 Aero 13-bg1077nr
AMD Ryzen AI 7 350, Radeon 860M (v6.92.6600)
13051 Points +1334%
Dell XPS 14 Core Ultra X7 358H
Intel Core Ultra X7 358H, Arc B390 Panther Lake iGPU (v8.20.8100)
6919 Points +660%
Dell XPS 13 9350
Intel Core Ultra 7 256V, Arc 140V (v6.92.6600)
4428 Points +387%
Lenovo ThinkPad X1 Carbon Gen 14 21V70075GE
Intel Core Ultra 5 325, Intel Graphics 4 Xe3 PTL (v8.20.8100)
4401 Points +384%
Dell XPS 13 DX13260
Intel Core 5 320, Intel Graphics 2 Xe3 WCL (v8.20.8100)
910 Points
Média Intel Core 5 320
  (n=1)
910 Points 0%
AIDA64 / FPU Mandel
HP OmniBook 7 Aero 13-bg1077nr
AMD Ryzen AI 7 350, Radeon 860M (v6.92.6600)
45043 Points +549%
Dell XPS 14 Core Ultra X7 358H
Intel Core Ultra X7 358H, Arc B390 Panther Lake iGPU (v8.20.8100)
40542 Points +484%
Lenovo ThinkPad X1 Carbon Gen 14 21V70075GE
Intel Core Ultra 5 325, Intel Graphics 4 Xe3 PTL (v8.20.8100)
32568 Points +369%
Dell XPS 13 9350
Intel Core Ultra 7 256V, Arc 140V (v6.92.6600)
32410 Points +367%
Dell XPS 13 DX13260
Intel Core 5 320, Intel Graphics 2 Xe3 WCL (v8.20.8100)
6944 Points
Média Intel Core 5 320
  (n=1)
6944 Points 0%
AIDA64 / CPU AES
HP OmniBook 7 Aero 13-bg1077nr
AMD Ryzen AI 7 350, Radeon 860M (v6.92.6600)
67645 MB/s +716%
Dell XPS 14 Core Ultra X7 358H
Intel Core Ultra X7 358H, Arc B390 Panther Lake iGPU (v8.20.8100)
63775 MB/s +669%
Dell XPS 13 9350
Intel Core Ultra 7 256V, Arc 140V (v6.92.6600)
40828 MB/s +392%
Lenovo ThinkPad X1 Carbon Gen 14 21V70075GE
Intel Core Ultra 5 325, Intel Graphics 4 Xe3 PTL (v8.20.8100)
37722 MB/s +355%
Dell XPS 13 DX13260
Intel Core 5 320, Intel Graphics 2 Xe3 WCL (v8.20.8100)
8293 MB/s
Média Intel Core 5 320
  (n=1)
8293 MB/s 0%
AIDA64 / CPU ZLib
Dell XPS 14 Core Ultra X7 358H
Intel Core Ultra X7 358H, Arc B390 Panther Lake iGPU (v8.20.8100)
1103 MB/s +715%
HP OmniBook 7 Aero 13-bg1077nr
AMD Ryzen AI 7 350, Radeon 860M (v6.92.6600)
663 MB/s +390%
Lenovo ThinkPad X1 Carbon Gen 14 21V70075GE
Intel Core Ultra 5 325, Intel Graphics 4 Xe3 PTL (v8.20.8100)
614 MB/s +354%
Dell XPS 13 9350
Intel Core Ultra 7 256V, Arc 140V (v6.92.6600)
536 MB/s +296%
Dell XPS 13 DX13260
Intel Core 5 320, Intel Graphics 2 Xe3 WCL (v8.20.8100)
135.3 MB/s
Média Intel Core 5 320
  (n=1)
135.3 MB/s 0%
AIDA64 / FP64 Ray-Trace
HP OmniBook 7 Aero 13-bg1077nr
AMD Ryzen AI 7 350, Radeon 860M (v6.92.6600)
12090 KRay/s +832%
Dell XPS 14 Core Ultra X7 358H
Intel Core Ultra X7 358H, Arc B390 Panther Lake iGPU (v8.20.8100)
7603 KRay/s +486%
Dell XPS 13 9350
Intel Core Ultra 7 256V, Arc 140V (v6.92.6600)
6506 KRay/s +402%
Lenovo ThinkPad X1 Carbon Gen 14 21V70075GE
Intel Core Ultra 5 325, Intel Graphics 4 Xe3 PTL (v8.20.8100)
6401 KRay/s +394%
Dell XPS 13 DX13260
Intel Core 5 320, Intel Graphics 2 Xe3 WCL (v8.20.8100)
1297 KRay/s
Média Intel Core 5 320
  (n=1)
1297 KRay/s 0%
AIDA64 / CPU PhotoWorxx
Dell XPS 14 Core Ultra X7 358H
Intel Core Ultra X7 358H, Arc B390 Panther Lake iGPU (v8.20.8100)
88086 MPixel/s +690%
Lenovo ThinkPad X1 Carbon Gen 14 21V70075GE
Intel Core Ultra 5 325, Intel Graphics 4 Xe3 PTL (v8.20.8100)
59824 MPixel/s +437%
Dell XPS 13 9350
Intel Core Ultra 7 256V, Arc 140V (v6.92.6600)
51767 MPixel/s +365%
HP OmniBook 7 Aero 13-bg1077nr
AMD Ryzen AI 7 350, Radeon 860M (v6.92.6600)
43875 MPixel/s +294%
Dell XPS 13 DX13260
Intel Core 5 320, Intel Graphics 2 Xe3 WCL (v8.20.8100)
11144 MPixel/s
Média Intel Core 5 320
  (n=1)
11144 MPixel/s 0%
AIDA64 / CPU CheckMate
Dell XPS 14 Core Ultra X7 358H
Intel Core Ultra X7 358H, Arc B390 Panther Lake iGPU (v8.20.8100)
4475 MP/s +658%
Lenovo ThinkPad X1 Carbon Gen 14 21V70075GE
Intel Core Ultra 5 325, Intel Graphics 4 Xe3 PTL (v8.20.8100)
2716 MP/s +360%
Dell XPS 13 DX13260
Intel Core 5 320, Intel Graphics 2 Xe3 WCL (v8.20.8100)
590 MP/s
Média Intel Core 5 320
  (n=1)
590 MP/s 0%

Desempenho do sistema

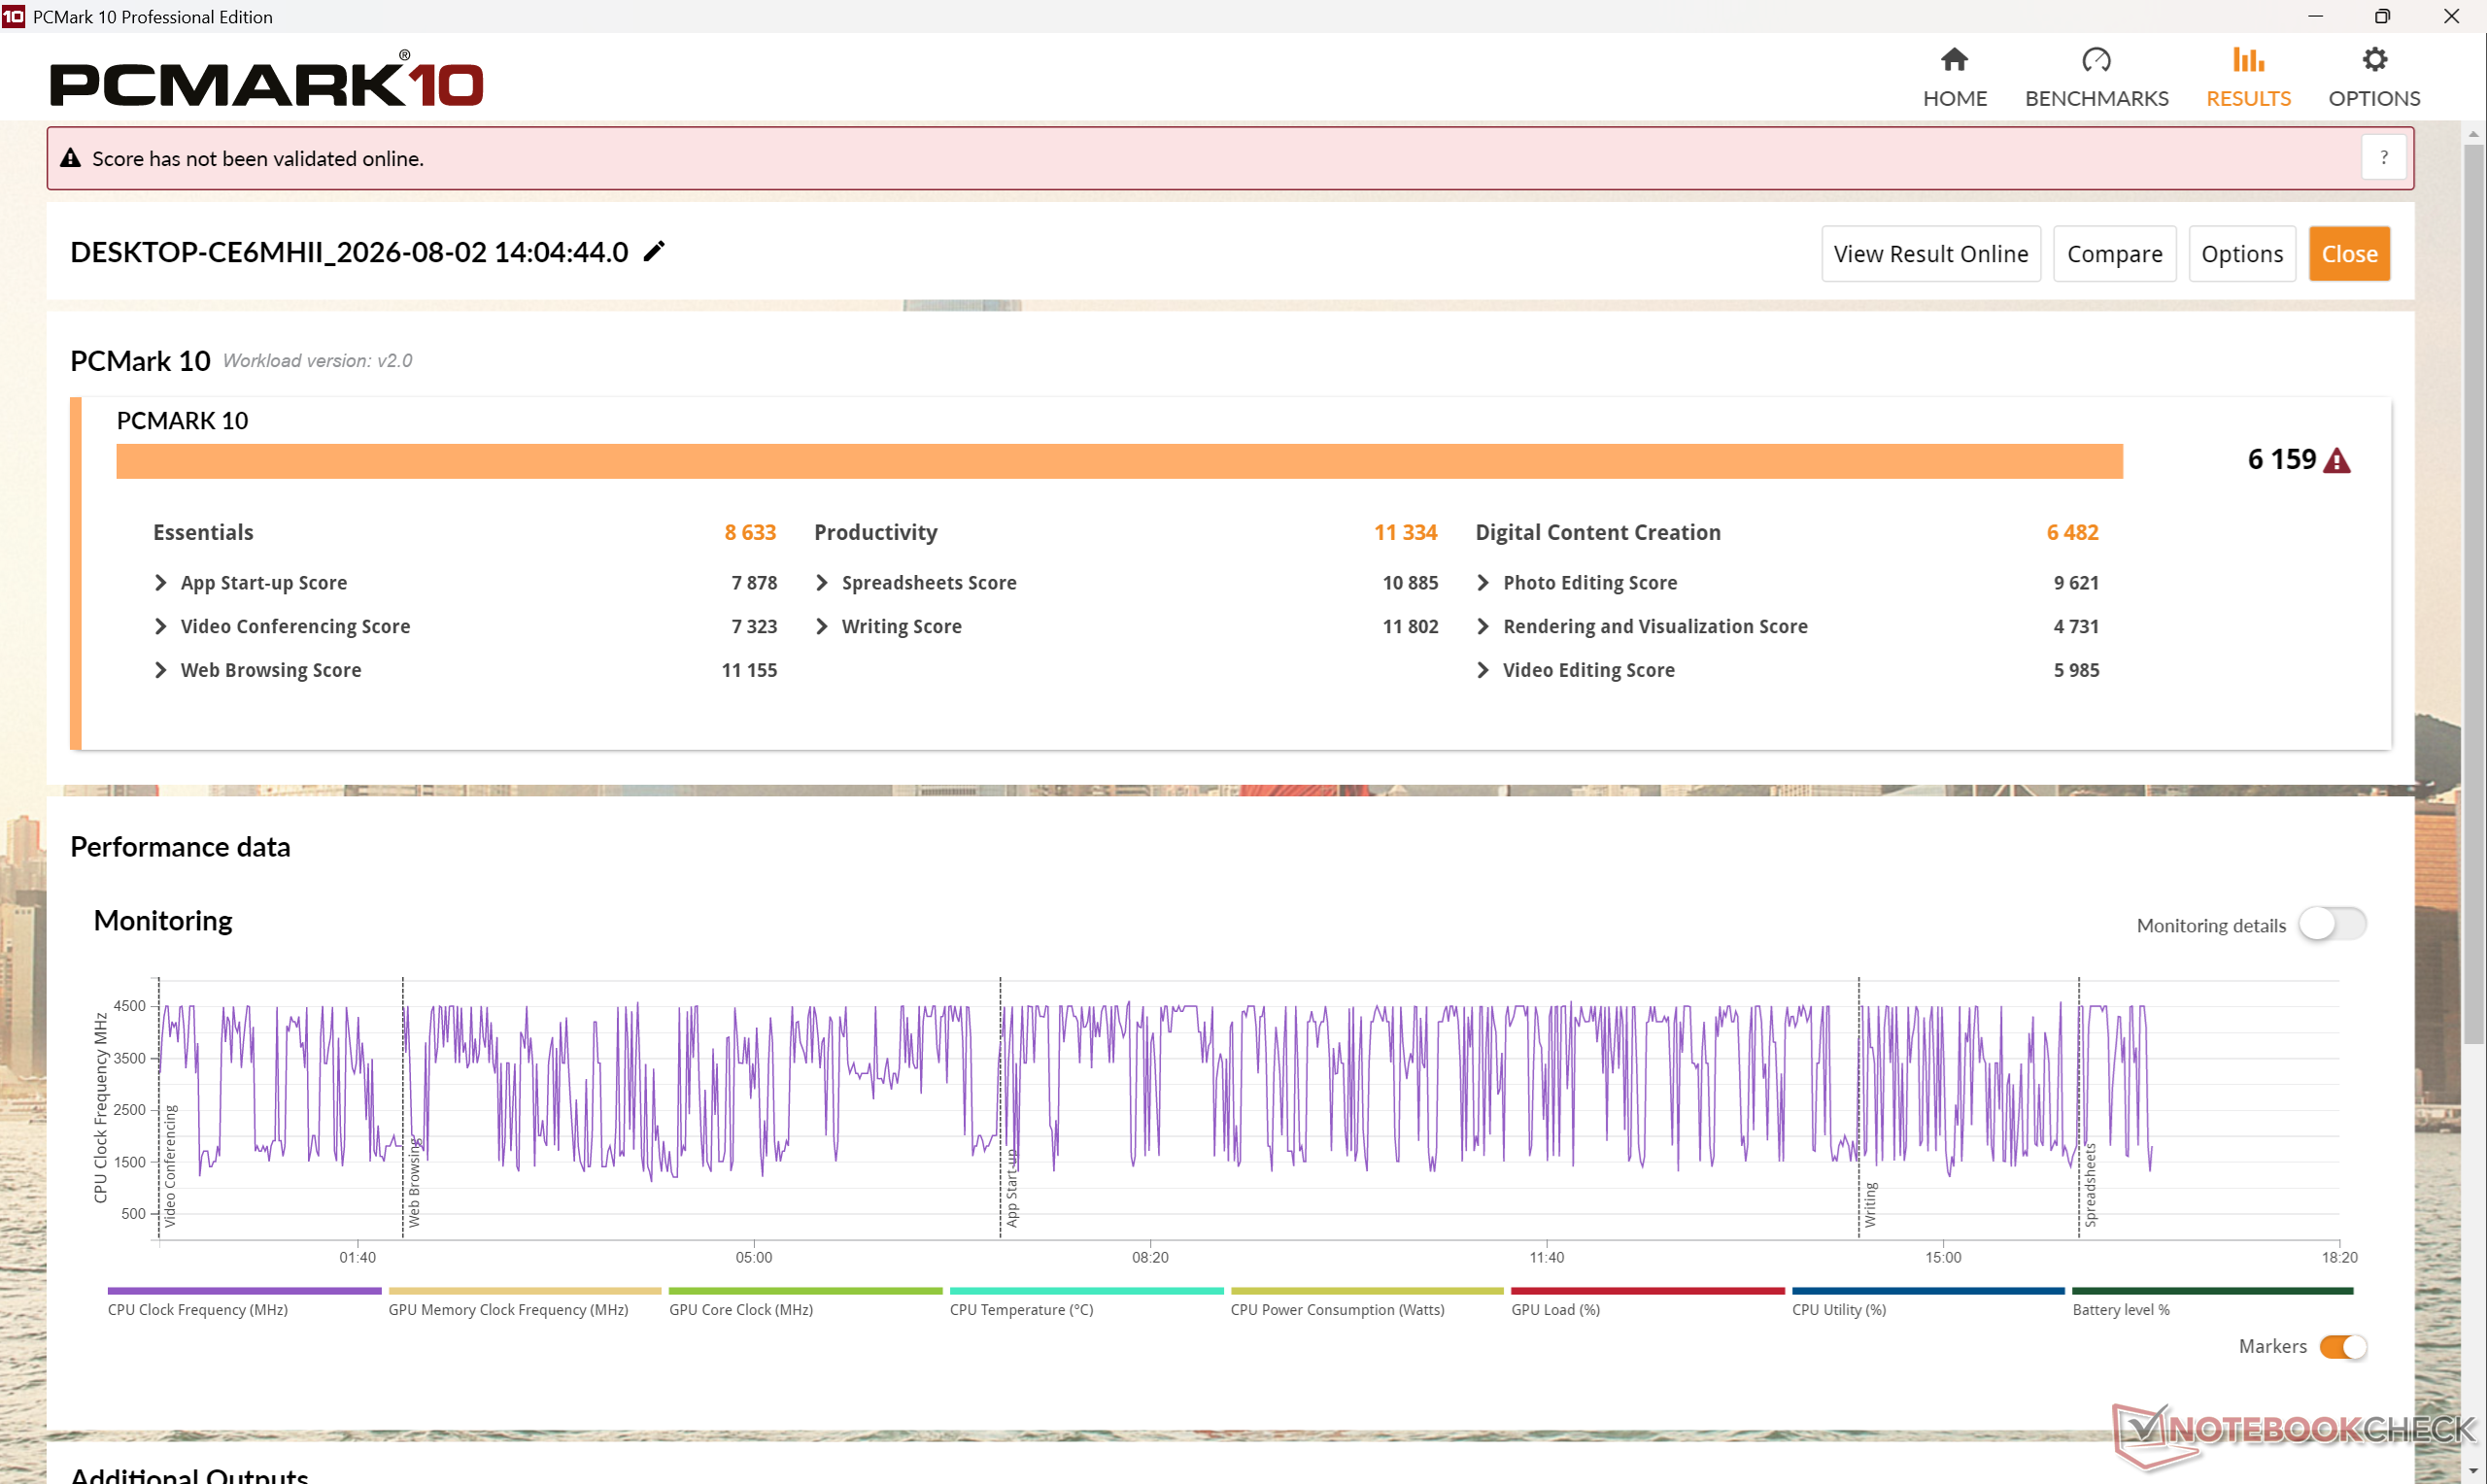
PCMark 10 Standard. O sistema se destaca na navegação na web e no processamento de texto, mas tarefas mais exigentes, como edição de imagens, parecerão lentas
Performance rating: Percent
PCMark 10: Score | Essentials | Productivity | Digital Content Creation
CrossMark: Overall | Productivity | Creativity | Responsiveness
WebXPRT 3: Overall
WebXPRT 4: Overall
Mozilla Kraken 1.1: Total
Performance rating
Dell XPS 14 Core Ultra X7 358H
Arc B390 Panther Lake iGPU, Ultra X7 358H, Samsung PM9C1b MZVL81T0HFLB-00BH1
90.9 pt
Apple MacBook Neo 256 GB -4!
A18 GPU, A18 Pro, Apple SSD AP0256Z
86.3 pt
Lenovo ThinkPad X1 Carbon Gen 14 21V70075GE
Intel Graphics 4 Xe3 PTL, Ultra 5 325, Samsung PM9C1b MZVL8512HFLU-00BLL
76 pt
Dell XPS 13 9350
Arc 140V, Core Ultra 7 256V, Micron 2550 512GB
74.9 pt
HP OmniBook 7 Aero 13-bg1077nr
Radeon 860M, Ryzen AI 7 350, SK hynix PC801 HFS001TEJ9X101N
69.6 pt
Dell XPS 13 DX13260
Intel Graphics 2 Xe3 WCL, Core 5 320
66.9 pt
Média Intel Core 5 320, Intel Graphics 2 Xe3 Wildcat Lake iGPU
 
66.9 pt
PCMark 10 / Score
Dell XPS 14 Core Ultra X7 358H
Arc B390 Panther Lake iGPU, Ultra X7 358H, Samsung PM9C1b MZVL81T0HFLB-00BH1
9880 Points +60%
HP OmniBook 7 Aero 13-bg1077nr
Radeon 860M, Ryzen AI 7 350, SK hynix PC801 HFS001TEJ9X101N
8424 Points +37%
Lenovo ThinkPad X1 Carbon Gen 14 21V70075GE
Intel Graphics 4 Xe3 PTL, Ultra 5 325, Samsung PM9C1b MZVL8512HFLU-00BLL
7709 Points +25%
Dell XPS 13 9350
Arc 140V, Core Ultra 7 256V, Micron 2550 512GB
6955 Points +13%
Dell XPS 13 DX13260
Intel Graphics 2 Xe3 WCL, Core 5 320
6159 Points
Média Intel Core 5 320, Intel Graphics 2 Xe3 Wildcat Lake iGPU
  (n=1)
6159 Points 0%
PCMark 10 / Essentials
Dell XPS 14 Core Ultra X7 358H
Arc B390 Panther Lake iGPU, Ultra X7 358H, Samsung PM9C1b MZVL81T0HFLB-00BH1
11263 Points +30%
HP OmniBook 7 Aero 13-bg1077nr
Radeon 860M, Ryzen AI 7 350, SK hynix PC801 HFS001TEJ9X101N
10909 Points +26%
Dell XPS 13 9350
Arc 140V, Core Ultra 7 256V, Micron 2550 512GB
10006 Points +16%
Lenovo ThinkPad X1 Carbon Gen 14 21V70075GE
Intel Graphics 4 Xe3 PTL, Ultra 5 325, Samsung PM9C1b MZVL8512HFLU-00BLL
9939 Points +15%
Dell XPS 13 DX13260
Intel Graphics 2 Xe3 WCL, Core 5 320
8633 Points
Média Intel Core 5 320, Intel Graphics 2 Xe3 Wildcat Lake iGPU
  (n=1)
8633 Points 0%
PCMark 10 / Productivity
Dell XPS 14 Core Ultra X7 358H
Arc B390 Panther Lake iGPU, Ultra X7 358H, Samsung PM9C1b MZVL81T0HFLB-00BH1
16780 Points +48%
HP OmniBook 7 Aero 13-bg1077nr
Radeon 860M, Ryzen AI 7 350, SK hynix PC801 HFS001TEJ9X101N
16132 Points +42%
Lenovo ThinkPad X1 Carbon Gen 14 21V70075GE
Intel Graphics 4 Xe3 PTL, Ultra 5 325, Samsung PM9C1b MZVL8512HFLU-00BLL
13901 Points +23%
Dell XPS 13 DX13260
Intel Graphics 2 Xe3 WCL, Core 5 320
11334 Points
Média Intel Core 5 320, Intel Graphics 2 Xe3 Wildcat Lake iGPU
  (n=1)
11334 Points 0%
Dell XPS 13 9350
Arc 140V, Core Ultra 7 256V, Micron 2550 512GB
9219 Points -19%
PCMark 10 / Digital Content Creation
Dell XPS 14 Core Ultra X7 358H
Arc B390 Panther Lake iGPU, Ultra X7 358H, Samsung PM9C1b MZVL81T0HFLB-00BH1
13847 Points +114%
Dell XPS 13 9350
Arc 140V, Core Ultra 7 256V, Micron 2550 512GB
9898 Points +53%
HP OmniBook 7 Aero 13-bg1077nr
Radeon 860M, Ryzen AI 7 350, SK hynix PC801 HFS001TEJ9X101N
9219 Points +42%
Lenovo ThinkPad X1 Carbon Gen 14 21V70075GE
Intel Graphics 4 Xe3 PTL, Ultra 5 325, Samsung PM9C1b MZVL8512HFLU-00BLL
8998 Points +39%
Dell XPS 13 DX13260
Intel Graphics 2 Xe3 WCL, Core 5 320
6482 Points
Média Intel Core 5 320, Intel Graphics 2 Xe3 Wildcat Lake iGPU
  (n=1)
6482 Points 0%
CrossMark / Overall
Dell XPS 14 Core Ultra X7 358H
Arc B390 Panther Lake iGPU, Ultra X7 358H, Samsung PM9C1b MZVL81T0HFLB-00BH1
1955 Points +29%
Dell XPS 13 9350
Arc 140V, Core Ultra 7 256V, Micron 2550 512GB
1736 Points +15%
Apple MacBook Neo 256 GB
A18 GPU, A18 Pro, Apple SSD AP0256Z
1715 Points +14%
Lenovo ThinkPad X1 Carbon Gen 14 21V70075GE
Intel Graphics 4 Xe3 PTL, Ultra 5 325, Samsung PM9C1b MZVL8512HFLU-00BLL
1675 Points +11%
Dell XPS 13 DX13260
Intel Graphics 2 Xe3 WCL, Core 5 320
1511 Points
Média Intel Core 5 320, Intel Graphics 2 Xe3 Wildcat Lake iGPU
  (n=1)
1511 Points 0%
HP OmniBook 7 Aero 13-bg1077nr
Radeon 860M, Ryzen AI 7 350, SK hynix PC801 HFS001TEJ9X101N
1406 Points -7%
CrossMark / Productivity
Apple MacBook Neo 256 GB
A18 GPU, A18 Pro, Apple SSD AP0256Z
1808 Points +15%
Dell XPS 14 Core Ultra X7 358H
Arc B390 Panther Lake iGPU, Ultra X7 358H, Samsung PM9C1b MZVL81T0HFLB-00BH1
1719 Points +9%
Dell XPS 13 9350
Arc 140V, Core Ultra 7 256V, Micron 2550 512GB
1682 Points +7%
Lenovo ThinkPad X1 Carbon Gen 14 21V70075GE
Intel Graphics 4 Xe3 PTL, Ultra 5 325, Samsung PM9C1b MZVL8512HFLU-00BLL
1652 Points +5%
Dell XPS 13 DX13260
Intel Graphics 2 Xe3 WCL, Core 5 320
1570 Points
Média Intel Core 5 320, Intel Graphics 2 Xe3 Wildcat Lake iGPU
  (n=1)
1570 Points 0%
HP OmniBook 7 Aero 13-bg1077nr
Radeon 860M, Ryzen AI 7 350, SK hynix PC801 HFS001TEJ9X101N
1247 Points -21%
CrossMark / Creativity
Dell XPS 14 Core Ultra X7 358H
Arc B390 Panther Lake iGPU, Ultra X7 358H, Samsung PM9C1b MZVL81T0HFLB-00BH1
2398 Points +59%
Dell XPS 13 9350
Arc 140V, Core Ultra 7 256V, Micron 2550 512GB
1953 Points +30%
Apple MacBook Neo 256 GB
A18 GPU, A18 Pro, Apple SSD AP0256Z
1809 Points +20%
Lenovo ThinkPad X1 Carbon Gen 14 21V70075GE
Intel Graphics 4 Xe3 PTL, Ultra 5 325, Samsung PM9C1b MZVL8512HFLU-00BLL
1756 Points +17%
HP OmniBook 7 Aero 13-bg1077nr
Radeon 860M, Ryzen AI 7 350, SK hynix PC801 HFS001TEJ9X101N
1676 Points +11%
Dell XPS 13 DX13260
Intel Graphics 2 Xe3 WCL, Core 5 320
1505 Points
Média Intel Core 5 320, Intel Graphics 2 Xe3 Wildcat Lake iGPU
  (n=1)
1505 Points 0%
CrossMark / Responsiveness
Dell XPS 14 Core Ultra X7 358H
Arc B390 Panther Lake iGPU, Ultra X7 358H, Samsung PM9C1b MZVL81T0HFLB-00BH1
1560 Points +14%
Lenovo ThinkPad X1 Carbon Gen 14 21V70075GE
Intel Graphics 4 Xe3 PTL, Ultra 5 325, Samsung PM9C1b MZVL8512HFLU-00BLL
1511 Points +11%
Dell XPS 13 DX13260
Intel Graphics 2 Xe3 WCL, Core 5 320
1363 Points
Média Intel Core 5 320, Intel Graphics 2 Xe3 Wildcat Lake iGPU
  (n=1)
1363 Points 0%
Dell XPS 13 9350
Arc 140V, Core Ultra 7 256V, Micron 2550 512GB
1343 Points -1%
Apple MacBook Neo 256 GB
A18 GPU, A18 Pro, Apple SSD AP0256Z
1248 Points -8%
HP OmniBook 7 Aero 13-bg1077nr
Radeon 860M, Ryzen AI 7 350, SK hynix PC801 HFS001TEJ9X101N
1191 Points -13%
WebXPRT 3 / Overall
Apple MacBook Neo 256 GB
A18 GPU, A18 Pro, Apple SSD AP0256Z
450 Points +76%
Dell XPS 14 Core Ultra X7 358H
Arc B390 Panther Lake iGPU, Ultra X7 358H, Samsung PM9C1b MZVL81T0HFLB-00BH1
338 Points +33%
Dell XPS 13 9350
Arc 140V, Core Ultra 7 256V, Micron 2550 512GB
310 Points +22%
Lenovo ThinkPad X1 Carbon Gen 14 21V70075GE
Intel Graphics 4 Xe3 PTL, Ultra 5 325, Samsung PM9C1b MZVL8512HFLU-00BLL
295 Points +16%
HP OmniBook 7 Aero 13-bg1077nr
Radeon 860M, Ryzen AI 7 350, SK hynix PC801 HFS001TEJ9X101N
259 Points +2%
Dell XPS 13 DX13260
Intel Graphics 2 Xe3 WCL, Core 5 320
255 Points
Média Intel Core 5 320, Intel Graphics 2 Xe3 Wildcat Lake iGPU
  (n=1)
255 Points 0%
WebXPRT 4 / Overall
Apple MacBook Neo 256 GB
A18 GPU, A18 Pro, Apple SSD AP0256Z
326 Points +21%
Dell XPS 14 Core Ultra X7 358H
Arc B390 Panther Lake iGPU, Ultra X7 358H, Samsung PM9C1b MZVL81T0HFLB-00BH1
305 Points +13%
Dell XPS 13 9350
Arc 140V, Core Ultra 7 256V, Micron 2550 512GB
286 Points +6%
Lenovo ThinkPad X1 Carbon Gen 14 21V70075GE
Intel Graphics 4 Xe3 PTL, Ultra 5 325, Samsung PM9C1b MZVL8512HFLU-00BLL
269 Points 0%
Dell XPS 13 DX13260
Intel Graphics 2 Xe3 WCL, Core 5 320
269 Points
Média Intel Core 5 320, Intel Graphics 2 Xe3 Wildcat Lake iGPU
  (n=1)
269 Points 0%
HP OmniBook 7 Aero 13-bg1077nr
Radeon 860M, Ryzen AI 7 350, SK hynix PC801 HFS001TEJ9X101N
249 Points -7%
Mozilla Kraken 1.1 / Total
HP OmniBook 7 Aero 13-bg1077nr
Radeon 860M, Ryzen AI 7 350, SK hynix PC801 HFS001TEJ9X101N
702 ms * -41%
Lenovo ThinkPad X1 Carbon Gen 14 21V70075GE
Intel Graphics 4 Xe3 PTL, Ultra 5 325, Samsung PM9C1b MZVL8512HFLU-00BLL
517 ms * -4%
Dell XPS 13 DX13260
Intel Graphics 2 Xe3 WCL, Core 5 320
497 ms *
Média Intel Core 5 320, Intel Graphics 2 Xe3 Wildcat Lake iGPU
  (n=1)
497 ms * -0%
Dell XPS 13 9350
Arc 140V, Core Ultra 7 256V, Micron 2550 512GB
472 ms * +5%
Dell XPS 14 Core Ultra X7 358H
Arc B390 Panther Lake iGPU, Ultra X7 358H, Samsung PM9C1b MZVL81T0HFLB-00BH1
445 ms * +10%
Apple MacBook Neo 256 GB
A18 GPU, A18 Pro, Apple SSD AP0256Z
273.4 ms * +45%

* ... menor é melhor

PCMark 10 Score
6159 pontos
Ajuda
AIDA64 / Memory Copy
Dell XPS 14 Core Ultra X7 358H
Intel Core Ultra X7 358H, Arc B390 Panther Lake iGPU
131796 MB/s +709%
Lenovo ThinkPad X1 Carbon Gen 14 21V70075GE
Intel Core Ultra 5 325, Intel Graphics 4 Xe3 PTL
104952 MB/s +544%
Dell XPS 13 9350
Intel Core Ultra 7 256V, Arc 140V
101642 MB/s +524%
HP OmniBook 7 Aero 13-bg1077nr
AMD Ryzen AI 7 350, Radeon 860M
84918 MB/s +421%
Dell XPS 13 DX13260
Intel Core 5 320, Intel Graphics 2 Xe3 WCL
16289 MB/s
Média Intel Core 5 320
  (n=1)
16289 MB/s 0%
AIDA64 / Memory Read
Dell XPS 14 Core Ultra X7 358H
Intel Core Ultra X7 358H, Arc B390 Panther Lake iGPU
114349 MB/s +586%
Dell XPS 13 9350
Intel Core Ultra 7 256V, Arc 140V
88013 MB/s +428%
Lenovo ThinkPad X1 Carbon Gen 14 21V70075GE
Intel Core Ultra 5 325, Intel Graphics 4 Xe3 PTL
83896 MB/s +403%
HP OmniBook 7 Aero 13-bg1077nr
AMD Ryzen AI 7 350, Radeon 860M
63477 MB/s +281%
Dell XPS 13 DX13260
Intel Core 5 320, Intel Graphics 2 Xe3 WCL
16674 MB/s
Média Intel Core 5 320
  (n=1)
16674 MB/s 0%
AIDA64 / Memory Write
Dell XPS 14 Core Ultra X7 358H
Intel Core Ultra X7 358H, Arc B390 Panther Lake iGPU
134916 MB/s +627%
Dell XPS 13 9350
Intel Core Ultra 7 256V, Arc 140V
112340 MB/s +505%
Lenovo ThinkPad X1 Carbon Gen 14 21V70075GE
Intel Core Ultra 5 325, Intel Graphics 4 Xe3 PTL
108023 MB/s +482%
HP OmniBook 7 Aero 13-bg1077nr
AMD Ryzen AI 7 350, Radeon 860M
102762 MB/s +454%
Dell XPS 13 DX13260
Intel Core 5 320, Intel Graphics 2 Xe3 WCL
18564 MB/s
Média Intel Core 5 320
  (n=1)
18564 MB/s 0%
AIDA64 / Memory Latency
Dell XPS 13 DX13260
Intel Core 5 320, Intel Graphics 2 Xe3 WCL
317 ns *
Média Intel Core 5 320
  (n=1)
317 ns * -0%
HP OmniBook 7 Aero 13-bg1077nr
AMD Ryzen AI 7 350, Radeon 860M
104 ns * +67%
Dell XPS 13 9350
Intel Core Ultra 7 256V, Arc 140V
99.6 ns * +69%
Lenovo ThinkPad X1 Carbon Gen 14 21V70075GE
Intel Core Ultra 5 325, Intel Graphics 4 Xe3 PTL
98.5 ns * +69%
Dell XPS 14 Core Ultra X7 358H
Intel Core Ultra X7 358H, Arc B390 Panther Lake iGPU
87.8 ns * +72%

* ... menor é melhor

Latência do DPC

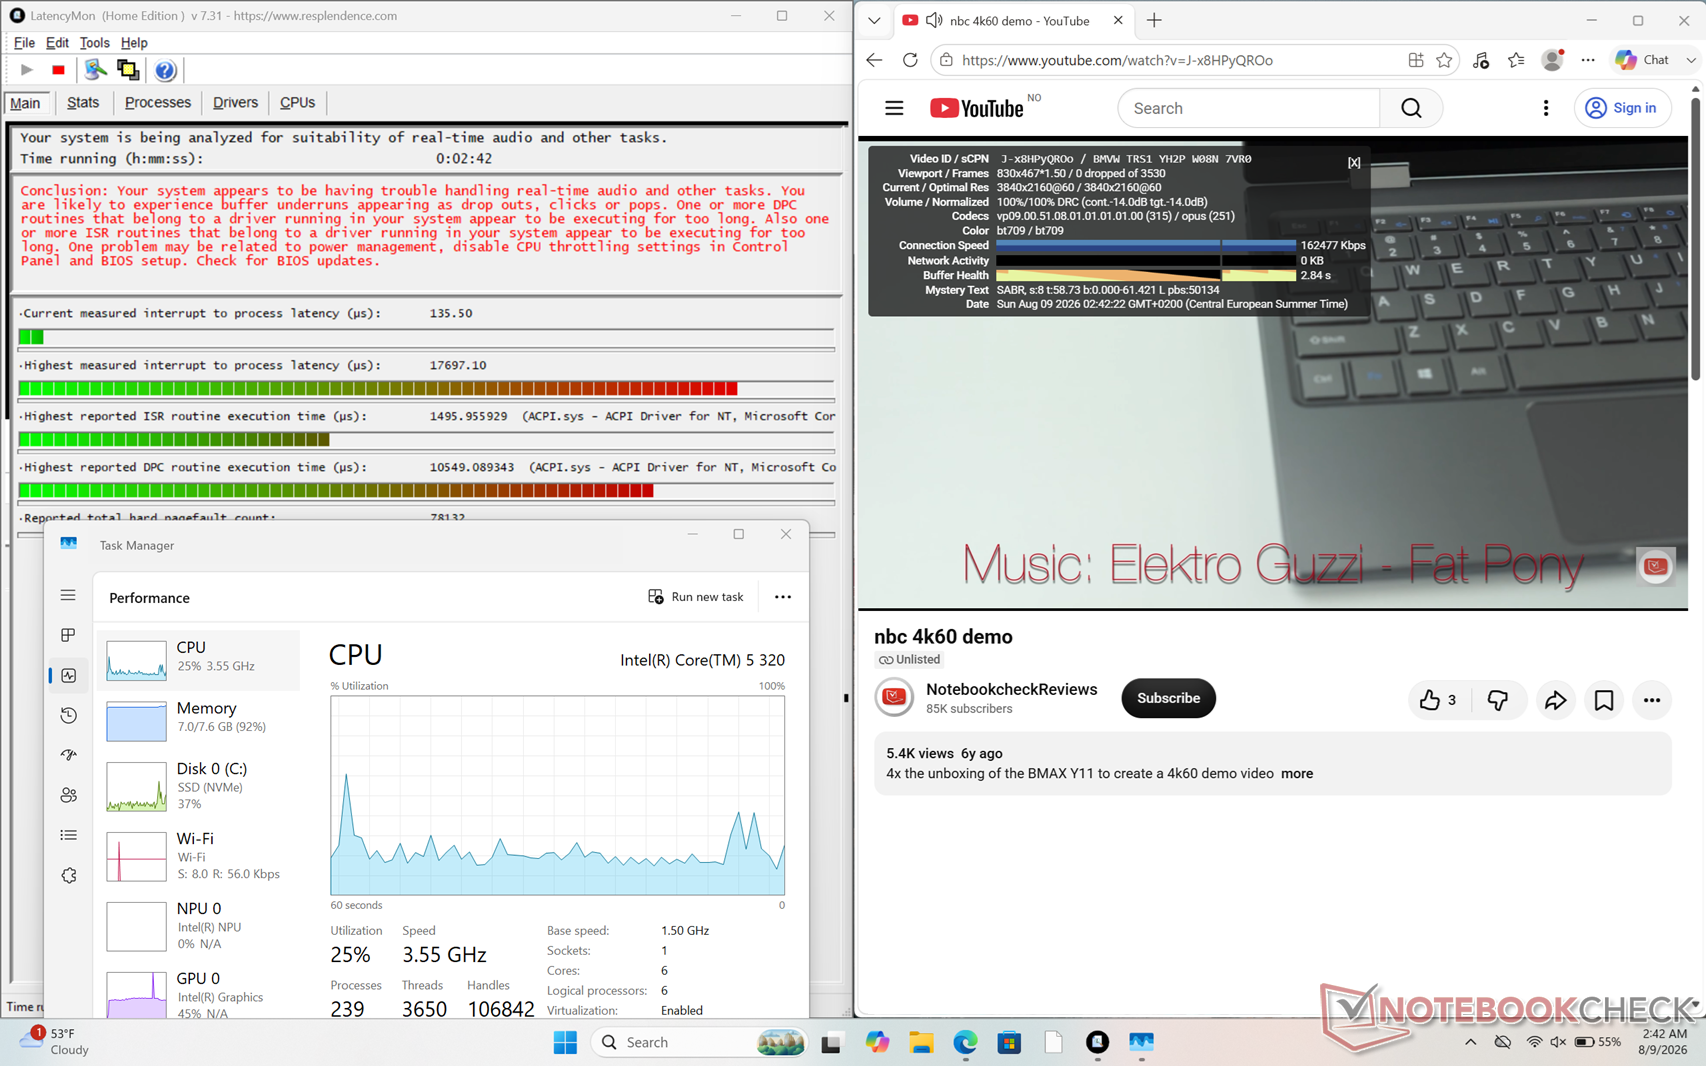
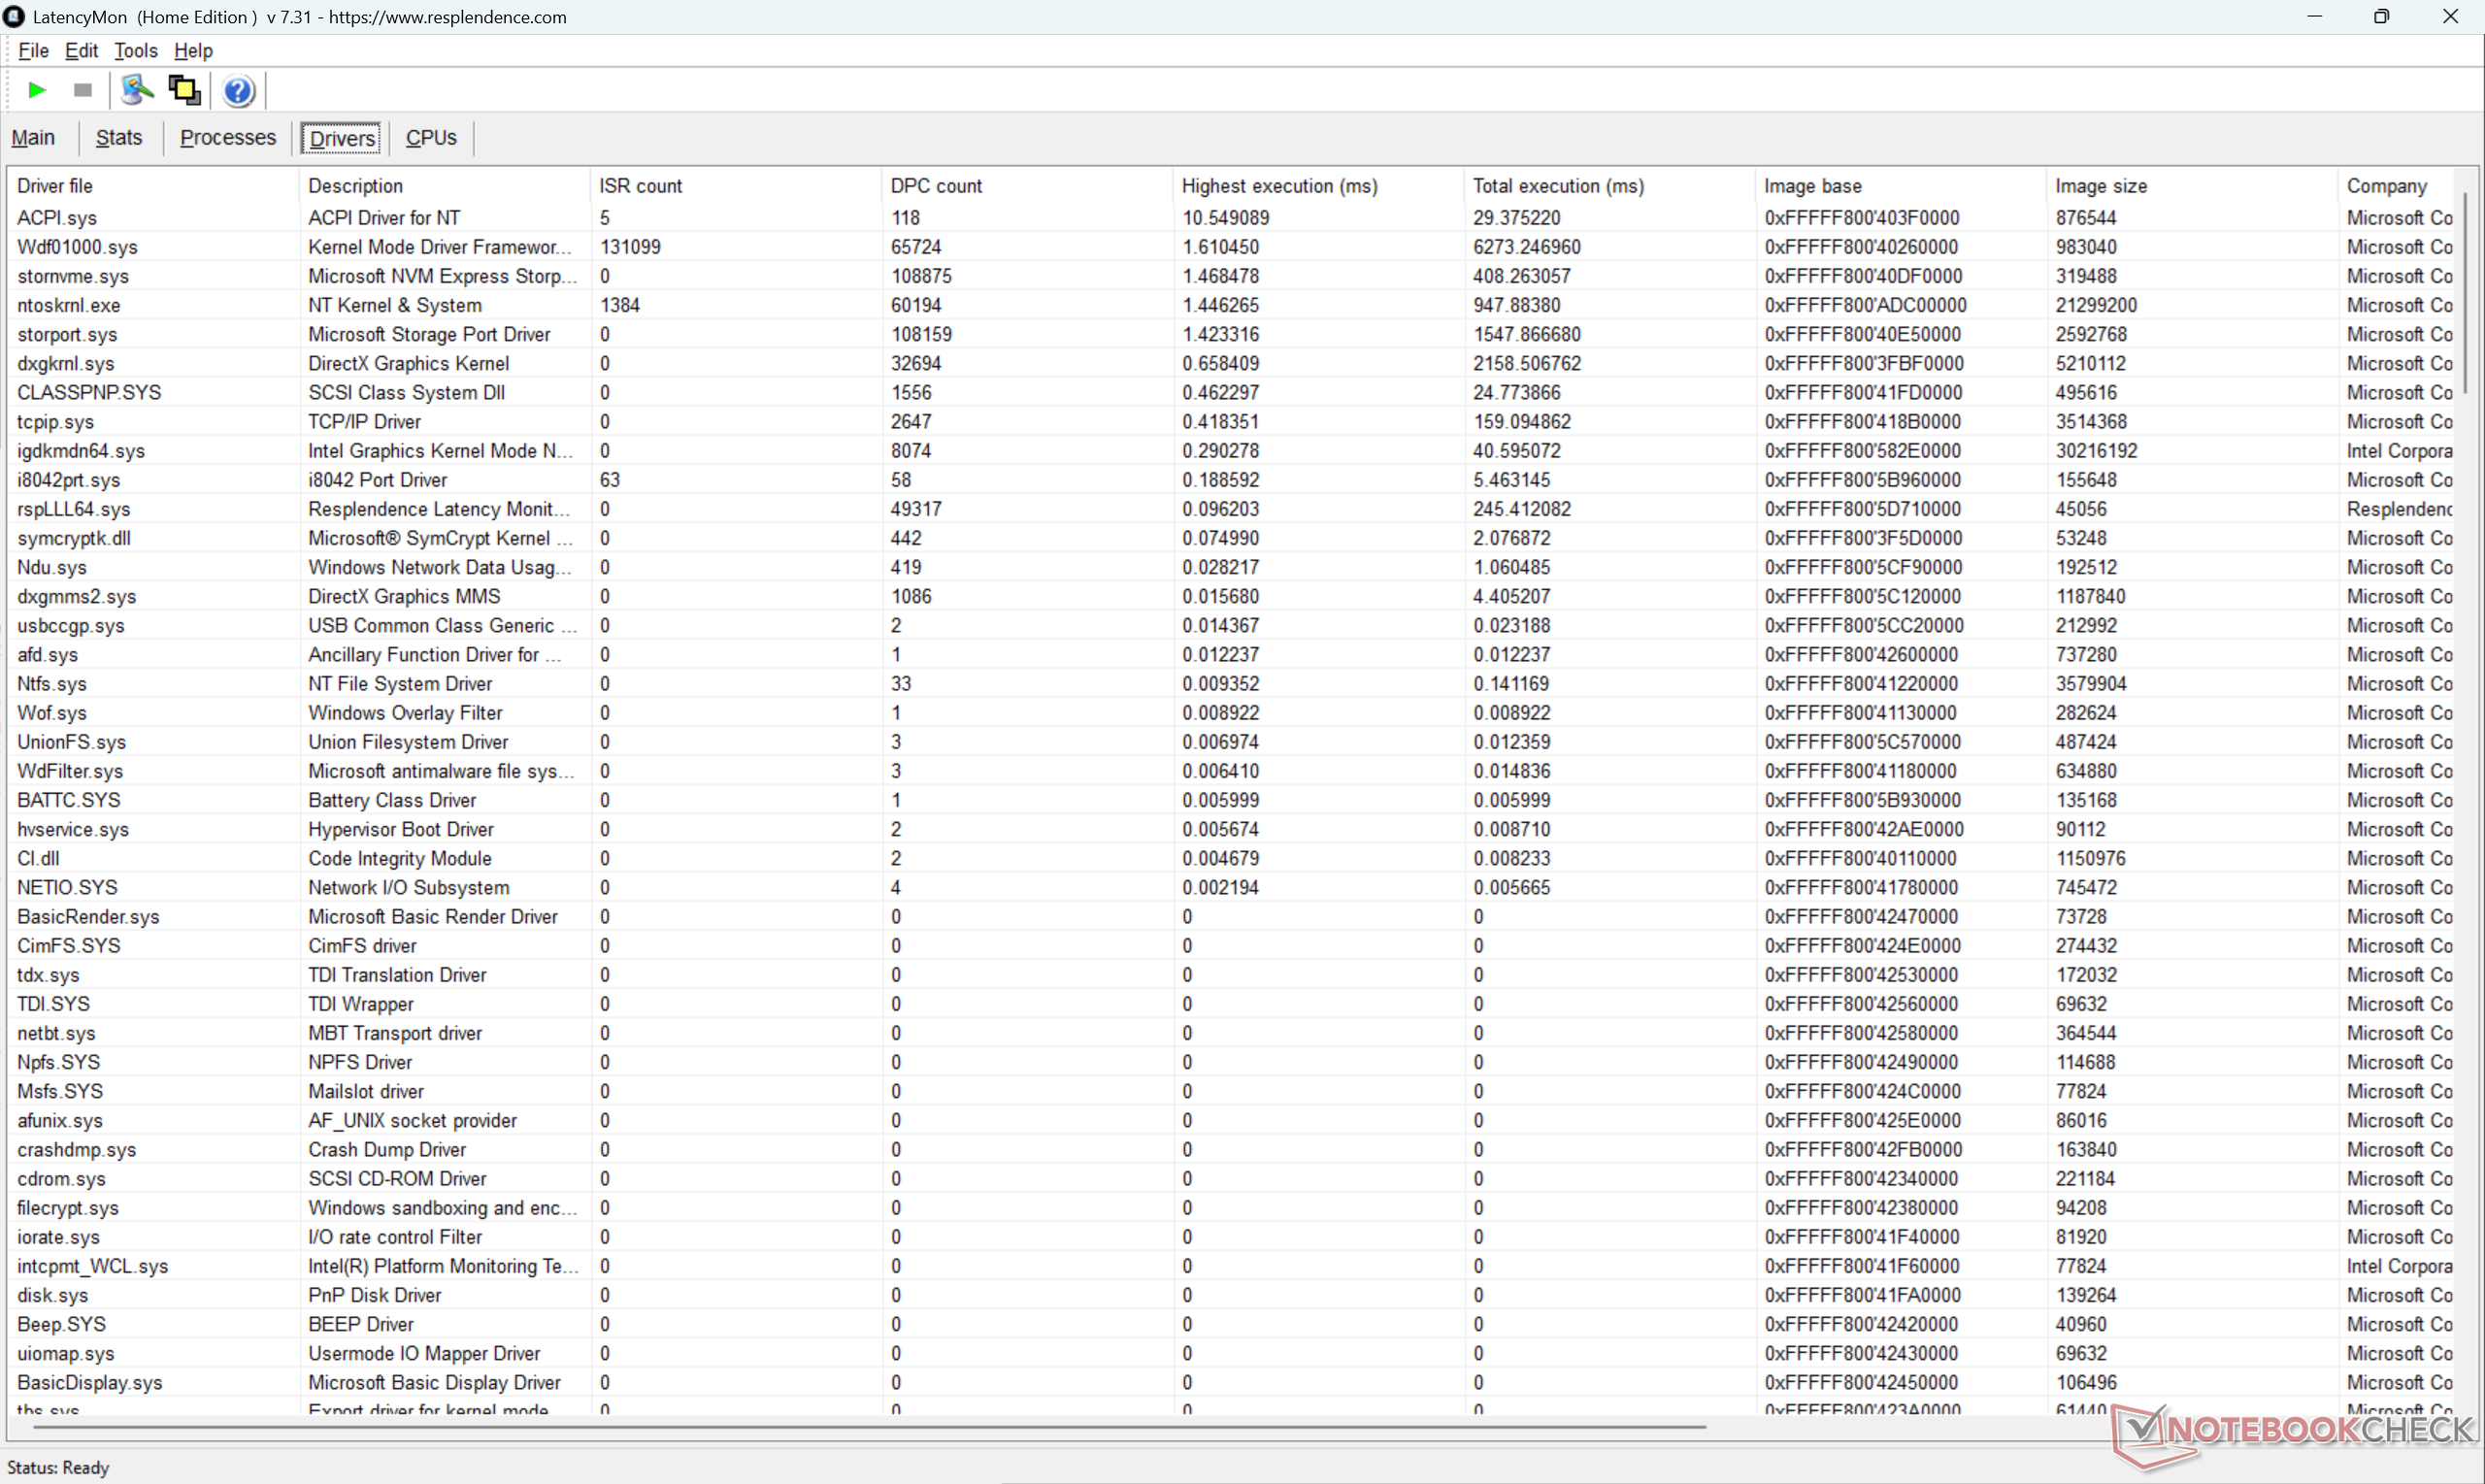
O LatencyMon mostra problemas de DPC, mas, fora isso, não há perda de quadros durante a reprodução de vídeo em 4K a 60 fps
Lista de drivers
Lista de drivers
DPC Latencies / LatencyMon - interrupt to process latency (max), Web, Youtube, Prime95
Dell XPS 13 DX13260
Intel Graphics 2 Xe3 WCL, Core 5 320
17697.1 μs *
Lenovo ThinkPad X1 Carbon Gen 14 21V70075GE
Intel Graphics 4 Xe3 PTL, Ultra 5 325, Samsung PM9C1b MZVL8512HFLU-00BLL
3000.2 μs * +83%
Dell XPS 14 Core Ultra X7 358H
Arc B390 Panther Lake iGPU, Ultra X7 358H, Samsung PM9C1b MZVL81T0HFLB-00BH1
872.4 μs * +95%
HP OmniBook 7 Aero 13-bg1077nr
Radeon 860M, Ryzen AI 7 350, SK hynix PC801 HFS001TEJ9X101N
719 μs * +96%

* ... menor é melhor

Dispositivos de armazenamento
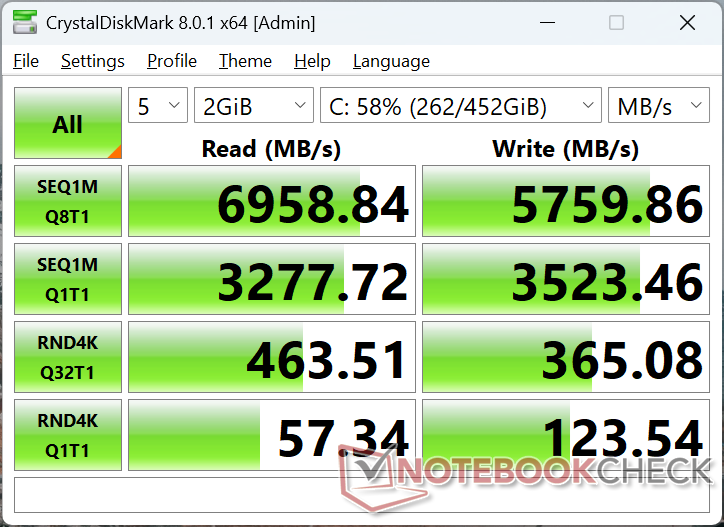
CDM 8
CDM 8
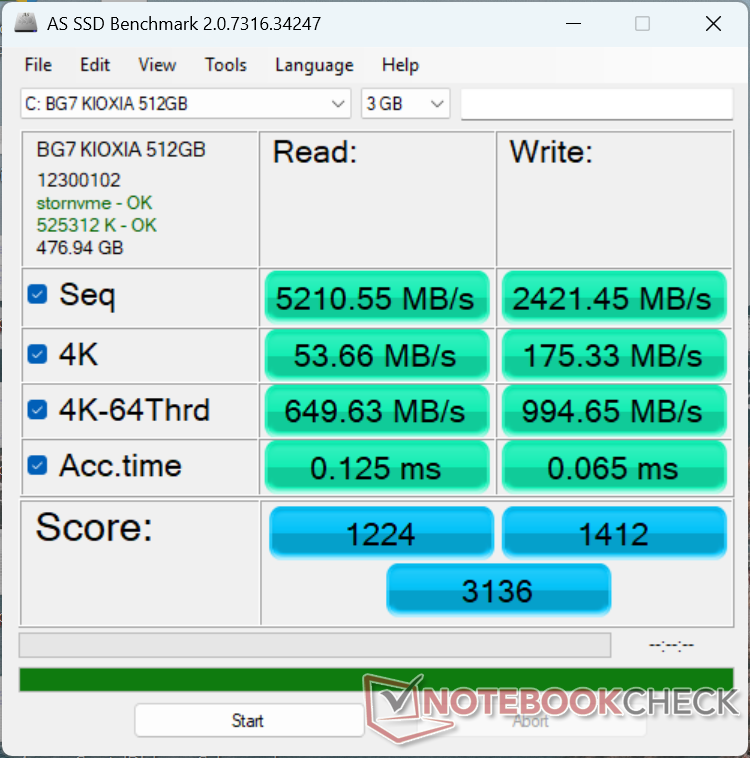
AS SSD
AS SSD
CDM 5/6 Read Seq Q32T1: 7107 MB/s
CDM 5/6 Write Seq Q32T1: 4462 MB/s
CDM 5/6 Read 4K Q32T1: 467.5 MB/s
CDM 5/6 Write 4K Q32T1: 359.6 MB/s
CDM 5 Read Seq: 3262 MB/s
CDM 5 Write Seq: 3536 MB/s
CDM 5/6 Read 4K: 59.62 MB/s
CDM 5/6 Write 4K: 116.7 MB/s
Drive Performance rating - Percent
HP OmniBook 7 Aero 13-bg1077nr
SK hynix PC801 HFS001TEJ9X101N
81.6 pt
Lenovo ThinkPad X1 Carbon Gen 14 21V70075GE
Samsung PM9C1b MZVL8512HFLU-00BLL
79.8 pt
Dell XPS 14 Core Ultra X7 358H
Samsung PM9C1b MZVL81T0HFLB-00BH1
77.7 pt
Dell XPS 13 DX13260
 
66.2 pt
Dell XPS 13 9350
Micron 2550 512GB
60.2 pt
DiskSpd
seq read
HP OmniBook 7 Aero 13-bg1077nr
SK hynix PC801 HFS001TEJ9X101N
4375 (4333.49min - 4375.35max) MB/s +32%
Dell XPS 13 DX13260
 
3317 (3282.04min - 3316.51max) MB/s
Lenovo ThinkPad X1 Carbon Gen 14 21V70075GE
Samsung PM9C1b MZVL8512HFLU-00BLL
3223 (3130.84min - 3223.17max) MB/s -3%
Dell XPS 14 Core Ultra X7 358H
Samsung PM9C1b MZVL81T0HFLB-00BH1
2967 (2659.4min - 2966.9max) MB/s -11%
Dell XPS 13 9350
Micron 2550 512GB
2416 (2299.74min - 2415.91max) MB/s -27%
seq write
HP OmniBook 7 Aero 13-bg1077nr
SK hynix PC801 HFS001TEJ9X101N
3662 (3599.27min - 3661.63max) MB/s +12%
Dell XPS 13 DX13260
 
3272 (3191.03min - 3271.98max) MB/s
Lenovo ThinkPad X1 Carbon Gen 14 21V70075GE
Samsung PM9C1b MZVL8512HFLU-00BLL
3265 (2792.78min - 3265.27max) MB/s 0%
Dell XPS 13 9350
Micron 2550 512GB
2477 (2281.75min - 2476.53max) MB/s -24%
Dell XPS 14 Core Ultra X7 358H
Samsung PM9C1b MZVL81T0HFLB-00BH1
2327 (2217.14min - 2327max) MB/s -29%
seq q8 t1 read
HP OmniBook 7 Aero 13-bg1077nr
SK hynix PC801 HFS001TEJ9X101N
7169 (6417.08min - 7168.69max) MB/s +3%
Dell XPS 14 Core Ultra X7 358H
Samsung PM9C1b MZVL81T0HFLB-00BH1
7037 (5759.83min - 7037.41max) MB/s +1%
Dell XPS 13 DX13260
 
6964 (5869.51min - 6964.43max) MB/s
Lenovo ThinkPad X1 Carbon Gen 14 21V70075GE
Samsung PM9C1b MZVL8512HFLU-00BLL
6949 (5380.03min - 6948.7max) MB/s 0%
Dell XPS 13 9350
Micron 2550 512GB
5057 (4337.25min - 5057.07max) MB/s -27%
seq q8 t1 write
HP OmniBook 7 Aero 13-bg1077nr
SK hynix PC801 HFS001TEJ9X101N
6156 (6136.27min - 6155.83max) MB/s +9%
Lenovo ThinkPad X1 Carbon Gen 14 21V70075GE
Samsung PM9C1b MZVL8512HFLU-00BLL
5863 (5795.9min - 5862.8max) MB/s +4%
Dell XPS 13 DX13260
 
5647 (5306.51min - 5646.79max) MB/s
Dell XPS 14 Core Ultra X7 358H
Samsung PM9C1b MZVL81T0HFLB-00BH1
5595 (5550.94min - 5595.34max) MB/s -1%
Dell XPS 13 9350
Micron 2550 512GB
4062 (3975.8min - 4061.61max) MB/s -28%
4k q1 t1 read
Lenovo ThinkPad X1 Carbon Gen 14 21V70075GE
Samsung PM9C1b MZVL8512HFLU-00BLL
74.6 (69.99min - 74.6max) MB/s +18%
Dell XPS 13 DX13260
 
63.4 (62.65min - 63.44max) MB/s
Dell XPS 14 Core Ultra X7 358H
Samsung PM9C1b MZVL81T0HFLB-00BH1
61.8 (59.95min - 61.82max) MB/s -3%
HP OmniBook 7 Aero 13-bg1077nr
SK hynix PC801 HFS001TEJ9X101N
54.6 (53.89min - 54.55max) MB/s -14%
Dell XPS 13 9350
Micron 2550 512GB
53.2 (50.58min - 53.24max) MB/s -16%
4k q1 t1 write
Lenovo ThinkPad X1 Carbon Gen 14 21V70075GE
Samsung PM9C1b MZVL8512HFLU-00BLL
171.1 (149.61min - 171.12max) MB/s +11%
Dell XPS 13 DX13260
 
154.1 (152.71min - 154.07max) MB/s
Dell XPS 14 Core Ultra X7 358H
Samsung PM9C1b MZVL81T0HFLB-00BH1
139.7 (138.86min - 139.67max) MB/s -9%
Dell XPS 13 9350
Micron 2550 512GB
139.2 (136.33min - 139.15max) MB/s -10%
HP OmniBook 7 Aero 13-bg1077nr
SK hynix PC801 HFS001TEJ9X101N
129.2 (122.07min - 129.16max) MB/s -16%
4k q32 t16 read
HP OmniBook 7 Aero 13-bg1077nr
SK hynix PC801 HFS001TEJ9X101N
970 (862.72min - 969.93max) MB/s +75%
Dell XPS 14 Core Ultra X7 358H
Samsung PM9C1b MZVL81T0HFLB-00BH1
711 (562.02min - 711.38max) MB/s +28%
Lenovo ThinkPad X1 Carbon Gen 14 21V70075GE
Samsung PM9C1b MZVL8512HFLU-00BLL
677 (649.67min - 677.04max) MB/s +22%
Dell XPS 13 9350
Micron 2550 512GB
640 (630.5min - 640.27max) MB/s +16%
Dell XPS 13 DX13260
 
554 (539.77min - 554.36max) MB/s
4k q32 t16 write
HP OmniBook 7 Aero 13-bg1077nr
SK hynix PC801 HFS001TEJ9X101N
545 (535.65min - 545.01max) MB/s +93%
Lenovo ThinkPad X1 Carbon Gen 14 21V70075GE
Samsung PM9C1b MZVL8512HFLU-00BLL
471 (431.88min - 471.05max) MB/s +66%
Dell XPS 14 Core Ultra X7 358H
Samsung PM9C1b MZVL81T0HFLB-00BH1
432 (319.99min - 432.49max) MB/s +53%
Dell XPS 13 9350
Micron 2550 512GB
374 (359.04min - 373.65max) MB/s +32%
Dell XPS 13 DX13260
 
283 (279.07min - 282.59max) MB/s
AS SSD
Score Total
Dell XPS 14 Core Ultra X7 358H
Samsung PM9C1b MZVL81T0HFLB-00BH1
5466 Points +74%
HP OmniBook 7 Aero 13-bg1077nr
SK hynix PC801 HFS001TEJ9X101N
4484 Points +43%
Lenovo ThinkPad X1 Carbon Gen 14 21V70075GE
Samsung PM9C1b MZVL8512HFLU-00BLL
3647 Points +16%
Dell XPS 13 9350
Micron 2550 512GB
3176 Points +1%
Dell XPS 13 DX13260
 
3136 Points
Score Read
HP OmniBook 7 Aero 13-bg1077nr
SK hynix PC801 HFS001TEJ9X101N
1805 Points +47%
Dell XPS 14 Core Ultra X7 358H
Samsung PM9C1b MZVL81T0HFLB-00BH1
1402 Points +15%
Lenovo ThinkPad X1 Carbon Gen 14 21V70075GE
Samsung PM9C1b MZVL8512HFLU-00BLL
1272 Points +4%
Dell XPS 13 DX13260
 
1224 Points
Dell XPS 13 9350
Micron 2550 512GB
1096 Points -10%
Score Write
Dell XPS 14 Core Ultra X7 358H
Samsung PM9C1b MZVL81T0HFLB-00BH1
3375 Points +139%
HP OmniBook 7 Aero 13-bg1077nr
SK hynix PC801 HFS001TEJ9X101N
1856 Points +31%
Lenovo ThinkPad X1 Carbon Gen 14 21V70075GE
Samsung PM9C1b MZVL8512HFLU-00BLL
1798 Points +27%
Dell XPS 13 9350
Micron 2550 512GB
1572 Points +11%
Dell XPS 13 DX13260
 
1412 Points
Seq Read
HP OmniBook 7 Aero 13-bg1077nr
SK hynix PC801 HFS001TEJ9X101N
5217.29 MB/s 0%
Dell XPS 13 DX13260
 
5210.55 MB/s
Lenovo ThinkPad X1 Carbon Gen 14 21V70075GE
Samsung PM9C1b MZVL8512HFLU-00BLL
5129 MB/s -2%
Dell XPS 14 Core Ultra X7 358H
Samsung PM9C1b MZVL81T0HFLB-00BH1
4161.24 MB/s -20%
Dell XPS 13 9350
Micron 2550 512GB
3933.86 MB/s -25%
Seq Write
Dell XPS 14 Core Ultra X7 358H
Samsung PM9C1b MZVL81T0HFLB-00BH1
3356.2 MB/s +39%
Lenovo ThinkPad X1 Carbon Gen 14 21V70075GE
Samsung PM9C1b MZVL8512HFLU-00BLL
3282 MB/s +36%
HP OmniBook 7 Aero 13-bg1077nr
SK hynix PC801 HFS001TEJ9X101N
3126.39 MB/s +29%
Dell XPS 13 9350
Micron 2550 512GB
2608.98 MB/s +8%
Dell XPS 13 DX13260
 
2421.45 MB/s
4K Read
Lenovo ThinkPad X1 Carbon Gen 14 21V70075GE
Samsung PM9C1b MZVL8512HFLU-00BLL
67.7 MB/s +26%
Dell XPS 14 Core Ultra X7 358H
Samsung PM9C1b MZVL81T0HFLB-00BH1
57.94 MB/s +8%
Dell XPS 13 DX13260
 
53.66 MB/s
HP OmniBook 7 Aero 13-bg1077nr
SK hynix PC801 HFS001TEJ9X101N
52.5 MB/s -2%
Dell XPS 13 9350
Micron 2550 512GB
51.9 MB/s -3%
4K Write
Dell XPS 14 Core Ultra X7 358H
Samsung PM9C1b MZVL81T0HFLB-00BH1
183.04 MB/s +4%
Dell XPS 13 DX13260
 
175.33 MB/s
Lenovo ThinkPad X1 Carbon Gen 14 21V70075GE
Samsung PM9C1b MZVL8512HFLU-00BLL
173.8 MB/s -1%
HP OmniBook 7 Aero 13-bg1077nr
SK hynix PC801 HFS001TEJ9X101N
144.39 MB/s -18%
Dell XPS 13 9350
Micron 2550 512GB
138.37 MB/s -21%
4K-64 Read
HP OmniBook 7 Aero 13-bg1077nr
SK hynix PC801 HFS001TEJ9X101N
1230.46 MB/s +89%
Dell XPS 14 Core Ultra X7 358H
Samsung PM9C1b MZVL81T0HFLB-00BH1
927.71 MB/s +43%
Lenovo ThinkPad X1 Carbon Gen 14 21V70075GE
Samsung PM9C1b MZVL8512HFLU-00BLL
691 MB/s +6%
Dell XPS 13 9350
Micron 2550 512GB
650.78 MB/s 0%
Dell XPS 13 DX13260
 
649.63 MB/s
4K-64 Write
Dell XPS 14 Core Ultra X7 358H
Samsung PM9C1b MZVL81T0HFLB-00BH1
2856.06 MB/s +187%
HP OmniBook 7 Aero 13-bg1077nr
SK hynix PC801 HFS001TEJ9X101N
1398.51 MB/s +41%
Lenovo ThinkPad X1 Carbon Gen 14 21V70075GE
Samsung PM9C1b MZVL8512HFLU-00BLL
1295 MB/s +30%
Dell XPS 13 9350
Micron 2550 512GB
1172.49 MB/s +18%
Dell XPS 13 DX13260
 
994.65 MB/s
Access Time Read
Dell XPS 13 DX13260
 
0.125 ms *
Dell XPS 14 Core Ultra X7 358H
Samsung PM9C1b MZVL81T0HFLB-00BH1
0.103 ms * +18%
Dell XPS 13 9350
Micron 2550 512GB
0.091 ms * +27%
Lenovo ThinkPad X1 Carbon Gen 14 21V70075GE
Samsung PM9C1b MZVL8512HFLU-00BLL
0.058 ms * +54%
HP OmniBook 7 Aero 13-bg1077nr
SK hynix PC801 HFS001TEJ9X101N
0.043 ms * +66%
Access Time Write
HP OmniBook 7 Aero 13-bg1077nr
SK hynix PC801 HFS001TEJ9X101N
0.08 ms * -23%
Dell XPS 14 Core Ultra X7 358H
Samsung PM9C1b MZVL81T0HFLB-00BH1
0.077 ms * -18%
Dell XPS 13 9350
Micron 2550 512GB
0.076 ms * -17%
Dell XPS 13 DX13260
 
0.065 ms *
Lenovo ThinkPad X1 Carbon Gen 14 21V70075GE
Samsung PM9C1b MZVL8512HFLU-00BLL
0.026 ms * +60%

* ... menor é melhor

Limitação de disco: Loop de leitura do DiskSpd, profundidade da fila 8

0145290435580725870101511601305145015951740188520302175232024652610275529003045319033353480362537703915406042054350449546404785493050755220536555105655580059456090623563806525667068156960Tooltip
Dell XPS 13 DX13260  ; diskspd 2.0.17 f: Ø6973 (5927.07-7011.62) MB/s
Dell XPS 14 Core Ultra X7 358H Samsung PM9C1b MZVL81T0HFLB-00BH1; diskspd 2.0.17 f: Ø7012 (6080.06-7044.75) MB/s

Desempenho da GPU

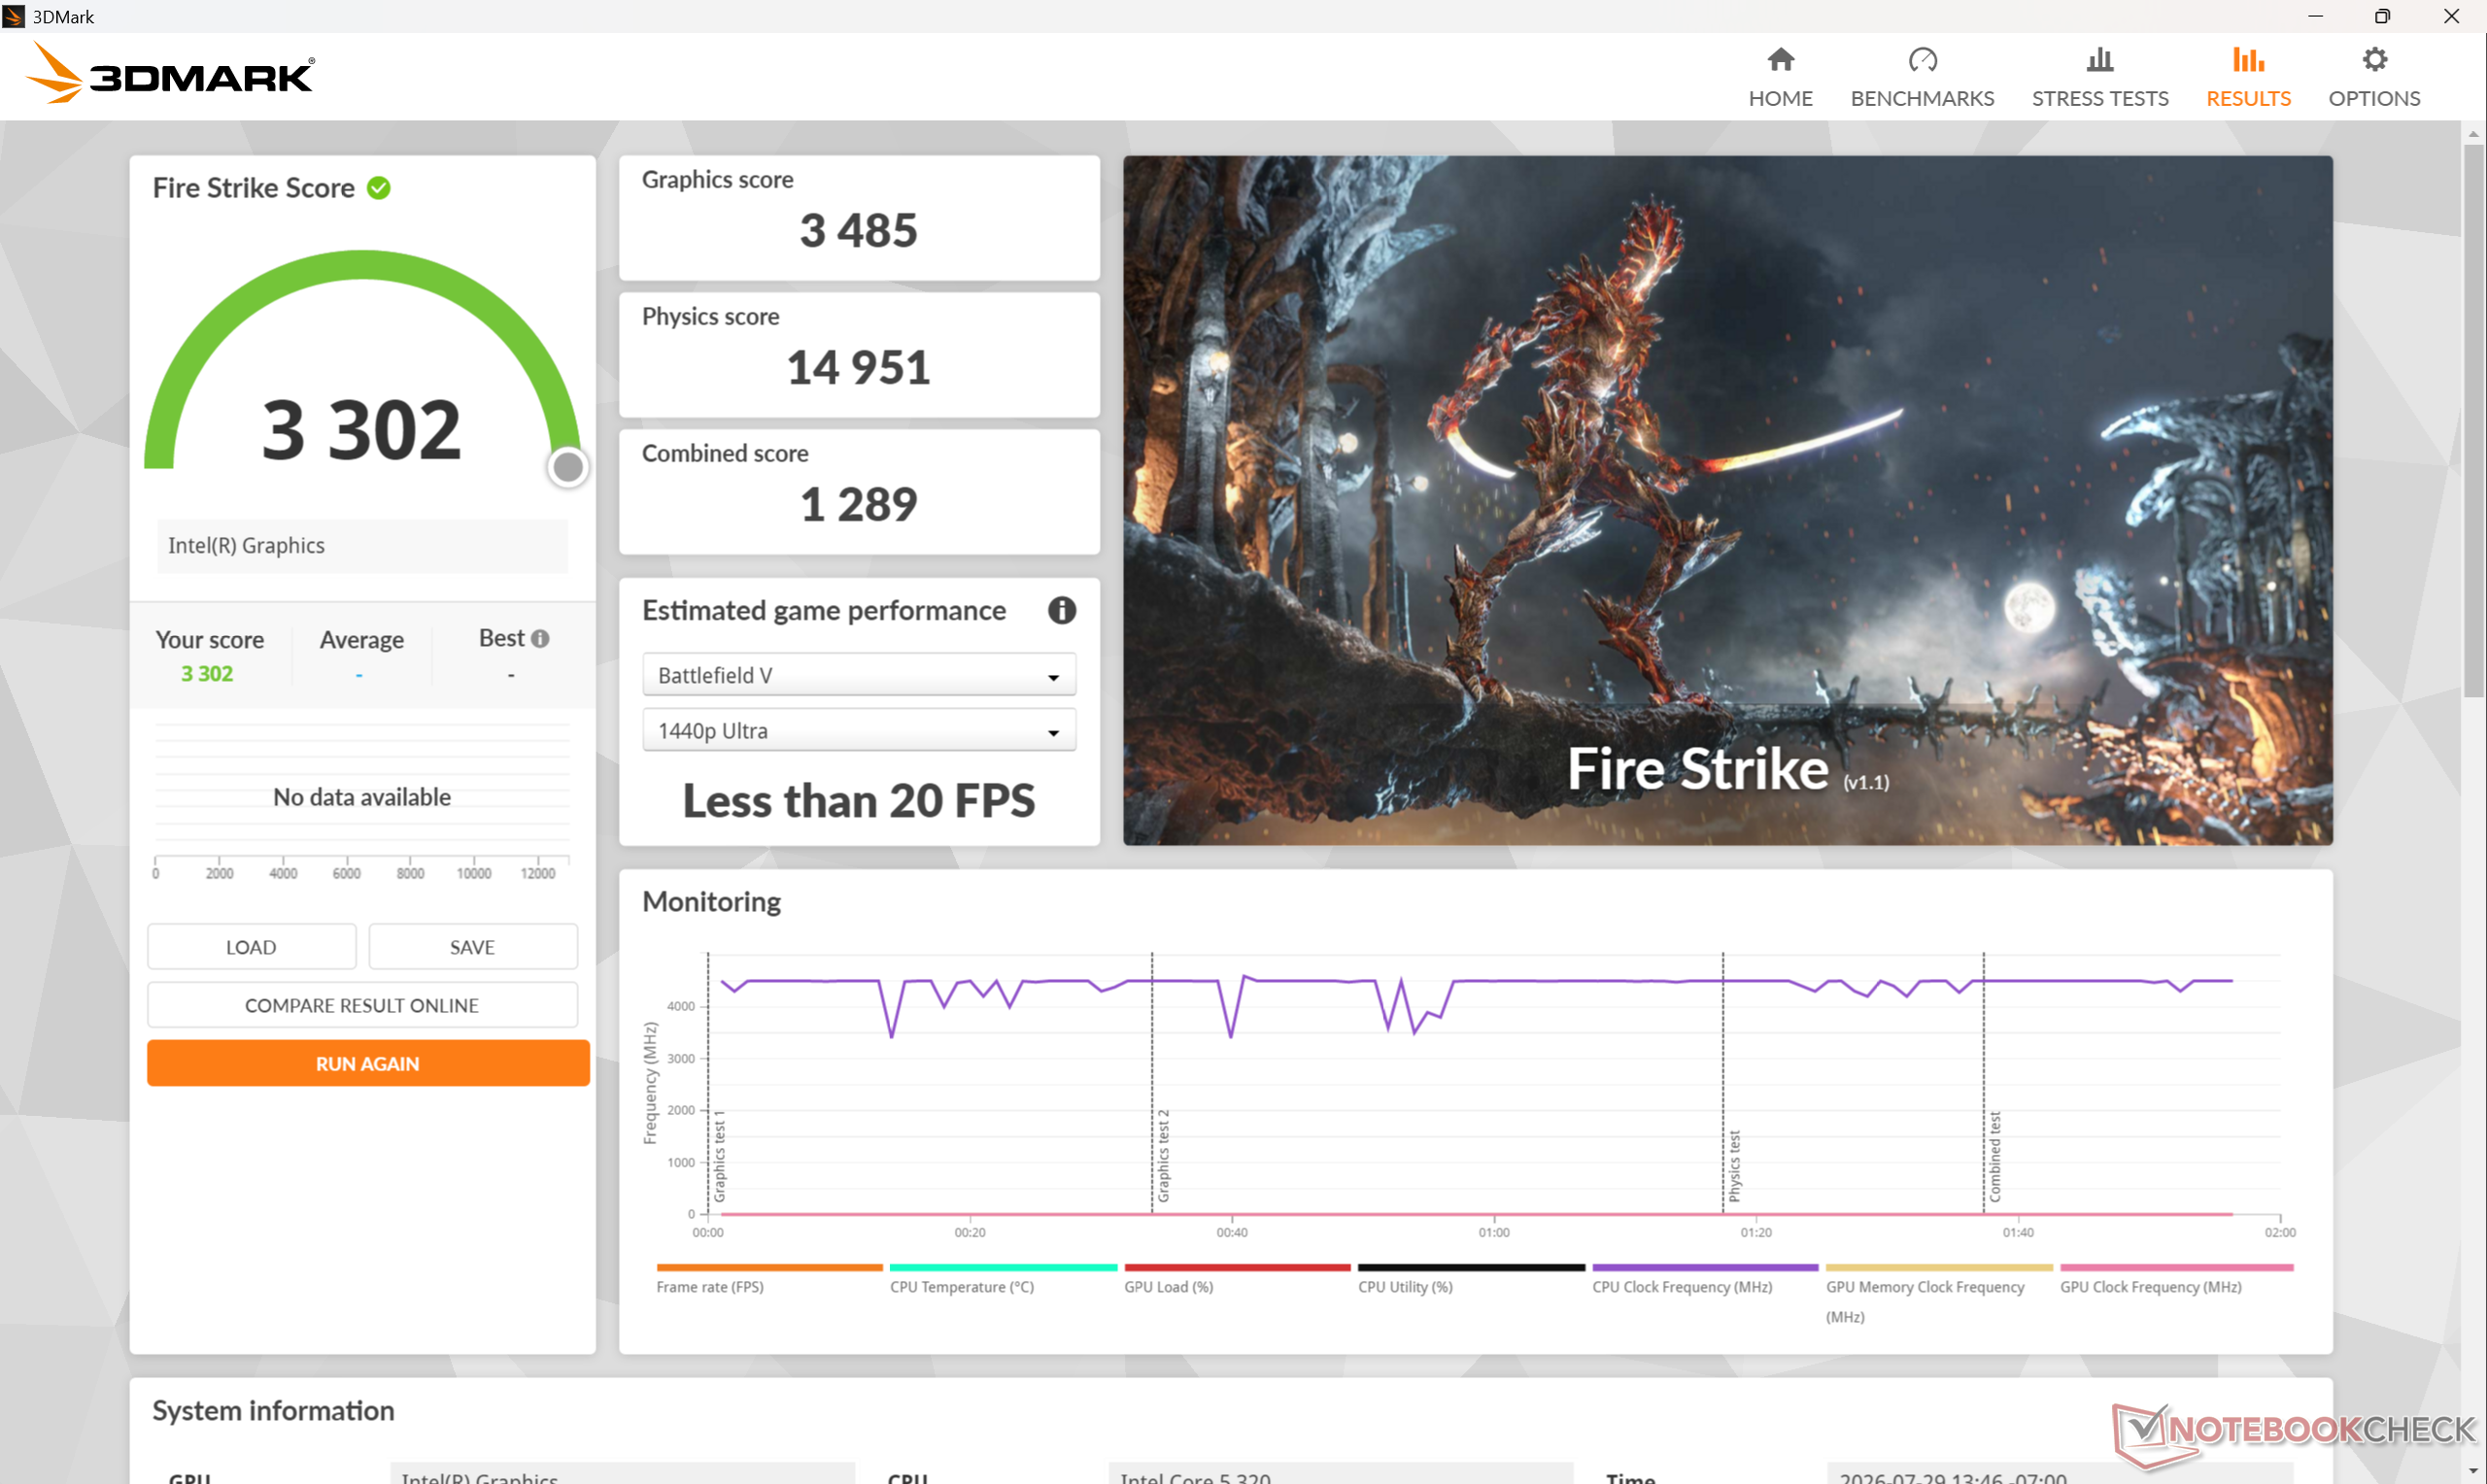
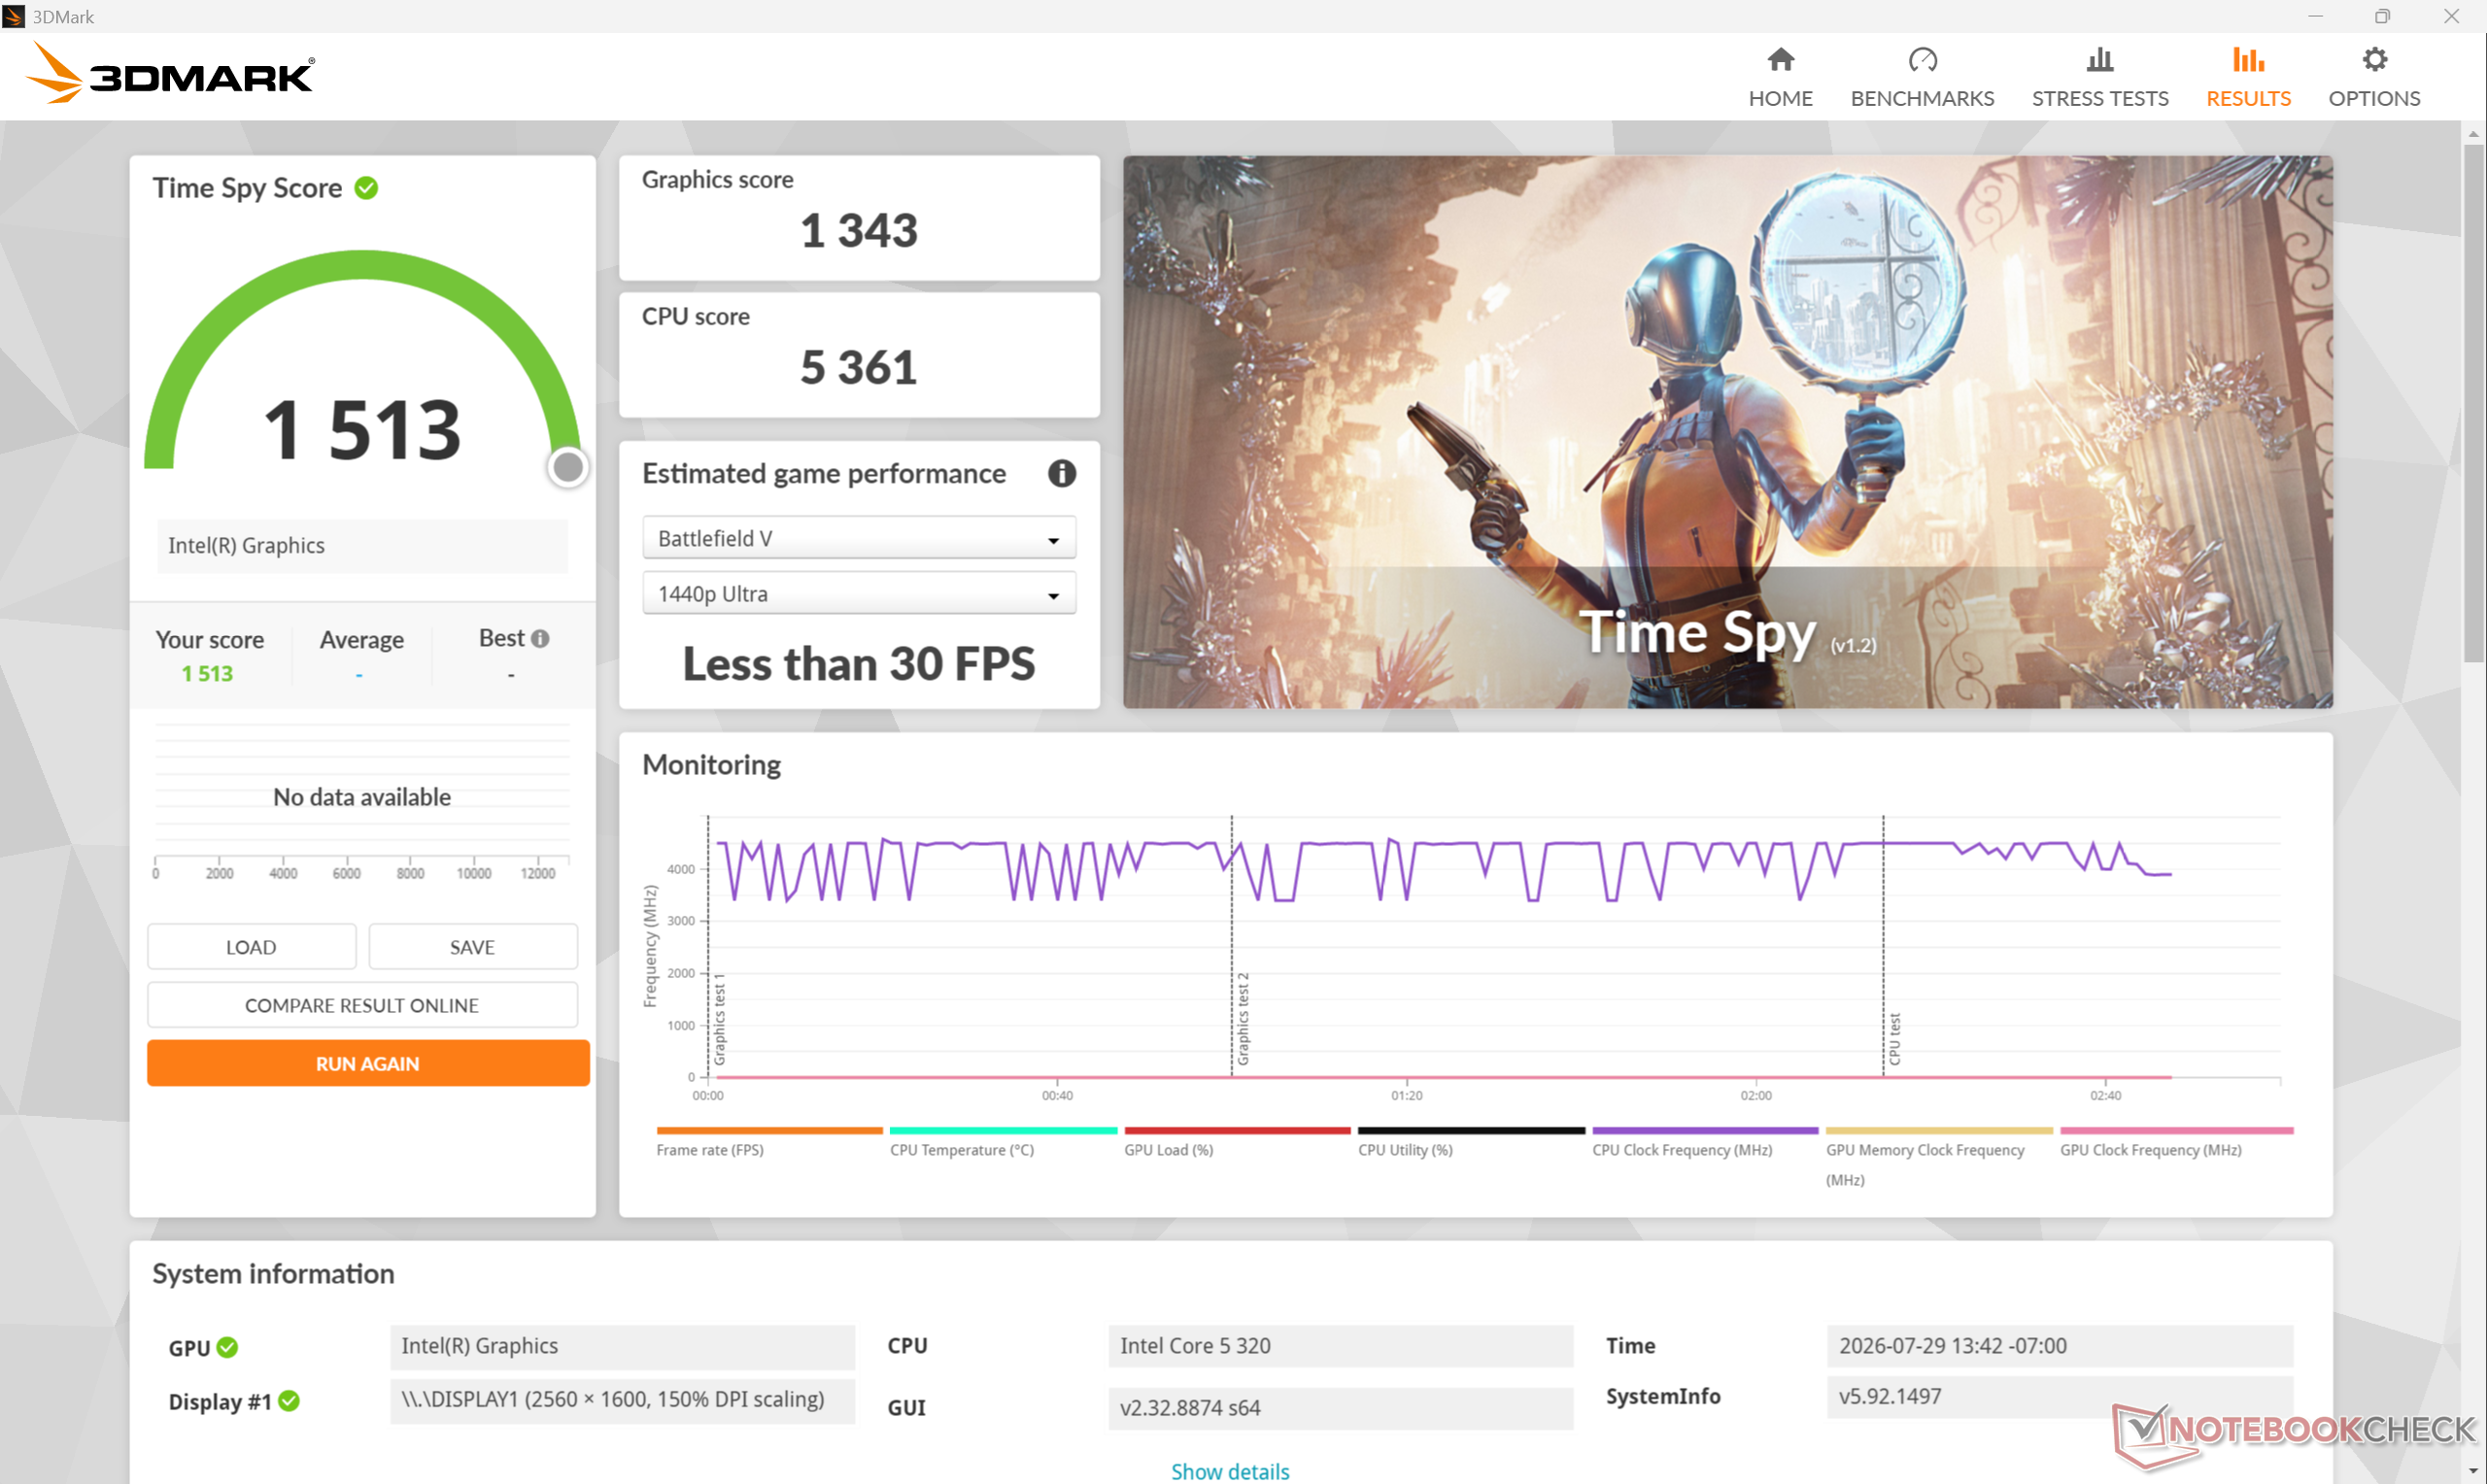
A placa gráfica integrada Graphics 2 Xe3 é ligeiramente mais lenta do que a Iris Xe 96 EUs, que era comum na maioria dos Ultrabooks no início de 2020. Nem é preciso dizer que ela foi projetada mais para a reprodução de vídeos em 4K do que para jogos propriamente ditos ou aceleração gráfica.

Alguns jogos não conseguiam ser iniciados, incluindo F1 24, Strange Brigade e Cyberpunk 2077 em determinadas configurações, provavelmente devido a restrições rigorosas de memória RAM. Portanto, esses conjuntos de dados não estão incluídos a seguir.

Perfil de energiaPontuação de gráficosPontuação de FísicaPontuação Combinada
Modo de Desempenho3.48514.9511.289
Modo equilibrado3.41015.2261283
Alimentação por bateria3.38415.1161270
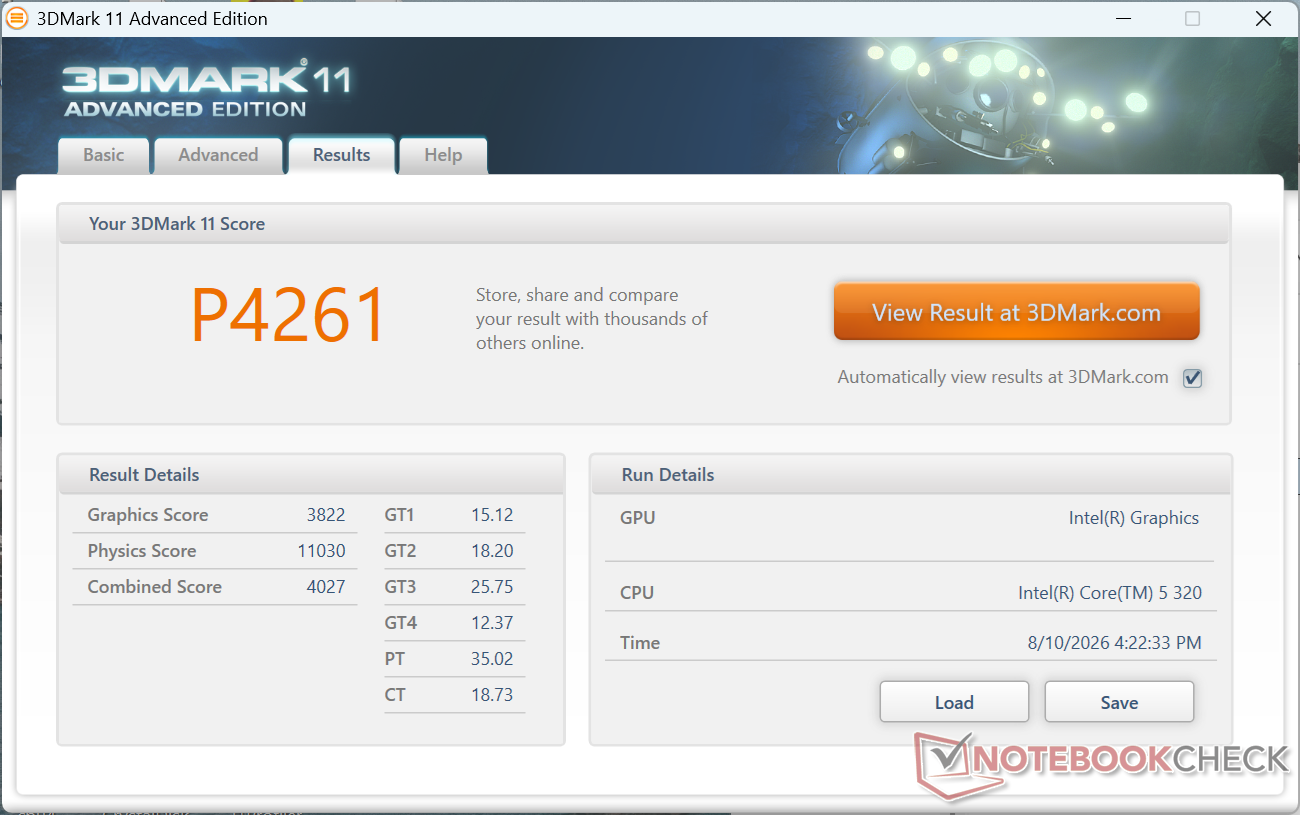
3DMark 11
3DMark 11
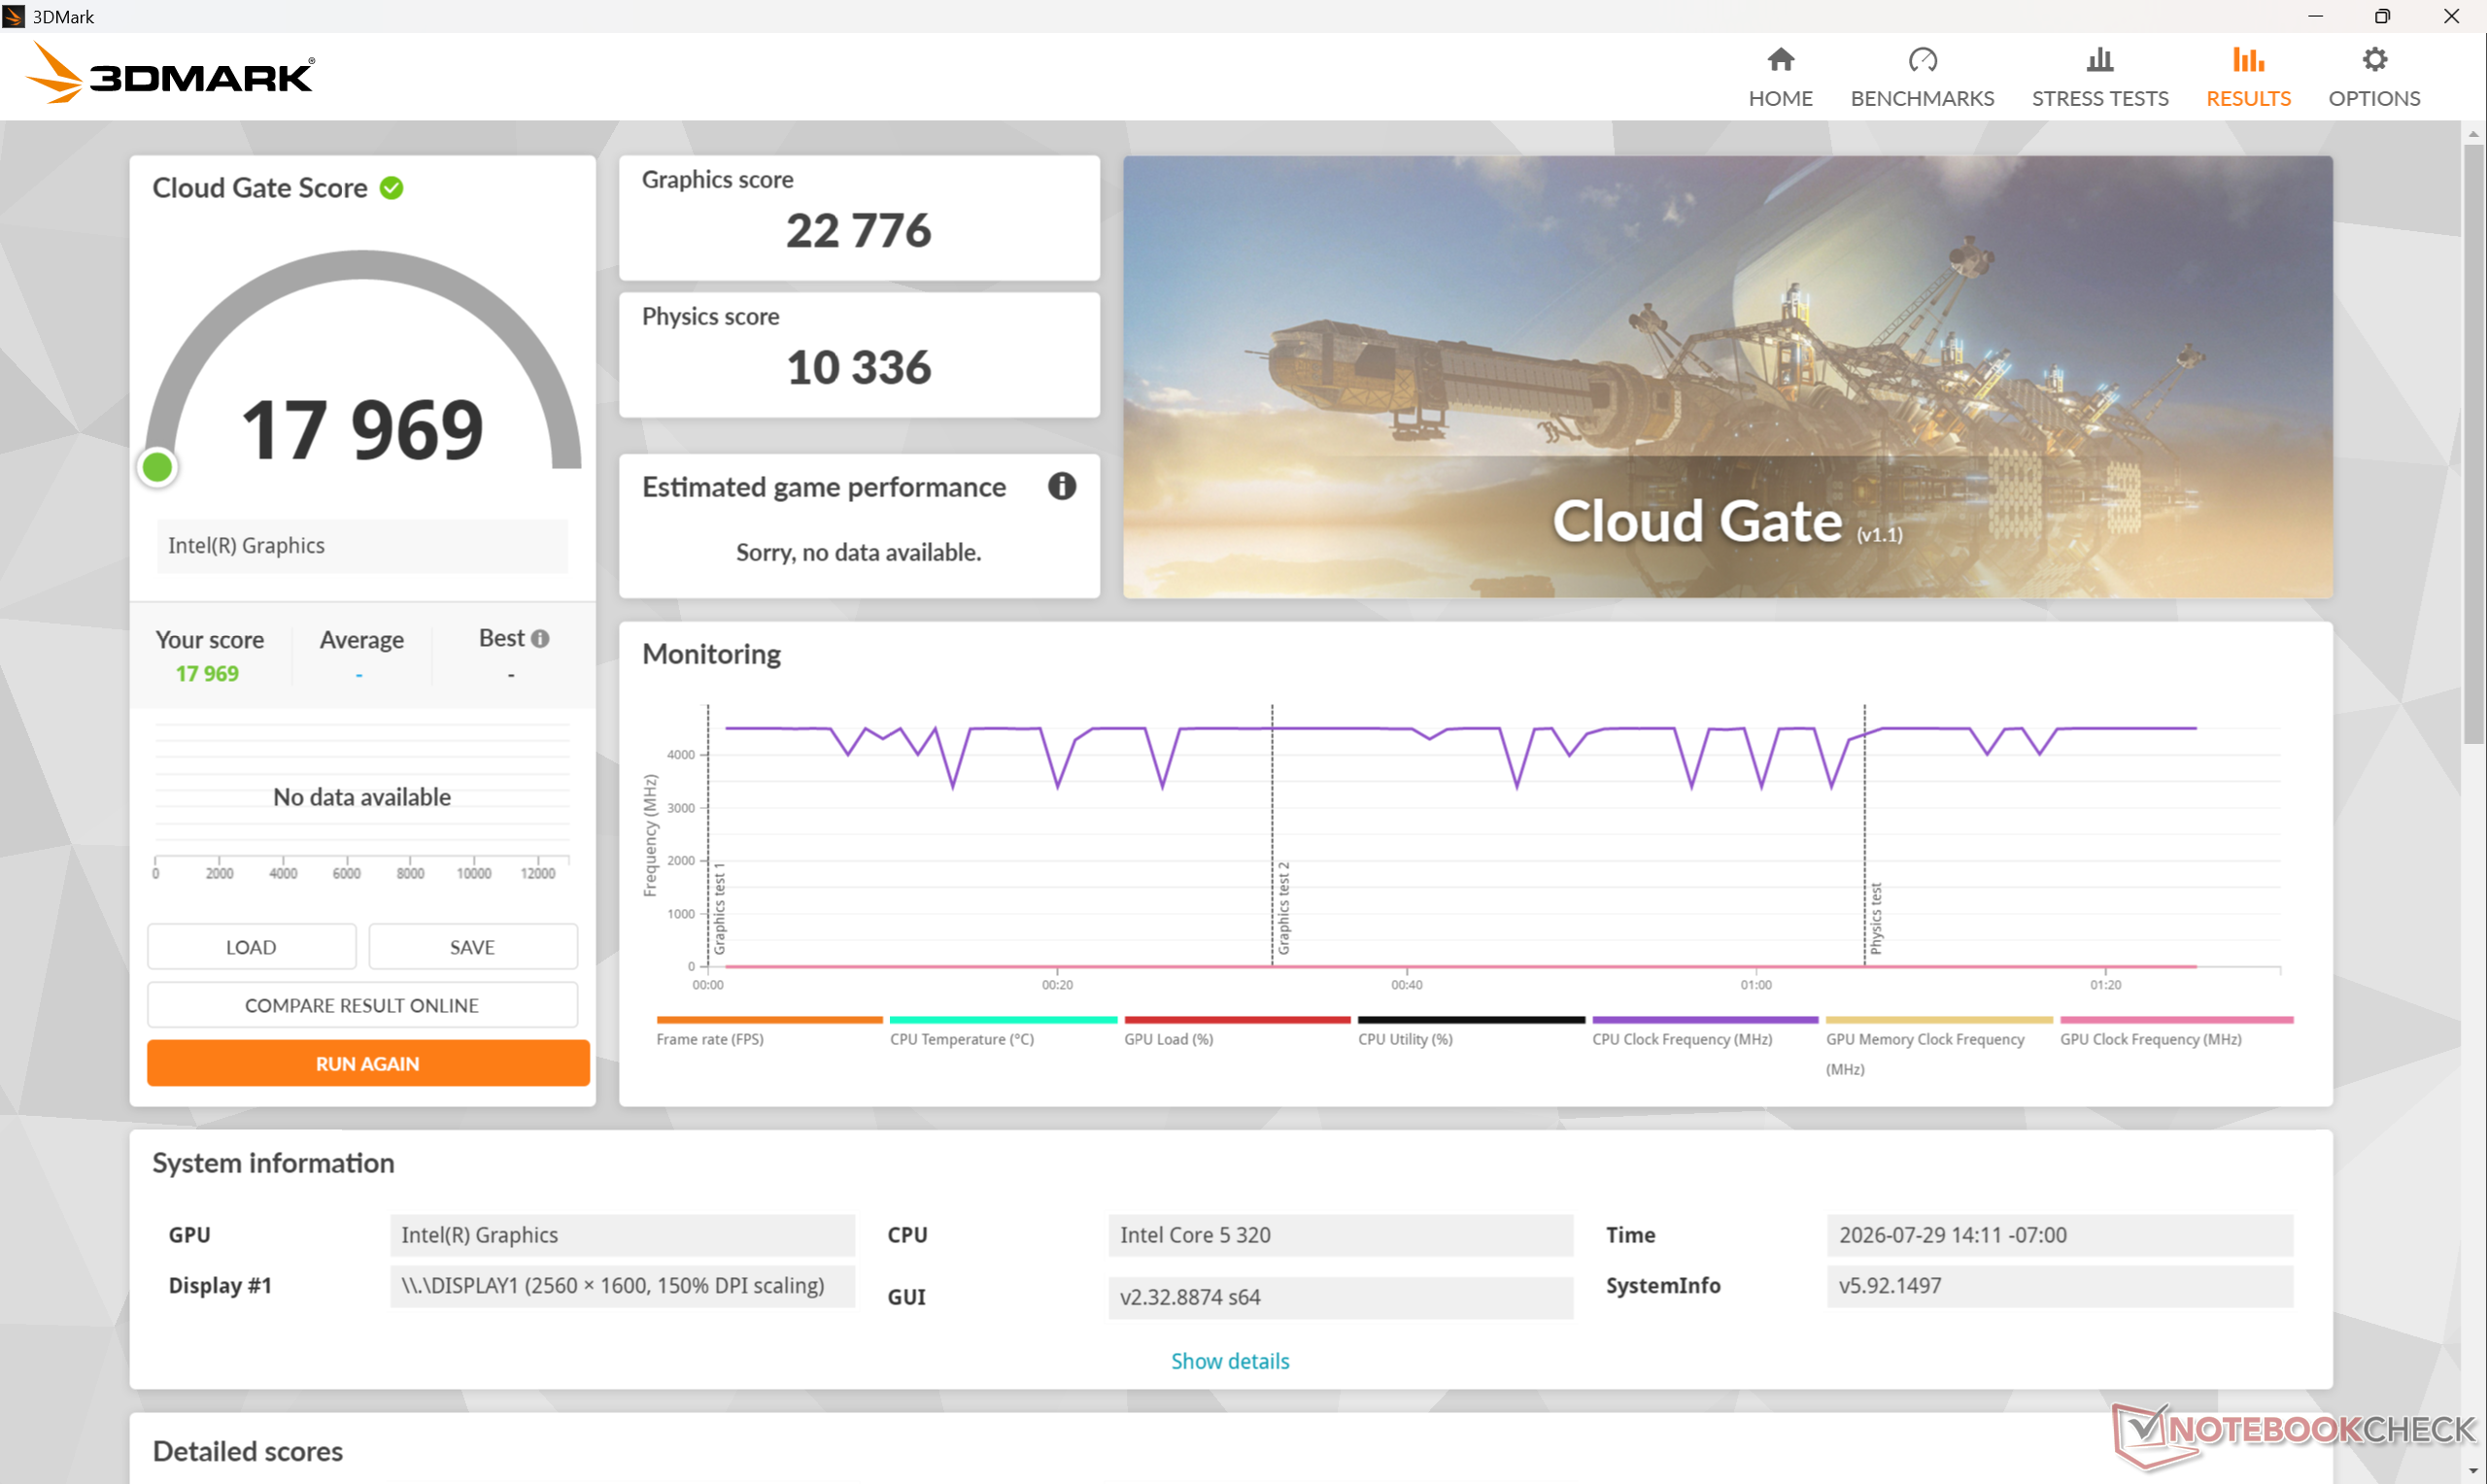
Cloud Gate
Cloud Gate
Fire Strike
Fire Strike
Time Spy
Time Spy
3DMark Performance rating - Percent
Dell XPS 14 Core Ultra X7 358H
Intel Arc B390 12 Xe3 Panther Lake iGPU, Intel Core Ultra X7 358H
100 pt
Dell XPS 13 9350
Intel Arc Graphics 140V, Intel Core Ultra 7 256V
59 pt
Dell XPS 14 Core Ultra 7 355
Intel Graphics 4 Xe3 Panther Lake iGPU, Intel Core Ultra 7 355
42.9 pt
HP OmniBook 7 Aero 13-bg1077nr
AMD Radeon 860M, AMD Ryzen AI 7 350
42.5 pt
Alldocube iWork GT Ultra
Intel Arc 7-Core iGPU, Intel Core Ultra 5 125H
41.7 pt
Lenovo ThinkPad X1 Carbon Gen 14 21V70075GE -1!
Intel Graphics 4 Xe3 Panther Lake iGPU, Intel Core Ultra 5 325
40.4 pt
Microsoft Surface Pro 8, i7-1185G7
Intel Iris Xe Graphics G7 96EUs, Intel Core i7-1185G7
32.2 pt
HP EliteBook 8 Flip G1i 13
Intel Graphics 4-Core iGPU (Meteor / Arrow Lake), Intel Core Ultra 7 265U
31.8 pt
Lenovo ThinkPad L13 2in1 G5 21LNS4AM00 -1!
Intel Graphics 4-Core iGPU (Meteor / Arrow Lake), Intel Core Ultra 5 125U
27.5 pt
Dell Latitude 13 7330
Intel Iris Xe Graphics G7 96EUs, Intel Core i7-1265U
26 pt
Média Intel Graphics 2 Xe3 Wildcat Lake iGPU
 
21.9 pt
Dell XPS 13 DX13260
Intel Graphics 2 Xe3 Wildcat Lake iGPU, Intel Core 5 320
21.8 pt
3DMark 11 - 1280x720 Performance GPU
Dell XPS 14 Core Ultra X7 358H
Intel Arc B390 12 Xe3 Panther Lake iGPU, Intel Core Ultra X7 358H
18743 Points +390%
HP OmniBook 7 Aero 13-bg1077nr
AMD Radeon 860M, AMD Ryzen AI 7 350
11064 Points +189%
Dell XPS 13 9350
Intel Arc Graphics 140V, Intel Core Ultra 7 256V
10651 Points +179%
Alldocube iWork GT Ultra
Intel Arc 7-Core iGPU, Intel Core Ultra 5 125H
7794 Points +104%
Dell XPS 14 Core Ultra 7 355
Intel Graphics 4 Xe3 Panther Lake iGPU, Intel Core Ultra 7 355
7317 Points +91%
Lenovo ThinkPad X1 Carbon Gen 14 21V70075GE
Intel Graphics 4 Xe3 Panther Lake iGPU, Intel Core Ultra 5 325
7301 Points +91%
Microsoft Surface Pro 8, i7-1185G7
Intel Iris Xe Graphics G7 96EUs, Intel Core i7-1185G7
6825 Points +79%
HP EliteBook 8 Flip G1i 13
Intel Graphics 4-Core iGPU (Meteor / Arrow Lake), Intel Core Ultra 7 265U
6090 Points +59%
Dell Latitude 13 7330
Intel Iris Xe Graphics G7 96EUs, Intel Core i7-1265U
5840 Points +53%
Lenovo ThinkPad L13 2in1 G5 21LNS4AM00
Intel Graphics 4-Core iGPU (Meteor / Arrow Lake), Intel Core Ultra 5 125U
5240 Points +37%
Dell XPS 13 DX13260
Intel Graphics 2 Xe3 Wildcat Lake iGPU, Intel Core 5 320
3822 Points
Média Intel Graphics 2 Xe3 Wildcat Lake iGPU
  (3749 - 3822, n=2)
3786 Points -1%
3DMark
1280x720 Cloud Gate Standard Graphics
Dell XPS 14 Core Ultra X7 358H
Intel Arc B390 12 Xe3 Panther Lake iGPU, Intel Core Ultra X7 358H
82808 Points +264%
Dell XPS 13 9350
Intel Arc Graphics 140V, Intel Core Ultra 7 256V
54751 Points +140%
Alldocube iWork GT Ultra
Intel Arc 7-Core iGPU, Intel Core Ultra 5 125H
42086 Points +85%
Dell XPS 14 Core Ultra 7 355
Intel Graphics 4 Xe3 Panther Lake iGPU, Intel Core Ultra 7 355
41422 Points +82%
HP OmniBook 7 Aero 13-bg1077nr
AMD Radeon 860M, AMD Ryzen AI 7 350
34432 Points +51%
HP EliteBook 8 Flip G1i 13
Intel Graphics 4-Core iGPU (Meteor / Arrow Lake), Intel Core Ultra 7 265U
32463 Points +43%
Microsoft Surface Pro 8, i7-1185G7
Intel Iris Xe Graphics G7 96EUs, Intel Core i7-1185G7
30384 Points +33%
Dell Latitude 13 7330
Intel Iris Xe Graphics G7 96EUs, Intel Core i7-1265U
25358 Points +11%
Dell XPS 13 DX13260
Intel Graphics 2 Xe3 Wildcat Lake iGPU, Intel Core 5 320
22776 Points
Média Intel Graphics 2 Xe3 Wildcat Lake iGPU
  (22468 - 22776, n=2)
22622 Points -1%
1920x1080 Fire Strike Graphics
Dell XPS 14 Core Ultra X7 358H
Intel Arc B390 12 Xe3 Panther Lake iGPU, Intel Core Ultra X7 358H
17324 Points +397%
Dell XPS 13 9350
Intel Arc Graphics 140V, Intel Core Ultra 7 256V
9492 Points +172%
Lenovo ThinkPad X1 Carbon Gen 14 21V70075GE
Intel Graphics 4 Xe3 Panther Lake iGPU, Intel Core Ultra 5 325
7090 Points +103%
Dell XPS 14 Core Ultra 7 355
Intel Graphics 4 Xe3 Panther Lake iGPU, Intel Core Ultra 7 355
7025 Points +102%
Alldocube iWork GT Ultra
Intel Arc 7-Core iGPU, Intel Core Ultra 5 125H
6691 Points +92%
HP OmniBook 7 Aero 13-bg1077nr
AMD Radeon 860M, AMD Ryzen AI 7 350
6462 Points +85%
Microsoft Surface Pro 8, i7-1185G7
Intel Iris Xe Graphics G7 96EUs, Intel Core i7-1185G7
5570 Points +60%
HP EliteBook 8 Flip G1i 13
Intel Graphics 4-Core iGPU (Meteor / Arrow Lake), Intel Core Ultra 7 265U
5143 Points +48%
Lenovo ThinkPad L13 2in1 G5 21LNS4AM00
Intel Graphics 4-Core iGPU (Meteor / Arrow Lake), Intel Core Ultra 5 125U
4604 Points +32%
Dell Latitude 13 7330
Intel Iris Xe Graphics G7 96EUs, Intel Core i7-1265U
3978 Points +14%
Média Intel Graphics 2 Xe3 Wildcat Lake iGPU
  (3485 - 3642, n=2)
3564 Points +2%
Dell XPS 13 DX13260
Intel Graphics 2 Xe3 Wildcat Lake iGPU, Intel Core 5 320
3485 Points
2560x1440 Time Spy Graphics
Dell XPS 14 Core Ultra X7 358H
Intel Arc B390 12 Xe3 Panther Lake iGPU, Intel Core Ultra X7 358H
7043 Points +424%
Dell XPS 13 9350
Intel Arc Graphics 140V, Intel Core Ultra 7 256V
4115 Points +206%
Dell XPS 14 Core Ultra 7 355
Intel Graphics 4 Xe3 Panther Lake iGPU, Intel Core Ultra 7 355
2951 Points +120%
Lenovo ThinkPad X1 Carbon Gen 14 21V70075GE
Intel Graphics 4 Xe3 Panther Lake iGPU, Intel Core Ultra 5 325
2905 Points +116%
Alldocube iWork GT Ultra
Intel Arc 7-Core iGPU, Intel Core Ultra 5 125H
2509 Points +87%
HP OmniBook 7 Aero 13-bg1077nr
AMD Radeon 860M, AMD Ryzen AI 7 350
2271 Points +69%
Lenovo ThinkPad L13 2in1 G5 21LNS4AM00
Intel Graphics 4-Core iGPU (Meteor / Arrow Lake), Intel Core Ultra 5 125U
1978 Points +47%
HP EliteBook 8 Flip G1i 13
Intel Graphics 4-Core iGPU (Meteor / Arrow Lake), Intel Core Ultra 7 265U
1808 Points +35%
Microsoft Surface Pro 8, i7-1185G7
Intel Iris Xe Graphics G7 96EUs, Intel Core i7-1185G7
1666 Points +24%
Média Intel Graphics 2 Xe3 Wildcat Lake iGPU
  (1343 - 1401, n=2)
1372 Points +2%
Dell Latitude 13 7330
Intel Iris Xe Graphics G7 96EUs, Intel Core i7-1265U
1355 Points +1%
Dell XPS 13 DX13260
Intel Graphics 2 Xe3 Wildcat Lake iGPU, Intel Core 5 320
1343 Points
3DMark 11 Performance
4261 pontos
3DMark Cloud Gate Standard Score
17969 pontos
3DMark Fire Strike Score
3302 pontos
3DMark Time Spy Score
1513 pontos
Ajuda
Blender
v3.3 Classroom METAL
Apple MacBook Neo 256 GB
Apple A18 GPU, Apple A18 Pro
227 Seconds *
v3.3 Classroom CPU
Dell Latitude 13 7330
Intel Iris Xe Graphics G7 96EUs, Intel Core i7-1265U
848 Seconds * -6%
Apple MacBook Neo 256 GB
Apple A18 GPU, Apple A18 Pro
813 Seconds * -2%
Dell XPS 13 DX13260
Intel Graphics 2 Xe3 Wildcat Lake iGPU, Intel Core 5 320
799 Seconds *
Média Intel Graphics 2 Xe3 Wildcat Lake iGPU
  (n=1)
799 Seconds * -0%
Lenovo ThinkPad L13 2in1 G5 21LNS4AM00
Intel Graphics 4-Core iGPU (Meteor / Arrow Lake), Intel Core Ultra 5 125U
719 Seconds * +10%
Alldocube iWork GT Ultra
Intel Arc 7-Core iGPU, Intel Core Ultra 5 125H
705 Seconds * +12%
HP EliteBook 8 Flip G1i 13
Intel Graphics 4-Core iGPU (Meteor / Arrow Lake), Intel Core Ultra 7 265U
667 Seconds * +17%
Dell XPS 13 9350
Intel Arc Graphics 140V, Intel Core Ultra 7 256V
580 Seconds * +27%
Lenovo ThinkPad X1 Carbon Gen 14 21V70075GE
Intel Graphics 4 Xe3 Panther Lake iGPU, Intel Core Ultra 5 325
499 Seconds * +38%
HP OmniBook 7 Aero 13-bg1077nr
AMD Radeon 860M, AMD Ryzen AI 7 350
365 Seconds * +54%
Dell XPS 14 Core Ultra X7 358H
Intel Arc B390 12 Xe3 Panther Lake iGPU, Intel Core Ultra X7 358H
335 Seconds * +58%
v3.3 Classroom oneAPI/Intel
Média Intel Graphics 2 Xe3 Wildcat Lake iGPU
  (n=1)
492 Seconds *
HP EliteBook 8 Flip G1i 13
Intel Graphics 4-Core iGPU (Meteor / Arrow Lake), Intel Core Ultra 7 265U
313 Seconds *
Dell XPS 13 9350
Intel Arc Graphics 140V, Intel Core Ultra 7 256V
211 Seconds *
Dell XPS 14 Core Ultra X7 358H
Intel Arc B390 12 Xe3 Panther Lake iGPU, Intel Core Ultra X7 358H
106 Seconds *
v4.3 Barbershop CPU
Dell XPS 13 DX13260
Intel Graphics 2 Xe3 Wildcat Lake iGPU, Intel Core 5 320
4408 Seconds *
Média Intel Graphics 2 Xe3 Wildcat Lake iGPU
  (3828 - 4408, n=2)
4118 Seconds * +7%
Alldocube iWork GT Ultra
Intel Arc 7-Core iGPU, Intel Core Ultra 5 125H
3693 Seconds * +16%
HP EliteBook 8 Flip G1i 13
Intel Graphics 4-Core iGPU (Meteor / Arrow Lake), Intel Core Ultra 7 265U
3358 Seconds * +24%
HP OmniBook 7 Aero 13-bg1077nr
AMD Radeon 860M, AMD Ryzen AI 7 350
2075 Seconds * +53%
Dell XPS 14 Core Ultra X7 358H
Intel Arc B390 12 Xe3 Panther Lake iGPU, Intel Core Ultra X7 358H
1711 Seconds * +61%
v4.3 Barbershop oneAPI
Média Intel Graphics 2 Xe3 Wildcat Lake iGPU
  (n=1)
2337 Seconds *
HP EliteBook 8 Flip G1i 13
Intel Graphics 4-Core iGPU (Meteor / Arrow Lake), Intel Core Ultra 7 265U
1308 Seconds *
Dell XPS 14 Core Ultra X7 358H
Intel Arc B390 12 Xe3 Panther Lake iGPU, Intel Core Ultra X7 358H
369 Seconds *

* ... menor é melhor

Performance rating - Percent
Dell XPS 14 Core Ultra X7 358H
Intel Core Ultra X7 358H, Intel Arc B390 12 Xe3 Panther Lake iGPU
100 pt
Dell XPS 13 9350
Intel Core Ultra 7 256V, Intel Arc Graphics 140V
64.5 pt
HP OmniBook 7 Aero 13-bg1077nr
AMD Ryzen AI 7 350, AMD Radeon 860M
63.1 pt
Lenovo ThinkPad X1 Carbon Gen 14 21V70075GE
Intel Core Ultra 5 325, Intel Graphics 4 Xe3 Panther Lake iGPU
57.9 pt
Dell XPS 13 DX13260
Intel Core 5 320, Intel Graphics 2 Xe3 Wildcat Lake iGPU
33.9 pt
Apple MacBook Neo 256 GB -4!
Apple A18 Pro, Apple A18 GPU
27.9 pt
Baldur's Gate 3 - 1920x1080 Ultra Preset AA:T
Dell XPS 14 Core Ultra X7 358H
Intel Core Ultra X7 358H, Intel Arc B390 12 Xe3 Panther Lake iGPU
48.7 (43.1min, 44.3P0.1, 45.5P1) fps +347%
Dell XPS 13 9350
Intel Core Ultra 7 256V, Intel Arc Graphics 140V
25.7 fps +136%
Lenovo ThinkPad X1 Carbon Gen 14 21V70075GE
Intel Core Ultra 5 325, Intel Graphics 4 Xe3 Panther Lake iGPU
22.4 (20.3min, 20.4P0.1, 20.6P1) fps +106%
HP OmniBook 7 Aero 13-bg1077nr
AMD Ryzen AI 7 350, AMD Radeon 860M
20.6 (17.1min, 17.1P0.1, 18.4P1) fps +89%
Apple MacBook Neo 256 GB
Apple A18 Pro, Apple A18 GPU
13.6 fps +25%
Dell XPS 13 DX13260
Intel Core 5 320, Intel Graphics 2 Xe3 Wildcat Lake iGPU
10.9 (9.5min, 9.53P0.1, 9.91P1) fps
GTA V - 1920x1080 Highest AA:4xMSAA + FX AF:16x
Dell XPS 14 Core Ultra X7 358H
Intel Core Ultra X7 358H, Intel Arc B390 12 Xe3 Panther Lake iGPU
43.3 (6.46min, 33.3P1) fps +462%
HP OmniBook 7 Aero 13-bg1077nr
AMD Ryzen AI 7 350, AMD Radeon 860M
25.7 (2.43min, 16.9P1) fps +233%
Dell XPS 13 9350
Intel Core Ultra 7 256V, Intel Arc Graphics 140V
25.6 (2.46min, 19.6P1) fps +232%
Lenovo ThinkPad X1 Carbon Gen 14 21V70075GE
Intel Core Ultra 5 325, Intel Graphics 4 Xe3 Panther Lake iGPU
21.9 (6.72min, 17.2P1) fps +184%
Dell XPS 13 DX13260
Intel Core 5 320, Intel Graphics 2 Xe3 Wildcat Lake iGPU
7.71 (1.599min, 5.99P1) fps
Final Fantasy XV Benchmark - 1920x1080 High Quality
Dell XPS 14 Core Ultra X7 358H
Intel Core Ultra X7 358H, Intel Arc B390 12 Xe3 Panther Lake iGPU
52.8 fps +182%
Dell XPS 13 9350
Intel Core Ultra 7 256V, Intel Arc Graphics 140V
31.5 fps +68%
Lenovo ThinkPad X1 Carbon Gen 14 21V70075GE
Intel Core Ultra 5 325, Intel Graphics 4 Xe3 Panther Lake iGPU
26.8 fps +43%
HP OmniBook 7 Aero 13-bg1077nr
AMD Ryzen AI 7 350, AMD Radeon 860M
23.3 fps +25%
Dell XPS 13 DX13260
Intel Core 5 320, Intel Graphics 2 Xe3 Wildcat Lake iGPU
18.7 fps
Dota 2 Reborn - 1920x1080 ultra (3/3) best looking
Dell XPS 14 Core Ultra X7 358H
Intel Core Ultra X7 358H, Intel Arc B390 12 Xe3 Panther Lake iGPU
105.4 (70.1min) fps +131%
Lenovo ThinkPad X1 Carbon Gen 14 21V70075GE
Intel Core Ultra 5 325, Intel Graphics 4 Xe3 Panther Lake iGPU
83.3 (54.4min) fps +82%
Dell XPS 13 9350
Intel Core Ultra 7 256V, Intel Arc Graphics 140V
80.7 (52.1min) fps +77%
HP OmniBook 7 Aero 13-bg1077nr
AMD Ryzen AI 7 350, AMD Radeon 860M
73.3 (66min) fps +60%
Dell XPS 13 DX13260
Intel Core 5 320, Intel Graphics 2 Xe3 Wildcat Lake iGPU
45.7 (22.3min) fps
X-Plane 11.11 - 1920x1080 high (fps_test=3)
HP OmniBook 7 Aero 13-bg1077nr
AMD Ryzen AI 7 350, AMD Radeon 860M
40.4 fps +98%
Dell XPS 14 Core Ultra X7 358H
Intel Core Ultra X7 358H, Intel Arc B390 12 Xe3 Panther Lake iGPU
40.3 fps +98%
Dell XPS 13 9350
Intel Core Ultra 7 256V, Intel Arc Graphics 140V
30.1 fps +48%
Lenovo ThinkPad X1 Carbon Gen 14 21V70075GE
Intel Core Ultra 5 325, Intel Graphics 4 Xe3 Panther Lake iGPU
25.5 fps +25%
Dell XPS 13 DX13260
Intel Core 5 320, Intel Graphics 2 Xe3 Wildcat Lake iGPU
20.4 fps
GTA V
1920x1080 Normal/Off AF:4x
Dell XPS 14 Core Ultra X7 358H
Intel Core Ultra X7 358H, Intel Arc B390 12 Xe3 Panther Lake iGPU
168.2 (4.85min, 111.1P1) fps +116%
Dell XPS 14 Core Ultra 7 355
Intel Core Ultra 7 355, Intel Graphics 4 Xe3 Panther Lake iGPU
145.8 (4.16min, 90.9P1) fps +87%
Dell XPS 13 9350
Intel Core Ultra 7 256V, Intel Arc Graphics 140V
134.2 (5.63min, 83.3P1) fps +72%
HP OmniBook 7 Aero 13-bg1077nr
AMD Ryzen AI 7 350, AMD Radeon 860M
120.3 (16.7min, 83.3P1) fps +55%
Alldocube iWork GT Ultra
Intel Core Ultra 5 125H, Intel Arc 7-Core iGPU
84.5 (27.2min, 55.6P1) fps +9%
Média Intel Graphics 2 Xe3 Wildcat Lake iGPU
  (77.8 - 78.7, n=2)
78.3 fps +1%
Dell XPS 13 DX13260
Intel Core 5 320, Intel Graphics 2 Xe3 Wildcat Lake iGPU
77.8 (7.47min, 47.6P1) fps
HP EliteBook 8 Flip G1i 13
Intel Core Ultra 7 265U, Intel Graphics 4-Core iGPU (Meteor / Arrow Lake)
74.9 (21.5min, 37P1) fps -4%
Dell Latitude 13 7330
Intel Core i7-1265U, Intel Iris Xe Graphics G7 96EUs
46.7 (18.1min, 32.3P1) fps -40%
1920x1080 High/On (Advanced Graphics Off) AA:2xMSAA + FX AF:8x
Dell XPS 14 Core Ultra X7 358H
Intel Core Ultra X7 358H, Intel Arc B390 12 Xe3 Panther Lake iGPU
98.2 (6.53min, 66.7P1) fps +357%
Dell XPS 13 9350
Intel Core Ultra 7 256V, Intel Arc Graphics 140V
60.8 (2.26min, 43.5P1) fps +183%
HP OmniBook 7 Aero 13-bg1077nr
AMD Ryzen AI 7 350, AMD Radeon 860M
60.8 (3.38min, 41.7P1) fps +183%
Dell XPS 14 Core Ultra 7 355
Intel Core Ultra 7 355, Intel Graphics 4 Xe3 Panther Lake iGPU
52.9 (9.17min, 41.7P1) fps +146%
Lenovo ThinkPad X1 Carbon Gen 14 21V70075GE
Intel Core Ultra 5 325, Intel Graphics 4 Xe3 Panther Lake iGPU
52.8 (6.47min, 40P1) fps +146%
Microsoft Surface Pro 8, i7-1185G7
Intel Core i7-1185G7, Intel Iris Xe Graphics G7 96EUs
33.2 (8.69min, 22.7P1) fps +54%
Alldocube iWork GT Ultra
Intel Core Ultra 5 125H, Intel Arc 7-Core iGPU
30.4 (6.49min, 20.8P1) fps +41%
HP EliteBook 8 Flip G1i 13
Intel Core Ultra 7 265U, Intel Graphics 4-Core iGPU (Meteor / Arrow Lake)
24.4 (7.21min, 18.5P1) fps +13%
Média Intel Graphics 2 Xe3 Wildcat Lake iGPU
  (21.5 - 27.2, n=2)
24.4 fps +13%
Lenovo ThinkPad L13 2in1 G5 21LNS4AM00
Intel Core Ultra 5 125U, Intel Graphics 4-Core iGPU (Meteor / Arrow Lake)
23.6 (5.71min, 17.9P1) fps +10%
Dell XPS 13 DX13260
Intel Core 5 320, Intel Graphics 2 Xe3 Wildcat Lake iGPU
21.5 (1.962min, 12.3P1) fps
Dell Latitude 13 7330
Intel Core i7-1265U, Intel Iris Xe Graphics G7 96EUs
13.9 (6.35min, 9.26P1) fps -35%
1920x1080 Highest AA:4xMSAA + FX AF:16x
Dell XPS 14 Core Ultra X7 358H
Intel Core Ultra X7 358H, Intel Arc B390 12 Xe3 Panther Lake iGPU
43.3 (6.46min, 33.3P1) fps +462%
HP OmniBook 7 Aero 13-bg1077nr
AMD Ryzen AI 7 350, AMD Radeon 860M
25.7 (2.43min, 16.9P1) fps +233%
Dell XPS 13 9350
Intel Core Ultra 7 256V, Intel Arc Graphics 140V
25.6 (2.46min, 19.6P1) fps +232%
Lenovo ThinkPad X1 Carbon Gen 14 21V70075GE
Intel Core Ultra 5 325, Intel Graphics 4 Xe3 Panther Lake iGPU
21.9 (6.72min, 17.2P1) fps +184%
Dell XPS 14 Core Ultra 7 355
Intel Core Ultra 7 355, Intel Graphics 4 Xe3 Panther Lake iGPU
20.9 (5.74min, 15.9P1) fps +171%
Alldocube iWork GT Ultra
Intel Core Ultra 5 125H, Intel Arc 7-Core iGPU
13.1 (5.76min, 10.4P1) fps +70%
Microsoft Surface Pro 8, i7-1185G7
Intel Core i7-1185G7, Intel Iris Xe Graphics G7 96EUs
12.8 (4.32min, 9.62P1) fps +66%
HP EliteBook 8 Flip G1i 13
Intel Core Ultra 7 265U, Intel Graphics 4-Core iGPU (Meteor / Arrow Lake)
9.99 (2.84min, 7.46P1) fps +30%
Lenovo ThinkPad L13 2in1 G5 21LNS4AM00
Intel Core Ultra 5 125U, Intel Graphics 4-Core iGPU (Meteor / Arrow Lake)
9.61 (4.73min, 7.41P1) fps +25%
Média Intel Graphics 2 Xe3 Wildcat Lake iGPU
  (7.71 - 10.5, n=2)
9.11 fps +18%
Dell XPS 13 DX13260
Intel Core 5 320, Intel Graphics 2 Xe3 Wildcat Lake iGPU
7.71 (1.599min, 5.99P1) fps
Dell Latitude 13 7330
Intel Core i7-1265U, Intel Iris Xe Graphics G7 96EUs
6.15 (2.67min, 3.83P1) fps -20%
Dota 2 Reborn
1920x1080 high (2/3)
Dell XPS 14 Core Ultra X7 358H
Intel Core Ultra X7 358H, Intel Arc B390 12 Xe3 Panther Lake iGPU
107.6 (68.3min) fps +138%
Dell XPS 13 9350
Intel Core Ultra 7 256V, Intel Arc Graphics 140V
83 (35.8min) fps +83%
HP OmniBook 7 Aero 13-bg1077nr
AMD Ryzen AI 7 350, AMD Radeon 860M
82.7 (74.6min) fps +83%
Lenovo ThinkPad X1 Carbon Gen 14 21V70075GE
Intel Core Ultra 5 325, Intel Graphics 4 Xe3 Panther Lake iGPU
82.1 (35.4min) fps +81%
Alldocube iWork GT Ultra
Intel Core Ultra 5 125H, Intel Arc 7-Core iGPU
74.6 (51min) fps +65%
Dell XPS 14 Core Ultra 7 355
Intel Core Ultra 7 355, Intel Graphics 4 Xe3 Panther Lake iGPU
73.7 (23.2min) fps +63%
Microsoft Surface Pro 8, i7-1185G7
Intel Core i7-1185G7, Intel Iris Xe Graphics G7 96EUs
63.4 (35.7min) fps +40%
Lenovo ThinkPad L13 2in1 G5 21LNS4AM00
Intel Core Ultra 5 125U, Intel Graphics 4-Core iGPU (Meteor / Arrow Lake)
59.9 (30.2min) fps +32%
Dell Latitude 13 7330
Intel Core i7-1265U, Intel Iris Xe Graphics G7 96EUs
50.6 (44.7min) fps +12%
Dell XPS 13 DX13260
Intel Core 5 320, Intel Graphics 2 Xe3 Wildcat Lake iGPU
45.3 (4.2min) fps
HP EliteBook 8 Flip G1i 13
Intel Core Ultra 7 265U, Intel Graphics 4-Core iGPU (Meteor / Arrow Lake)
44.6 (23.8min) fps -2%
Média Intel Graphics 2 Xe3 Wildcat Lake iGPU
  (34.9 - 45.3, n=2)
40.1 fps -11%
1920x1080 ultra (3/3) best looking
Dell XPS 14 Core Ultra X7 358H
Intel Core Ultra X7 358H, Intel Arc B390 12 Xe3 Panther Lake iGPU
105.4 (70.1min) fps +131%
Lenovo ThinkPad X1 Carbon Gen 14 21V70075GE
Intel Core Ultra 5 325, Intel Graphics 4 Xe3 Panther Lake iGPU
83.3 (54.4min) fps +82%
Dell XPS 13 9350
Intel Core Ultra 7 256V, Intel Arc Graphics 140V
80.7 (52.1min) fps +77%
HP OmniBook 7 Aero 13-bg1077nr
AMD Ryzen AI 7 350, AMD Radeon 860M
73.3 (66min) fps +60%
Alldocube iWork GT Ultra
Intel Core Ultra 5 125H, Intel Arc 7-Core iGPU
70.1 (49.9min) fps +53%
Dell XPS 14 Core Ultra 7 355
Intel Core Ultra 7 355, Intel Graphics 4 Xe3 Panther Lake iGPU
69.4 (33.2min) fps +52%
Microsoft Surface Pro 8, i7-1185G7
Intel Core i7-1185G7, Intel Iris Xe Graphics G7 96EUs
56.7 (32.8min) fps +24%
HP EliteBook 8 Flip G1i 13
Intel Core Ultra 7 265U, Intel Graphics 4-Core iGPU (Meteor / Arrow Lake)
52.4 (32.2min) fps +15%
Lenovo ThinkPad L13 2in1 G5 21LNS4AM00
Intel Core Ultra 5 125U, Intel Graphics 4-Core iGPU (Meteor / Arrow Lake)
50.7 (29.1min) fps +11%
Dell XPS 13 DX13260
Intel Core 5 320, Intel Graphics 2 Xe3 Wildcat Lake iGPU
45.7 (22.3min) fps
Dell Latitude 13 7330
Intel Core i7-1265U, Intel Iris Xe Graphics G7 96EUs
44.9 (40.1min) fps -2%
Média Intel Graphics 2 Xe3 Wildcat Lake iGPU
  (32.8 - 45.7, n=2)
39.3 fps -14%
Final Fantasy XV Benchmark
1280x720 Lite Quality
Dell XPS 14 Core Ultra X7 358H
Intel Core Ultra X7 358H, Intel Arc B390 12 Xe3 Panther Lake iGPU
123.5 fps +232%
Dell XPS 13 9350
Intel Core Ultra 7 256V, Intel Arc Graphics 140V
79.4 fps +113%
Lenovo ThinkPad X1 Carbon Gen 14 21V70075GE
Intel Core Ultra 5 325, Intel Graphics 4 Xe3 Panther Lake iGPU
73 fps +96%
Dell XPS 14 Core Ultra 7 355
Intel Core Ultra 7 355, Intel Graphics 4 Xe3 Panther Lake iGPU
67.3 fps +81%
HP OmniBook 7 Aero 13-bg1077nr
AMD Ryzen AI 7 350, AMD Radeon 860M
63.4 fps +70%
Alldocube iWork GT Ultra
Intel Core Ultra 5 125H, Intel Arc 7-Core iGPU
58 fps +56%
Microsoft Surface Pro 8, i7-1185G7
Intel Core i7-1185G7, Intel Iris Xe Graphics G7 96EUs
48.5 fps +30%
Lenovo ThinkPad L13 2in1 G5 21LNS4AM00
Intel Core Ultra 5 125U, Intel Graphics 4-Core iGPU (Meteor / Arrow Lake)
44.9 fps +21%
HP EliteBook 8 Flip G1i 13
Intel Core Ultra 7 265U, Intel Graphics 4-Core iGPU (Meteor / Arrow Lake)
42.6 fps +15%
Média Intel Graphics 2 Xe3 Wildcat Lake iGPU
  (37.2 - 39.4, n=2)
38.3 fps +3%
Dell XPS 13 DX13260
Intel Core 5 320, Intel Graphics 2 Xe3 Wildcat Lake iGPU
37.2 fps
Dell Latitude 13 7330
Intel Core i7-1265U, Intel Iris Xe Graphics G7 96EUs
32.9 fps -12%
1920x1080 Standard Quality
Dell XPS 14 Core Ultra X7 358H
Intel Core Ultra X7 358H, Intel Arc B390 12 Xe3 Panther Lake iGPU
73.7 fps +294%
Dell XPS 13 9350
Intel Core Ultra 7 256V, Intel Arc Graphics 140V
46.1 fps +147%
Lenovo ThinkPad X1 Carbon Gen 14 21V70075GE
Intel Core Ultra 5 325, Intel Graphics 4 Xe3 Panther Lake iGPU
37.5 fps +101%
Dell XPS 14 Core Ultra 7 355
Intel Core Ultra 7 355, Intel Graphics 4 Xe3 Panther Lake iGPU
34.9 fps +87%
Alldocube iWork GT Ultra
Intel Core Ultra 5 125H, Intel Arc 7-Core iGPU
33.2 fps +78%
HP OmniBook 7 Aero 13-bg1077nr
AMD Ryzen AI 7 350, AMD Radeon 860M
32.7 fps +75%
Microsoft Surface Pro 8, i7-1185G7
Intel Core i7-1185G7, Intel Iris Xe Graphics G7 96EUs
26.9 fps +44%
HP EliteBook 8 Flip G1i 13
Intel Core Ultra 7 265U, Intel Graphics 4-Core iGPU (Meteor / Arrow Lake)
24.9 fps +33%
Lenovo ThinkPad L13 2in1 G5 21LNS4AM00
Intel Core Ultra 5 125U, Intel Graphics 4-Core iGPU (Meteor / Arrow Lake)
24.2 fps +29%
Média Intel Graphics 2 Xe3 Wildcat Lake iGPU
  (18.7 - 20.3, n=2)
19.5 fps +4%
Dell XPS 13 DX13260
Intel Core 5 320, Intel Graphics 2 Xe3 Wildcat Lake iGPU
18.7 fps
Dell Latitude 13 7330
Intel Core i7-1265U, Intel Iris Xe Graphics G7 96EUs
17.5 fps -6%
1920x1080 High Quality
Dell XPS 14 Core Ultra X7 358H
Intel Core Ultra X7 358H, Intel Arc B390 12 Xe3 Panther Lake iGPU
52.8 fps +182%
Dell XPS 13 9350
Intel Core Ultra 7 256V, Intel Arc Graphics 140V
31.5 fps +68%
Microsoft Surface Pro 8, i7-1185G7
Intel Core i7-1185G7, Intel Iris Xe Graphics G7 96EUs
26.9 fps +44%
Lenovo ThinkPad X1 Carbon Gen 14 21V70075GE
Intel Core Ultra 5 325, Intel Graphics 4 Xe3 Panther Lake iGPU
26.8 fps +43%
Dell XPS 14 Core Ultra 7 355
Intel Core Ultra 7 355, Intel Graphics 4 Xe3 Panther Lake iGPU
25.4 fps +36%
HP OmniBook 7 Aero 13-bg1077nr
AMD Ryzen AI 7 350, AMD Radeon 860M
23.3 fps +25%
Alldocube iWork GT Ultra
Intel Core Ultra 5 125H, Intel Arc 7-Core iGPU
23.1 fps +24%
Dell XPS 13 DX13260
Intel Core 5 320, Intel Graphics 2 Xe3 Wildcat Lake iGPU
18.7 fps
HP EliteBook 8 Flip G1i 13
Intel Core Ultra 7 265U, Intel Graphics 4-Core iGPU (Meteor / Arrow Lake)
18.2 fps -3%
Média Intel Graphics 2 Xe3 Wildcat Lake iGPU
  (15.2 - 18.7, n=2)
17 fps -9%
Lenovo ThinkPad L13 2in1 G5 21LNS4AM00
Intel Core Ultra 5 125U, Intel Graphics 4-Core iGPU (Meteor / Arrow Lake)
16.9 fps -10%
Dell Latitude 13 7330
Intel Core i7-1265U, Intel Iris Xe Graphics G7 96EUs
12.9 fps -31%
X-Plane 11.11
1280x720 low (fps_test=1)
HP OmniBook 7 Aero 13-bg1077nr
AMD Ryzen AI 7 350, AMD Radeon 860M
60.3 fps +157%
Dell XPS 14 Core Ultra X7 358H
Intel Core Ultra X7 358H, Intel Arc B390 12 Xe3 Panther Lake iGPU
59.7 fps +154%
Dell Latitude 13 7330
Intel Core i7-1265U, Intel Iris Xe Graphics G7 96EUs
47.3 fps +101%
Dell XPS 13 9350
Intel Core Ultra 7 256V, Intel Arc Graphics 140V
47.1 fps +100%
Dell XPS 14 Core Ultra 7 355
Intel Core Ultra 7 355, Intel Graphics 4 Xe3 Panther Lake iGPU
43.6 fps +86%
Alldocube iWork GT Ultra
Intel Core Ultra 5 125H, Intel Arc 7-Core iGPU
42.6 fps +81%
Lenovo ThinkPad X1 Carbon Gen 14 21V70075GE
Intel Core Ultra 5 325, Intel Graphics 4 Xe3 Panther Lake iGPU
36.2 fps +54%
Lenovo ThinkPad L13 2in1 G5 21LNS4AM00
Intel Core Ultra 5 125U, Intel Graphics 4-Core iGPU (Meteor / Arrow Lake)
35.5 fps +51%
HP EliteBook 8 Flip G1i 13
Intel Core Ultra 7 265U, Intel Graphics 4-Core iGPU (Meteor / Arrow Lake)
35.3 fps +50%
Microsoft Surface Pro 8, i7-1185G7
Intel Core i7-1185G7, Intel Iris Xe Graphics G7 96EUs
33.6 fps +43%
Média Intel Graphics 2 Xe3 Wildcat Lake iGPU
  (23.5 - 32.6, n=2)
28.1 fps +20%
Dell XPS 13 DX13260
Intel Core 5 320, Intel Graphics 2 Xe3 Wildcat Lake iGPU
23.5 fps
1920x1080 med (fps_test=2)
HP OmniBook 7 Aero 13-bg1077nr
AMD Ryzen AI 7 350, AMD Radeon 860M
48.9 fps +107%
Dell XPS 14 Core Ultra X7 358H
Intel Core Ultra X7 358H, Intel Arc B390 12 Xe3 Panther Lake iGPU
47.1 fps +100%
Dell XPS 13 9350
Intel Core Ultra 7 256V, Intel Arc Graphics 140V
36.1 fps +53%
Dell Latitude 13 7330
Intel Core i7-1265U, Intel Iris Xe Graphics G7 96EUs
33.8 fps +43%
Alldocube iWork GT Ultra
Intel Core Ultra 5 125H, Intel Arc 7-Core iGPU
32.4 fps +37%
Dell XPS 14 Core Ultra 7 355
Intel Core Ultra 7 355, Intel Graphics 4 Xe3 Panther Lake iGPU
30.9 fps +31%
Lenovo ThinkPad X1 Carbon Gen 14 21V70075GE
Intel Core Ultra 5 325, Intel Graphics 4 Xe3 Panther Lake iGPU
29.4 fps +25%
Microsoft Surface Pro 8, i7-1185G7
Intel Core i7-1185G7, Intel Iris Xe Graphics G7 96EUs
28.8 fps +22%
HP EliteBook 8 Flip G1i 13
Intel Core Ultra 7 265U, Intel Graphics 4-Core iGPU (Meteor / Arrow Lake)
28.1 fps +19%
Lenovo ThinkPad L13 2in1 G5 21LNS4AM00
Intel Core Ultra 5 125U, Intel Graphics 4-Core iGPU (Meteor / Arrow Lake)
28 fps +19%
Média Intel Graphics 2 Xe3 Wildcat Lake iGPU
  (23.6 - 26.2, n=2)
24.9 fps +6%
Dell XPS 13 DX13260
Intel Core 5 320, Intel Graphics 2 Xe3 Wildcat Lake iGPU
23.6 fps
1920x1080 high (fps_test=3)
HP OmniBook 7 Aero 13-bg1077nr
AMD Ryzen AI 7 350, AMD Radeon 860M
40.4 fps +98%
Dell XPS 14 Core Ultra X7 358H
Intel Core Ultra X7 358H, Intel Arc B390 12 Xe3 Panther Lake iGPU
40.3 fps +98%
Dell XPS 14 Core Ultra 7 355
Intel Core Ultra 7 355, Intel Graphics 4 Xe3 Panther Lake iGPU
30.5 fps +50%
Dell Latitude 13 7330
Intel Core i7-1265U, Intel Iris Xe Graphics G7 96EUs
30.3 fps +49%
Microsoft Surface Pro 8, i7-1185G7
Intel Core i7-1185G7, Intel Iris Xe Graphics G7 96EUs
30.2 fps +48%
Dell XPS 13 9350
Intel Core Ultra 7 256V, Intel Arc Graphics 140V
30.1 fps +48%
Alldocube iWork GT Ultra
Intel Core Ultra 5 125H, Intel Arc 7-Core iGPU
29.9 fps +47%
Lenovo ThinkPad X1 Carbon Gen 14 21V70075GE
Intel Core Ultra 5 325, Intel Graphics 4 Xe3 Panther Lake iGPU
25.5 fps +25%
Lenovo ThinkPad L13 2in1 G5 21LNS4AM00
Intel Core Ultra 5 125U, Intel Graphics 4-Core iGPU (Meteor / Arrow Lake)
24.1 fps +18%
HP EliteBook 8 Flip G1i 13
Intel Core Ultra 7 265U, Intel Graphics 4-Core iGPU (Meteor / Arrow Lake)
23.7 fps +16%
Dell XPS 13 DX13260
Intel Core 5 320, Intel Graphics 2 Xe3 Wildcat Lake iGPU
20.4 fps
Média Intel Graphics 2 Xe3 Wildcat Lake iGPU
  (17.8 - 20.4, n=2)
19.1 fps -6%
Baldur's Gate 3
1280x720 Low Preset AA:SM
Dell XPS 14 Core Ultra X7 358H
Intel Core Ultra X7 358H, Intel Arc B390 12 Xe3 Panther Lake iGPU
87 (74.7min, 76P0.1, 78.7P1) fps +254%
Dell XPS 13 9350
Intel Core Ultra 7 256V, Intel Arc Graphics 140V
51.7 fps +110%
HP OmniBook 7 Aero 13-bg1077nr
AMD Ryzen AI 7 350, AMD Radeon 860M
48.9 (32.2min, 36.1P0.1, 45P1) fps +99%
Dell XPS 14 Core Ultra 7 355
Intel Core Ultra 7 355, Intel Graphics 4 Xe3 Panther Lake iGPU
40.6 (34.8min, 34.9P0.1, 37.6P1) fps +65%
Alldocube iWork GT Ultra
Intel Core Ultra 5 125H, Intel Arc 7-Core iGPU
35.5 (20min, 20P0.1, 29.9P1) fps +44%
HP EliteBook 8 Flip G1i 13
Intel Core Ultra 7 265U, Intel Graphics 4-Core iGPU (Meteor / Arrow Lake)
26.3 fps +7%
Média Intel Graphics 2 Xe3 Wildcat Lake iGPU
  (24.6 - 26.9, n=2)
25.8 fps +5%
Dell XPS 13 DX13260
Intel Core 5 320, Intel Graphics 2 Xe3 Wildcat Lake iGPU
24.6 (21.6min, 21.7P0.1, 22P1) fps
1920x1080 Low Preset AA:SM
Dell XPS 14 Core Ultra X7 358H
Intel Core Ultra X7 358H, Intel Arc B390 12 Xe3 Panther Lake iGPU
64.3 (56.2min, 57.5P0.1, 60.1P1) fps +318%
Dell XPS 13 9350
Intel Core Ultra 7 256V, Intel Arc Graphics 140V
36.6 fps +138%
Lenovo ThinkPad X1 Carbon Gen 14 21V70075GE
Intel Core Ultra 5 325, Intel Graphics 4 Xe3 Panther Lake iGPU
34.8 (30.4min, 30.4P0.1, 31P1) fps +126%
HP OmniBook 7 Aero 13-bg1077nr
AMD Ryzen AI 7 350, AMD Radeon 860M
31.8 (23.7min, 23.7P0.1, 27.7P1) fps +106%
Dell XPS 14 Core Ultra 7 355
Intel Core Ultra 7 355, Intel Graphics 4 Xe3 Panther Lake iGPU
28.4 (25.5min, 25.8P0.1, 26.5P1) fps +84%
Alldocube iWork GT Ultra
Intel Core Ultra 5 125H, Intel Arc 7-Core iGPU
25.3 (19.9min, 19.9P0.1, 20P1) fps +64%
Lenovo ThinkPad L13 2in1 G5 21LNS4AM00
Intel Core Ultra 5 125U, Intel Graphics 4-Core iGPU (Meteor / Arrow Lake)
19.4 fps +26%
Apple MacBook Neo 256 GB
Apple A18 Pro, Apple A18 GPU
19.1 fps +24%
HP EliteBook 8 Flip G1i 13
Intel Core Ultra 7 265U, Intel Graphics 4-Core iGPU (Meteor / Arrow Lake)
18.1 fps +18%
Média Intel Graphics 2 Xe3 Wildcat Lake iGPU
  (15.4 - 17.1, n=2)
16.3 fps +6%
Dell XPS 13 DX13260
Intel Core 5 320, Intel Graphics 2 Xe3 Wildcat Lake iGPU
15.4 (7.68min, 9.28P0.1, 13.8P1) fps
1920x1080 Medium Preset AA:T
Dell XPS 14 Core Ultra X7 358H
Intel Core Ultra X7 358H, Intel Arc B390 12 Xe3 Panther Lake iGPU
55.4 (49.6min, 49.9P0.1, 51P1) fps +340%
Dell XPS 13 9350
Intel Core Ultra 7 256V, Intel Arc Graphics 140V
30.5 fps +142%
HP OmniBook 7 Aero 13-bg1077nr
AMD Ryzen AI 7 350, AMD Radeon 860M
26.4 (15.9min, 16.5P0.1, 20.8P1) fps +110%
Lenovo ThinkPad X1 Carbon Gen 14 21V70075GE
Intel Core Ultra 5 325, Intel Graphics 4 Xe3 Panther Lake iGPU
26 (23.5min, 23.6P0.1, 23.9P1) fps +106%
Dell XPS 14 Core Ultra 7 355
Intel Core Ultra 7 355, Intel Graphics 4 Xe3 Panther Lake iGPU
23 (20.8min, 20.8P0.1, 21.1P1) fps +83%
Alldocube iWork GT Ultra
Intel Core Ultra 5 125H, Intel Arc 7-Core iGPU
19.7 (15min, 15P0.1, 15P1) fps +56%
Apple MacBook Neo 256 GB
Apple A18 Pro, Apple A18 GPU
15.5 fps +23%
Lenovo ThinkPad L13 2in1 G5 21LNS4AM00
Intel Core Ultra 5 125U, Intel Graphics 4-Core iGPU (Meteor / Arrow Lake)
15.3 fps +21%
HP EliteBook 8 Flip G1i 13
Intel Core Ultra 7 265U, Intel Graphics 4-Core iGPU (Meteor / Arrow Lake)
14.9 fps +18%
Média Intel Graphics 2 Xe3 Wildcat Lake iGPU
  (12.6 - 13.9, n=2)
13.3 fps +6%
Dell XPS 13 DX13260
Intel Core 5 320, Intel Graphics 2 Xe3 Wildcat Lake iGPU
12.6 (11.6min, 11.6P0.1, 11.8P1) fps
1920x1080 High Preset AA:T
Dell XPS 14 Core Ultra X7 358H
Intel Core Ultra X7 358H, Intel Arc B390 12 Xe3 Panther Lake iGPU
49 (44.2min, 44.5P0.1, 46.3P1) fps +350%
Dell XPS 13 9350
Intel Core Ultra 7 256V, Intel Arc Graphics 140V
25.8 fps +137%
Lenovo ThinkPad X1 Carbon Gen 14 21V70075GE
Intel Core Ultra 5 325, Intel Graphics 4 Xe3 Panther Lake iGPU
22.9 (20.7min, 20.7P0.1, 21P1) fps +110%
HP OmniBook 7 Aero 13-bg1077nr
AMD Ryzen AI 7 350, AMD Radeon 860M
21.1 (16.7min, 17.1P0.1, 18.9P1) fps +94%
Dell XPS 14 Core Ultra 7 355
Intel Core Ultra 7 355, Intel Graphics 4 Xe3 Panther Lake iGPU
19.6 (18.3min, 18.3P0.1, 18.4P1) fps +80%
Alldocube iWork GT Ultra
Intel Core Ultra 5 125H, Intel Arc 7-Core iGPU
17.3 (14.9min, 14.9P0.1, 15P1) fps +59%
Apple MacBook Neo 256 GB
Apple A18 Pro, Apple A18 GPU
13.9 fps +28%
Lenovo ThinkPad L13 2in1 G5 21LNS4AM00
Intel Core Ultra 5 125U, Intel Graphics 4-Core iGPU (Meteor / Arrow Lake)
13.1 fps +20%
HP EliteBook 8 Flip G1i 13
Intel Core Ultra 7 265U, Intel Graphics 4-Core iGPU (Meteor / Arrow Lake)
12.8 fps +17%
Média Intel Graphics 2 Xe3 Wildcat Lake iGPU
  (10.9 - 12, n=2)
11.5 fps +6%
Dell XPS 13 DX13260
Intel Core 5 320, Intel Graphics 2 Xe3 Wildcat Lake iGPU
10.9 (9.83min, 9.85P0.1, 9.97P1) fps
1920x1080 Ultra Preset AA:T
Dell XPS 14 Core Ultra X7 358H
Intel Core Ultra X7 358H, Intel Arc B390 12 Xe3 Panther Lake iGPU
48.7 (43.1min, 44.3P0.1, 45.5P1) fps +347%
Dell XPS 13 9350
Intel Core Ultra 7 256V, Intel Arc Graphics 140V
25.7 fps +136%
Lenovo ThinkPad X1 Carbon Gen 14 21V70075GE
Intel Core Ultra 5 325, Intel Graphics 4 Xe3 Panther Lake iGPU
22.4 (20.3min, 20.4P0.1, 20.6P1) fps +106%
HP OmniBook 7 Aero 13-bg1077nr
AMD Ryzen AI 7 350, AMD Radeon 860M
20.6 (17.1min, 17.1P0.1, 18.4P1) fps +89%
Dell XPS 14 Core Ultra 7 355
Intel Core Ultra 7 355, Intel Graphics 4 Xe3 Panther Lake iGPU
19.5 (18.1min, 18.1P0.1, 18.3P1) fps +79%
Alldocube iWork GT Ultra
Intel Core Ultra 5 125H, Intel Arc 7-Core iGPU
17 (14.9min, 14.9P0.1, 15P1) fps +56%
Apple MacBook Neo 256 GB
Apple A18 Pro, Apple A18 GPU
13.6 fps +25%
Lenovo ThinkPad L13 2in1 G5 21LNS4AM00
Intel Core Ultra 5 125U, Intel Graphics 4-Core iGPU (Meteor / Arrow Lake)
12.8 fps +17%
HP EliteBook 8 Flip G1i 13
Intel Core Ultra 7 265U, Intel Graphics 4-Core iGPU (Meteor / Arrow Lake)
12.7 fps +17%
Média Intel Graphics 2 Xe3 Wildcat Lake iGPU
  (10.9 - 11.8, n=2)
11.4 fps +5%
Dell XPS 13 DX13260
Intel Core 5 320, Intel Graphics 2 Xe3 Wildcat Lake iGPU
10.9 (9.5min, 9.53P0.1, 9.91P1) fps
Cyberpunk 2077
1280x720 Low Preset (FSR off)
Dell XPS 14 Core Ultra X7 358H
Intel Core Ultra X7 358H, Intel Arc B390 12 Xe3 Panther Lake iGPU
94.4 (78.1min, 71P1) fps +178%
Dell XPS 13 9350
Intel Core Ultra 7 256V, Intel Arc Graphics 140V
66.6 (50.2min) fps +96%
Dell XPS 14 Core Ultra 7 355
Intel Core Ultra 7 355, Intel Graphics 4 Xe3 Panther Lake iGPU
59.3 (48.7min, 45.4P1) fps +75%
HP OmniBook 7 Aero 13-bg1077nr
AMD Ryzen AI 7 350, AMD Radeon 860M
49 (39min, 12.1P1) fps +45%
Alldocube iWork GT Ultra
Intel Core Ultra 5 125H, Intel Arc 7-Core iGPU
34.7 (28.8min) fps +2%
Média Intel Graphics 2 Xe3 Wildcat Lake iGPU
  (33.9 - 34.7, n=2)
34.3 fps +1%
Dell XPS 13 DX13260
Intel Core 5 320, Intel Graphics 2 Xe3 Wildcat Lake iGPU
33.9 (28.7min, 26.9P1) fps
HP EliteBook 8 Flip G1i 13
Intel Core Ultra 7 265U, Intel Graphics 4-Core iGPU (Meteor / Arrow Lake)
32.7 (26.5min, 25.4P1) fps -4%
1920x1080 Low Preset (FSR off)
Dell XPS 14 Core Ultra X7 358H
Intel Core Ultra X7 358H, Intel Arc B390 12 Xe3 Panther Lake iGPU
68.6 (57.3min, 52.9P1) fps +267%
Dell XPS 13 9350
Intel Core Ultra 7 256V, Intel Arc Graphics 140V
45.7 (36.4min) fps +144%
Lenovo ThinkPad X1 Carbon Gen 14 21V70075GE
Intel Core Ultra 5 325, Intel Graphics 4 Xe3 Panther Lake iGPU
38.6 (32.4min) fps +106%
Dell XPS 14 Core Ultra 7 355
Intel Core Ultra 7 355, Intel Graphics 4 Xe3 Panther Lake iGPU
32.7 (28.3min, 27P1) fps +75%
HP OmniBook 7 Aero 13-bg1077nr
AMD Ryzen AI 7 350, AMD Radeon 860M
32.5 (27min, 25.2P1) fps +74%
Alldocube iWork GT Ultra
Intel Core Ultra 5 125H, Intel Arc 7-Core iGPU
26.8 (23.2min) fps +43%
HP EliteBook 8 Flip G1i 13
Intel Core Ultra 7 265U, Intel Graphics 4-Core iGPU (Meteor / Arrow Lake)
21.1 (17.8min, 16.2P1) fps +13%
Média Intel Graphics 2 Xe3 Wildcat Lake iGPU
  (18.7 - 20.6, n=2)
19.7 fps +5%
Lenovo ThinkPad L13 2in1 G5 21LNS4AM00
Intel Core Ultra 5 125U, Intel Graphics 4-Core iGPU (Meteor / Arrow Lake)
19.5 (16.5min) fps +4%
Dell XPS 13 DX13260
Intel Core 5 320, Intel Graphics 2 Xe3 Wildcat Lake iGPU
18.7 (15.9min, 13.1P1) fps
Apple MacBook Neo 256 GB
Apple A18 Pro, Apple A18 GPU
12.4 fps -34%
1920x1080 Medium Preset (FSR off)
Dell XPS 14 Core Ultra X7 358H
Intel Core Ultra X7 358H, Intel Arc B390 12 Xe3 Panther Lake iGPU
56.2 (48.2min, 44.5P1) fps +293%
Dell XPS 13 9350
Intel Core Ultra 7 256V, Intel Arc Graphics 140V
37 (30.1min) fps +159%
Lenovo ThinkPad X1 Carbon Gen 14 21V70075GE
Intel Core Ultra 5 325, Intel Graphics 4 Xe3 Panther Lake iGPU
29.1 (25.1min) fps +103%
Dell XPS 14 Core Ultra 7 355
Intel Core Ultra 7 355, Intel Graphics 4 Xe3 Panther Lake iGPU
27.7 (24.2min, 23.3P1) fps +94%
HP OmniBook 7 Aero 13-bg1077nr
AMD Ryzen AI 7 350, AMD Radeon 860M
24.9 (21.2min, 18.5P1) fps +74%
Alldocube iWork GT Ultra
Intel Core Ultra 5 125H, Intel Arc 7-Core iGPU
21.6 (18.7min) fps +51%
HP EliteBook 8 Flip G1i 13
Intel Core Ultra 7 265U, Intel Graphics 4-Core iGPU (Meteor / Arrow Lake)
17.1 (14.8min, 14.3P1) fps +20%
Lenovo ThinkPad L13 2in1 G5 21LNS4AM00
Intel Core Ultra 5 125U, Intel Graphics 4-Core iGPU (Meteor / Arrow Lake)
15.9 (13.9min) fps +11%
Média Intel Graphics 2 Xe3 Wildcat Lake iGPU
  (14.3 - 15.3, n=2)
14.8 fps +3%
Dell XPS 13 DX13260
Intel Core 5 320, Intel Graphics 2 Xe3 Wildcat Lake iGPU
14.3 (12.6min, 12.1P1) fps
Apple MacBook Neo 256 GB
Apple A18 Pro, Apple A18 GPU
9.2 fps -36%
baixomédiaaltoultra
GTA V (2015) 116.8 101 21.5 7.71
Dota 2 Reborn (2015) 79.2 43.7 45.3 45.7
Final Fantasy XV Benchmark (2018) 37.2 18.7 18.7
X-Plane 11.11 (2018) 23.5 23.6 20.4
Strange Brigade (2018) 95.1 38.6 30.5
Baldur's Gate 3 (2023) 15.4 12.6 10.9 10.9
Cyberpunk 2077 (2023) 18.7 14.3

Emissões

Ruído do sistema

O sistema é mais silencioso do que os modelos XPS 13 da geração anterior, o que se deve ao desempenho geral mais lento da CPU Wildcat. O ruído do ventilador só se torna perceptível ao executar tarefas mais exigentes, além da navegação na web ou do streaming de vídeo.
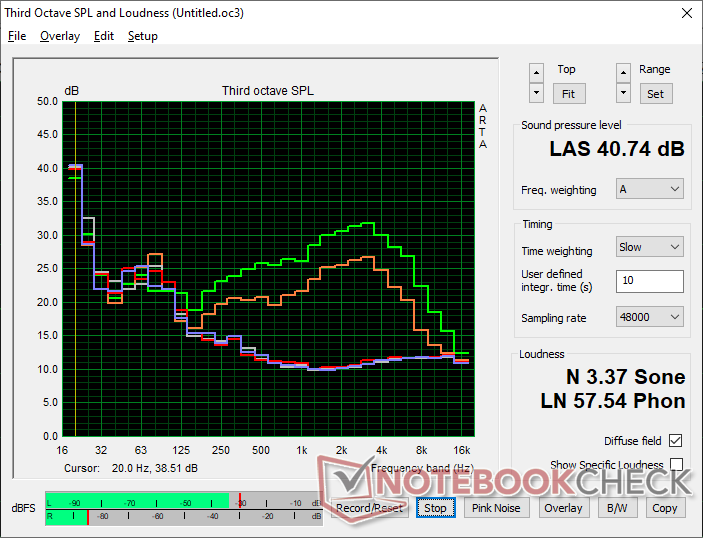
Perfil de ruído do ventilador (Branco: Fundo, Vermelho: Sistema em repouso, Azul: 3DMark 11, Laranja: Cyberpunk 2077, Verde: Teste de estresse com o Prime95)

Barulho

Ocioso
23.3 / 23.3 / 23.3 dB
Carga
27.7 / 40.7 dB
  red to green bar
 
 
30 dB
silencioso
40 dB(A)
audível
50 dB(A)
ruidosamente alto
 
min: dark, med: mid, max: light   Earthworks M23R, Arta (15 cm de distância)   ruído ambiente: 23.3 dB(A)
dB(A) 0102030405060708090Deep BassMiddle BassHigh BassLower RangeMidsHigher MidsLower HighsMid HighsUpper HighsSuper Highs2040.439.840.240.138.22528.62932.628.529.83121.924.224.421.924.64021.721.423.119.921.65024.625.1222223.76325.423.522.725.224.48022.424.725.427.121.91002223232221.812517.718.918.217.221.816015.415.414.916.118.520015.414.414.518.221.525013.913.614.119.823.13151514.41520.624.140012.512.113.220.32550012.111.311.520.825.863010.911.210.919.625.680010.611.110.32126.3100010.410.910.621.726.1125010.1109.923.428.516009.910.31025.229.9200010.210.310.125.530.6250010.410.610.326.331.4315010.811.310.726.731.7400011.311.311.124.730500011.411.711.622.328.2630011.711.711.720.426.8800011.711.711.715.822.41000011.711.811.713.518.51250011.91211.912.415.71600010.911.111.111.312.4SPL23.323.523.335.640.7N0.50.50.52.13.4median 11.7median 11.7median 11.6median 20.6median 25.6Delta1.61.81.73.44.2hearing rangehide median Fan NoiseDell XPS 13 DX13260
Dell XPS 13 DX13260
Core 5 320, Intel Graphics 2 Xe3 WCL
Dell XPS 14 Core Ultra X7 358H
Ultra X7 358H, Arc B390 Panther Lake iGPU
Dell XPS 13 9350
Core Ultra 7 256V, Arc 140V
Apple MacBook Neo 256 GB
A18 Pro, A18 GPU
HP OmniBook 7 Aero 13-bg1077nr
Ryzen AI 7 350, Radeon 860M
Lenovo ThinkPad X1 Carbon Gen 14 21V70075GE
Ultra 5 325, Intel Graphics 4 Xe3 PTL
Noise
-8%
-3%
6%
-10%
desligado / ambiente * (dB)
23.3
22.9
2%
24.1
-3%
23.2
-0%
24.8
-6%
Idle Minimum * (dB)
23.3
23.3
-0%
24.4
-5%
23.3
-0%
24.8
-6%
Idle Average * (dB)
23.3
23.3
-0%
24.4
-5%
23.3
-0%
24.8
-6%
Idle Maximum * (dB)
23.3
23.3
-0%
24.4
-5%
23.3
-0%
24.8
-6%
Load Average * (dB)
27.7
34
-23%
26.2
5%
24.7
11%
38.9
-40%
Cyberpunk 2077 ultra * (dB)
35.6
43.5
-22%
34.2
4%
23.5
34%
38.9
-9%
Load Maximum * (dB)
40.7
45.7
-12%
45.2
-11%
42
-3%
38.9
4%

* ... menor é melhor

Temperatura

Escape traseiro
Escape traseiro
O adaptador de corrente alterna atinge mais de 38 °C ao operar com cargas exigentes
Carga Máxima
 37.6 °C39 °C38.2 °C 
 34 °C37.6 °C33.4 °C 
 30 °C28.8 °C28.4 °C 
Máximo: 39 °C
Médio: 34.1 °C
35.8 °C38.2 °C36.6 °C
31.4 °C36.6 °C34.8 °C
29.4 °C30.8 °C30.6 °C
Máximo: 38.2 °C
Médio: 33.8 °C
alimentação elétrica  35.6 °C | Temperatura do quarto 20 °C | Fluke 62 Mini IR Thermometer
(±) A temperatura média para o lado superior sob carga máxima é 34.1 °C / 93 F, em comparação com a média de 30.8 °C / ###class_avg_f# ## F para os dispositivos da classe Subnotebook.
(+) A temperatura máxima no lado superior é 39 °C / 102 F, em comparação com a média de 35.9 °C / 97 F , variando de 21.4 a 59 °C para a classe Subnotebook.
(+) A parte inferior aquece até um máximo de 38.2 °C / 101 F, em comparação com a média de 39.2 °C / 103 F
(+) Em uso inativo, a temperatura média para o lado superior é 25.1 °C / 77 F, em comparação com a média do dispositivo de 30.8 °C / ### class_avg_f### F.
(+) Os apoios para as mãos e o touchpad são mais frios que a temperatura da pele, com um máximo de 30 °C / 86 F e, portanto, são frios ao toque.
(±) A temperatura média da área do apoio para as mãos de dispositivos semelhantes foi 28.2 °C / 82.8 F (-1.8 °C / -3.2 F).
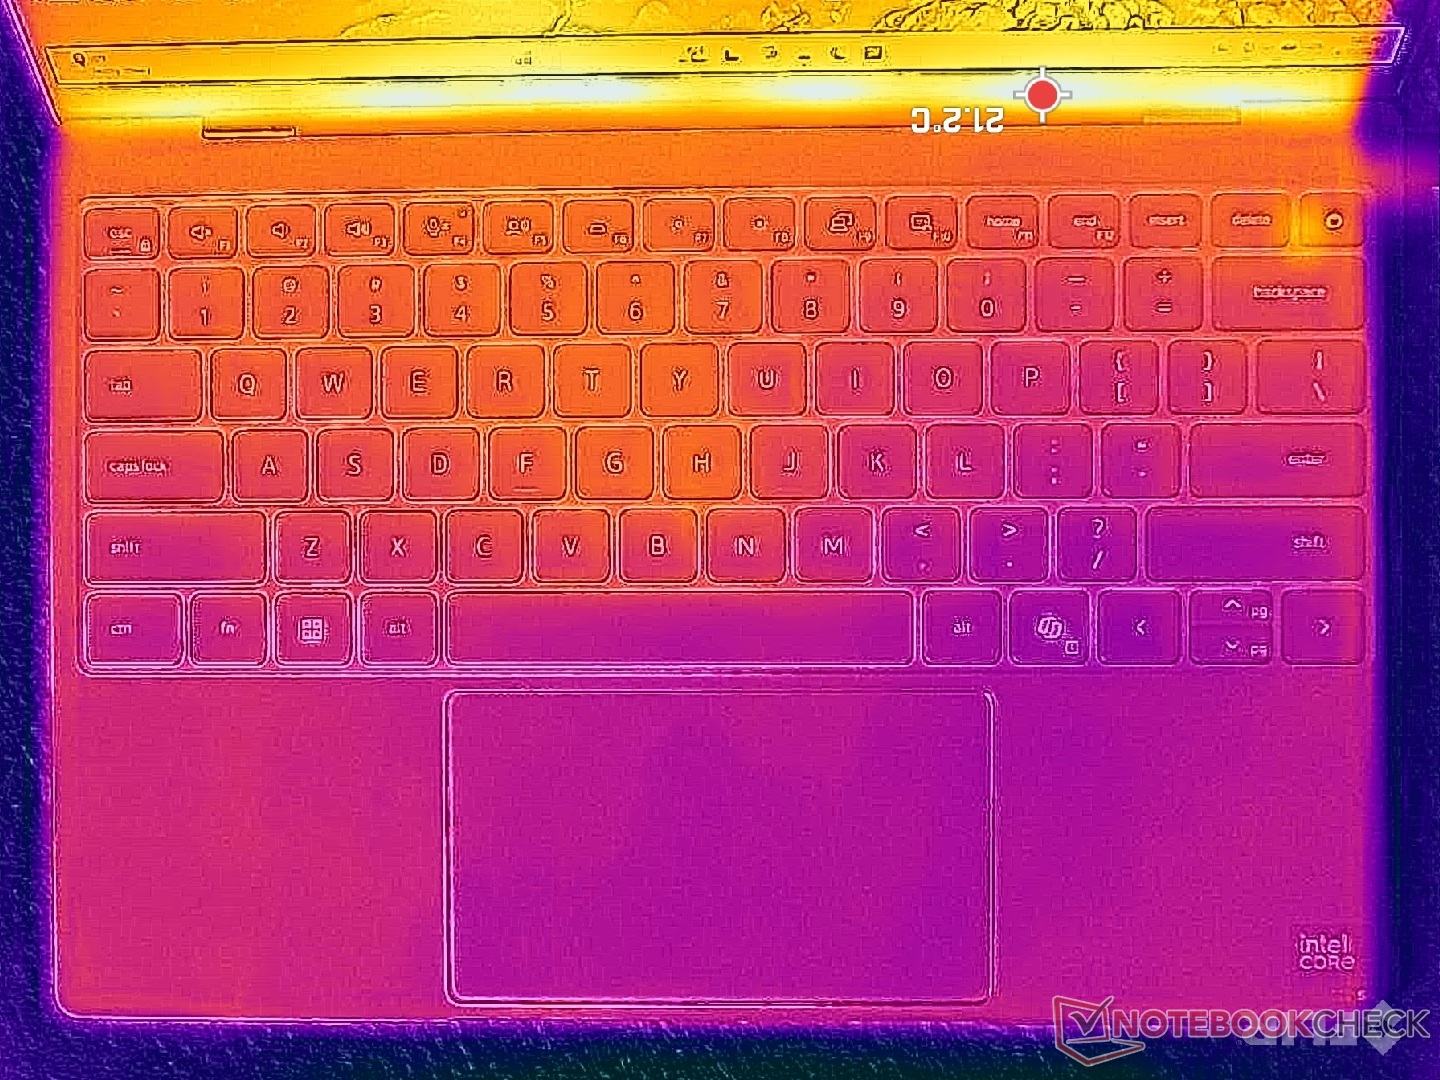
Sistema inativo (capa C)
Sistema inativo (capa D)
Teste de estresse com Prime95+FurMark (nível C)
Teste de estresse com Prime95+FurMark (nível D)
Dell XPS 13 DX13260
Core 5 320, Intel Graphics 2 Xe3 WCL
Dell XPS 14 Core Ultra X7 358H
Ultra X7 358H, Arc B390 Panther Lake iGPU
Dell XPS 13 9350
Core Ultra 7 256V, Arc 140V
Apple MacBook Neo 256 GB
A18 Pro, A18 GPU
HP OmniBook 7 Aero 13-bg1077nr
Ryzen AI 7 350, Radeon 860M
Lenovo ThinkPad X1 Carbon Gen 14 21V70075GE
Ultra 5 325, Intel Graphics 4 Xe3 PTL
Heat
5%
4%
4%
6%
-2%
Maximum Upper Side * (°C)
39
34
13%
34.8
11%
40.8
-5%
35.8
8%
40.7
-4%
Maximum Bottom * (°C)
38.2
35.8
6%
37.4
2%
38
1%
37.6
2%
42.8
-12%
Idle Upper Side * (°C)
26
25.6
2%
25.4
2%
23.8
8%
24.2
7%
24.9
4%
Idle Bottom * (°C)
26.2
26.4
-1%
26.2
-0%
22.8
13%
24
8%
25
5%

* ... menor é melhor

Teste de estresse

A CPU atingia 3,6 GHz e 35 W ao iniciar o teste de estresse do Prime95, antes de atingir rapidamente o pico de 100 °C. O desempenho então caía rapidamente para 2,6 GHz e 18 W, a fim de manter uma temperatura do núcleo mais controlável de 89 °C. A temperatura do núcleo pode ficar bastante elevada, levando a temperaturas superficiais visivelmente elevadas ao executar cargas exigentes.
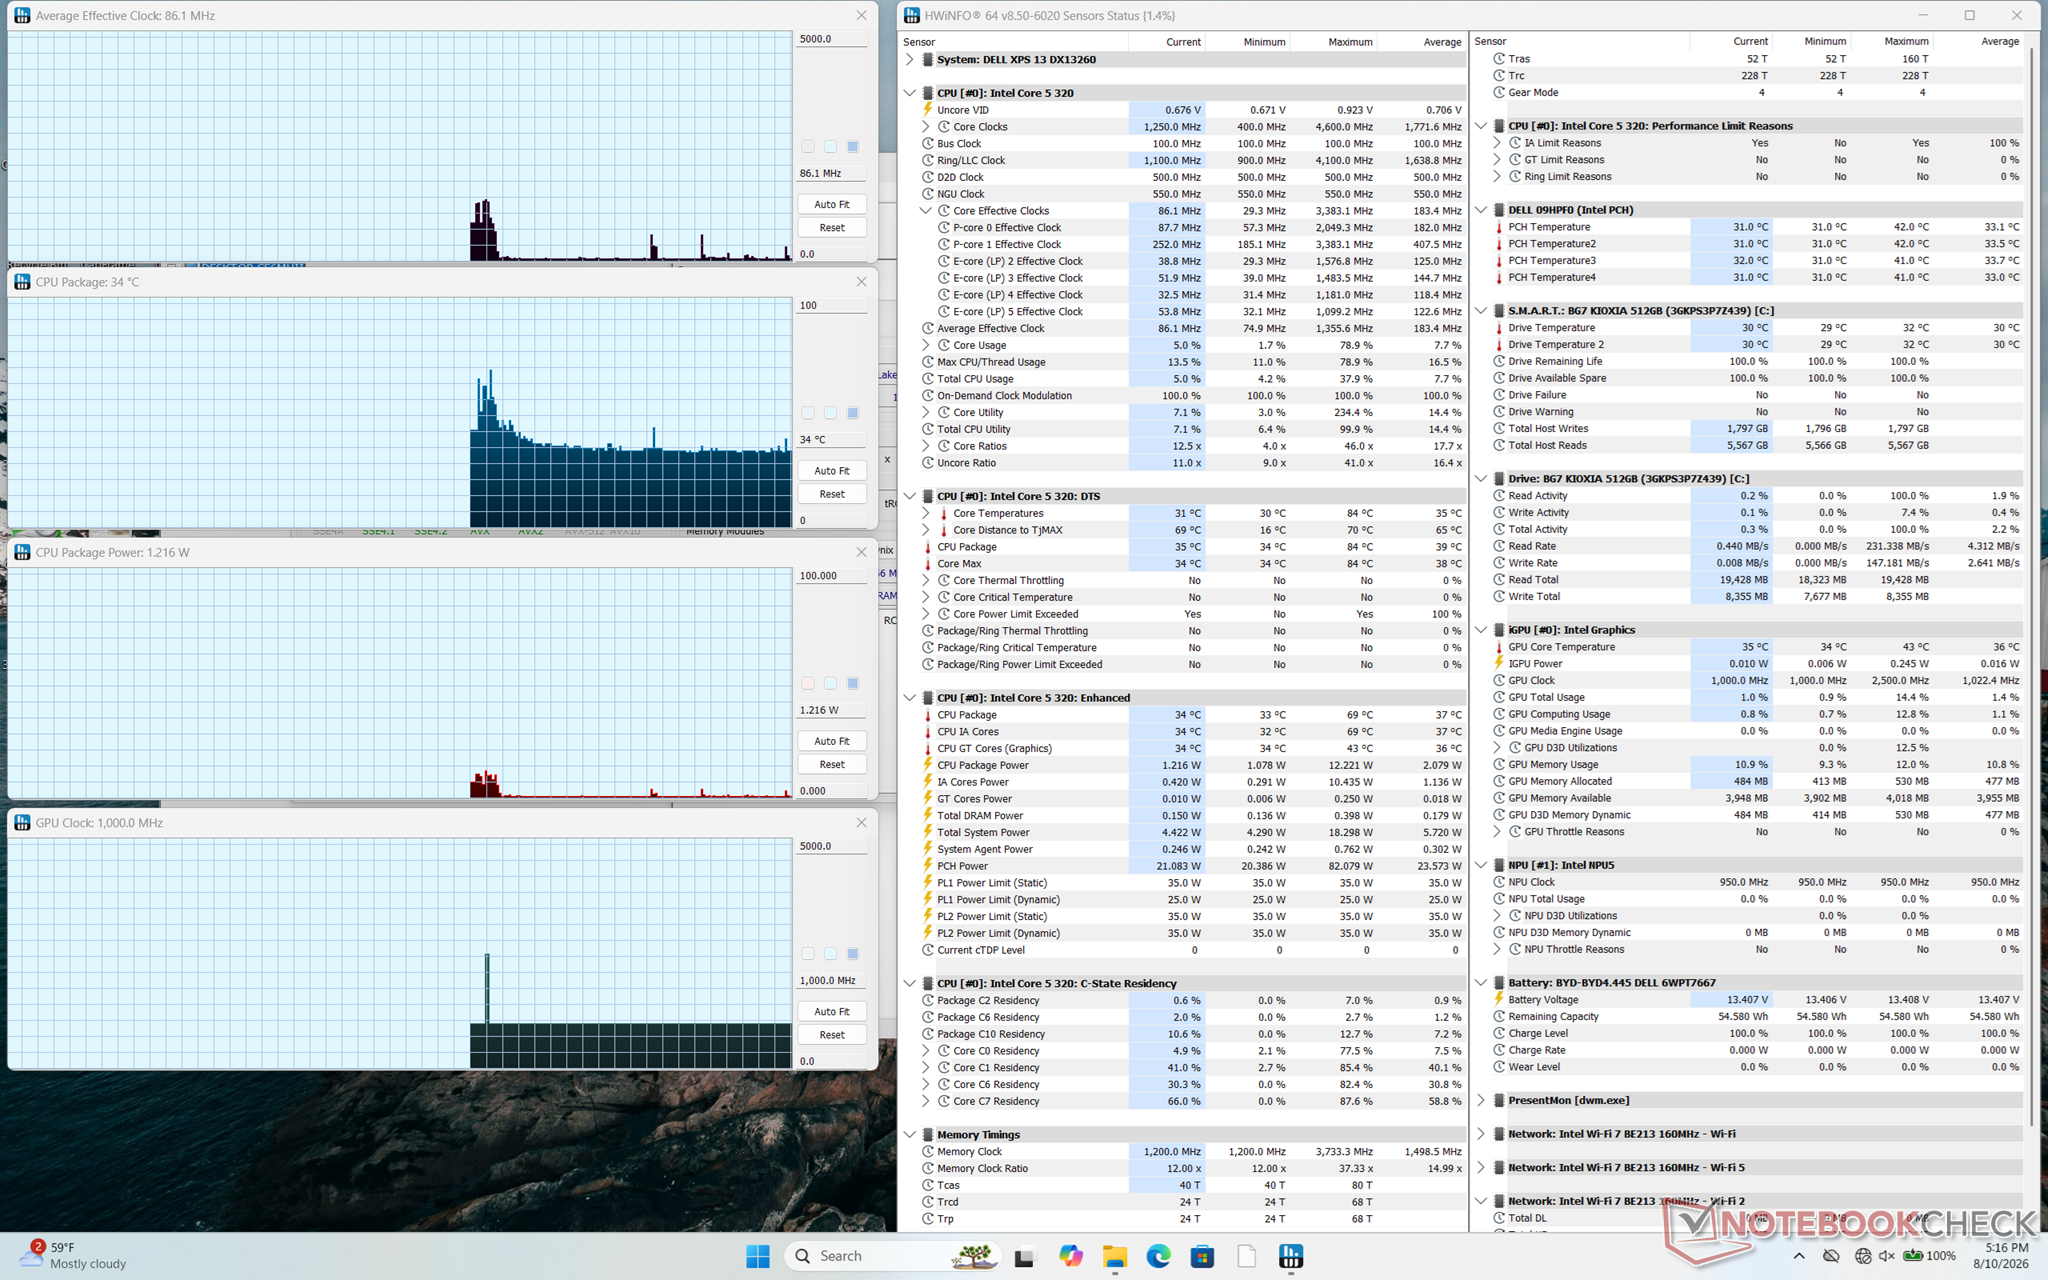
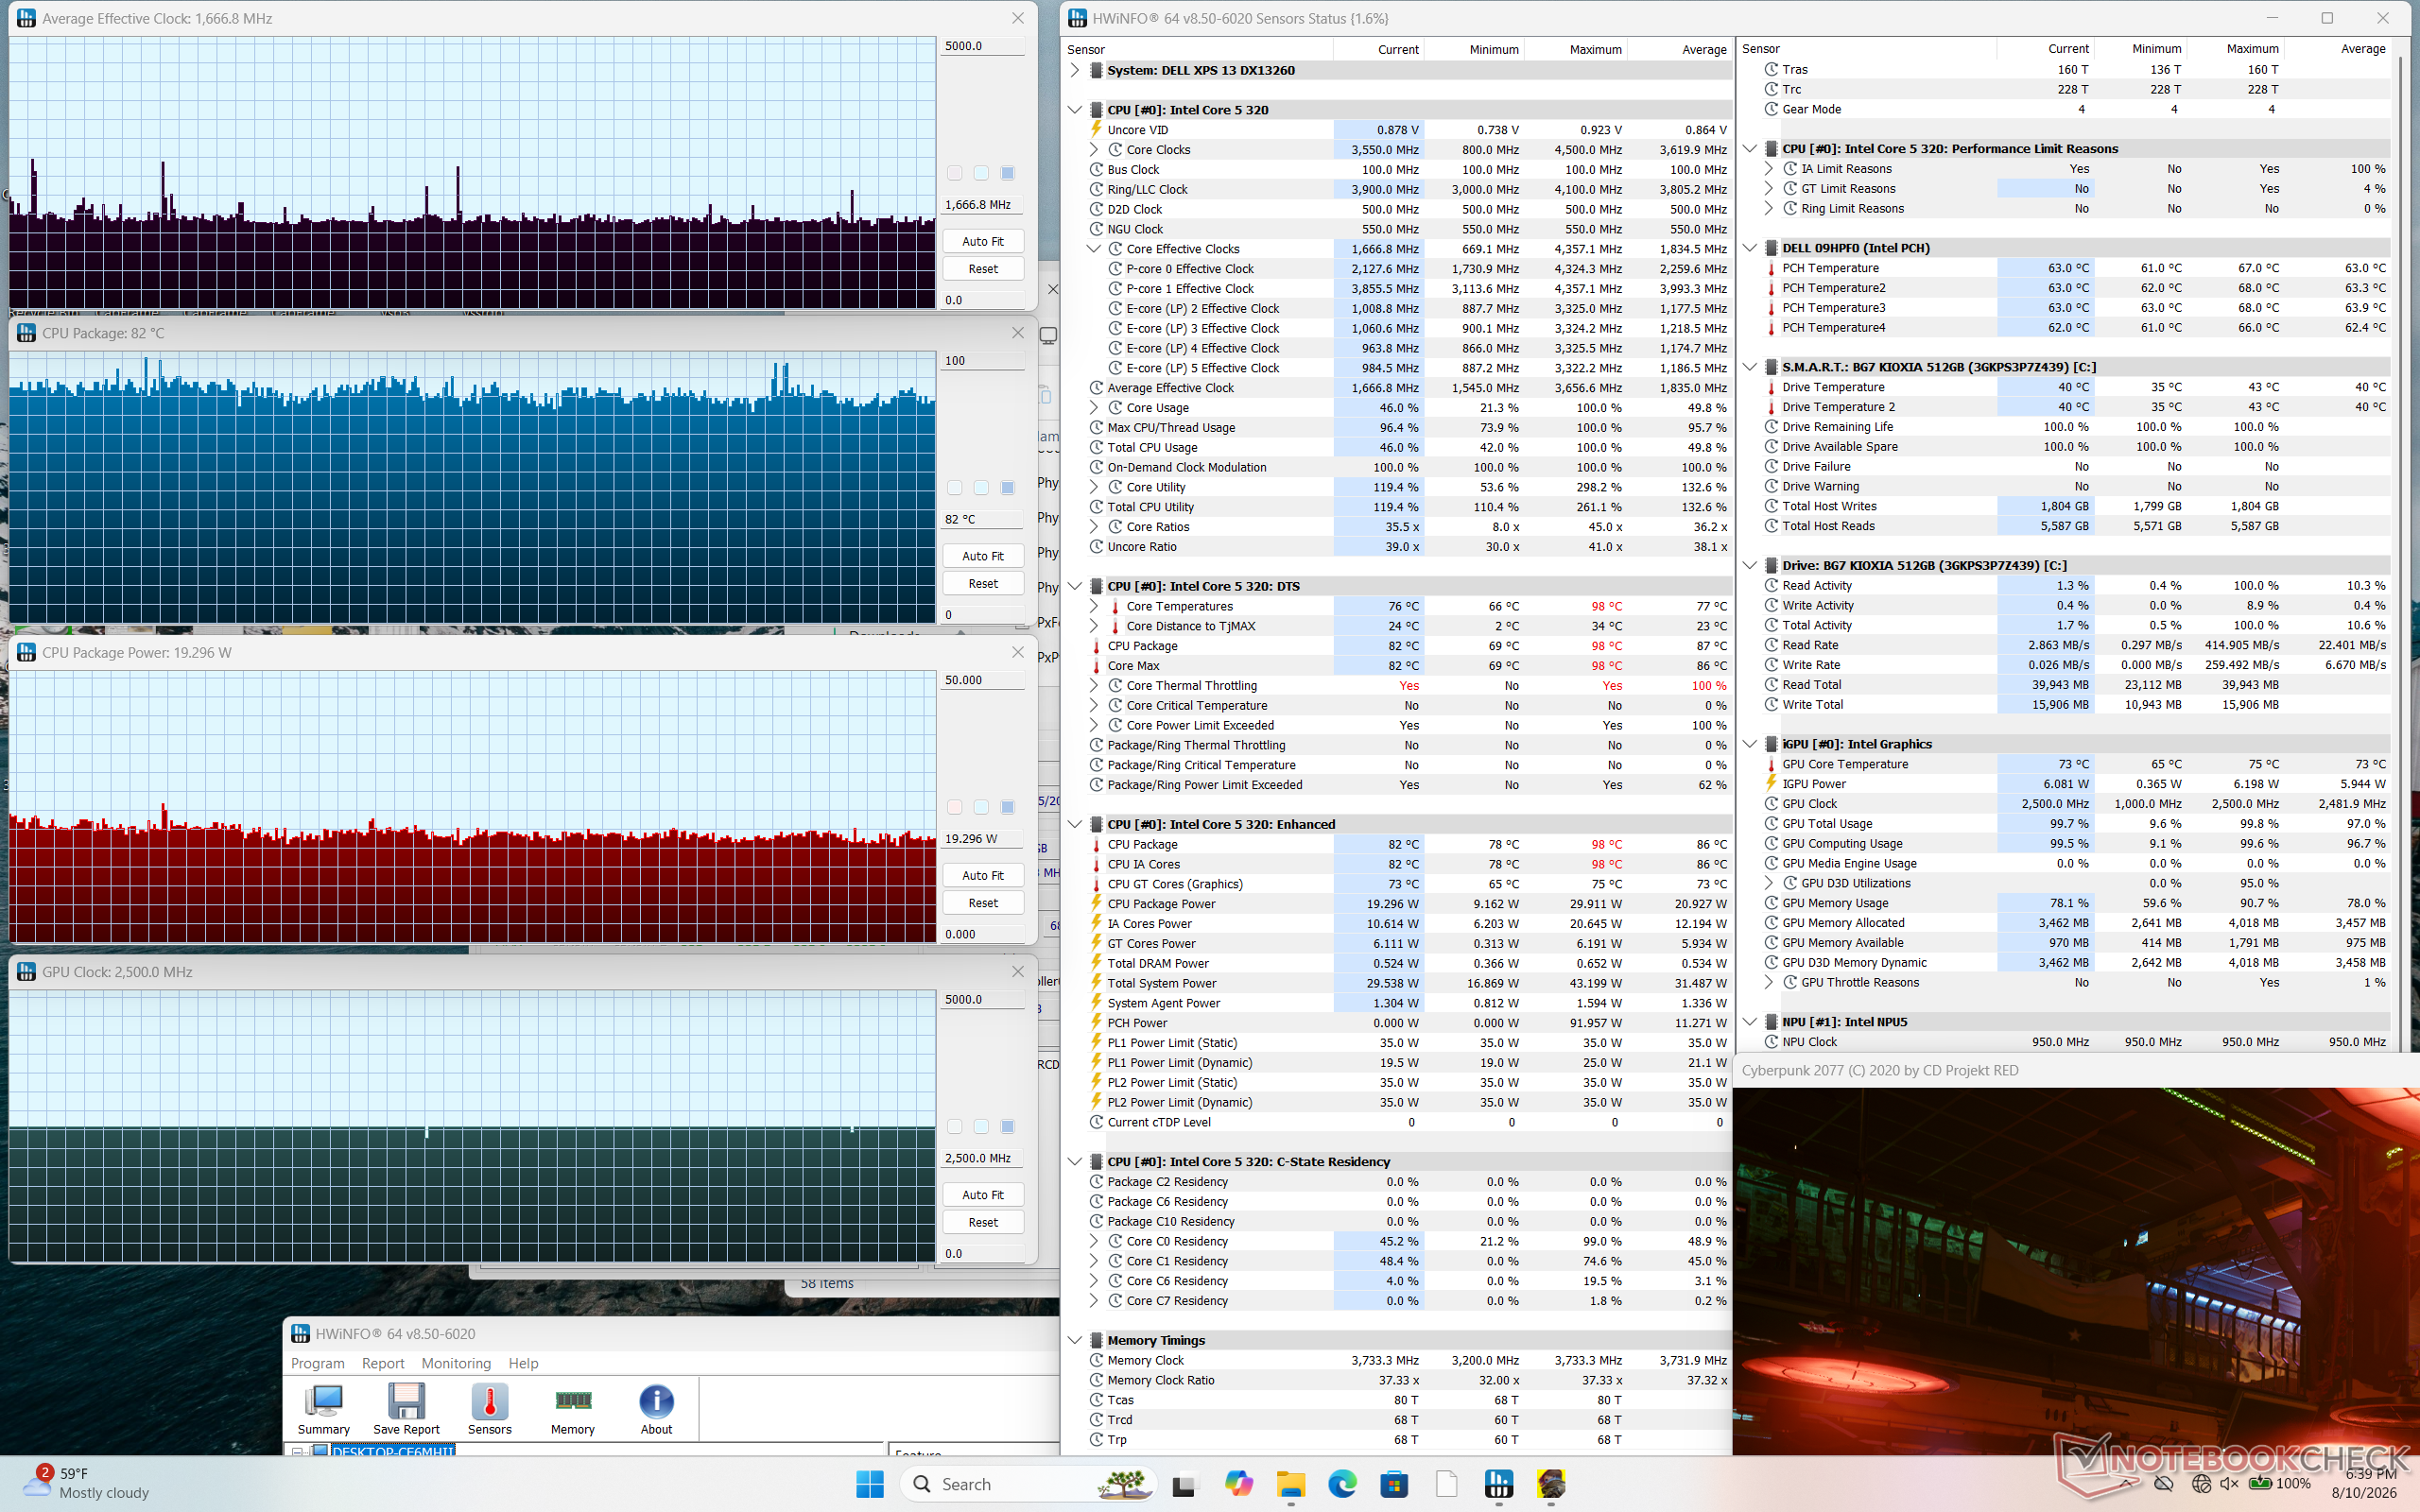
Sistema inativo
Sistema inativo
O estresse em Cyberpunk 2077
Teste de estresse do Prime95
Teste de estresse com Prime95 e FurMark
Frequência média da CPU (GHz) Frequência da GPU (MHz) Temperatura média da CPU (°C) Sistema em repouso
--
1000
34
Teste de carga
com Prime95
2,6
--
89
Teste
de carga
com Prime95 + FurMark
2,4
1.800 - 2.500
79
Teste
de carga
com Cyberpunk 2077
~1,7
2.500
82

Palestrantes

O ruído rosa apresenta um volume máximo alto com uma amplitude melhor do que o esperado para o preço
dB(A) 0102030405060708090Deep BassMiddle BassHigh BassLower RangeMidsHigher MidsLower HighsMid HighsUpper HighsSuper Highs2039.839.2252929.93124.222.74021.424.15025.131.76323.529.78024.749.61002354.912518.955.116015.458.320014.462.525013.666.231514.470.740012.177.650011.380.463011.276.580011.175100010.979.712501076.9160010.373.7200010.368.8250010.673.1315011.370.3400011.367.3500011.767.4630011.765.8800011.766.11000011.866.5125001265.21600011.157.7SPL23.585.9N0.568.4median 11.7median 68.4Delta1.84.726.325.821.422.12624.925.127.622.532.523.448.72655.818.860.922.167.2267019.372.317.674.217.774.319.575.31571.711.871.311.27410.574.21072.710.17210.67210.97511.374.811.671.71269.71269.612.371.112.669.61270.111.269.824.784.70.666.6median 12median 71.73.42.2hearing rangehide median Pink NoiseDell XPS 13 DX13260Apple MacBook Pro 16 2021 M1 Pro
Diagrama de frequência (as caixas de seleção podem ser marcadas e desmarcadas para comparar dispositivos)
Dell XPS 13 DX13260 análise de áudio

(+) | os alto-falantes podem tocar relativamente alto (###valor### dB)
Graves 100 - 315Hz
(±) | graves reduzidos - em média 7.9% menor que a mediana
(+) | o baixo é linear (6.2% delta para a frequência anterior)
Médios 400 - 2.000 Hz
(±) | médios mais altos - em média 7.6% maior que a mediana
(+) | médios são lineares (6.8% delta para frequência anterior)
Altos 2 - 16 kHz
(+) | agudos equilibrados - apenas 2.2% longe da mediana
(+) | os máximos são lineares (3.1% delta da frequência anterior)
Geral 100 - 16.000 Hz
(+) | o som geral é linear (11% diferença em relação à mediana)
Comparado com a mesma classe
» 10% de todos os dispositivos testados nesta classe foram melhores, 4% semelhantes, 86% piores
» O melhor teve um delta de 5%, a média foi 18%, o pior foi 53%
Comparado com todos os dispositivos testados
» 6% de todos os dispositivos testados foram melhores, 2% semelhantes, 92% piores
» O melhor teve um delta de 4%, a média foi 23%, o pior foi 134%

Apple MacBook Pro 16 2021 M1 Pro análise de áudio

(+) | os alto-falantes podem tocar relativamente alto (###valor### dB)
Graves 100 - 315Hz
(+) | bons graves - apenas 3.8% longe da mediana
(+) | o baixo é linear (5.2% delta para a frequência anterior)
Médios 400 - 2.000 Hz
(+) | médios equilibrados - apenas 1.3% longe da mediana
(+) | médios são lineares (2.1% delta para frequência anterior)
Altos 2 - 16 kHz
(+) | agudos equilibrados - apenas 1.9% longe da mediana
(+) | os máximos são lineares (2.7% delta da frequência anterior)
Geral 100 - 16.000 Hz
(+) | o som geral é linear (4.6% diferença em relação à mediana)
Comparado com a mesma classe
» 0% de todos os dispositivos testados nesta classe foram melhores, 0% semelhantes, 100% piores
» O melhor teve um delta de 5%, a média foi 17%, o pior foi 45%
Comparado com todos os dispositivos testados
» 0% de todos os dispositivos testados foram melhores, 0% semelhantes, 100% piores
» O melhor teve um delta de 4%, a média foi 23%, o pior foi 134%

Gestão de Energia

Consumo de energia

O consumo pode chegar a apenas 2 W e 5 W nas configurações de brilho mais baixo e mais alto, respectivamente, proporcionando um nível extremamente alto de eficiência energética. Consequentemente, a autonomia é muito longa, com mais de 18 horas de navegação na web em condições reais, apesar do tamanho médio da bateria.
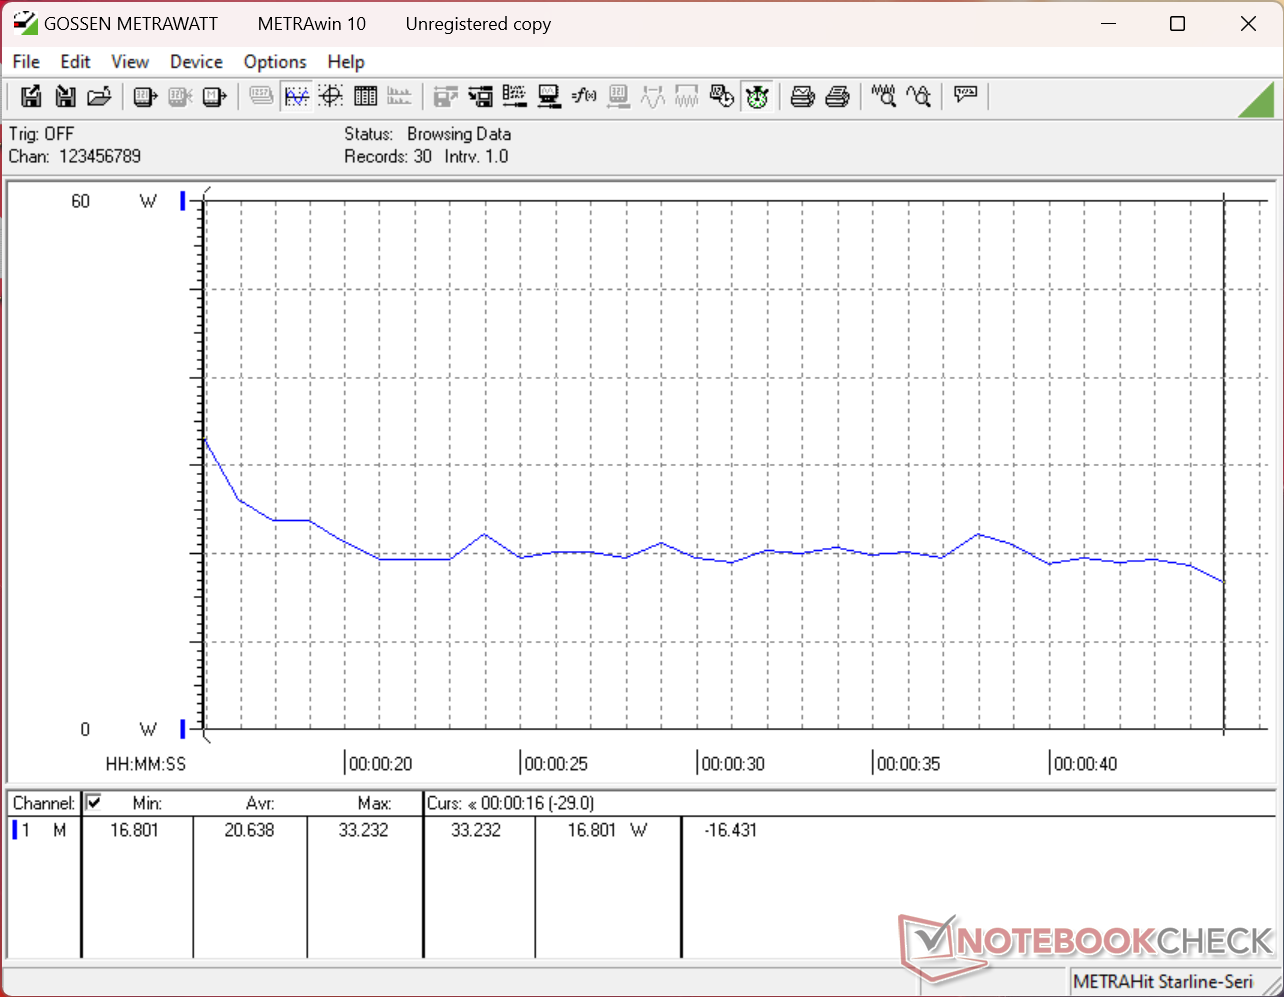
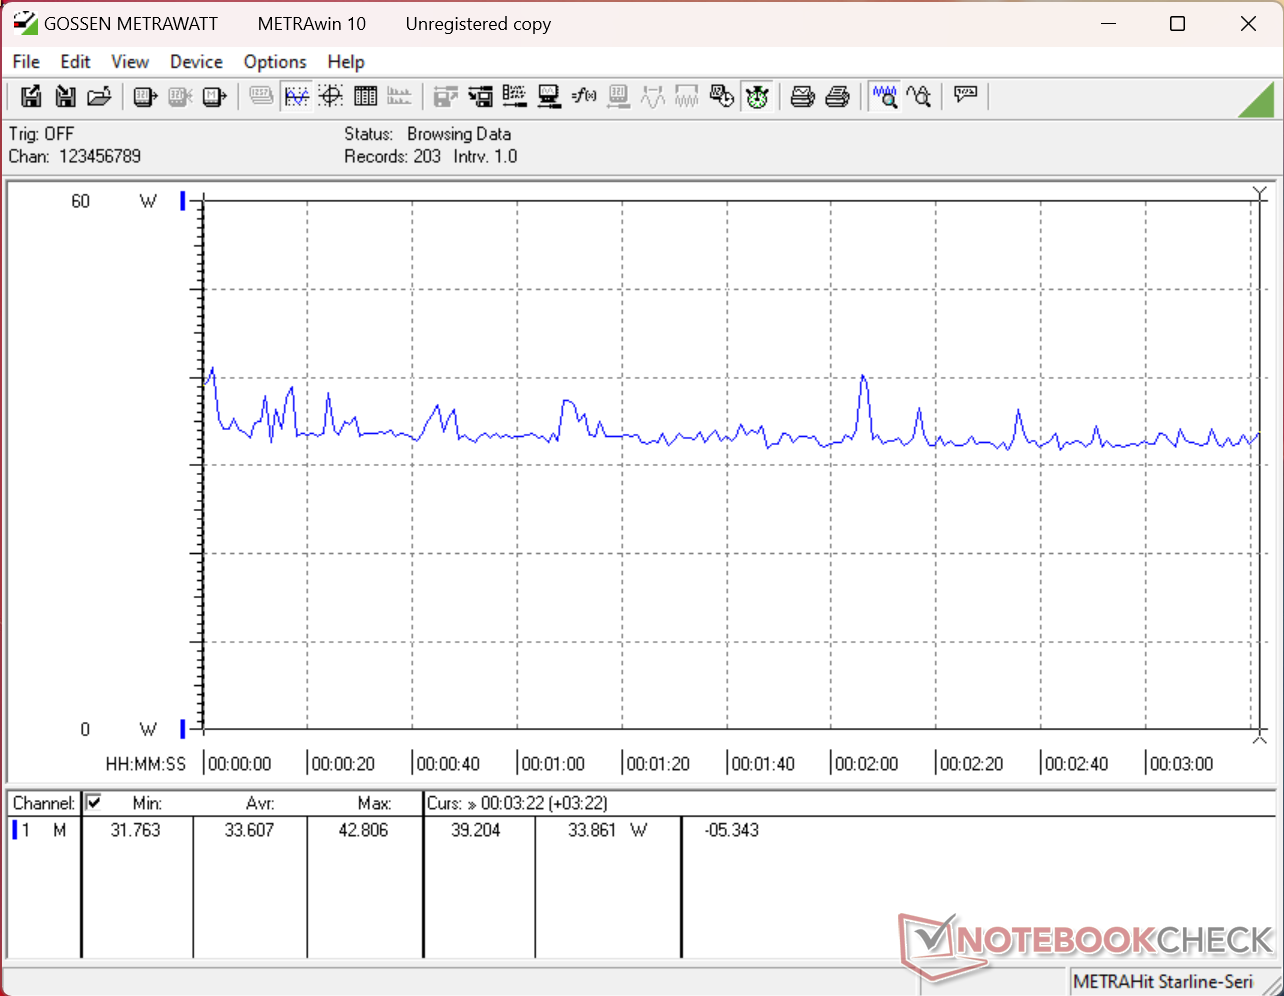
Consumo do 3DMark 11
Cyberpunk 2077 1080p – Consumo médio
O consumo atingiria um pico de 53 W ao iniciar o teste de estresse do Prime95, antes de cair para 36 W aproximadamente 30 segundos depois, sugerindo uma sustentabilidade limitada do Turbo Boost
O teste de estresse com o Prime95+FurMark foi iniciado aos 10 segundos
Consumo de energia
desligadodarklight 0.03 / 0.56 Watt
Ociosodarkmidlight 1.9 / 5.4 / 5.8 Watt
Carga midlight 20.6 / 52 Watt
 color bar
Key: min: dark, med: mid, max: light        Metrahit Energy
Dell XPS 13 DX13260
Core 5 320, Intel Graphics 2 Xe3 WCL, , IPS, 2560x1600, 13.4"
Dell XPS 14 Core Ultra X7 358H
Ultra X7 358H, Arc B390 Panther Lake iGPU, Samsung PM9C1b MZVL81T0HFLB-00BH1, OLED, 2880x1800, 14"
Dell XPS 13 9350
Core Ultra 7 256V, Arc 140V, Micron 2550 512GB, IPS, 1920x1200, 13.4"
Apple MacBook Neo 256 GB
A18 Pro, A18 GPU, Apple SSD AP0256Z, IPS, 2408x1506, 13"
HP OmniBook 7 Aero 13-bg1077nr
Ryzen AI 7 350, Radeon 860M, SK hynix PC801 HFS001TEJ9X101N, IPS, 1920x1200, 13.3"
Lenovo ThinkPad X1 Carbon Gen 14 21V70075GE
Ultra 5 325, Intel Graphics 4 Xe3 PTL, Samsung PM9C1b MZVL8512HFLU-00BLL, IPS, 1920x1200, 14"
Power Consumption
-59%
-10%
13%
-53%
-22%
Idle Minimum * (Watt)
1.9
3.1
-63%
1.3
32%
1.5
21%
3.2
-68%
1.6
16%
Idle Average * (Watt)
5.4
3.6
33%
2.5
54%
8.9
-65%
6.8
-26%
4.6
15%
Idle Maximum * (Watt)
5.8
10
-72%
4.1
29%
9
-55%
7
-21%
4.9
16%
Load Average * (Watt)
20.6
39.2
-90%
40.1
-95%
18.9
8%
50.3
-144%
39.7
-93%
Cyberpunk 2077 ultra * (Watt)
33.6
51.4
-53%
46.1
-37%
11.5
66%
52.8
-57%
45.2
-35%
Cyberpunk 2077 ultra external monitor * (Watt)
30.1
51.2
-70%
43.1
-43%
10.3
66%
41.6
-38%
46.1
-53%
Load Maximum * (Watt)
52
101.4
-95%
57.3
-10%
26.3
49%
59.9
-15%
64.2
-23%

* ... menor é melhor

Consumo de energia no modo Cyberpunk / Teste de estresse

05101520253035404550556065707580859095100Tooltip
Dell XPS 13 DX13260 Core 5 320, Intel Graphics 2 Xe3 WCL; 1280x720 Prime95 28.10 and Furmark 1.25: Ø41.5 (36.3-52.6) Watt
Dell XPS 14 Core Ultra X7 358H Ultra X7 358H, Arc B390 Panther Lake iGPU; 1280x720 Prime95 28.10 and Furmark 1.25: Ø57.8 (46.6-101.4) Watt
Dell XPS 13 DX13260 Core 5 320, Intel Graphics 2 Xe3 WCL; Idle 150cd/m2: Ø2.49 (2.36-3.57) Watt
Dell XPS 14 Core Ultra X7 358H Ultra X7 358H, Arc B390 Panther Lake iGPU; Idle 150cd/m2: Ø3.26 (2.28-5.65) Watt
Dell XPS 13 DX13260 Core 5 320, Intel Graphics 2 Xe3 WCL; Cyberpunk 2077 FHD ultra no FSR 150cd: Ø33.6 (31.8-41.2) Watt
Dell XPS 14 Core Ultra X7 358H Ultra X7 358H, Arc B390 Panther Lake iGPU; Cyberpunk 2077 FHD ultra no FSR 150cd: Ø51.4 (48.7-57.4) Watt

Consumo de energia do monitor externo

05101520253035404550556065707580859095Tooltip
Dell XPS 13 DX13260 Core 5 320, Intel Graphics 2 Xe3 WCL; Prime95 V2810 Stress (external Monitor): Ø38.6 (33.5-48.1) Watt
Dell XPS 14 Core Ultra X7 358H Ultra X7 358H, Arc B390 Panther Lake iGPU; Prime95 V2810 Stress (external Monitor): Ø56.8 (46.6-99.1) Watt
Dell XPS 13 DX13260 Core 5 320, Intel Graphics 2 Xe3 WCL; Cinebench R15 Multi (external Monitor): Ø40 (38.8-42.3) Watt
Dell XPS 14 Core Ultra X7 358H Ultra X7 358H, Arc B390 Panther Lake iGPU; Cinebench R15 Multi (external Monitor): Ø93.9 (89.5-96.9) Watt
Dell XPS 13 DX13260 Core 5 320, Intel Graphics 2 Xe3 WCL; Cinebench R23 Multi (external Monitor): Ø36.8 (34.1-46.4) Watt
Dell XPS 14 Core Ultra X7 358H Ultra X7 358H, Arc B390 Panther Lake iGPU; Cinebench R23 Multi (external Monitor): Ø71 (41.1-94.8) Watt
Dell XPS 13 DX13260 Core 5 320, Intel Graphics 2 Xe3 WCL; 1280x720 FurMark 1.19 GPU Stress Test (external Monitor): Ø16.8 (15.9-17.6) Watt
Dell XPS 14 Core Ultra X7 358H Ultra X7 358H, Arc B390 Panther Lake iGPU; 1280x720 FurMark 1.19 GPU Stress Test (external Monitor): Ø58.2 (42.2-74.1) Watt
Dell XPS 13 DX13260 Core 5 320, Intel Graphics 2 Xe3 WCL; Idle 1min (external Monitor): Ø2.08 (1.816-5.48) Watt
Dell XPS 14 Core Ultra X7 358H Ultra X7 358H, Arc B390 Panther Lake iGPU; Idle 1min (external Monitor): Ø3.43 (1.646-5.16) Watt
Dell XPS 13 DX13260 Core 5 320, Intel Graphics 2 Xe3 WCL; Cyberpunk 2077 FHD ultra no FSR (external Monitor): Ø30.1 (28.8-41.9) Watt
Dell XPS 14 Core Ultra X7 358H Ultra X7 358H, Arc B390 Panther Lake iGPU; Cyberpunk 2077 FHD ultra no FSR (external Monitor): Ø51.2 (30.8-56.9) Watt

Duração da bateria

Tempo de Execução da Bateria
WiFi Websurfing
18h 26min
Dell XPS 13 DX13260
Core 5 320, Intel Graphics 2 Xe3 WCL, 52 Wh
Dell XPS 14 Core Ultra X7 358H
Ultra X7 358H, Arc B390 Panther Lake iGPU, 70 Wh
Dell XPS 13 9350
Core Ultra 7 256V, Arc 140V, 55 Wh
Apple MacBook Neo 256 GB
A18 Pro, A18 GPU, 36.5 Wh
HP OmniBook 7 Aero 13-bg1077nr
Ryzen AI 7 350, Radeon 860M, 43 Wh
Lenovo ThinkPad X1 Carbon Gen 14 21V70075GE
Ultra 5 325, Intel Graphics 4 Xe3 PTL, 58 Wh
Duração da bateria
-9%
12%
-30%
-43%
26%
WiFi v1.3 (h)
18.4
16.8
-9%
20.6
12%
12.9
-30%
10.4
-43%
23.2
26%
Reader / Idle (h)
56.8
Load (h)
2.4
2.8
H.264 (h)
13.6

Avaliação do Notebookcheck

O XPS 13 com Intel Wildcat rompe com o padrão do que os usuários podem esperar de laptops Windows de baixo custo.

Dell XPS 13 DX13260 - 08/12/2026 v8
Allen Ngo

Acabamento
82 / 98 → 84%
Teclado
83%
Mouse
85%
Conectividade
57 / 74 → 77%
Peso
74 / 20-77 → 95%
Bateria
91%
Pantalha
90%
Desempenho do jogos
23 / 75 → 31%
Desempenho da aplicação
79 / 92 → 86%
AI Performance
81%
Temperatura
93%
Ruído
90%
Áudio
82 / 91 → 90%
Câmera
35 / 75 → 47%
Médio
67%
86%
Subnotebook - Médio equilibrado
CO2 Emissions
No Data
Materials
50%
Packaging
100%
Power Use
93.1%
Repairability
50%
Software Updates
22.3%
Recycle Logo Total Sustainability Score: 52.6%

Comparativo com possíveis concorrentes

Imagem
Modelo / Análises
Preço
Peso
Altura
Tela
1.
85.7%
Dell XPS 13 DX13260
Dell XPS 13 DX13260
Intel Core 5 320 ⎘
Intel Graphics 2 Xe3 Wildcat Lake iGPU ⎘
8 GB Memória
Amazon: Preço de tabela: 700 USD1.1 kg12.7 mm13.40"
2560x1600
225 PPI
IPS
2.
87.4%
Dell XPS 14 Core Ultra X7 358H
Intel Core Ultra X7 358H ⎘
Intel Arc B390 12 Xe3 Panther Lake iGPU ⎘
32 GB Memória, 1000 GB SSD
Amazon:
1. $1,399.99
Dell XPS 14 Premium Laptop D...
2. $2,049.00
Dell XPS 14 9440 14.5" Noteb...
3. $1,955.00
Dell Pro 14 Plus Business La...
Preço de tabela: 2200 USD
1.4 kg14.62 mm14.00"
2880x1800
243 PPI
OLED
3.
85.3%
Dell XPS 13 9350
Dell XPS 13 9350
Intel Core Ultra 7 256V ⎘
Intel Arc Graphics 140V ⎘
16 GB Memória, 512 GB SSD
Amazon: Preço de tabela: 1400 USD1.2 kg15.3 mm13.40"
1920x1200
169 PPI
IPS
4.
86%
Apple MacBook Neo 256 GB
Apple A18 Pro ⎘
Apple A18 GPU ⎘
8 GB Memória, 256 GB SSD
Amazon: Preço de tabela: 699€1.2 kg12.7 mm13.00"
2408x1506
218 PPI
IPS
5.
86.9%
HP OmniBook 7 Aero 13-bg1077nr
AMD Ryzen AI 7 350 ⎘
AMD Radeon 860M ⎘
32 GB Memória, 1024 GB SSD
Amazon: Preço de tabela: 1250 USD1 kg17.6 mm13.30"
1920x1200
170 PPI
IPS
6.
89.9%
Lenovo ThinkPad X1 Carbon Gen 14 21V70075GE
Intel Core Ultra 5 325 ⎘
Intel Graphics 4 Xe3 Panther Lake iGPU ⎘
32 GB Memória, 512 GB SSD
Amazon:
1. $1,899.00
Lenovo ThinkPad X1 Carbon Ge...
2. $2,199.99
Lenovo ThinkPad X1 Carbon Bu...
3. $1,929.74
Lenovo ThinkPad X1 Carbon Ge...
Preço de tabela: 2469€
1.1 kg16.8 mm14.00"
1920x1200
162 PPI
IPS

Transparência

A seleção dos dispositivos a serem analisados ​​é feita pela nossa equipe editorial. A amostra de teste foi fornecida ao autor como empréstimo pelo fabricante ou varejista para fins desta revisão. O credor não teve influência nesta revisão, nem o fabricante recebeu uma cópia desta revisão antes da publicação. Não houve obrigação de publicar esta revisão. Como empresa de mídia independente, a Notebookcheck não está sujeita à autoridade de fabricantes, varejistas ou editores.

É assim que o Notebookcheck está testando

Todos os anos, o Notebookcheck analisa de forma independente centenas de laptops e smartphones usando procedimentos padronizados para garantir que todos os resultados sejam comparáveis. Desenvolvemos continuamente nossos métodos de teste há cerca de 20 anos e definimos padrões da indústria no processo. Em nossos laboratórios de teste, equipamentos de medição de alta qualidade são utilizados por técnicos e editores experientes. Esses testes envolvem um processo de validação em vários estágios. Nosso complexo sistema de classificação é baseado em centenas de medições e benchmarks bem fundamentados, o que mantém a objetividade.
Google LogoAdd as a preferred source on Google
Mail Logo
> Análises e revisões de portáteis e celulares > Análises > Análises > Análise do Dell XPS 13 Wildcat Lake: redefinindo a categoria de computadores Windows de baixo custo
Allen Ngo, 2026-08-13 (Update: 2026-08-13)