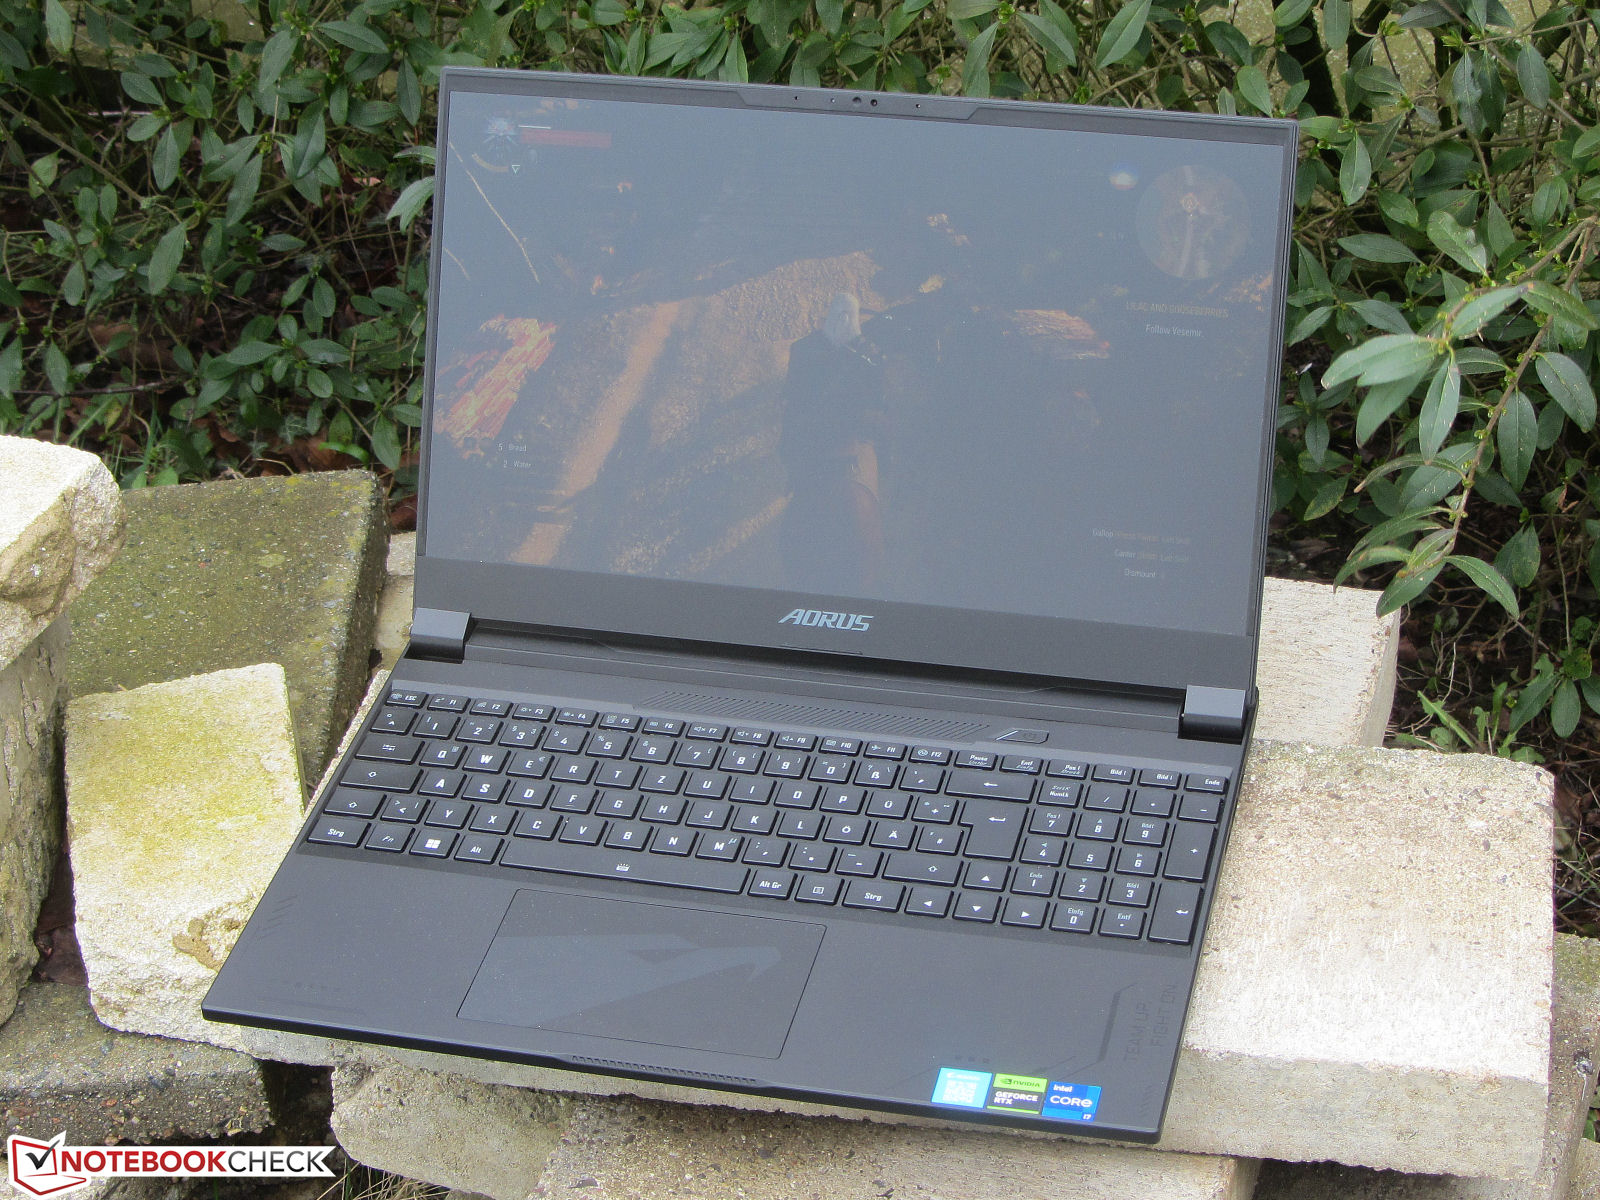
Revisão Aorus 15X ASF: Laptop para jogos com potência e resistência RTX 4070
O Aorus 15X - um laptop para jogos de médio alcance - é alimentado por um Raptor Lake Core i7 e uma GPU RTX 4070. O pacote total de varejo por cerca de US$ 2.099. Seus concorrentes incluem dispositivos tais como o Lâmina Razer 15 OLED (Início de 2022)oAsus ROG Strix G17 G713PIoMSI Katana 17 B13VFKe oAcer Predator Helios 300.
Possíveis concorrentes em comparação
Avaliação | Data | Modelo | Peso | Altura | Size | Resolução | Preço |
|---|---|---|---|---|---|---|---|
| 86.2 % v7 (old) | 04/2023 | Aorus 15X ASF i7-13700HX, GeForce RTX 4070 Laptop GPU | 2.3 kg | 19.7 mm | 15.60" | 2560x1440 | |
| 89.9 % v7 (old) | 03/2023 | Razer Blade 15 OLED (Early 2022) i9-12900H, GeForce RTX 3070 Ti Laptop GPU | 2 kg | 16.99 mm | 15.60" | 2560x1440 | |
| 82.1 % v7 (old) | 02/2023 | MSI Katana 17 B13VFK i7-13620H, GeForce RTX 4060 Laptop GPU | 2.8 kg | 25.2 mm | 17.30" | 1920x1080 | |
| 88.4 % v7 (old) | 04/2023 | Asus ROG Strix G17 G713PI R9 7945HX, GeForce RTX 4070 Laptop GPU | 2.8 kg | 30.7 mm | 17.30" | 2560x1440 | |
| 86.5 % v7 (old) | 11/2022 | Acer Predator Helios 300 (i7-12700H, RTX 3070 Ti) i7-12700H, GeForce RTX 3070 Ti Laptop GPU | 3 kg | 27.65 mm | 17.30" | 2560x1440 |
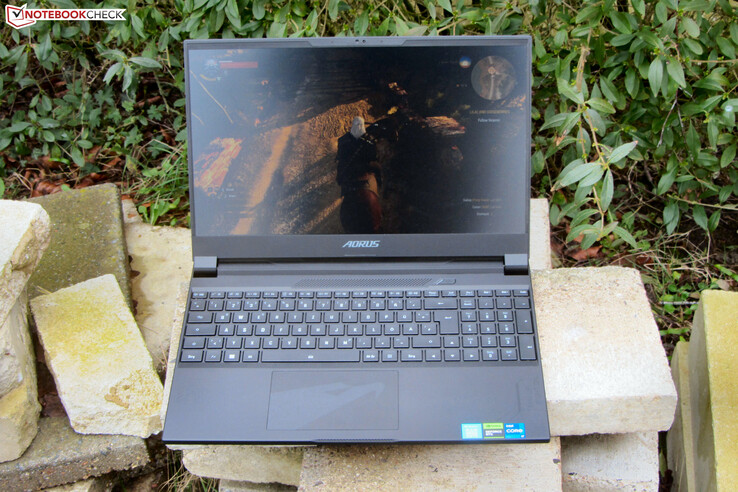
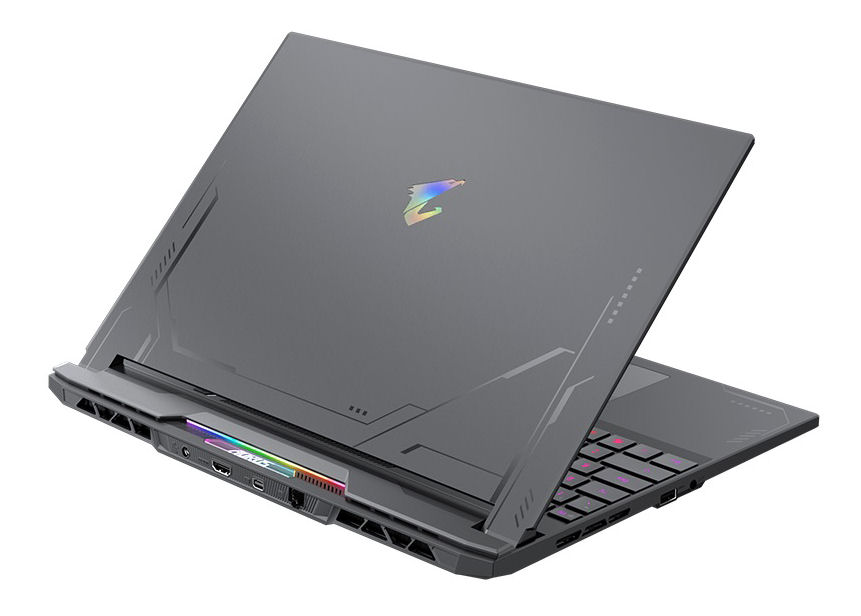
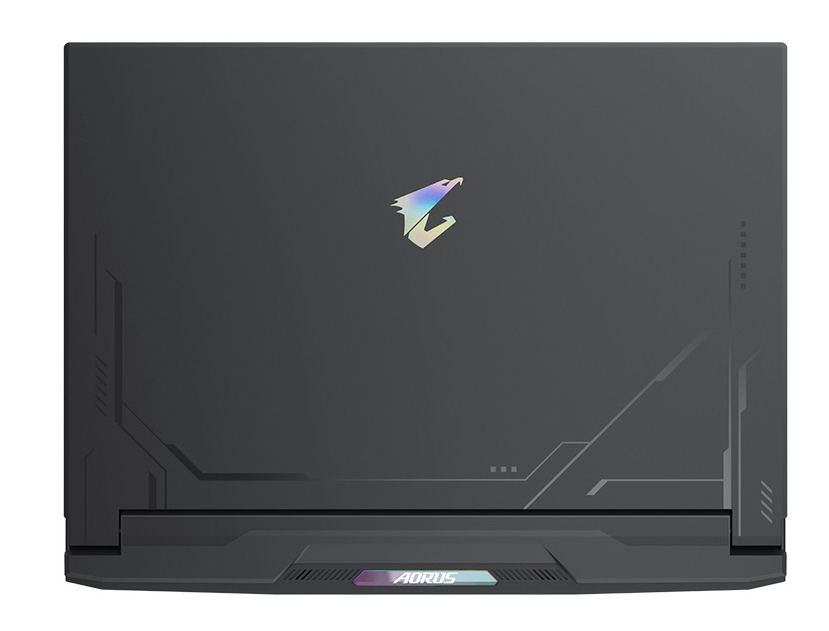
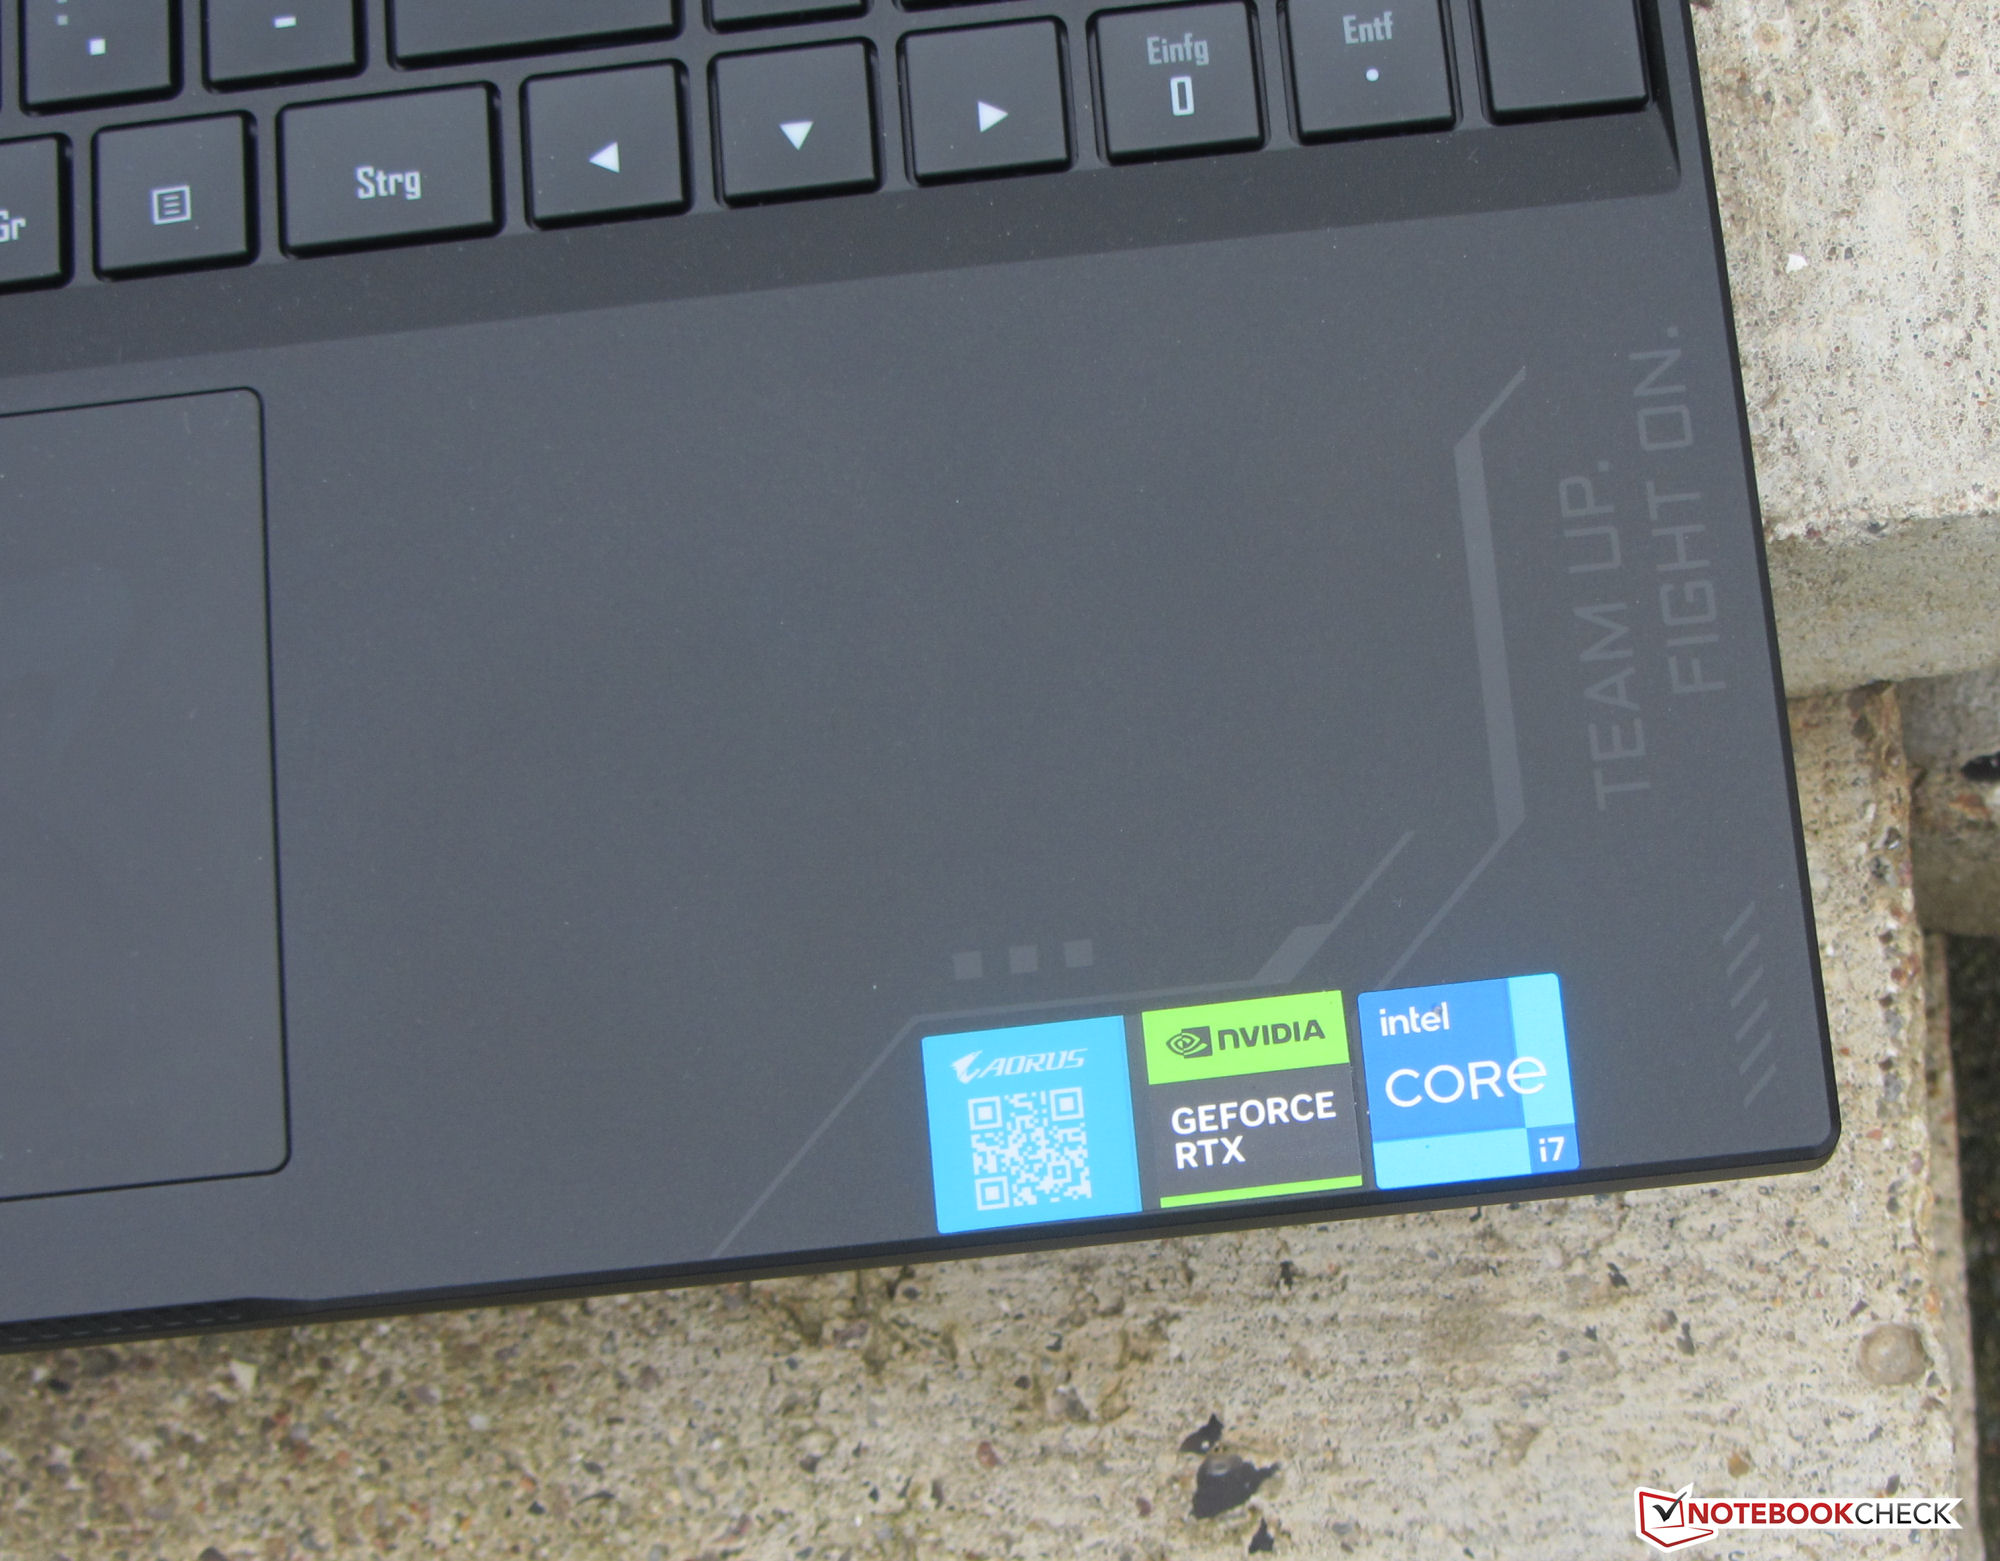
Case - Gigabyte utiliza uma mistura de materiais
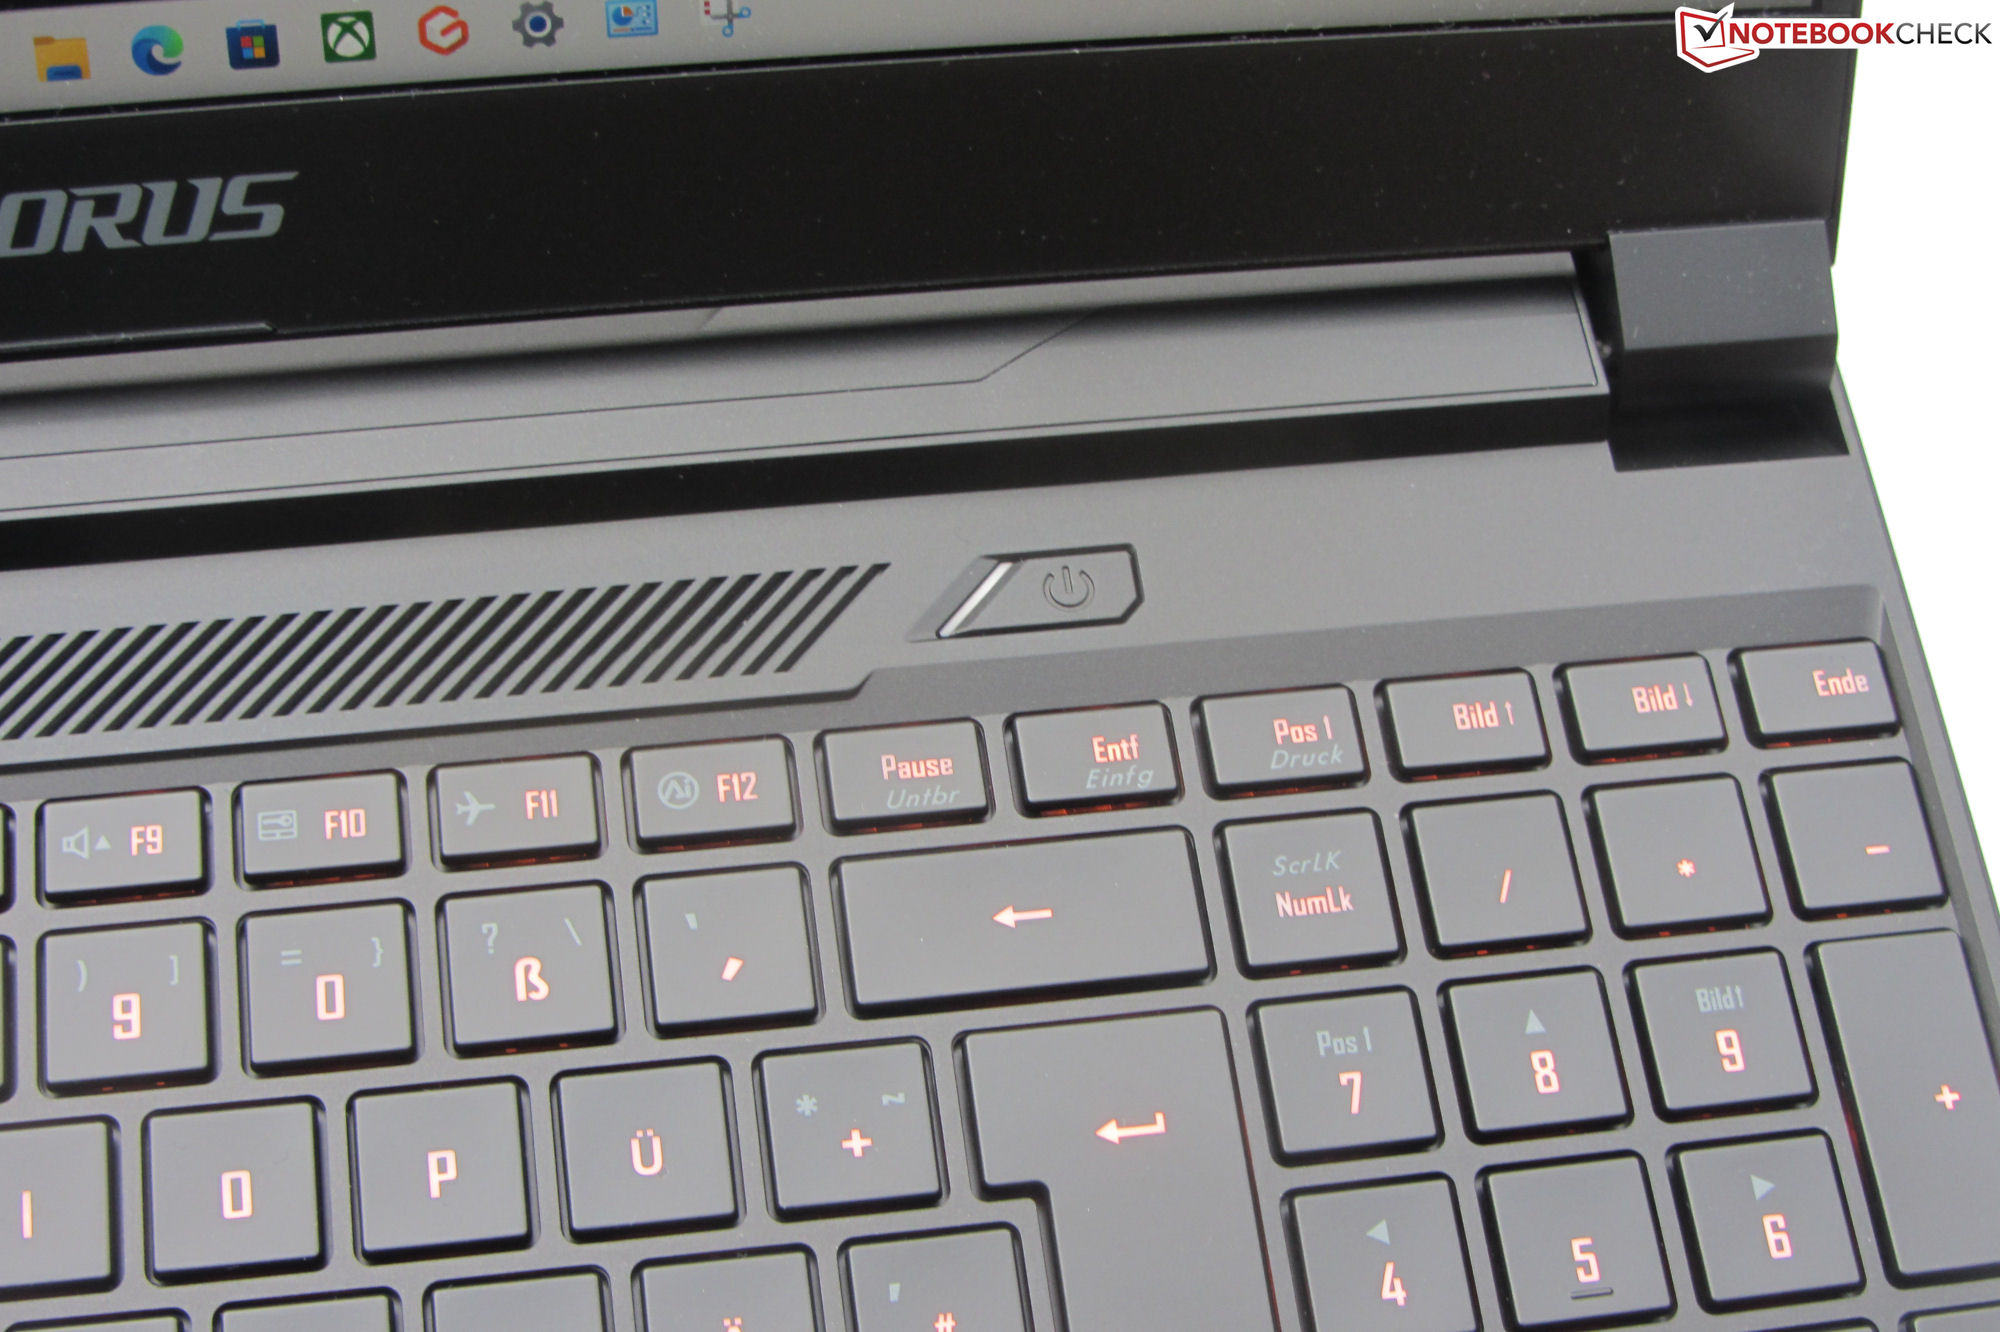
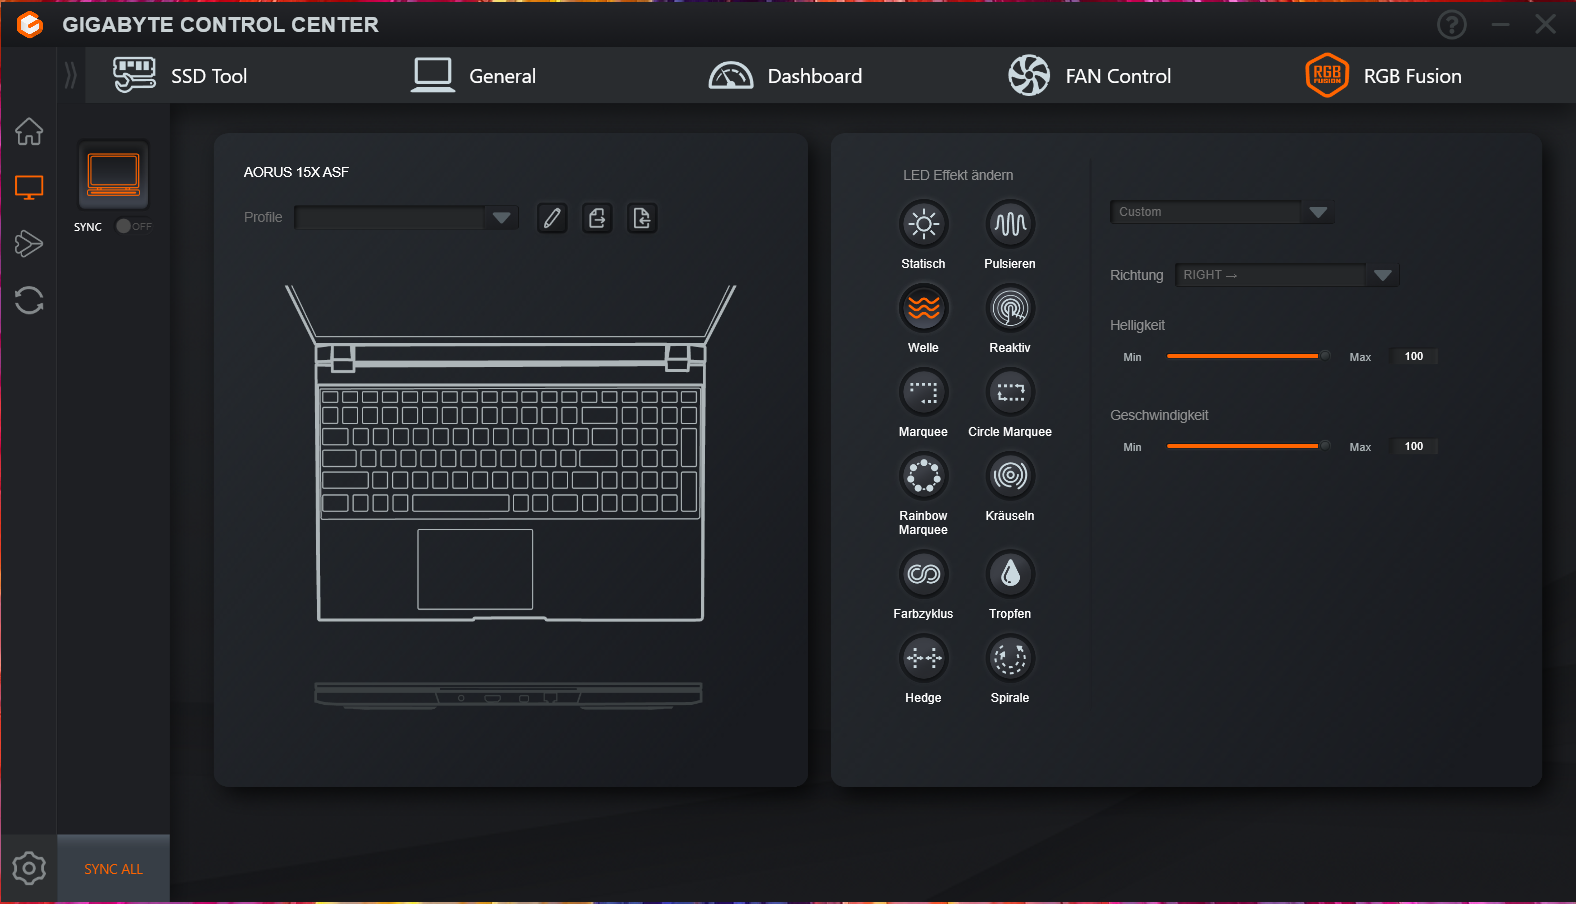
Somente a parte de trás da tampa é feita de metal preto fosco - a unidade base é feita de plástico. A Gigabyte não acrescentou nenhum ornamento visual extravagante além do padrão que está gravado na superfície lisa da caixa. Uma faixa LED (RGB, personalizável) na parte de trás da unidade base e as teclas iluminadas (RGB) adicionam um pop de cor ao dispositivo.
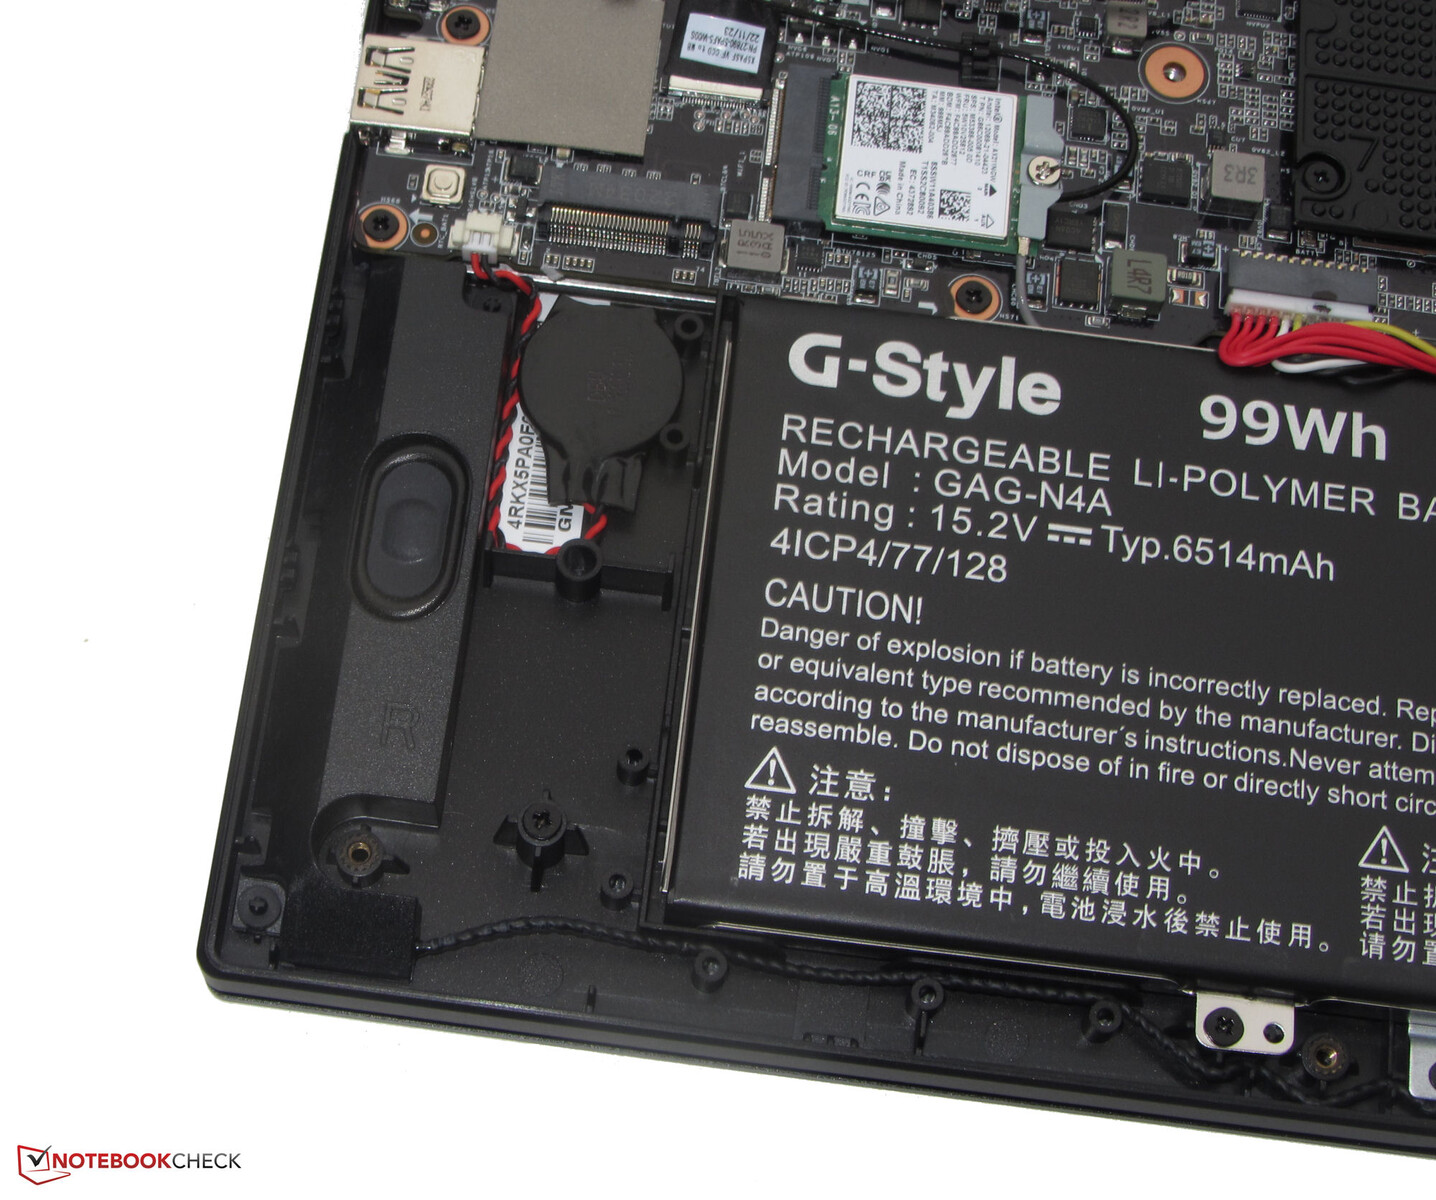
A caixa é montada sem falhas - não há excessos de material e as dimensões do espaço são todas corretas. A unidade de base só pode ser ligeiramente torcida, a tampa mais ainda. Mas tudo isso permanece dentro de uma faixa normal. A bateria (aparafusada - não colada) e o restante das entranhas do laptop podem ser acessados quando o invólucro inferior é removido. As dobradiças mantêm a tampa firmemente no lugar e o ângulo máximo de abertura é de cerca de 130 graus. É possível abrir a tampa com uma mão.
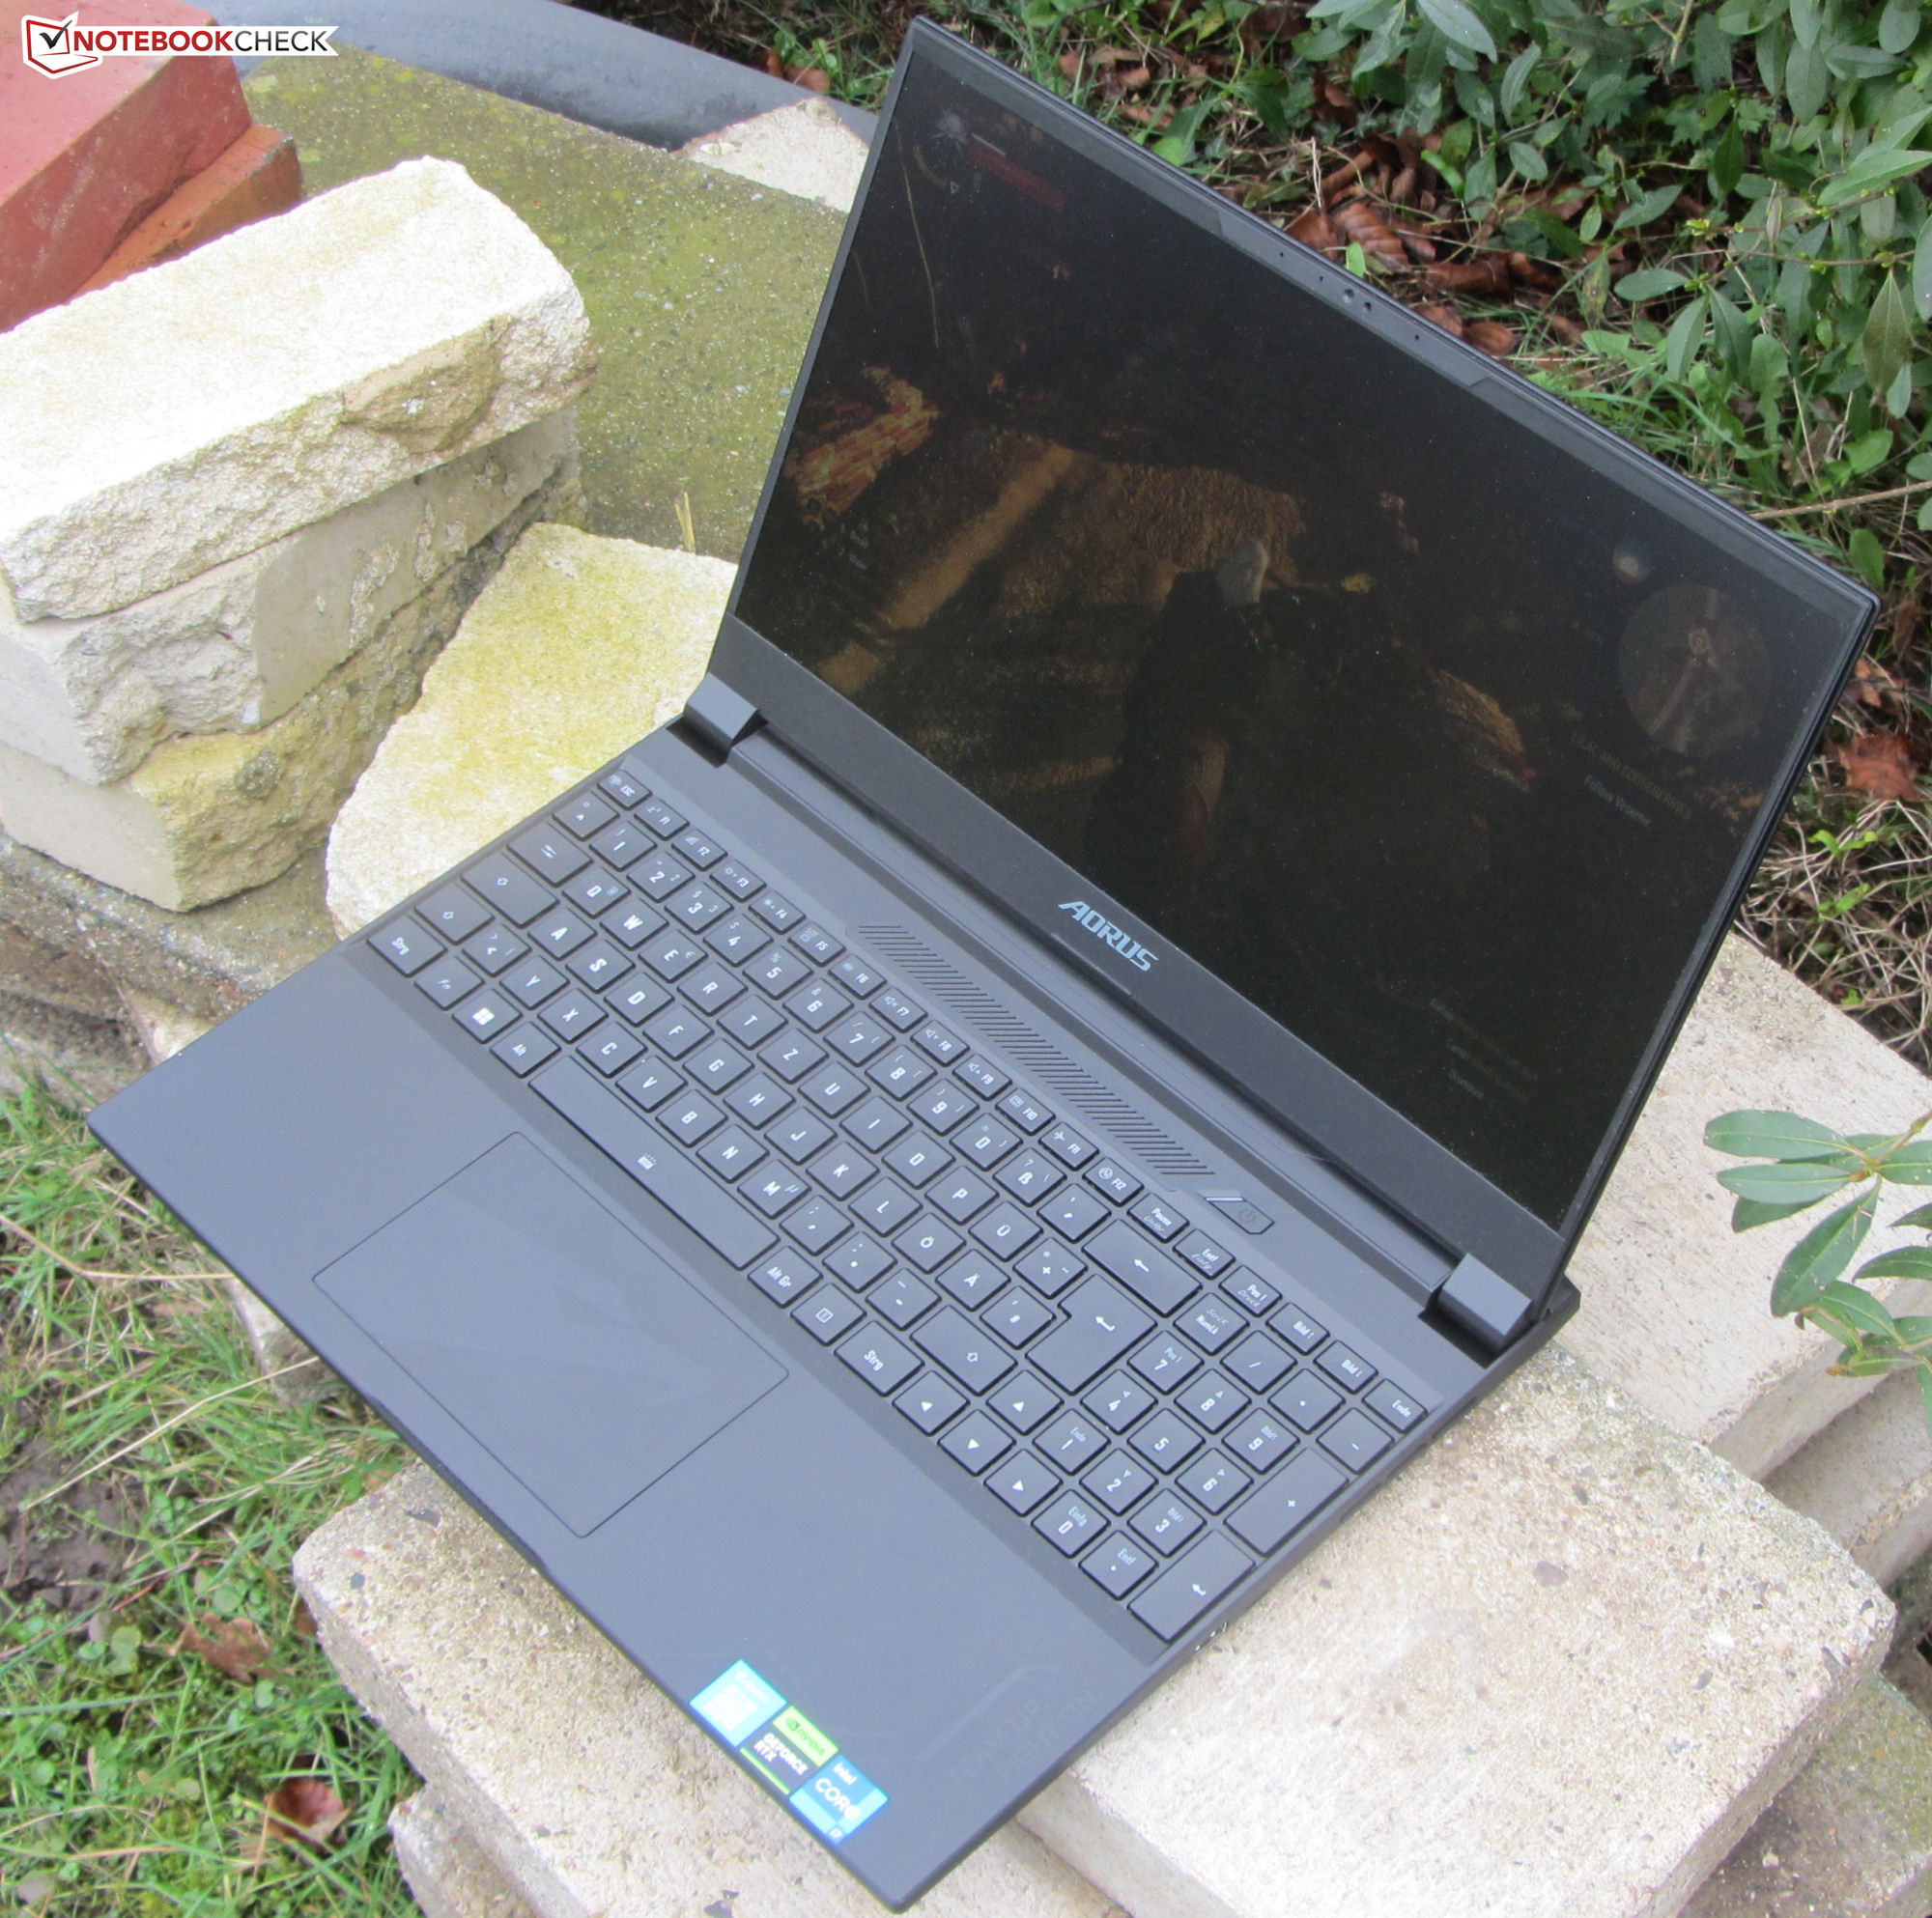
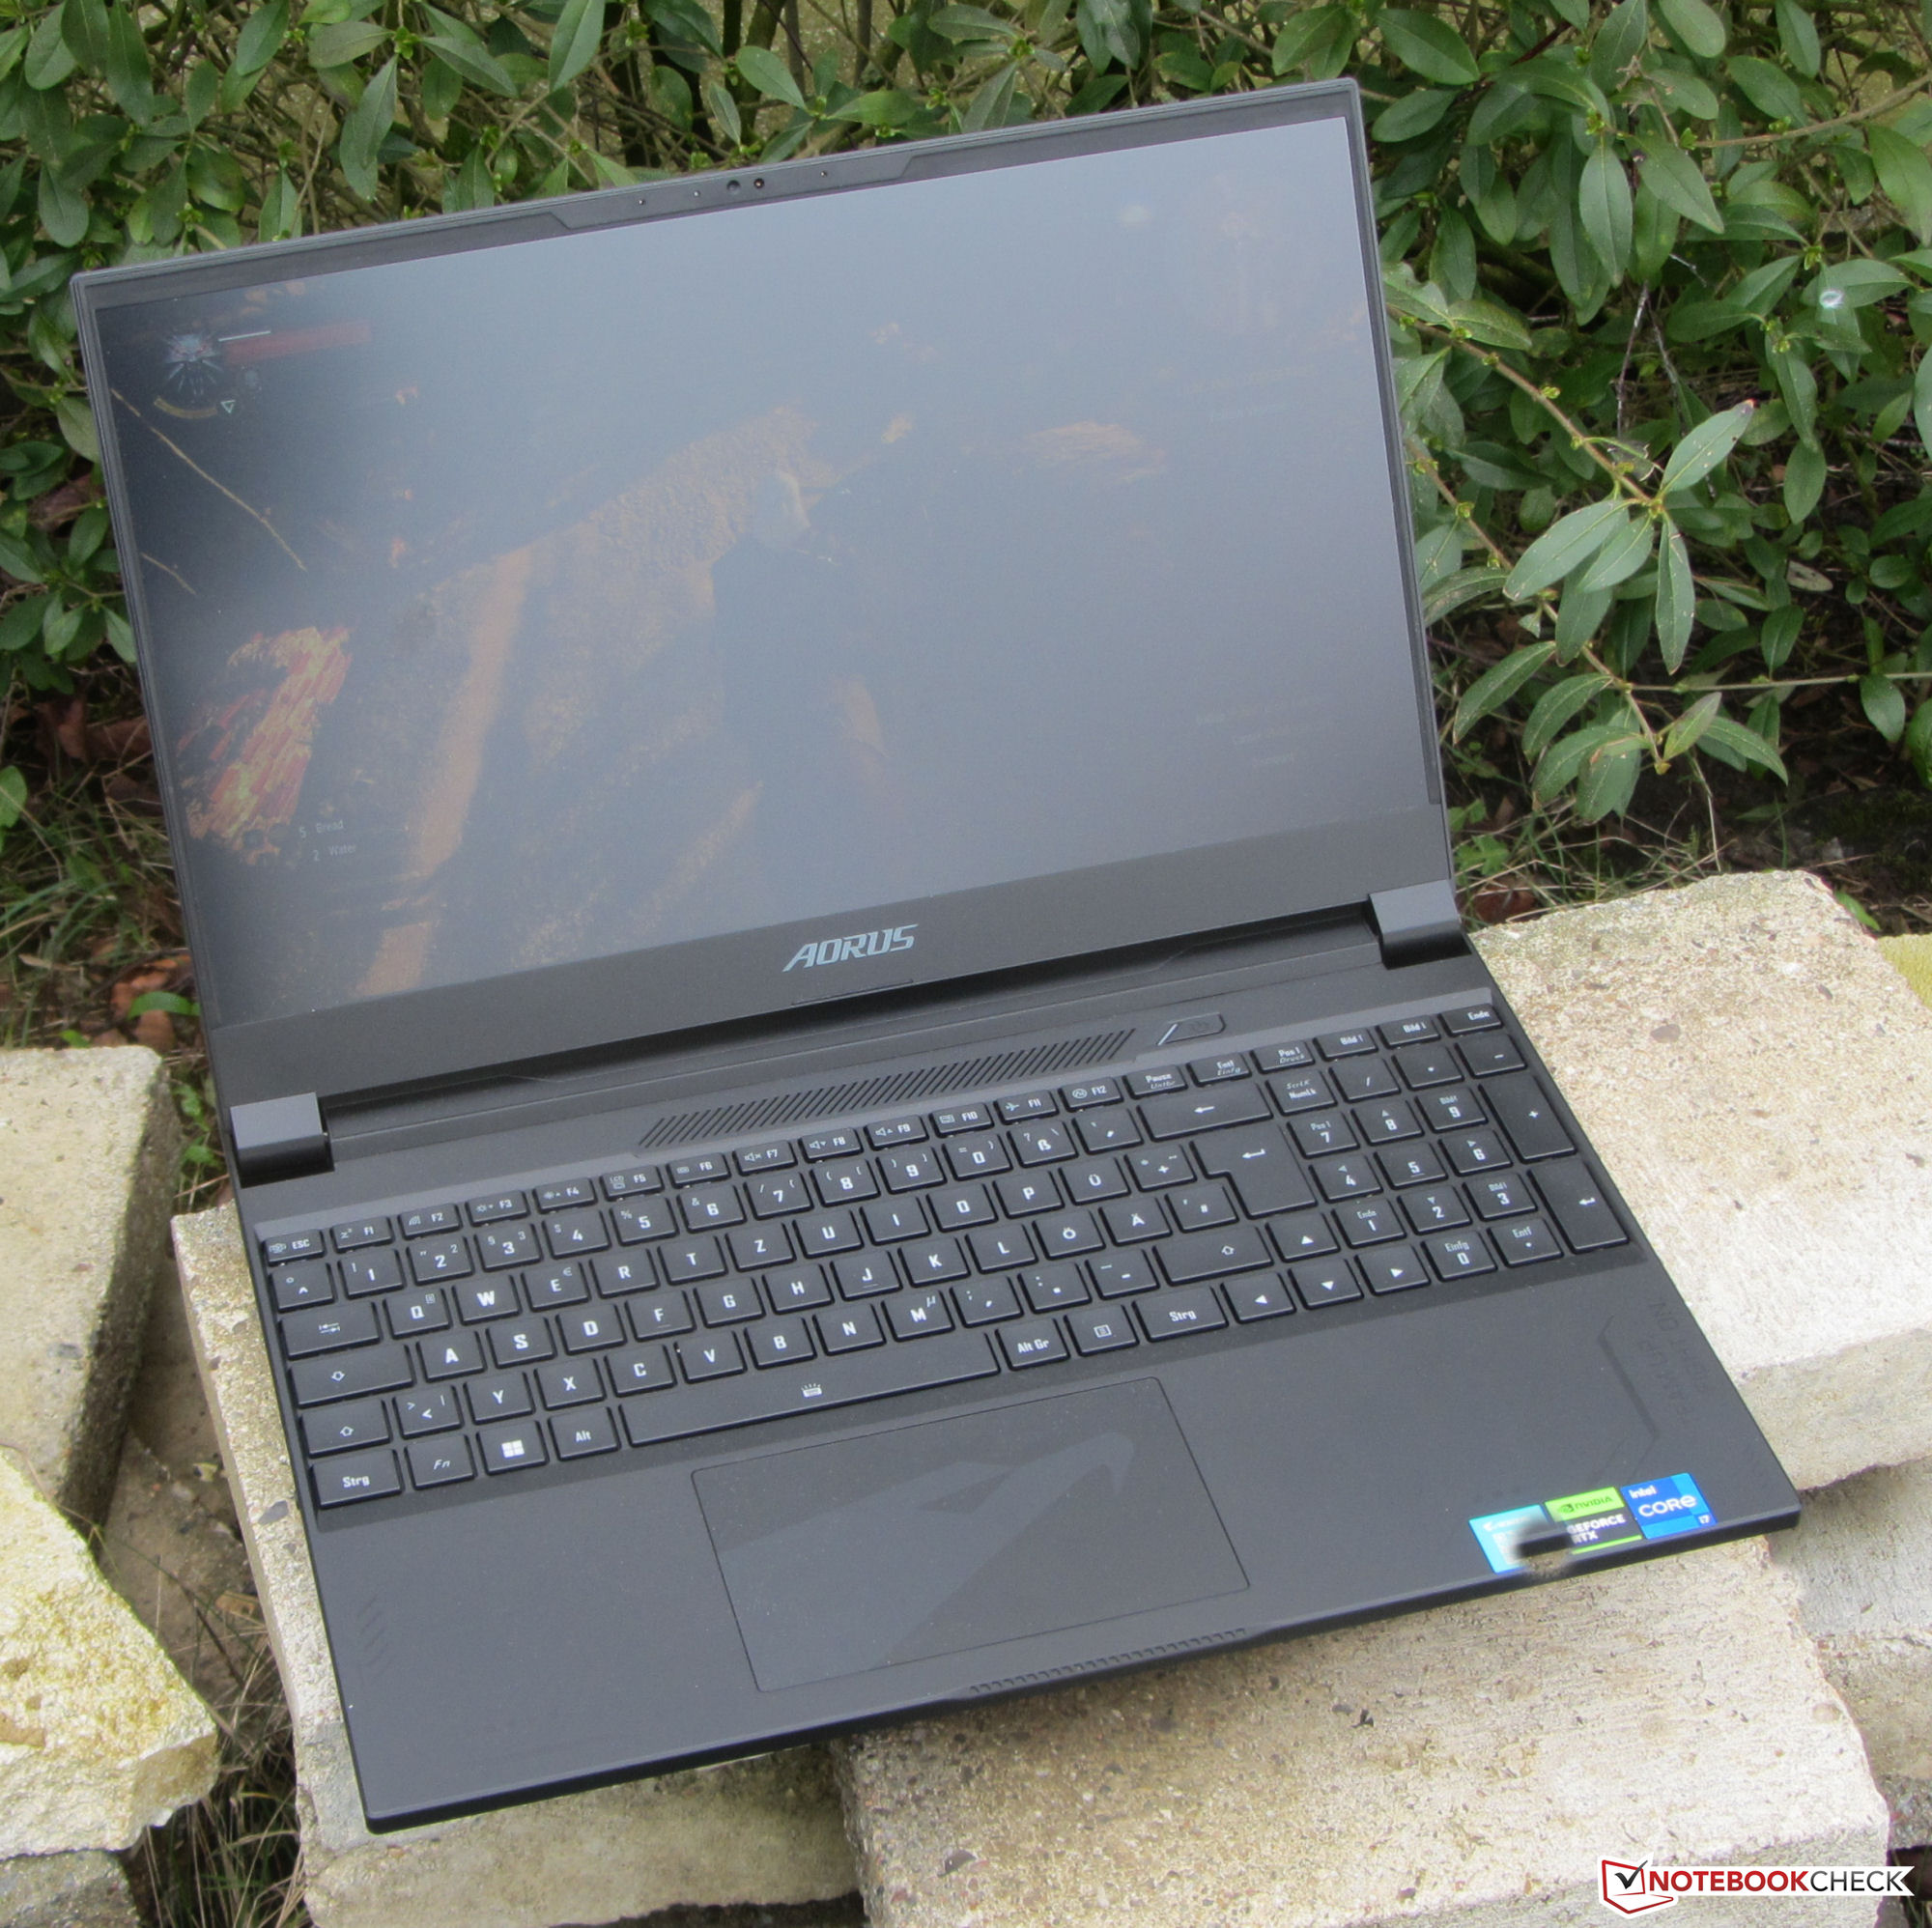
O 15X pode ser colocado praticamente na faixa média de todos os laptops de 15,6 polegadas: Não é compacto, nem é particularmente maciço. A mesma coisa pode ser dita por seu peso.
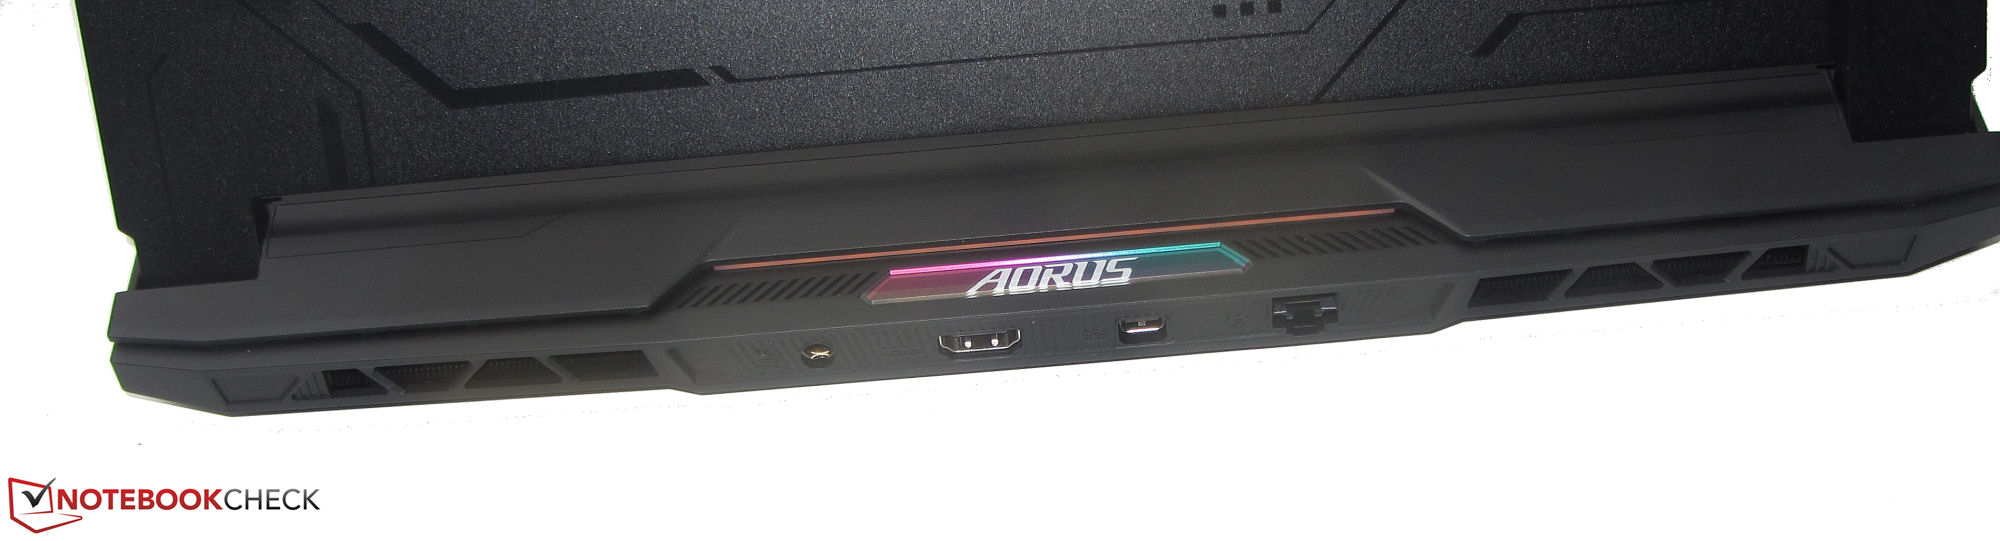
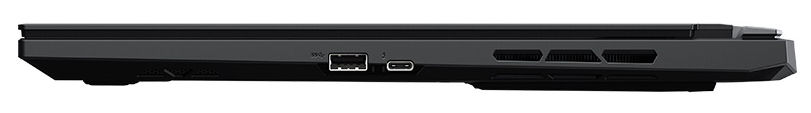
Conectividade - o computador Aorus apresenta o Thunderbolt 4
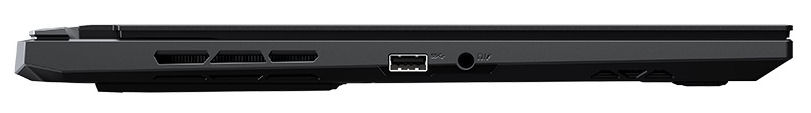
O 15X tem duas portas USB-A (USB 3.2 Gen 2) e uma porta USB-C (Thunderbolt 4). Esta última suporta Power Delivery e pode emitir um sinal DisplayPort. Isto, junto com a porta HDMI (2.1) e a Mini DisplayPort dedicada (1.4), faz com que haja três saídas de vídeo. O computador não dispõe de um leitor de cartões SD.
As duas saídas de vídeo dedicadas, assim como a porta ethernet, podem ser encontradas na parte de trás do dispositivo. Isto significa que os cabos não se atrapalharão quando você estiver usando o laptop.

Comunicação
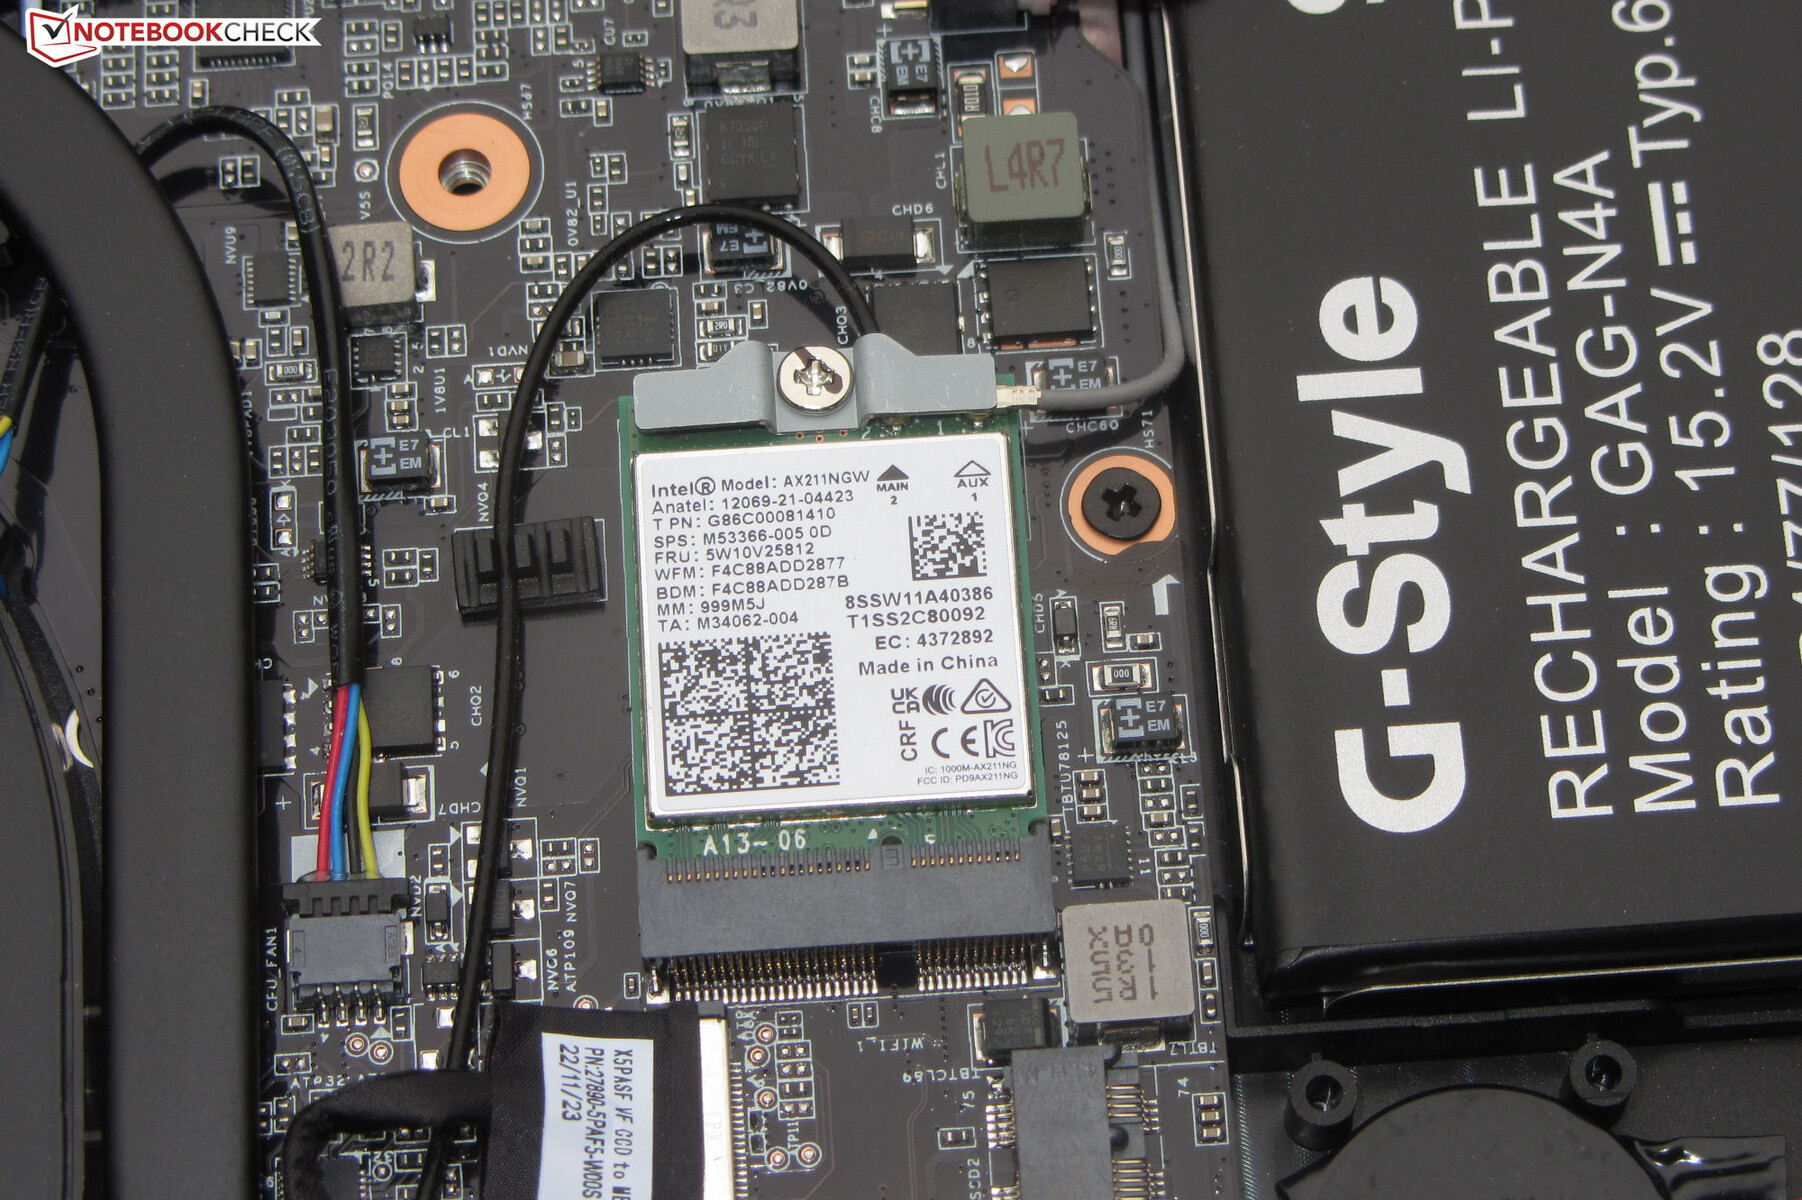
Sob condições ideais (sem dispositivos WLAN adicionais nas proximidades, pequena distância entre o laptop e o PC servidor), as taxas de transferência WLAN do laptop são boas, no entanto, elas permanecem ligeiramente abaixo da média considerando o que é possível com este chip Wi-Fi (Intel AX211; Wi-Fi 6E). A conexão de rede cabeada é possível através de um chip Gigabit Ethernet (RTL8125; 2,5 Gbit) pela Realtek.
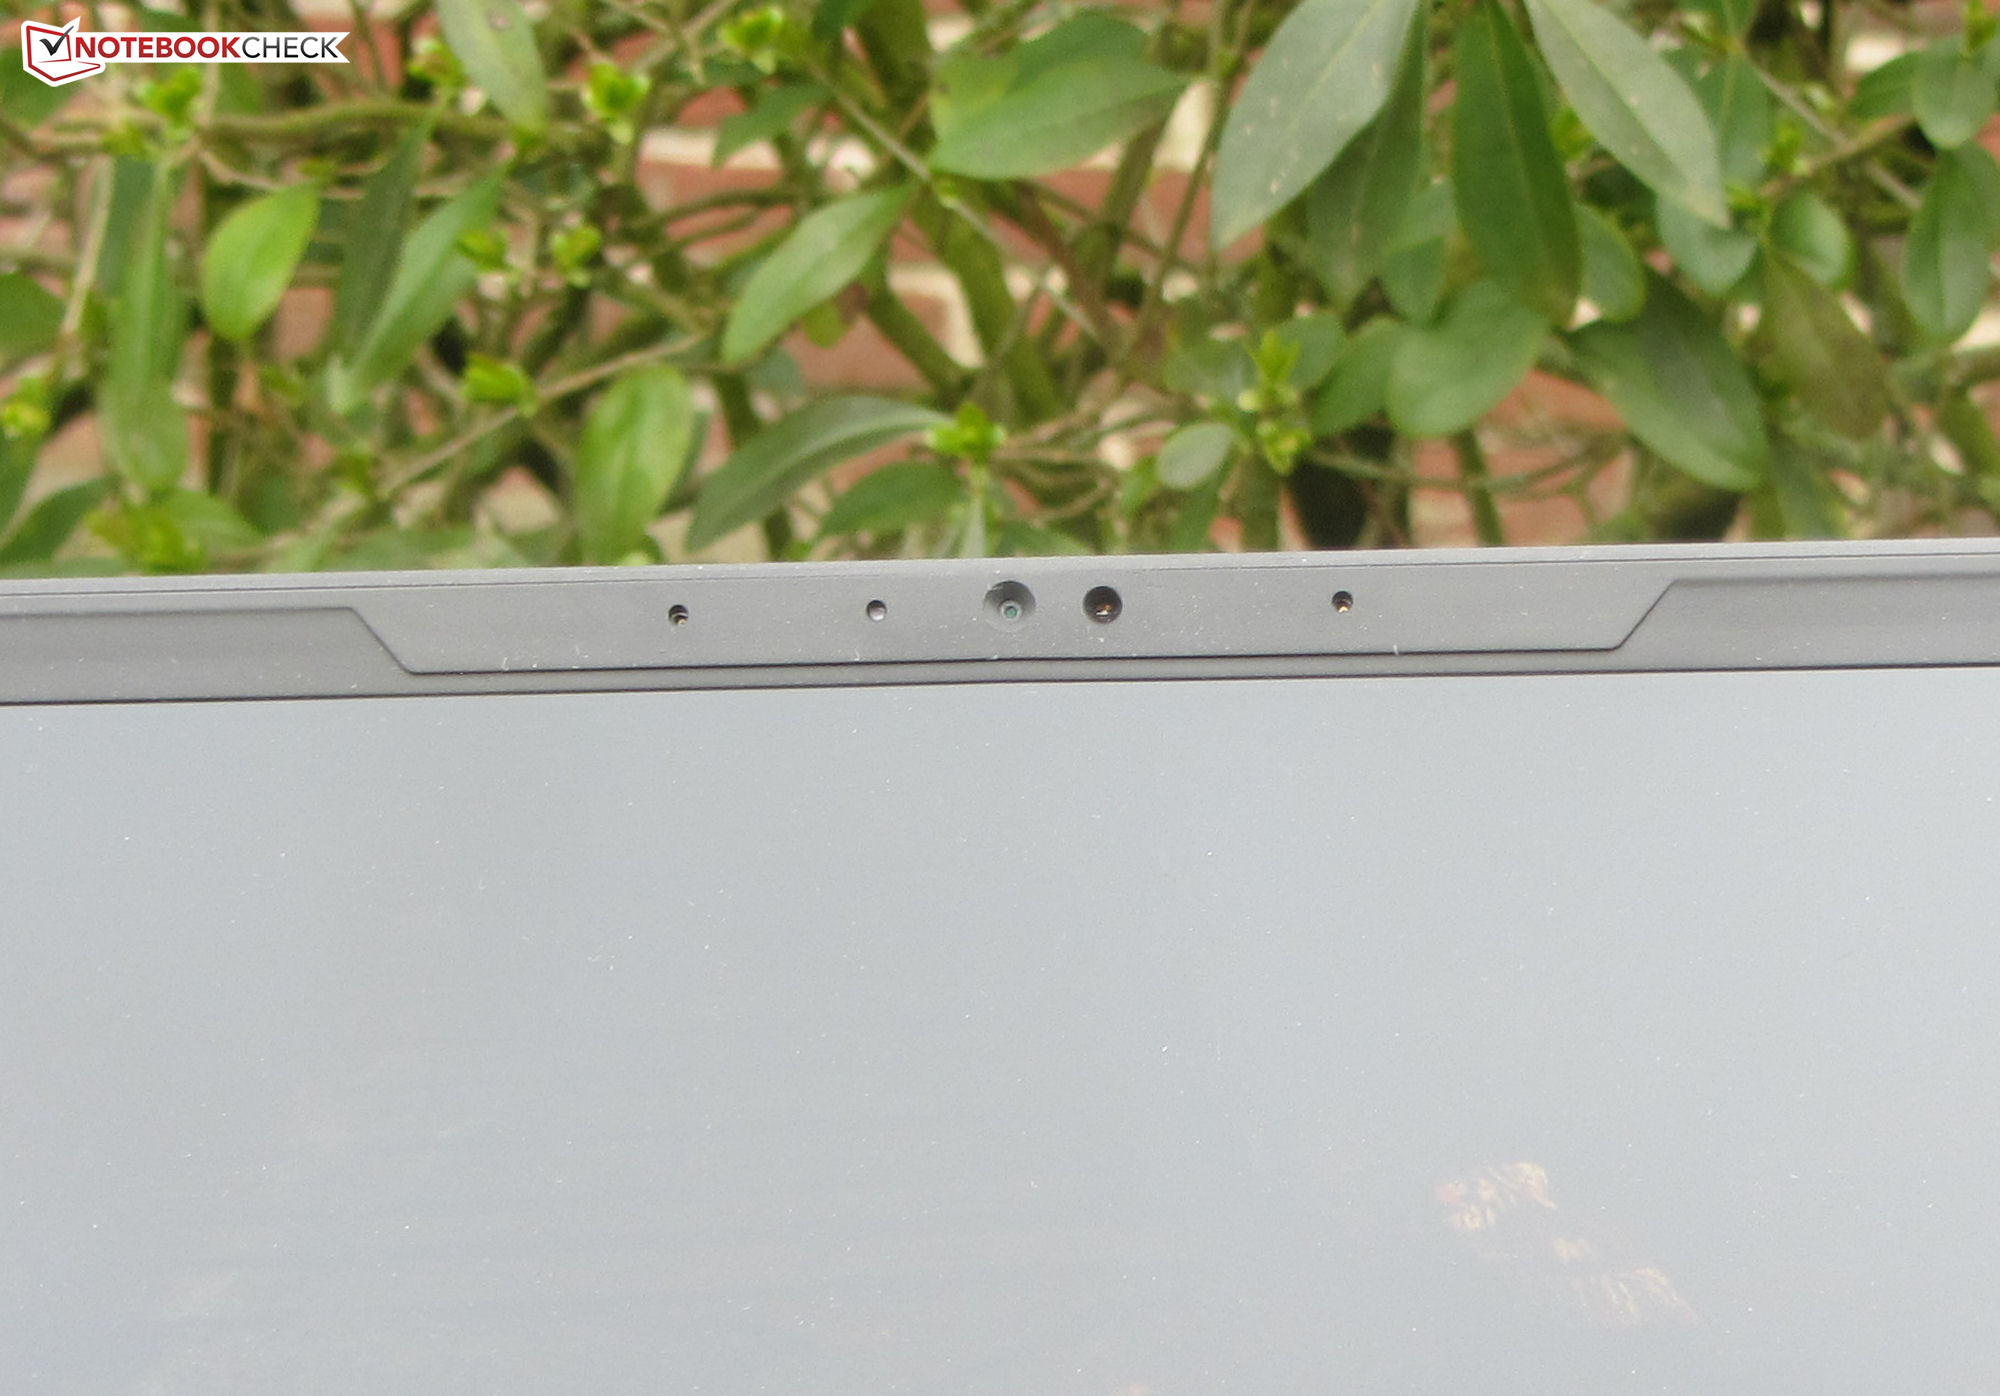
Webcam
A webcam do dispositivo (2,1 MP, máx. 1.920 x 1.080 pixels) não tem cobertura, no entanto, sua qualidade é bastante padrão. Ela luta um pouco com a precisão das cores: seu desvio de cor de 11 significa que isto se enquadra em uma faixa inaceitável (desejável: DeltaE menos de 3).


Acessórios
Ao lado dos documentos habituais (guia de início rápido e informações sobre garantia), o laptop não vem com nenhum acessório adicional.
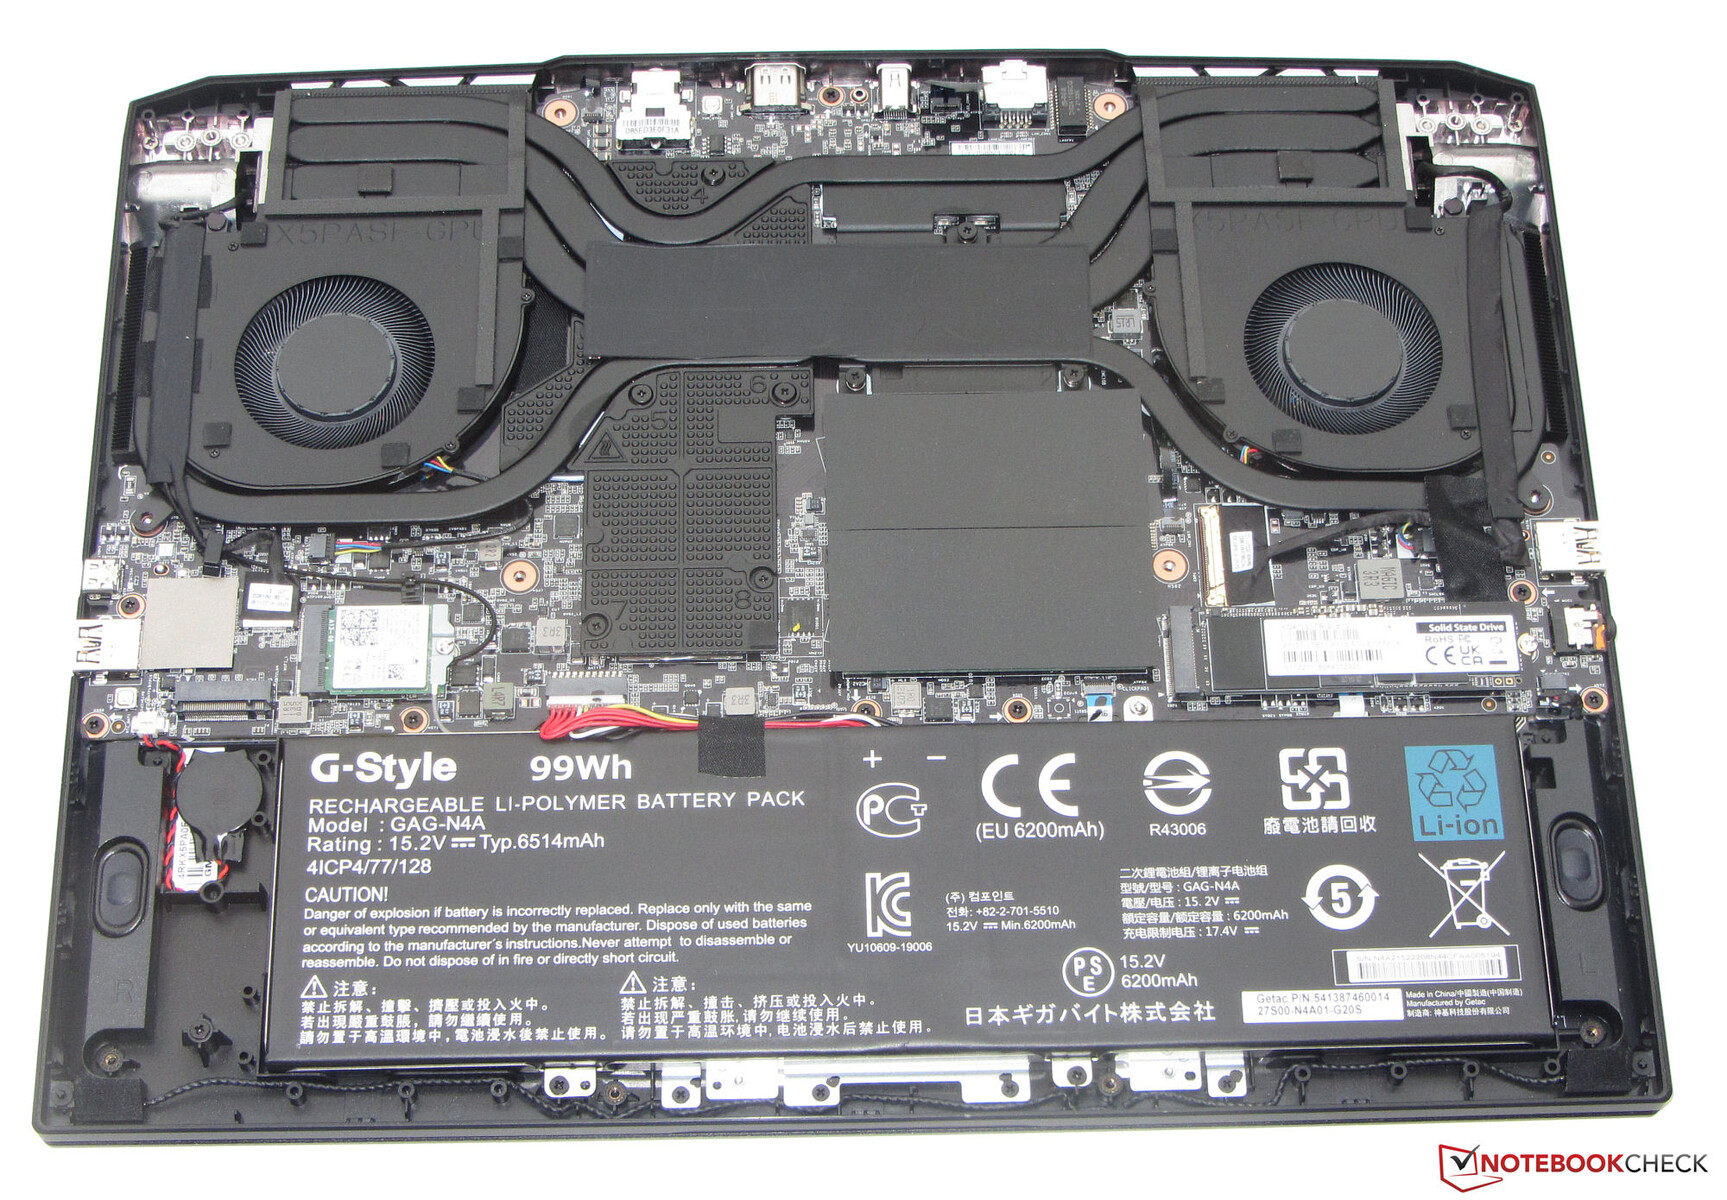
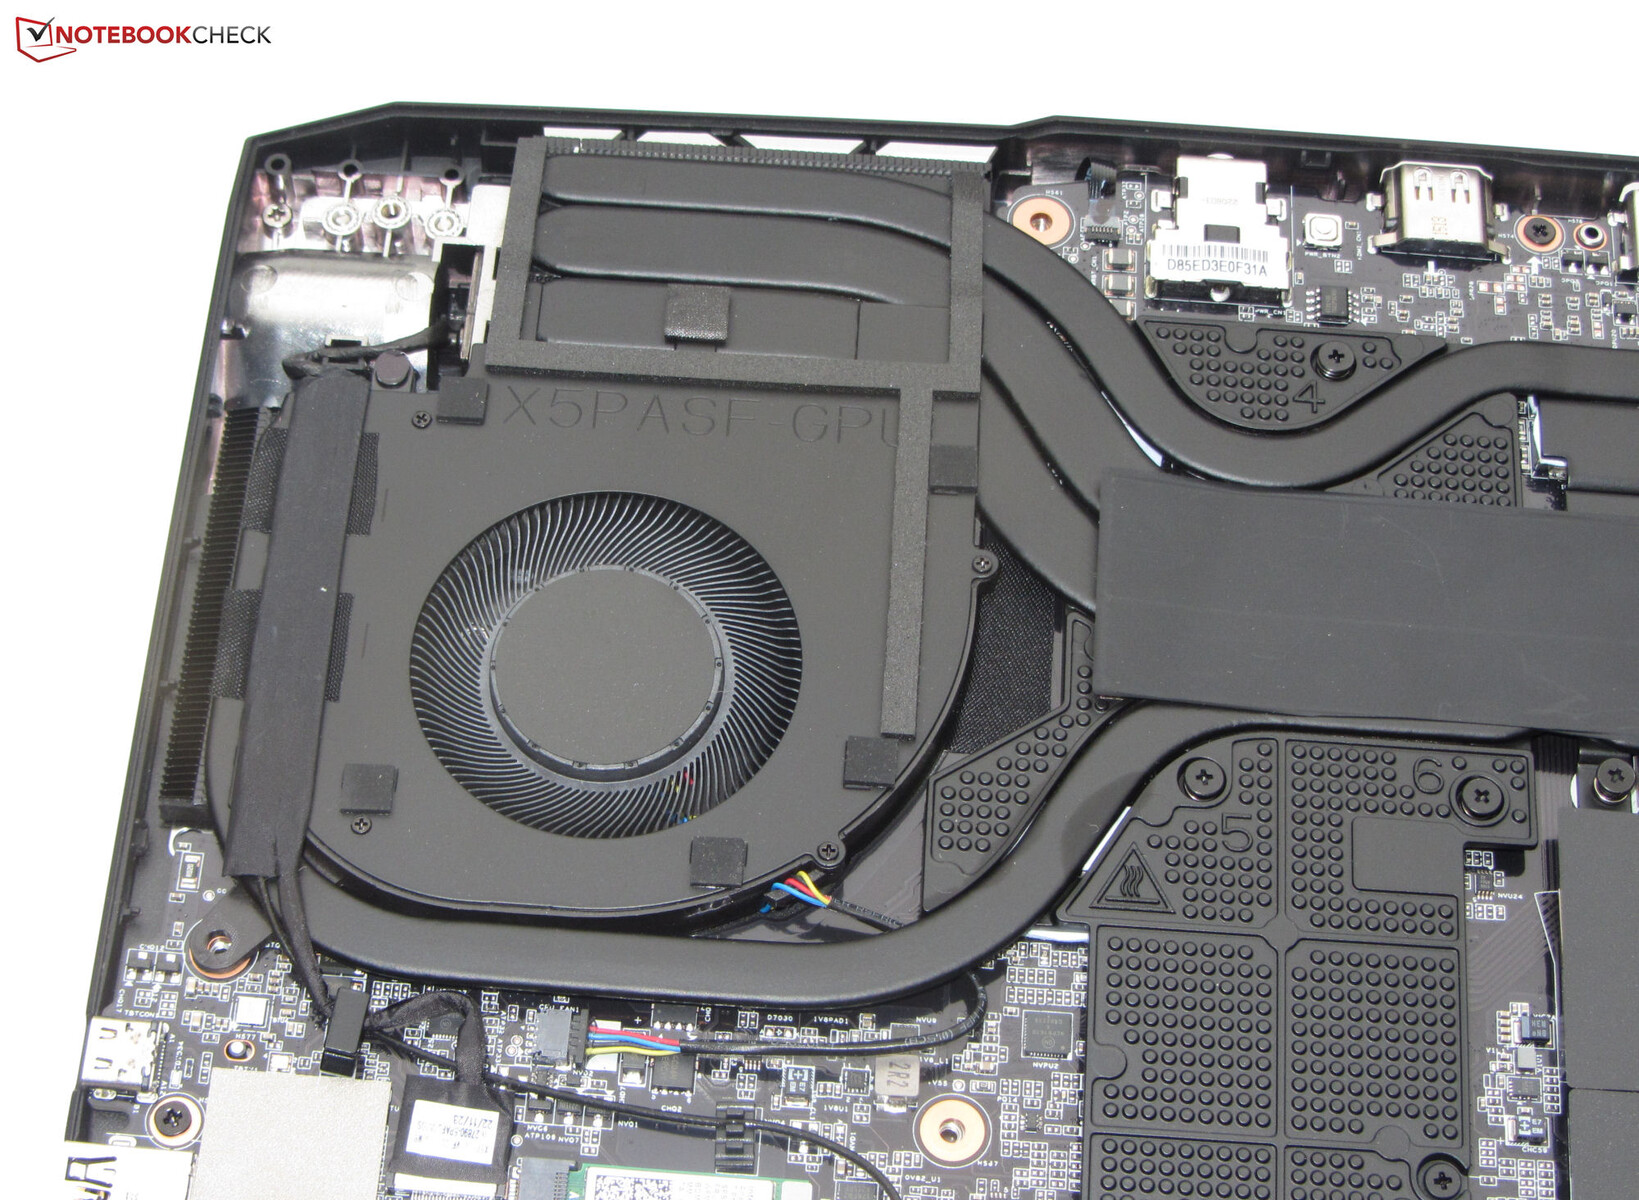
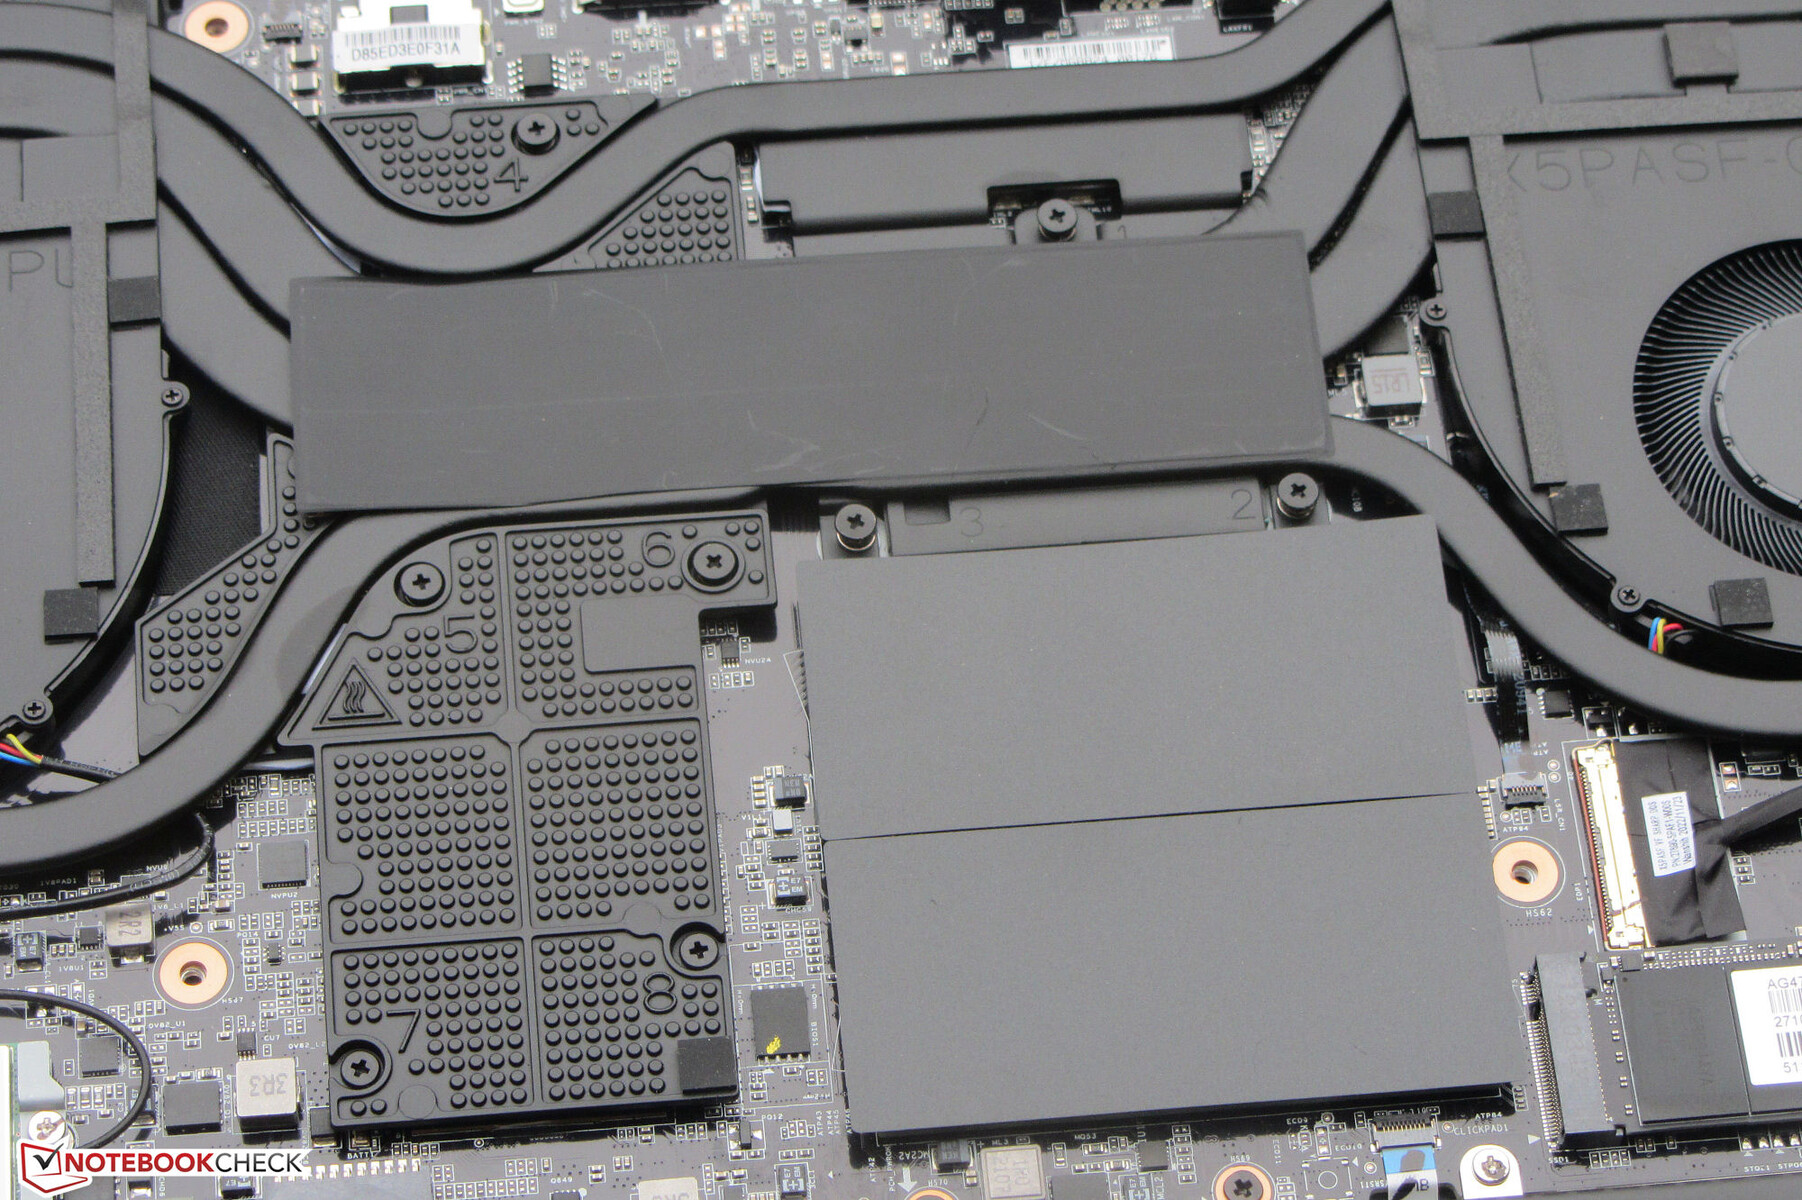
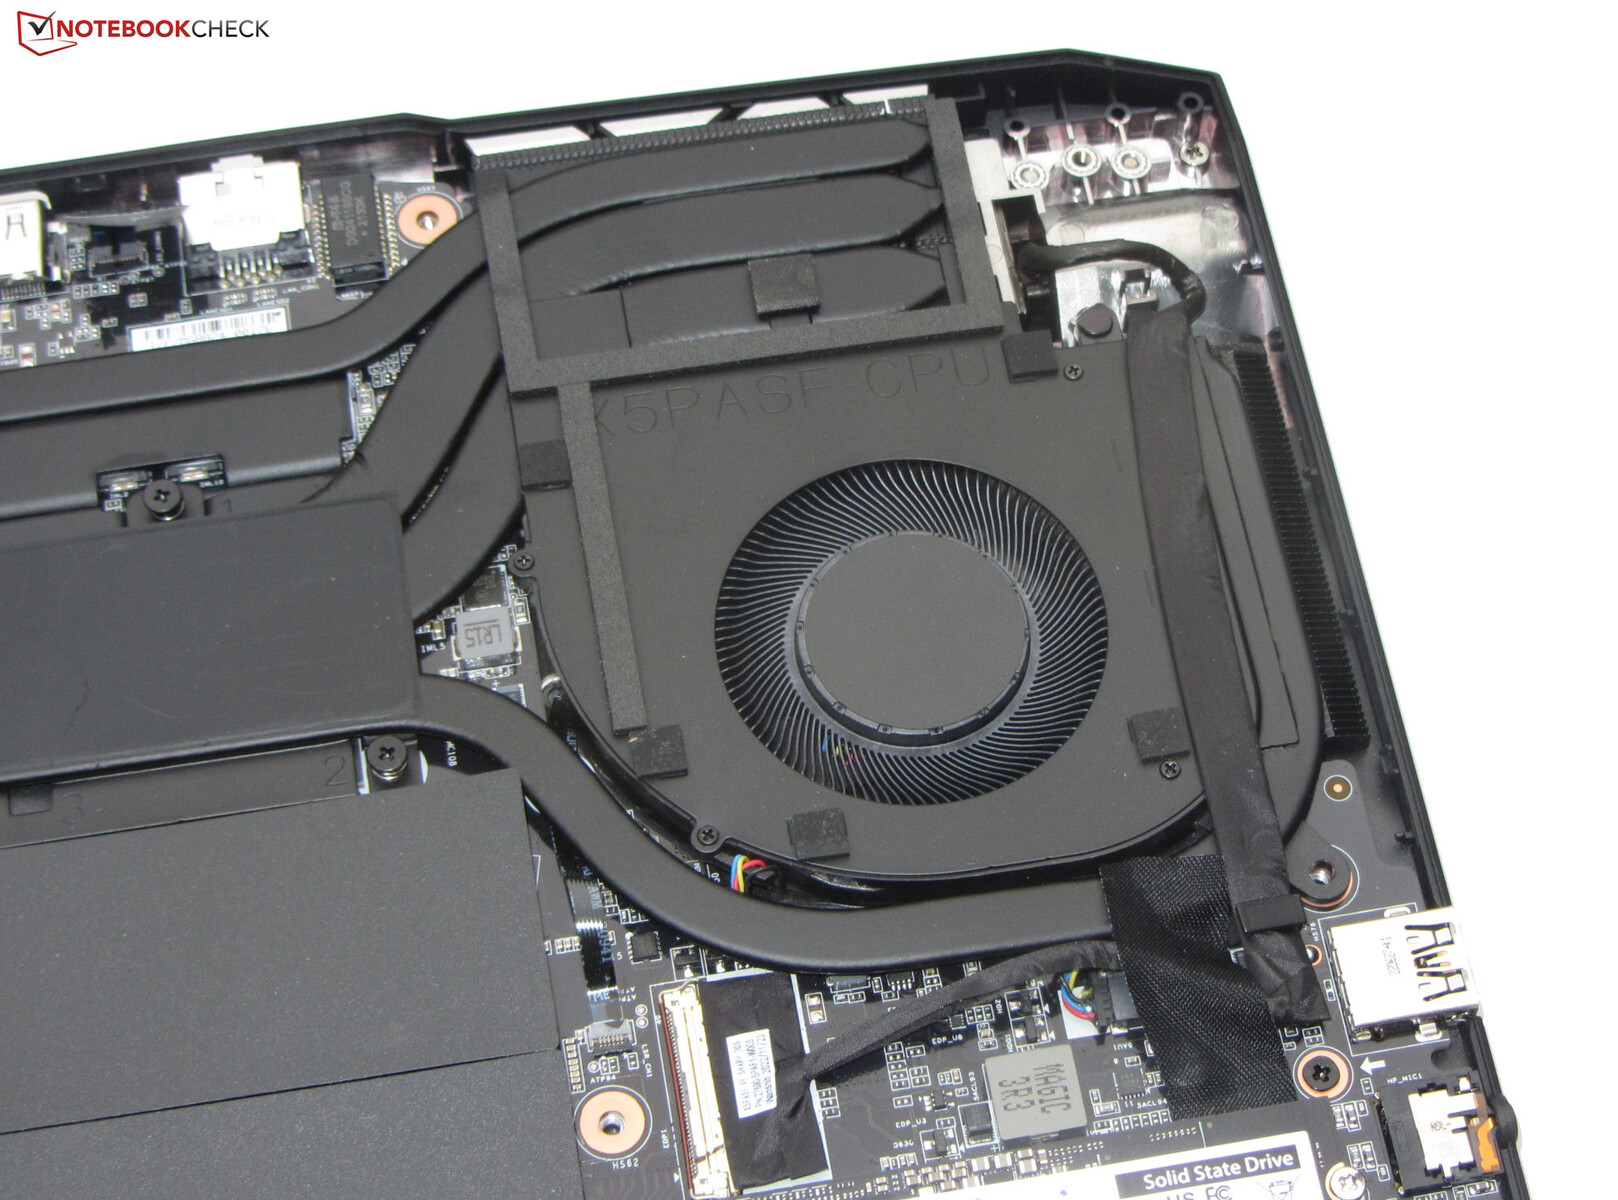
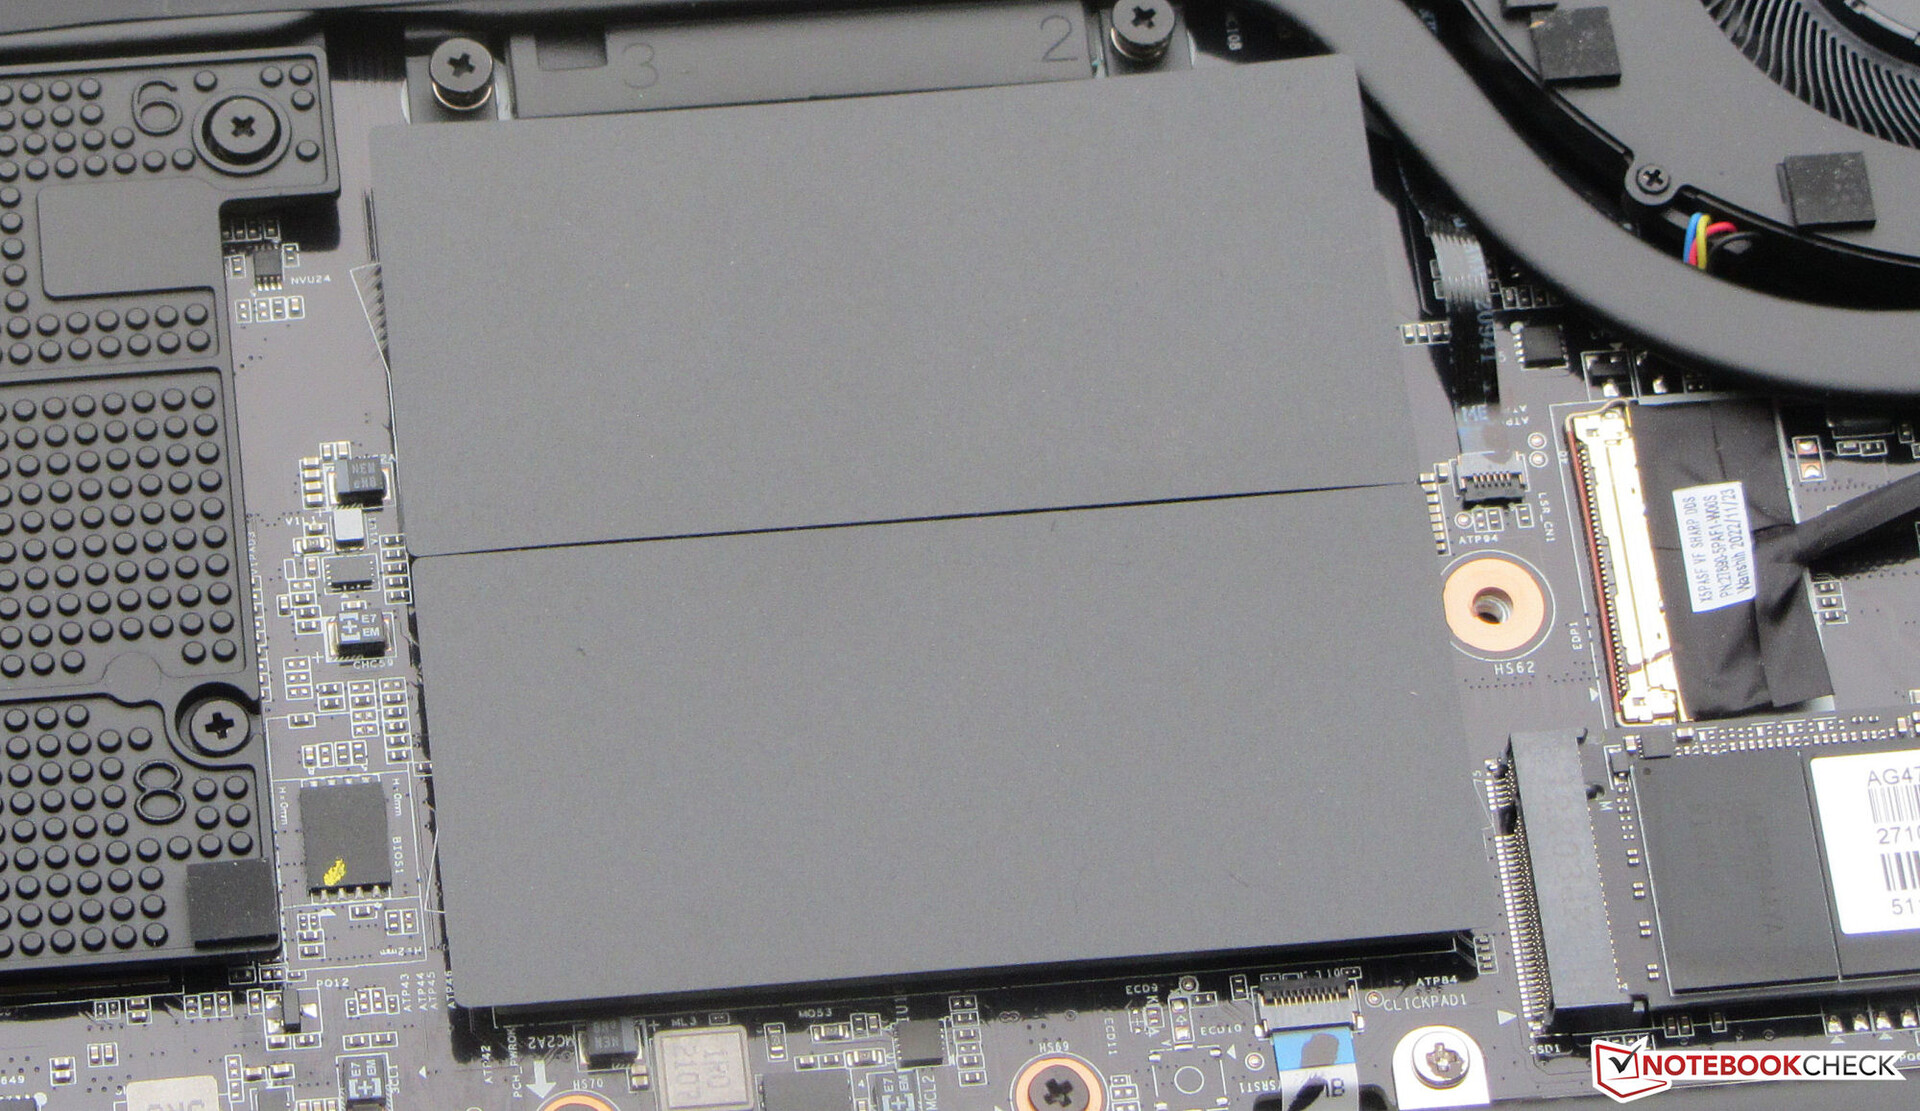
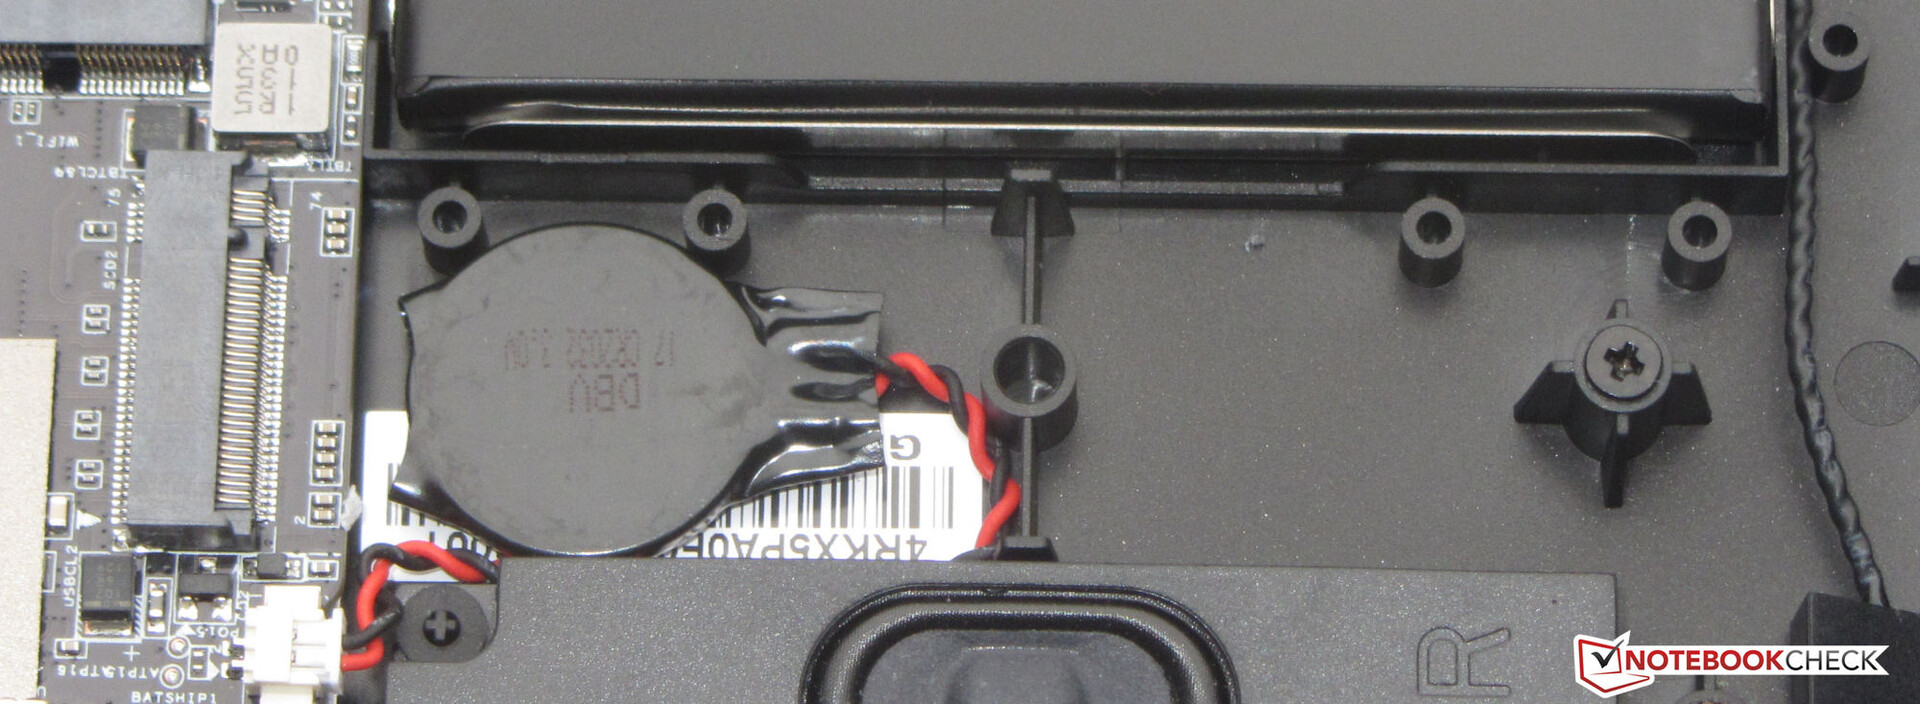
Manutenção
Depois que todos os parafusos forem removidos do fundo do dispositivo, a casca inferior pode ser removida com a ajuda de uma espátula plana ou faca de palete. Posteriormente, os slots de RAM (ambos em uso), SSD (PCIe 4), segundo slot M.2 2280 (PCIe 4), bateria BIOS, módulo WLAN, ventiladores, alto-falantes e a bateria podem ser acessados.
Garantia
O laptop Gigabyte de 15,6 polegadas vem com uma garantia de dois anos. As extensões de garantia não estão disponíveis.
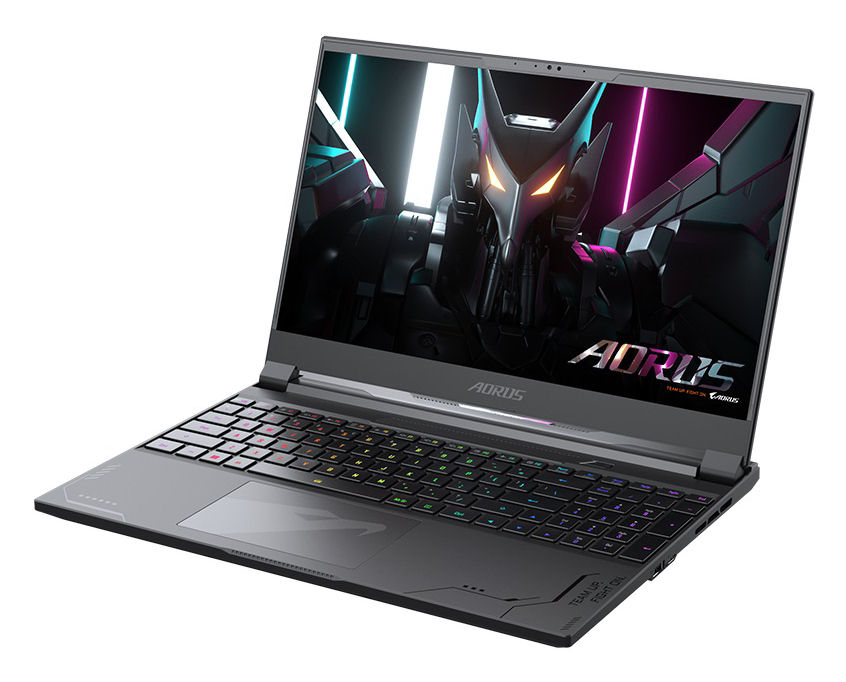
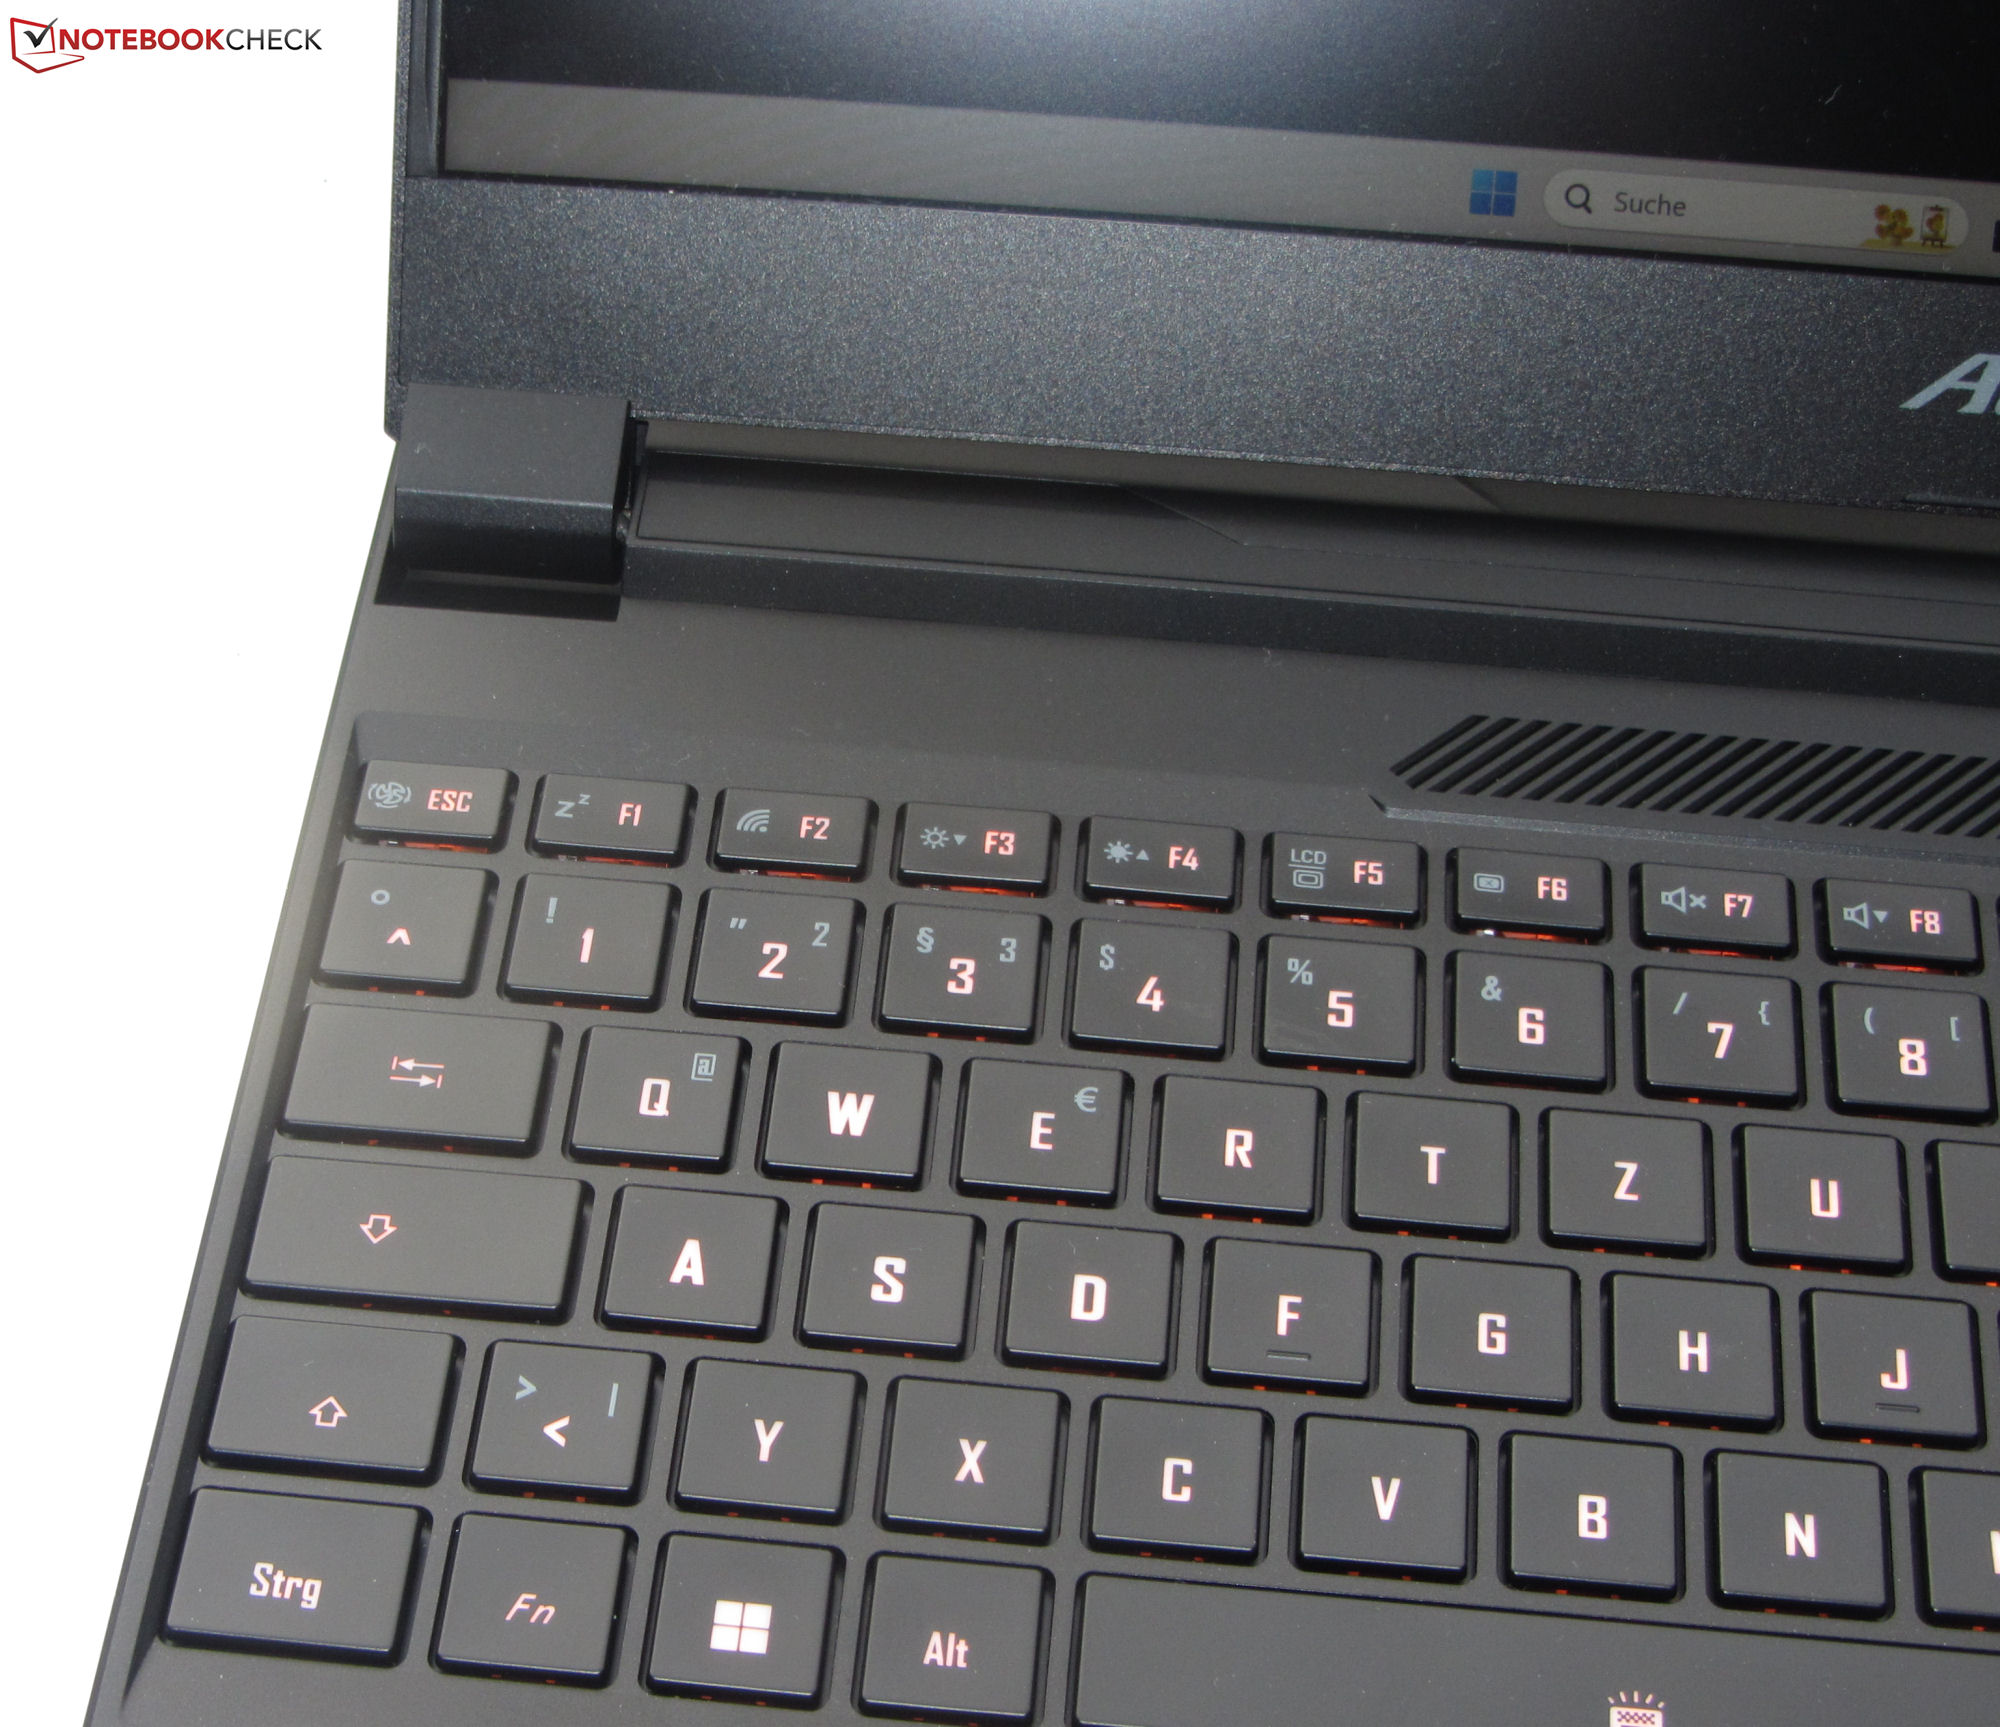
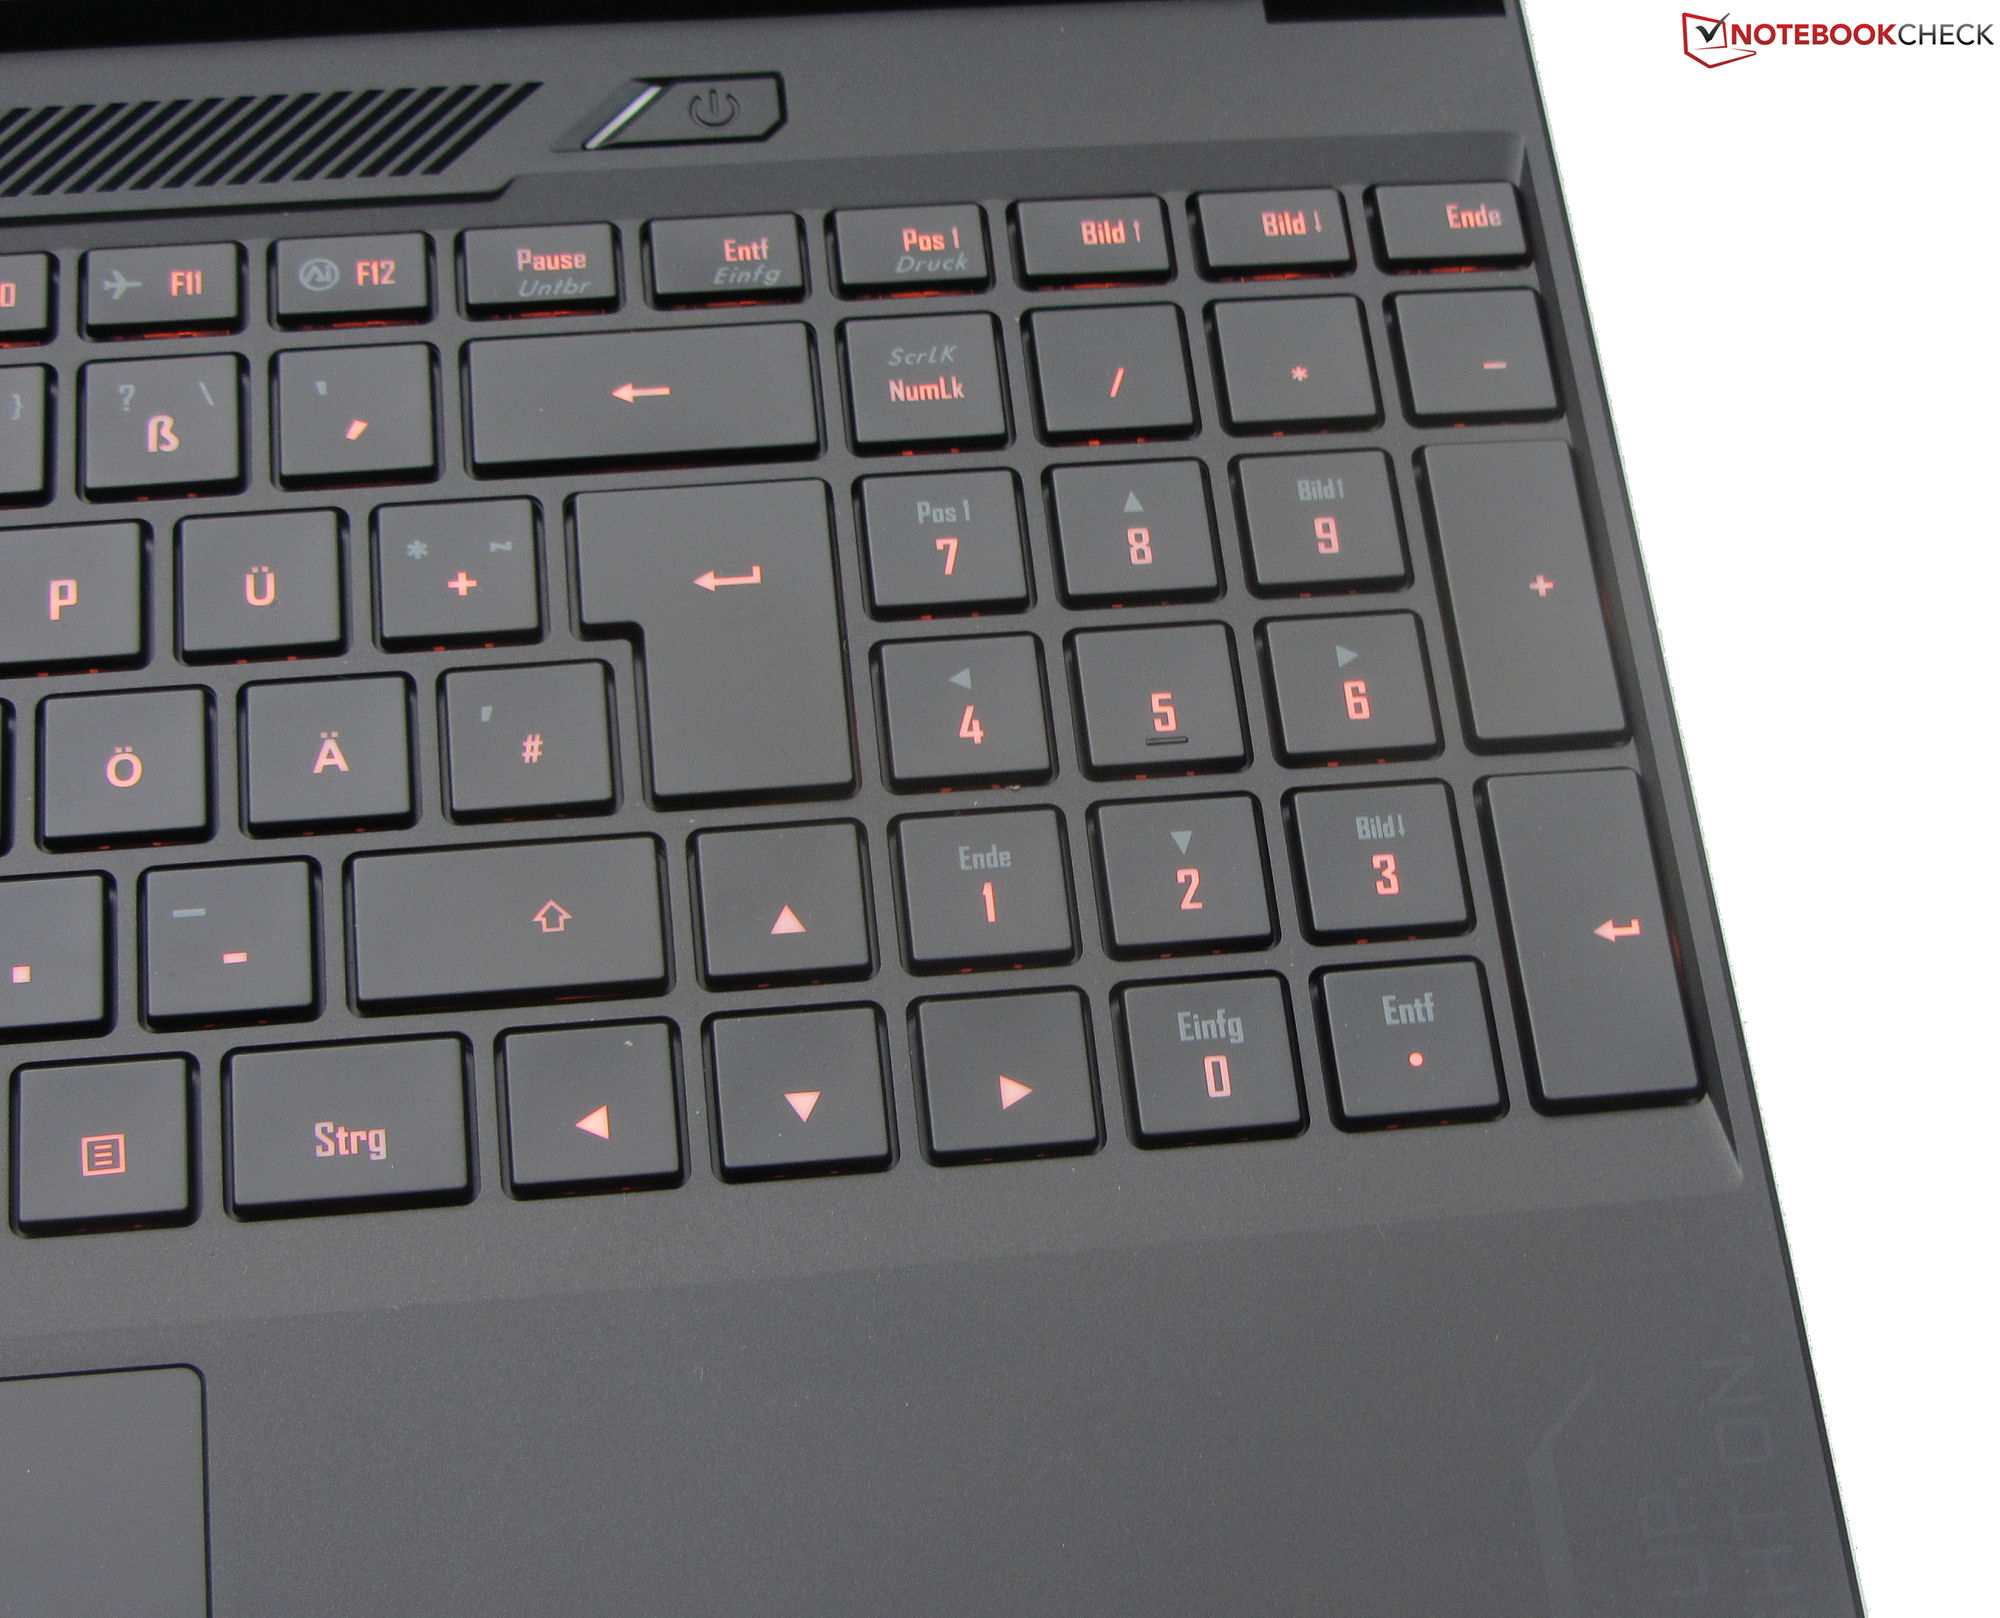
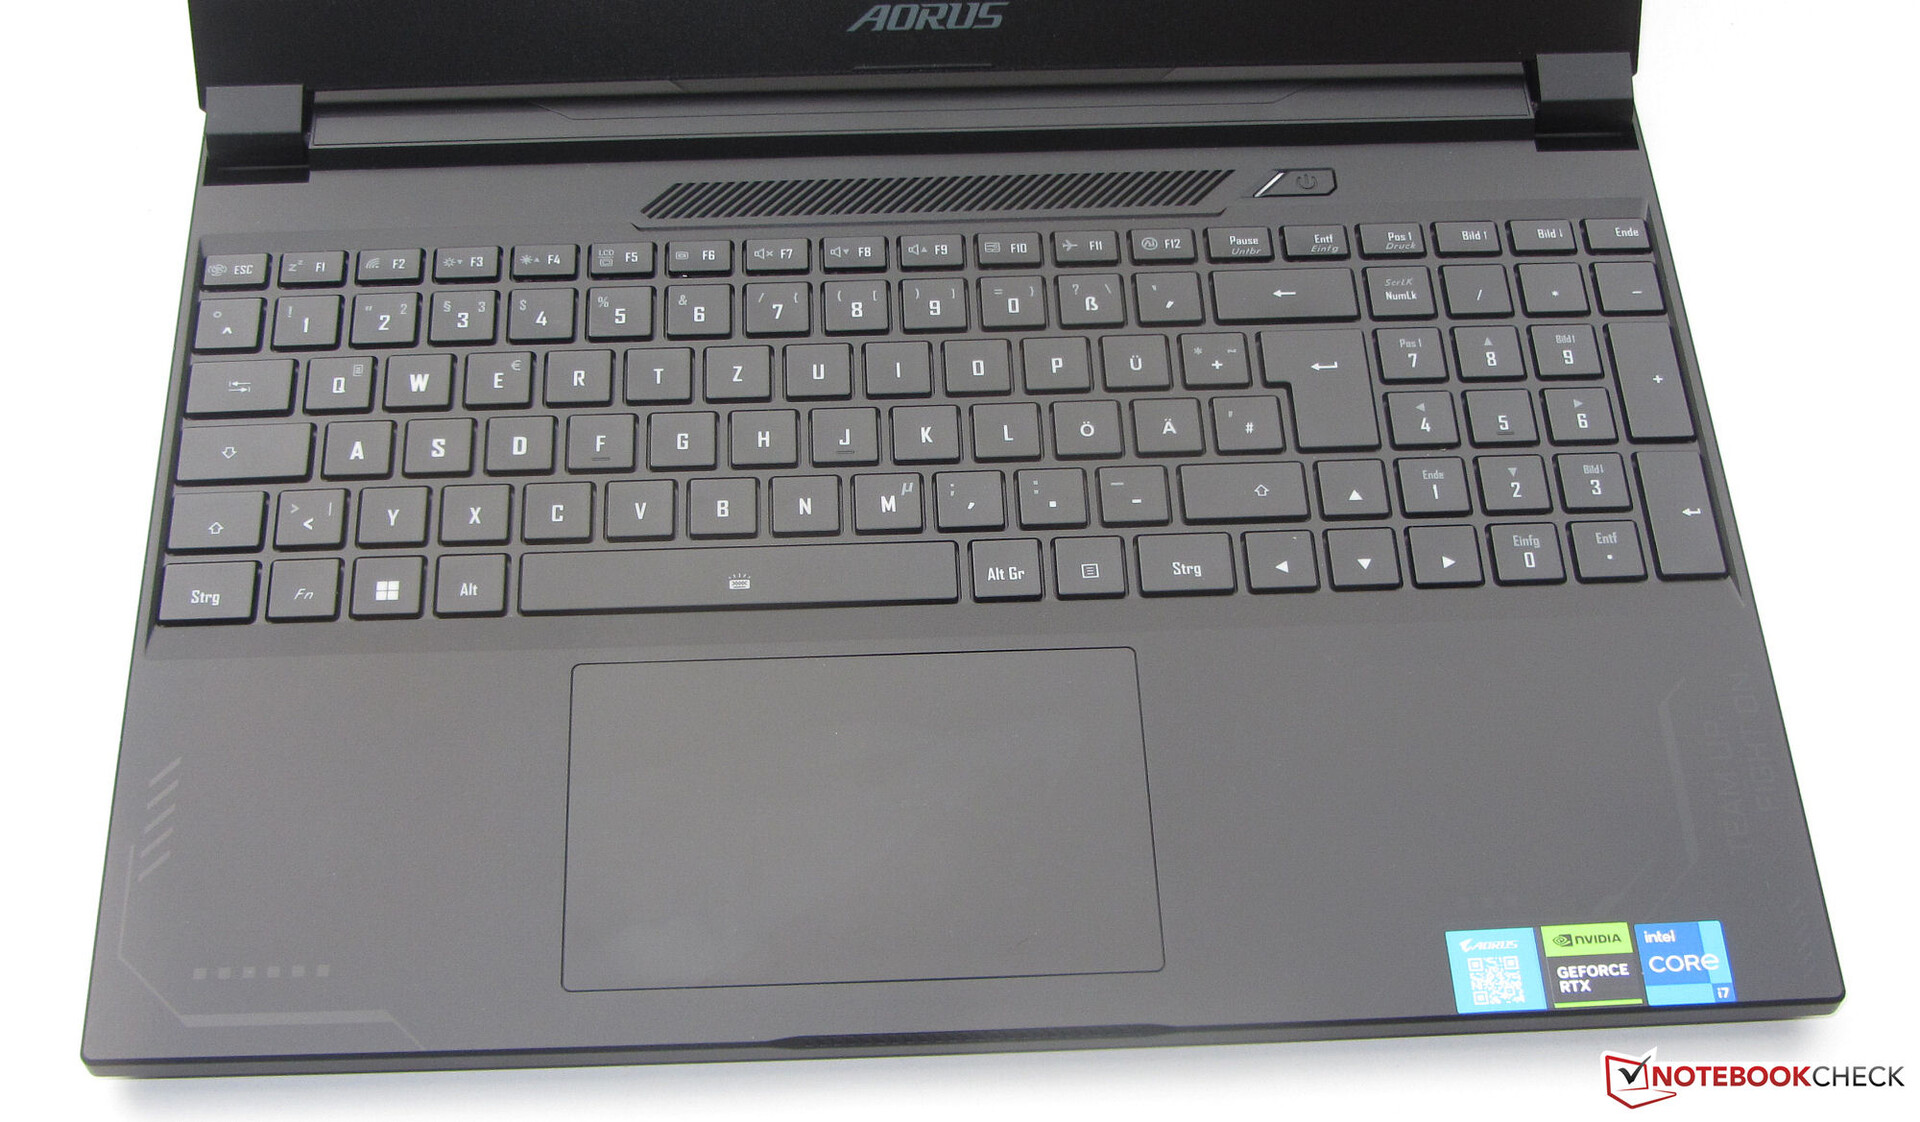
Dispositivos de entrada - um laptop de jogos com teclas iluminadas individualmente
Teclado
As teclas lisas do teclado Chiclet têm um elevador de nível médio e um ponto de pressão claro. Cada tecla é iluminada individualmente (três níveis de luminosidade). Negativo: As funções secundárias das teclas não captam nenhuma luz, o que significa que elas são pouco legíveis. Enquanto você estiver digitando, as chaves têm apenas uma pequena quantidade de dar - mas isto não deve ser muito irritante. Tudo-em-tudo, Gigabyte forneceu a este dispositivo um bom teclado diário.
Touchpad
Um teclado de clique multi-toque (aproximadamente 12,1 x 7,6 cm) substitui um mouse neste computador - sua superfície lisa facilita o uso. Os cantos reagem às entradas, têm um leve dar e têm um ponto de pressão claro.
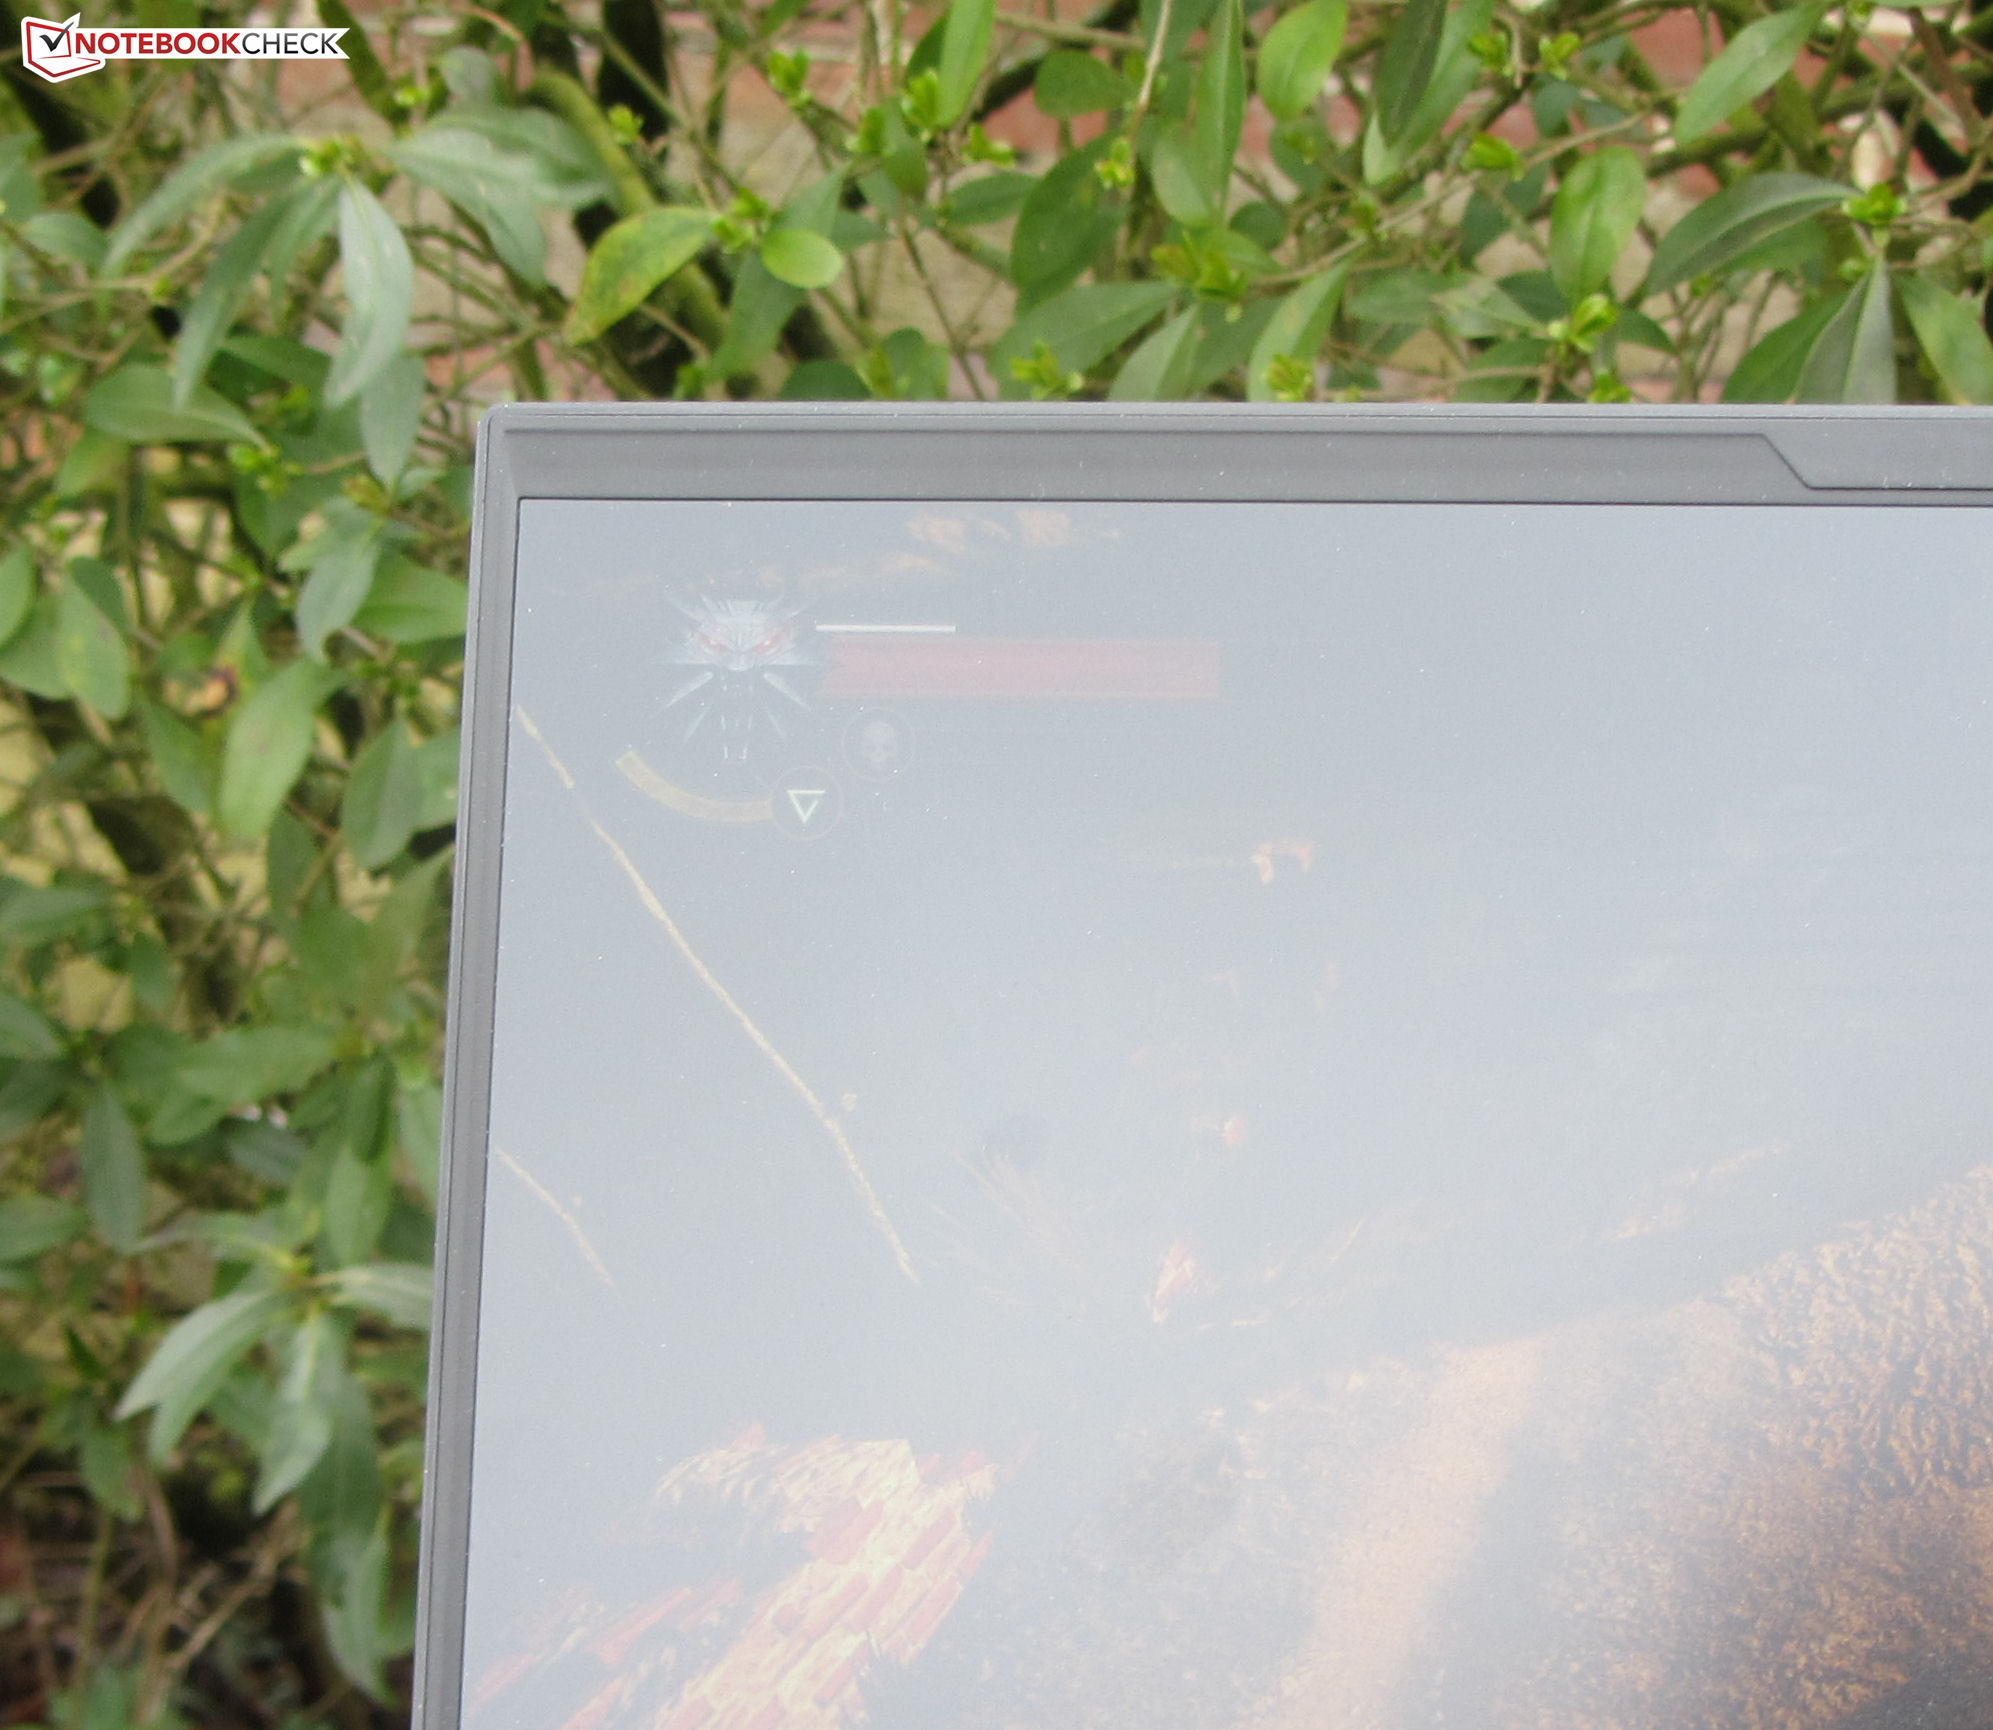
Display - painel QHD de 240 Hz
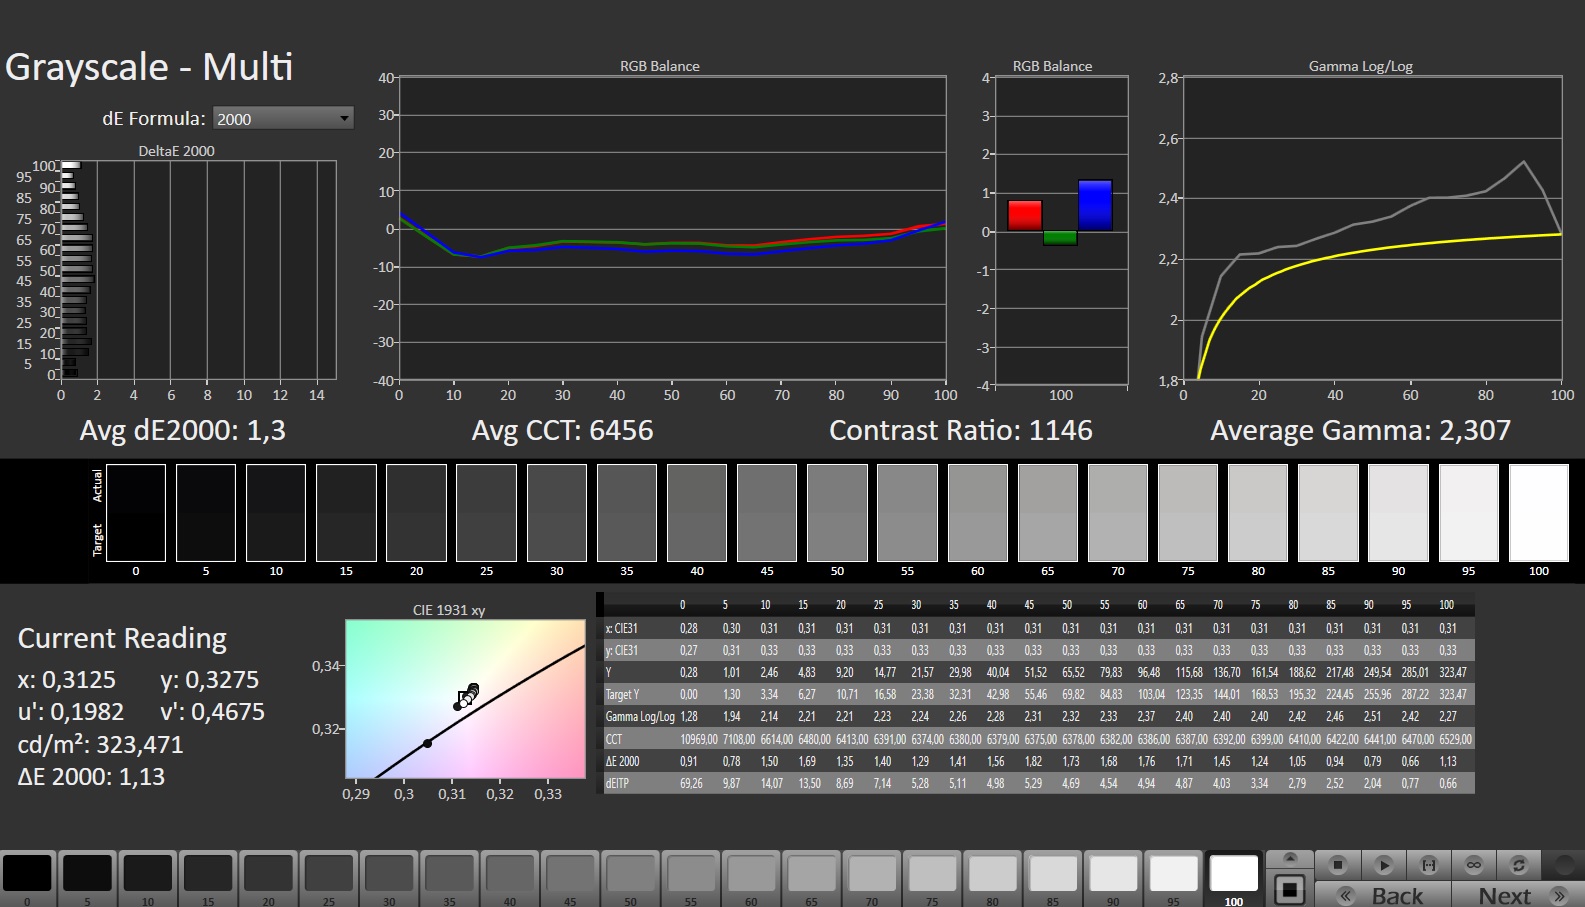
O Gigabyte 15X está equipado com um painel de reação rápida no formato 16:9 240 Hz, que não sofre de uma cintilação de PWM em nenhum nível de brilho. Os níveis de brilho e contraste no display mate de 15,6 polegadas (2.560 x 1.440 pixels) estão dentro de uma faixa aceitável (> 300 cd/m² e 1.000:1).
Em comparação com seus concorrentes, o Blade 15 se sobressai graças a seu painel OLED.
| |||||||||||||||||||||||||
iluminação: 90 %
iluminação com acumulador: 316 cd/m²
Contraste: 1129:1 (Preto: 0.28 cd/m²)
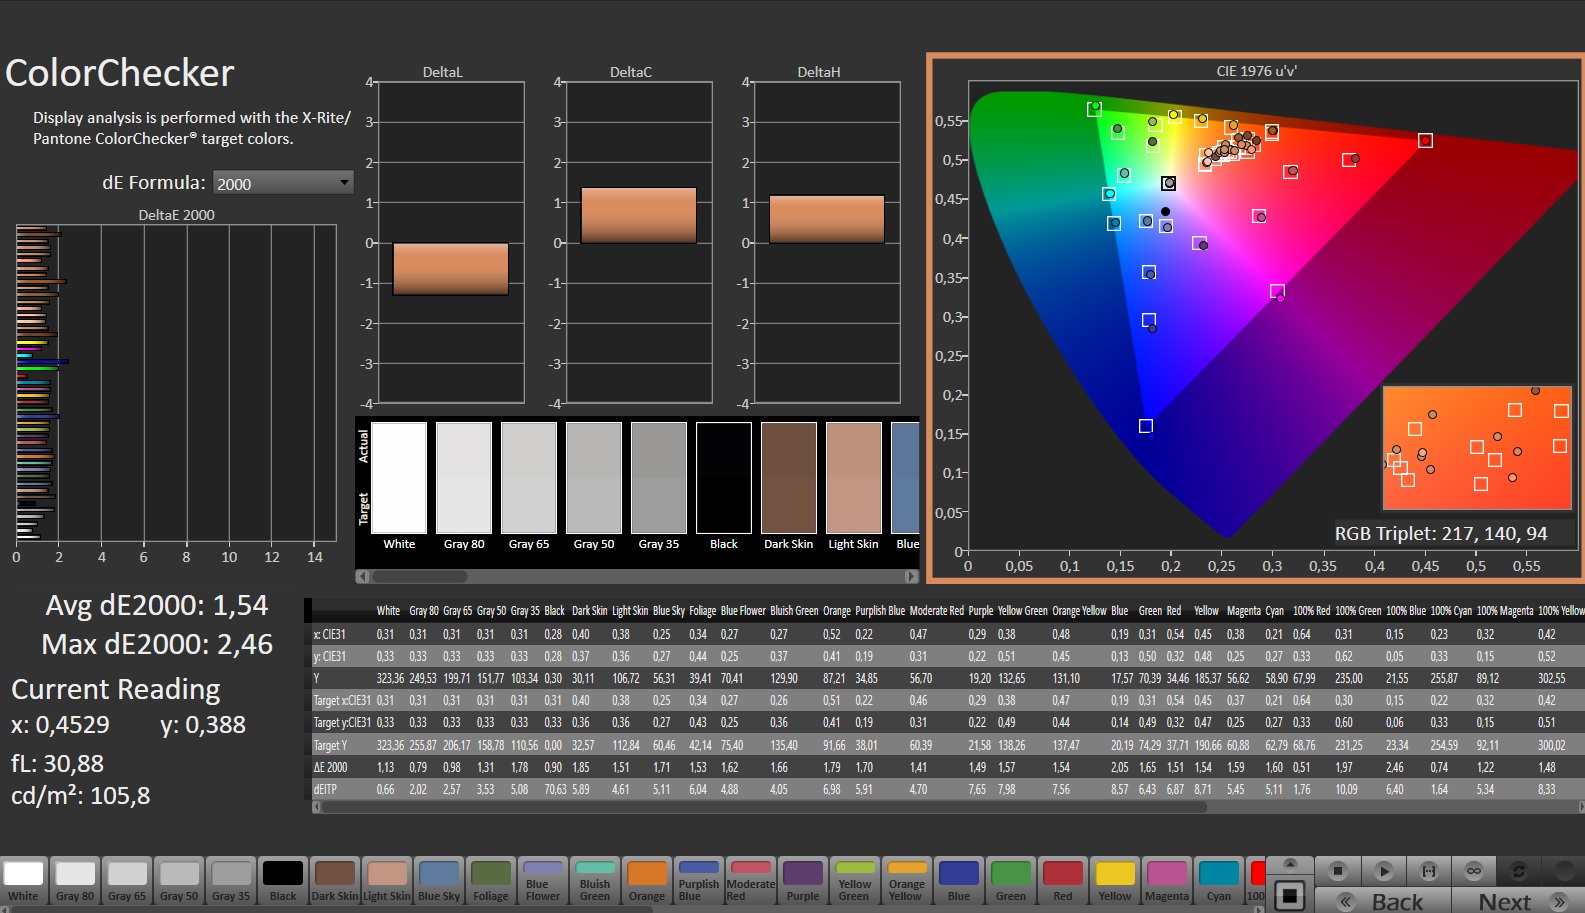
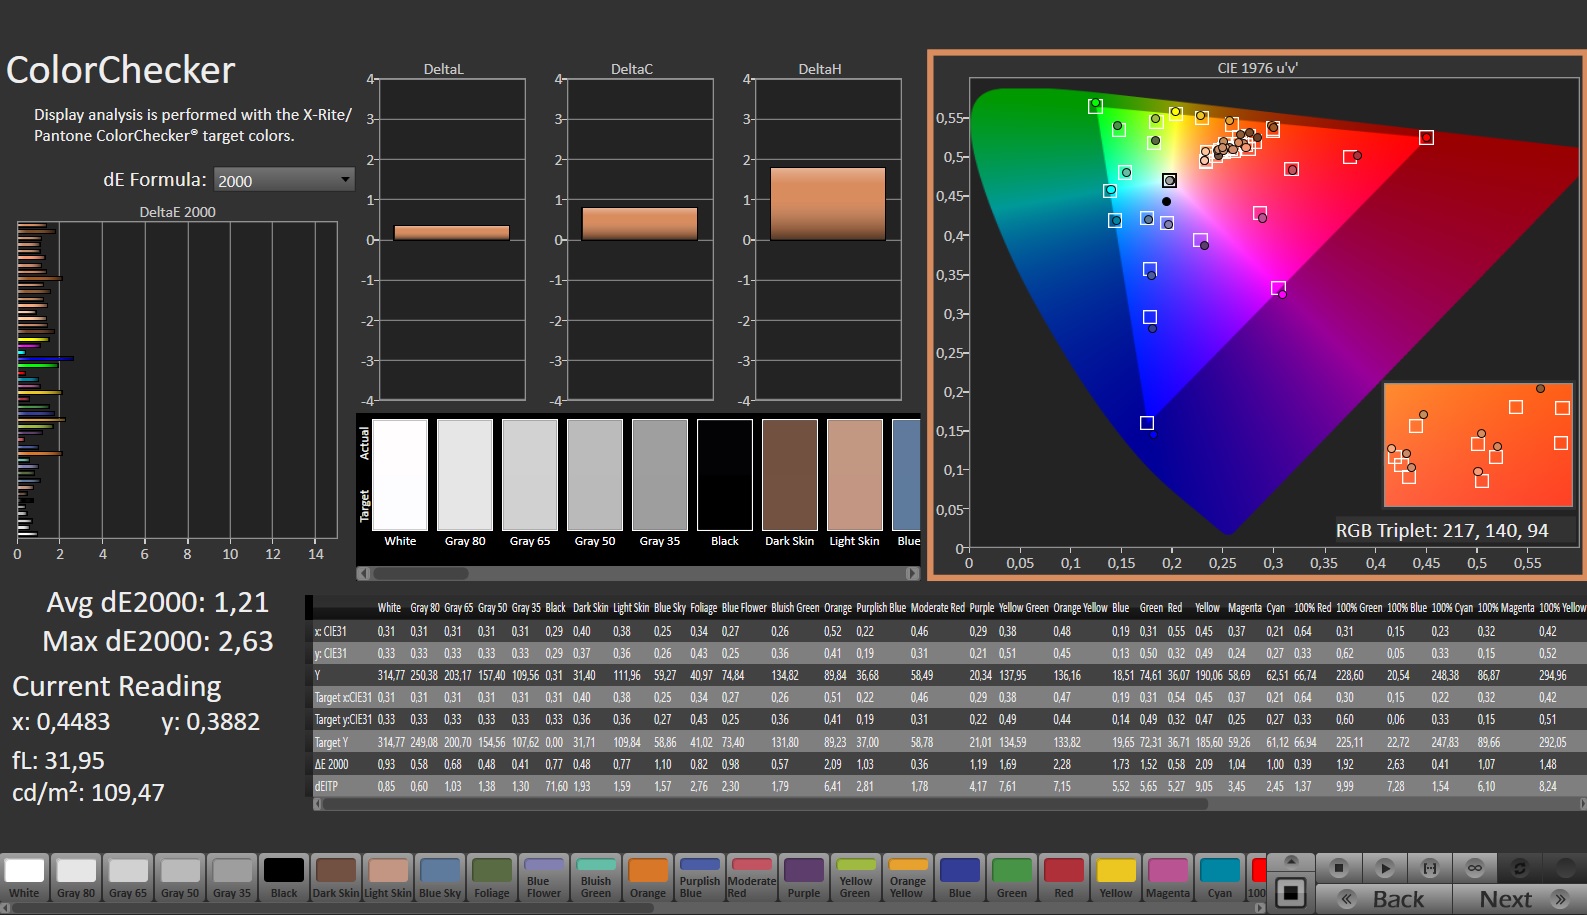
ΔE ColorChecker Calman: 1.54 | ∀{0.5-29.43 Ø4.71}
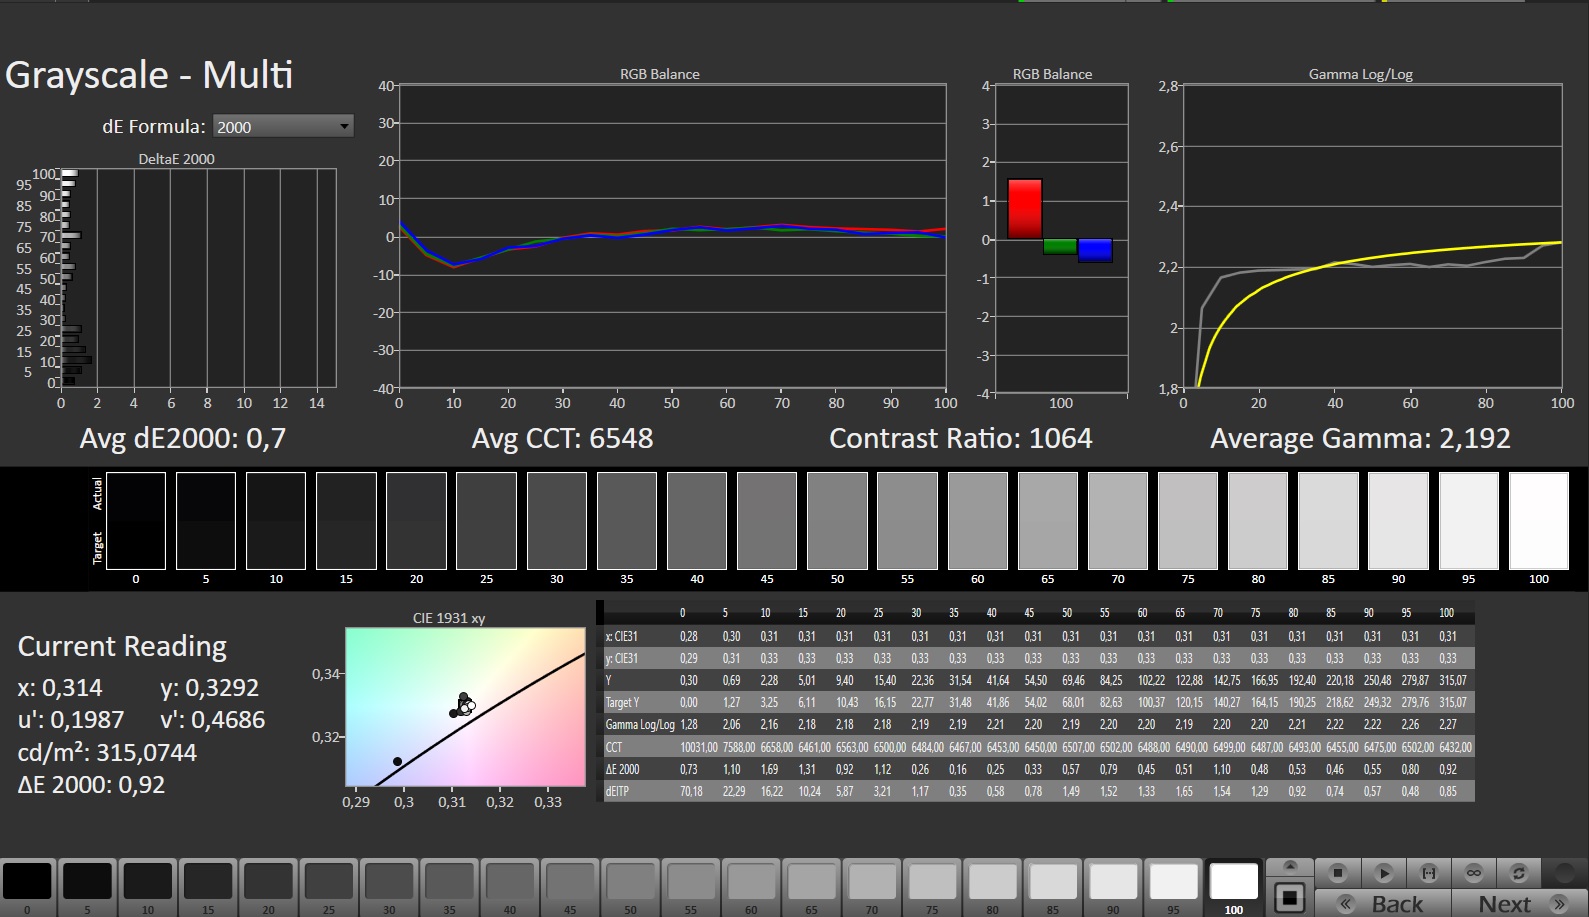
calibrated: 1.21
ΔE Greyscale Calman: 1.3 | ∀{0.09-98 Ø4.96}
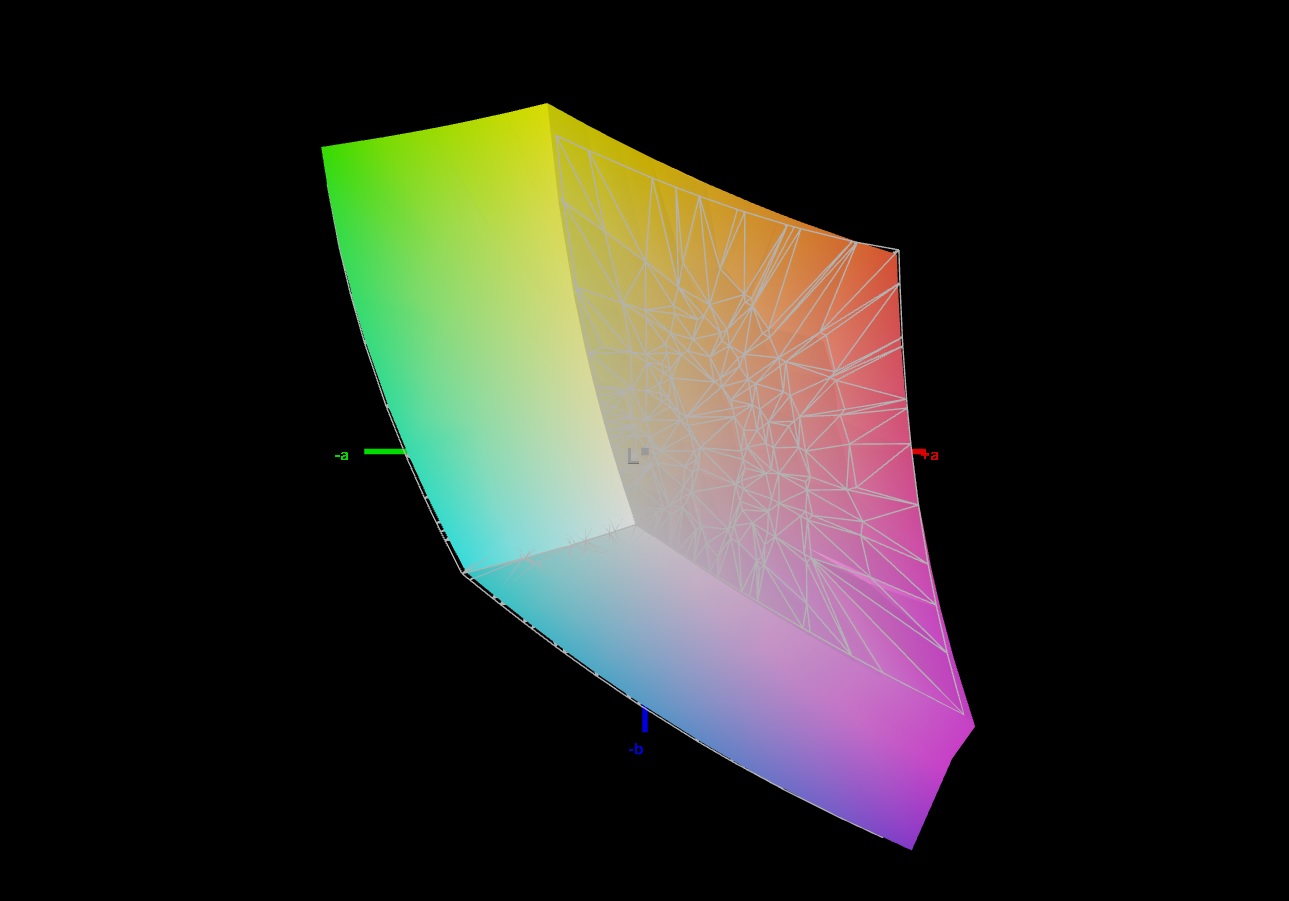
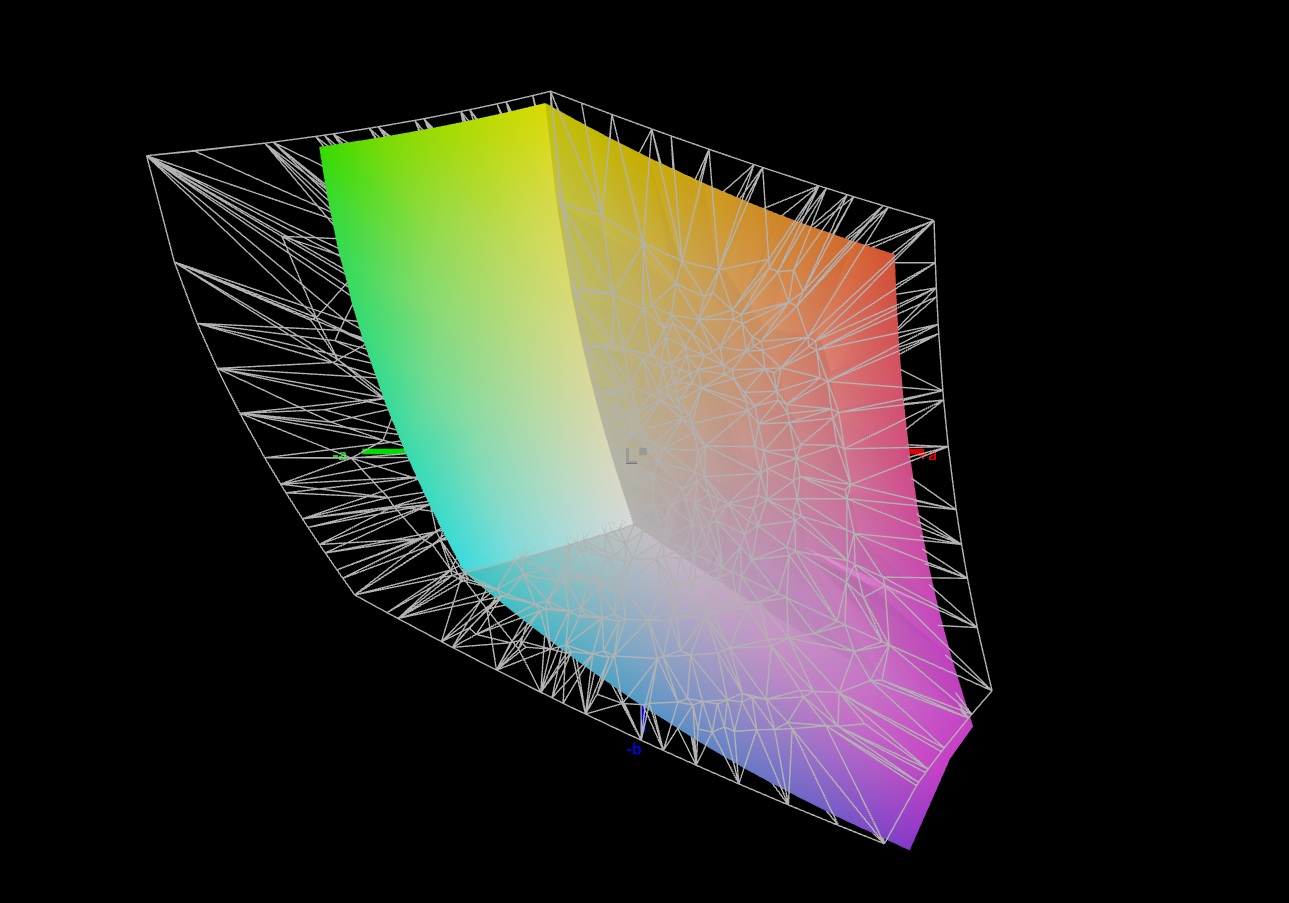
70.5% AdobeRGB 1998 (Argyll 3D)
98.2% sRGB (Argyll 3D)
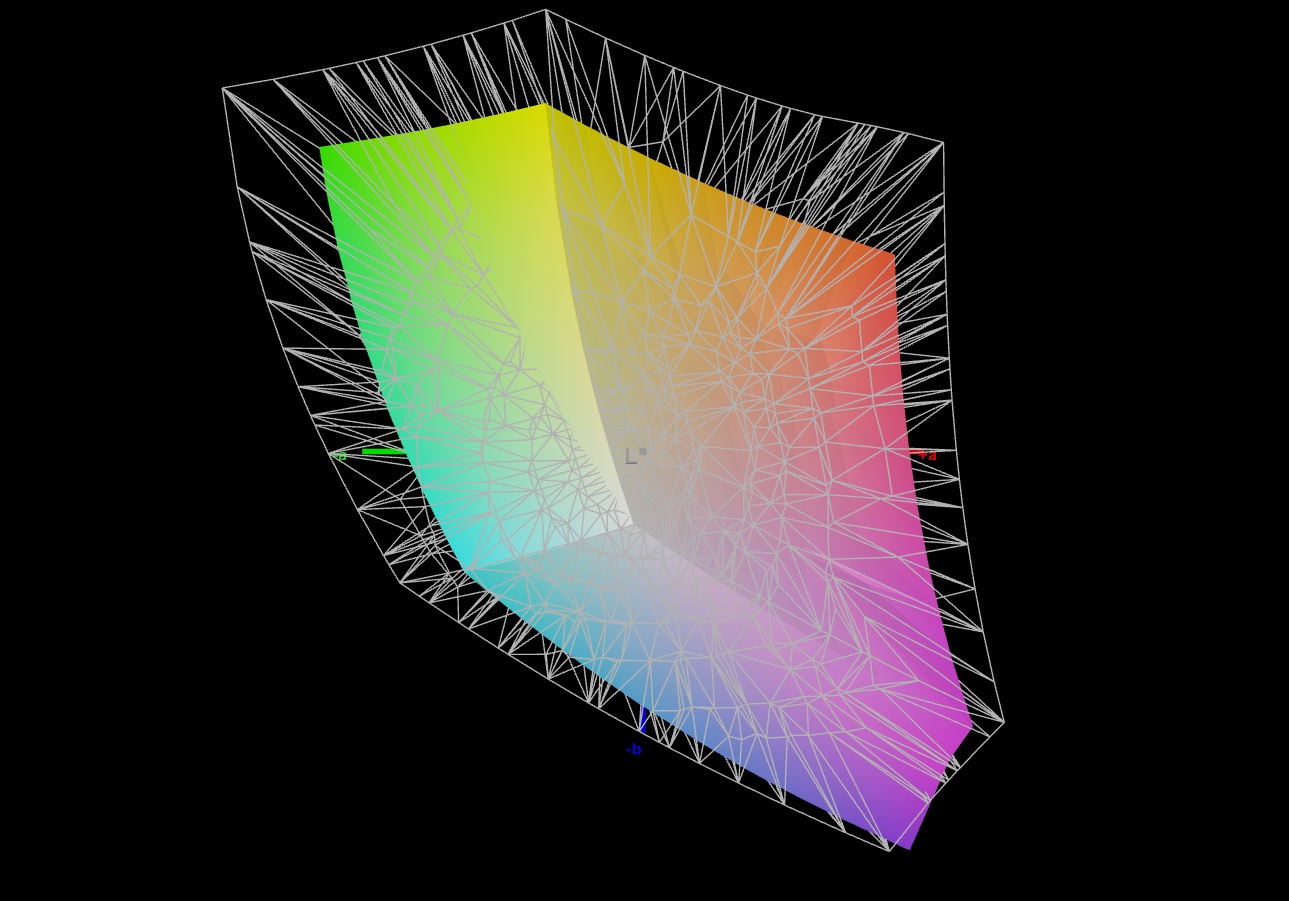
69.3% Display P3 (Argyll 3D)
Gamma: 2.307
CCT: 6456 K
| Aorus 15X ASF BOE CQ NE156QHM-NZ1, IPS, 2560x1440, 15.6" | Razer Blade 15 OLED (Early 2022) Samsung ATNA562P02-0, OLED, 2560x1440, 15.6" | MSI Katana 17 B13VFK B173HAN04.9, IPS LED, 1920x1080, 17.3" | Asus ROG Strix G17 G713PI BOE0B69, IPS, 2560x1440, 17.3" | Acer Predator Helios 300 (i7-12700H, RTX 3070 Ti) BOE0A1A, IPS, 2560x1440, 17.3" | |
|---|---|---|---|---|---|
| Display | 25% | -40% | 22% | 21% | |
| Display P3 Coverage (%) | 69.3 | 97.6 41% | 40.8 -41% | 98.3 42% | 96.8 40% |
| sRGB Coverage (%) | 98.2 | 99.4 1% | 61 -38% | 100 2% | 99.9 2% |
| AdobeRGB 1998 Coverage (%) | 70.5 | 94 33% | 42.2 -40% | 85.9 22% | 84.8 20% |
| Response Times | 82% | -172% | 33% | -26% | |
| Response Time Grey 50% / Grey 80% * (ms) | 12.4 ? | 2 ? 84% | 33 ? -166% | 5.3 ? 57% | 16.4 ? -32% |
| Response Time Black / White * (ms) | 9.4 ? | 2 ? 79% | 26 ? -177% | 8.6 ? 9% | 11.2 ? -19% |
| PWM Frequency (Hz) | 500 ? | ||||
| Screen | 109% | -135% | -4% | -60% | |
| Brightness middle (cd/m²) | 316 | 383 21% | 267 -16% | 327 3% | 366 16% |
| Brightness (cd/m²) | 301 | 384 28% | 256 -15% | 320 6% | 340 13% |
| Brightness Distribution (%) | 90 | 99 10% | 93 3% | 89 -1% | 85 -6% |
| Black Level * (cd/m²) | 0.28 | 0.03 89% | 0.21 25% | 0.38 -36% | 0.31 -11% |
| Contrast (:1) | 1129 | 12767 1031% | 1271 13% | 861 -24% | 1181 5% |
| Colorchecker dE 2000 * | 1.54 | 1.89 -23% | 4.7 -205% | 1.01 34% | 3.56 -131% |
| Colorchecker dE 2000 max. * | 2.46 | 3.76 -53% | 20.4 -729% | 4.01 -63% | 5.66 -130% |
| Colorchecker dE 2000 calibrated * | 1.21 | 2.67 -121% | 4.5 -272% | 0.41 66% | 3.31 -174% |
| Greyscale dE 2000 * | 1.3 | 1.26 3% | 1.5 -15% | 1.6 -23% | 2.84 -118% |
| Gamma | 2.307 95% | 2.41 91% | 2.12 104% | 2.168 101% | 2.29 96% |
| CCT | 6456 101% | 6386 102% | 6552 99% | 6659 98% | 6835 95% |
| Média Total (Programa/Configurações) | 72% /
87% | -116% /
-120% | 17% /
7% | -22% /
-38% |
* ... menor é melhor
Diretamente fora da caixa, o display já mostra uma grande reprodução de cores: Com um desvio de 1,54, ele está dentro de uma faixa aceitável (DeltaE < 3). A calibração reduz o número para 1,21 e ajuda a exibir os tons de cinza de forma mais uniforme.
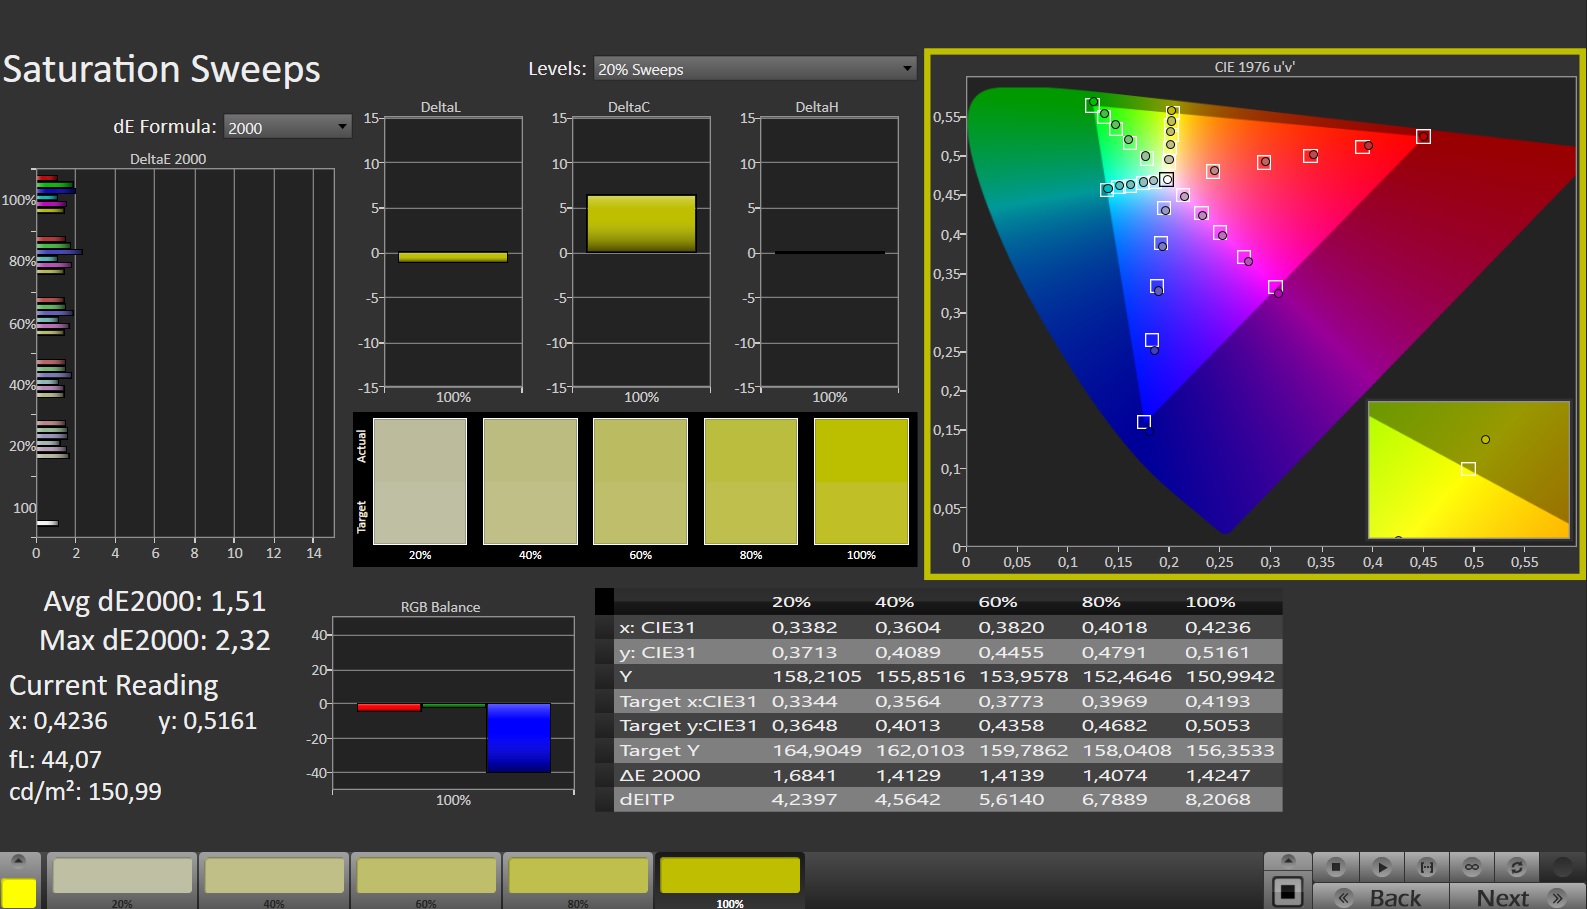
A tela pode representar quase todo o espaço de cor sRGB - mas não os espaços de cor AdobeRGB e DCI-P3. Isto significa que a maioria dos concorrentes faz um trabalho um pouco melhor com isto.

Exibir tempos de resposta
| ↔ Tempo de resposta preto para branco | ||
|---|---|---|
| 9.4 ms ... ascensão ↗ e queda ↘ combinadas | ↗ 4.9 ms ascensão | 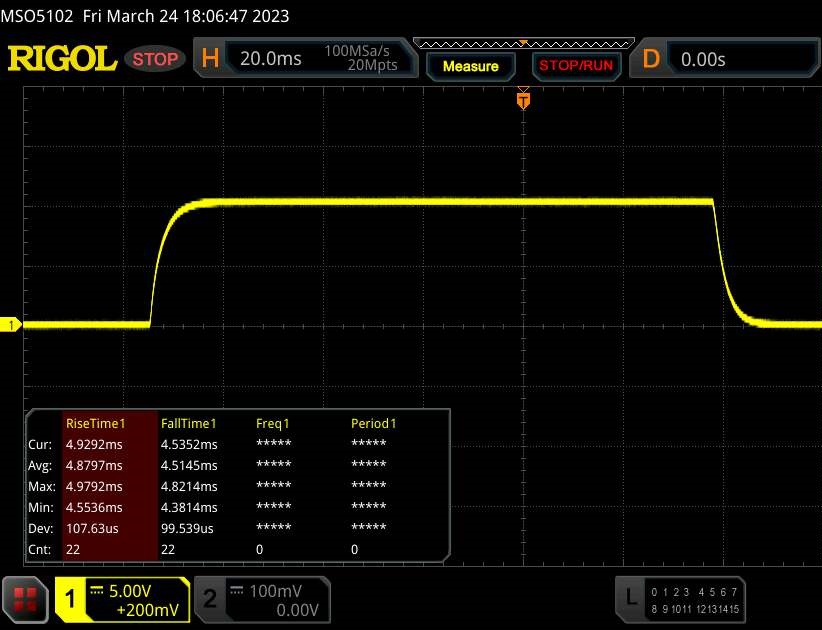 |
| ↘ 4.5 ms queda | ||
| A tela mostra taxas de resposta rápidas em nossos testes e deve ser adequada para jogos. Em comparação, todos os dispositivos testados variam de 0.1 (mínimo) a 240 (máximo) ms. » 26 % de todos os dispositivos são melhores. Isso significa que o tempo de resposta medido é melhor que a média de todos os dispositivos testados (19.8 ms). | ||
| ↔ Tempo de resposta 50% cinza a 80% cinza | ||
| 12.4 ms ... ascensão ↗ e queda ↘ combinadas | ↗ 6 ms ascensão | 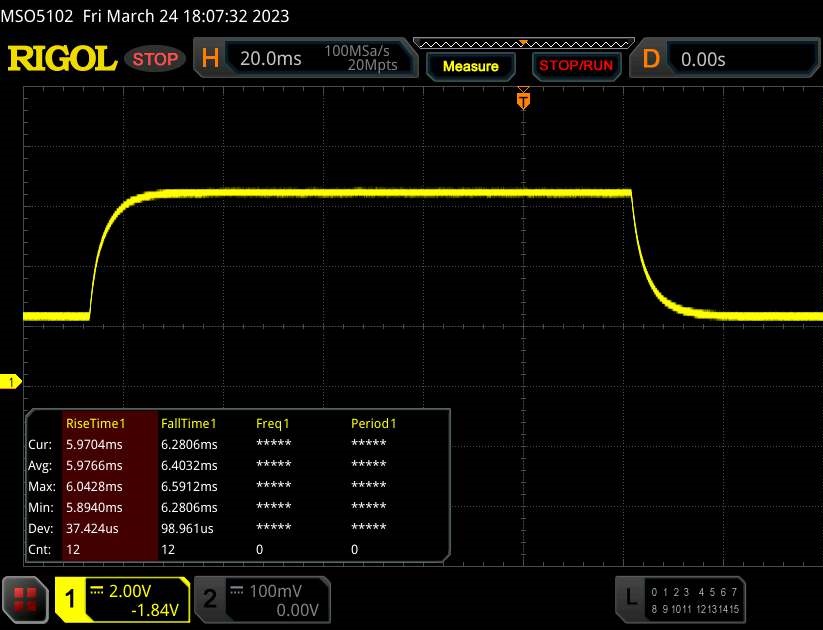 |
| ↘ 6.4 ms queda | ||
| A tela mostra boas taxas de resposta em nossos testes, mas pode ser muito lenta para jogadores competitivos. Em comparação, todos os dispositivos testados variam de 0.165 (mínimo) a 636 (máximo) ms. » 26 % de todos os dispositivos são melhores. Isso significa que o tempo de resposta medido é melhor que a média de todos os dispositivos testados (31 ms). | ||
Cintilação da tela / PWM (modulação por largura de pulso)
| Tela tremeluzindo / PWM não detectado | 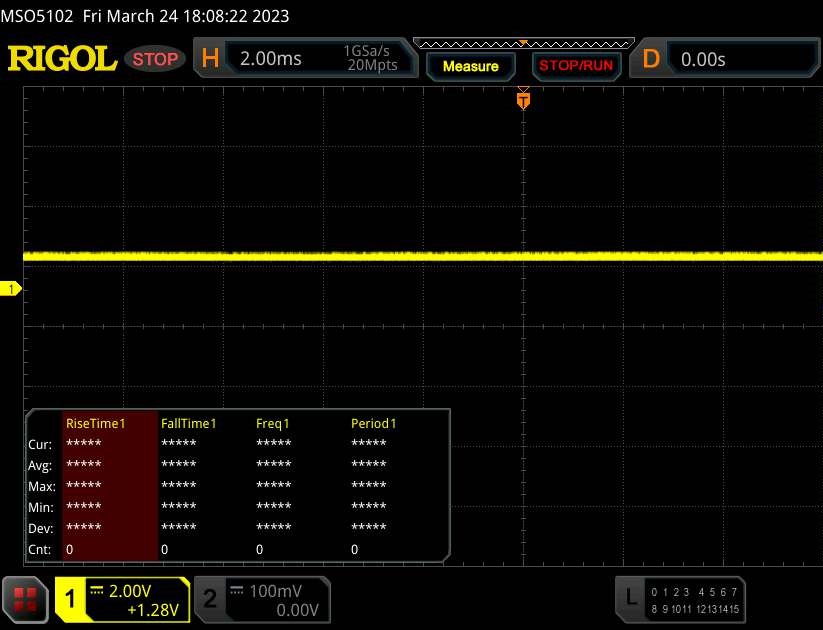 | ||
[pwm_comparison] Em comparação: 52 % de todos os dispositivos testados não usam PWM para escurecer a tela. Se PWM foi detectado, uma média de 7757 (mínimo: 5 - máximo: 343500) Hz foi medida. | |||
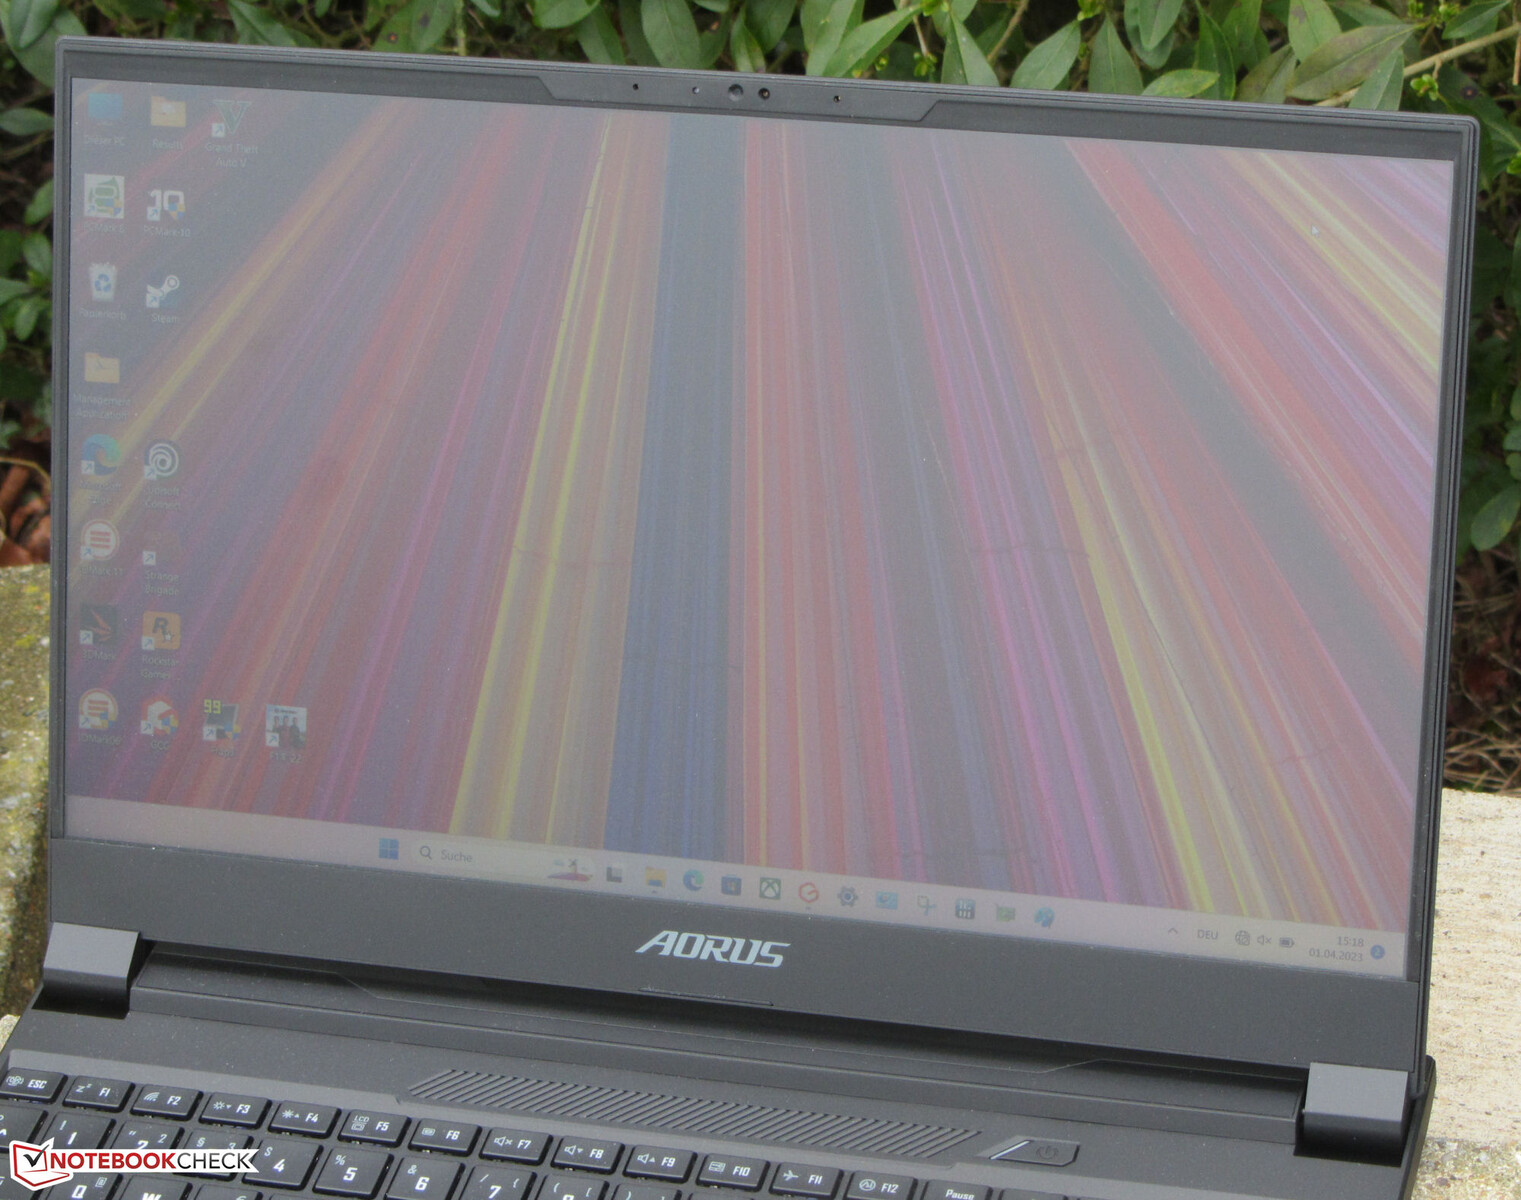
O painel IPS estável em ângulo de visão pode ser visto de todas as posições. No exterior, o visor é visível principalmente, desde que o sol não esteja brilhando muito.

Desempenho
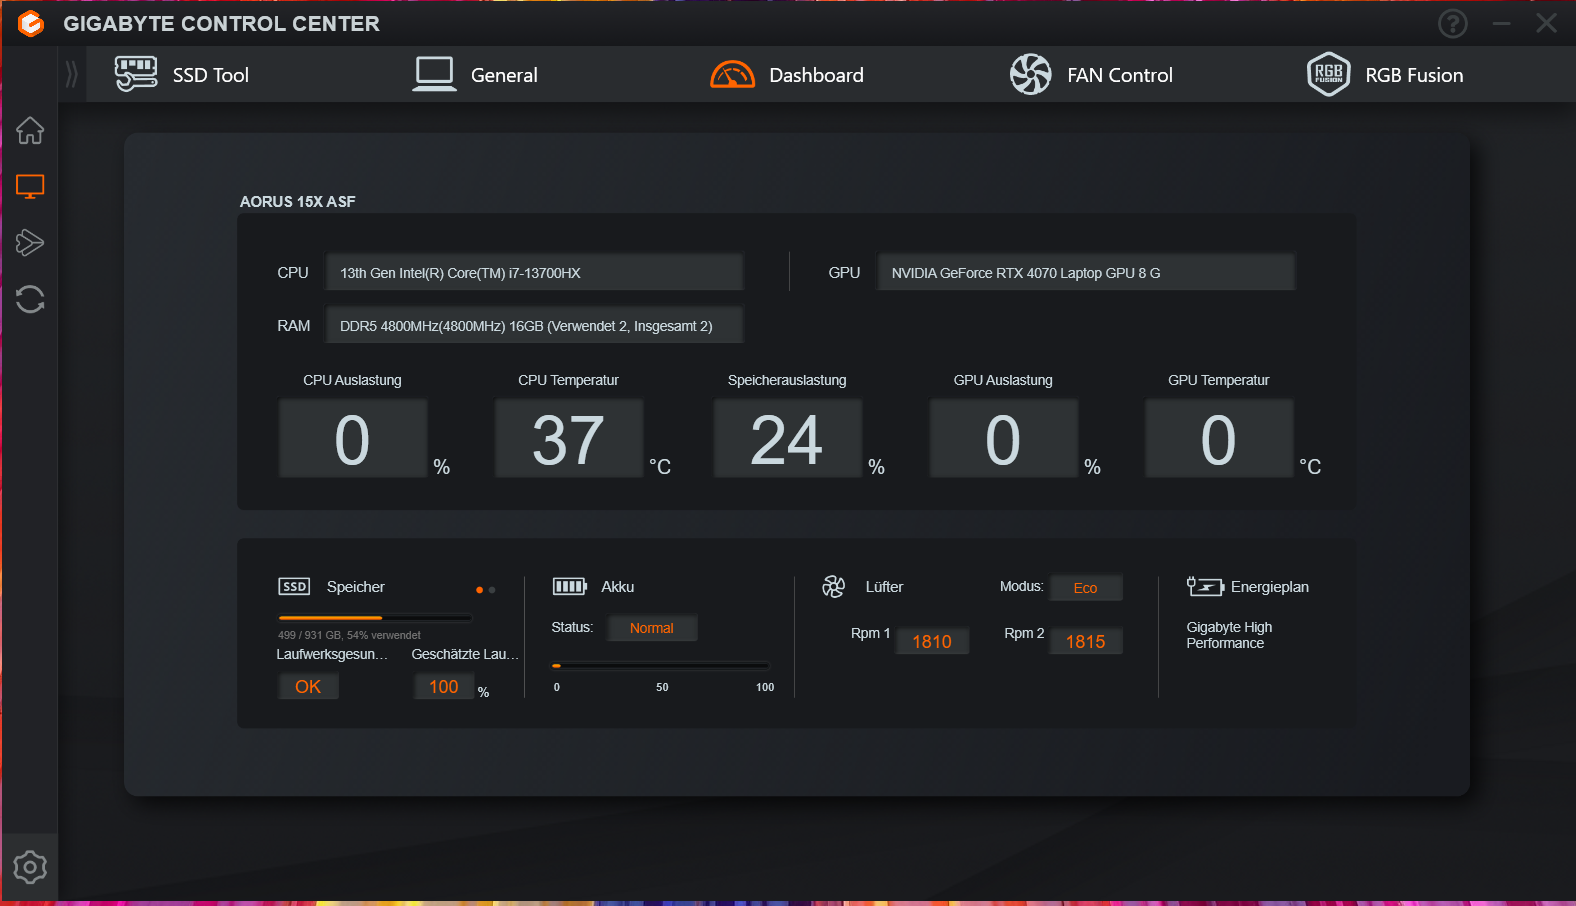
O Aorus 15X é classificado como um poderoso laptop para jogos - mas não está limitado apenas a esta área. Seu bom desempenho é possível graças ao Raptor Lake e à Ada Lovelace. O dispositivo de teste apresentado pode ser adquirido por cerca de US$ 2.099.
Condições de teste
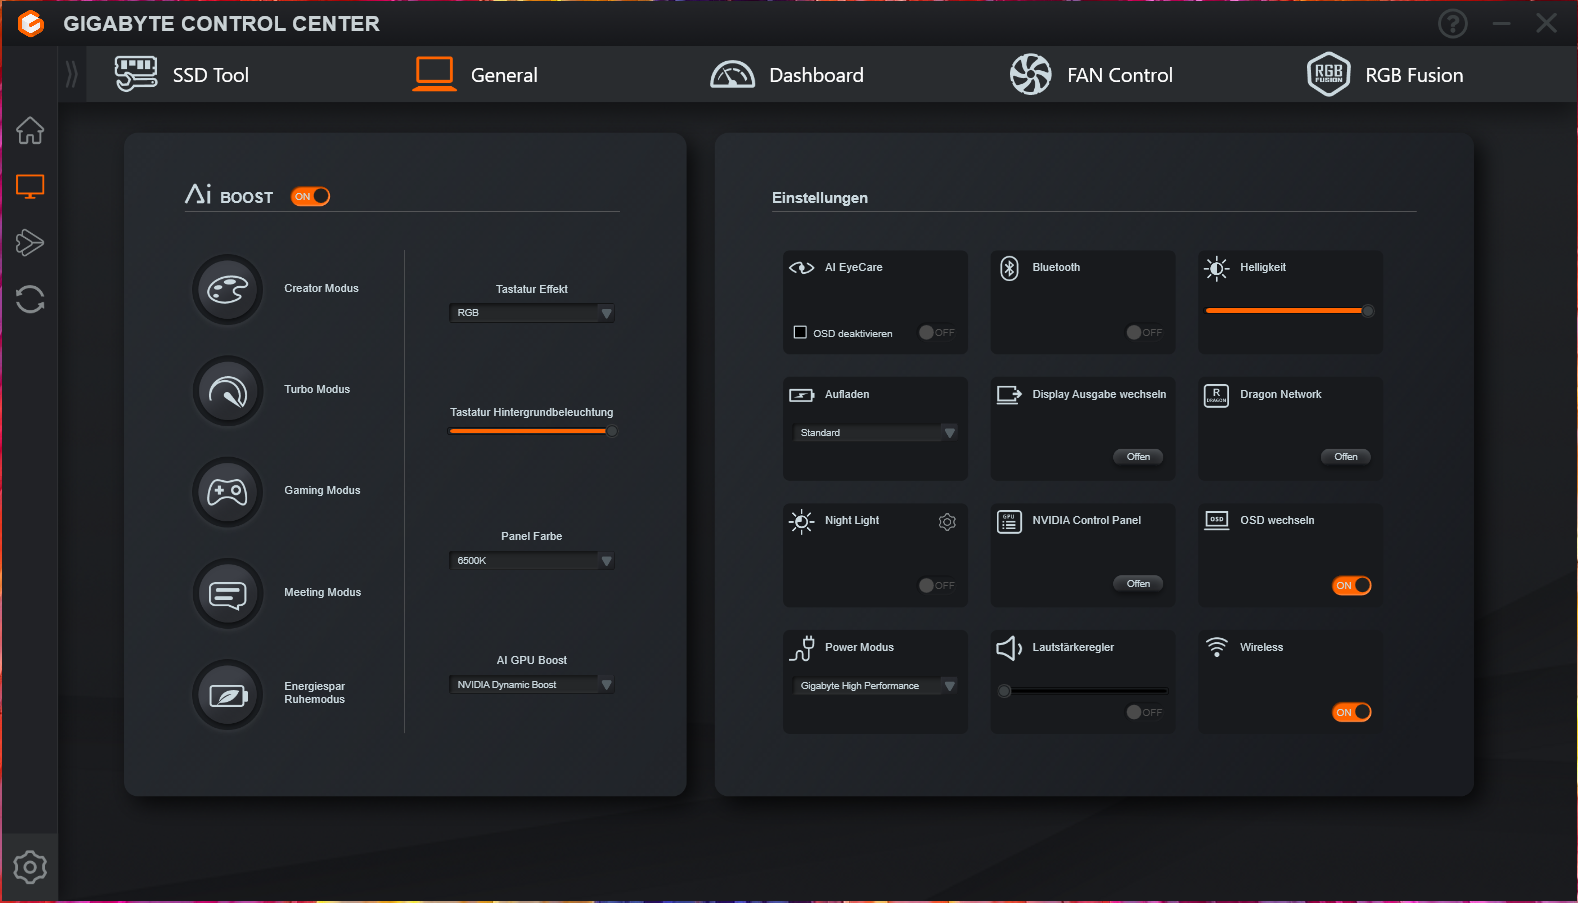
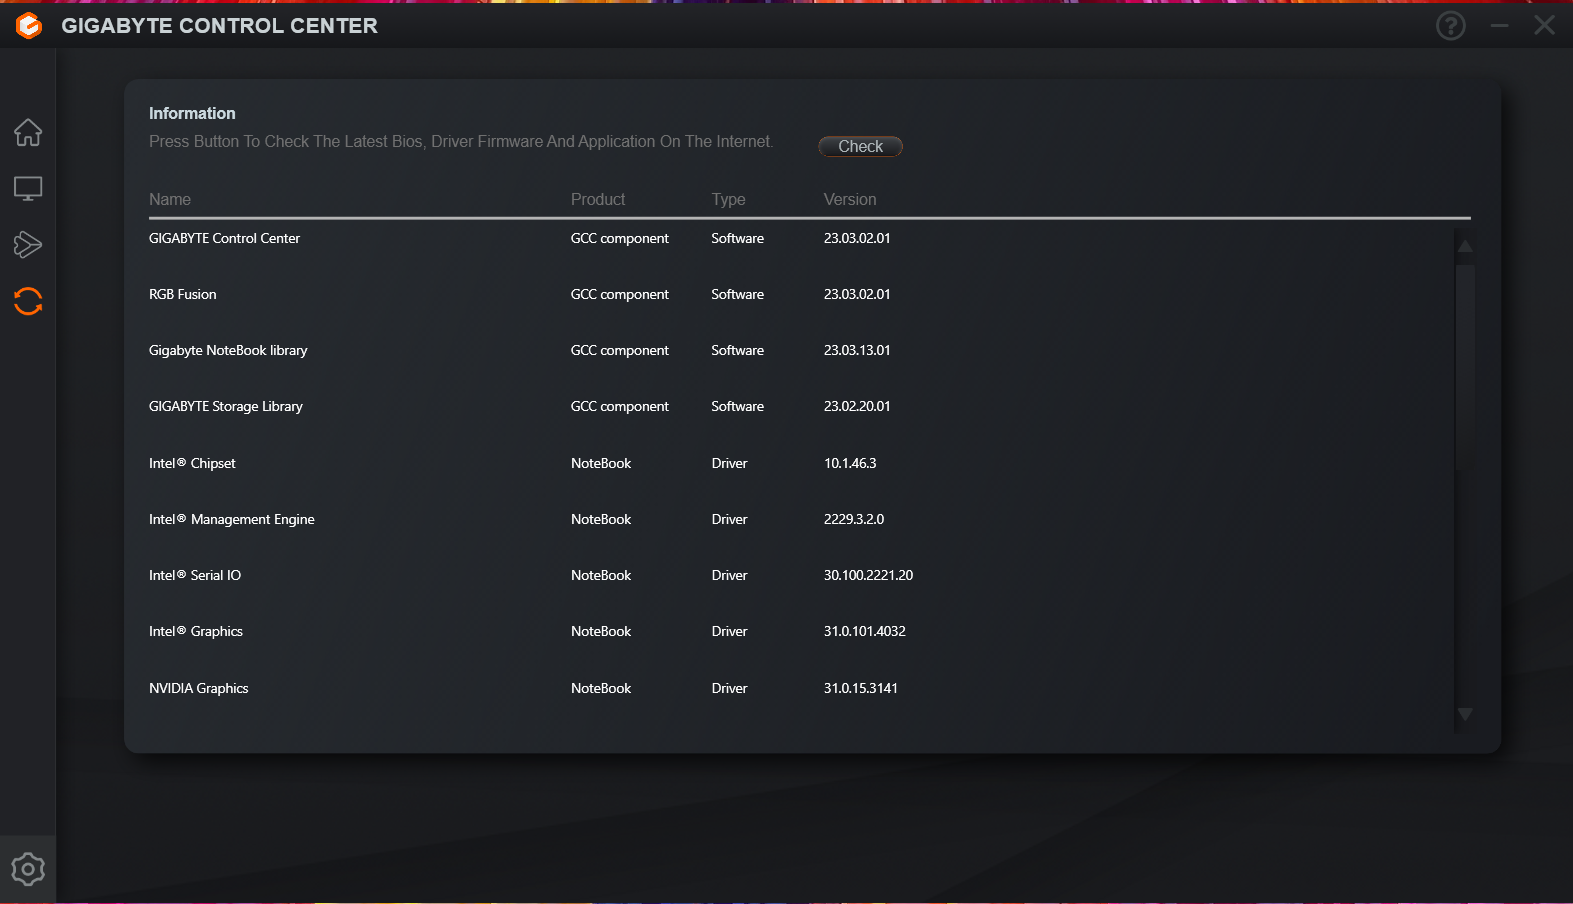
O centro de controle do computador (Gigabyte Control Center) tem todos os modos de desempenho usuais (ver tabela) e uma função de reforço de IA superior, que nós usamos. Isto significou que o centro de controle escolheu o perfil mais adequado - "modo de jogo" e "modo criador" para os benchmarks e "modo ocioso com economia de energia" para os testes de bateria.
o "modo Turbo" pode, em certos casos, proporcionar um desempenho ligeiramente melhor - mas isto tem um preço: Os ventiladores estão constantemente trabalhando em potência máxima. Você pode alcançar os níveis de trabalho mais silenciosos - perto do silêncio total - usando o "modo reunião". Aqui, o desempenho de um fio, que é mais importante para o uso diário, diminui em menor grau do que o desempenho de vários fios. Até mesmo o jogo seria possível em configurações reduzidas.
| Modo criador | Modo turbo | Modo de jogo | Modo de reunião | Modo ocioso de economia de energia | |
|---|---|---|---|---|---|
| Limite de potência 1 | 70 watts | 70 watts | 55 watts | 15 watts | 15 watts |
| Limite de potência 2 | 157 watts | 157 watts | 157 watts | 30 watts | 30 watts |
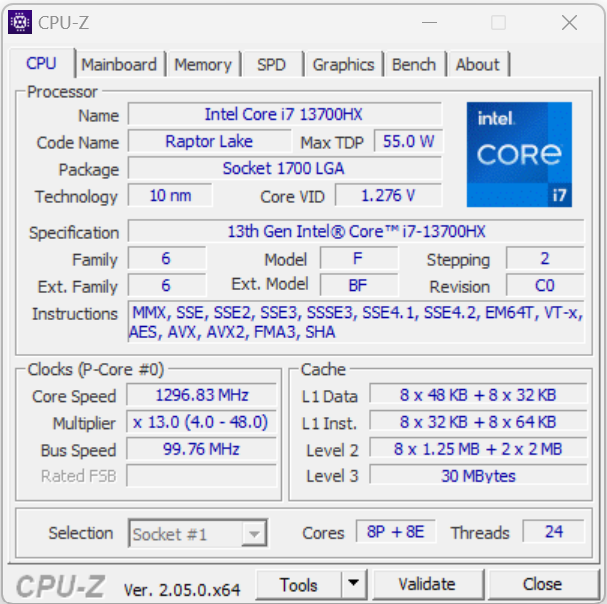
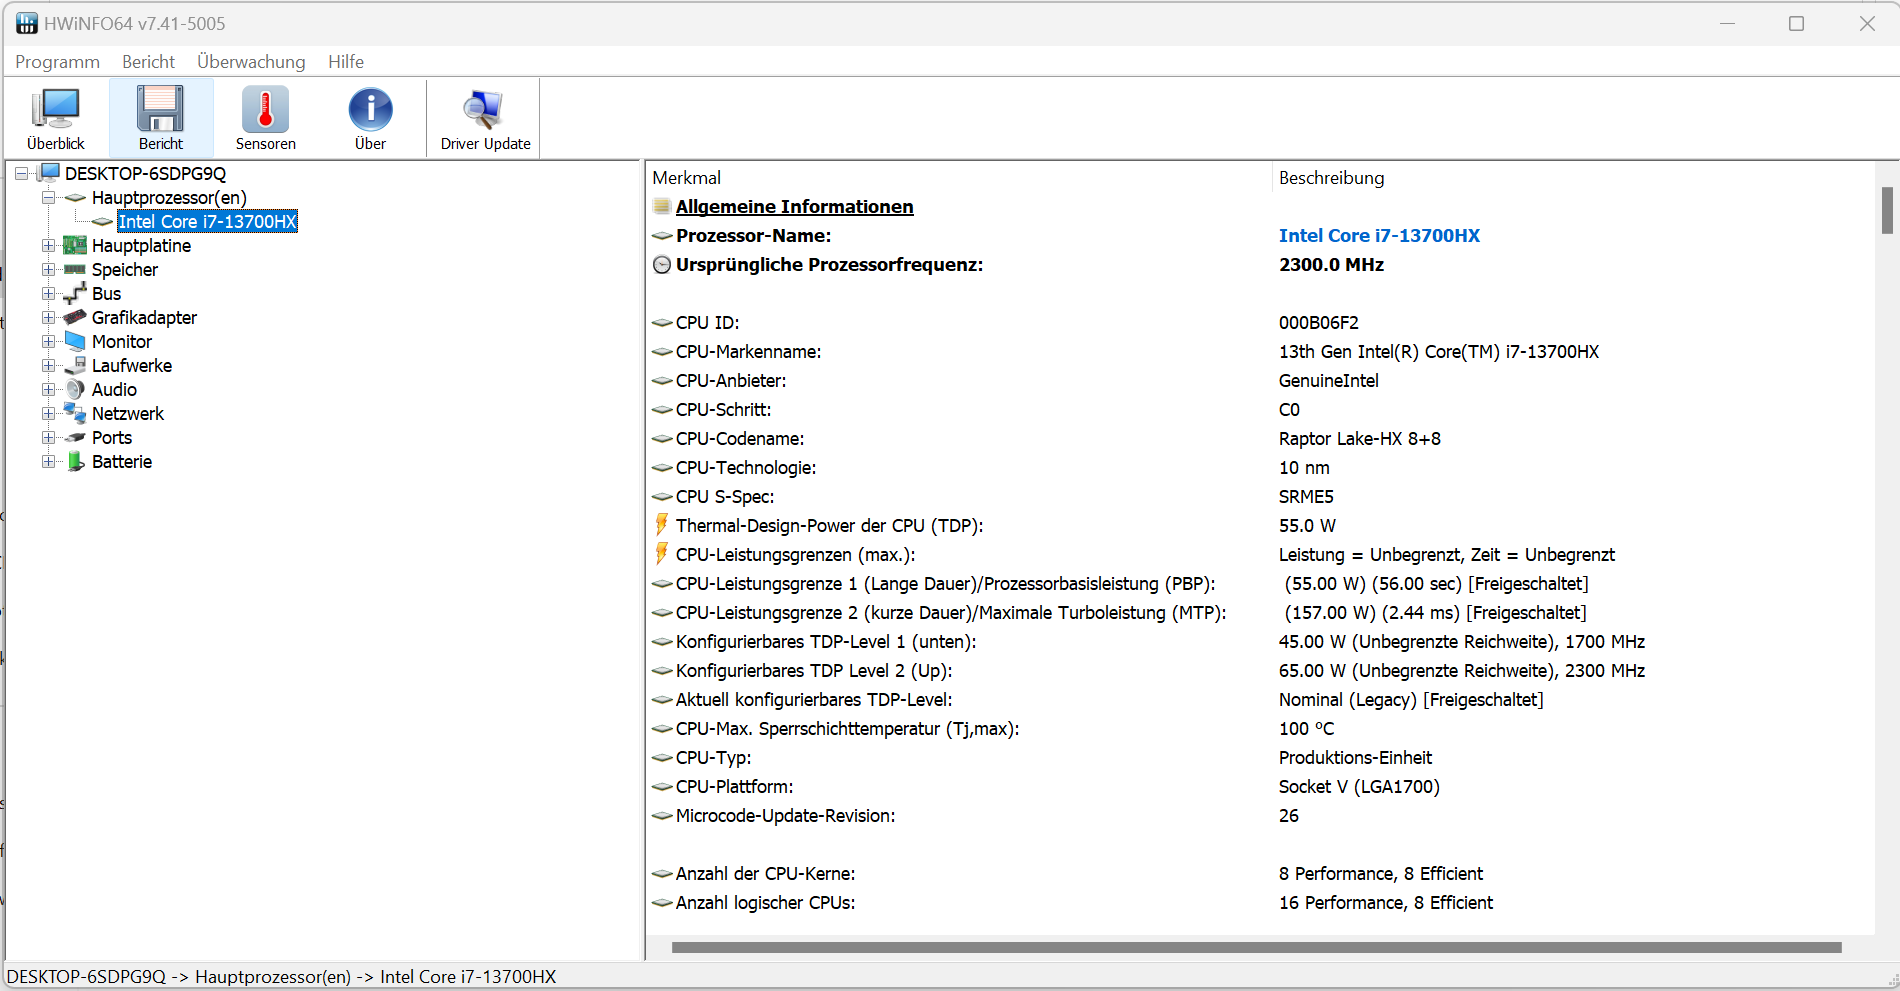
Processador
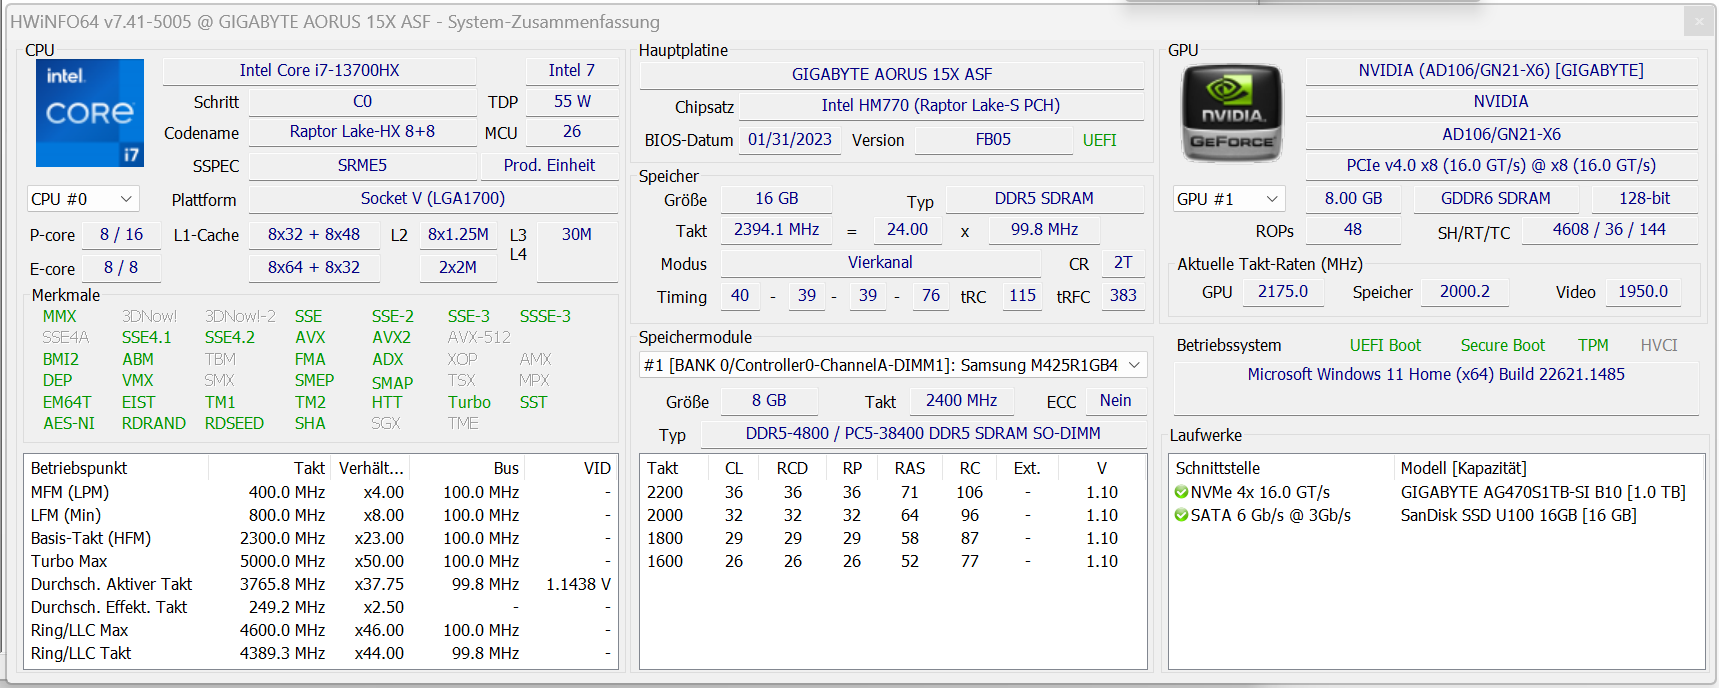
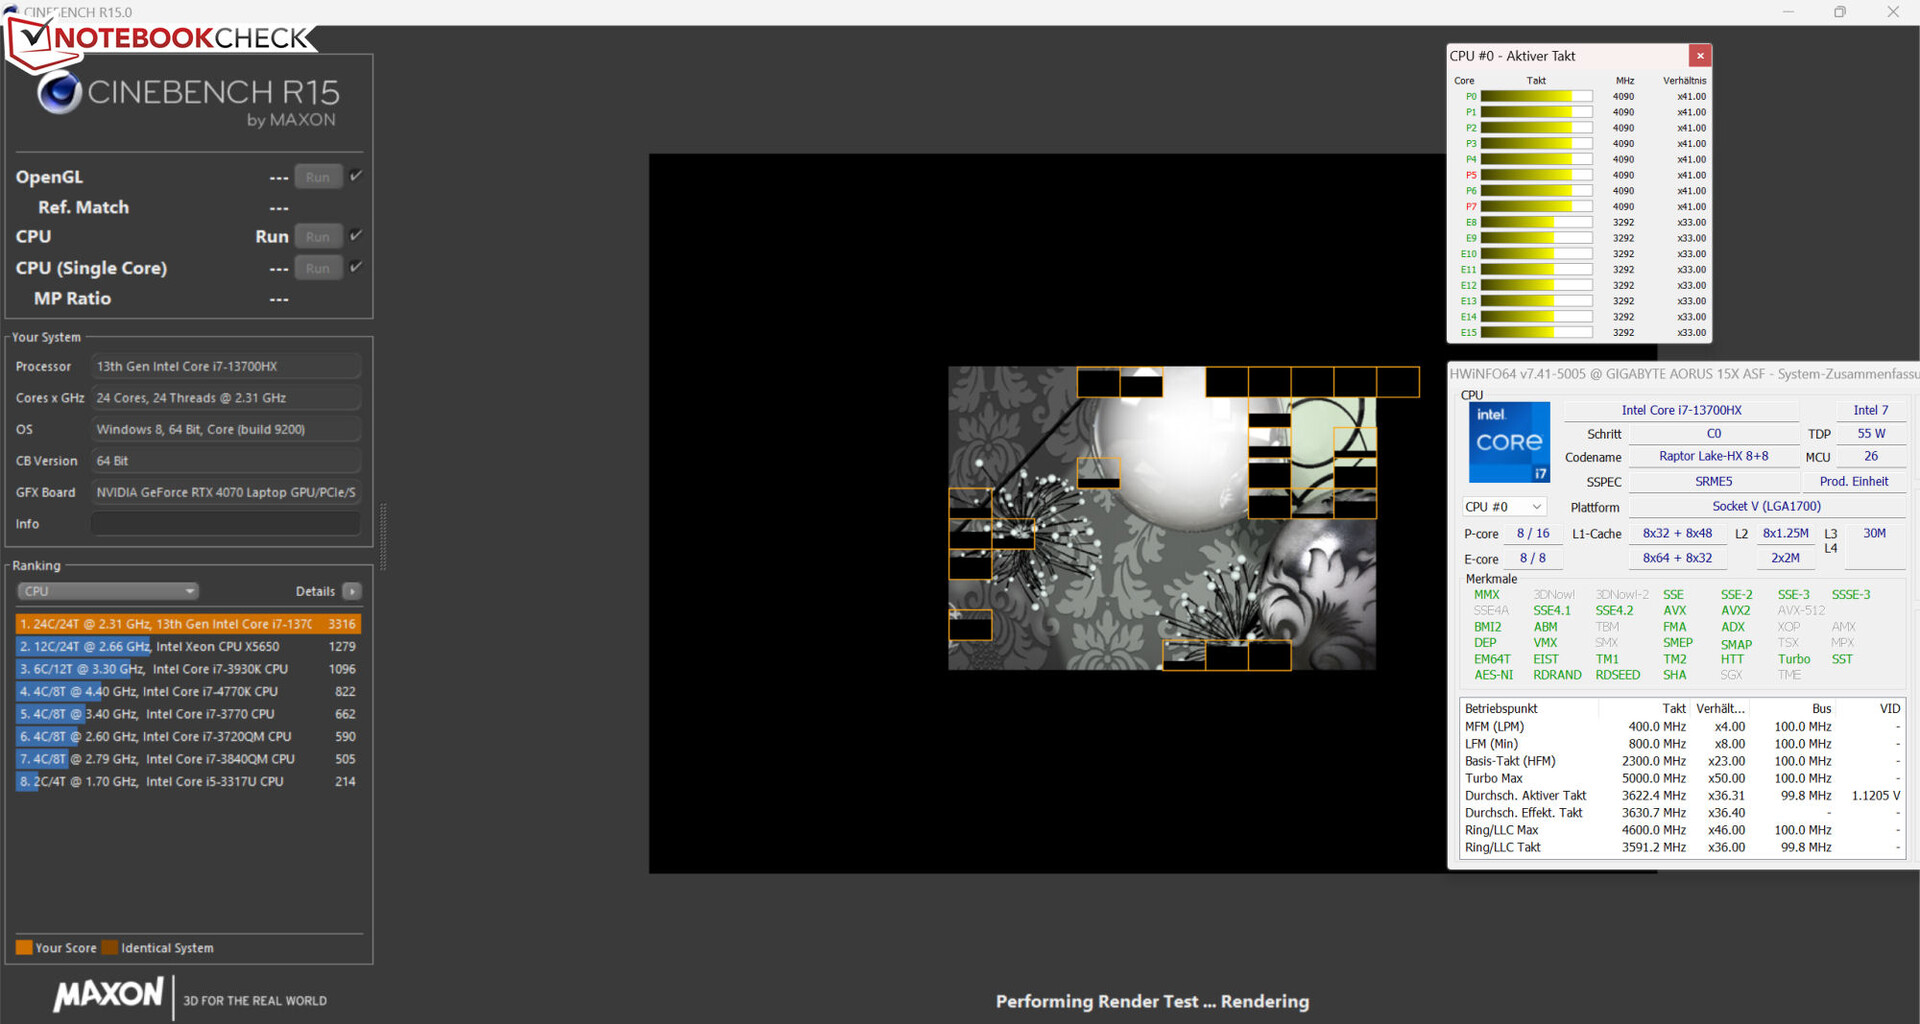
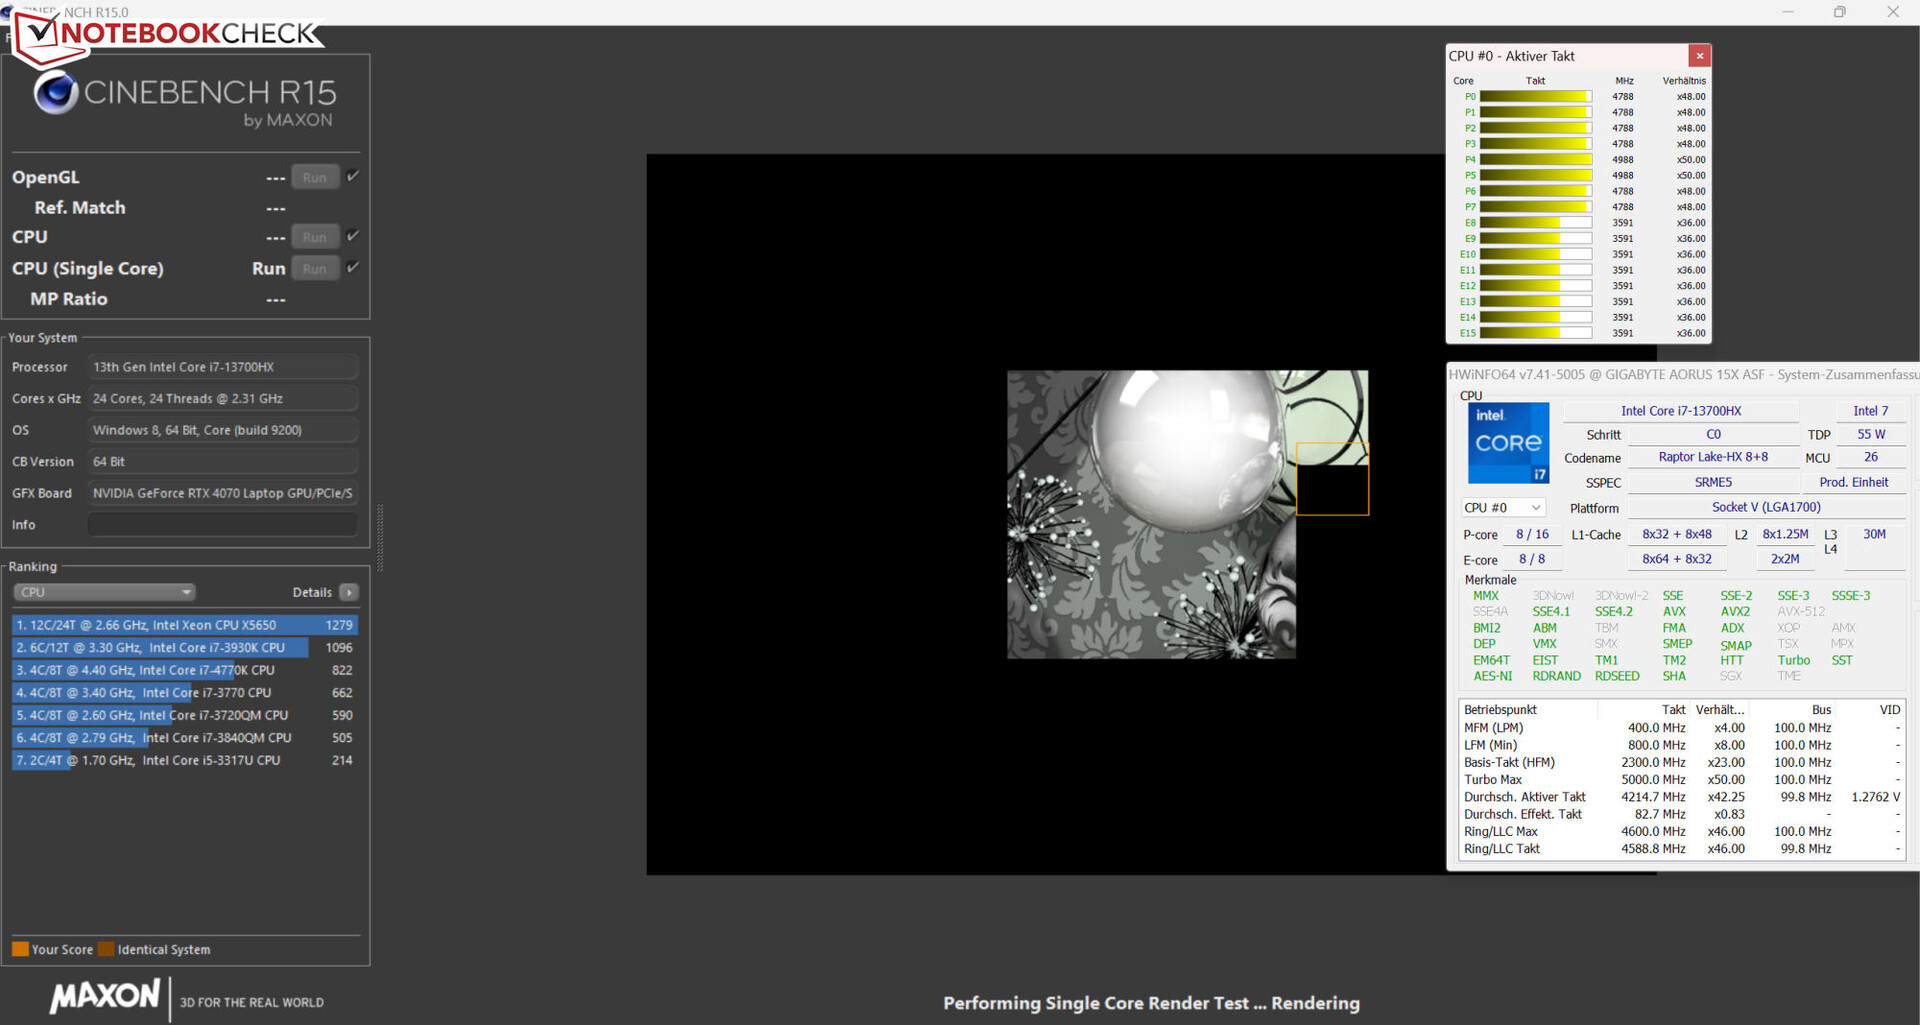
SeuCore-i7-13700HX (Raptor Lake) consiste em 8 núcleos de eficiência (sem hiperfiação, 1,5 a 3,7 GHz) e 8 núcleos de desempenho (hiperfiação, 2,1 a 5 GHz). No total, isto soma 24 núcleos de CPU logísticos. Os benchmarks fornecem resultados no mesmo nível da média determinada da CPU.
Os testes de CPU do benchmark Cinebench R15 foram executados com altas (multi-fios) ou altas a máximas (single-thread) taxas de relógio enquanto conectado à rede elétrica. Usando a bateria, estas taxas caíram - significativamente mais sob carga de rosca única do que sob carga de rosca múltipla.
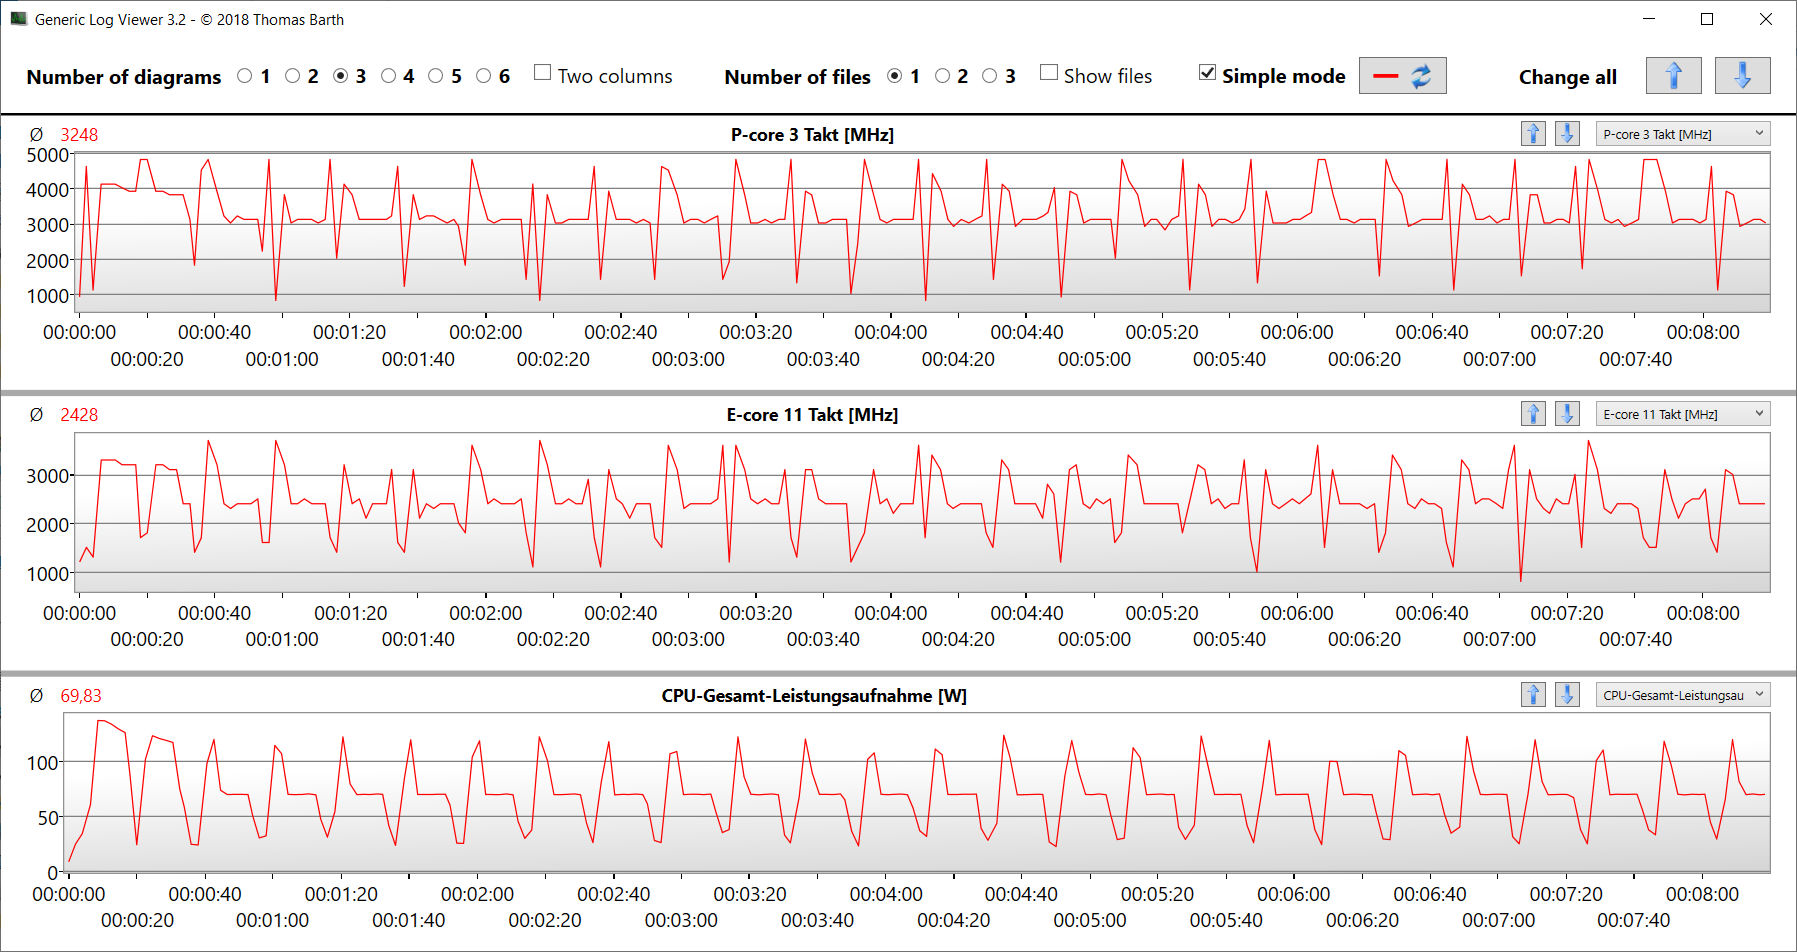
O teste de loop CB15 mostrou: O turbo da CPU foi utilizado e a carga multi-tarefa contínua fez com que as taxas de clock caíssem ligeiramente da primeira para a terceira corrida.
Cinebench R15 Multi Loop test

* ... menor é melhor
AIDA64: FP32 Ray-Trace | FPU Julia | CPU SHA3 | CPU Queen | FPU SinJulia | FPU Mandel | CPU AES | CPU ZLib | FP64 Ray-Trace | CPU PhotoWorxx
| Performance rating | |
| Asus ROG Strix G17 G713PI | |
| Média da turma Gaming | |
| Média Intel Core i7-13700HX | |
| Aorus 15X ASF | |
| Acer Predator Helios 300 (i7-12700H, RTX 3070 Ti) | |
| Razer Blade 15 OLED (Early 2022) | |
| MSI Katana 17 B13VFK | |
| AIDA64 / FP32 Ray-Trace | |
| Asus ROG Strix G17 G713PI | |
| Média da turma Gaming (10227 - 85542, n=105, últimos 2 anos) | |
| Média Intel Core i7-13700HX (14261 - 21999, n=11) | |
| Acer Predator Helios 300 (i7-12700H, RTX 3070 Ti) | |
| Aorus 15X ASF | |
| MSI Katana 17 B13VFK | |
| Razer Blade 15 OLED (Early 2022) | |
| AIDA64 / FPU Julia | |
| Asus ROG Strix G17 G713PI | |
| Média da turma Gaming (51376 - 238426, n=105, últimos 2 anos) | |
| Média Intel Core i7-13700HX (74636 - 109364, n=11) | |
| Acer Predator Helios 300 (i7-12700H, RTX 3070 Ti) | |
| Aorus 15X ASF | |
| Razer Blade 15 OLED (Early 2022) | |
| MSI Katana 17 B13VFK | |
| AIDA64 / CPU SHA3 | |
| Asus ROG Strix G17 G713PI | |
| Média da turma Gaming (2180 - 10115, n=105, últimos 2 anos) | |
| Média Intel Core i7-13700HX (3359 - 5053, n=11) | |
| Acer Predator Helios 300 (i7-12700H, RTX 3070 Ti) | |
| Aorus 15X ASF | |
| Razer Blade 15 OLED (Early 2022) | |
| MSI Katana 17 B13VFK | |
| AIDA64 / CPU Queen | |
| Asus ROG Strix G17 G713PI | |
| Média da turma Gaming (49785 - 173351, n=90, últimos 2 anos) | |
| Aorus 15X ASF | |
| Média Intel Core i7-13700HX (86532 - 114717, n=11) | |
| Razer Blade 15 OLED (Early 2022) | |
| Acer Predator Helios 300 (i7-12700H, RTX 3070 Ti) | |
| MSI Katana 17 B13VFK | |
| AIDA64 / FPU SinJulia | |
| Asus ROG Strix G17 G713PI | |
| Média da turma Gaming (4424 - 33636, n=105, últimos 2 anos) | |
| Média Intel Core i7-13700HX (9290 - 13519, n=11) | |
| Aorus 15X ASF | |
| Acer Predator Helios 300 (i7-12700H, RTX 3070 Ti) | |
| Razer Blade 15 OLED (Early 2022) | |
| MSI Katana 17 B13VFK | |
| AIDA64 / FPU Mandel | |
| Asus ROG Strix G17 G713PI | |
| Média da turma Gaming (25115 - 128721, n=105, últimos 2 anos) | |
| Média Intel Core i7-13700HX (35751 - 53484, n=11) | |
| Acer Predator Helios 300 (i7-12700H, RTX 3070 Ti) | |
| Aorus 15X ASF | |
| Razer Blade 15 OLED (Early 2022) | |
| MSI Katana 17 B13VFK | |
| AIDA64 / CPU AES | |
| Asus ROG Strix G17 G713PI | |
| Aorus 15X ASF | |
| Média Intel Core i7-13700HX (67846 - 182575, n=11) | |
| Média da turma Gaming (39258 - 247074, n=105, últimos 2 anos) | |
| Razer Blade 15 OLED (Early 2022) | |
| Acer Predator Helios 300 (i7-12700H, RTX 3070 Ti) | |
| MSI Katana 17 B13VFK | |
| AIDA64 / CPU ZLib | |
| Asus ROG Strix G17 G713PI | |
| Média da turma Gaming (574 - 2531, n=105, últimos 2 anos) | |
| Média Intel Core i7-13700HX (981 - 1451, n=11) | |
| Acer Predator Helios 300 (i7-12700H, RTX 3070 Ti) | |
| Aorus 15X ASF | |
| Razer Blade 15 OLED (Early 2022) | |
| MSI Katana 17 B13VFK | |
| AIDA64 / FP64 Ray-Trace | |
| Asus ROG Strix G17 G713PI | |
| Média da turma Gaming (5509 - 45446, n=105, últimos 2 anos) | |
| Média Intel Core i7-13700HX (7728 - 11837, n=11) | |
| Acer Predator Helios 300 (i7-12700H, RTX 3070 Ti) | |
| Aorus 15X ASF | |
| MSI Katana 17 B13VFK | |
| Razer Blade 15 OLED (Early 2022) | |
| AIDA64 / CPU PhotoWorxx | |
| Média da turma Gaming (12271 - 89891, n=105, últimos 2 anos) | |
| Acer Predator Helios 300 (i7-12700H, RTX 3070 Ti) | |
| Aorus 15X ASF | |
| Média Intel Core i7-13700HX (19678 - 42415, n=11) | |
| Razer Blade 15 OLED (Early 2022) | |
| Razer Blade 15 OLED (Early 2022) | |
| MSI Katana 17 B13VFK | |
| Asus ROG Strix G17 G713PI | |
Desempenho do sistema
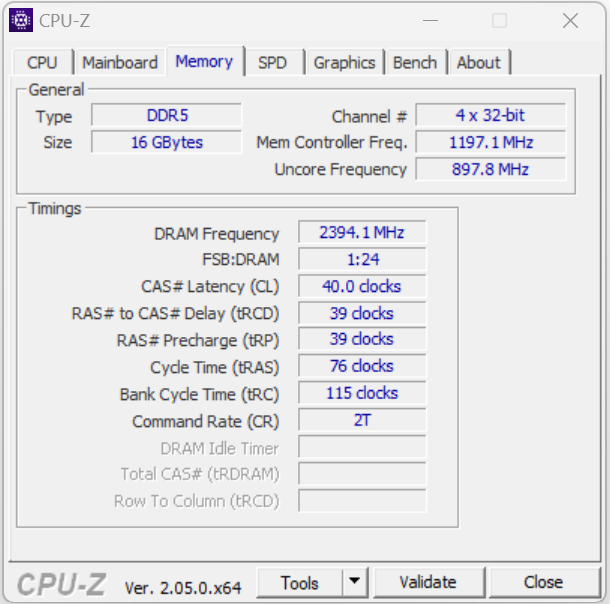
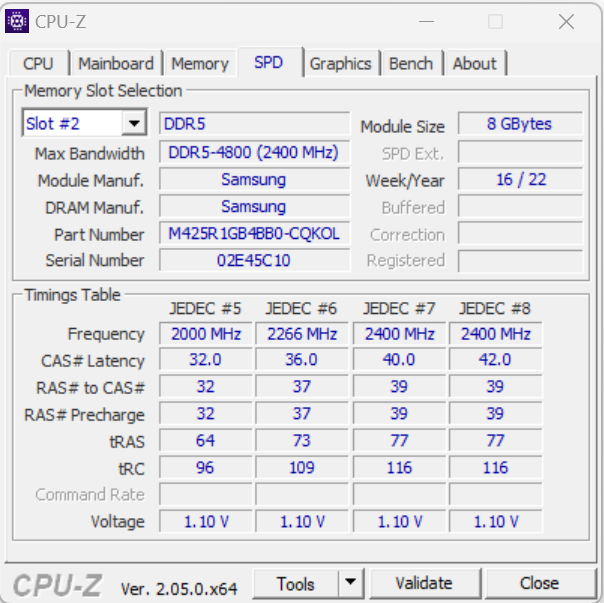
A folha de especificações já revela: 15X usuários não têm que se preocupar com a falta de desempenho. O sistema em bom funcionamento está bem preparado para tarefas exigentes, como renderização ou jogos - os bons resultados da PCMark confirmam isto. As taxas de transferência de RAM não mostram nada de anormal e estão em um nível normal para DDR5-4800 RAM.
CrossMark: Overall | Productivity | Creativity | Responsiveness
| PCMark 10 / Score | |
| Média da turma Gaming (5828 - 12414, n=93, últimos 2 anos) | |
| Acer Predator Helios 300 (i7-12700H, RTX 3070 Ti) | |
| Média Intel Core i7-13700HX, NVIDIA GeForce RTX 4070 Laptop GPU (7178 - 8486, n=4) | |
| Asus ROG Strix G17 G713PI | |
| Razer Blade 15 OLED (Early 2022) | |
| Aorus 15X ASF | |
| MSI Katana 17 B13VFK | |
| PCMark 10 / Essentials | |
| Asus ROG Strix G17 G713PI | |
| MSI Katana 17 B13VFK | |
| Aorus 15X ASF | |
| Acer Predator Helios 300 (i7-12700H, RTX 3070 Ti) | |
| Média da turma Gaming (8810 - 11935, n=97, últimos 2 anos) | |
| Média Intel Core i7-13700HX, NVIDIA GeForce RTX 4070 Laptop GPU (9679 - 11652, n=4) | |
| Razer Blade 15 OLED (Early 2022) | |
| PCMark 10 / Productivity | |
| Média da turma Gaming (6845 - 25323, n=95, últimos 2 anos) | |
| Asus ROG Strix G17 G713PI | |
| Razer Blade 15 OLED (Early 2022) | |
| Acer Predator Helios 300 (i7-12700H, RTX 3070 Ti) | |
| Média Intel Core i7-13700HX, NVIDIA GeForce RTX 4070 Laptop GPU (9236 - 10517, n=4) | |
| Aorus 15X ASF | |
| MSI Katana 17 B13VFK | |
| PCMark 10 / Digital Content Creation | |
| Média da turma Gaming (7602 - 19954, n=95, últimos 2 anos) | |
| Acer Predator Helios 300 (i7-12700H, RTX 3070 Ti) | |
| Média Intel Core i7-13700HX, NVIDIA GeForce RTX 4070 Laptop GPU (9731 - 13534, n=4) | |
| Razer Blade 15 OLED (Early 2022) | |
| MSI Katana 17 B13VFK | |
| Aorus 15X ASF | |
| Asus ROG Strix G17 G713PI | |
| CrossMark / Overall | |
| Aorus 15X ASF | |
| Asus ROG Strix G17 G713PI | |
| Média da turma Gaming (1366 - 2409, n=94, últimos 2 anos) | |
| Média Intel Core i7-13700HX, NVIDIA GeForce RTX 4070 Laptop GPU (1756 - 2065, n=3) | |
| Acer Predator Helios 300 (i7-12700H, RTX 3070 Ti) | |
| MSI Katana 17 B13VFK | |
| Razer Blade 15 OLED (Early 2022) | |
| CrossMark / Productivity | |
| Aorus 15X ASF | |
| Asus ROG Strix G17 G713PI | |
| Média da turma Gaming (1386 - 2254, n=94, últimos 2 anos) | |
| Média Intel Core i7-13700HX, NVIDIA GeForce RTX 4070 Laptop GPU (1731 - 1960, n=3) | |
| Acer Predator Helios 300 (i7-12700H, RTX 3070 Ti) | |
| MSI Katana 17 B13VFK | |
| Razer Blade 15 OLED (Early 2022) | |
| CrossMark / Creativity | |
| Asus ROG Strix G17 G713PI | |
| Média da turma Gaming (1343 - 2786, n=94, últimos 2 anos) | |
| Aorus 15X ASF | |
| Acer Predator Helios 300 (i7-12700H, RTX 3070 Ti) | |
| Média Intel Core i7-13700HX, NVIDIA GeForce RTX 4070 Laptop GPU (1797 - 2193, n=3) | |
| MSI Katana 17 B13VFK | |
| Razer Blade 15 OLED (Early 2022) | |
| CrossMark / Responsiveness | |
| Aorus 15X ASF | |
| Média Intel Core i7-13700HX, NVIDIA GeForce RTX 4070 Laptop GPU (1708 - 2016, n=3) | |
| MSI Katana 17 B13VFK | |
| Acer Predator Helios 300 (i7-12700H, RTX 3070 Ti) | |
| Média da turma Gaming (1226 - 2334, n=94, últimos 2 anos) | |
| Asus ROG Strix G17 G713PI | |
| Razer Blade 15 OLED (Early 2022) | |
| PCMark 8 Home Score Accelerated v2 | 4764 pontos | |
| PCMark 8 Work Score Accelerated v2 | 5976 pontos | |
| PCMark 10 Score | 7178 pontos | |
Ajuda | ||
| AIDA64 / Memory Copy | |
| Média da turma Gaming (21750 - 129946, n=105, últimos 2 anos) | |
| Aorus 15X ASF | |
| Acer Predator Helios 300 (i7-12700H, RTX 3070 Ti) | |
| Razer Blade 15 OLED (Early 2022) | |
| Média Intel Core i7-13700HX (36125 - 63990, n=11) | |
| MSI Katana 17 B13VFK | |
| Asus ROG Strix G17 G713PI | |
| AIDA64 / Memory Read | |
| Média da turma Gaming (22956 - 118858, n=105, últimos 2 anos) | |
| Aorus 15X ASF | |
| MSI Katana 17 B13VFK | |
| Razer Blade 15 OLED (Early 2022) | |
| Média Intel Core i7-13700HX (36510 - 69729, n=11) | |
| Asus ROG Strix G17 G713PI | |
| Acer Predator Helios 300 (i7-12700H, RTX 3070 Ti) | |
| AIDA64 / Memory Write | |
| Média da turma Gaming (22297 - 135096, n=105, últimos 2 anos) | |
| Média Intel Core i7-13700HX (33598 - 85675, n=11) | |
| Asus ROG Strix G17 G713PI | |
| Razer Blade 15 OLED (Early 2022) | |
| Acer Predator Helios 300 (i7-12700H, RTX 3070 Ti) | |
| Aorus 15X ASF | |
| MSI Katana 17 B13VFK | |
| AIDA64 / Memory Latency | |
| Média da turma Gaming (75.3 - 259, n=105, últimos 2 anos) | |
| MSI Katana 17 B13VFK | |
| Razer Blade 15 OLED (Early 2022) | |
| Acer Predator Helios 300 (i7-12700H, RTX 3070 Ti) | |
| Média Intel Core i7-13700HX (81.5 - 97.9, n=11) | |
| Asus ROG Strix G17 G713PI | |
| Aorus 15X ASF | |
* ... menor é melhor
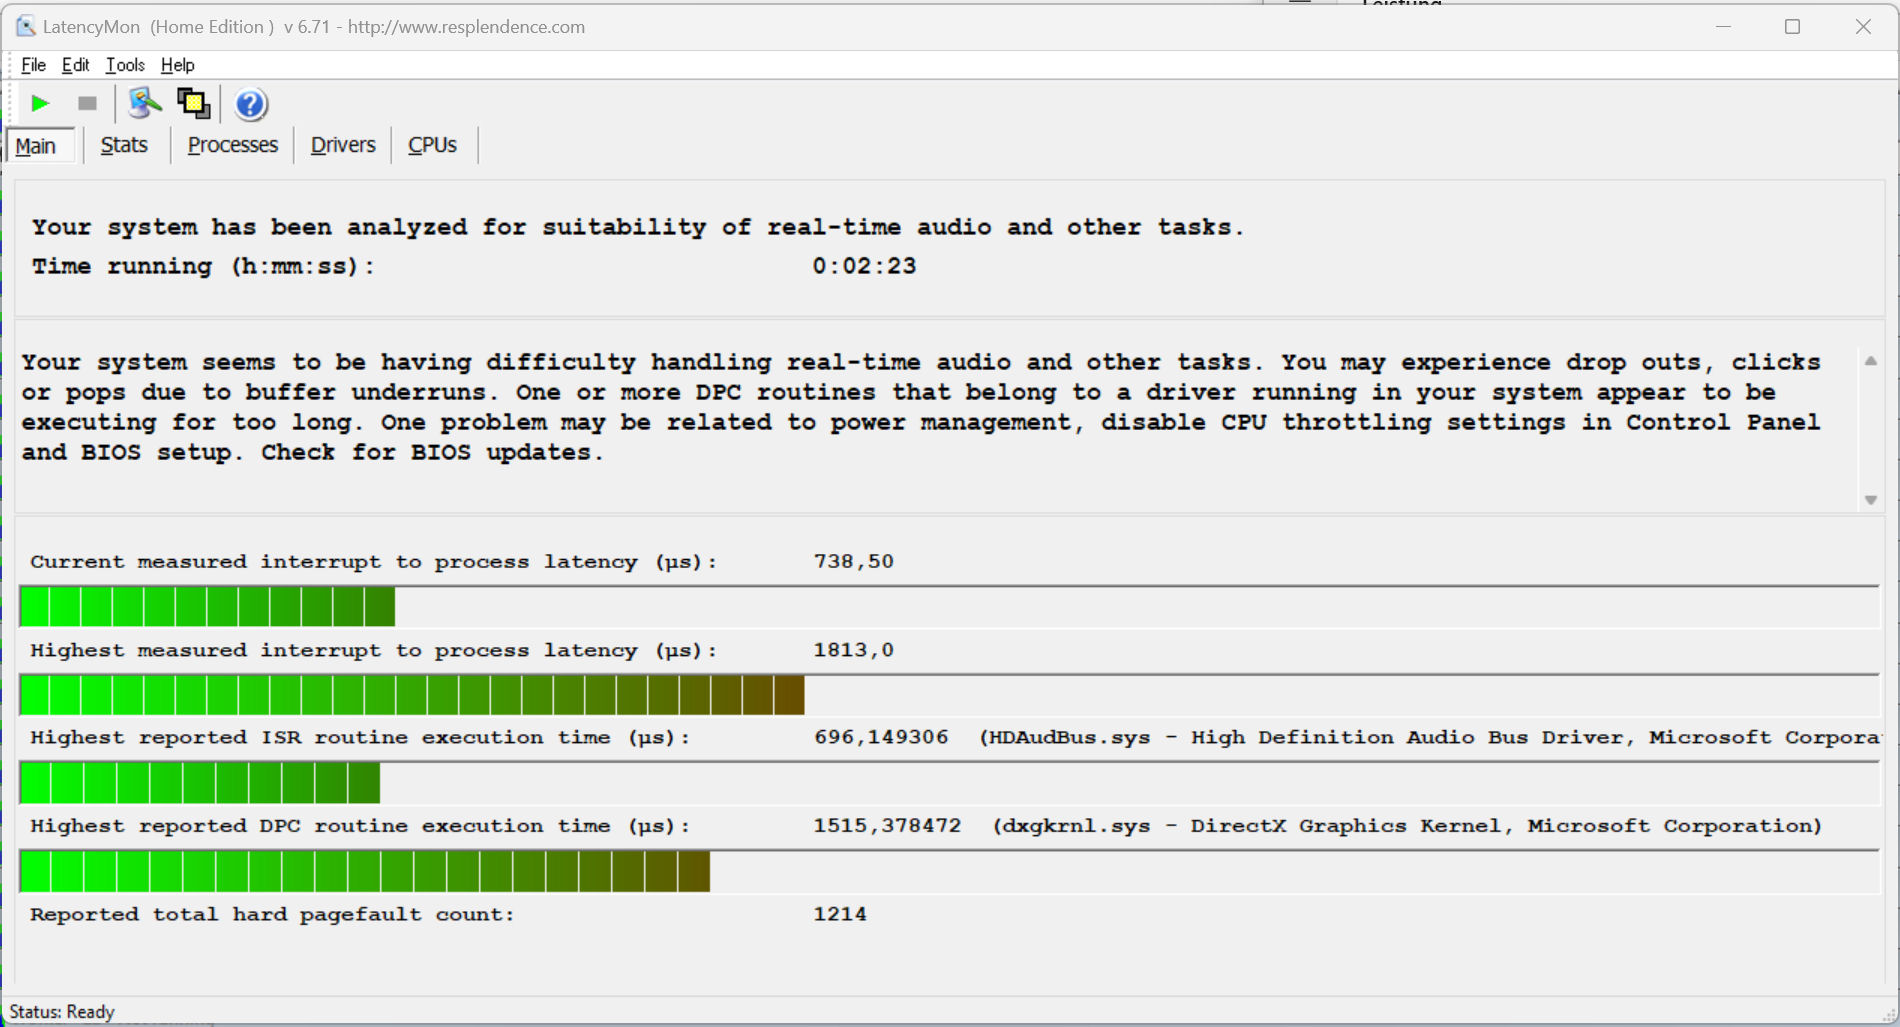
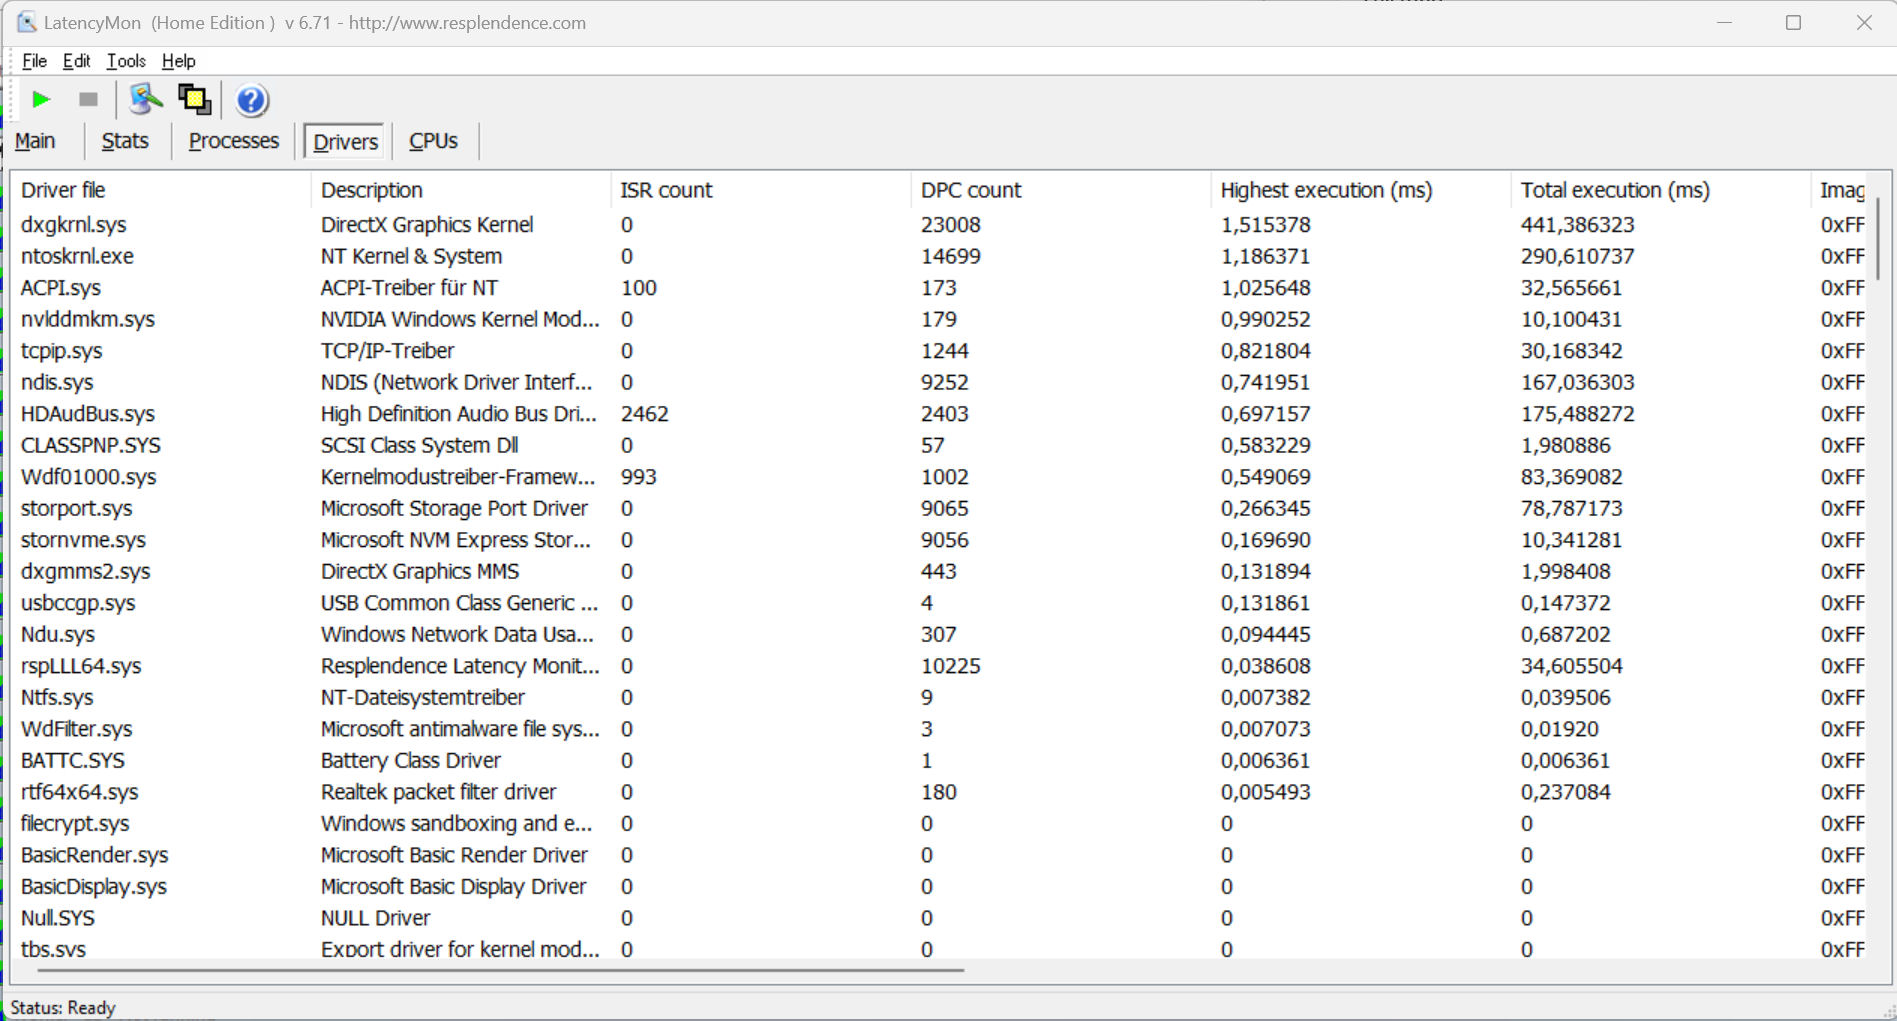
Latência do DPC
O teste de monitor de latência padronizado (navegação na web, reprodução de vídeo 4k, Prime95 de alta carga) revelou algumas anormalidades. Este sistema não parece ser adequado para edição de vídeo e áudio em tempo real. Futuras atualizações de software poderiam trazer algumas melhorias - mas também poderiam possivelmente piorar esta questão.
| DPC Latencies / LatencyMon - interrupt to process latency (max), Web, Youtube, Prime95 | |
| MSI Katana 17 B13VFK | |
| Aorus 15X ASF | |
| Acer Predator Helios 300 (i7-12700H, RTX 3070 Ti) | |
| Asus ROG Strix G17 G713PI | |
| Razer Blade 15 OLED (Early 2022) | |
* ... menor é melhor
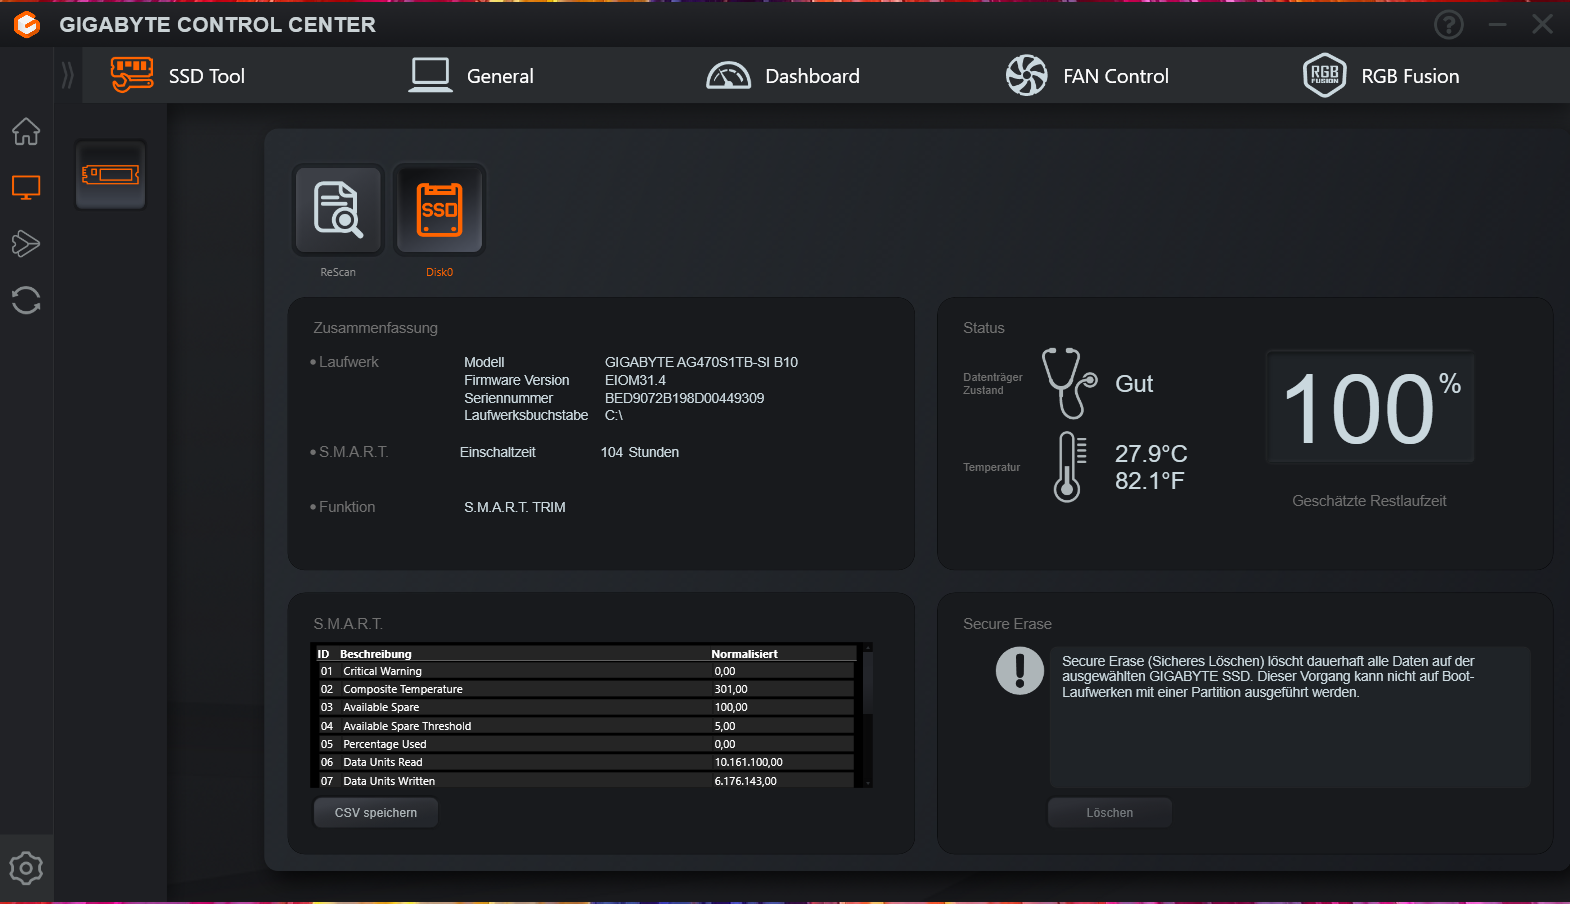
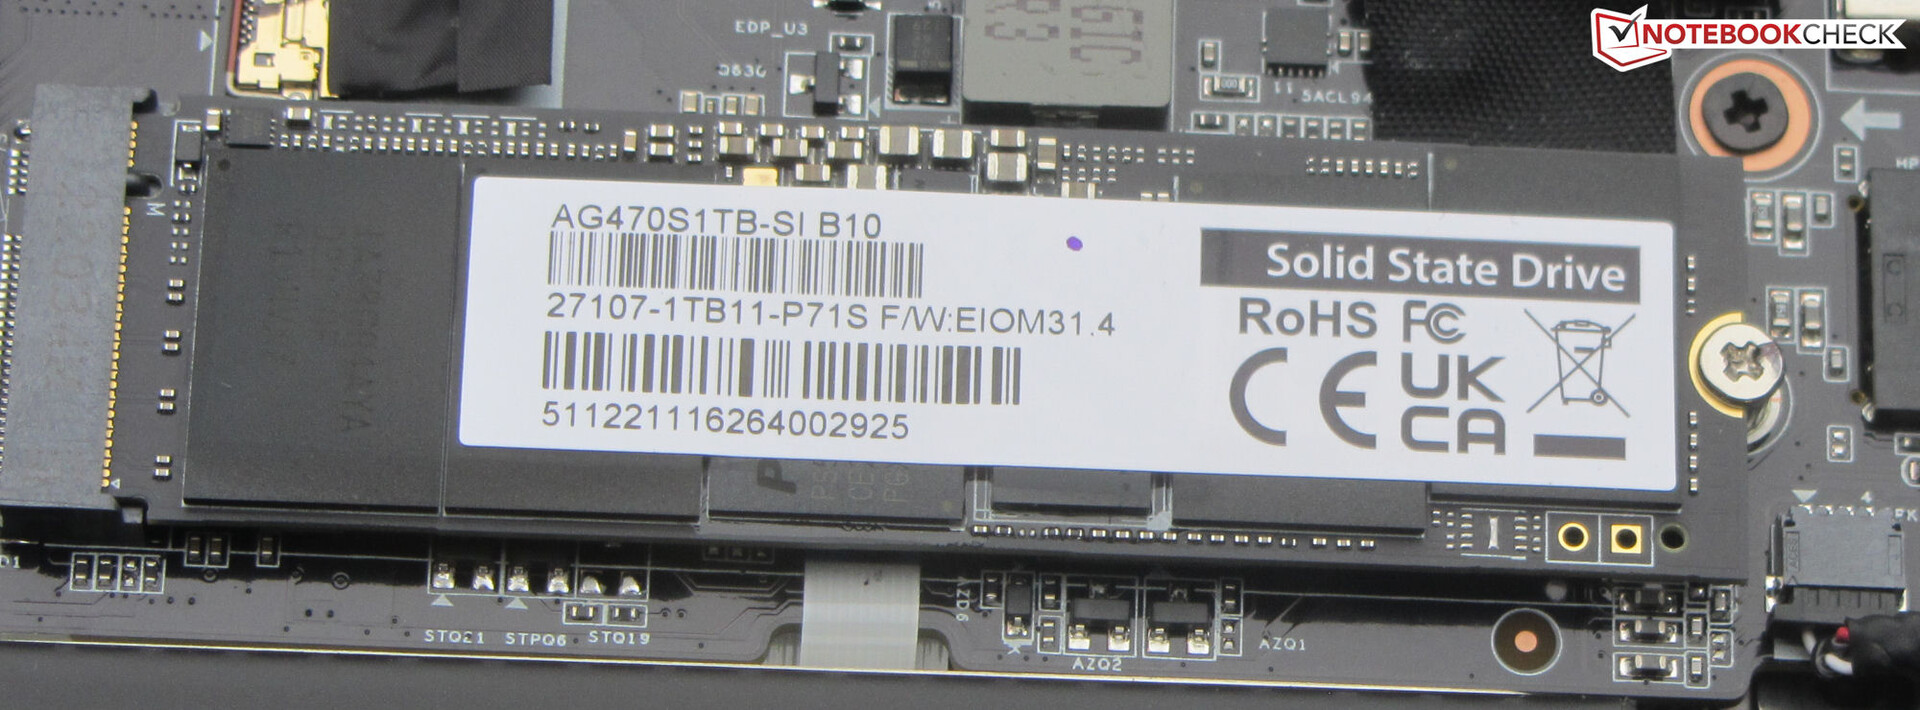
Dispositivos de armazenamento
O 15X tem espaço para dois SSDs PCIe-4 no formato M.2-2280 - entretanto, apenas um está incluído no laptop. O modelo PCIe-4 instalado (1 TB) da Gigabyte oferece taxas de transferência muito boas. Entretanto: no curso posterior do loop do DiskSpd, ocasionais quedas de desempenho puderam ser observadas - provavelmente devido ao estrangulamento térmico.

* ... menor é melhor
Reading continuous performance: DiskSpd Read Loop, Queue Depth 8
Placa gráfica
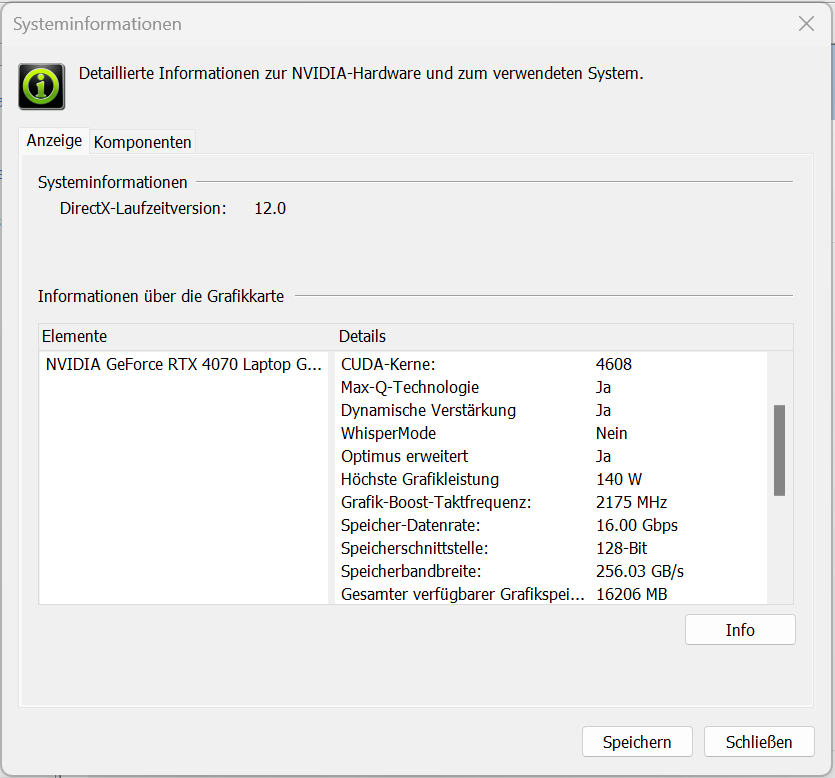
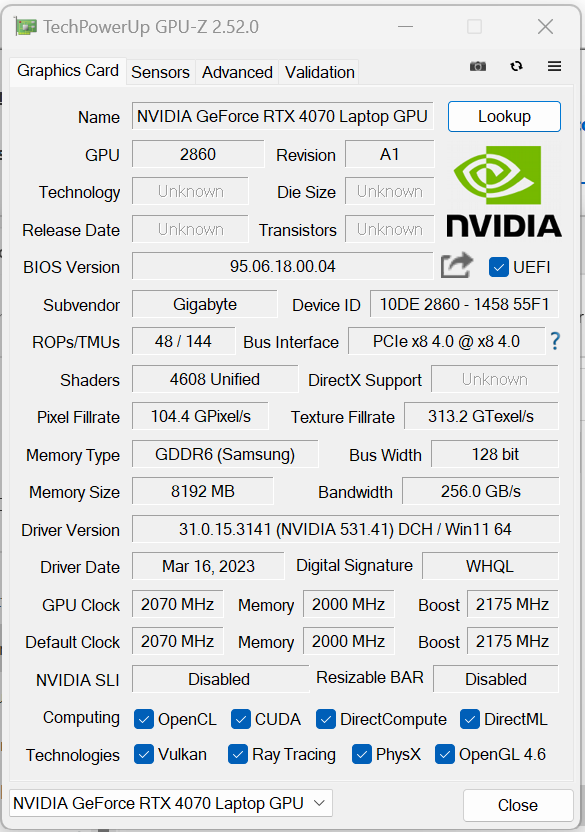
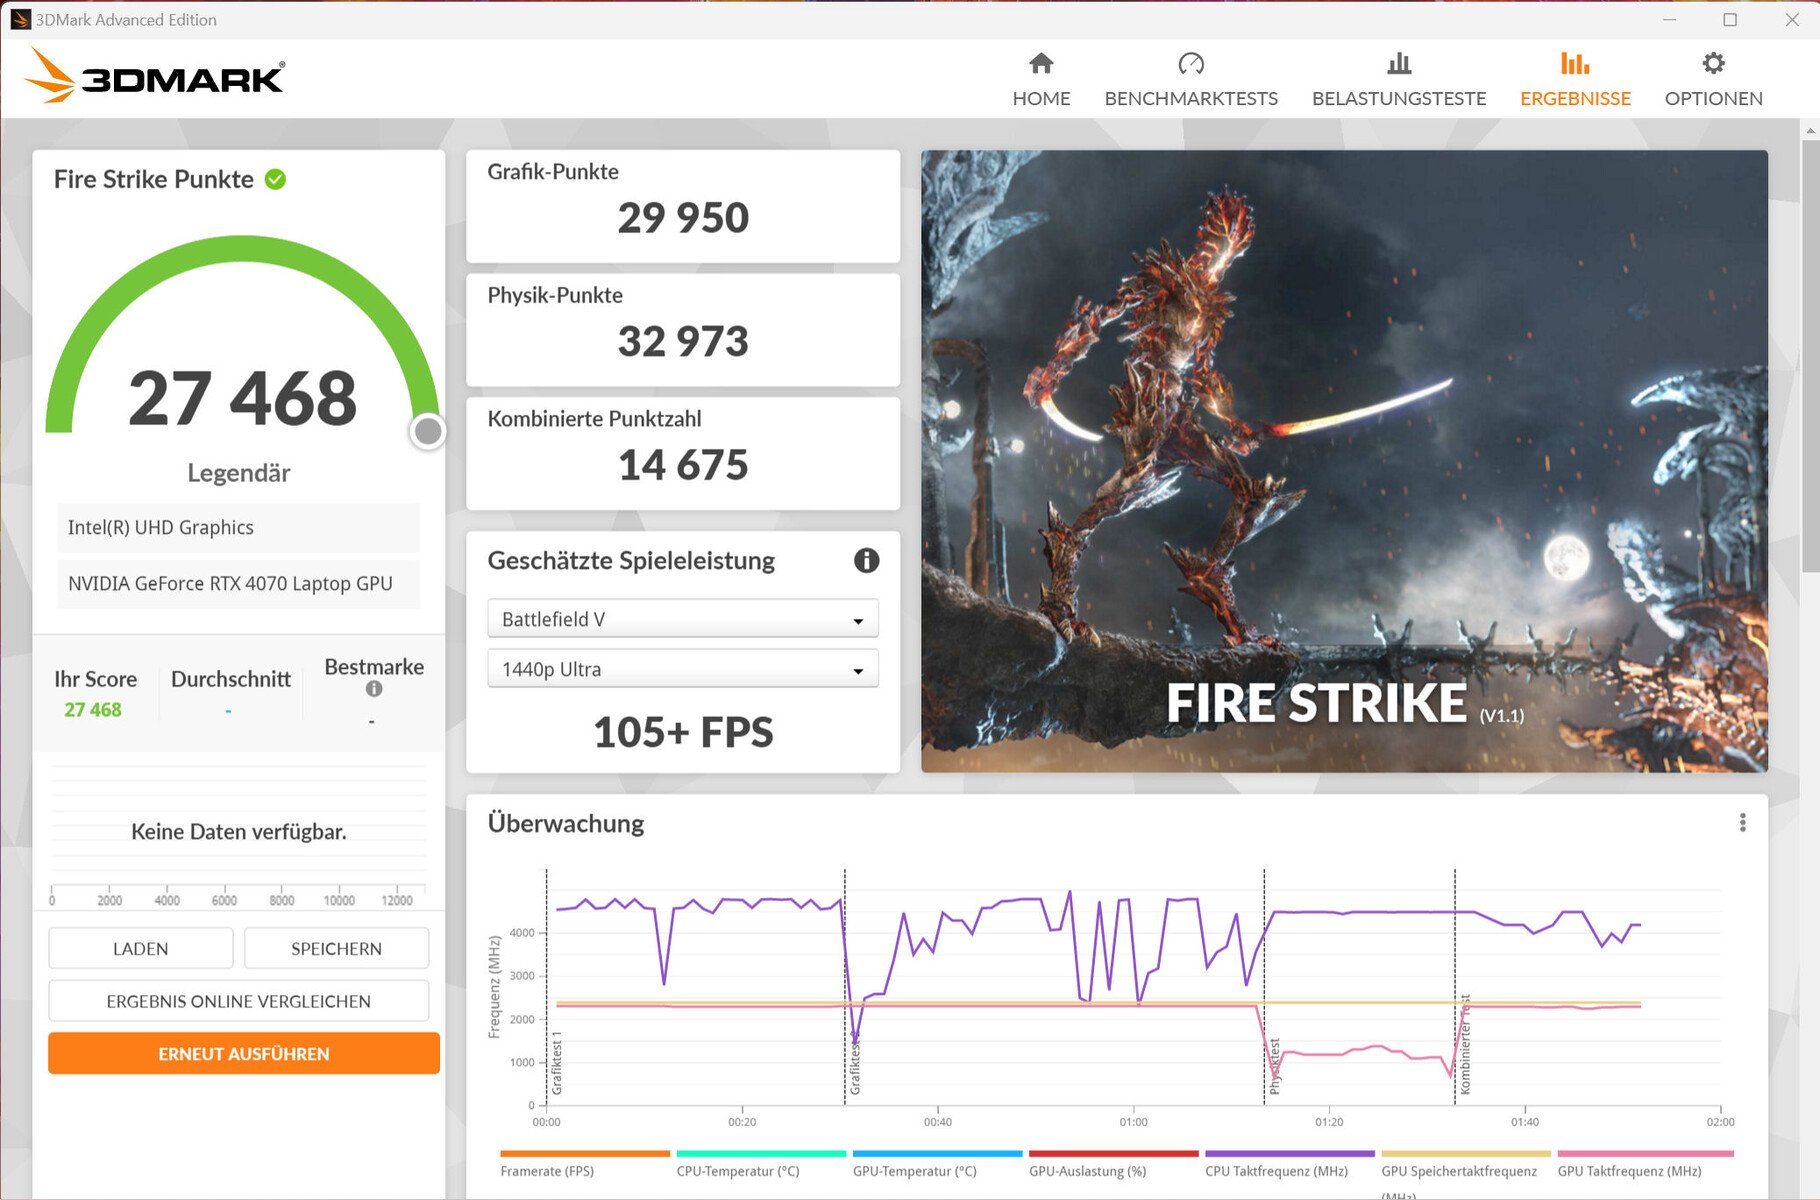
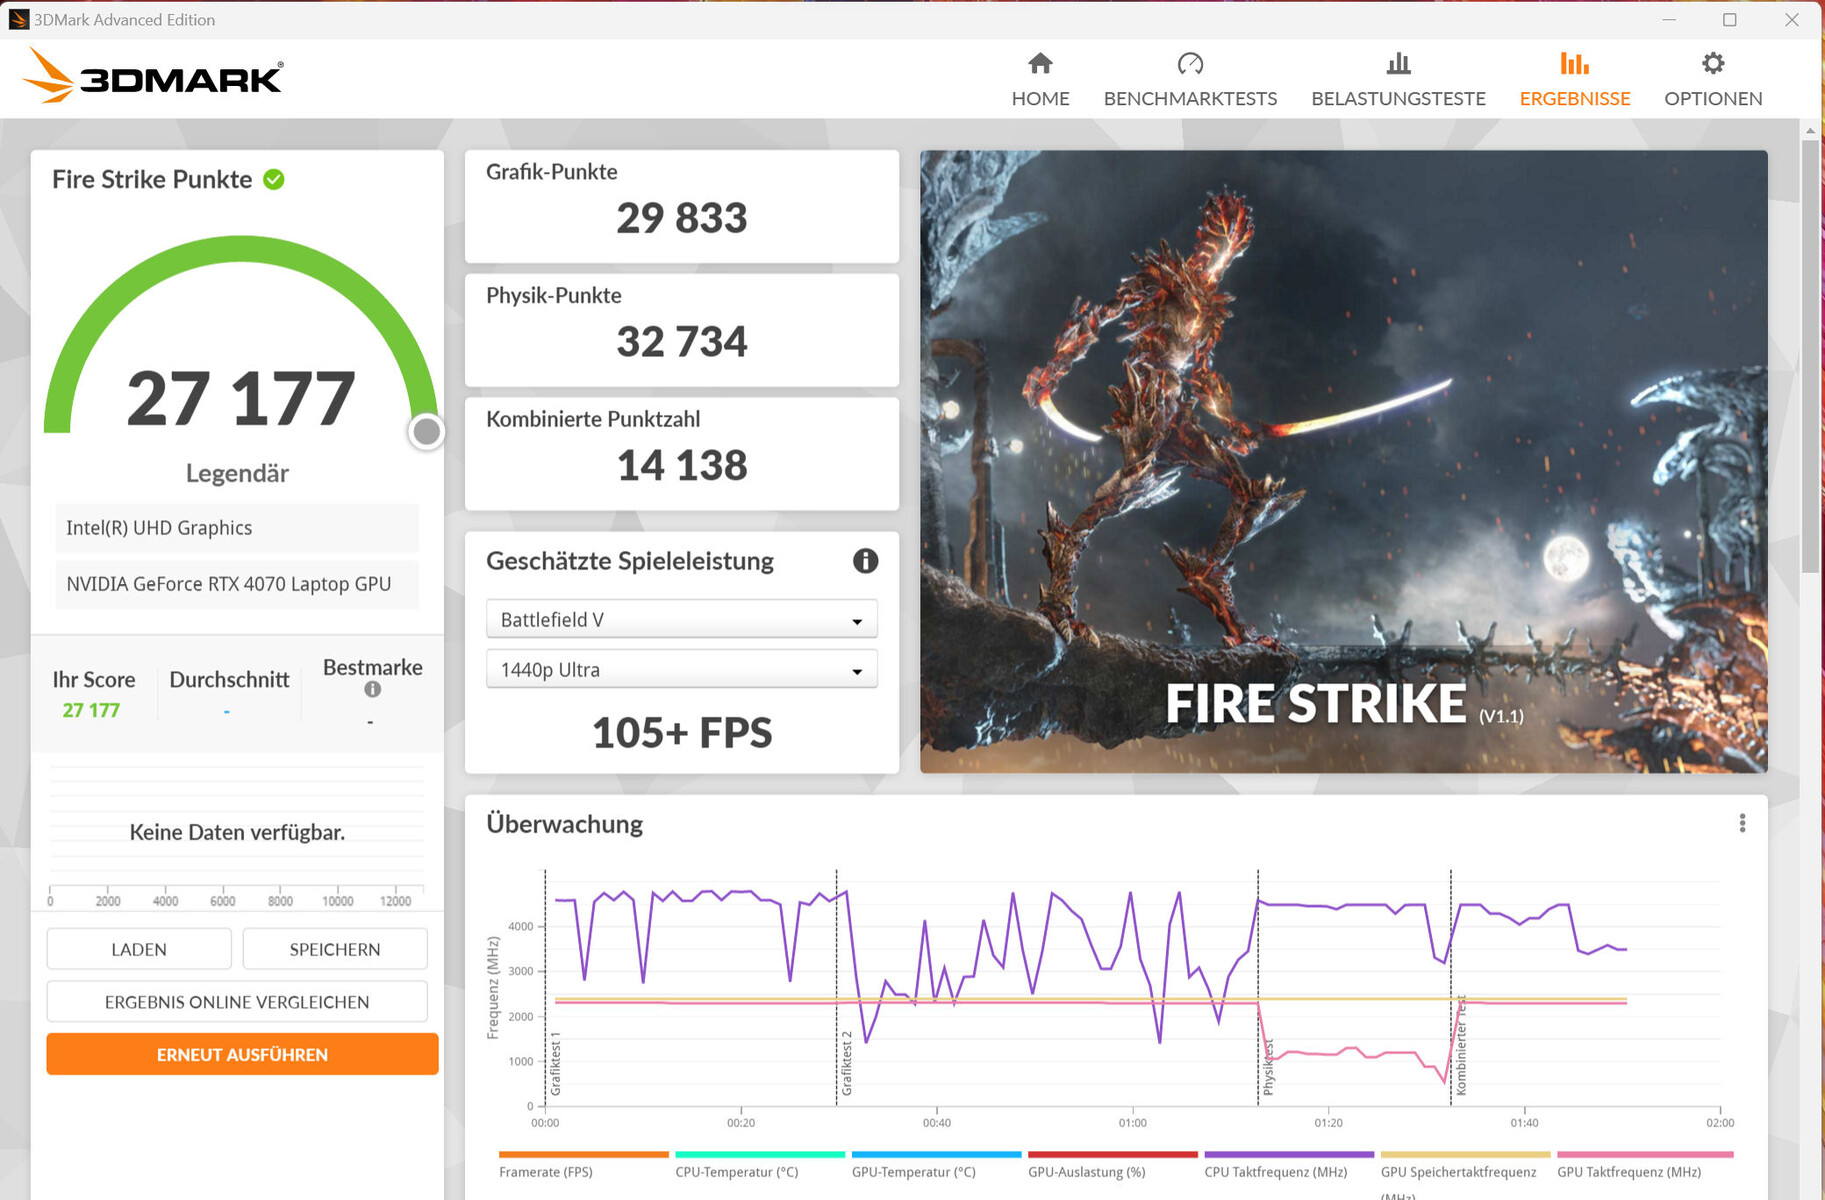
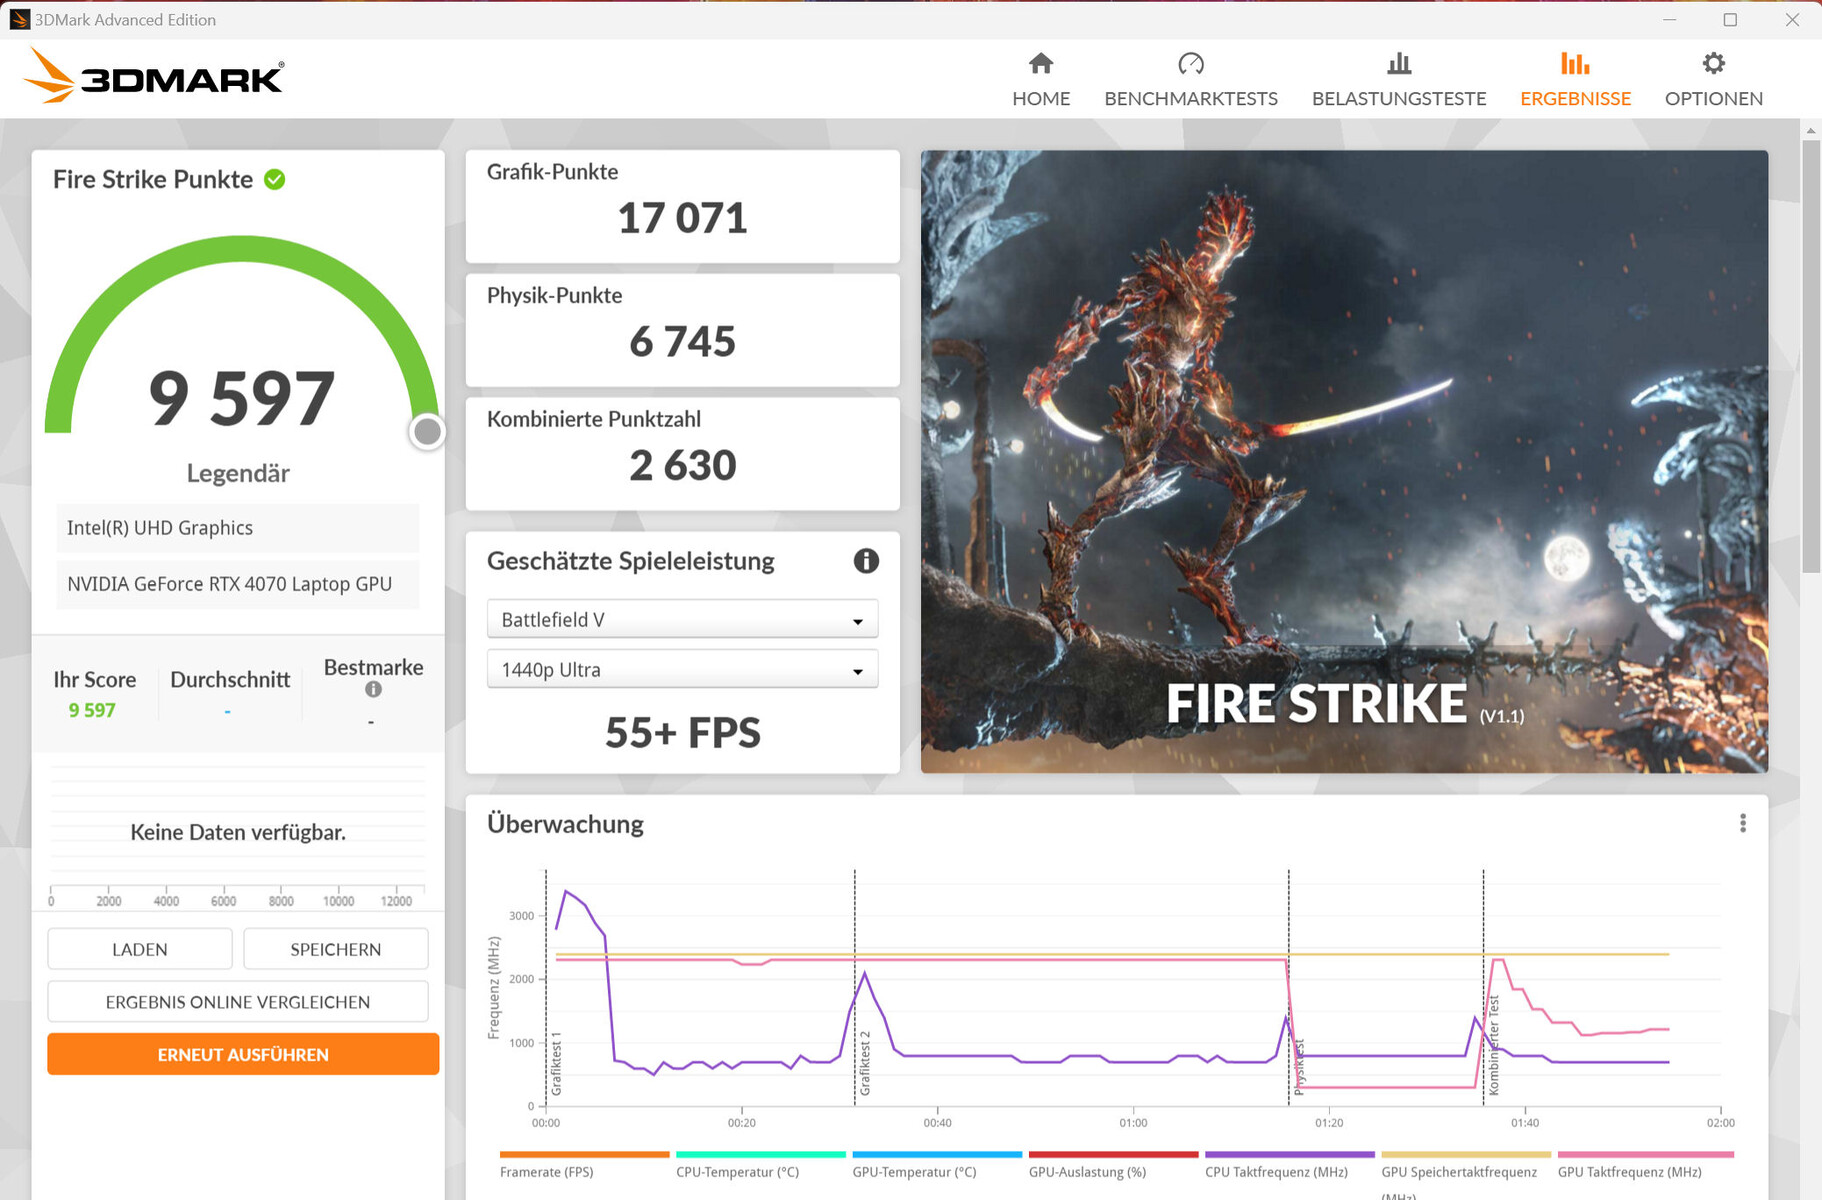
Aorus depende de umGeForce-RTX-4070 gPU de laptop e lhe concede o TGP máximo possível de 140 watts (115 watts + 25 watts Dynamic Boost) - isto não é totalmente utilizado de acordo com o Witcher 3 teste. A GPU tem 4.608 shaders, um ônibus de 128 bit de largura e memória GDDR6 rápida (8.192 MB).
Os resultados de referência foram superiores à média anterior do RTX 4070. O modo dGPU não levou a nenhuma melhoria. A troca entre o dGPU e o Optimus não exigiu reinício - o Advanced Optimus é suportado.


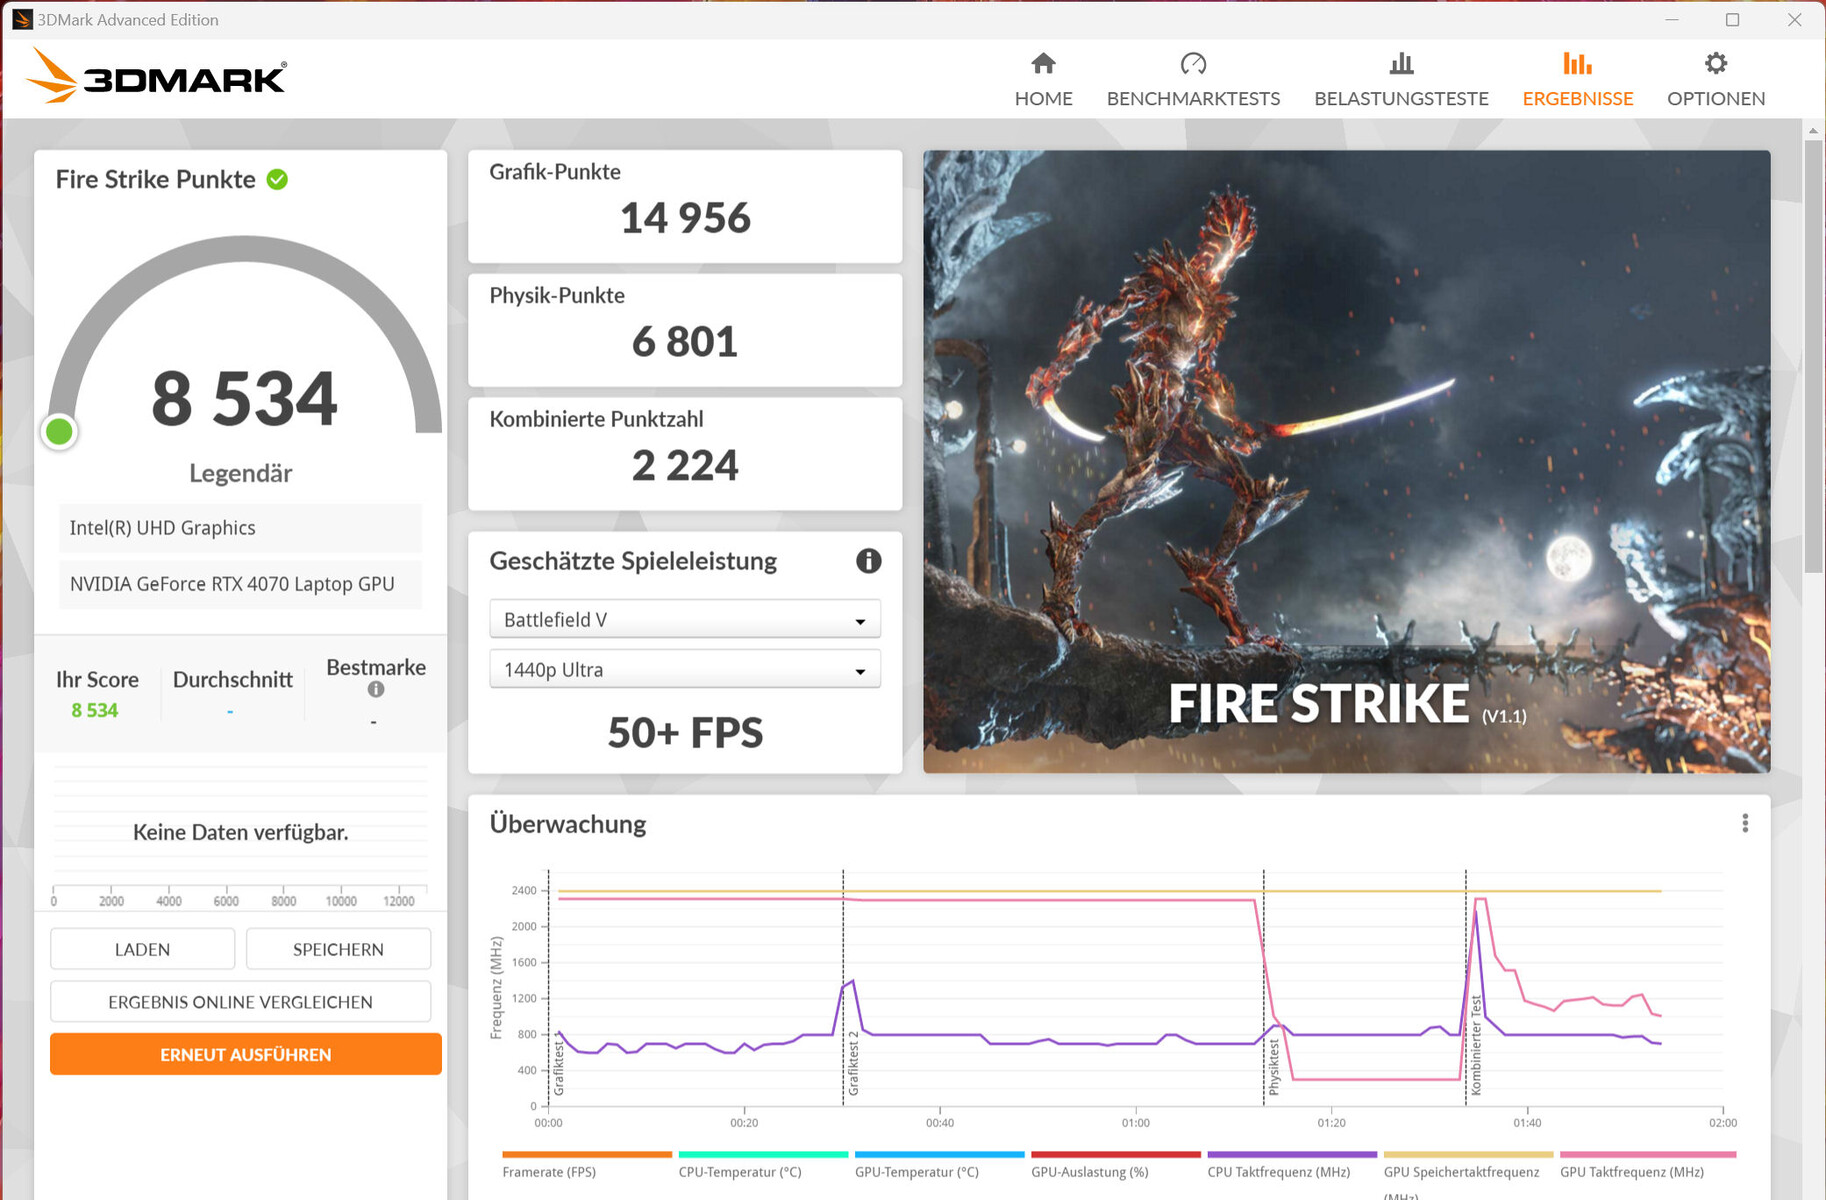
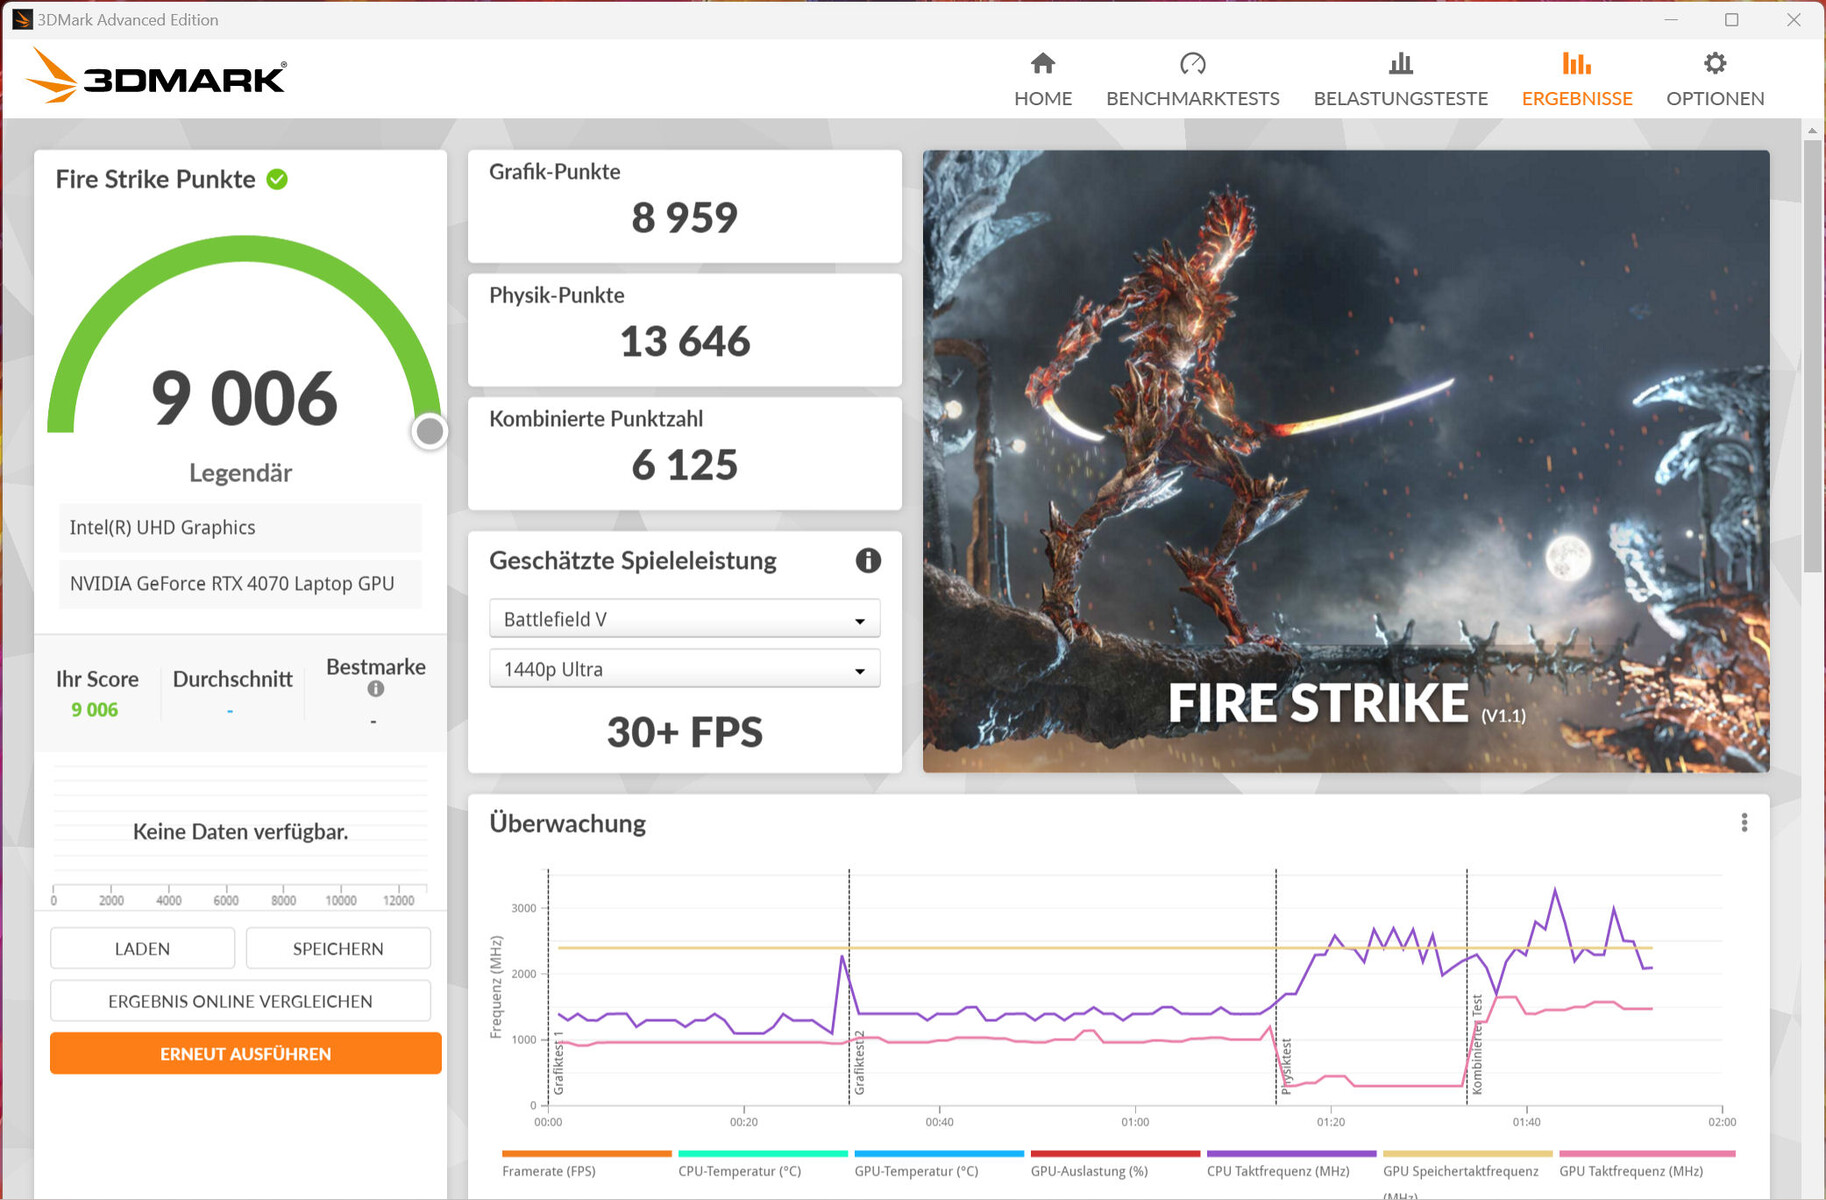

| 3DMark 06 Standard Score | 55615 pontos | |
| 3DMark 11 Performance | 34985 pontos | |
| 3DMark Cloud Gate Standard Score | 65819 pontos | |
| 3DMark Fire Strike Score | 27468 pontos | |
| 3DMark Time Spy Score | 12421 pontos | |
Ajuda | ||
| Geekbench 6.0 - GPU OpenCL 6.0 | |
| Média da turma Gaming (155885 - 241981, n=3, últimos 2 anos) | |
| Aorus 15X ASF | |
| Média NVIDIA GeForce RTX 4070 Laptop GPU (91839 - 122792, n=18) | |
| Razer Blade 15 OLED (Early 2022) | |
* ... menor é melhor
Desempenho do jogo
O laptop é projetado para jogos de QHD em configurações altas a máximas. Resoluções mais altas seriam possíveis com o monitor correspondente - possivelmente com configurações reduzidas. As taxas de quadros dos jogos que testamos estavam no mesmo nível da média RTX 4070 determinada. O modo dGPU aumentou ligeiramente as taxas de quadros de alguns jogos.
| The Witcher 3 - 1920x1080 Ultra Graphics & Postprocessing (HBAO+) | |
| Média da turma Gaming (104.7 - 240, n=7, últimos 2 anos) | |
| Asus ROG Strix G17 G713PI | |
| Acer Predator Helios 300 (i7-12700H, RTX 3070 Ti) | |
| Aorus 15X ASF | |
| Média NVIDIA GeForce RTX 4070 Laptop GPU (69.8 - 133.7, n=57) | |
| MSI Katana 17 B13VFK | |
| Razer Blade 15 OLED (Early 2022) | |
Para verificar se a taxa de quadros permaneceu consistente durante um longo período de uso, executamos o jogo The Witcher 3 por cerca de 60 minutos em resolução Full HD usando configurações de qualidade máxima. O personagem do jogo não foi movido. Uma queda na taxa de quadros não foi notada.
Witcher 3 FPS diagram
| baixo | média | alto | ultra | QHD | |
|---|---|---|---|---|---|
| GTA V (2015) | 185.1 | 185.9 | 180.2 | 117.8 | 88.8 |
| The Witcher 3 (2015) | 484.7 | 366.3 | 228.3 | 117 | |
| Dota 2 Reborn (2015) | 191.9 | 181.1 | 161.1 | 149.4 | |
| Final Fantasy XV Benchmark (2018) | 208 | 167.2 | 117.5 | 83.7 | |
| X-Plane 11.11 (2018) | 164.9 | 145.5 | 117.1 | ||
| Far Cry 5 (2018) | 183 | 157 | 151 | 141 | 111 |
| Strange Brigade (2018) | 537 | 300 | 235 | 201 | 133.2 |
| Flight Simulator 2020 (2020) | 158.8 | 117.2 | 82.5 | 64.8 | 50.1 |
| F1 22 (2022) | 256 | 251 | 193.7 | 78.7 | 52.2 |
| FIFA 23 (2022) | 166.2 | ||||
| Uncharted Legacy of Thieves Collection (2022) | 92.7 | 89.4 | 84.4 | 82.1 | 61 |
| The Callisto Protocol (2022) | 155.6 | 127.5 | 121.8 | 79.7 | 58.4 |
| Need for Speed Unbound (2022) | 118.1 | 112.1 | 101 | 89.1 | 77.7 |
| High On Life (2023) | 236 | 185.9 | 141.6 | 114 | 68.5 |
| Dead Space Remake (2023) | 100.9 | 95.7 | 85.3 | 82.4 | 53.1 |
| Returnal (2023) | 119 | 117 | 106 | 90 | 66 |
| Atomic Heart (2023) | 199.8 | 158.3 | 96.4 | 79 | 58.9 |
| Company of Heroes 3 (2023) | 228.9 | 205.1 | 159.7 | 157.5 | 115.1 |
| Sons of the Forest (2023) | 98.3 | 86.8 | 83.3 | 82.3 | 69.5 |
| Resident Evil 4 Remake (2023) | 185.9 | 133.5 | 120.8 | 86.7 | 61.5 |
| The Last of Us (2023) | 73.1 | 60.9 | 56.9 | 56 | 53.3 |
Desempenho do jogo em volume reduzido
Até certo ponto, os 15X podem satisfazer os desejos dos usuários que não querem um laptop de jogo muito barulhento. O perfil de energia "modo reunião" garante um volume operacional geral mais baixo com potência de processamento reduzida. Este último ainda é suficiente para jogos em configurações médias a parcialmente altas. O Witcher 3 o teste foi executado a uma taxa média de quadros de 69 FPS com um GPU TGP de cerca de 67 watts.
| HD baixo | FHD baixo | FHD médio | FHD alto | FHD ultra | |
|---|---|---|---|---|---|
| GTA V | - | 73,7 fps | 68,2 fps | 50,3 fps | 27,2 fps |
| Dota 2 Reborn | 87,1 fps | - | - | 61,8 fps | 52,7 fps |
| Fantasia Final XV Benchmark | 56,7 fps | - | 49 fps | 40,7 fps | - |
| Plano X 11,11 | 59,5 fps | - | 52,2 fps | 45,6 fps | - |
| Strange Brigade | 123,8 fps | - | 96,4 fps | 92,3 fps | 88,8 fps |
Emissões - A ASF Aorus ASF pode funcionar silenciosamente
Emissões sonoras
Os dois ventiladores geralmente trabalham em baixa velocidade sem carga e em uso diário (escritório, Internet). No entanto, não é impossível que eles aumentem - níveis de até 38 dB(A) são possíveis. Sob carga, o nível ficou muito alto com valores máximos de 58 dB(A) (teste de estresse) e 54 dB(A) (Witcher 3 teste).
O Aorus 15X é capaz de operação silenciosa a praticamente silenciosa. Isto requer o uso dos perfis de energia "modo reunião" ou "modo ocioso de economia de energia". O desempenho reduzido subsequente do computador ainda é mais do que suficiente para o uso diário e permite até mesmo jogos em configurações reduzidas.
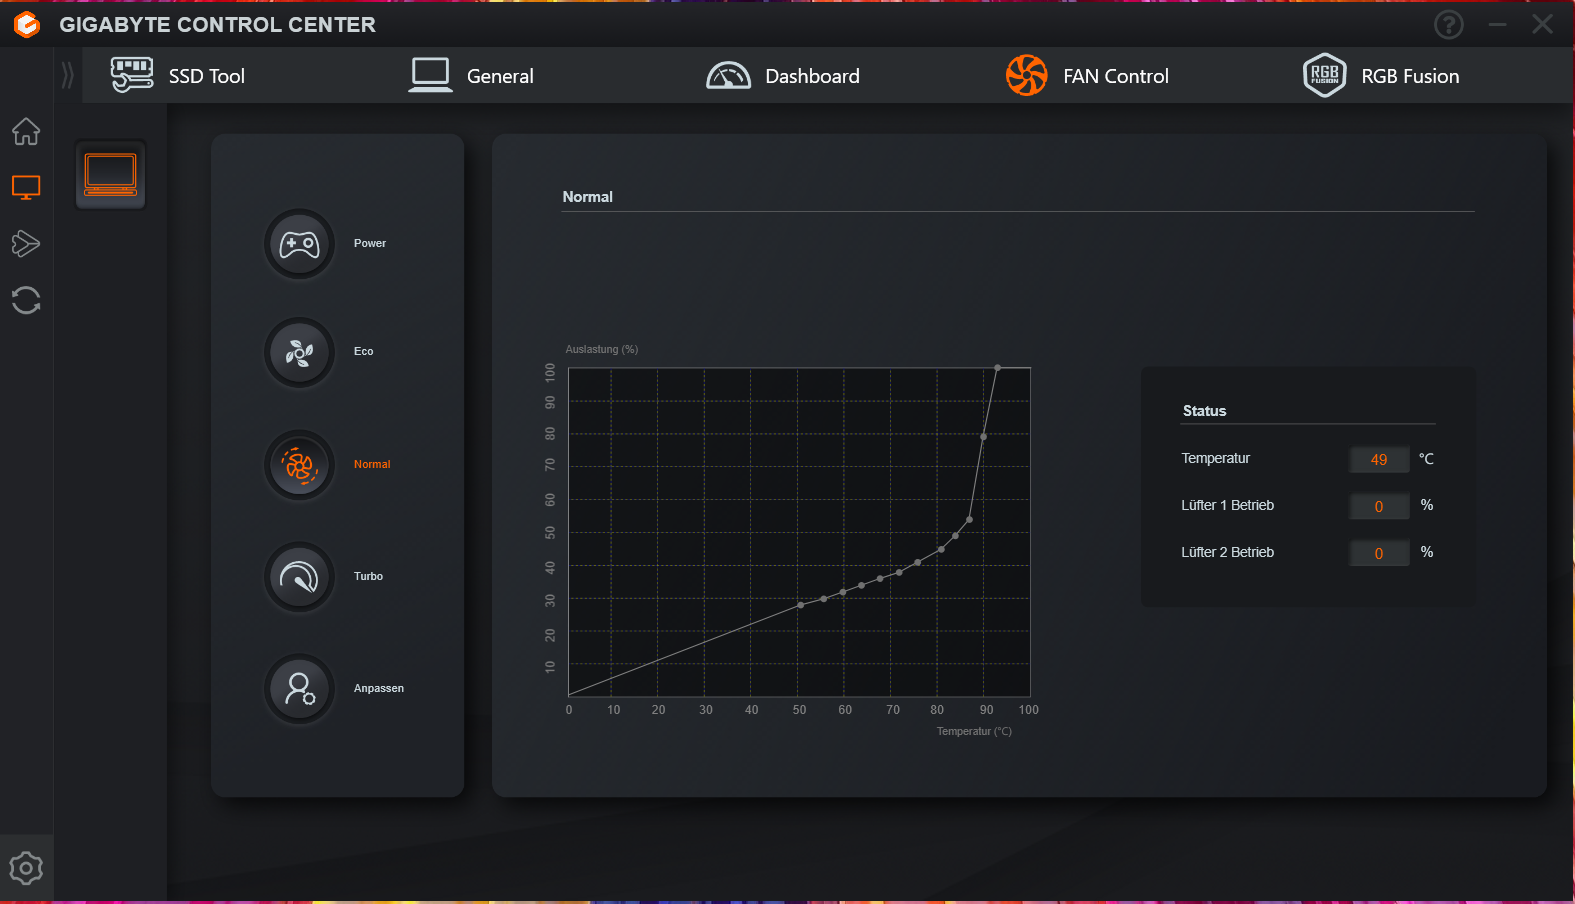
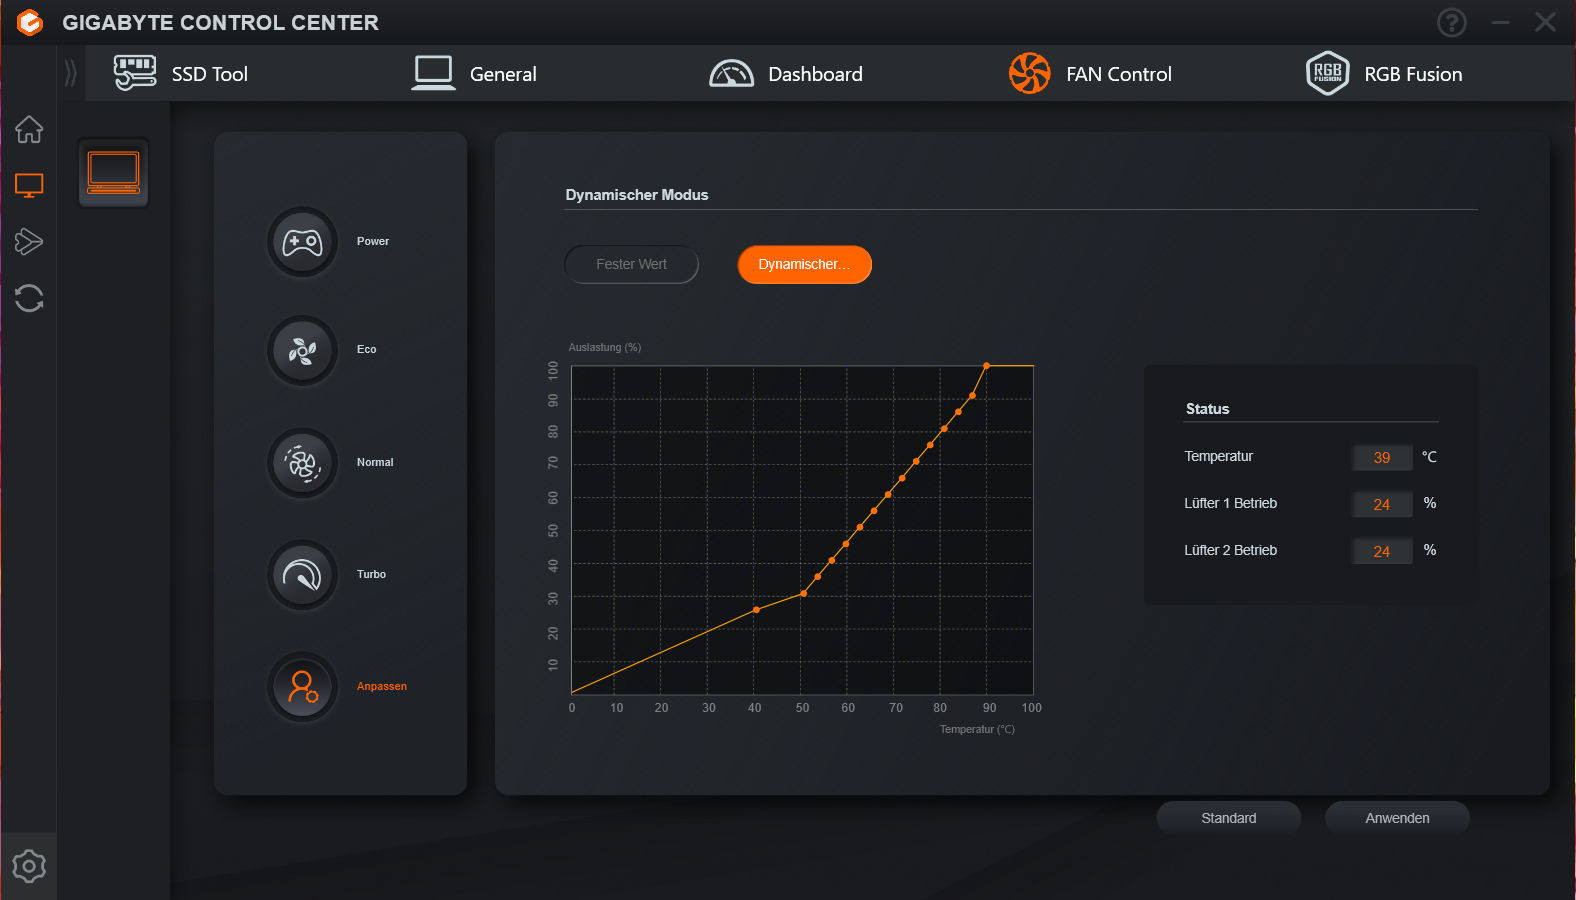
O Centro de Controle da Gigabyte permite controlar o ventilador. Vários perfis de ventiladores estão disponíveis, e uma curva individual do ventilador também pode ser criada.
Barulho
| Ocioso |
| 28 / 29 / 36 dB |
| Carga |
| 50 / 58 dB |
 | ||
30 dB silencioso 40 dB(A) audível 50 dB(A) ruidosamente alto |
||
min: | ||
| Aorus 15X ASF i7-13700HX, GeForce RTX 4070 Laptop GPU | Razer Blade 15 OLED (Early 2022) i9-12900H, GeForce RTX 3070 Ti Laptop GPU | MSI Katana 17 B13VFK i7-13620H, GeForce RTX 4060 Laptop GPU | Asus ROG Strix G17 G713PI R9 7945HX, GeForce RTX 4070 Laptop GPU | Acer Predator Helios 300 (i7-12700H, RTX 3070 Ti) i7-12700H, GeForce RTX 3070 Ti Laptop GPU | |
|---|---|---|---|---|---|
| Noise | 11% | 2% | 9% | 2% | |
| desligado / ambiente * (dB) | 25 | 26 -4% | 24.5 2% | 25 -0% | 23 8% |
| Idle Minimum * (dB) | 28 | 28 -0% | 24.5 12% | 26 7% | 23 18% |
| Idle Average * (dB) | 29 | 28 3% | 24.5 16% | 29 -0% | 25.92 11% |
| Idle Maximum * (dB) | 36 | 28 22% | 40 -11% | 30 17% | 40.67 -13% |
| Load Average * (dB) | 50 | 38.5 23% | 48.3 3% | 46 8% | 42.7 15% |
| Witcher 3 ultra * (dB) | 54 | 56 -4% | 46 15% | 62.48 -16% | |
| Load Maximum * (dB) | 58 | 43.9 24% | 59.1 -2% | 47 19% | 62.67 -8% |
* ... menor é melhor
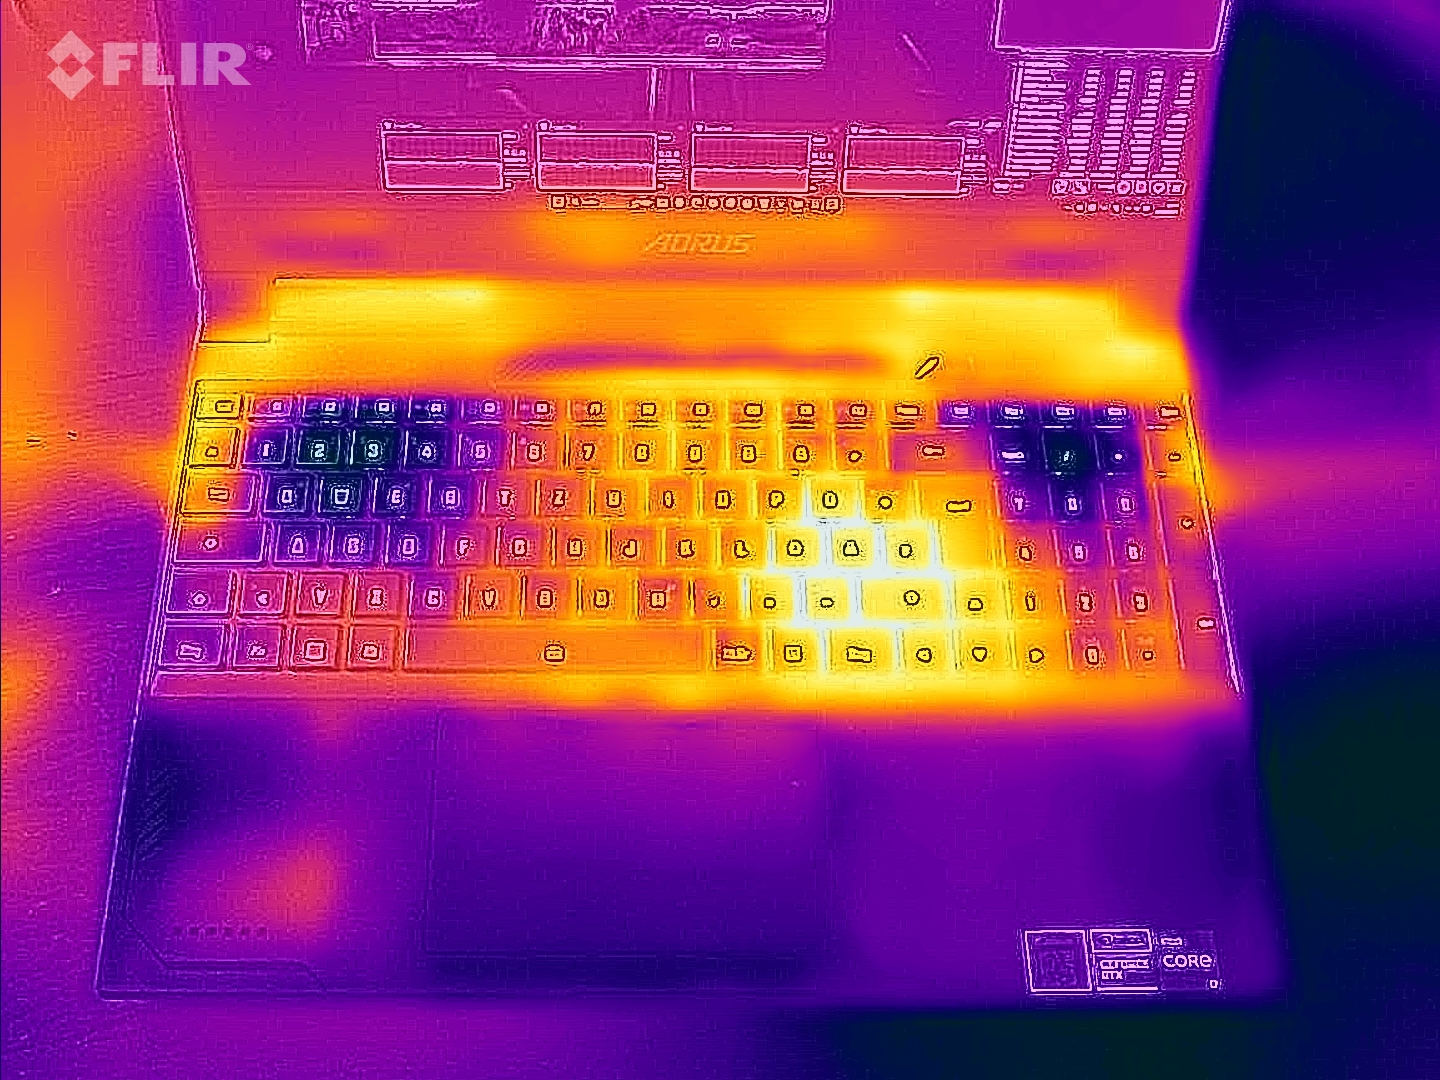
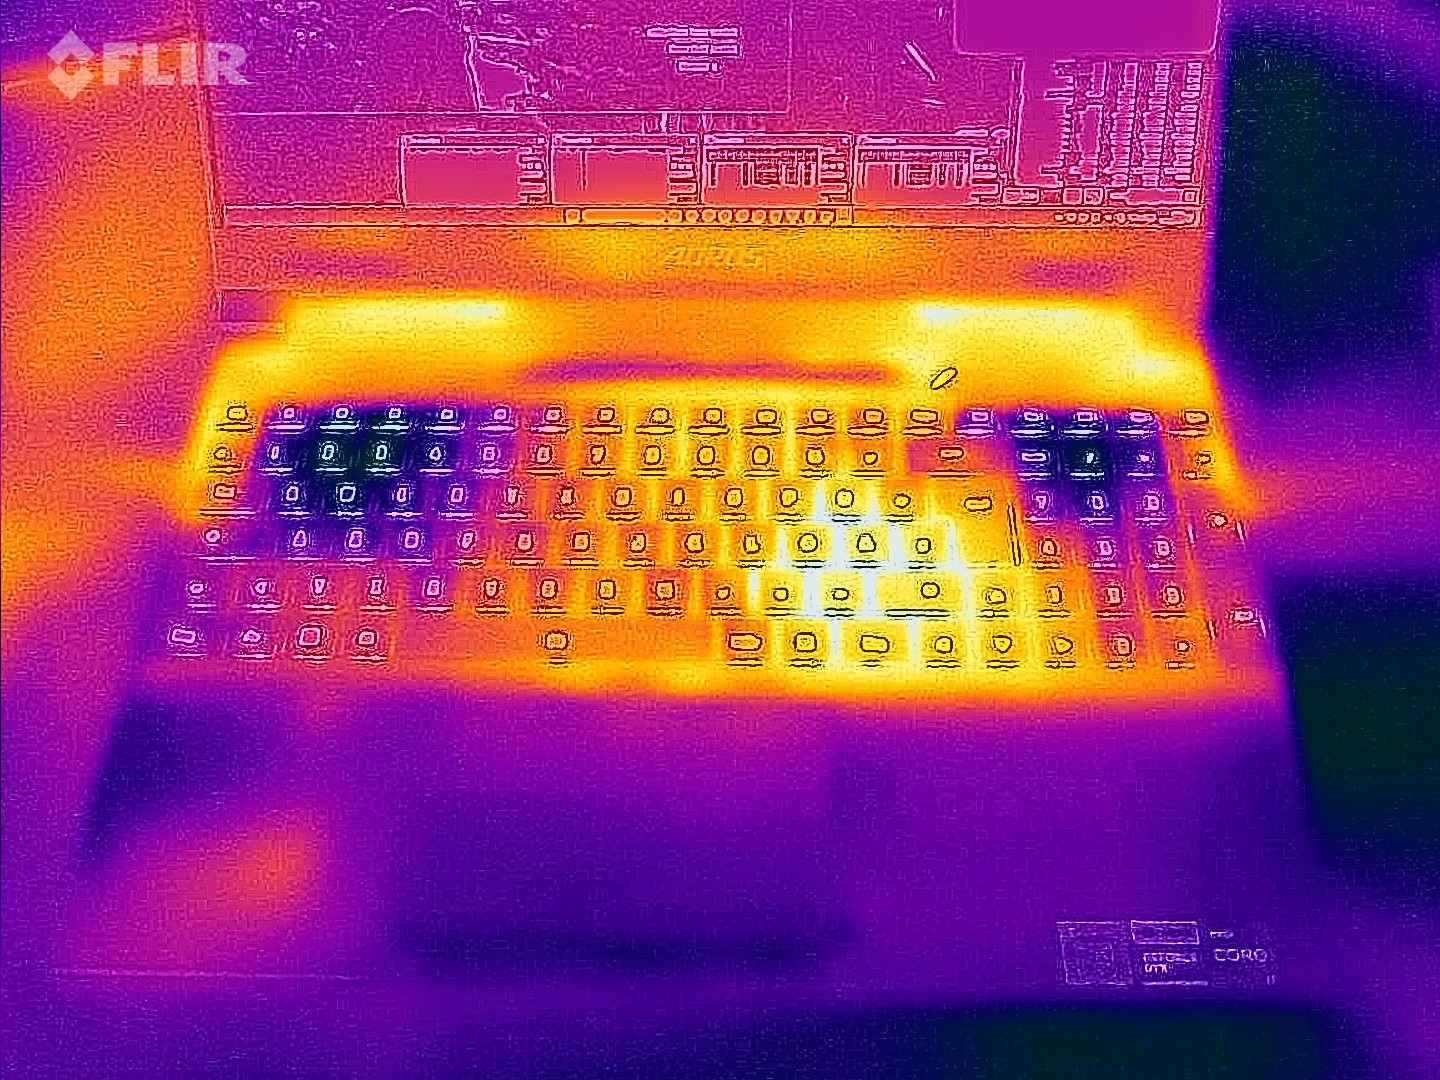
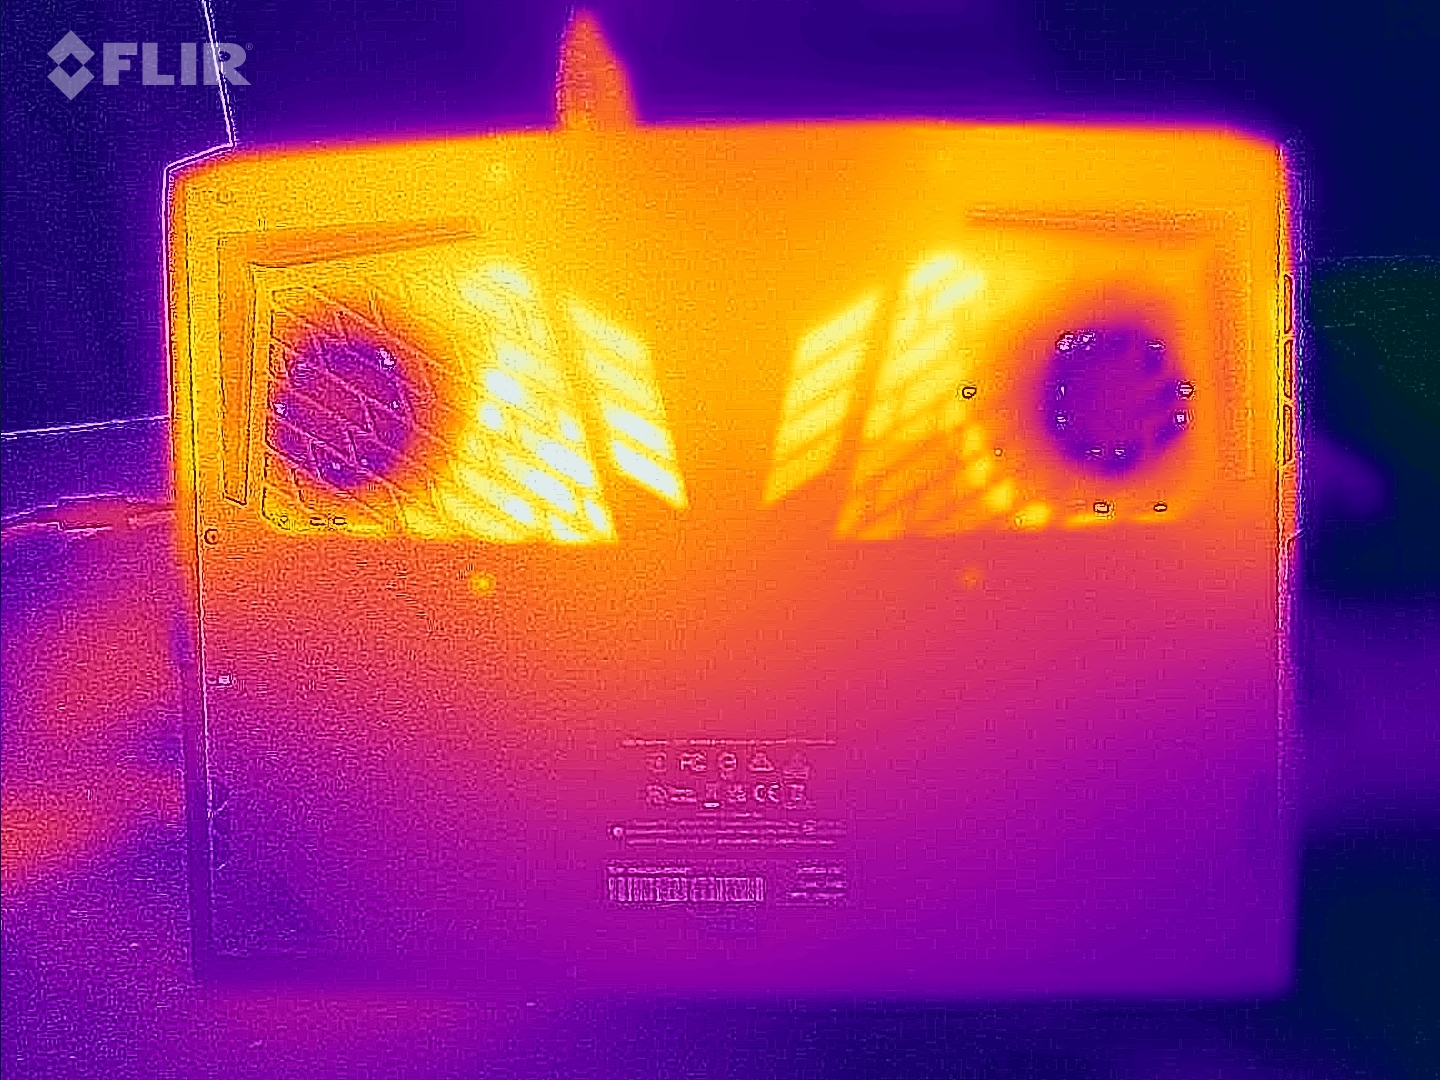
Temperatura
As temperaturas da caixa permaneceram dentro da zona verde em uso diário (escritório, Internet). Sob carga (teste de estresse, Witcher 3 teste), o laptop aqueceu visivelmente, mas não excessivamente. As temperaturas da CPU não são motivo de preocupação.
(±) A temperatura máxima no lado superior é 42 °C / 108 F, em comparação com a média de 40.4 °C / 105 F , variando de 21.2 a 68.8 °C para a classe Gaming.
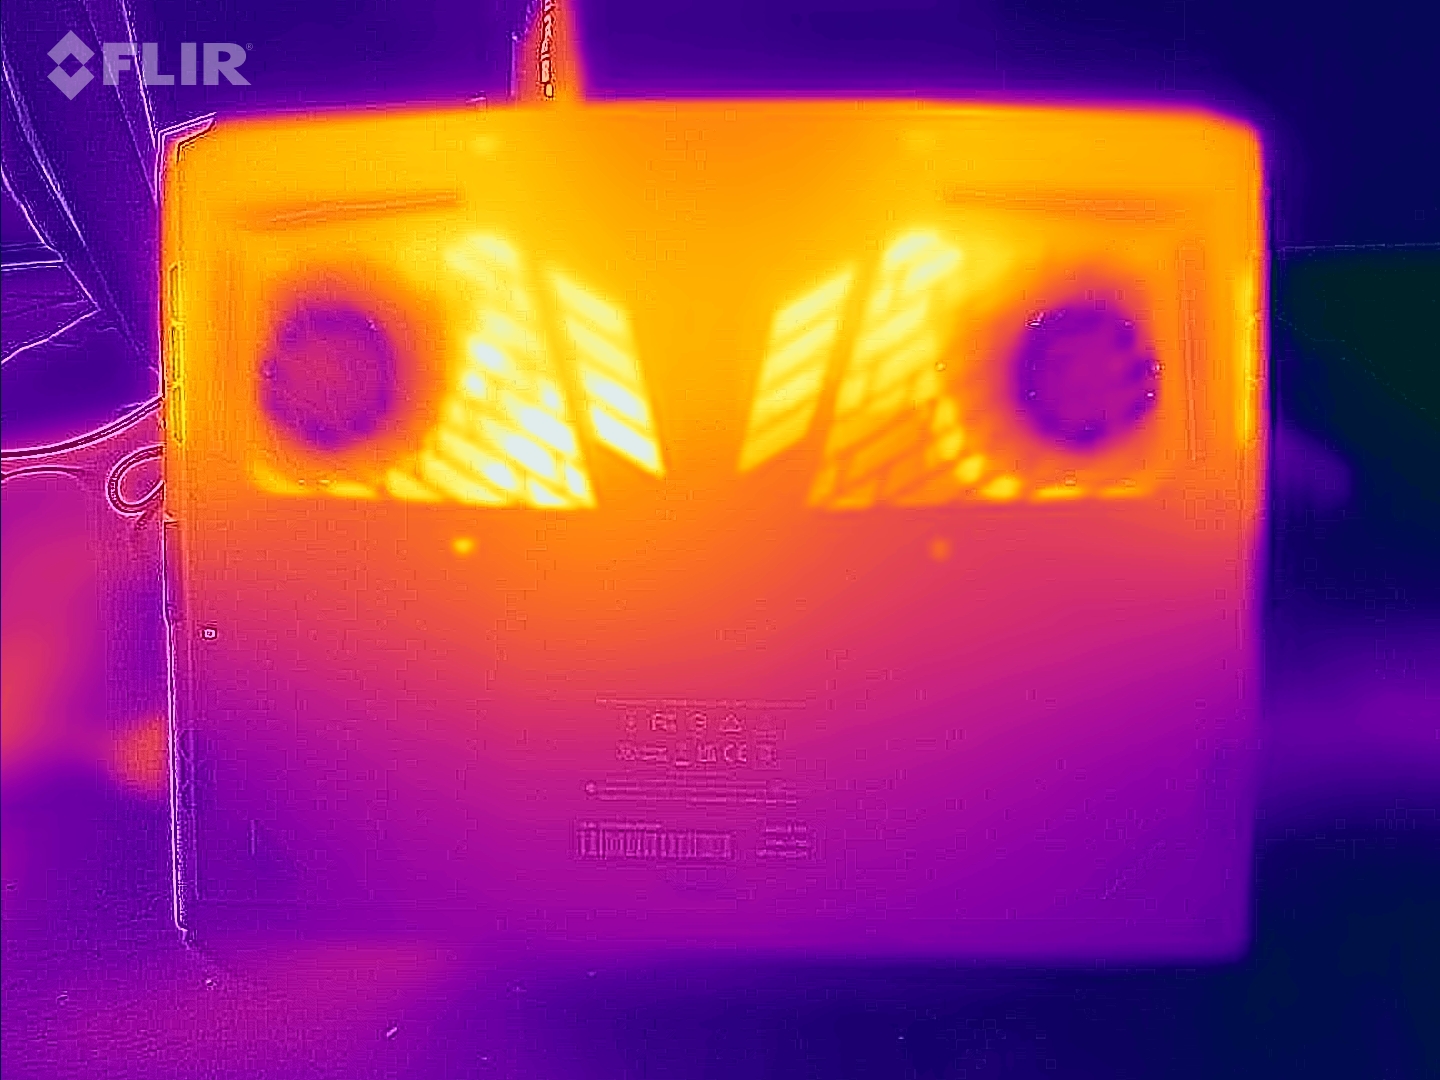
(-) A parte inferior aquece até um máximo de 51 °C / 124 F, em comparação com a média de 43.2 °C / 110 F
(+) Em uso inativo, a temperatura média para o lado superior é 25.7 °C / 78 F, em comparação com a média do dispositivo de 33.9 °C / ### class_avg_f### F.
(±) Jogando The Witcher 3, a temperatura média para o lado superior é 34.2 °C / 94 F, em comparação com a média do dispositivo de 33.9 °C / ## #class_avg_f### F.
(+) Os apoios para as mãos e o touchpad são mais frios que a temperatura da pele, com um máximo de 28 °C / 82.4 F e, portanto, são frios ao toque.
(±) A temperatura média da área do apoio para as mãos de dispositivos semelhantes foi 28.8 °C / 83.8 F (+0.8 °C / 1.4 F).
| Aorus 15X ASF Intel Core i7-13700HX, NVIDIA GeForce RTX 4070 Laptop GPU | Razer Blade 15 OLED (Early 2022) Intel Core i9-12900H, NVIDIA GeForce RTX 3070 Ti Laptop GPU | MSI Katana 17 B13VFK Intel Core i7-13620H, NVIDIA GeForce RTX 4060 Laptop GPU | Asus ROG Strix G17 G713PI AMD Ryzen 9 7945HX, NVIDIA GeForce RTX 4070 Laptop GPU | Acer Predator Helios 300 (i7-12700H, RTX 3070 Ti) Intel Core i7-12700H, NVIDIA GeForce RTX 3070 Ti Laptop GPU | |
|---|---|---|---|---|---|
| Heat | -18% | -10% | -8% | -6% | |
| Maximum Upper Side * (°C) | 42 | 49.5 -18% | 41.6 1% | 42 -0% | 35 17% |
| Maximum Bottom * (°C) | 51 | 47.5 7% | 43.1 15% | 41 20% | 53 -4% |
| Idle Upper Side * (°C) | 27 | 33.4 -24% | 32 -19% | 33 -22% | 29 -7% |
| Idle Bottom * (°C) | 26 | 35 -35% | 35.8 -38% | 34 -31% | 34 -31% |
* ... menor é melhor
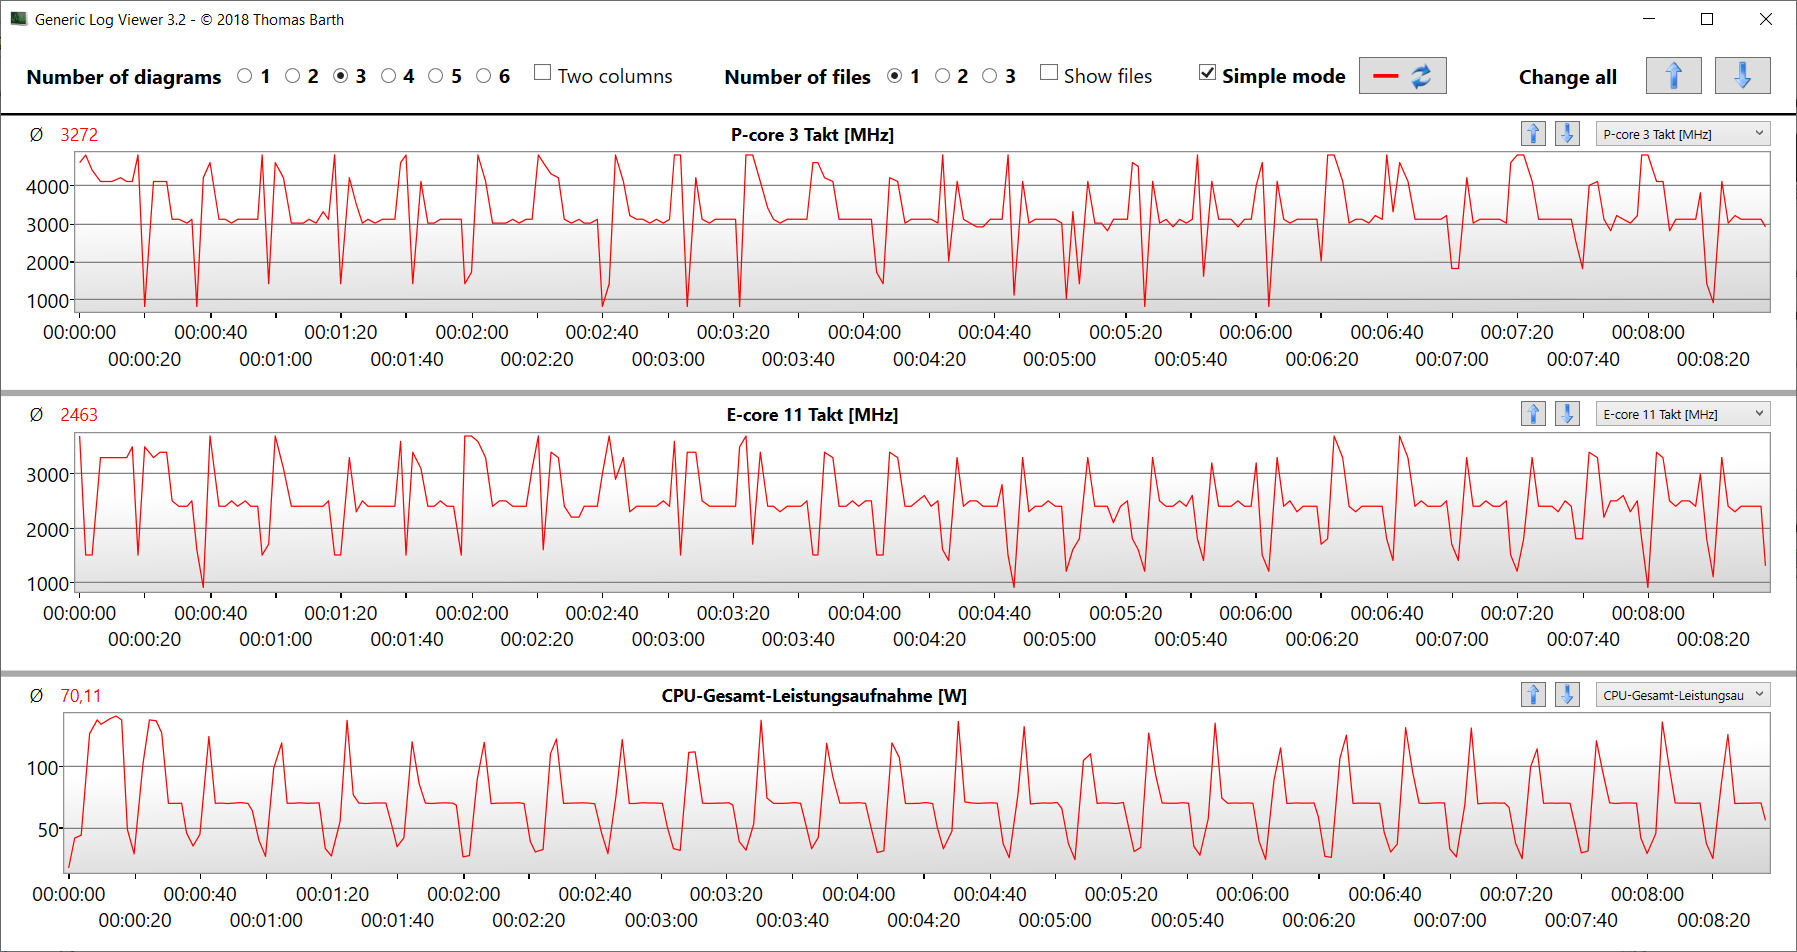
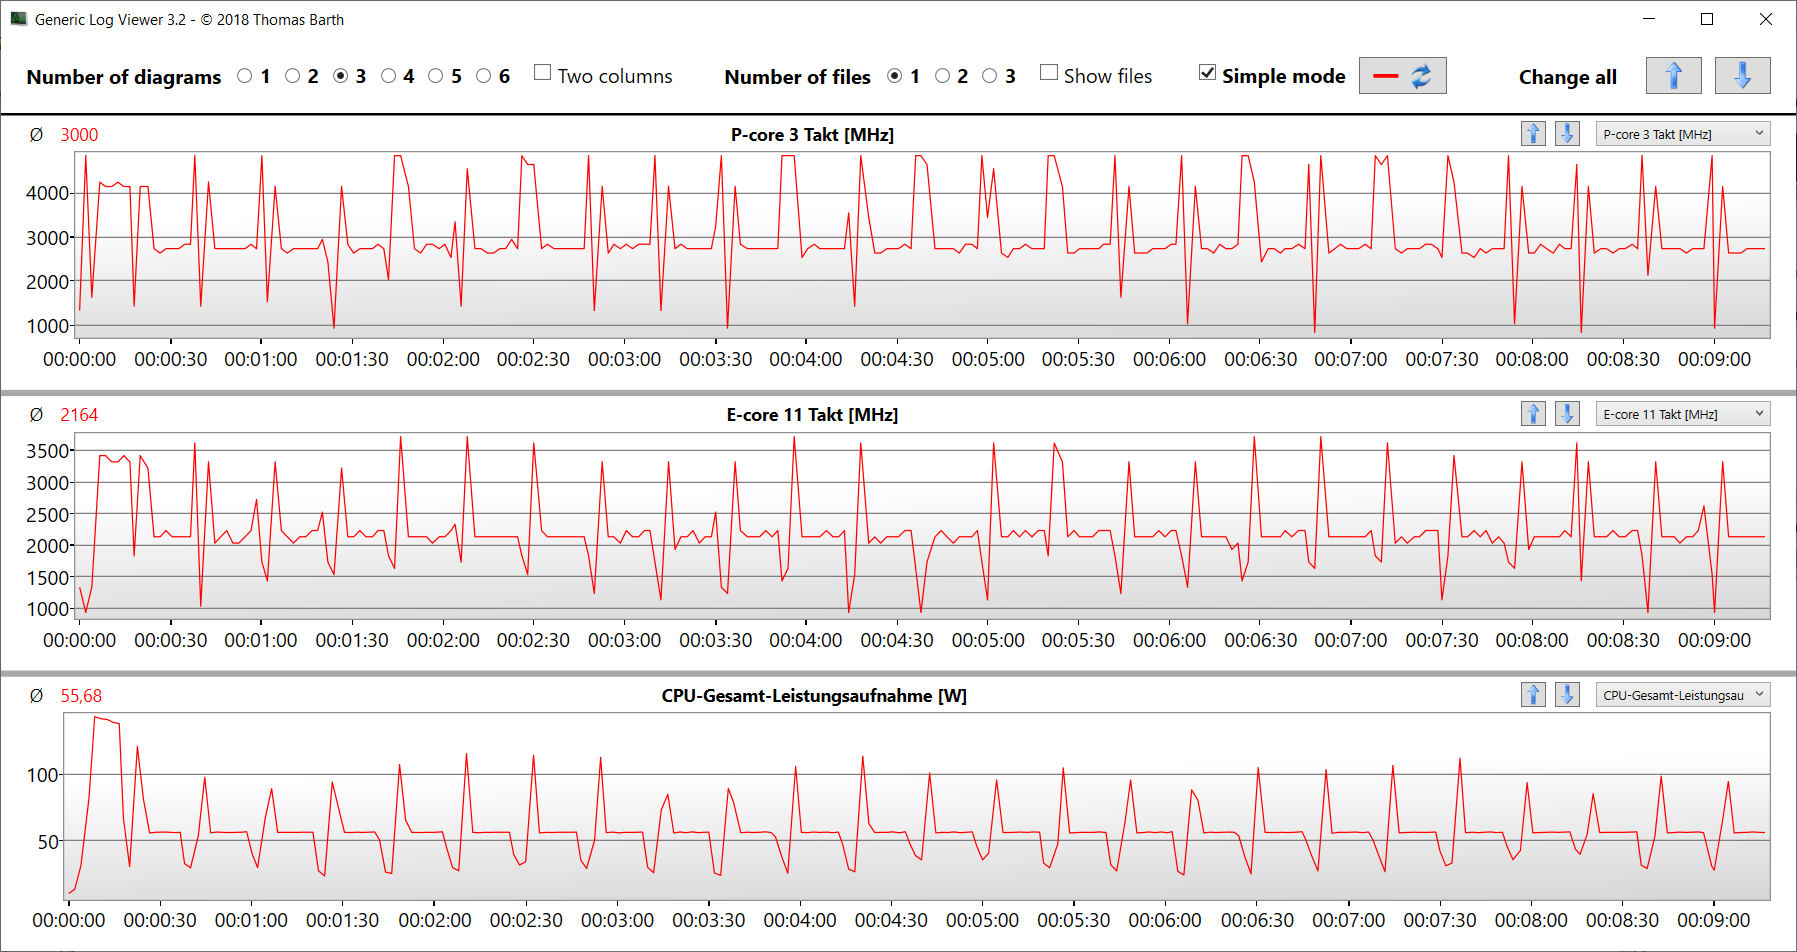
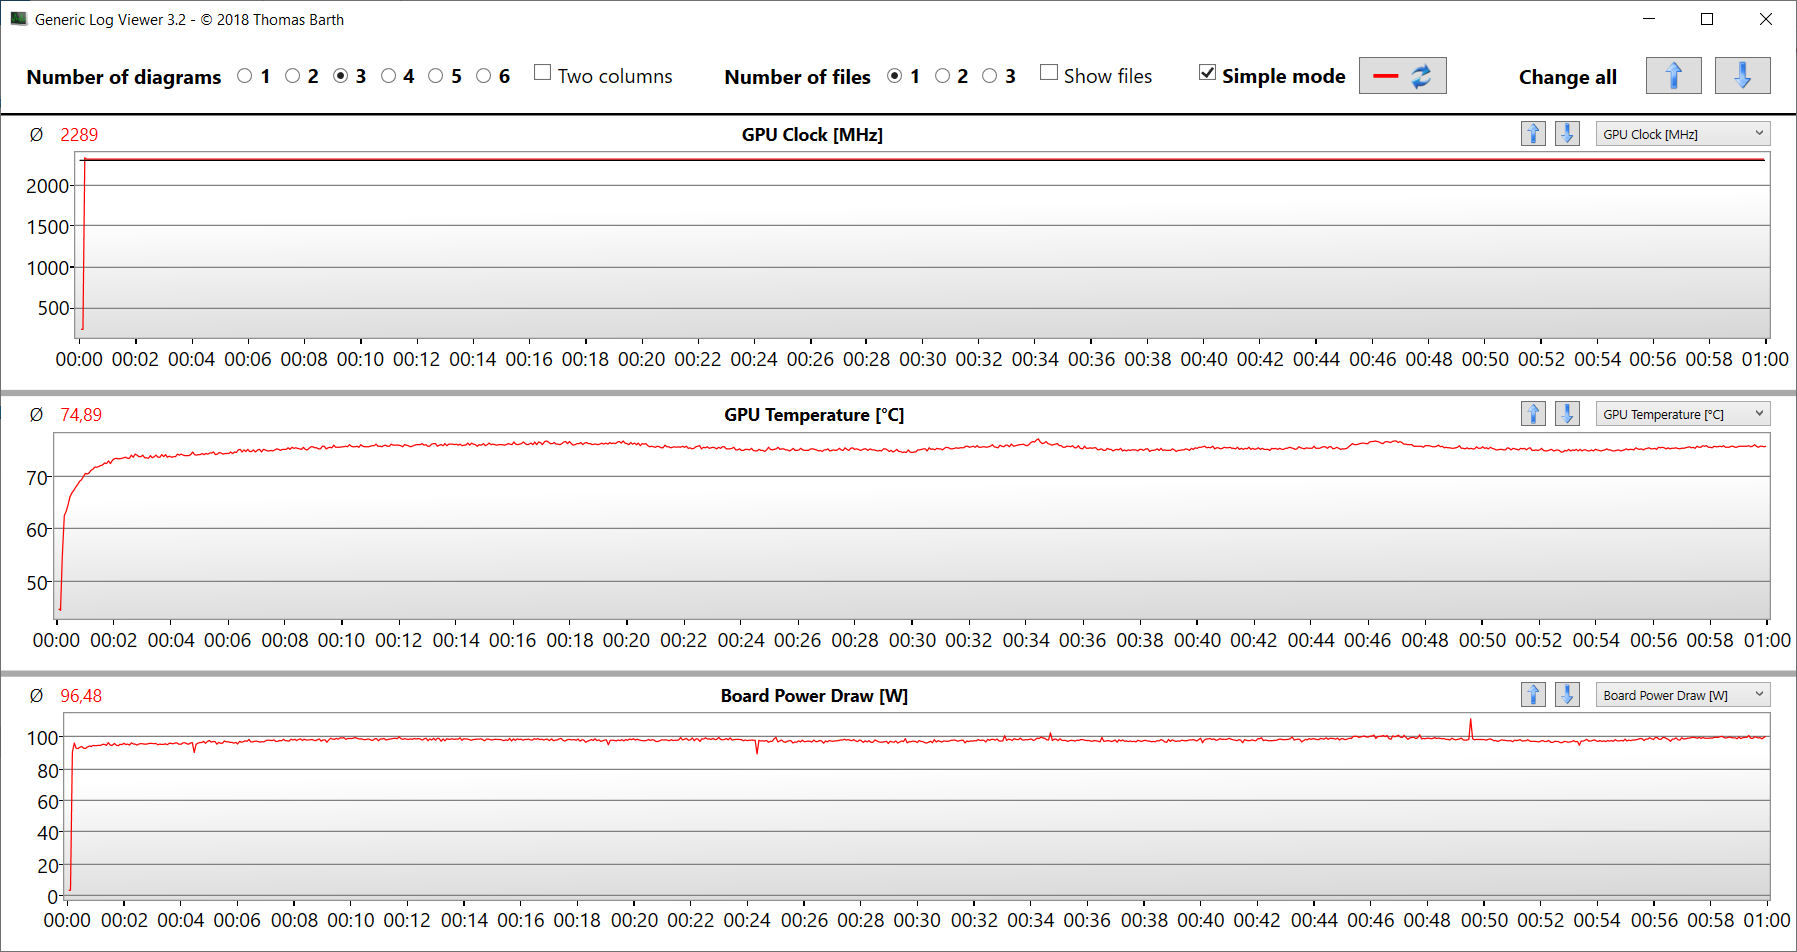
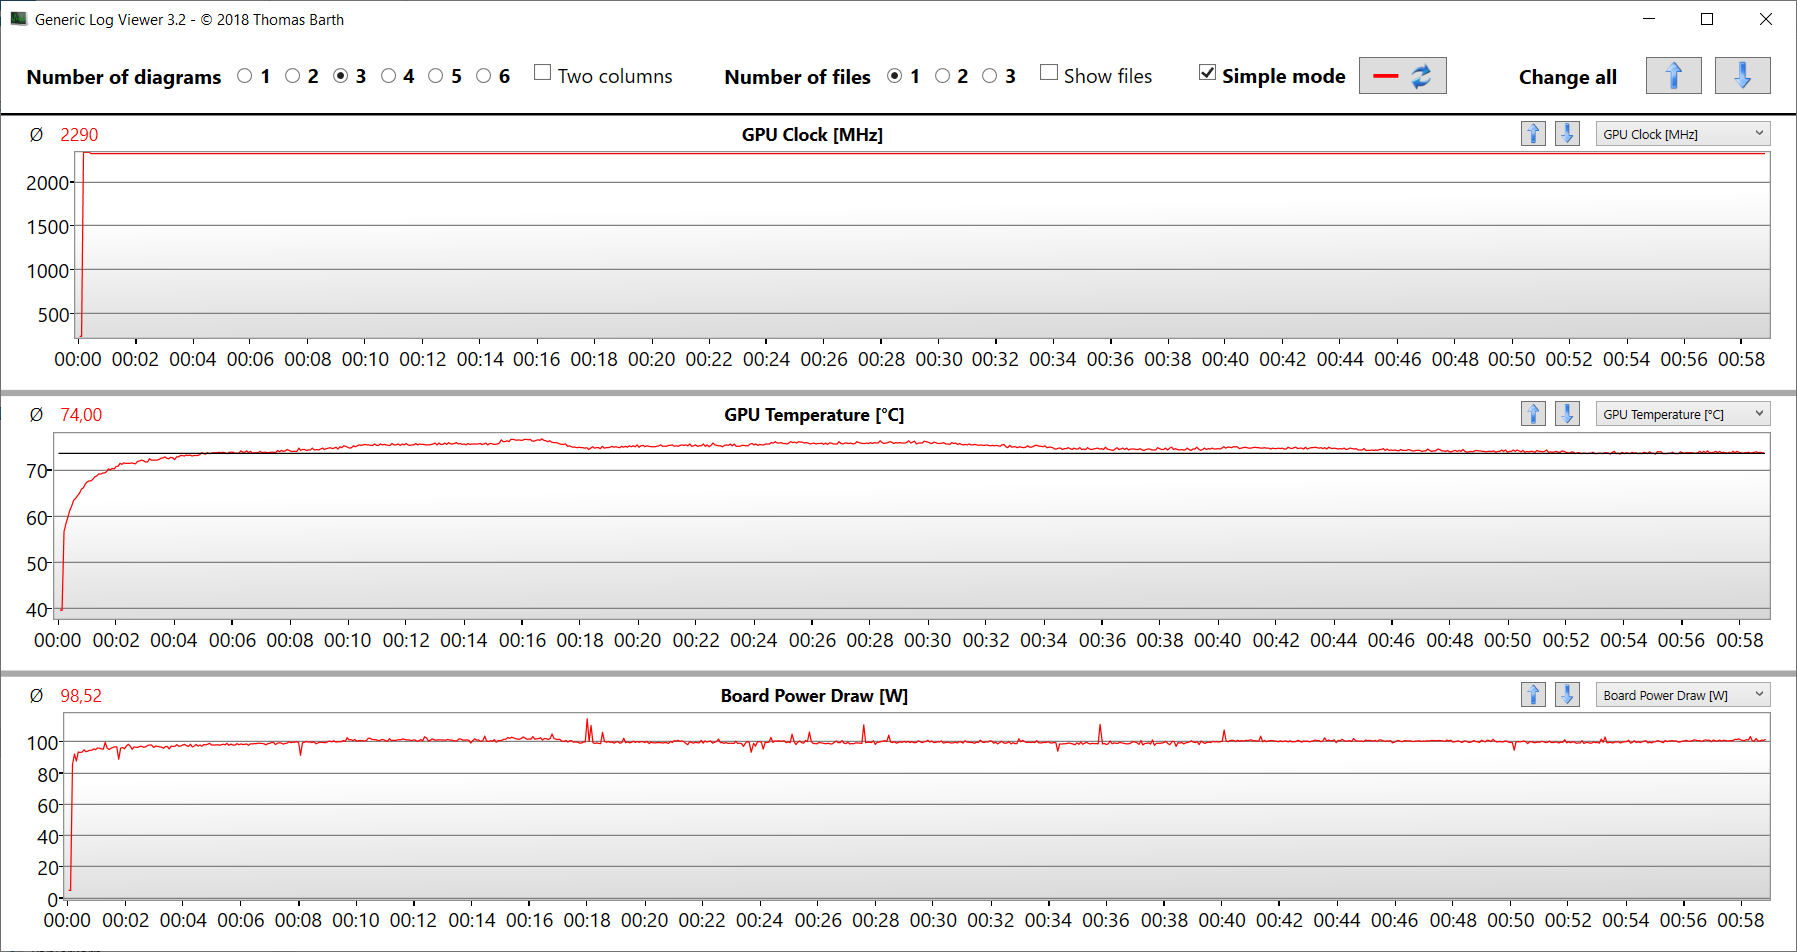
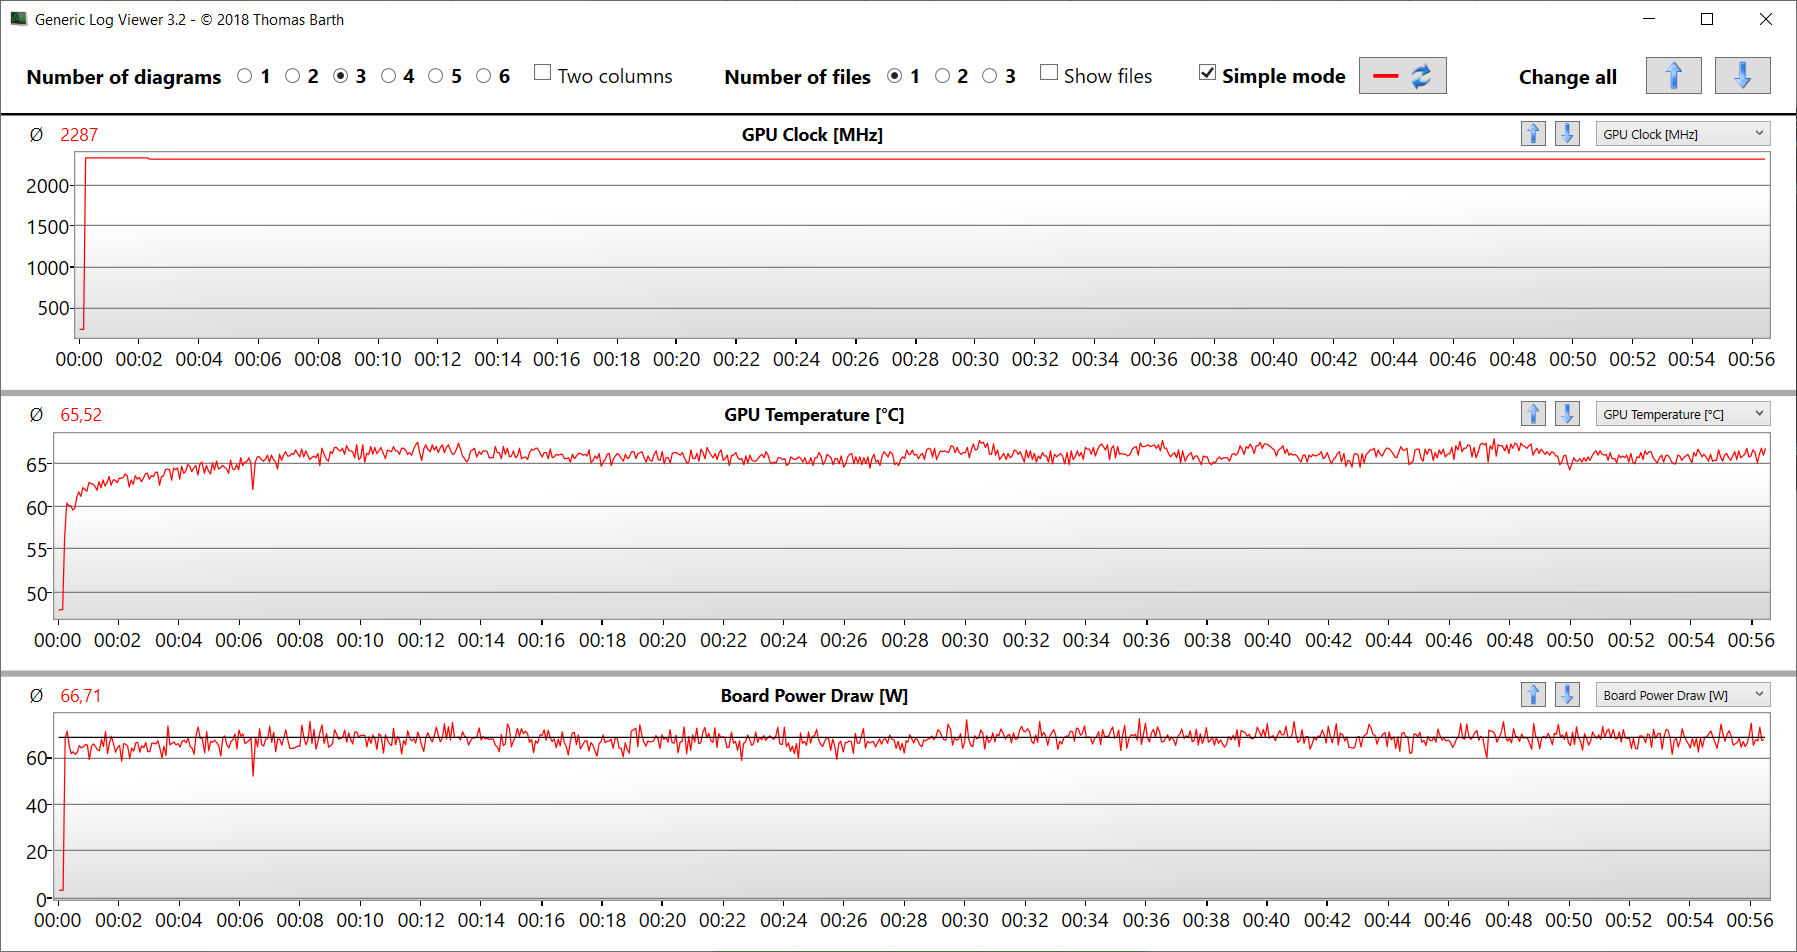
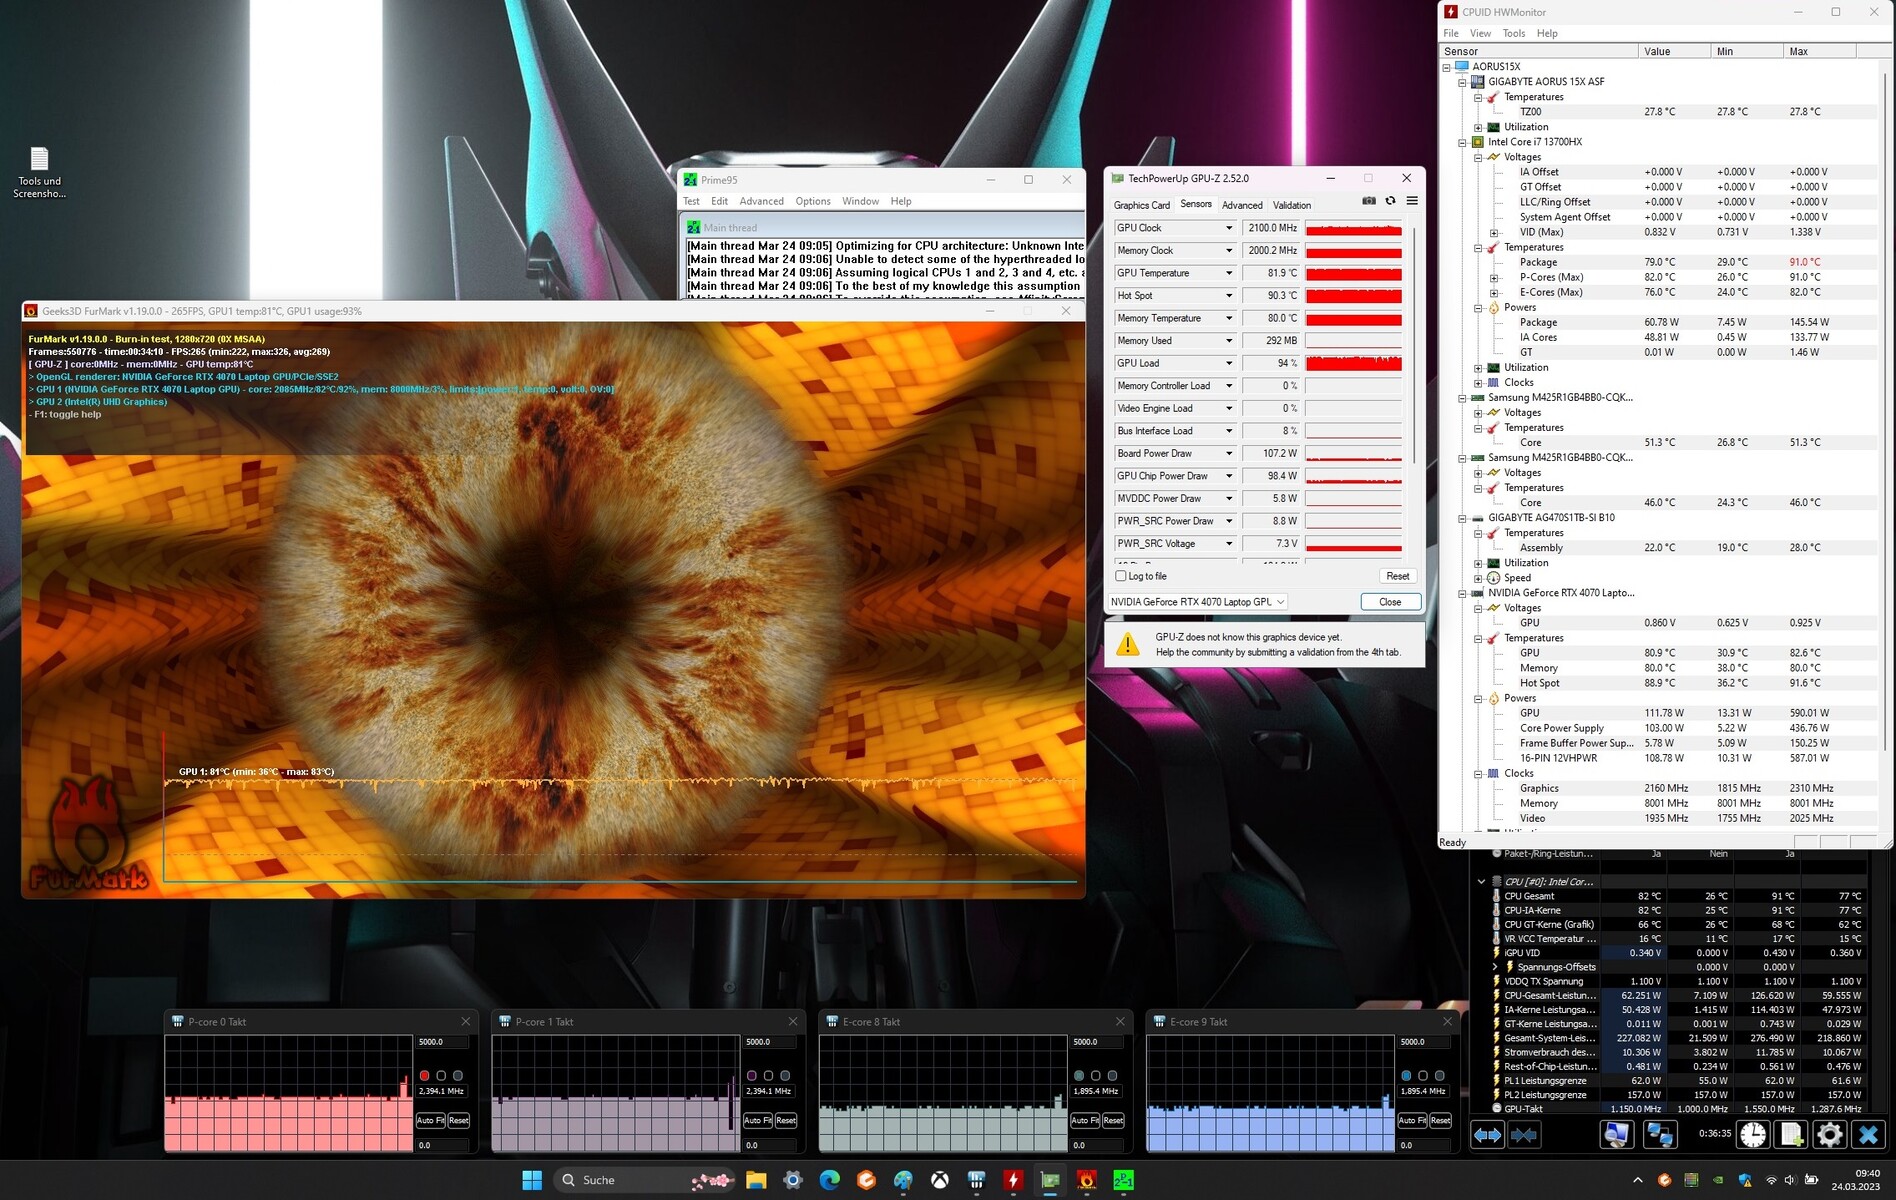
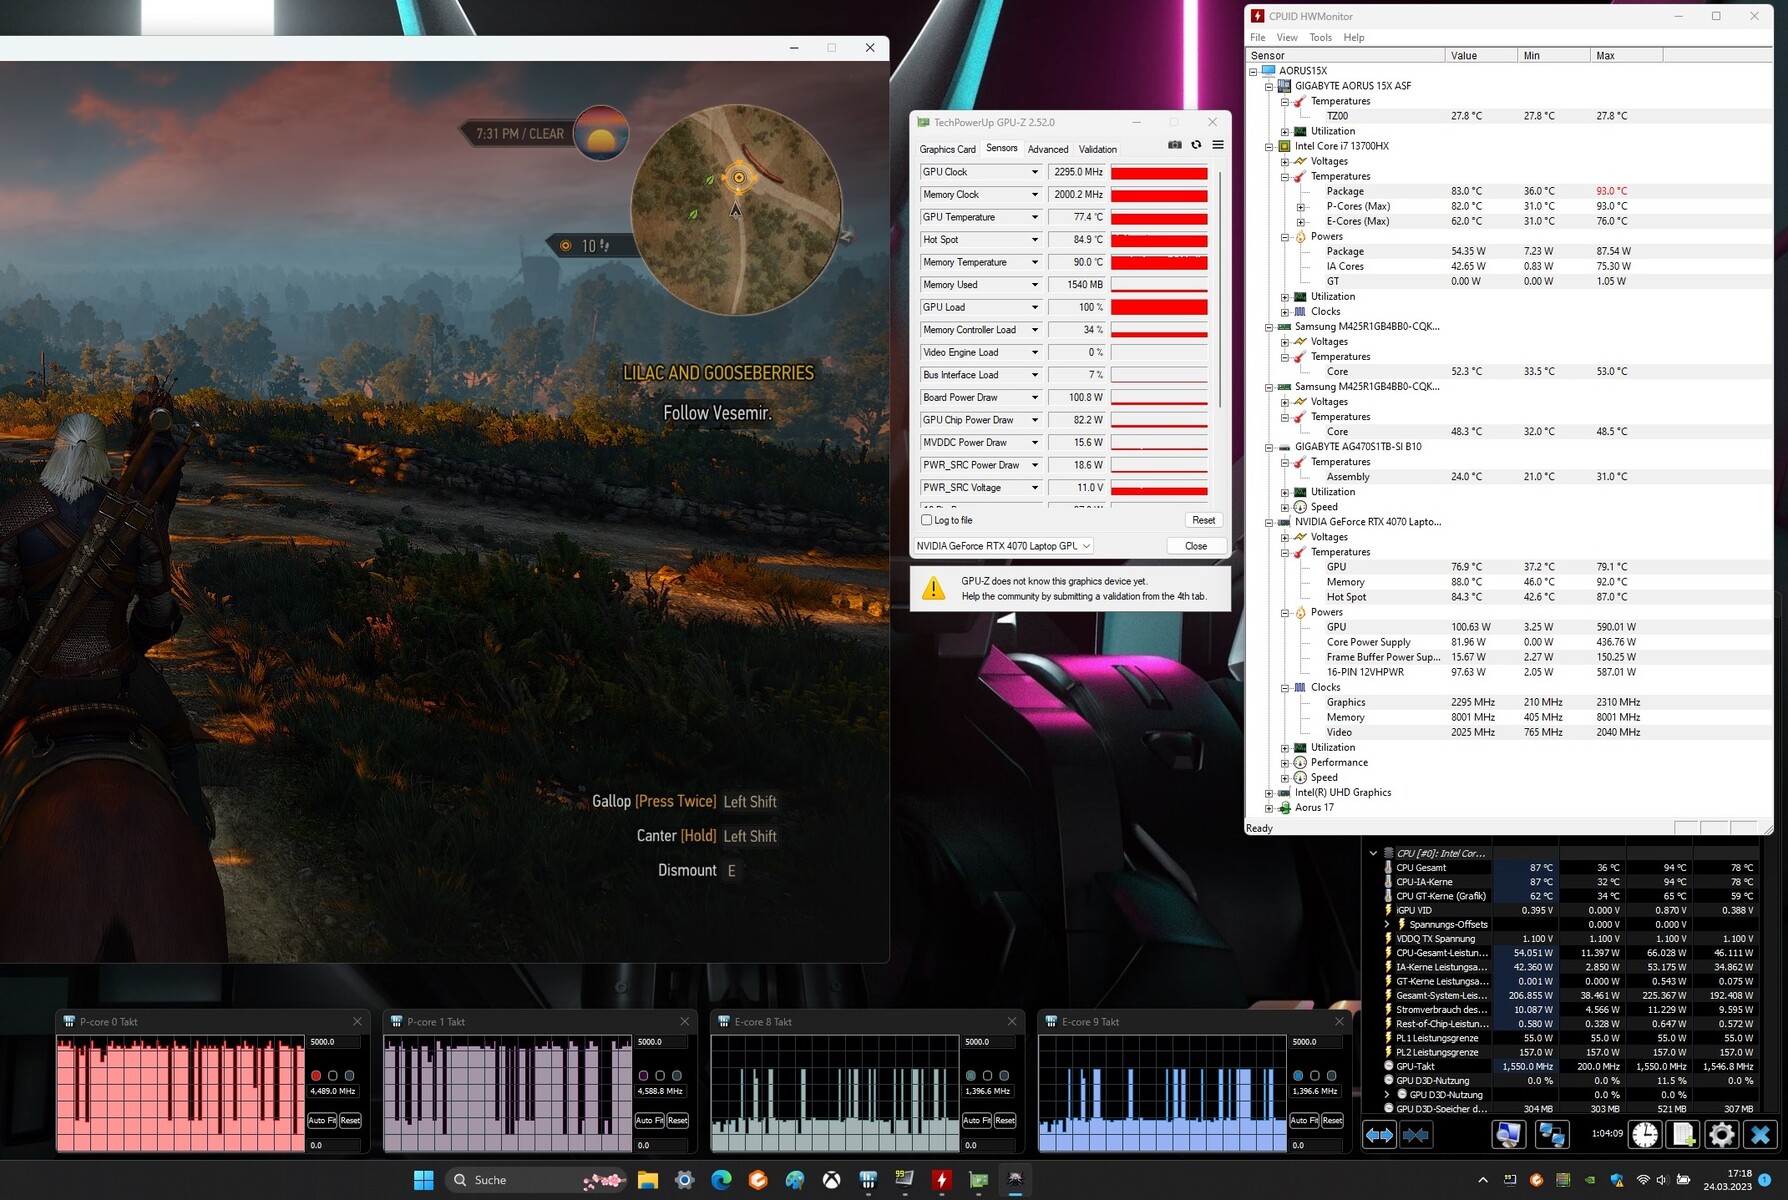
Teste de estresse
O teste de estresse (Prime95 e Furmark em uso contínuo) simula um cenário extremo para verificar quão estável o sistema está sob carga máxima.
A CPU (P: 2,7 a 2,8 GHz, E: 2,1 a 2,2 GHz) iniciou o teste com taxas médias de clock. Após um curto período de tempo, as taxas de clock afundaram para cerca de 2 a 2,5 GHz (P-cores) e 1,8 a 1,9 GHz (E-cores). A taxa de relógio da GPU afundou de 2,4 GHz a 2,1 GHz.
Oradores
Os alto-falantes estéreo produzem um som decente, mas dificilmente há um baixo. Os fones de ouvido ou alto-falantes externos são recomendados para uma melhor experiência sonora.
Aorus 15X ASF análise de áudio
(+) | os alto-falantes podem tocar relativamente alto (###valor### dB)
Graves 100 - 315Hz
(-) | quase nenhum baixo - em média 27.3% menor que a mediana
(-) | graves não são lineares (15.1% delta para frequência anterior)
Médios 400 - 2.000 Hz
(±) | médios mais altos - em média 5.8% maior que a mediana
(+) | médios são lineares (4.8% delta para frequência anterior)
Altos 2 - 16 kHz
(+) | agudos equilibrados - apenas 3.1% longe da mediana
(+) | os máximos são lineares (6.3% delta da frequência anterior)
Geral 100 - 16.000 Hz
(±) | a linearidade do som geral é média (20.1% diferença em relação à mediana)
Comparado com a mesma classe
» 71% de todos os dispositivos testados nesta classe foram melhores, 6% semelhantes, 23% piores
» O melhor teve um delta de 6%, a média foi 18%, o pior foi 132%
Comparado com todos os dispositivos testados
» 52% de todos os dispositivos testados foram melhores, 8% semelhantes, 40% piores
» O melhor teve um delta de 4%, a média foi 23%, o pior foi 134%
Asus ROG Strix G17 G713PI análise de áudio
(±) | o volume do alto-falante é médio, mas bom (###valor### dB)
Graves 100 - 315Hz
(+) | bons graves - apenas 4.6% longe da mediana
(+) | o baixo é linear (6.5% delta para a frequência anterior)
Médios 400 - 2.000 Hz
(+) | médios equilibrados - apenas 3.1% longe da mediana
(+) | médios são lineares (5.9% delta para frequência anterior)
Altos 2 - 16 kHz
(+) | agudos equilibrados - apenas 3.5% longe da mediana
(+) | os máximos são lineares (6.8% delta da frequência anterior)
Geral 100 - 16.000 Hz
(+) | o som geral é linear (9.5% diferença em relação à mediana)
Comparado com a mesma classe
» 3% de todos os dispositivos testados nesta classe foram melhores, 1% semelhantes, 95% piores
» O melhor teve um delta de 6%, a média foi 18%, o pior foi 132%
Comparado com todos os dispositivos testados
» 4% de todos os dispositivos testados foram melhores, 1% semelhantes, 95% piores
» O melhor teve um delta de 4%, a média foi 23%, o pior foi 134%
Gestão de energia - o computador Aorus não falta em resistência
Consumo de energia
O laptop Gigabyte não apresentou nenhuma anormalidade em termos de consumo de energia. As tarifas estavam em um nível normal para o hardware instalado. O Witcher 3 teste e teste de estresse foram executados com consumo de energia relativamente constante. O conector de energia (280 watts) é suficientemente dimensionado.
| desligado | |
| Ocioso | |
| Carga |
|
Key:
min: | |
| Aorus 15X ASF i7-13700HX, GeForce RTX 4070 Laptop GPU | Razer Blade 15 OLED (Early 2022) i9-12900H, GeForce RTX 3070 Ti Laptop GPU | MSI Katana 17 B13VFK i7-13620H, GeForce RTX 4060 Laptop GPU | Asus ROG Strix G17 G713PI R9 7945HX, GeForce RTX 4070 Laptop GPU | Acer Predator Helios 300 (i7-12700H, RTX 3070 Ti) i7-12700H, GeForce RTX 3070 Ti Laptop GPU | Média NVIDIA GeForce RTX 4070 Laptop GPU | Média da turma Gaming | |
|---|---|---|---|---|---|---|---|
| Power Consumption | -57% | 15% | -14% | -19% | -2% | -8% | |
| Idle Minimum * (Watt) | 11 | 31.6 -187% | 12.2 -11% | 15 -36% | 15 -36% | 13.2 ? -20% | 13 ? -18% |
| Idle Average * (Watt) | 16 | 33.3 -108% | 14.9 7% | 20 -25% | 20 -25% | 18.2 ? -14% | 19 ? -19% |
| Idle Maximum * (Watt) | 24 | 38.6 -61% | 15.8 34% | 29 -21% | 22.3 7% | 24.6 ? -3% | 24.6 ? -3% |
| Load Average * (Watt) | 104 | 149 -43% | 85.22 18% | 121 -16% | 133 -28% | 97 ? 7% | 110.7 ? -6% |
| Witcher 3 ultra * (Watt) | 185.4 | 149.6 19% | 151.1 19% | 179.8 3% | 231 -25% | ||
| Load Maximum * (Watt) | 272 | 160 41% | 212.8 22% | 246 10% | 290 -7% | 221 ? 19% | 259 ? 5% |
* ... menor é melhor
Power consumption Witcher 3 / stress test
Power consumption with external monitor
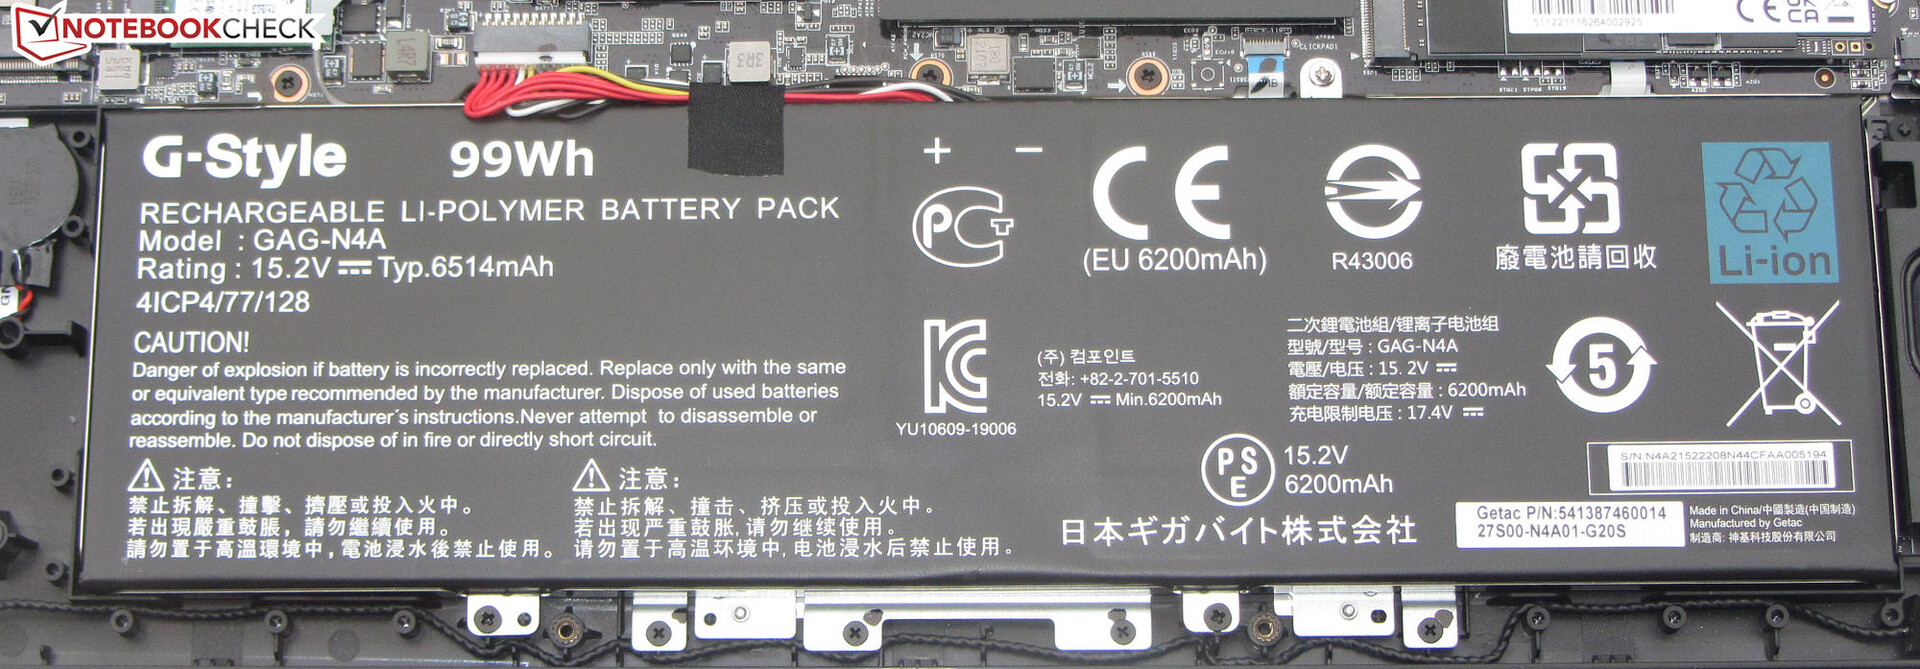
Tempos de execução
O dispositivo de 15,6 polegadas atingiu tempos de execução de 8:09 horas e 7:52 horas no teste WLAN (chamando websites através de um roteiro) e teste de vídeo (pequeno filme Big Buck Bunny (codificação H.264, FHD) em um loop), respectivamente. Durante ambos os testes, os recursos de economia de energia do notebook foram desativados e o brilho do visor foi ajustado para cerca de 150 cd/m². Os módulos sem fio também foram desabilitados para o teste de vídeo.
O Aorus 15 forneceu bons tempos de funcionamento da bateria em geral - não apenas para um laptop de jogos. Levando em consideração a enorme capacidade da bateria (99 Wh), estas taxas não são surpreendentes. No entanto, o laptop da Gigabyte também está à frente em termos de watt-hora.
| Aorus 15X ASF i7-13700HX, GeForce RTX 4070 Laptop GPU, 99 Wh | Razer Blade 15 OLED (Early 2022) i9-12900H, GeForce RTX 3070 Ti Laptop GPU, 80 Wh | MSI Katana 17 B13VFK i7-13620H, GeForce RTX 4060 Laptop GPU, 53.5 Wh | Asus ROG Strix G17 G713PI R9 7945HX, GeForce RTX 4070 Laptop GPU, 90 Wh | Acer Predator Helios 300 (i7-12700H, RTX 3070 Ti) i7-12700H, GeForce RTX 3070 Ti Laptop GPU, 90 Wh | Média da turma Gaming | |
|---|---|---|---|---|---|---|
| Duração da bateria | -26% | -58% | -54% | -21% | -15% | |
| Reader / Idle (h) | 11.3 | 6.7 -41% | 8.27 ? -27% | |||
| H.264 (h) | 7.9 | 5.9 -25% | 2.8 -65% | 5.9 -25% | 8.32 ? 5% | |
| WiFi v1.3 (h) | 8.2 | 4.6 -44% | 2.9 -65% | 4.3 -48% | 6 -27% | 7.11 ? -13% |
| Load (h) | 2 | 2.1 5% | 1 -50% | 1 -50% | 1.8 -10% | 1.502 ? -25% |
| Witcher 3 ultra (h) | 1.1 |
Pro
Contra
Veredicto - Um computador portátil para jogos bem redondo
Enquanto o Aorus 15X é projetado para jogos de QHD em configurações altas ao máximo, ele também funciona bem em outras áreas exigentes, como edição e renderização de vídeo. ONúcleo i7-13700HX eGeForce RTX 4070 laptop fornecem o poder de processamento necessário. Um PCIe-4-SSD (1 TB) super-rápido garante tempos de carregamento curtos.
Poderoso, duradouro e silencioso quando necessário - o Aorus 15X ASF pode atender a muitas das exigências impostas a um laptop moderno para jogos.
A CPU e a GPU trabalham com taxas de relógio consistentemente altas. O ruído e o desenvolvimento de calor estão no nível normalmente alto. Entretanto, é possível uma operação silenciosa a completamente silenciosa - com poder de processamento significativamente reduzido. No entanto, isto ainda atenderia as exigências dos usuários para o uso diário e permitiria jogos em configurações reduzidas.
A tela mate QHD (15,6 polegadas, IPS, 240 Hz) não precisa ser criticada. Uma porta Thunderbolt 4 abre opções de expansão (solução de acoplamento, GPU externo). Ela também pode ser usada para alimentar o laptop através de um adaptador de energia USB-C (mínimo 65 watts) - É suportado o fornecimento de energia. Tempos de funcionamento da bateria de cerca de 8 horas completam o pacote geral.
OLâmina Razer 15 OLED poderia revelar-se uma alternativa viável a este dispositivo. Ele oferece menos poder de processamento que o laptop Aorus, mas marca pontos extras com suas dimensões mais compactas, menor peso e uma tela OLED de alto contraste e verdadeira cor.
Preço e disponibilidade
O Aorus 15X ASF pode ser adquirido na configuração que testamos por $2.099 na Amazon.
Aorus 15X ASF
- 04/05/2023 v7 (old)
Sascha Mölck
Transparência
A seleção dos dispositivos a serem analisados é feita pela nossa equipe editorial. A amostra de teste foi fornecida ao autor como empréstimo pelo fabricante ou varejista para fins desta revisão. O credor não teve influência nesta revisão, nem o fabricante recebeu uma cópia desta revisão antes da publicação. Não houve obrigação de publicar esta revisão. Como empresa de mídia independente, a Notebookcheck não está sujeita à autoridade de fabricantes, varejistas ou editores.
É assim que o Notebookcheck está testando
Todos os anos, o Notebookcheck analisa de forma independente centenas de laptops e smartphones usando procedimentos padronizados para garantir que todos os resultados sejam comparáveis. Desenvolvemos continuamente nossos métodos de teste há cerca de 20 anos e definimos padrões da indústria no processo. Em nossos laboratórios de teste, equipamentos de medição de alta qualidade são utilizados por técnicos e editores experientes. Esses testes envolvem um processo de validação em vários estágios. Nosso complexo sistema de classificação é baseado em centenas de medições e benchmarks bem fundamentados, o que mantém a objetividade.Price comparison

