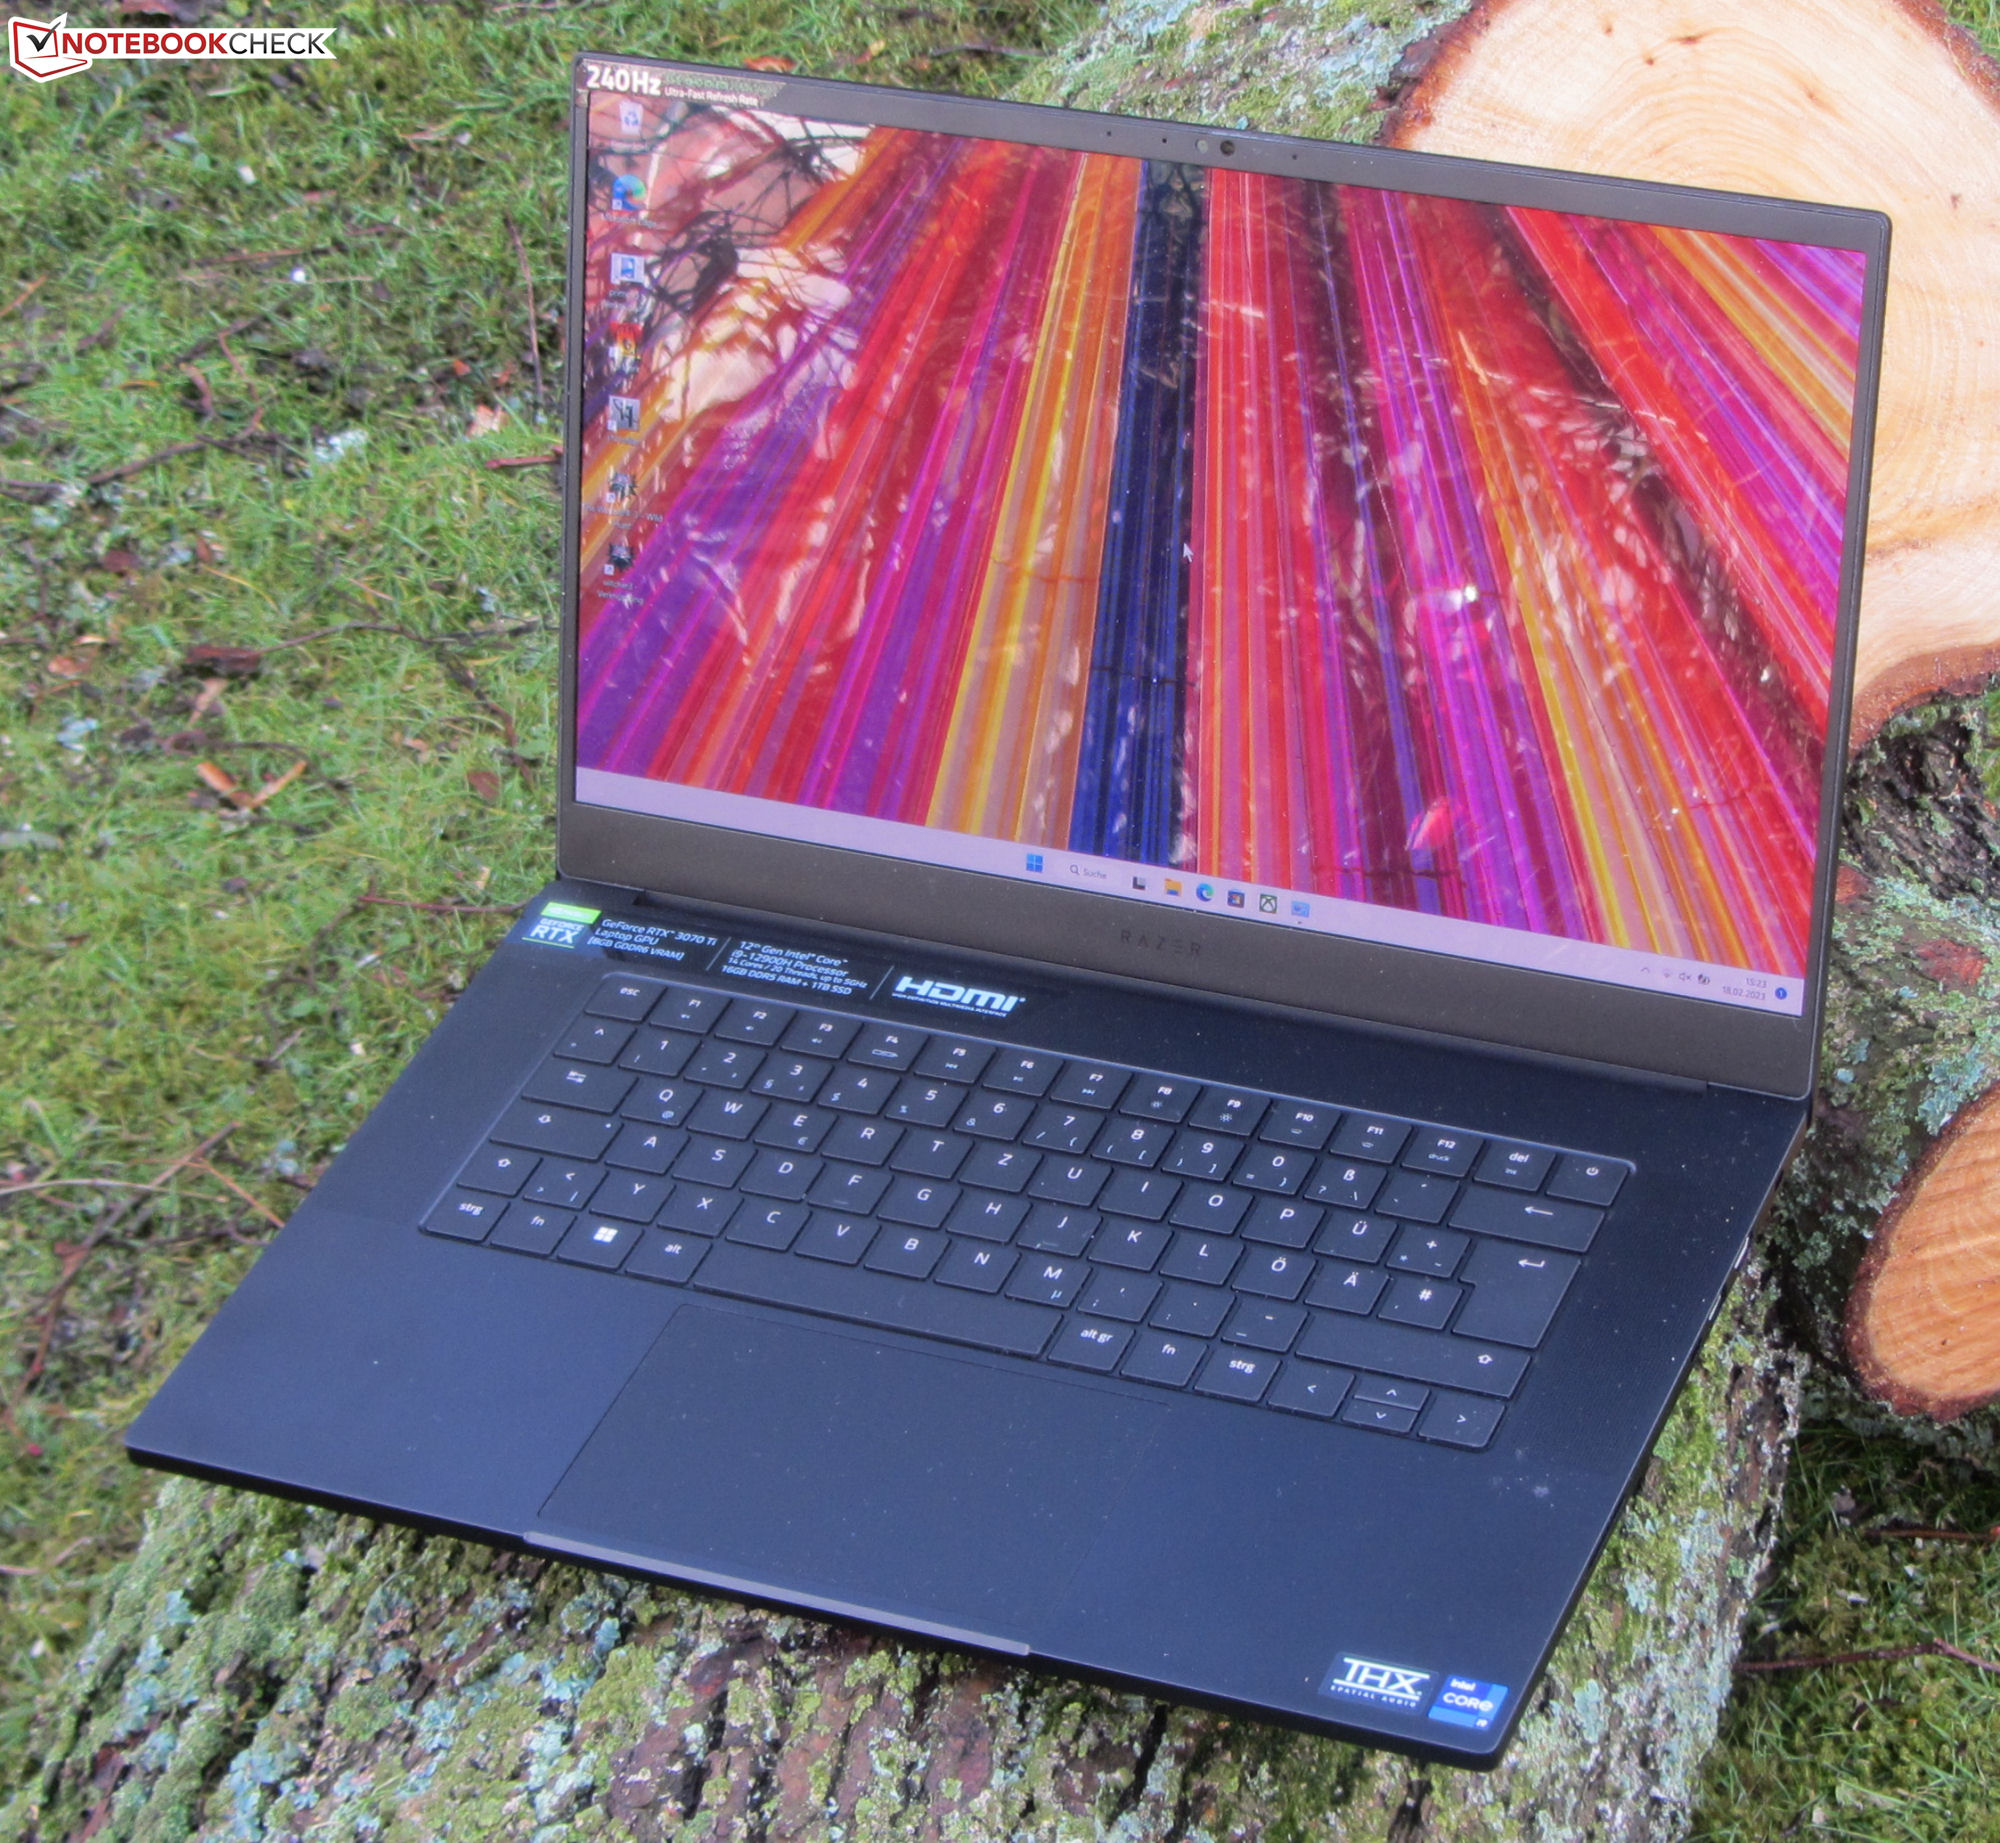
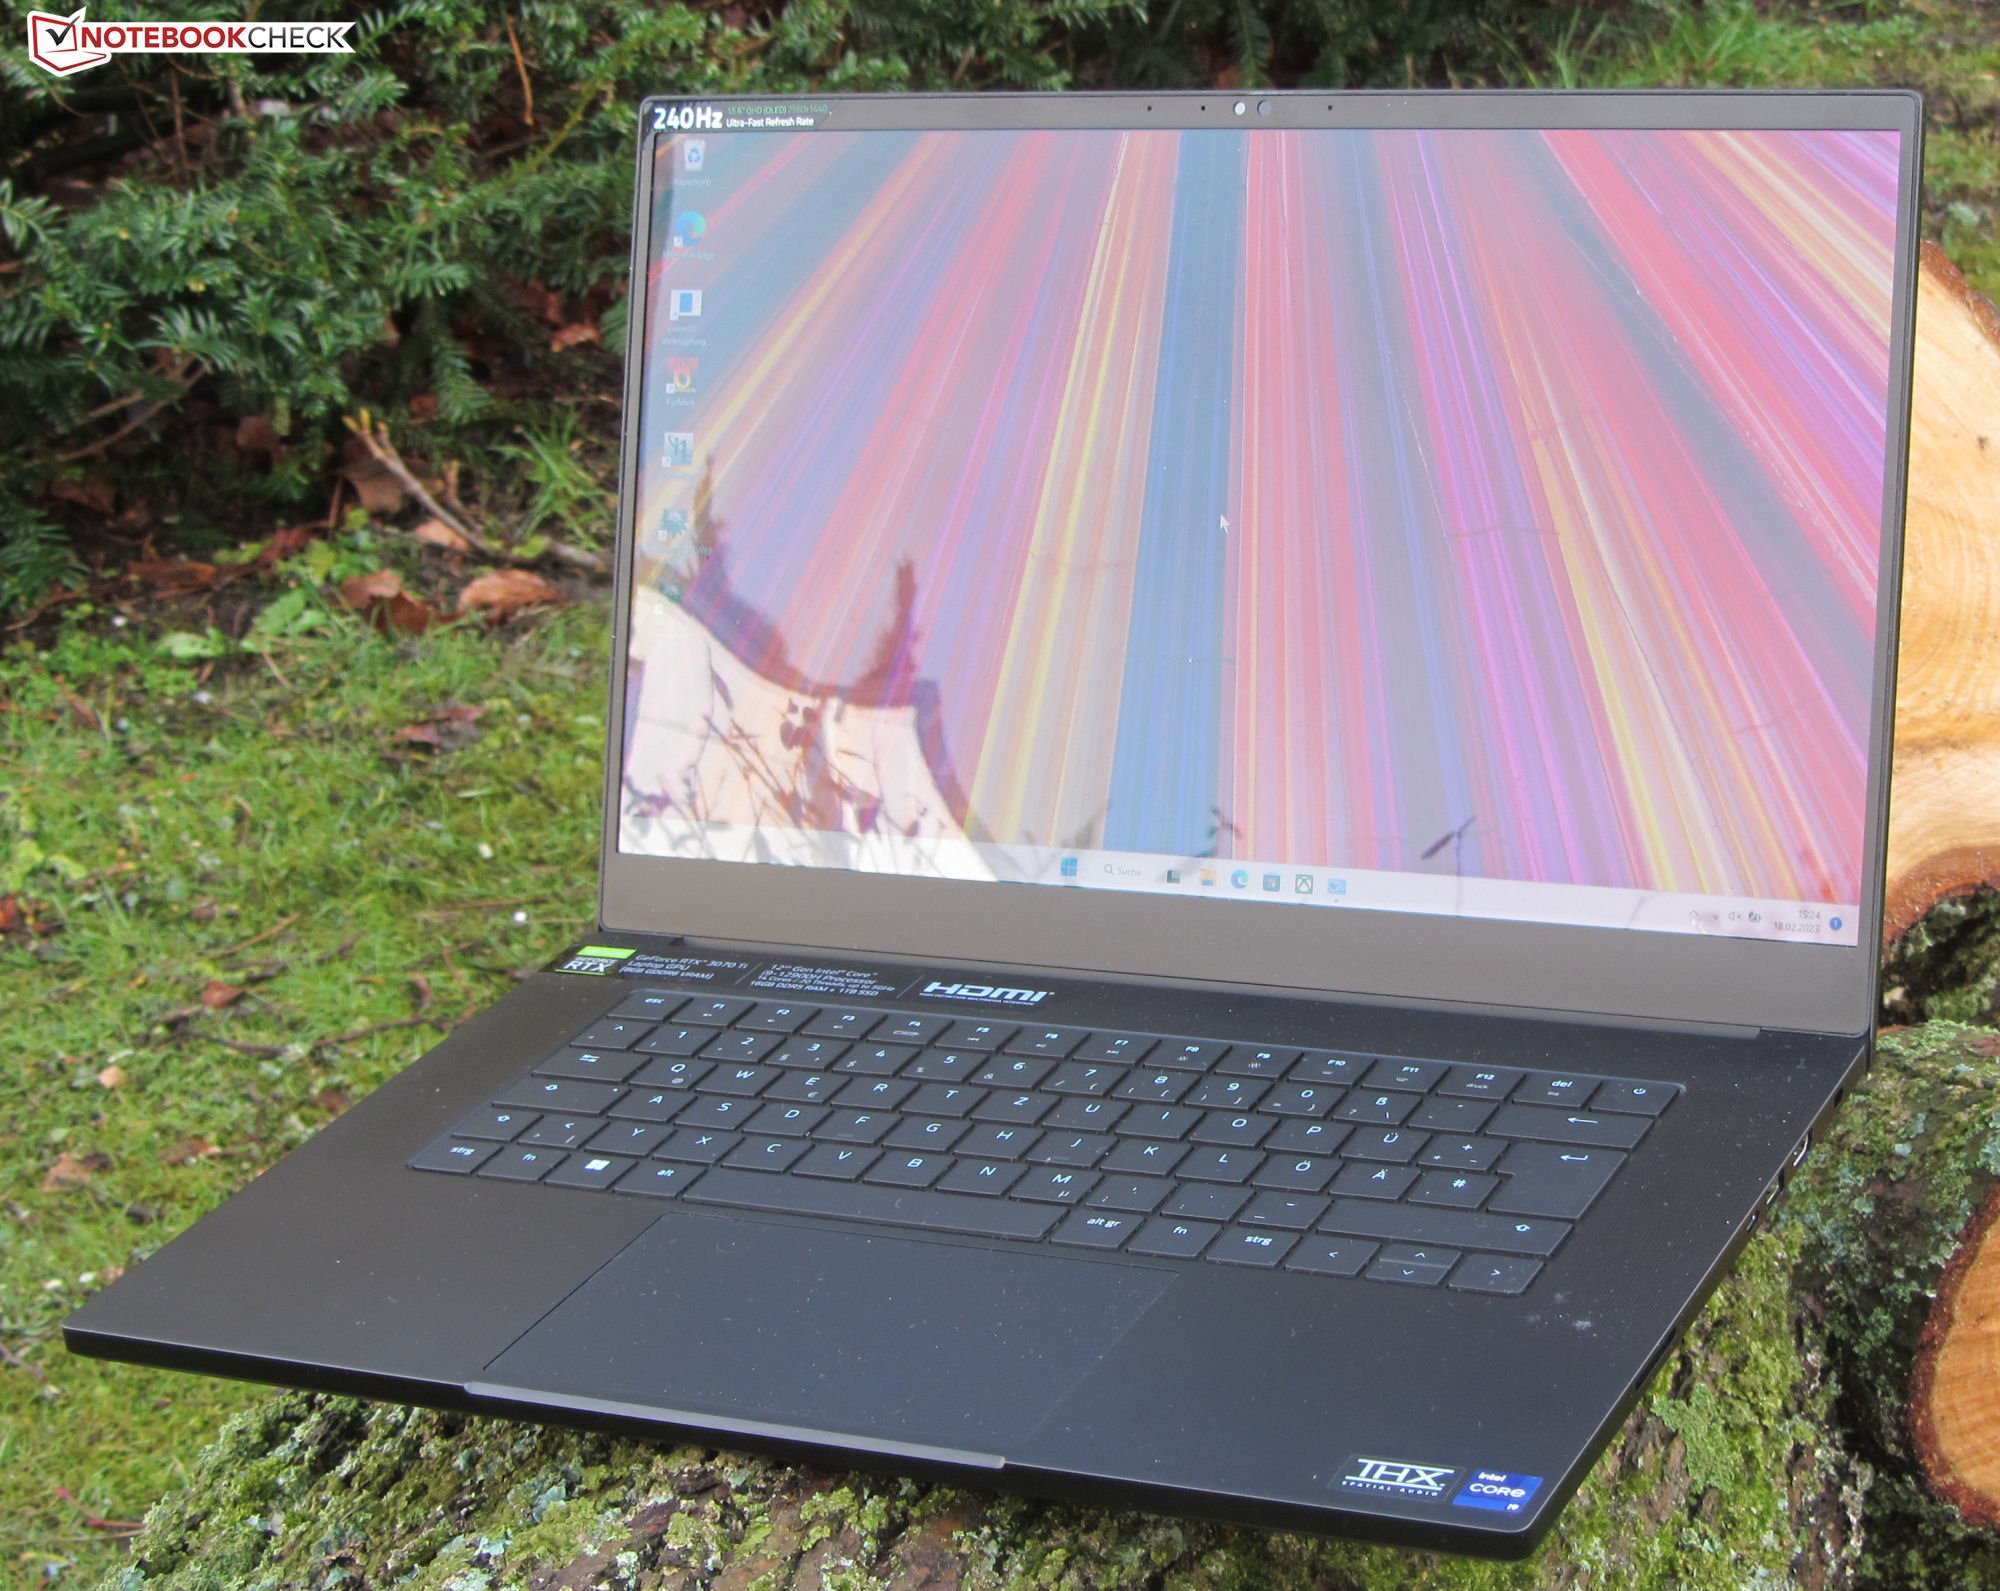
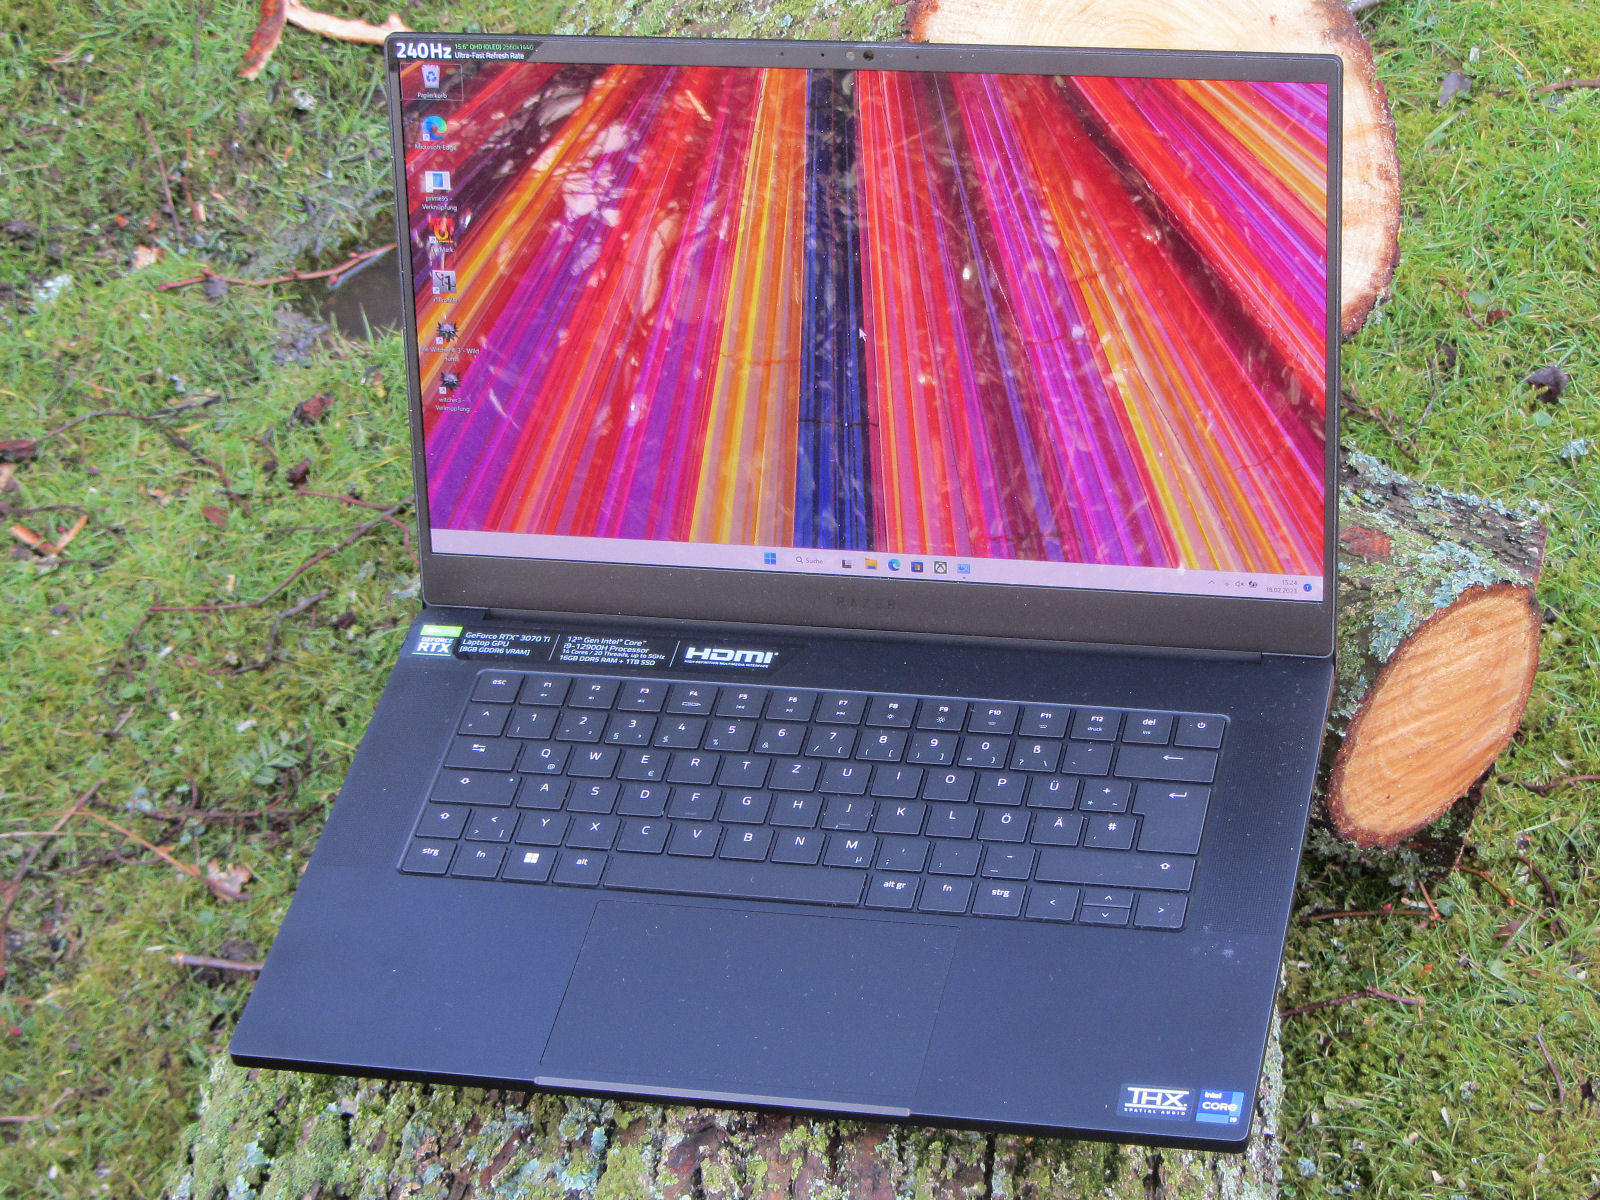
Revisão da Razer Blade 15 OLED (início de 2022): Um laptop compacto para jogos com um RTX 3070 Ti

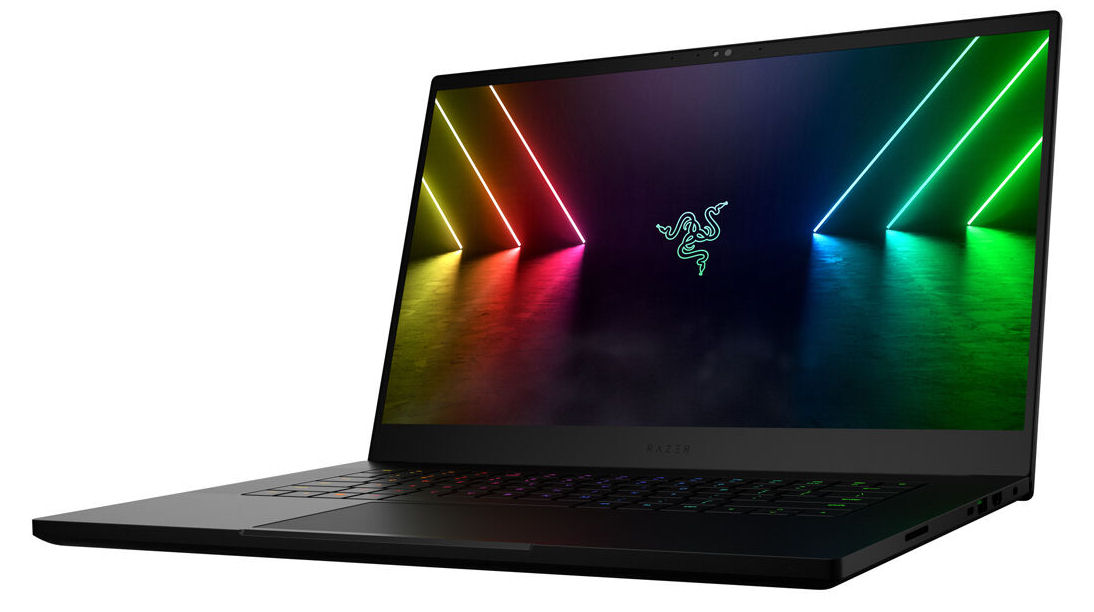
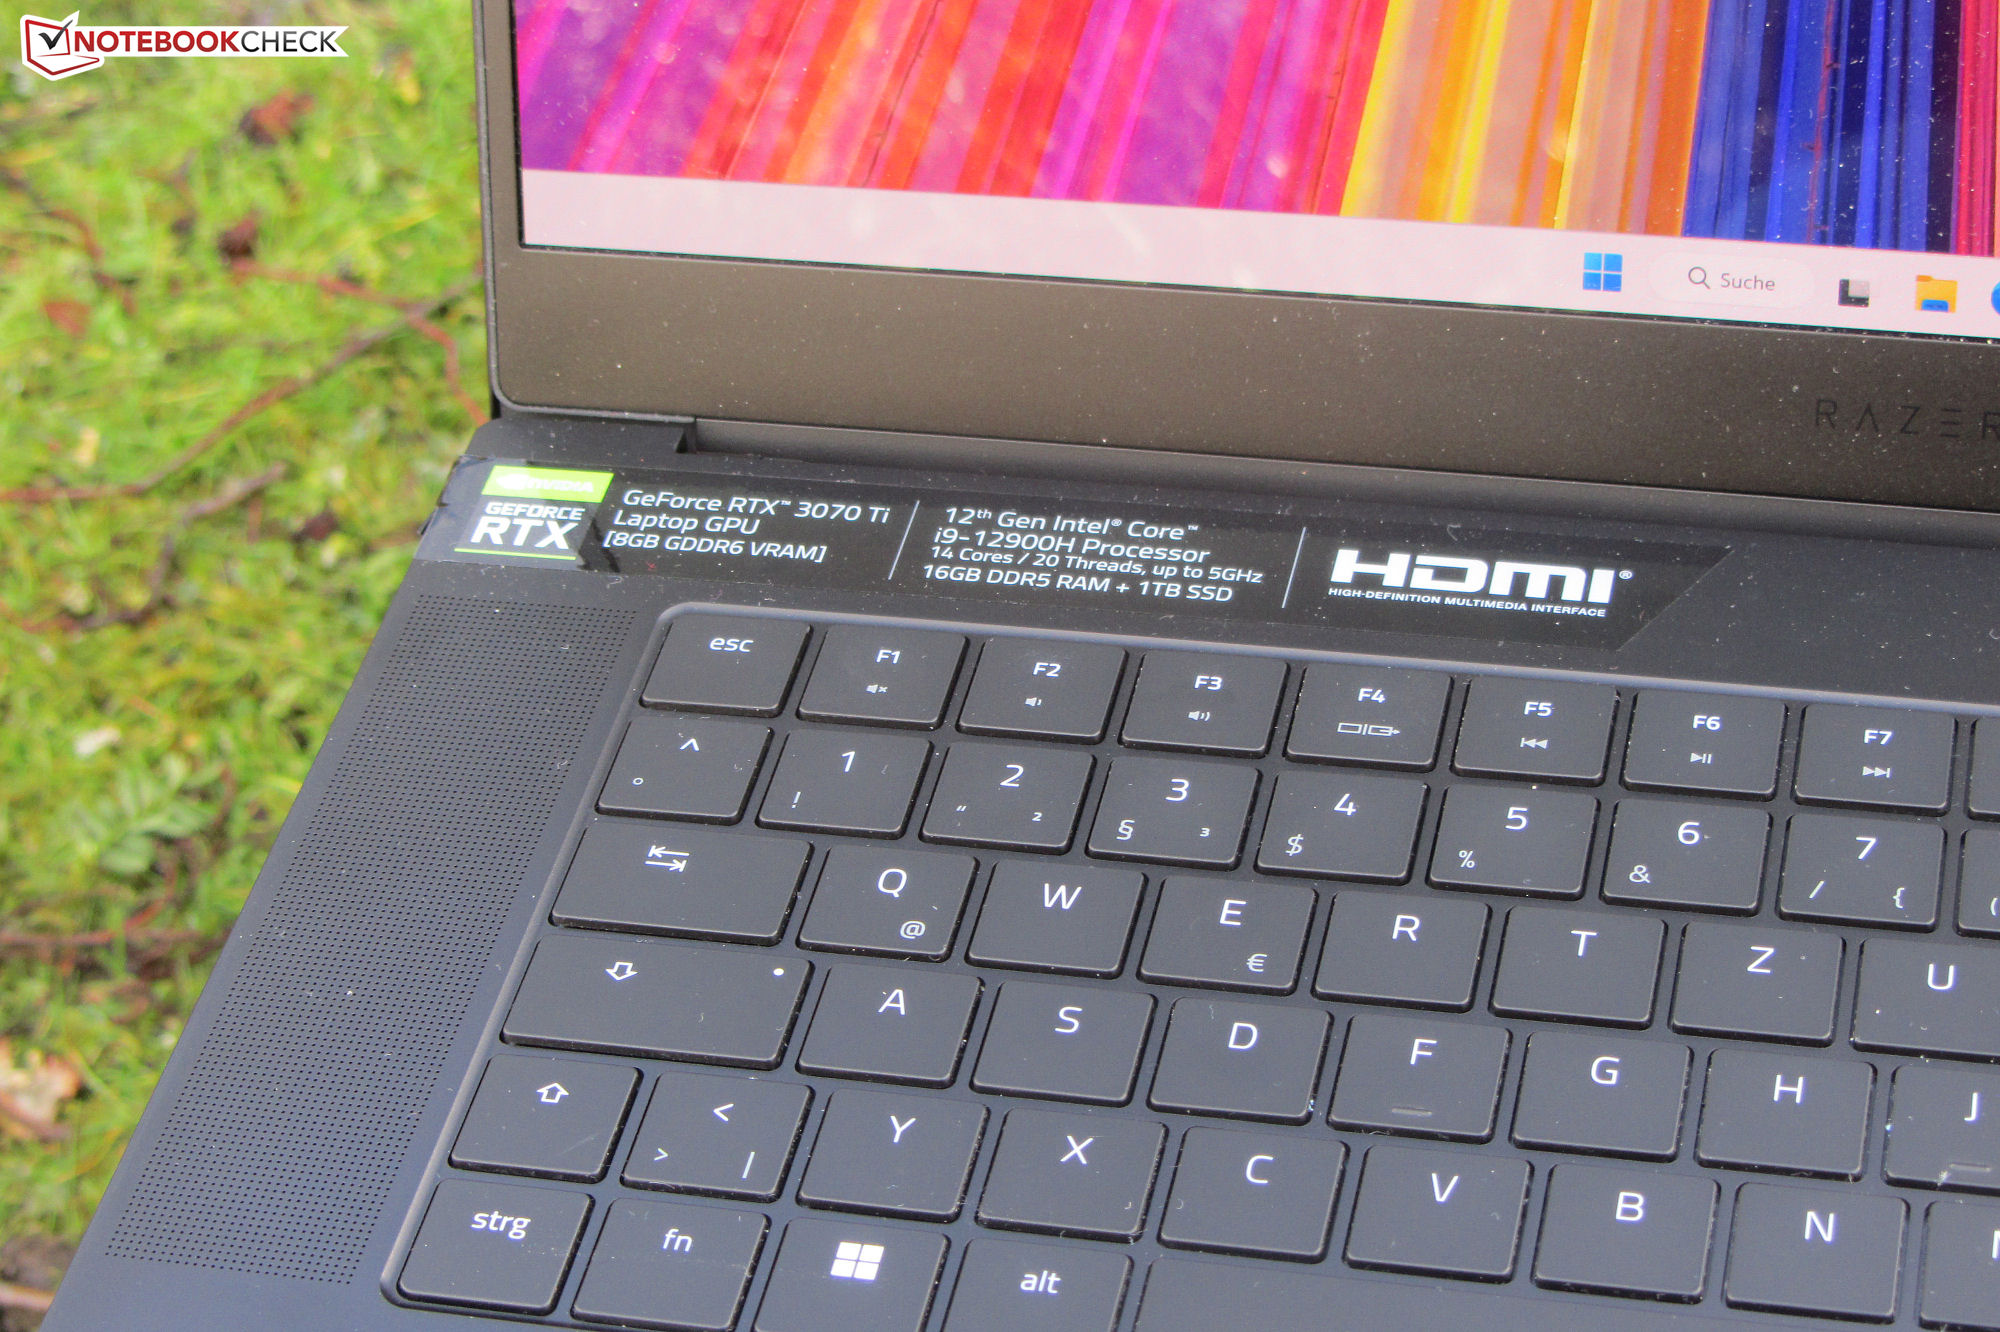
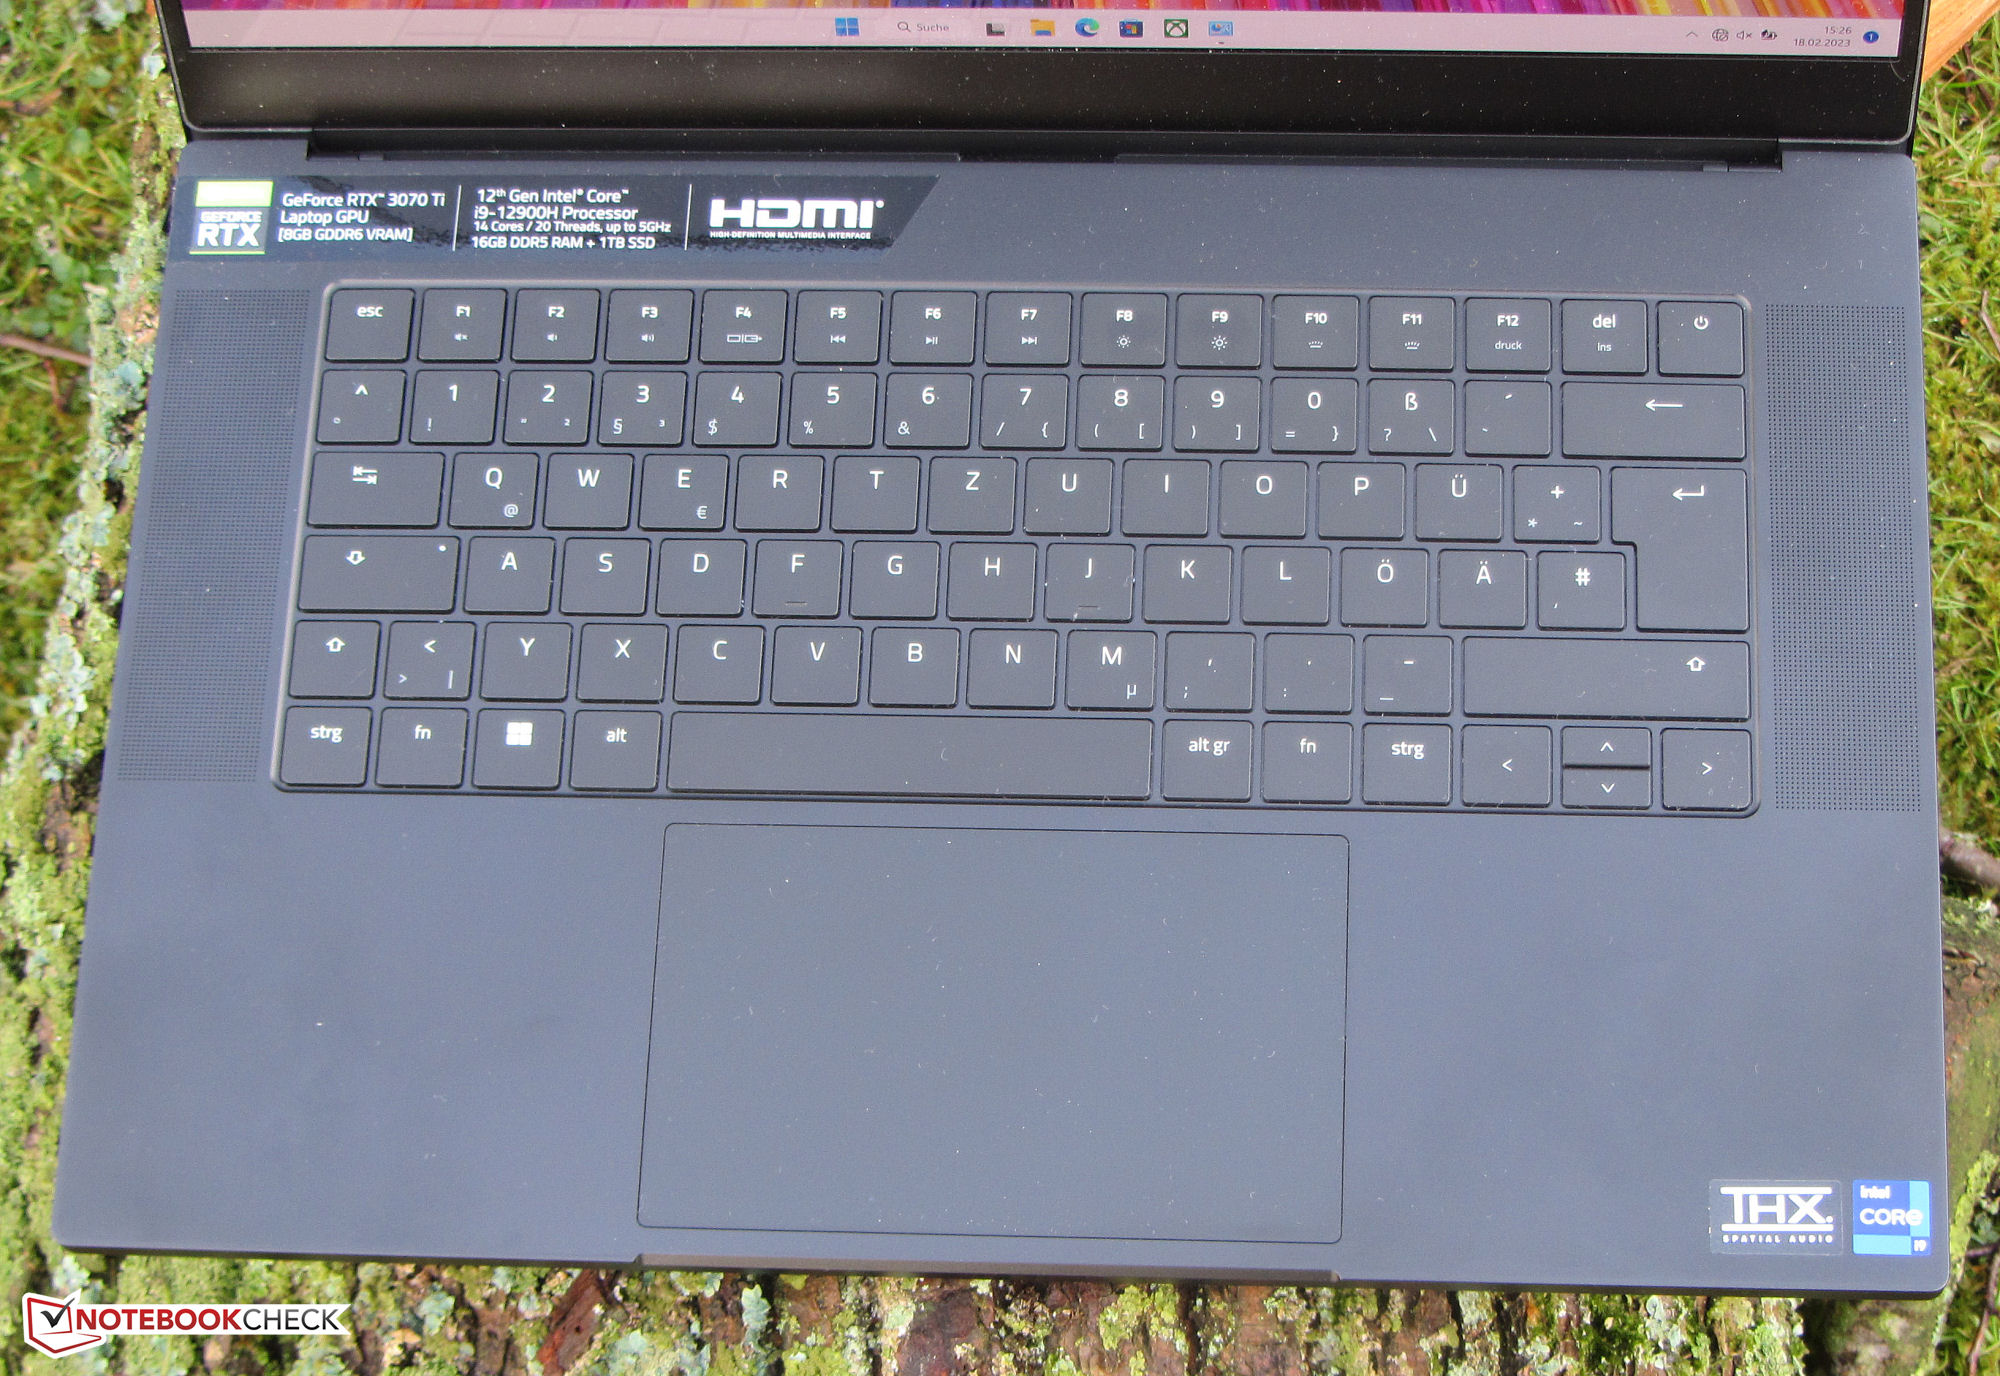
A Razer Blade 15 (início de 2022) tem ambições de ser um laptop tanto para os jogadores quanto para os usuários criativos. O hardware adequado está a bordo: Núcleo i9-12900HcPU, GeForce RTX 3070 TigPU laptop e um visor OLED (QHD) colorido e preciso. Concorrentes compactos similares podem ser encontrados na forma do Schenker XMG Fusion 15 (meados de 22)oAorus 15 XE5oHP Omen 16e oAsus ROG Zephyrus M16 GU603Z.
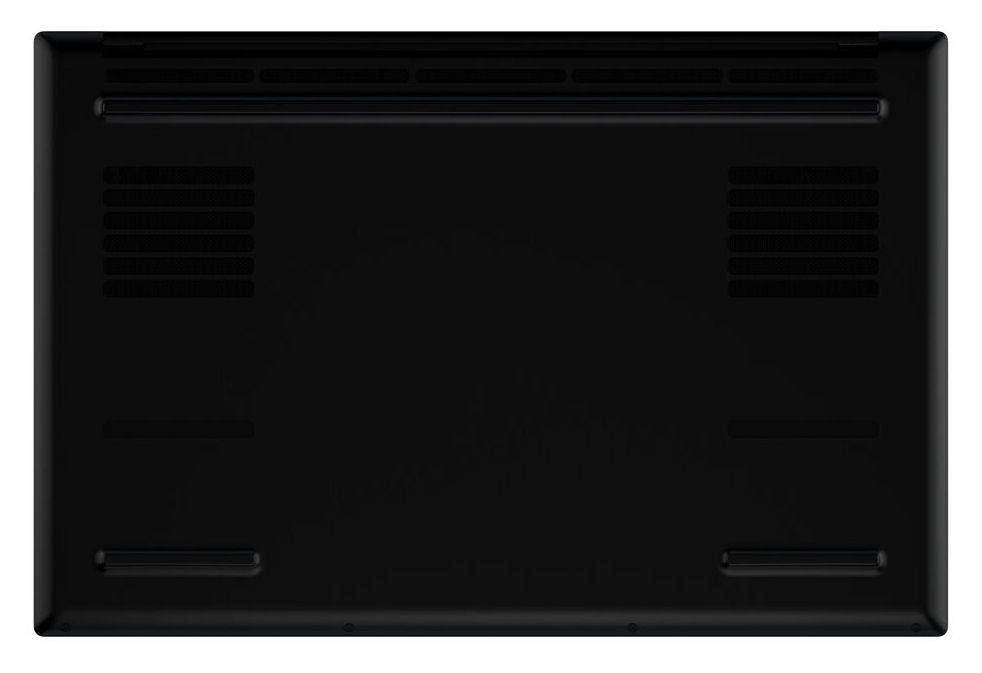
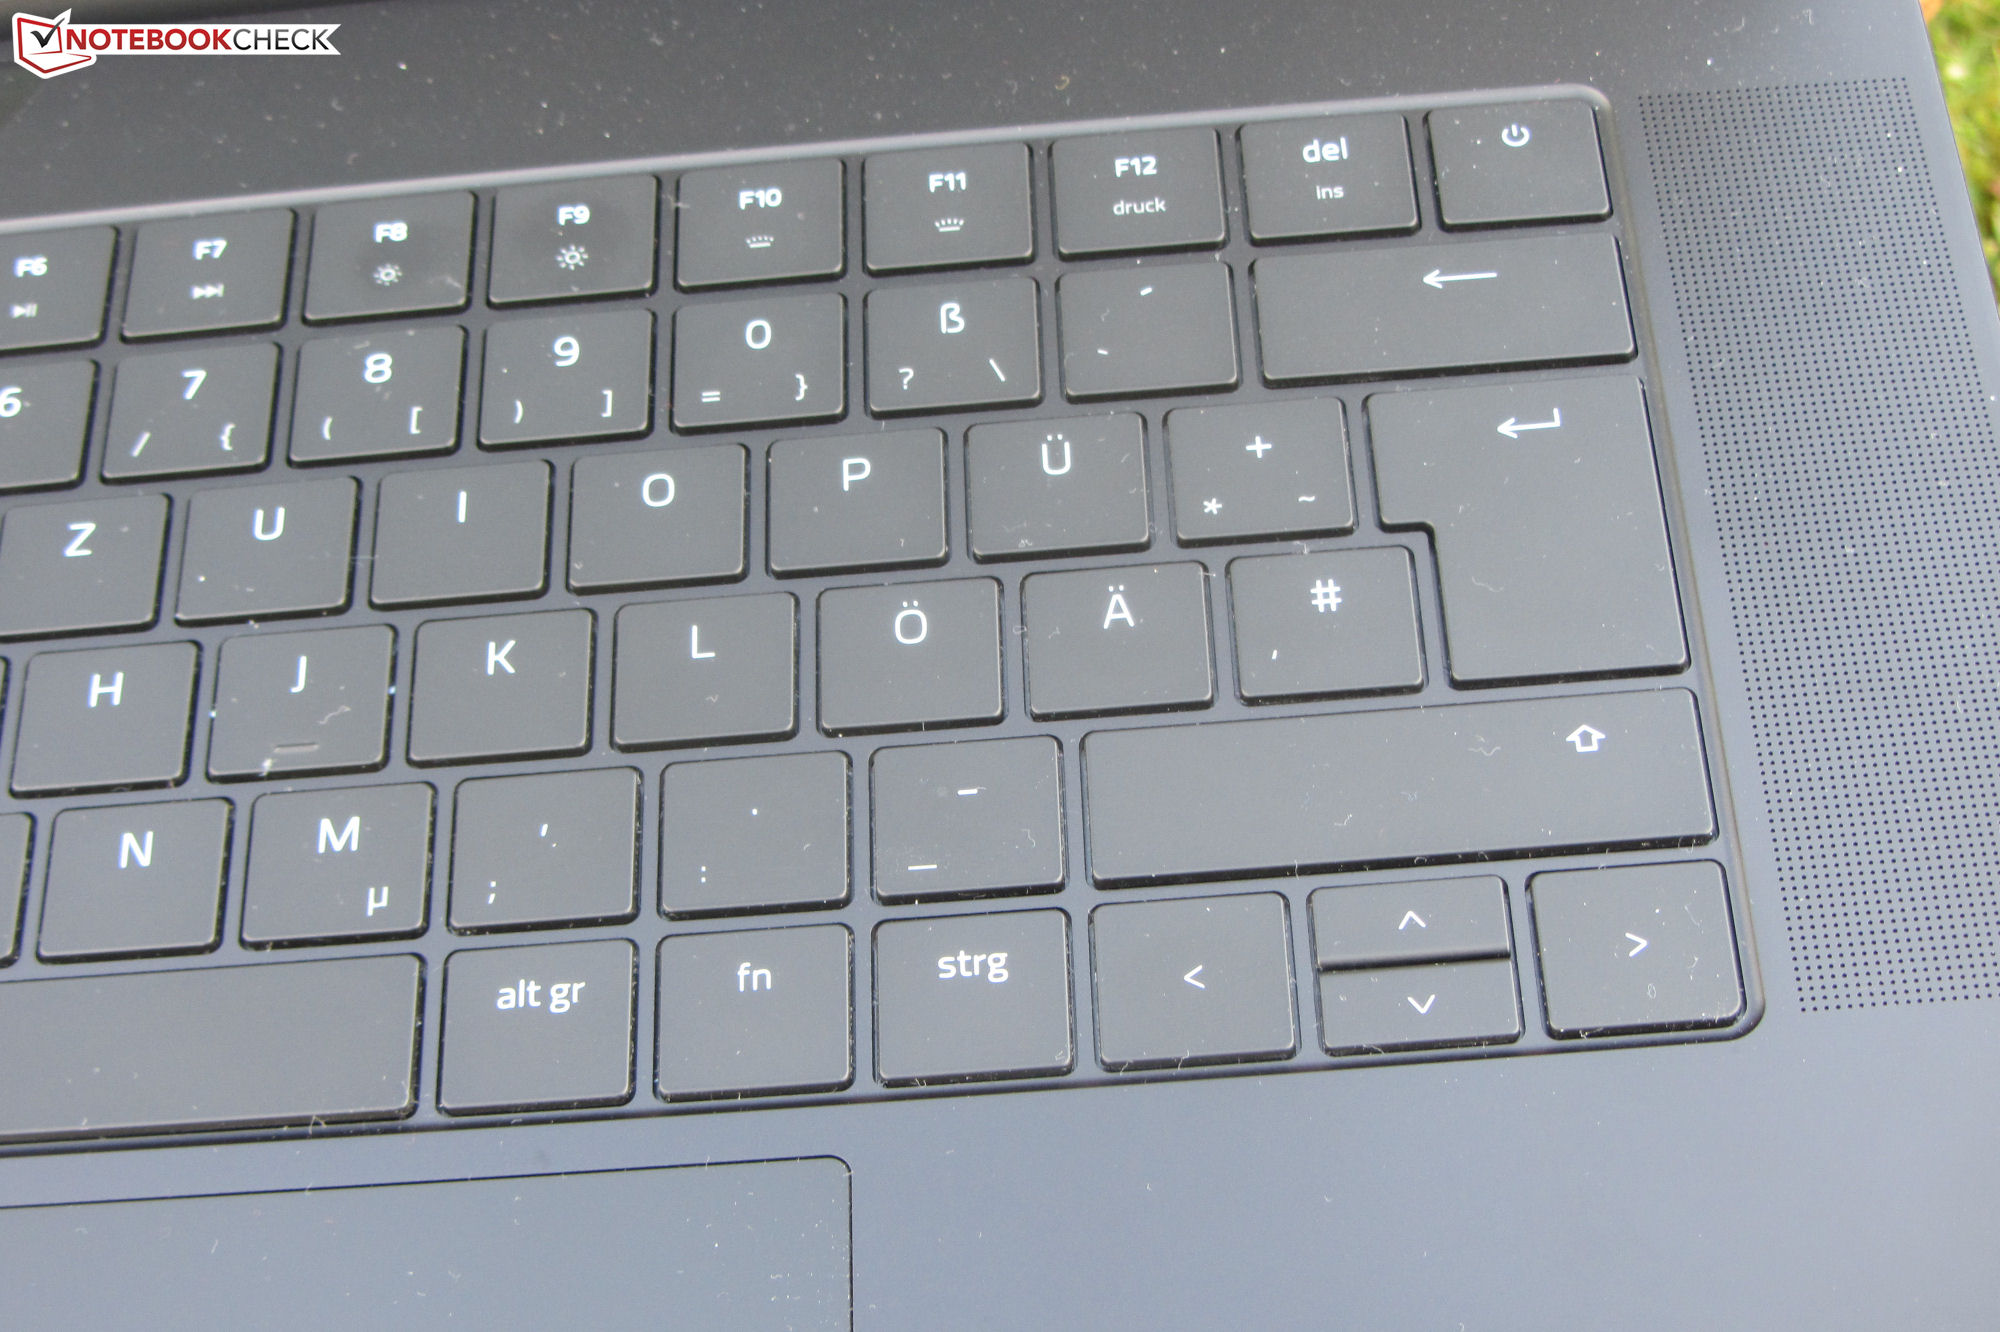
Informações sobre o estojo, características, dispositivos de entrada e alto-falantes já estão à disposição em nossa revisão de seu irmão, (12800H, RTX 3080 Ti). Este último está equipado com um painel LED (QHD) - a diferença mais relevante em relação ao dispositivo atual.
Possíveis concorrentes em comparação
Avaliação | Data | Modelo | Peso | Altura | Size | Resolução | Preço |
|---|---|---|---|---|---|---|---|
| 89.9 % v7 (old) | 03/2023 | Razer Blade 15 OLED (Early 2022) i9-12900H, GeForce RTX 3070 Ti Laptop GPU | 2 kg | 16.99 mm | 15.60" | 2560x1440 | |
| 87.8 % v7 (old) | 02/2023 | Asus ROG Zephyrus M16 GU603Z i9-12900H, GeForce RTX 3070 Ti Laptop GPU | 2.1 kg | 19.9 mm | 16.00" | 2560x1600 | |
| 85.5 % v7 (old) | 12/2022 | Aorus 15 XE5 i7-12700H, GeForce RTX 3070 Ti Laptop GPU | 2.3 kg | 24 mm | 15.60" | 2560x1440 | |
| 87.4 % v7 (old) | 08/2022 | Schenker XMG Fusion 15 (Mid 22) i7-11800H, GeForce RTX 3070 Laptop GPU | 1.9 kg | 21.65 mm | 15.60" | 2560x1440 | |
| 85.5 % v7 (old) | 05/2022 | HP Omen 16-b1090ng i7-12700H, GeForce RTX 3070 Ti Laptop GPU | 2.3 kg | 23 mm | 16.10" | 2560x1440 |
| SD Card Reader | |
| average JPG Copy Test (av. of 3 runs) | |
| Razer Blade 15 2022 (Toshiba Exceria Pro SDXC 64 GB UHS-II) | |
| Asus ROG Zephyrus M16 GU603Z | |
| Média da turma Gaming (20.9 - 210, n=54, últimos 2 anos) | |
| Razer Blade 15 OLED (Early 2022) (AV Pro SD microSD 128 GB V60) | |
| Schenker XMG Fusion 15 (Mid 22) (AV PRO microSD 128 GB V60) | |
| HP Omen 16-b1090ng (AV PRO microSD 128 GB V60) | |
| maximum AS SSD Seq Read Test (1GB) | |
| Asus ROG Zephyrus M16 GU603Z | |
| Razer Blade 15 2022 (Toshiba Exceria Pro SDXC 64 GB UHS-II) | |
| Média da turma Gaming (25.5 - 261, n=51, últimos 2 anos) | |
| Razer Blade 15 OLED (Early 2022) (AV Pro SD microSD 128 GB V60) | |

 GeForce RTX 3070 Ti Laptop GPU, i9-12900H, Samsung PM9A1 MZVL21T0HCLR")
 GeForce RTX 3070 Ti Laptop GPU, i9-12900H, Samsung PM9A1 MZVL21T0HCLR")
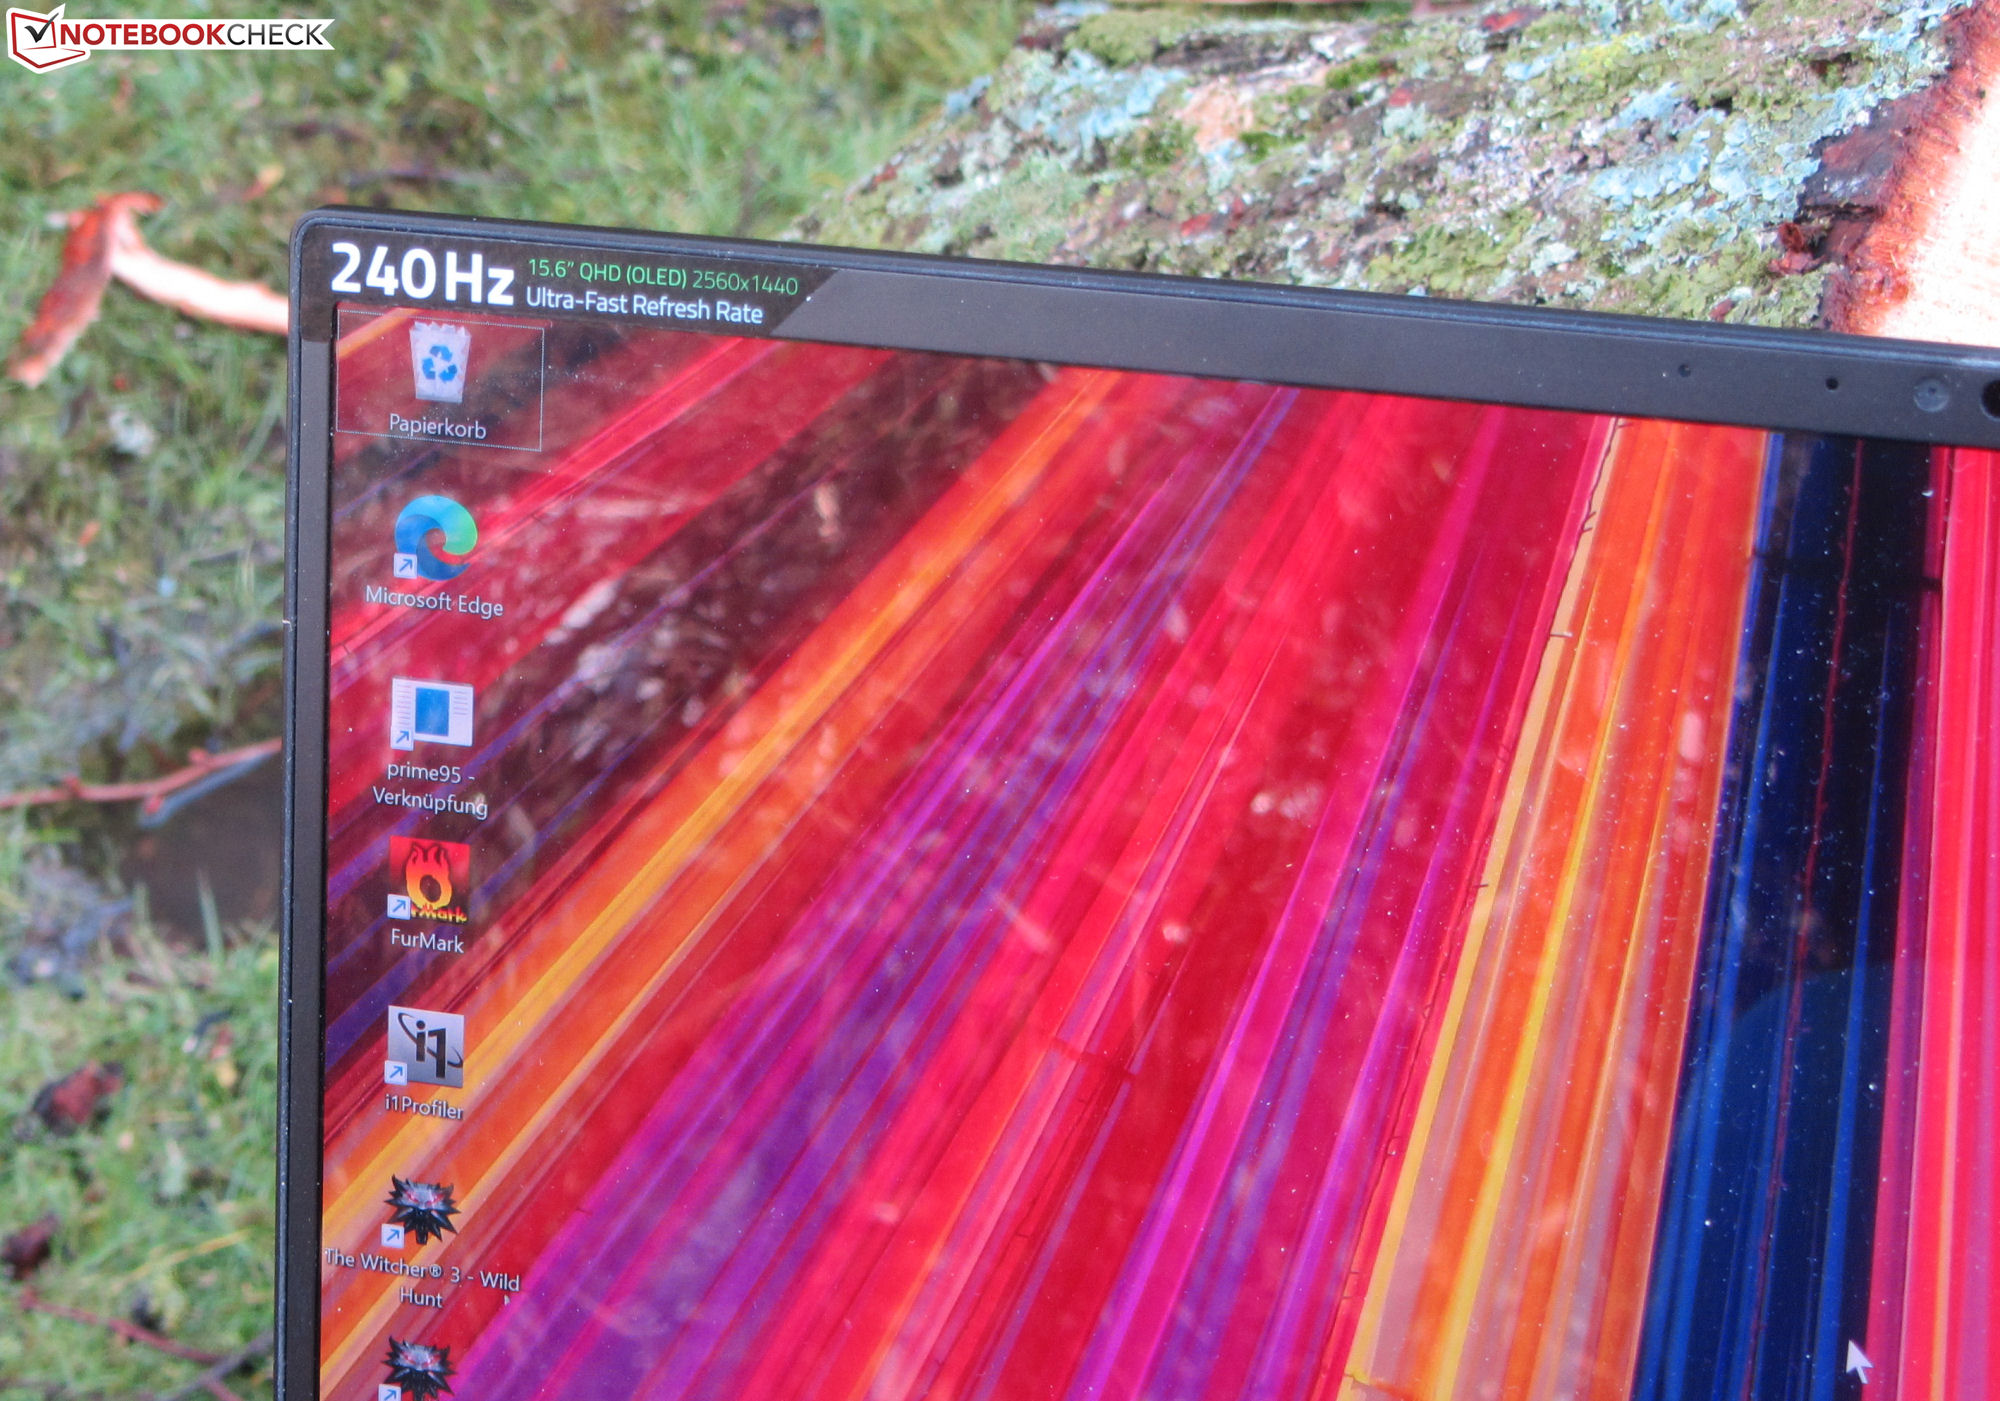
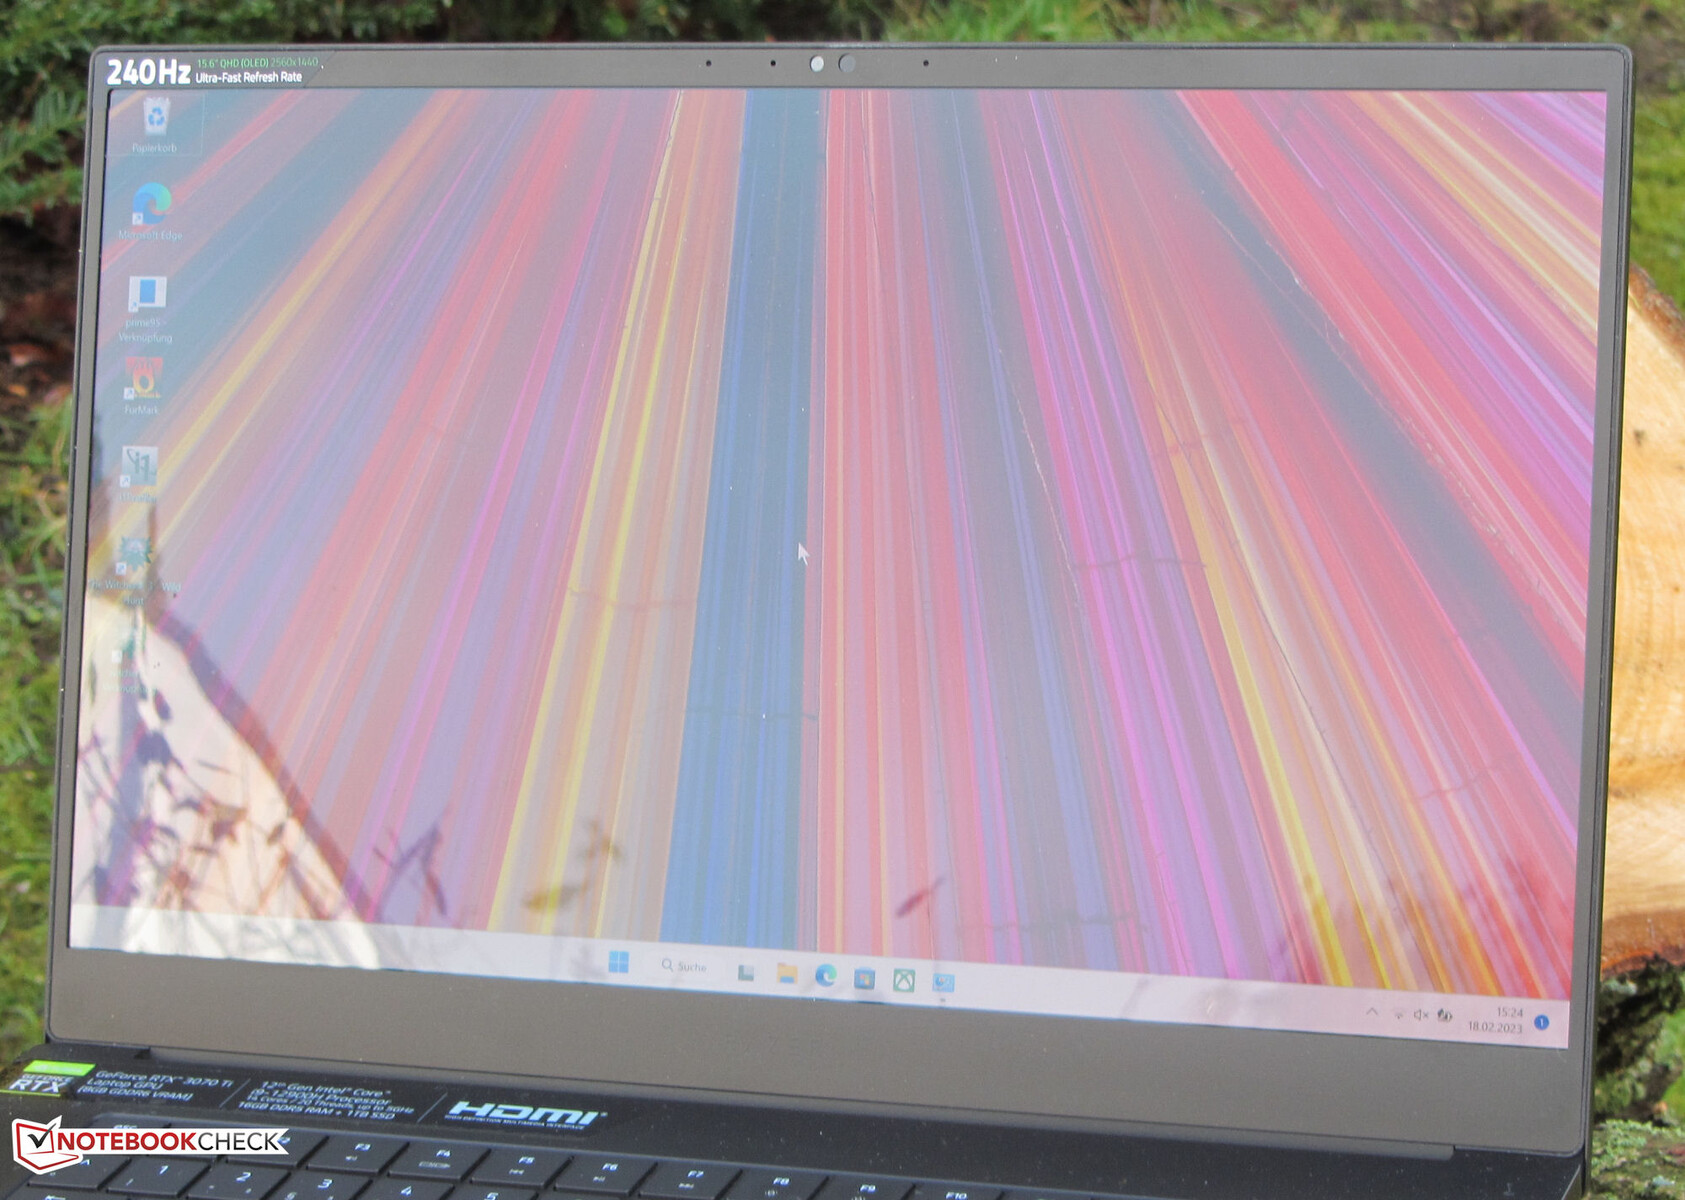
Display - O computador móvel Razer traz junto um painel OLED

O visor OLED oferece os mesmos dados-chave que o seu irmão-irmão do visor LED: Uma resolução de 2560 x 1440 pixels (QHD) a uma taxa de atualização de 240 Hz e 15,6 polegadas de diâmetro.
Típico para OLEDs, o painel marca pontos para maravilhosos níveis de preto e tempos de resposta rápidos. Além disso, isto é acompanhado por um brilho máximo relativamente alto. Isto é algo a que sua contraparte LED não consegue segurar uma chama.
Os pontos fracos do painel OLED: Ele tem uma superfície brilhante e cintila a um ajuste de brilho de ≤ 70% a uma freqüência de 500 Hz. A cintilação tecnicamente induzida está ligada à regulação de luminosidade do painel. A este respeito, de seus irmãos painel LED mate e sem cintilação tem seu nariz na frente.
| |||||||||||||||||||||||||
iluminação: 99 %
iluminação com acumulador: 381 cd/m²
Contraste: 12767:1 (Preto: 0.03 cd/m²)
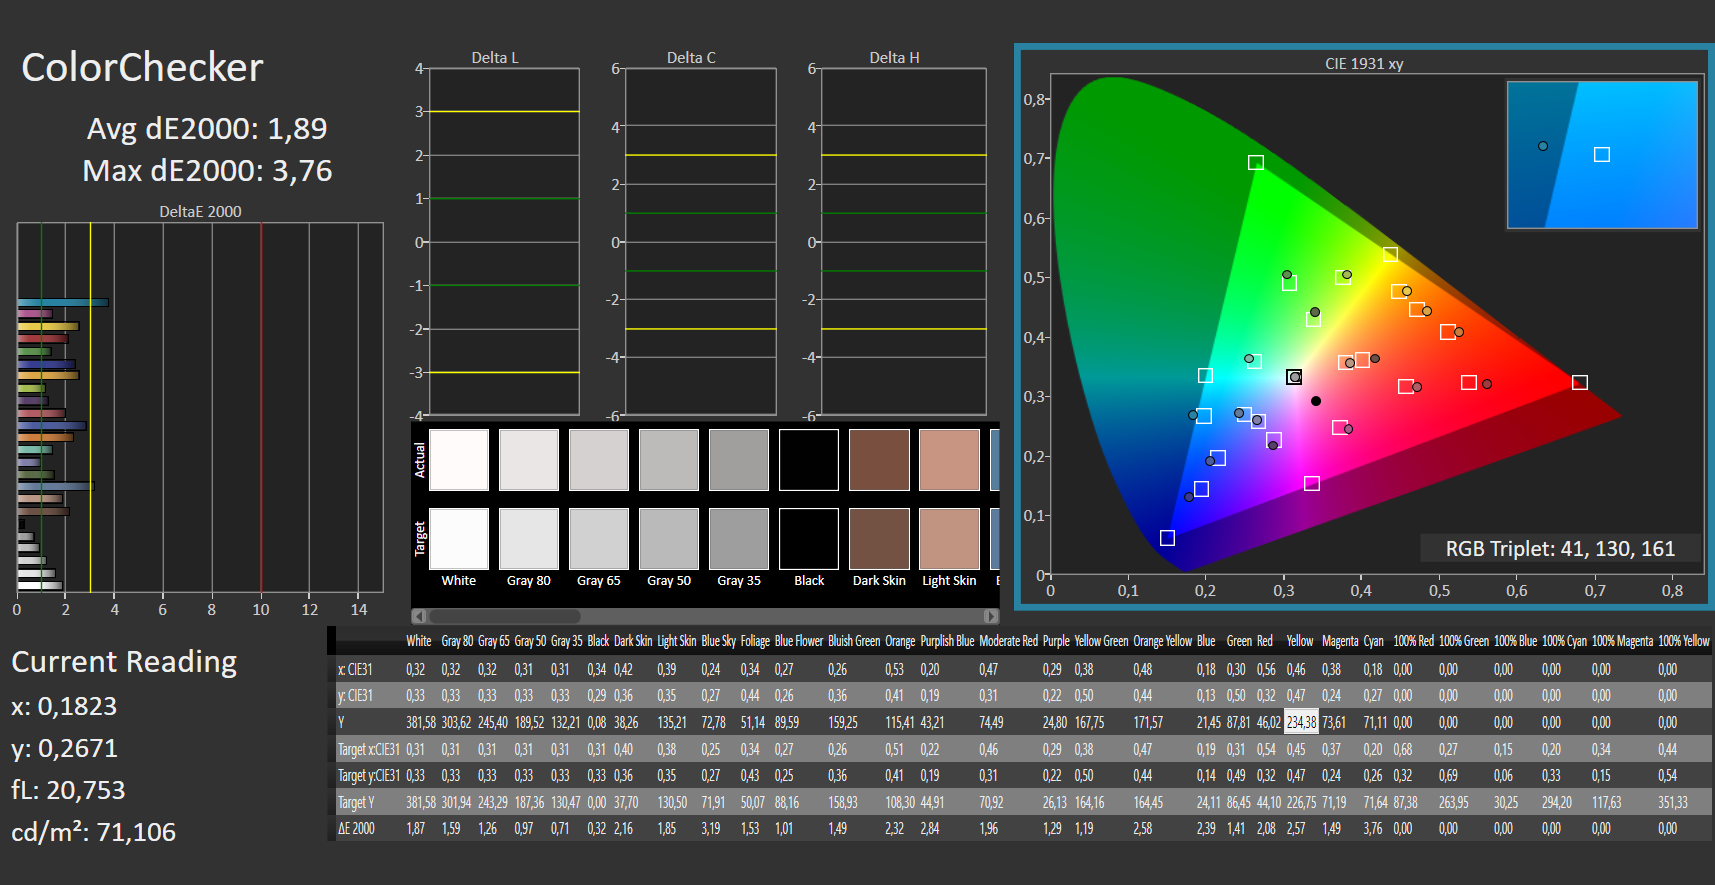
ΔE ColorChecker Calman: 1.89 | ∀{0.5-29.43 Ø4.72}
calibrated: 2.67
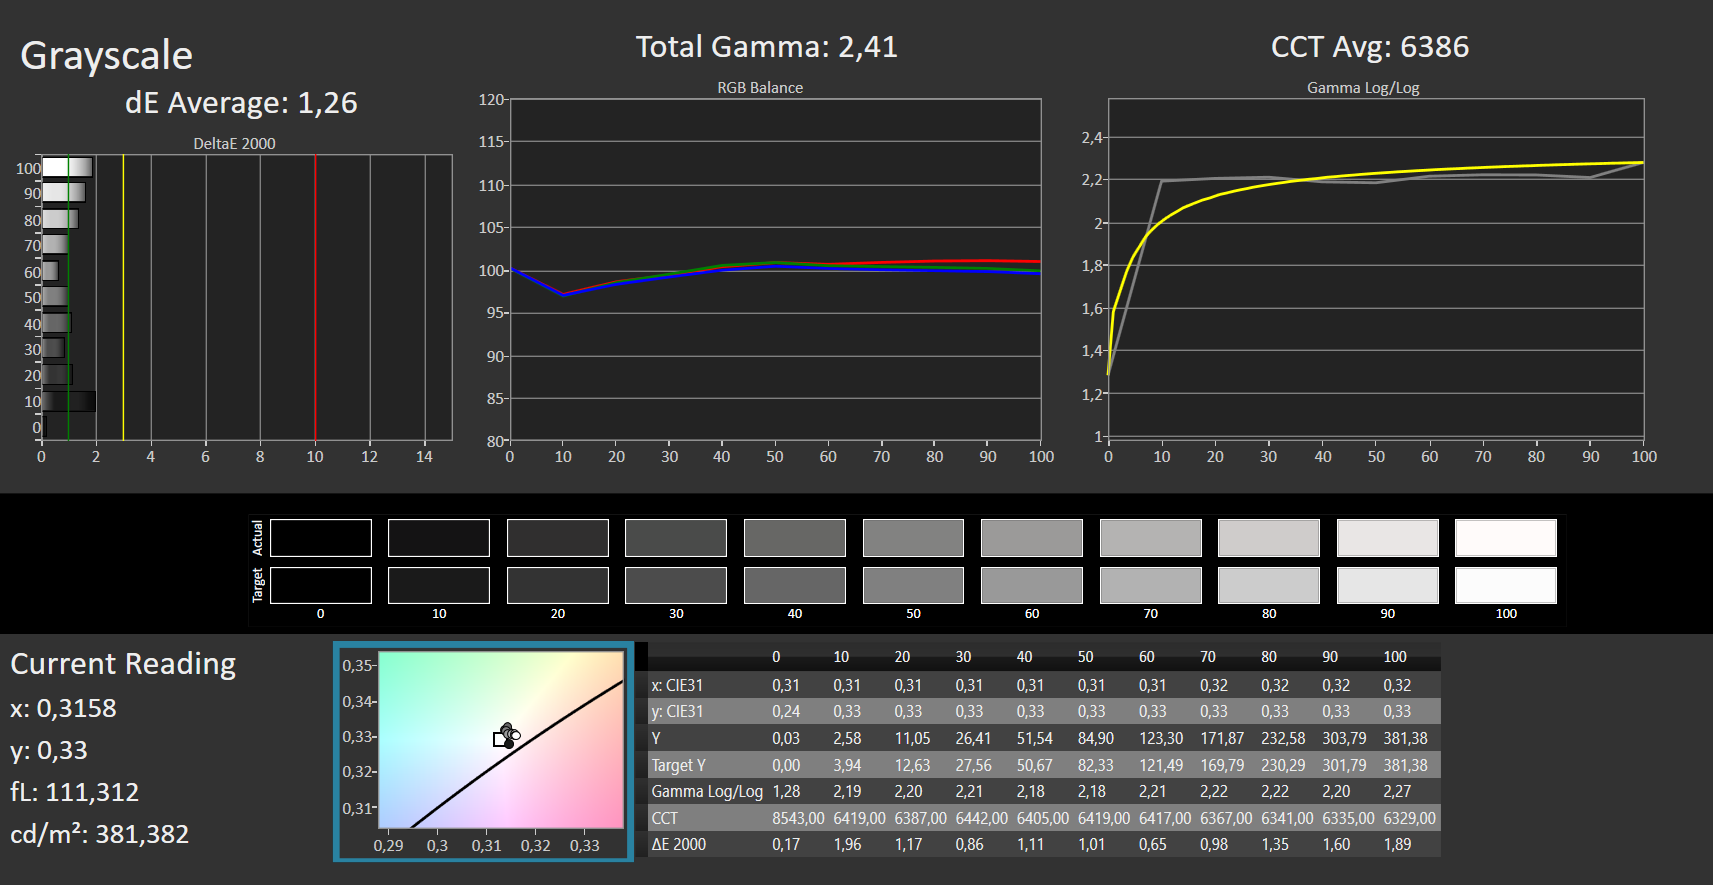
ΔE Greyscale Calman: 1.26 | ∀{0.09-98 Ø4.97}
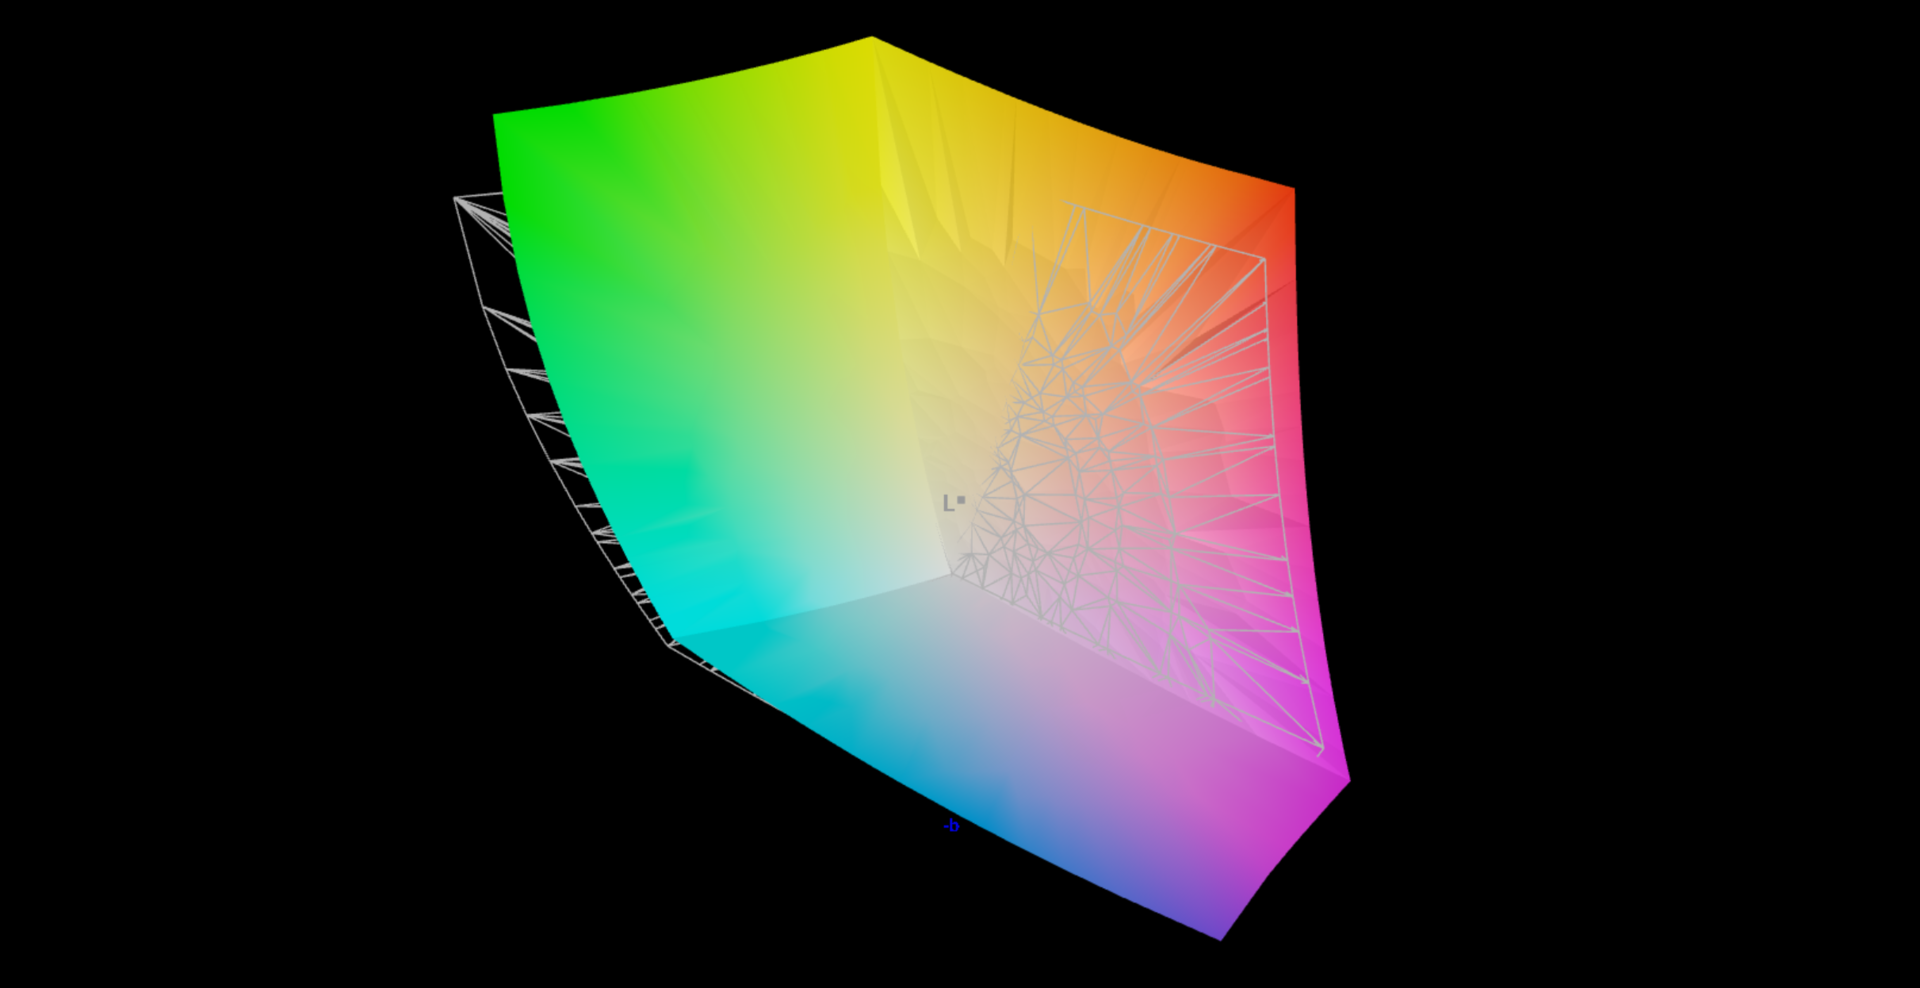
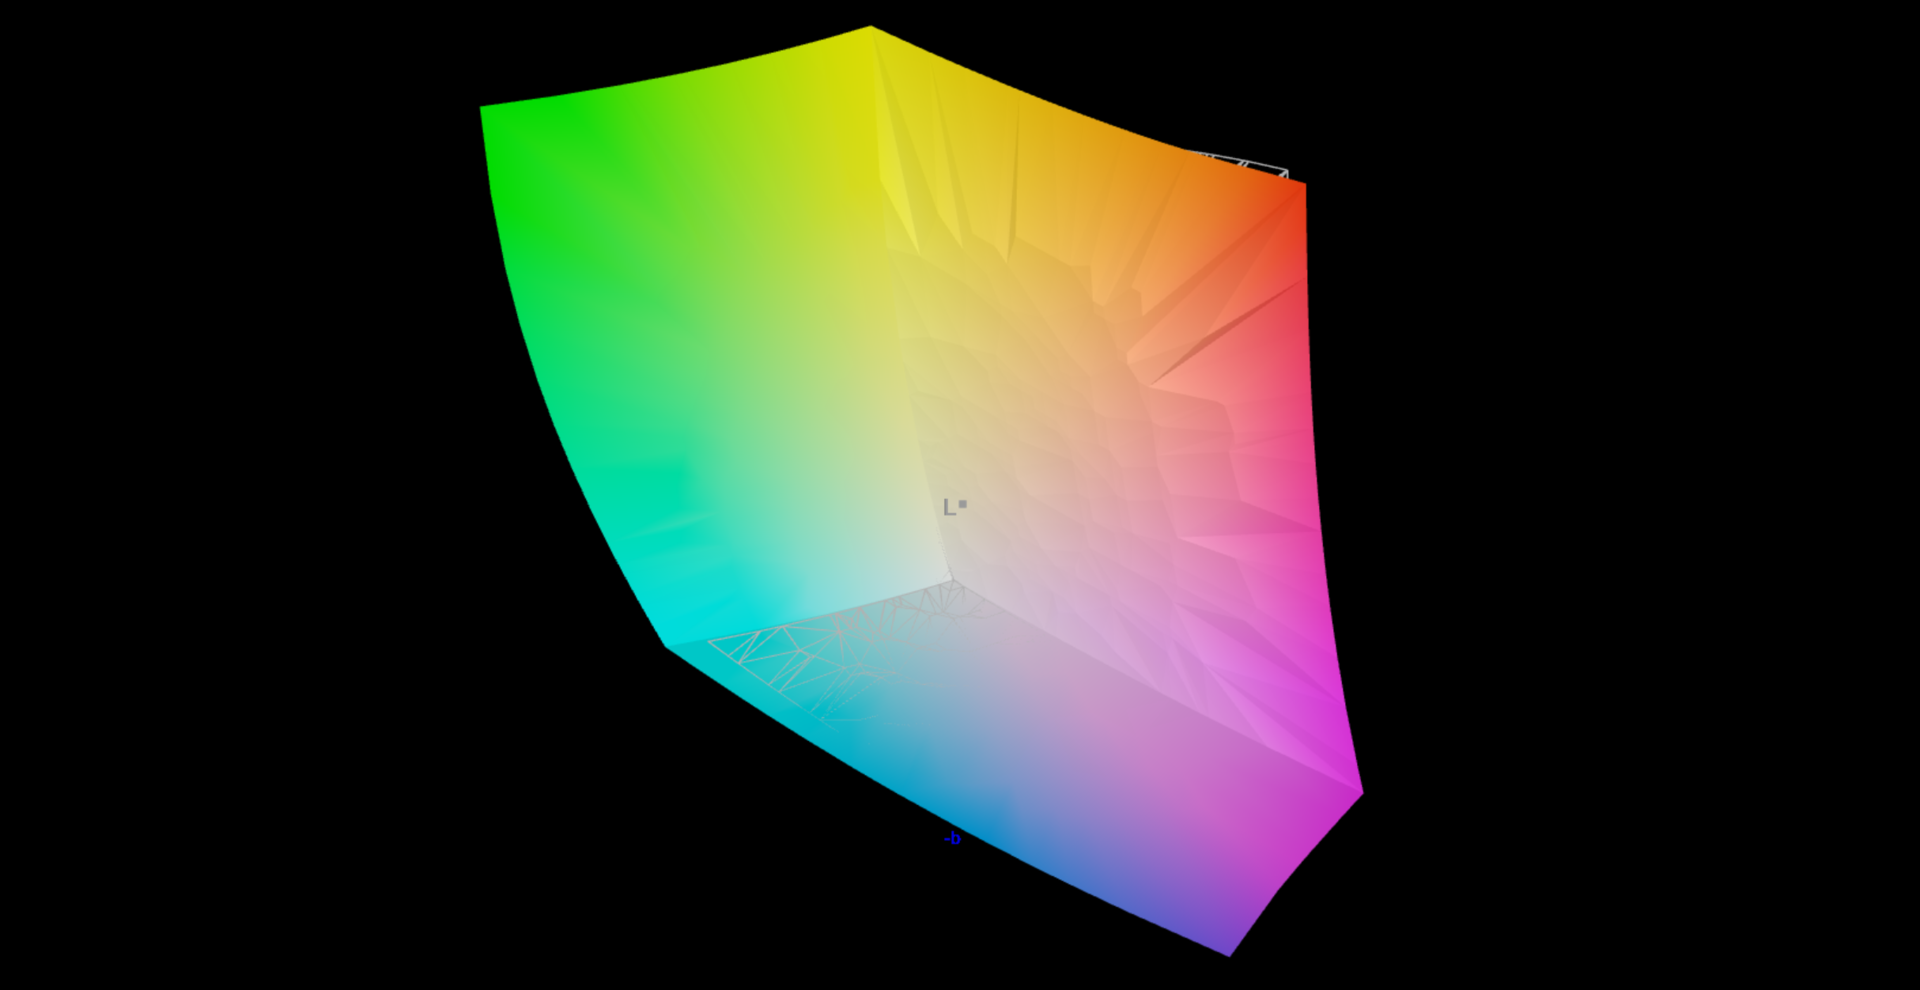
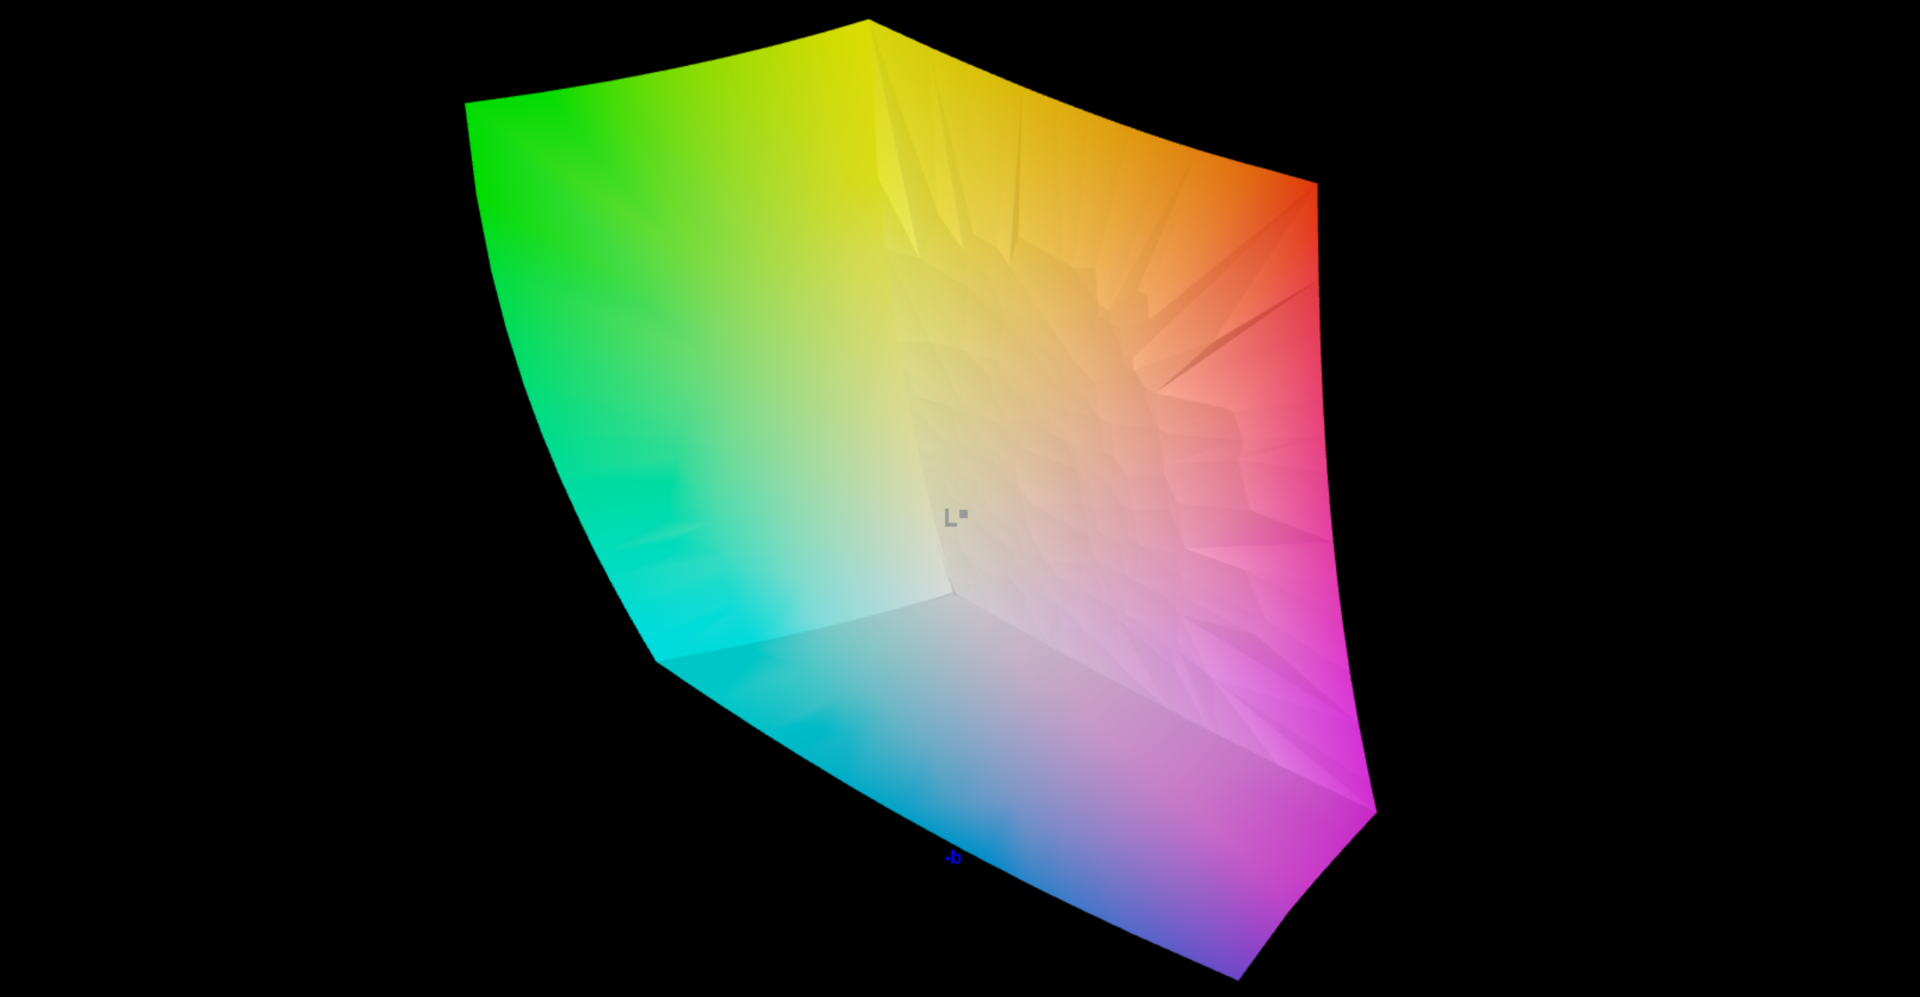
94% AdobeRGB 1998 (Argyll 3D)
99.4% sRGB (Argyll 3D)
97.6% Display P3 (Argyll 3D)
Gamma: 2.41
CCT: 6386 K
| Razer Blade 15 OLED (Early 2022) Samsung ATNA562P02-0, OLED, 2560x1440, 15.6" | Asus ROG Zephyrus M16 GU603Z BOE0A0B (BOE CQ NE160QDM-NY3), IPS, 2560x1600, 16" | Aorus 15 XE5 Chi Mei N156KME-GNA, IPS, 2560x1440, 15.6" | Schenker XMG Fusion 15 (Mid 22) BOE CQ NE156QHM-NY2, IPS, 2560x1440, 15.6" | HP Omen 16-b1090ng BOE09E5, IPS, 2560x1440, 16.1" | Razer Blade 15 2022 Sharp LQ156T1JW03, IPS, 2560x1440, 15.6" | |
|---|---|---|---|---|---|---|
| Display | -6% | -4% | -20% | -17% | -2% | |
| Display P3 Coverage (%) | 97.6 | 92.8 -5% | 95.2 -2% | 67.3 -31% | 71 -27% | 99.1 2% |
| sRGB Coverage (%) | 99.4 | 98.5 -1% | 99.9 1% | 96.7 -3% | 97.9 -2% | 99.9 1% |
| AdobeRGB 1998 Coverage (%) | 94 | 83.1 -12% | 84.5 -10% | 68.2 -27% | 73.3 -22% | 86.8 -8% |
| Response Times | -340% | -475% | -365% | -498% | -550% | |
| Response Time Grey 50% / Grey 80% * (ms) | 2 ? | 7.6 ? -280% | 14.4 ? -620% | 11.6 ? -480% | 14.5 ? -625% | 14.4 ? -620% |
| Response Time Black / White * (ms) | 2 ? | 10 ? -400% | 8.6 ? -330% | 7 ? -250% | 9.4 ? -370% | 11.6 ? -480% |
| PWM Frequency (Hz) | 500 ? | |||||
| Screen | -96% | -169% | -178% | -184% | -106% | |
| Brightness middle (cd/m²) | 383 | 497 30% | 336 -12% | 326 -15% | 335 -13% | 286 -25% |
| Brightness (cd/m²) | 384 | 481 25% | 316 -18% | 303 -21% | 319 -17% | 271 -29% |
| Brightness Distribution (%) | 99 | 82 -17% | 89 -10% | 89 -10% | 90 -9% | 89 -10% |
| Black Level * (cd/m²) | 0.03 | 0.21 -600% | 0.34 -1033% | 0.33 -1000% | 0.28 -833% | 0.25 -733% |
| Contrast (:1) | 12767 | 2367 -81% | 988 -92% | 988 -92% | 1196 -91% | 1144 -91% |
| Colorchecker dE 2000 * | 1.89 | 3.53 -87% | 3.36 -78% | 2.73 -44% | 4.38 -132% | 2.74 -45% |
| Colorchecker dE 2000 max. * | 3.76 | 6.15 -64% | 6.67 -77% | 9.54 -154% | 9.48 -152% | 5.21 -39% |
| Colorchecker dE 2000 calibrated * | 2.67 | 3.53 -32% | 0.74 72% | 1.36 49% | 1.33 50% | 2.52 6% |
| Greyscale dE 2000 * | 1.26 | 1.74 -38% | 4.7 -273% | 5.2 -313% | 7 -456% | 1.1 13% |
| Gamma | 2.41 91% | 2.2 100% | 2.244 98% | 2.074 106% | 2.103 105% | 2.2 100% |
| CCT | 6386 102% | 6418 101% | 6897 94% | 6911 94% | 6244 104% | 6408 101% |
| Média Total (Programa/Configurações) | -147% /
-112% | -216% /
-177% | -188% /
-171% | -233% /
-193% | -219% /
-147% |
* ... menor é melhor
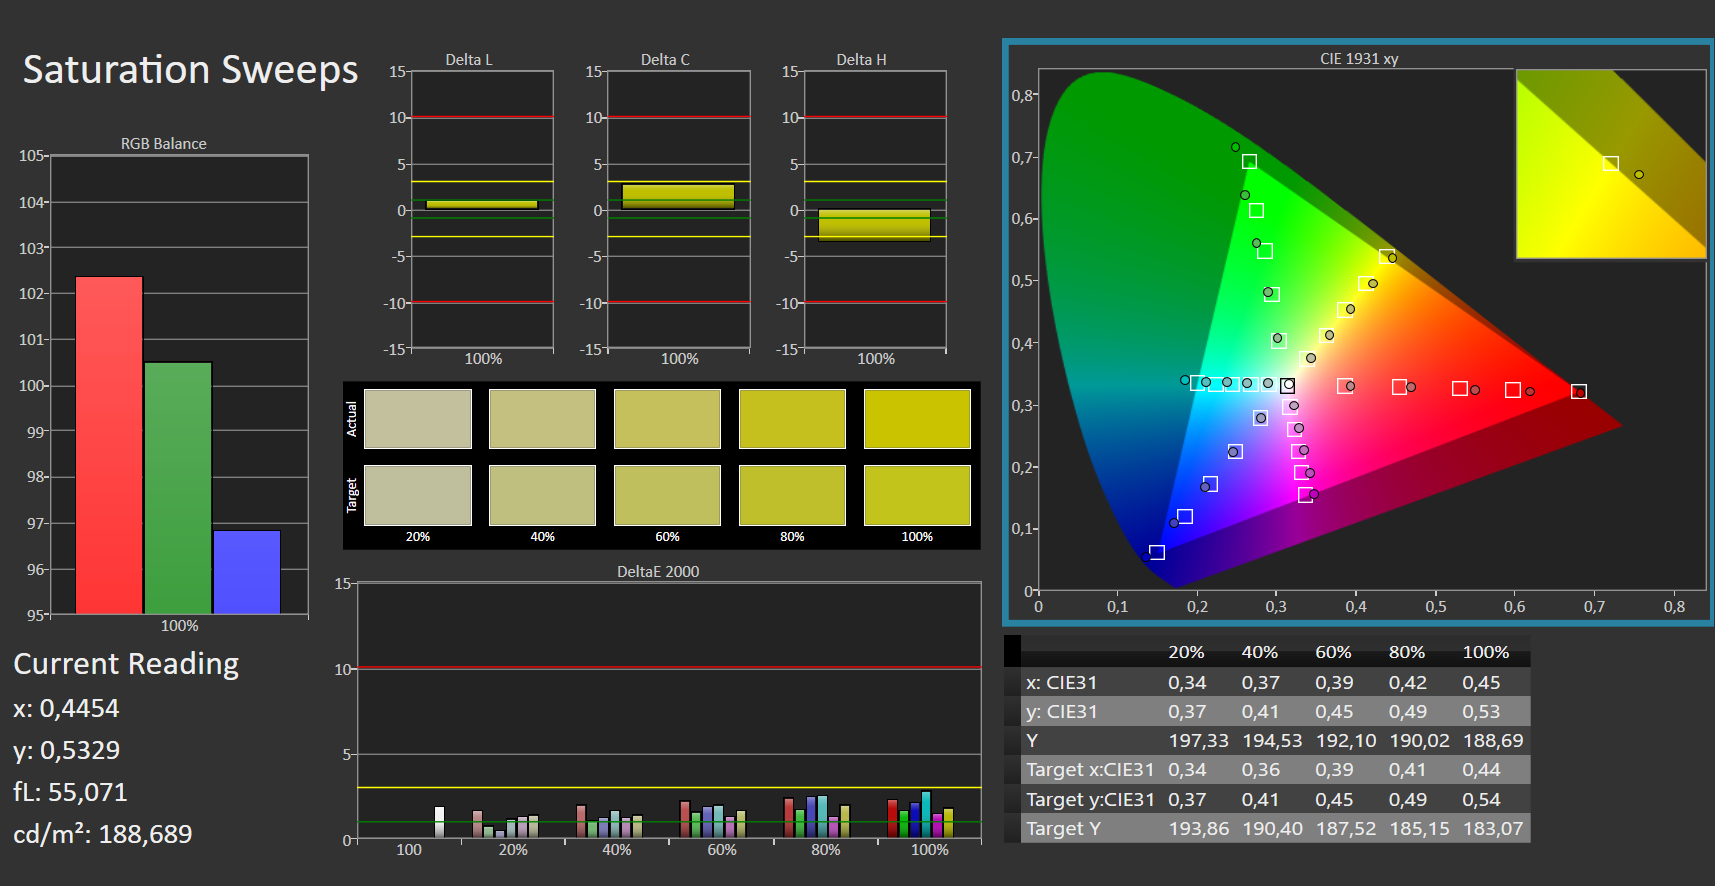
Mesmo fora da caixa, o display proporciona uma reprodução de cores impressionante: Com um desvio de 1,9, o alvo (DeltaE < 3) é claramente alcançado. A calibração não leva a nenhuma melhoria. A precisão das cores é dada: Os espaços de cor sRGB e DCI-P3 são reproduzidos completa e quase completamente com o espaço de cor AdobeRGB a 94 por cento. O painel de LED do irmão também proporciona resultados igualmente bons.
Exibir tempos de resposta
| ↔ Tempo de resposta preto para branco | ||
|---|---|---|
| 2 ms ... ascensão ↗ e queda ↘ combinadas | ↗ 1 ms ascensão |  |
| ↘ 1 ms queda | ||
| A tela mostra taxas de resposta muito rápidas em nossos testes e deve ser muito adequada para jogos em ritmo acelerado. Em comparação, todos os dispositivos testados variam de 0.1 (mínimo) a 240 (máximo) ms. » 11 % de todos os dispositivos são melhores. Isso significa que o tempo de resposta medido é melhor que a média de todos os dispositivos testados (19.8 ms). | ||
| ↔ Tempo de resposta 50% cinza a 80% cinza | ||
| 2 ms ... ascensão ↗ e queda ↘ combinadas | ↗ 1 ms ascensão |  |
| ↘ 1 ms queda | ||
| A tela mostra taxas de resposta muito rápidas em nossos testes e deve ser muito adequada para jogos em ritmo acelerado. Em comparação, todos os dispositivos testados variam de 0.165 (mínimo) a 636 (máximo) ms. » 10 % de todos os dispositivos são melhores. Isso significa que o tempo de resposta medido é melhor que a média de todos os dispositivos testados (31 ms). | ||
Cintilação da tela / PWM (modulação por largura de pulso)
| Tela tremeluzindo/PWM detectado | 500 Hz | ≤ 70 % configuração de brilho |  |
A luz de fundo da tela pisca em 500 Hz (pior caso, por exemplo, utilizando PWM) Cintilação detectada em uma configuração de brilho de 70 % e abaixo. Não deve haver cintilação ou PWM acima desta configuração de brilho. A frequência de 500 Hz é relativamente alta, portanto, a maioria dos usuários sensíveis ao PWM não deve notar nenhuma oscilação. No entanto, há relatos de que alguns usuários ainda são sensíveis ao PWM em 500 Hz e acima, portanto, esteja atento. [pwm_comparison] Em comparação: 52 % de todos os dispositivos testados não usam PWM para escurecer a tela. Se PWM foi detectado, uma média de 7781 (mínimo: 5 - máximo: 343500) Hz foi medida. | |||
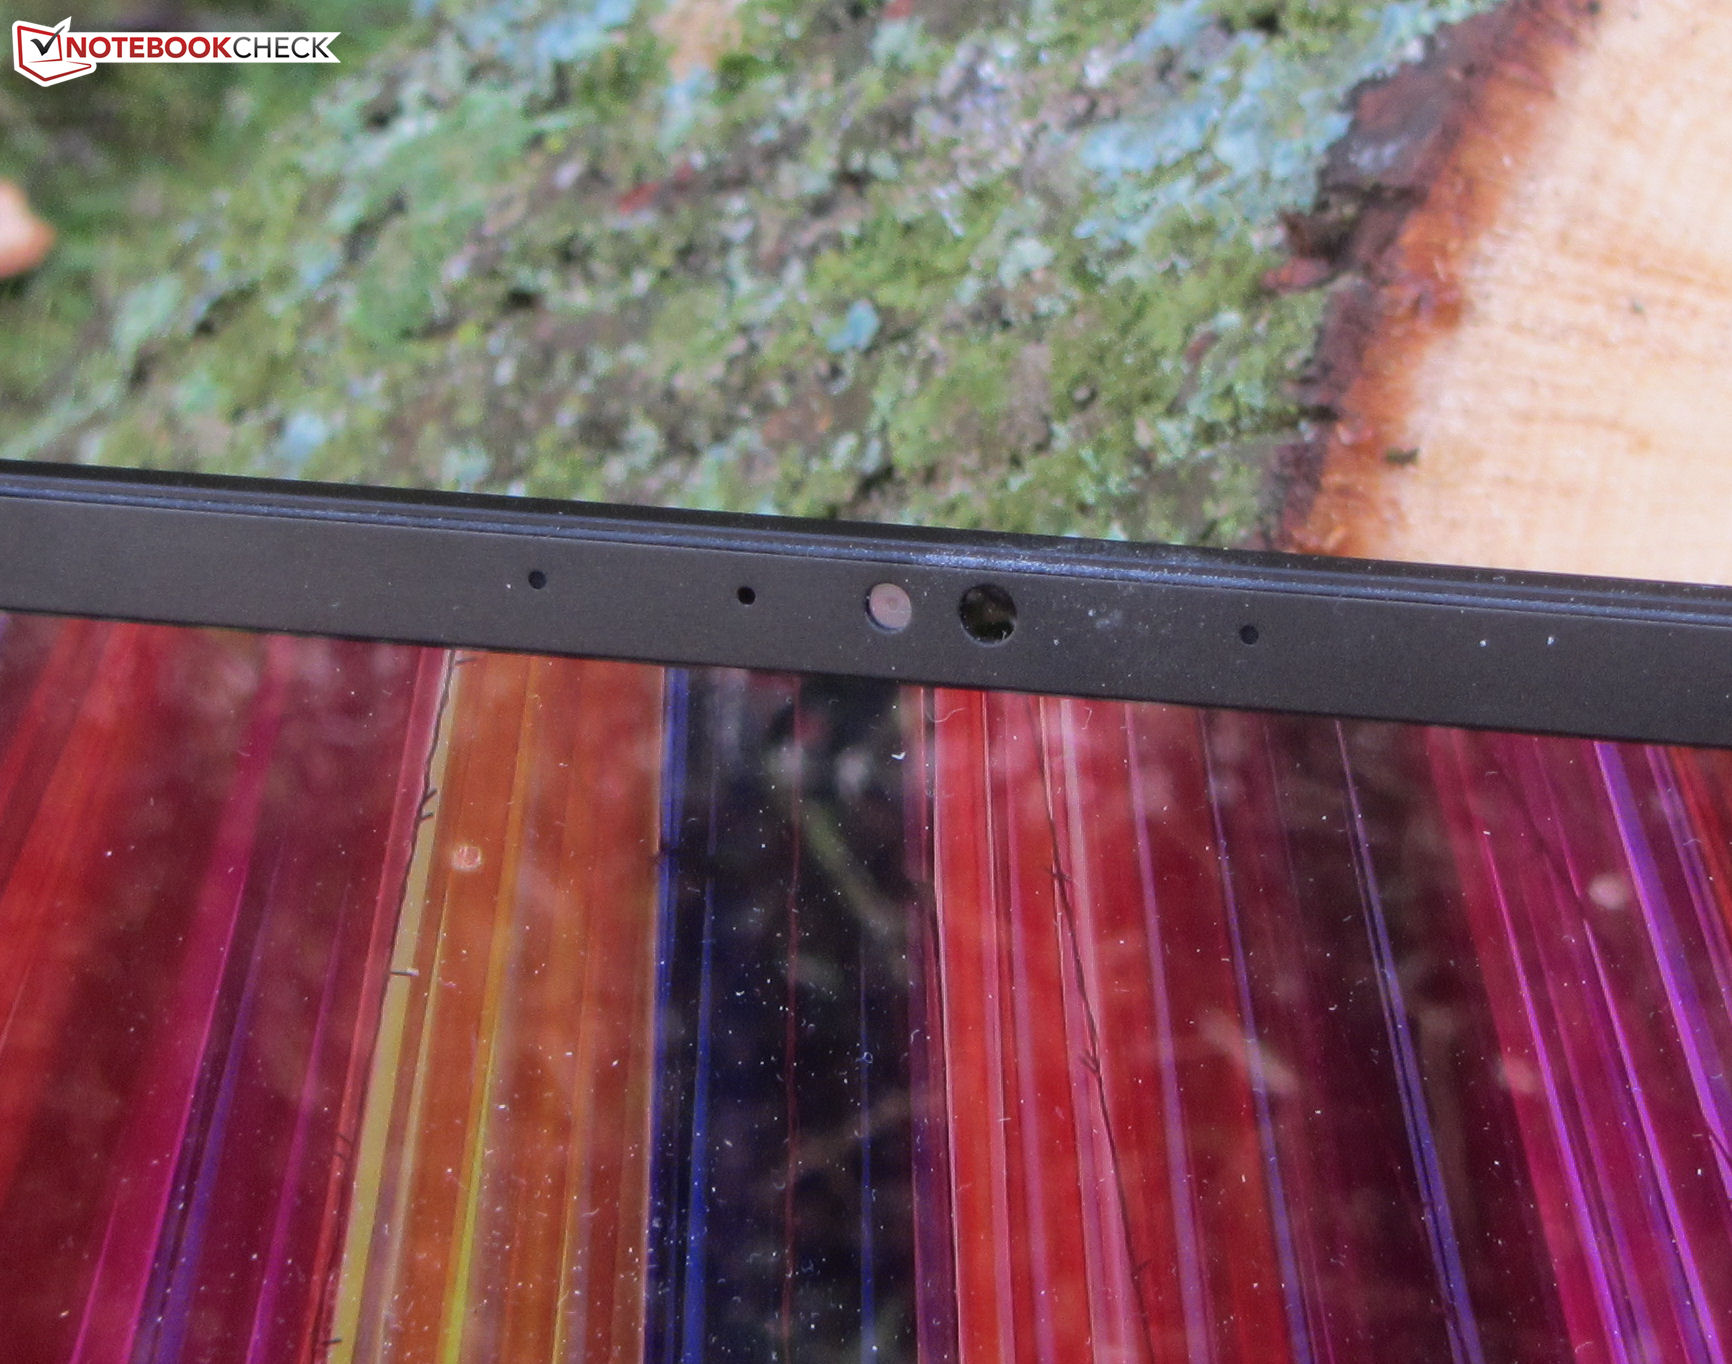
O painel vem com grande estabilidade de ângulo de visão e é legível de todos os ângulos. Entretanto, ao ar livre, isto é difícil devido à superfície brilhante e refletiva da tela.

Performance - Blade 15 é baseado em Alder Lake e Ampere
Com o Blade 15 (início de 2022), a Razer tem um laptop em sua linha de produtos projetado para jogos QHD (de alta a máxima configuração), mas também corta uma bela figura em áreas como edição e renderização de vídeo. O modelo revisado aqui pode ser obtido por cerca de US$ 1.967.

Condições de teste
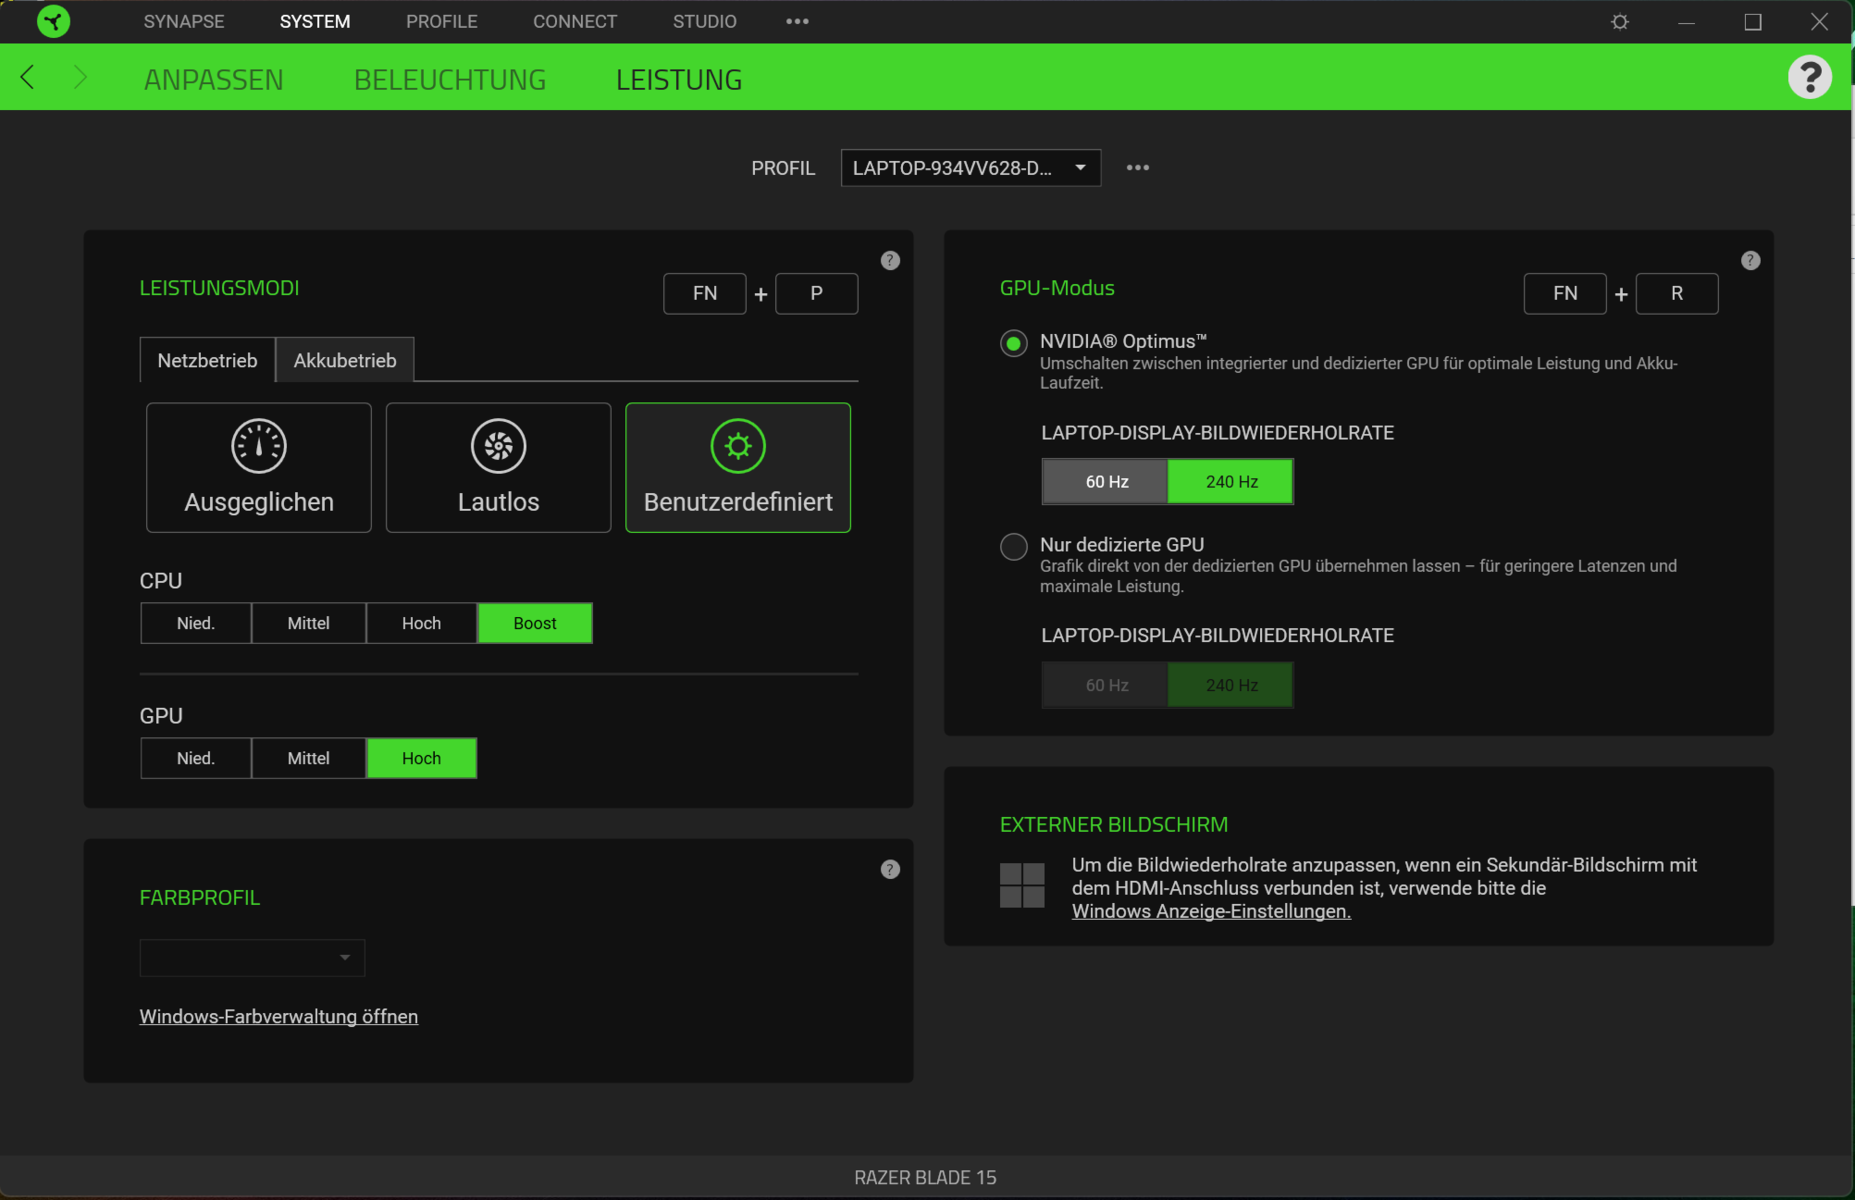
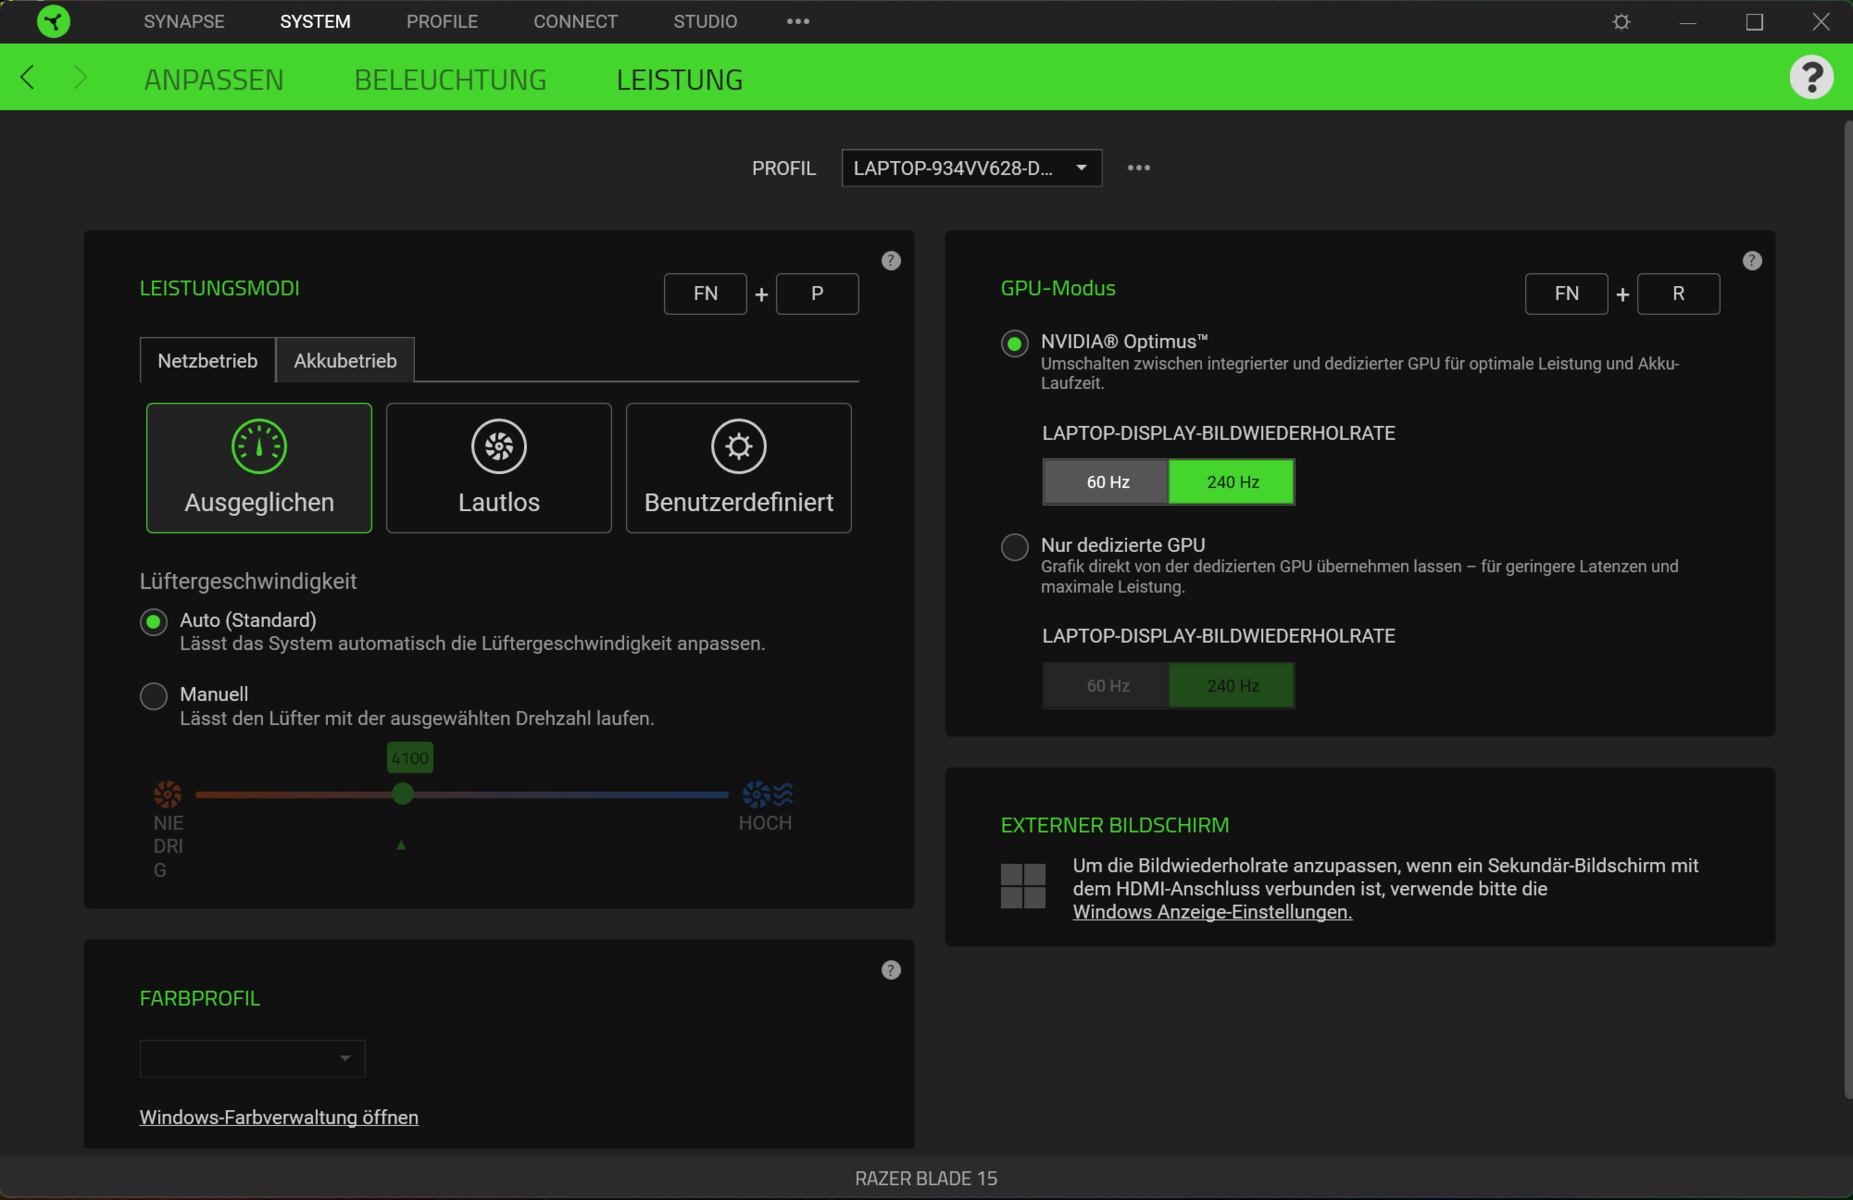
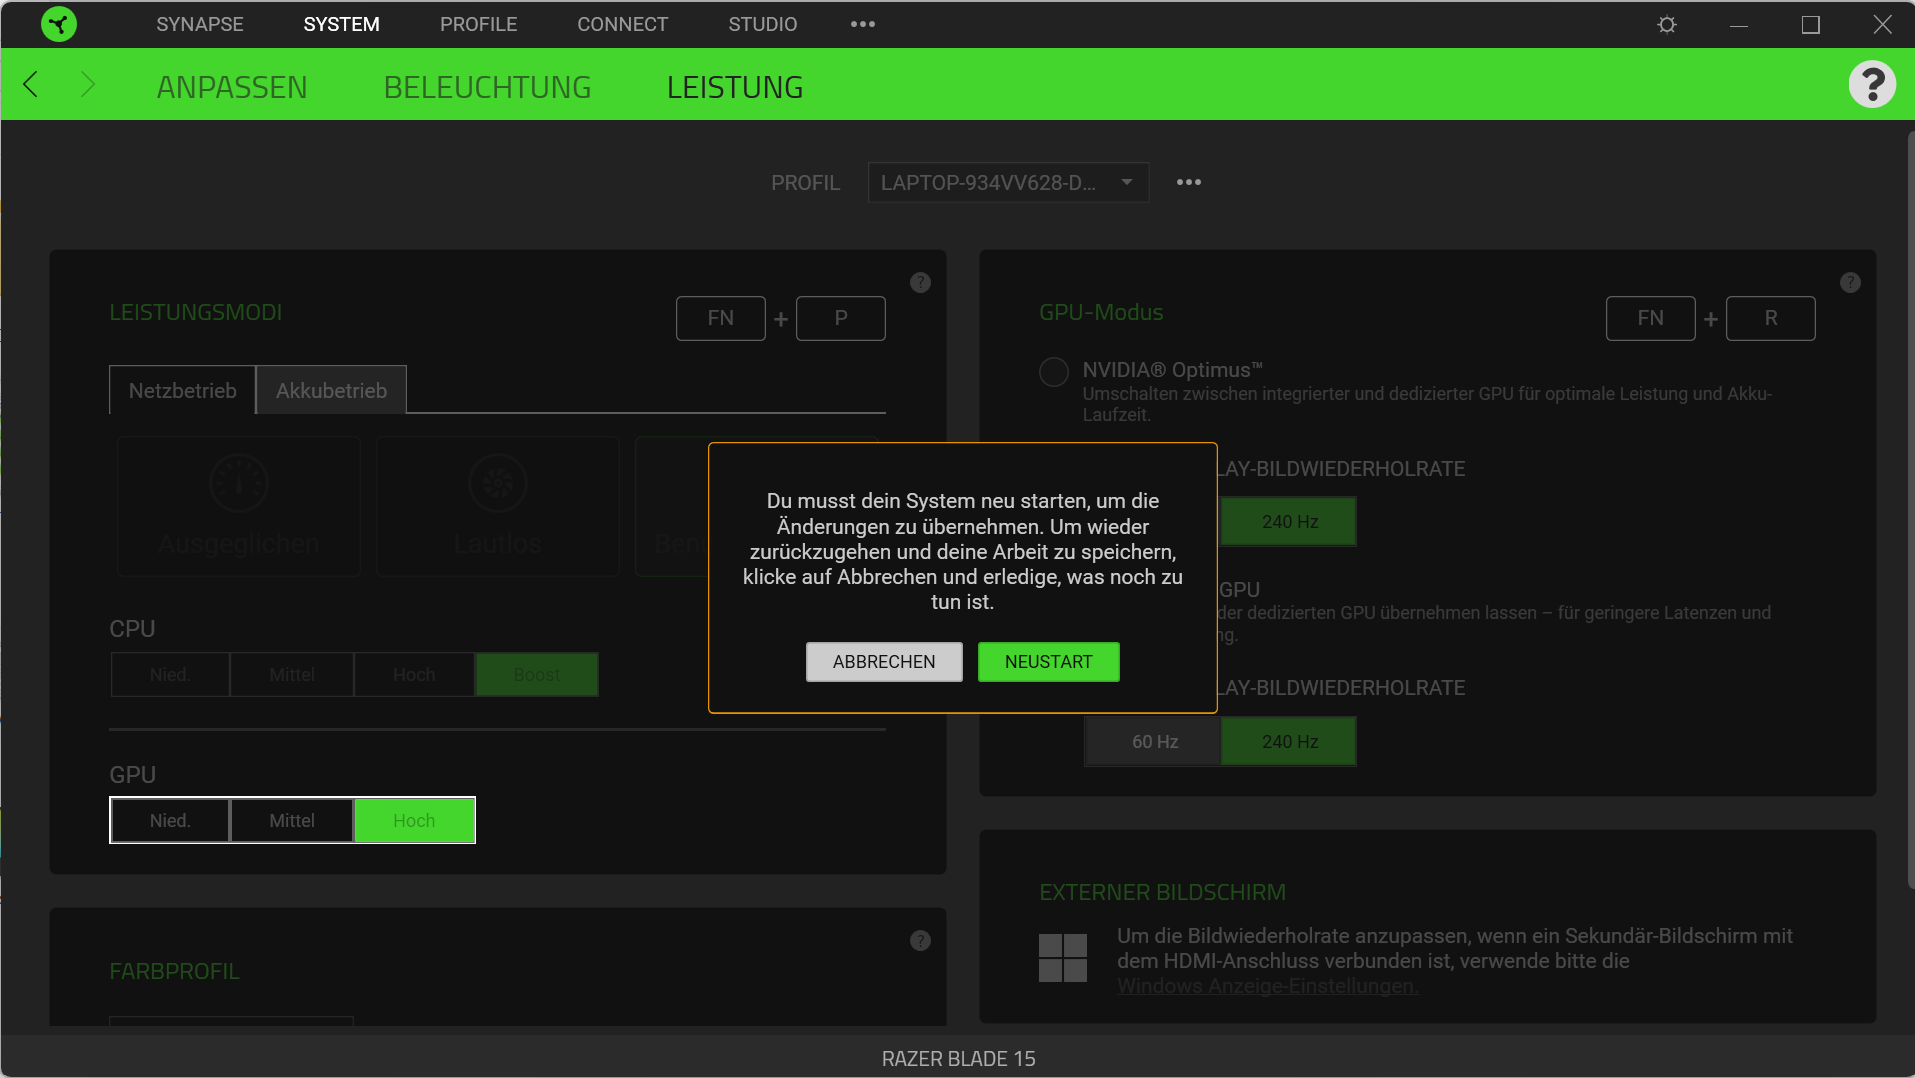
É possível alternar entre os três modos de desempenho ("Balanceado", "Silencioso" e "Definido pelo usuário") usando a combinação de teclas "Fn" + "P". O perfil "Definido pelo usuário" permite configurações de subpressões para a CPU ("Baixa", "Média", "Alta", "Boost") e GPU ("Baixa", "Média", e "Alta") - via software Razer Synapse pré-instalado. No modo de bateria, somente o perfil "Balanceado" está disponível.
Os benchmarks foram realizados utilizando o modo "User-defined" ativo em configurações máximas (subpresets "Boost" e "High"). Para o teste de bateria, foi utilizado o perfil "Silencioso".
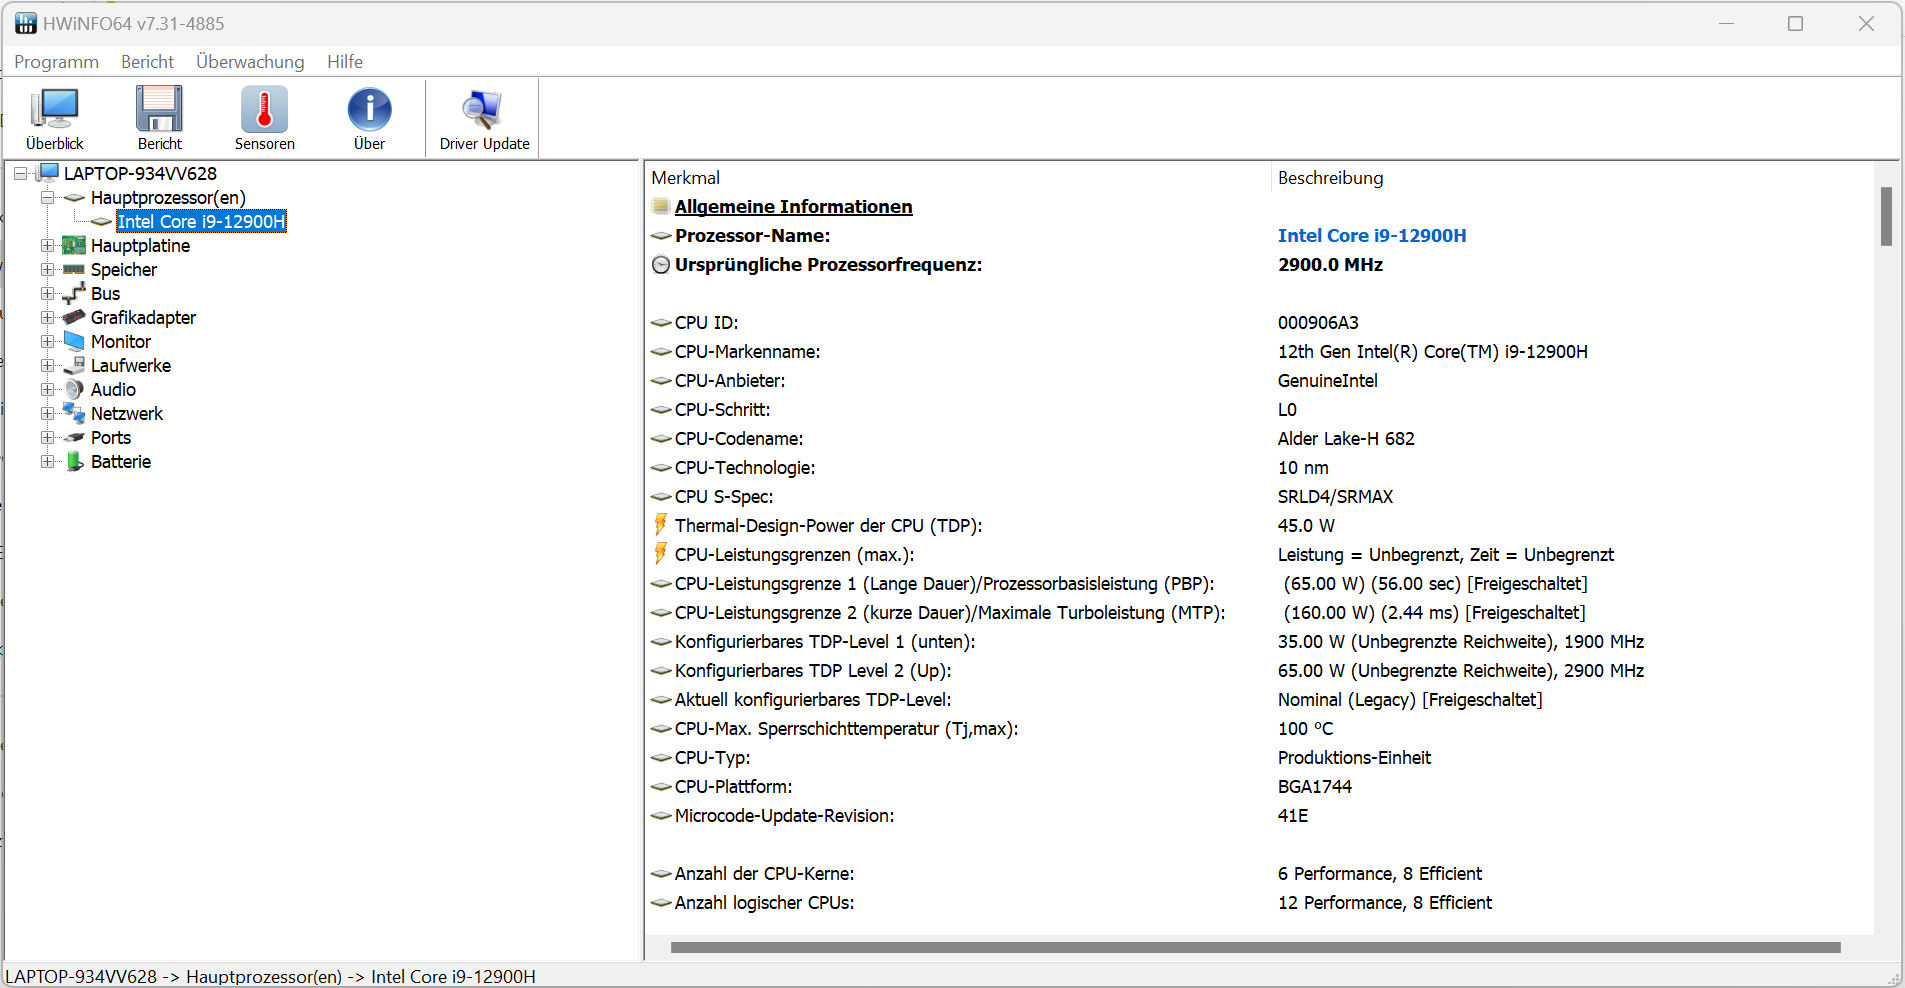
Processador
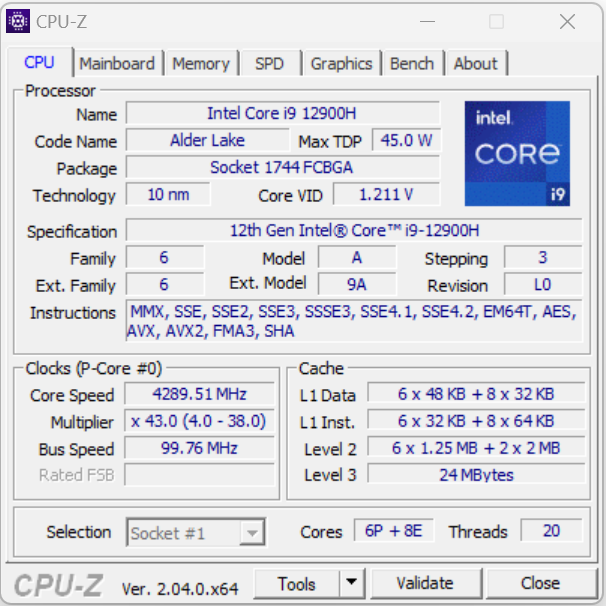
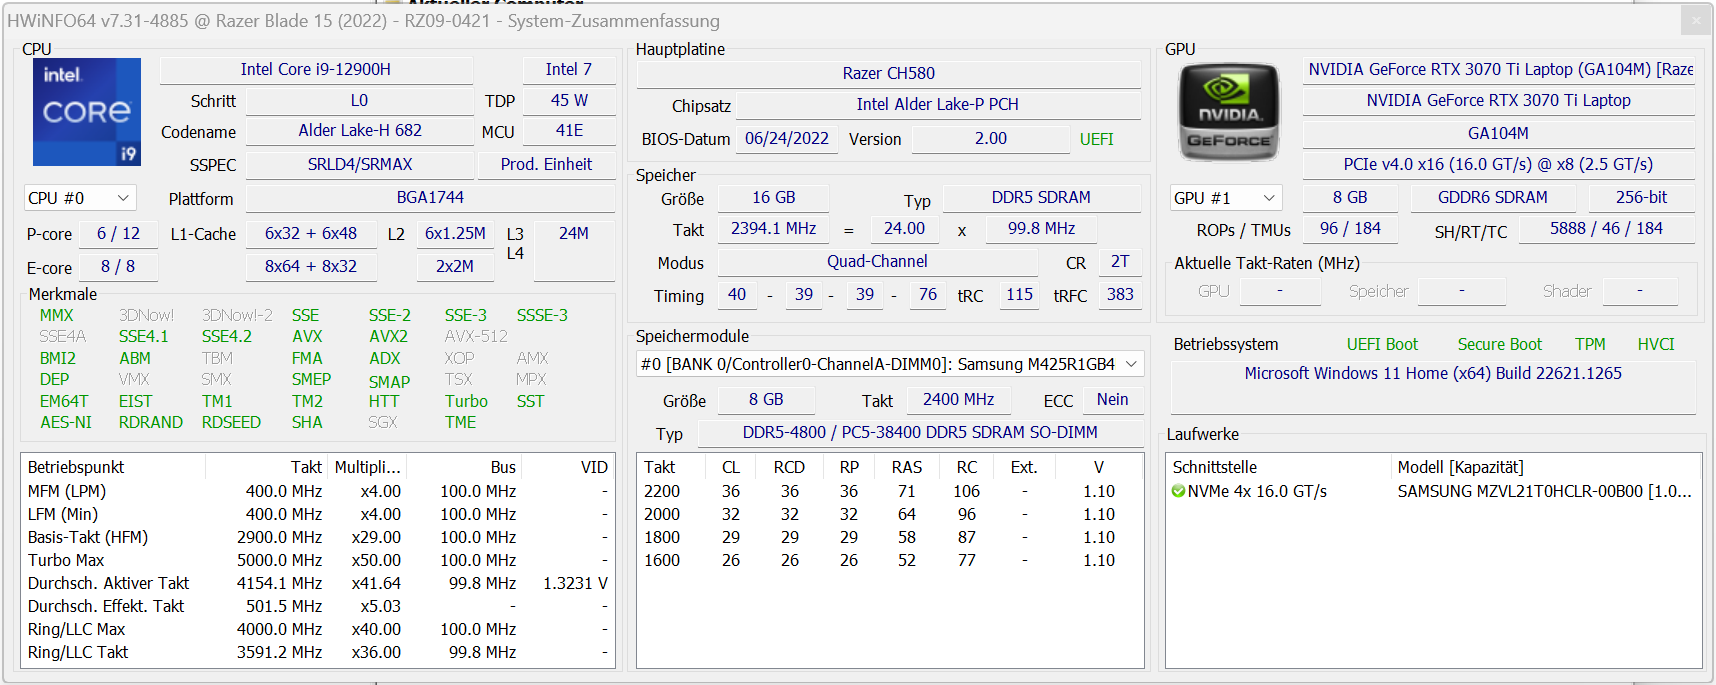
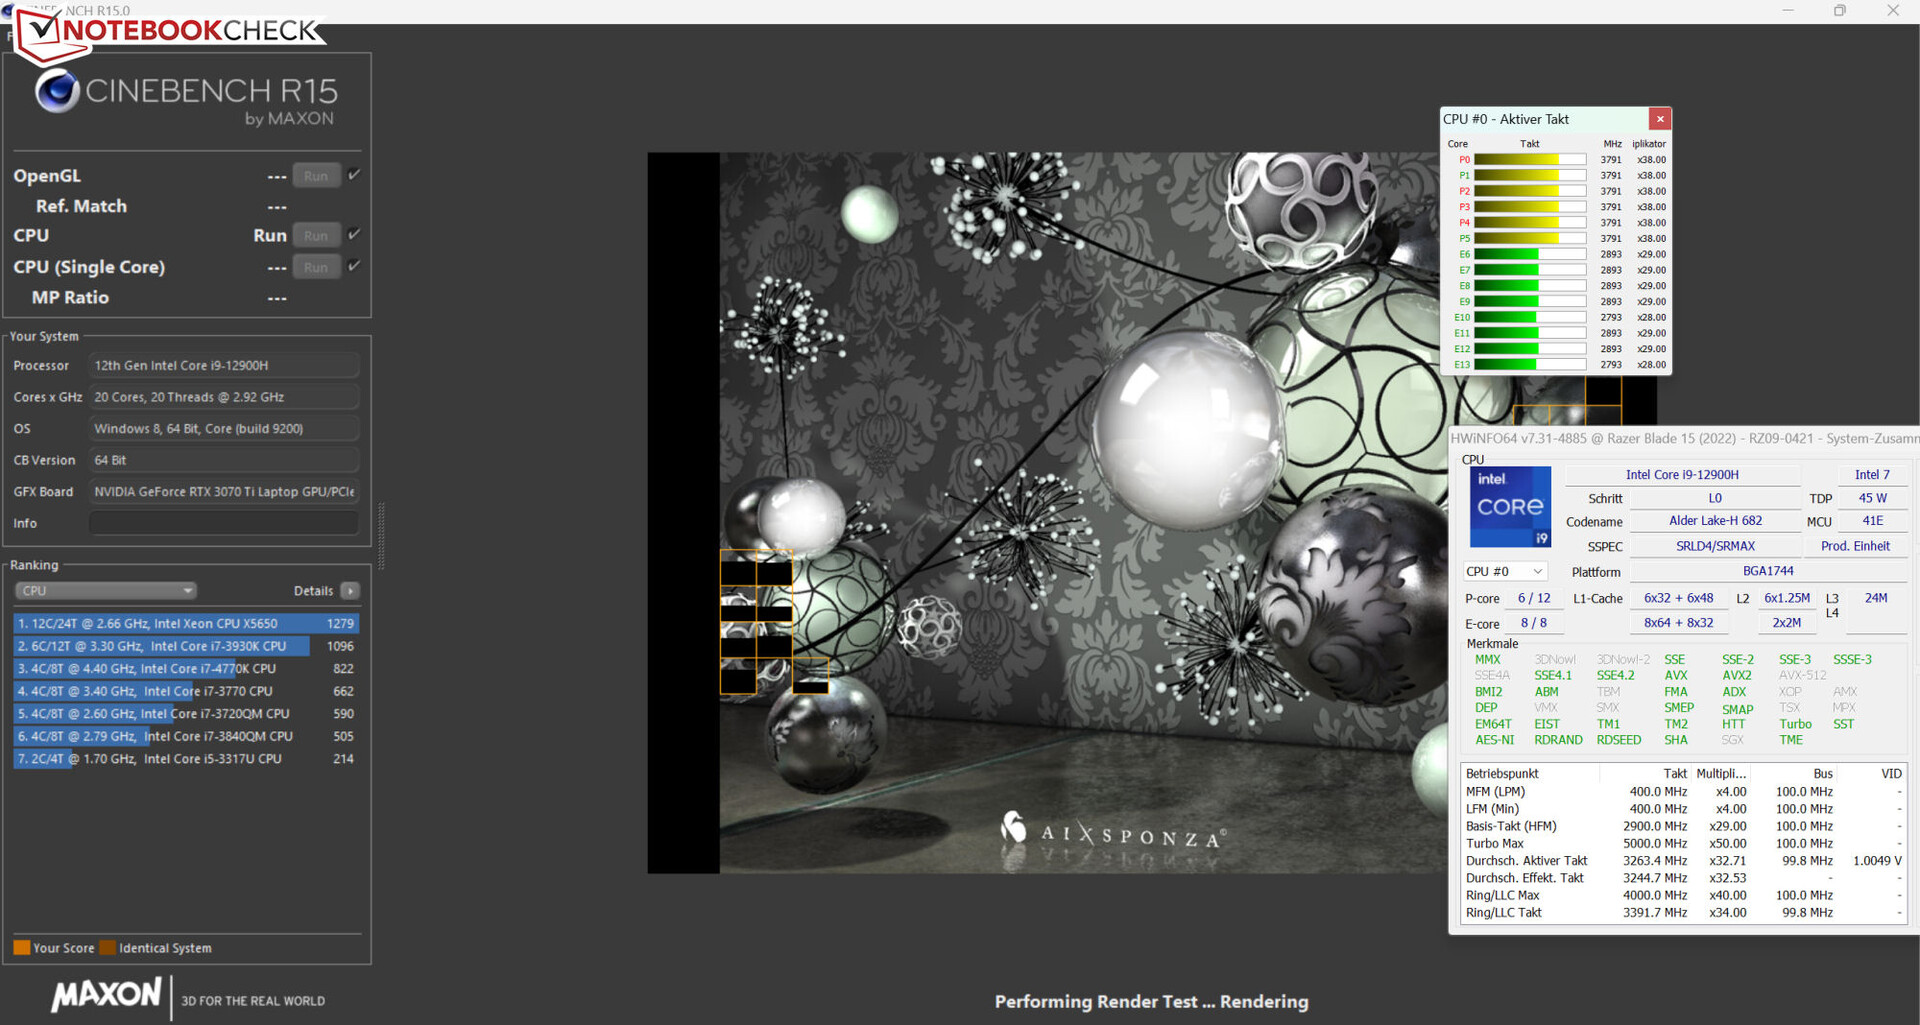
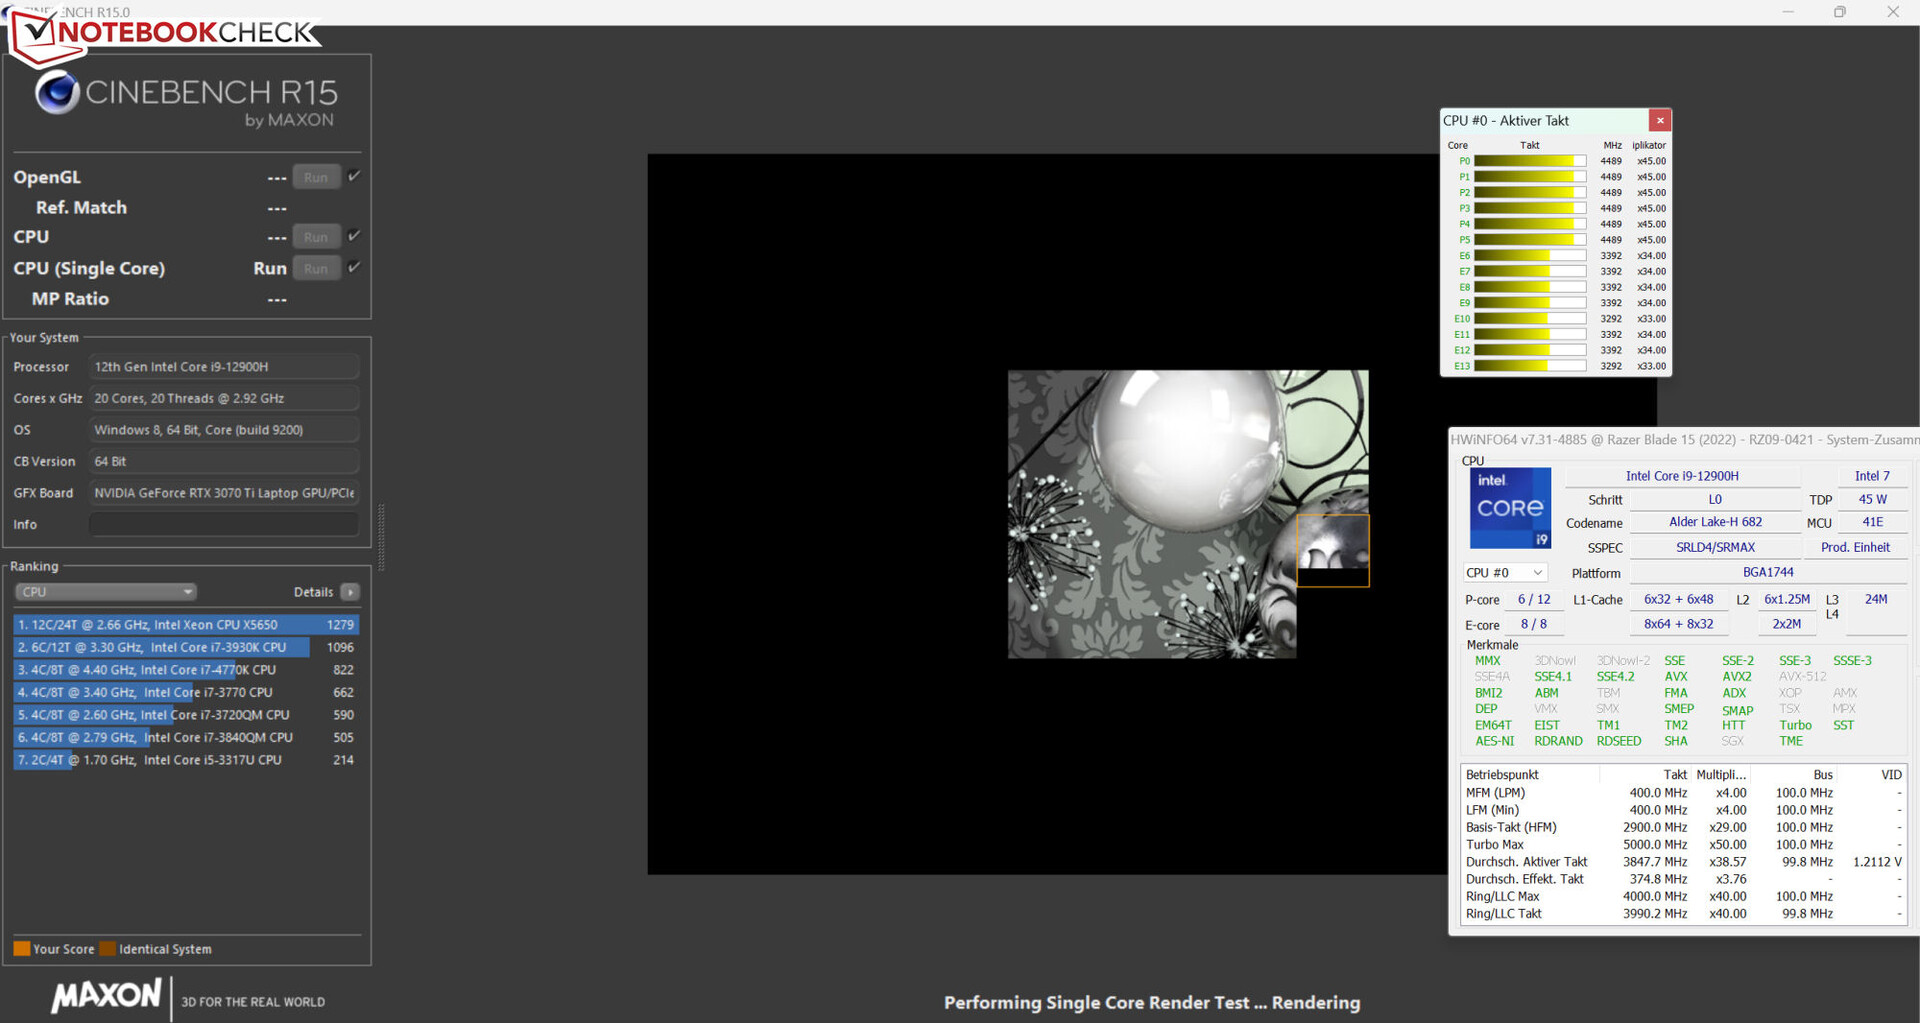
ONúcleo i9-12900H(Alder Lake) consiste em seis núcleos de desempenho (hiperthreading, 2,5 a 5 GHz) e oito núcleos de eficiência (sem hiperthreading, 1,8 a 3,8 GHz). No total, existem 20 núcleos lógicos de CPU.
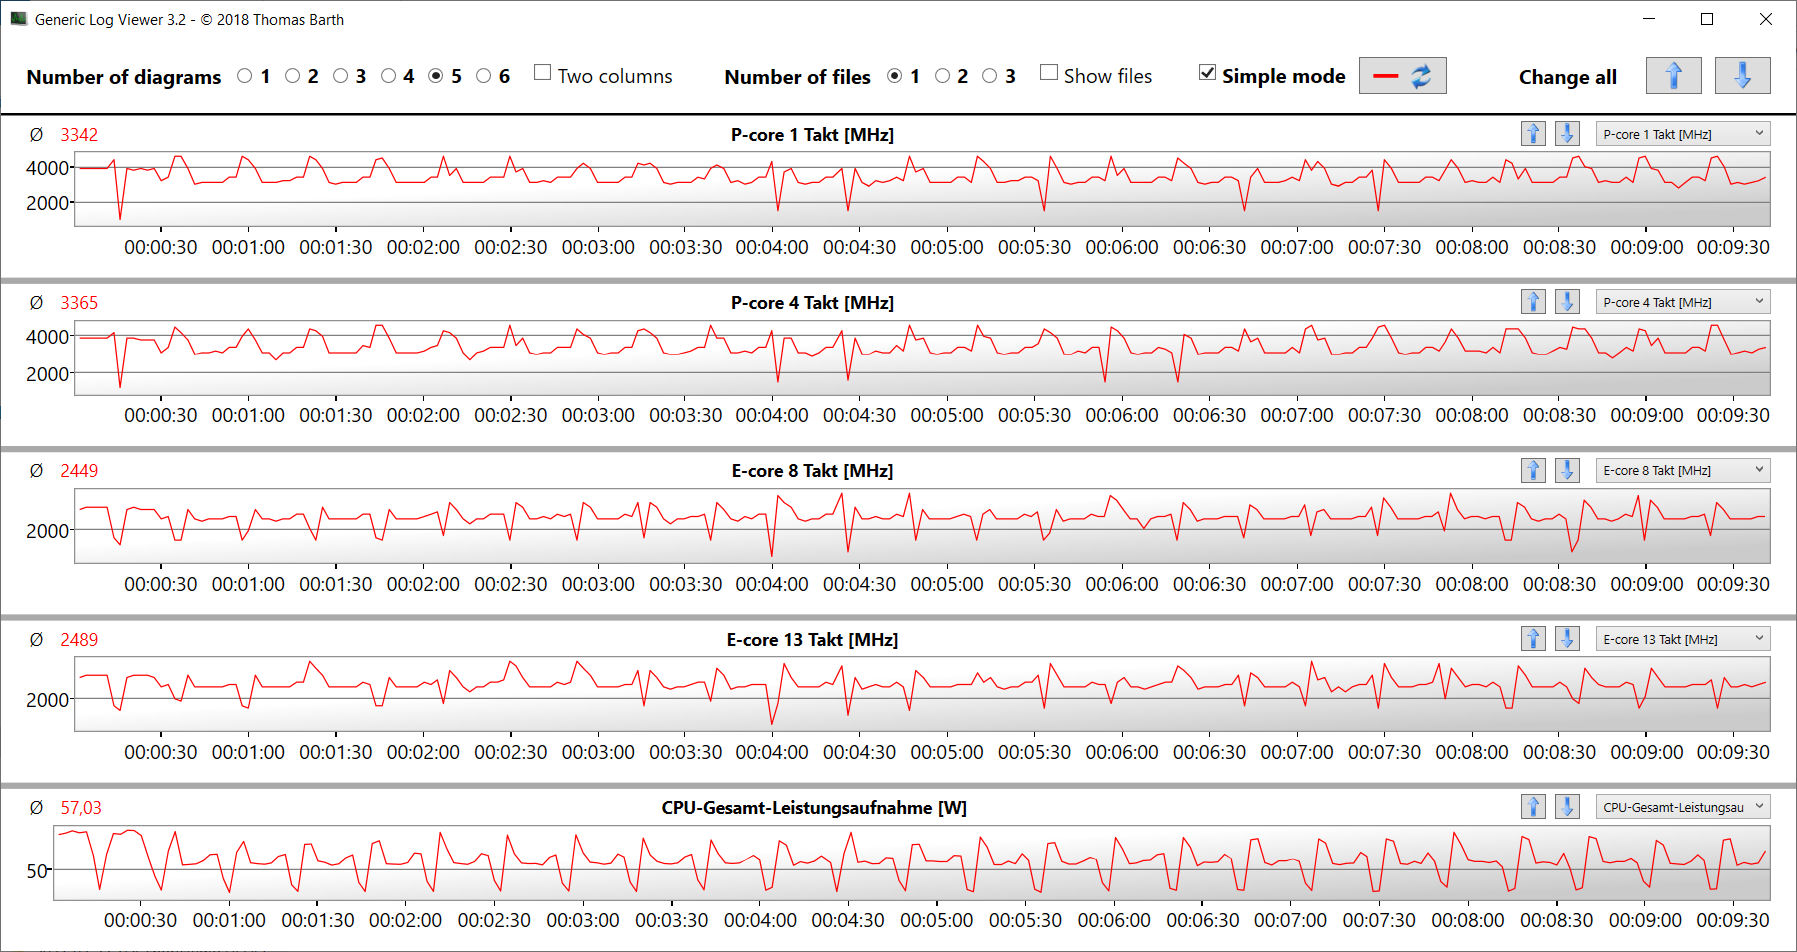
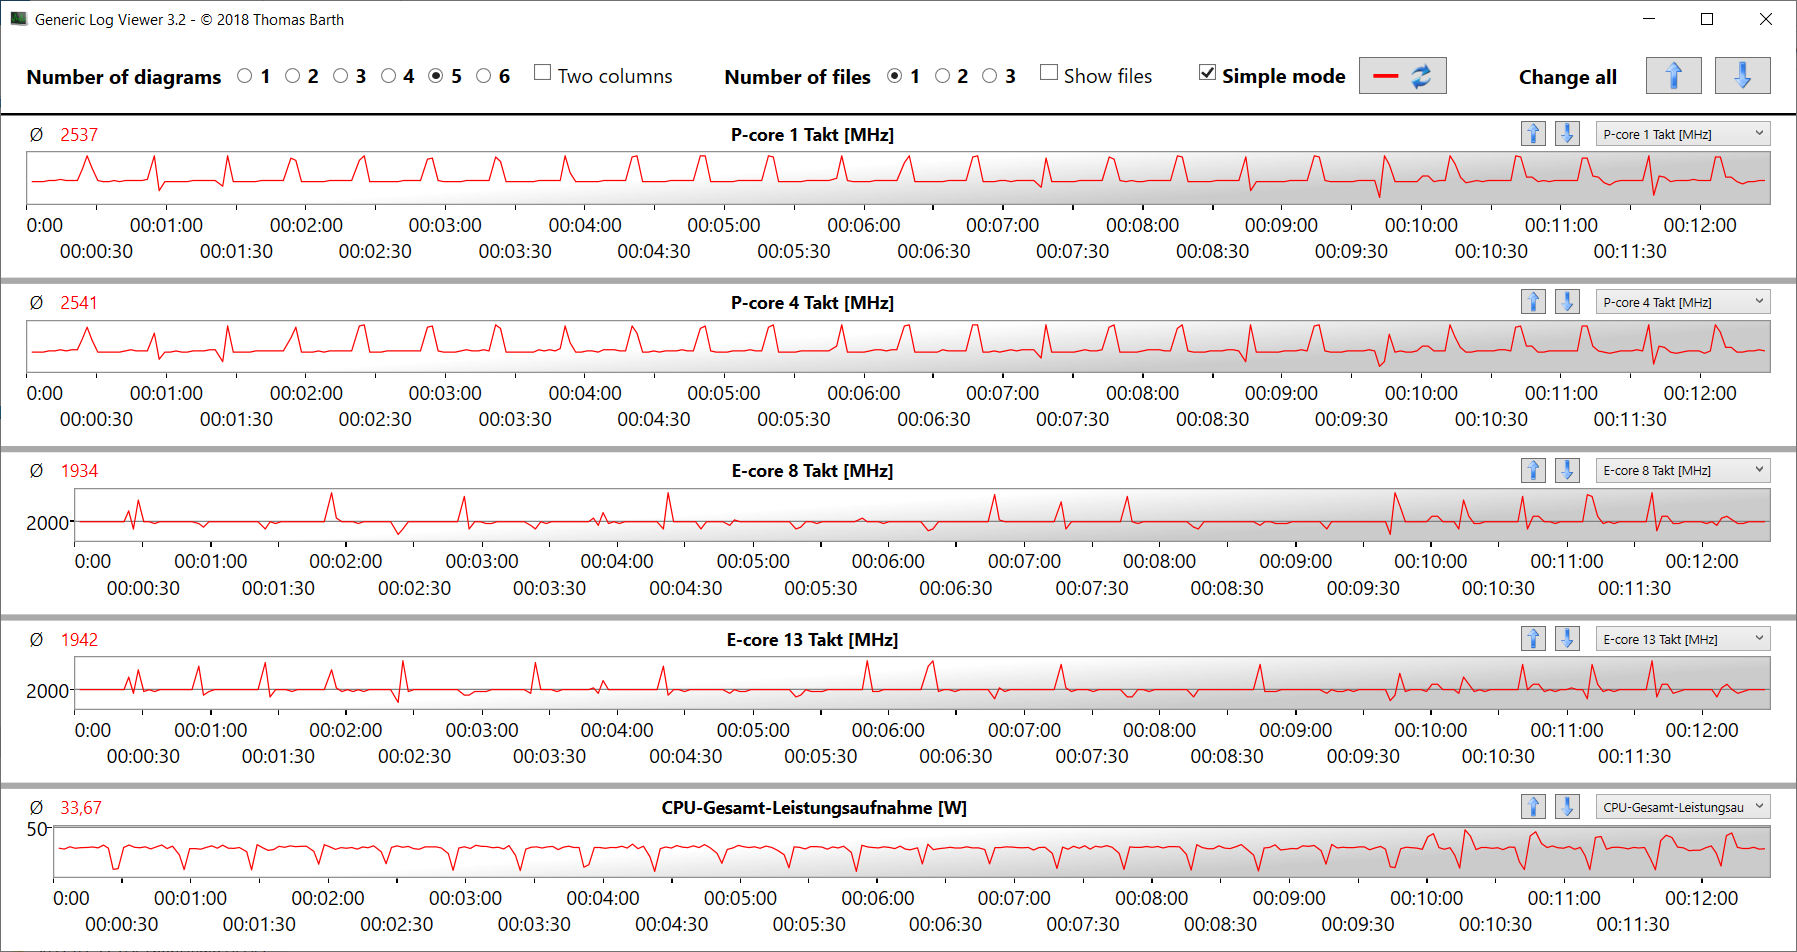
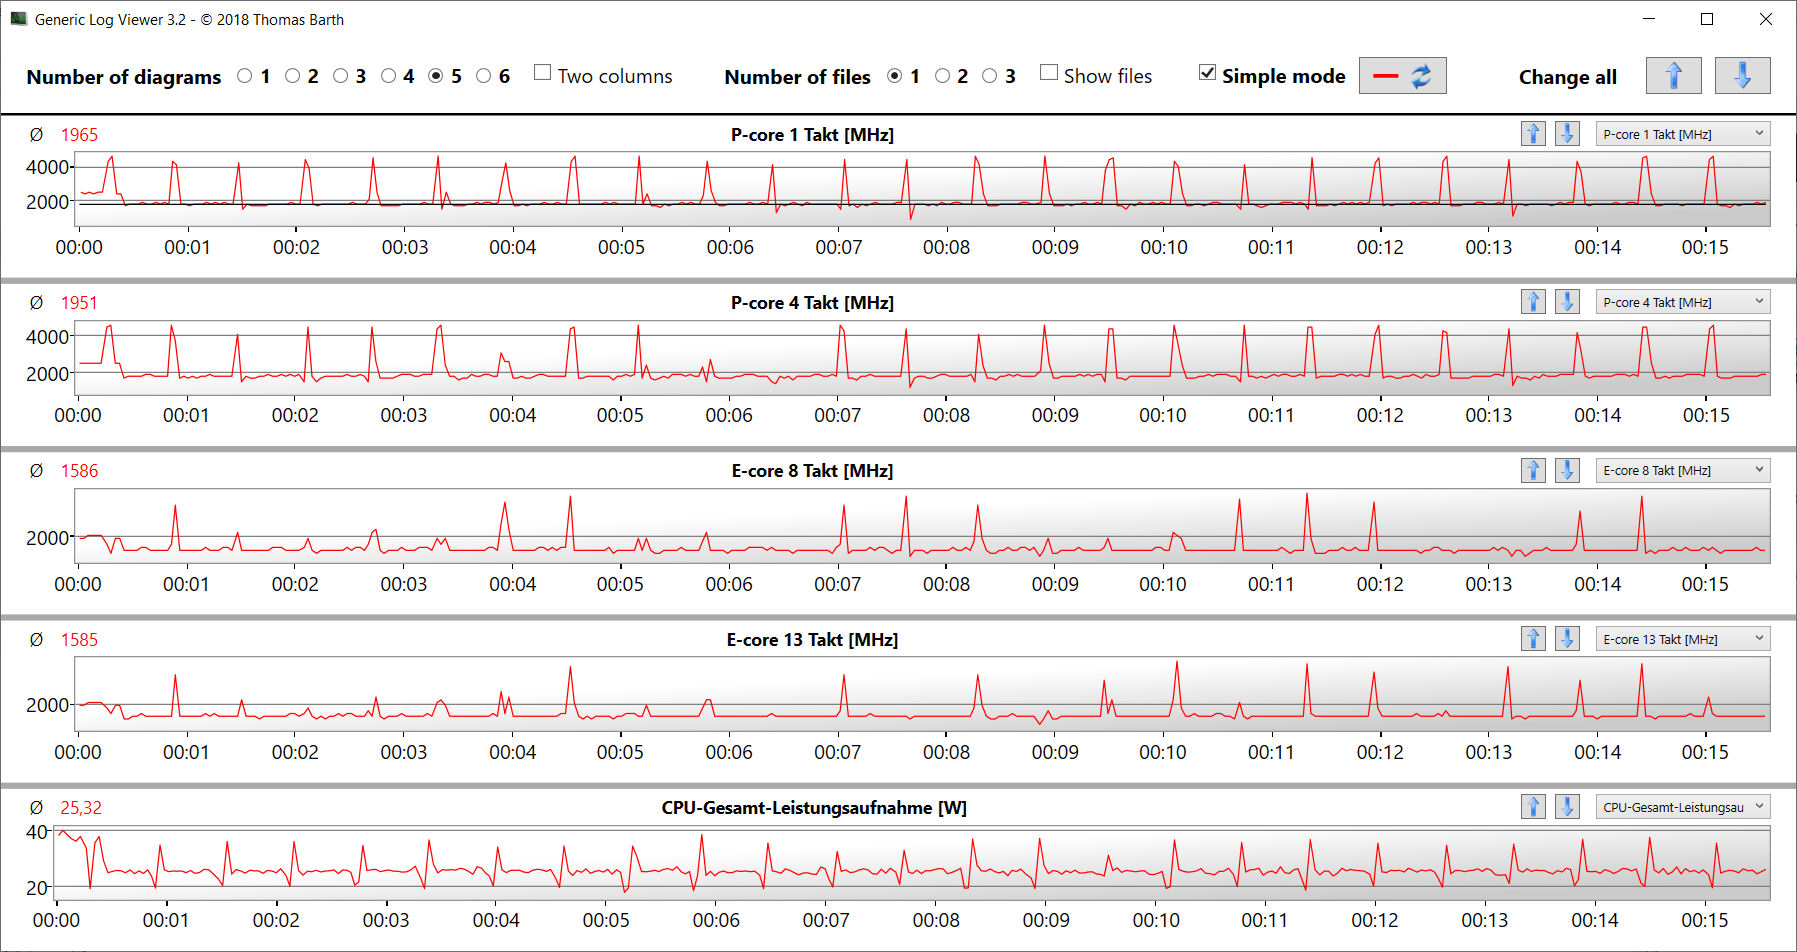
O teste de benchmark Cinebench R15 multi-thread foi processado em 3,6 a 3,8 GHz (P-cores) e 2,8 a 2,9 GHz (E-cores). Fizemos o teste de rosca única em 1,4 a 4,5 GHz (P-cores) e 1,5 a 3,5 GHz (E-cores), respectivamente. No modo de bateria, as velocidades do relógio são mais baixas. O teste de loop CB15 mostra: A carga multi-tarefa só é confrontada com a alta velocidade do relógio turbo por um curto período de tempo. Após 30 a 40 segundos, os valores caem para aproximadamente a velocidade do relógio de base.
Cinebench R15 Multi Continuous Test
* ... menor é melhor
AIDA64: FP32 Ray-Trace | FPU Julia | CPU SHA3 | CPU Queen | FPU SinJulia | FPU Mandel | CPU AES | CPU ZLib | FP64 Ray-Trace | CPU PhotoWorxx
| Performance rating | |
| Média da turma Gaming | |
| Asus ROG Zephyrus M16 GU603Z | |
| Razer Blade 15 OLED (Early 2022) | |
| Aorus 15 XE5 | |
| Schenker XMG Fusion 15 (Mid 22) | |
| Média Intel Core i9-12900H | |
| HP Omen 16-b1090ng | |
| Razer Blade 15 2022 | |
| AIDA64 / FP32 Ray-Trace | |
| Média da turma Gaming (10227 - 85542, n=107, últimos 2 anos) | |
| Asus ROG Zephyrus M16 GU603Z | |
| Razer Blade 15 OLED (Early 2022) | |
| Aorus 15 XE5 | |
| Schenker XMG Fusion 15 (Mid 22) | |
| Média Intel Core i9-12900H (4074 - 18289, n=29) | |
| Razer Blade 15 2022 | |
| HP Omen 16-b1090ng | |
| AIDA64 / FPU Julia | |
| Média da turma Gaming (51376 - 238426, n=107, últimos 2 anos) | |
| Asus ROG Zephyrus M16 GU603Z | |
| Razer Blade 15 OLED (Early 2022) | |
| Aorus 15 XE5 | |
| Schenker XMG Fusion 15 (Mid 22) | |
| Média Intel Core i9-12900H (22307 - 93236, n=29) | |
| Razer Blade 15 2022 | |
| HP Omen 16-b1090ng | |
| AIDA64 / CPU SHA3 | |
| Média da turma Gaming (2180 - 9817, n=107, últimos 2 anos) | |
| Schenker XMG Fusion 15 (Mid 22) | |
| Asus ROG Zephyrus M16 GU603Z | |
| Razer Blade 15 OLED (Early 2022) | |
| Média Intel Core i9-12900H (1378 - 4215, n=29) | |
| Aorus 15 XE5 | |
| Razer Blade 15 2022 | |
| HP Omen 16-b1090ng | |
| AIDA64 / CPU Queen | |
| Média da turma Gaming (49785 - 173351, n=98, últimos 2 anos) | |
| Razer Blade 15 OLED (Early 2022) | |
| Asus ROG Zephyrus M16 GU603Z | |
| Aorus 15 XE5 | |
| Média Intel Core i9-12900H (78172 - 111241, n=28) | |
| HP Omen 16-b1090ng | |
| Razer Blade 15 2022 | |
| Schenker XMG Fusion 15 (Mid 22) | |
| AIDA64 / FPU SinJulia | |
| Média da turma Gaming (4424 - 33636, n=107, últimos 2 anos) | |
| Razer Blade 15 OLED (Early 2022) | |
| Asus ROG Zephyrus M16 GU603Z | |
| HP Omen 16-b1090ng | |
| Razer Blade 15 2022 | |
| Média Intel Core i9-12900H (5709 - 10410, n=29) | |
| Schenker XMG Fusion 15 (Mid 22) | |
| Aorus 15 XE5 | |
| AIDA64 / FPU Mandel | |
| Média da turma Gaming (25115 - 128721, n=107, últimos 2 anos) | |
| Schenker XMG Fusion 15 (Mid 22) | |
| Asus ROG Zephyrus M16 GU603Z | |
| Razer Blade 15 OLED (Early 2022) | |
| Aorus 15 XE5 | |
| Média Intel Core i9-12900H (11257 - 45581, n=29) | |
| Razer Blade 15 2022 | |
| HP Omen 16-b1090ng | |
| AIDA64 / CPU AES | |
| Schenker XMG Fusion 15 (Mid 22) | |
| Asus ROG Zephyrus M16 GU603Z | |
| Aorus 15 XE5 | |
| Média da turma Gaming (39258 - 247074, n=107, últimos 2 anos) | |
| Razer Blade 15 OLED (Early 2022) | |
| HP Omen 16-b1090ng | |
| Média Intel Core i9-12900H (31935 - 151546, n=29) | |
| Razer Blade 15 2022 | |
| AIDA64 / CPU ZLib | |
| Média da turma Gaming (574 - 2531, n=107, últimos 2 anos) | |
| Razer Blade 15 OLED (Early 2022) | |
| Asus ROG Zephyrus M16 GU603Z | |
| HP Omen 16-b1090ng | |
| Razer Blade 15 2022 | |
| Média Intel Core i9-12900H (449 - 1193, n=29) | |
| Aorus 15 XE5 | |
| Schenker XMG Fusion 15 (Mid 22) | |
| AIDA64 / FP64 Ray-Trace | |
| Média da turma Gaming (5509 - 45446, n=107, últimos 2 anos) | |
| Asus ROG Zephyrus M16 GU603Z | |
| Razer Blade 15 OLED (Early 2022) | |
| Schenker XMG Fusion 15 (Mid 22) | |
| Aorus 15 XE5 | |
| Média Intel Core i9-12900H (2235 - 10511, n=29) | |
| HP Omen 16-b1090ng | |
| Razer Blade 15 2022 | |
| AIDA64 / CPU PhotoWorxx | |
| Média da turma Gaming (12271 - 89891, n=107, últimos 2 anos) | |
| Asus ROG Zephyrus M16 GU603Z | |
| Razer Blade 15 2022 | |
| HP Omen 16-b1090ng | |
| Média Intel Core i9-12900H (20960 - 48269, n=30) | |
| Aorus 15 XE5 | |
| Razer Blade 15 OLED (Early 2022) | |
| Razer Blade 15 OLED (Early 2022) | |
| Schenker XMG Fusion 15 (Mid 22) | |
Desempenho do sistema
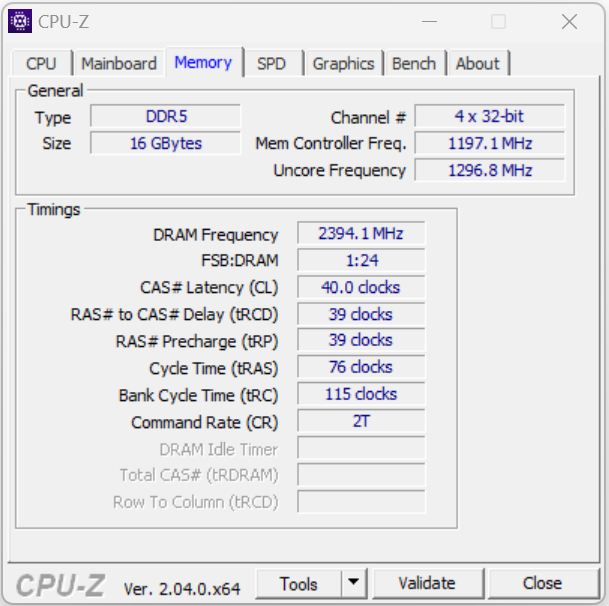
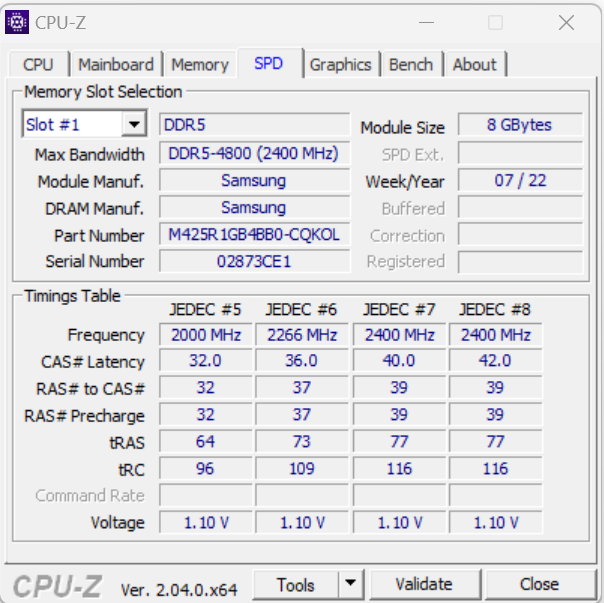
O sistema funciona de forma suave e confiável e fornece energia suficiente para áreas de aplicação exigentes, como renderização, edição de vídeo e jogos. As taxas de transferência da RAM estão em um nível normal para a memória DDR5-4800 e isto é complementado por bons resultados PC-Mark.
CrossMark: Overall | Productivity | Creativity | Responsiveness
| PCMark 10 / Score | |
| Média da turma Gaming (5828 - 11574, n=95, últimos 2 anos) | |
| Asus ROG Zephyrus M16 GU603Z | |
| Média Intel Core i9-12900H, NVIDIA GeForce RTX 3070 Ti Laptop GPU (7087 - 8072, n=6) | |
| Razer Blade 15 2022 | |
| Aorus 15 XE5 | |
| Razer Blade 15 OLED (Early 2022) | |
| HP Omen 16-b1090ng | |
| Schenker XMG Fusion 15 (Mid 22) | |
| PCMark 10 / Essentials | |
| Asus ROG Zephyrus M16 GU603Z | |
| Média Intel Core i9-12900H, NVIDIA GeForce RTX 3070 Ti Laptop GPU (10266 - 11663, n=6) | |
| Aorus 15 XE5 | |
| Razer Blade 15 2022 | |
| Média da turma Gaming (8810 - 12600, n=99, últimos 2 anos) | |
| Razer Blade 15 OLED (Early 2022) | |
| HP Omen 16-b1090ng | |
| Schenker XMG Fusion 15 (Mid 22) | |
| PCMark 10 / Productivity | |
| Média da turma Gaming (6845 - 18766, n=97, últimos 2 anos) | |
| Aorus 15 XE5 | |
| Asus ROG Zephyrus M16 GU603Z | |
| Média Intel Core i9-12900H, NVIDIA GeForce RTX 3070 Ti Laptop GPU (9402 - 10742, n=6) | |
| Razer Blade 15 OLED (Early 2022) | |
| Razer Blade 15 2022 | |
| HP Omen 16-b1090ng | |
| Schenker XMG Fusion 15 (Mid 22) | |
| PCMark 10 / Digital Content Creation | |
| Média da turma Gaming (7602 - 19657, n=97, últimos 2 anos) | |
| Razer Blade 15 2022 | |
| Asus ROG Zephyrus M16 GU603Z | |
| Média Intel Core i9-12900H, NVIDIA GeForce RTX 3070 Ti Laptop GPU (10009 - 12541, n=6) | |
| Aorus 15 XE5 | |
| HP Omen 16-b1090ng | |
| Razer Blade 15 OLED (Early 2022) | |
| Schenker XMG Fusion 15 (Mid 22) | |
| CrossMark / Overall | |
| Média da turma Gaming (1366 - 2409, n=96, últimos 2 anos) | |
| Aorus 15 XE5 | |
| Asus ROG Zephyrus M16 GU603Z | |
| Média Intel Core i9-12900H, NVIDIA GeForce RTX 3070 Ti Laptop GPU (1664 - 2044, n=6) | |
| Razer Blade 15 OLED (Early 2022) | |
| Schenker XMG Fusion 15 (Mid 22) | |
| CrossMark / Productivity | |
| Aorus 15 XE5 | |
| Média da turma Gaming (1386 - 2254, n=96, últimos 2 anos) | |
| Asus ROG Zephyrus M16 GU603Z | |
| Média Intel Core i9-12900H, NVIDIA GeForce RTX 3070 Ti Laptop GPU (1591 - 1968, n=6) | |
| Razer Blade 15 OLED (Early 2022) | |
| Schenker XMG Fusion 15 (Mid 22) | |
| CrossMark / Creativity | |
| Média da turma Gaming (1343 - 2729, n=96, últimos 2 anos) | |
| Asus ROG Zephyrus M16 GU603Z | |
| Média Intel Core i9-12900H, NVIDIA GeForce RTX 3070 Ti Laptop GPU (1797 - 2148, n=6) | |
| Aorus 15 XE5 | |
| Razer Blade 15 OLED (Early 2022) | |
| Schenker XMG Fusion 15 (Mid 22) | |
| CrossMark / Responsiveness | |
| Aorus 15 XE5 | |
| Asus ROG Zephyrus M16 GU603Z | |
| Média Intel Core i9-12900H, NVIDIA GeForce RTX 3070 Ti Laptop GPU (1514 - 2069, n=6) | |
| Média da turma Gaming (1226 - 2334, n=96, últimos 2 anos) | |
| Schenker XMG Fusion 15 (Mid 22) | |
| Razer Blade 15 OLED (Early 2022) | |
| PCMark 8 Home Score Accelerated v2 | 5101 pontos | |
| PCMark 8 Work Score Accelerated v2 | 5789 pontos | |
| PCMark 10 Score | 7336 pontos | |
Ajuda | ||
| AIDA64 / Memory Copy | |
| Média da turma Gaming (21750 - 129946, n=107, últimos 2 anos) | |
| Asus ROG Zephyrus M16 GU603Z | |
| HP Omen 16-b1090ng | |
| Razer Blade 15 2022 | |
| Média Intel Core i9-12900H (34438 - 74264, n=29) | |
| Razer Blade 15 OLED (Early 2022) | |
| Aorus 15 XE5 | |
| Schenker XMG Fusion 15 (Mid 22) | |
| AIDA64 / Memory Read | |
| Média da turma Gaming (22956 - 118858, n=107, últimos 2 anos) | |
| Asus ROG Zephyrus M16 GU603Z | |
| HP Omen 16-b1090ng | |
| Razer Blade 15 2022 | |
| Média Intel Core i9-12900H (36365 - 74642, n=29) | |
| Razer Blade 15 OLED (Early 2022) | |
| Aorus 15 XE5 | |
| Schenker XMG Fusion 15 (Mid 22) | |
| AIDA64 / Memory Write | |
| Média da turma Gaming (22297 - 135096, n=107, últimos 2 anos) | |
| Asus ROG Zephyrus M16 GU603Z | |
| Razer Blade 15 2022 | |
| HP Omen 16-b1090ng | |
| Média Intel Core i9-12900H (32276 - 67858, n=29) | |
| Aorus 15 XE5 | |
| Razer Blade 15 OLED (Early 2022) | |
| Schenker XMG Fusion 15 (Mid 22) | |
| AIDA64 / Memory Latency | |
| Média da turma Gaming (75.3 - 259, n=107, últimos 2 anos) | |
| Razer Blade 15 OLED (Early 2022) | |
| Aorus 15 XE5 | |
| Schenker XMG Fusion 15 (Mid 22) | |
| HP Omen 16-b1090ng | |
| Asus ROG Zephyrus M16 GU603Z | |
| Média Intel Core i9-12900H (74.7 - 118.1, n=28) | |
| Razer Blade 15 2022 | |
* ... menor é melhor
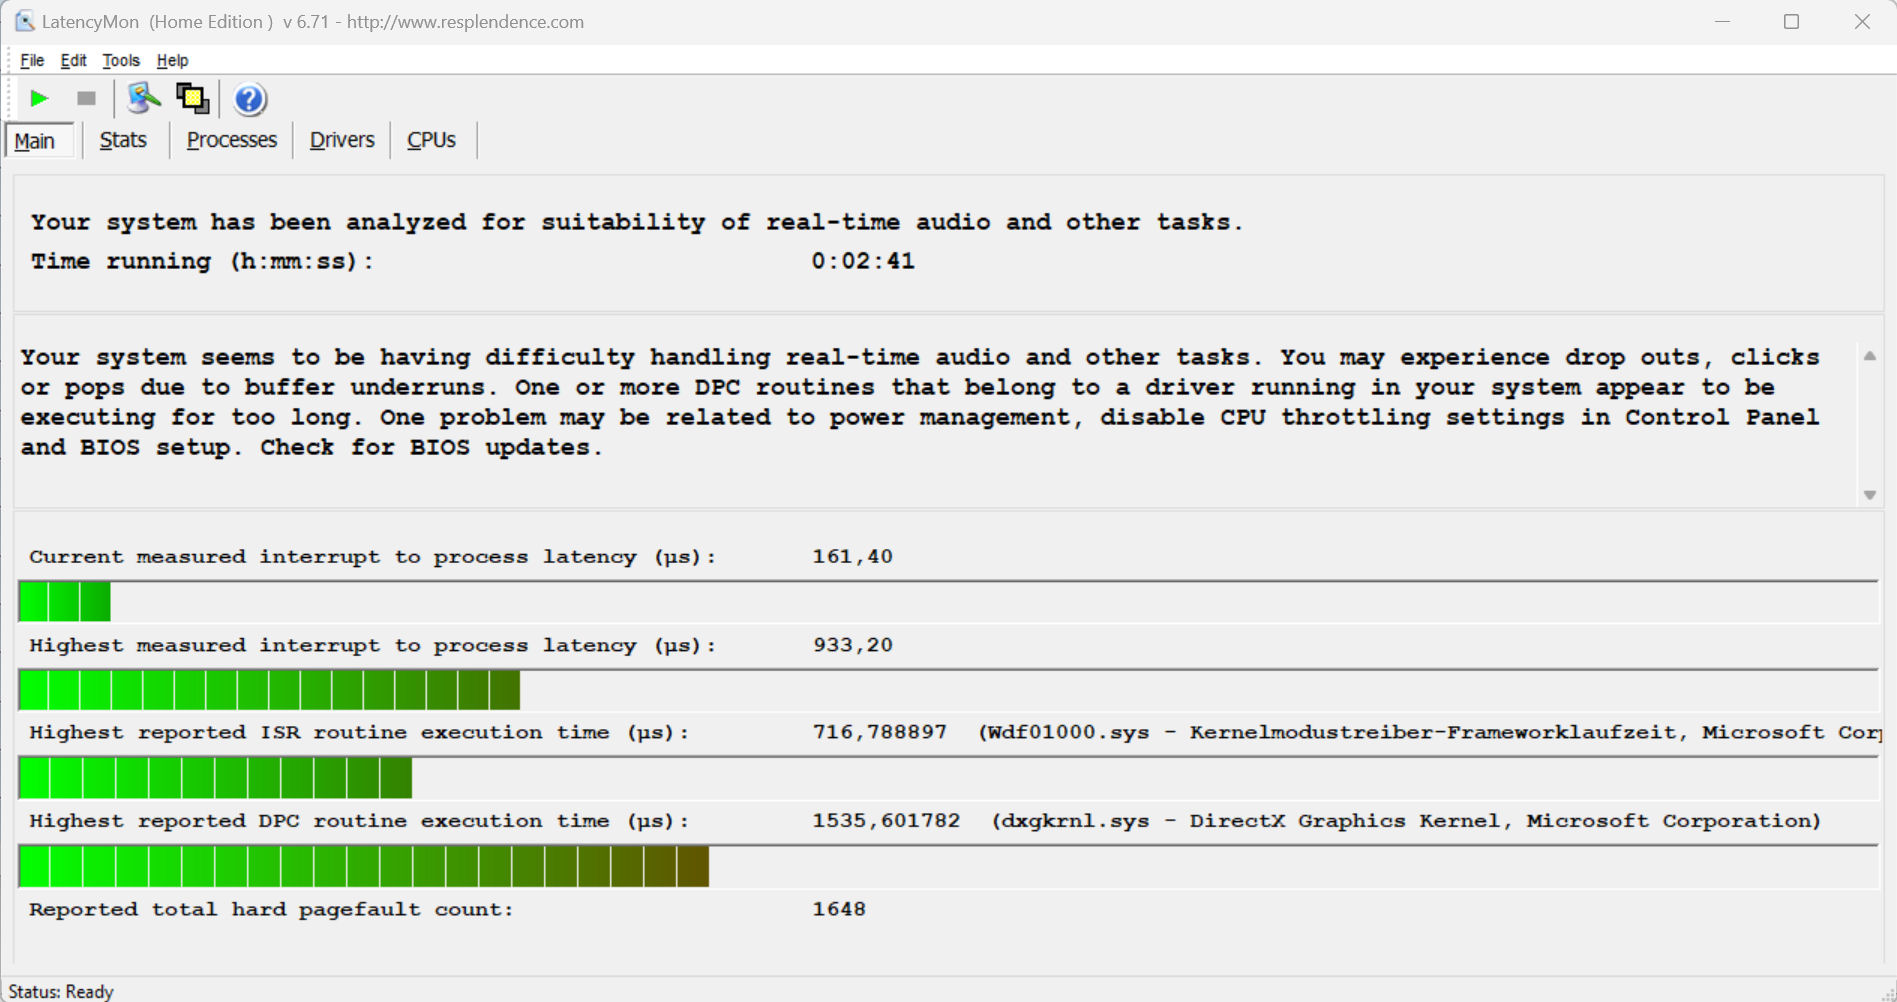
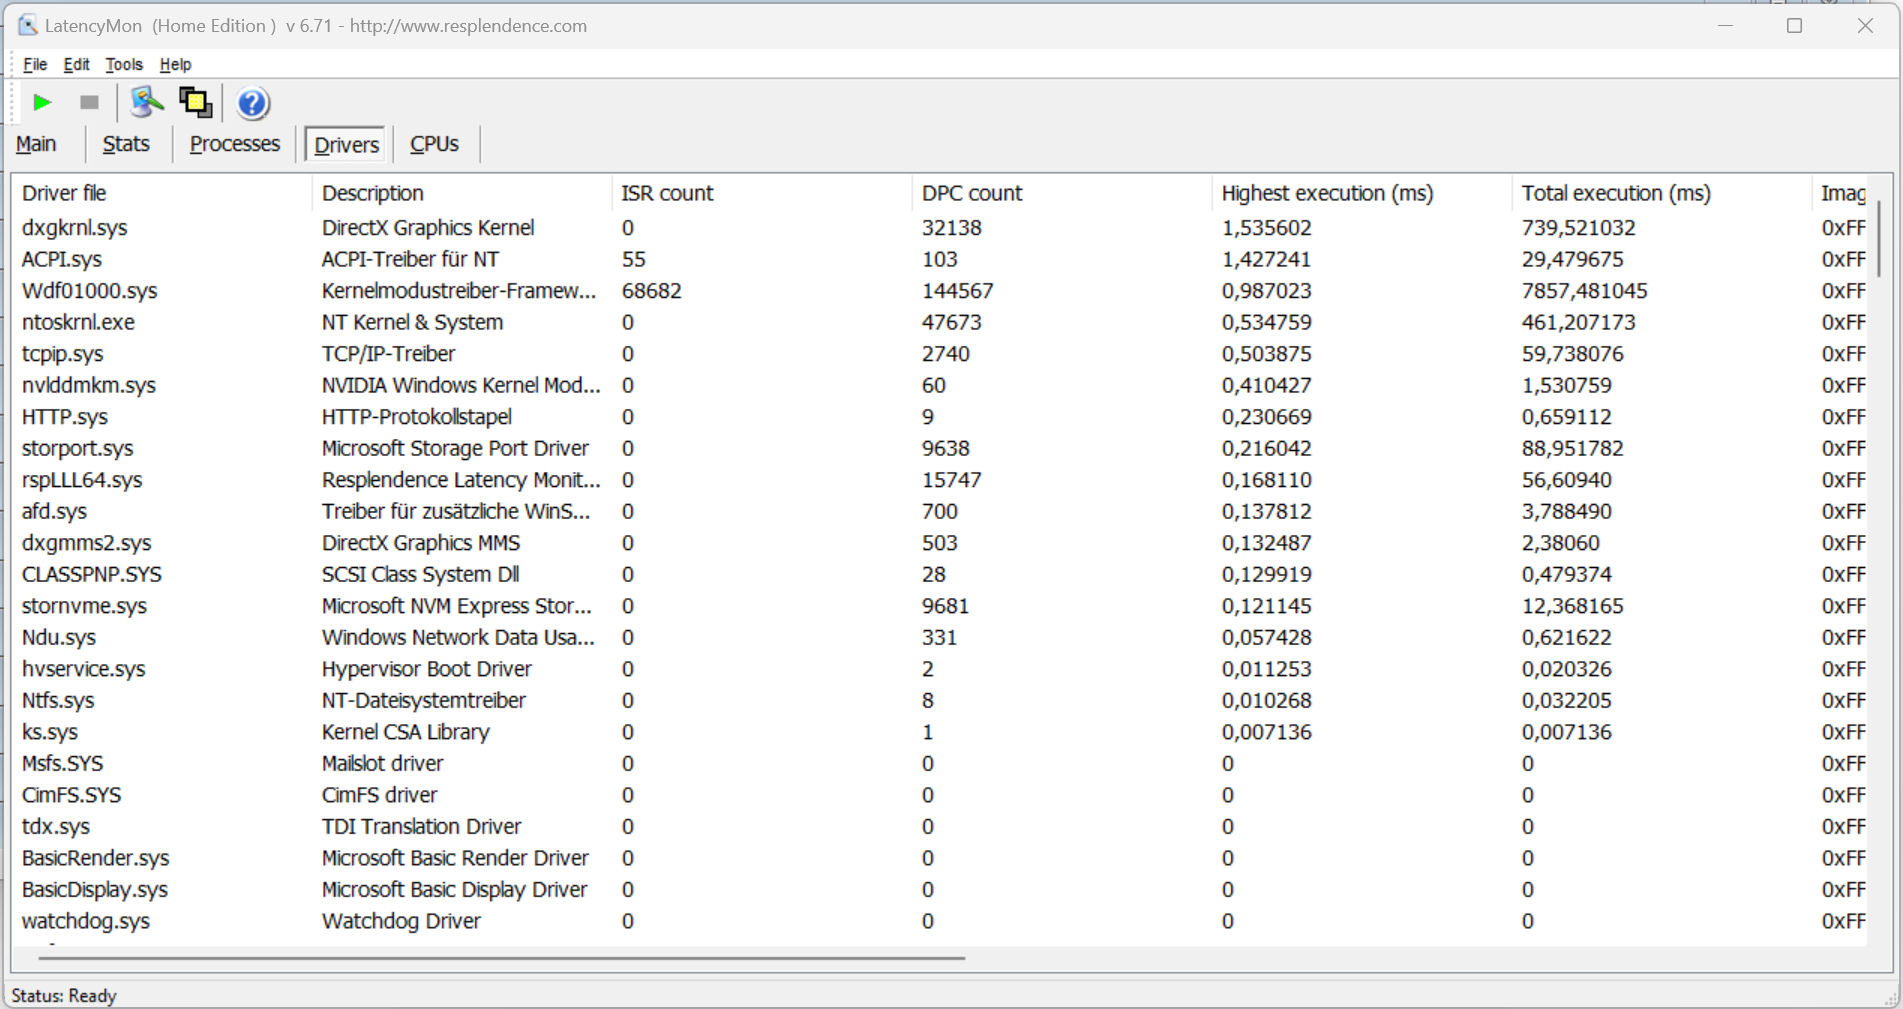
Latências DPC
O teste de monitor de latência padronizado (navegação na Internet, reprodução de vídeo 4k, Prime95 de alta carga) revelou anomalias. O sistema não parece ser adequado para edição de vídeo e áudio em tempo real. Entretanto, futuras atualizações de software podem levar a melhorias ou deteriorações no desempenho.
| DPC Latencies / LatencyMon - interrupt to process latency (max), Web, Youtube, Prime95 | |
| Schenker XMG Fusion 15 (Mid 22) | |
| Razer Blade 15 2022 | |
| Aorus 15 XE5 | |
| Asus ROG Zephyrus M16 GU603Z | |
| Razer Blade 15 OLED (Early 2022) | |
| HP Omen 16-b1090ng | |
* ... menor é melhor
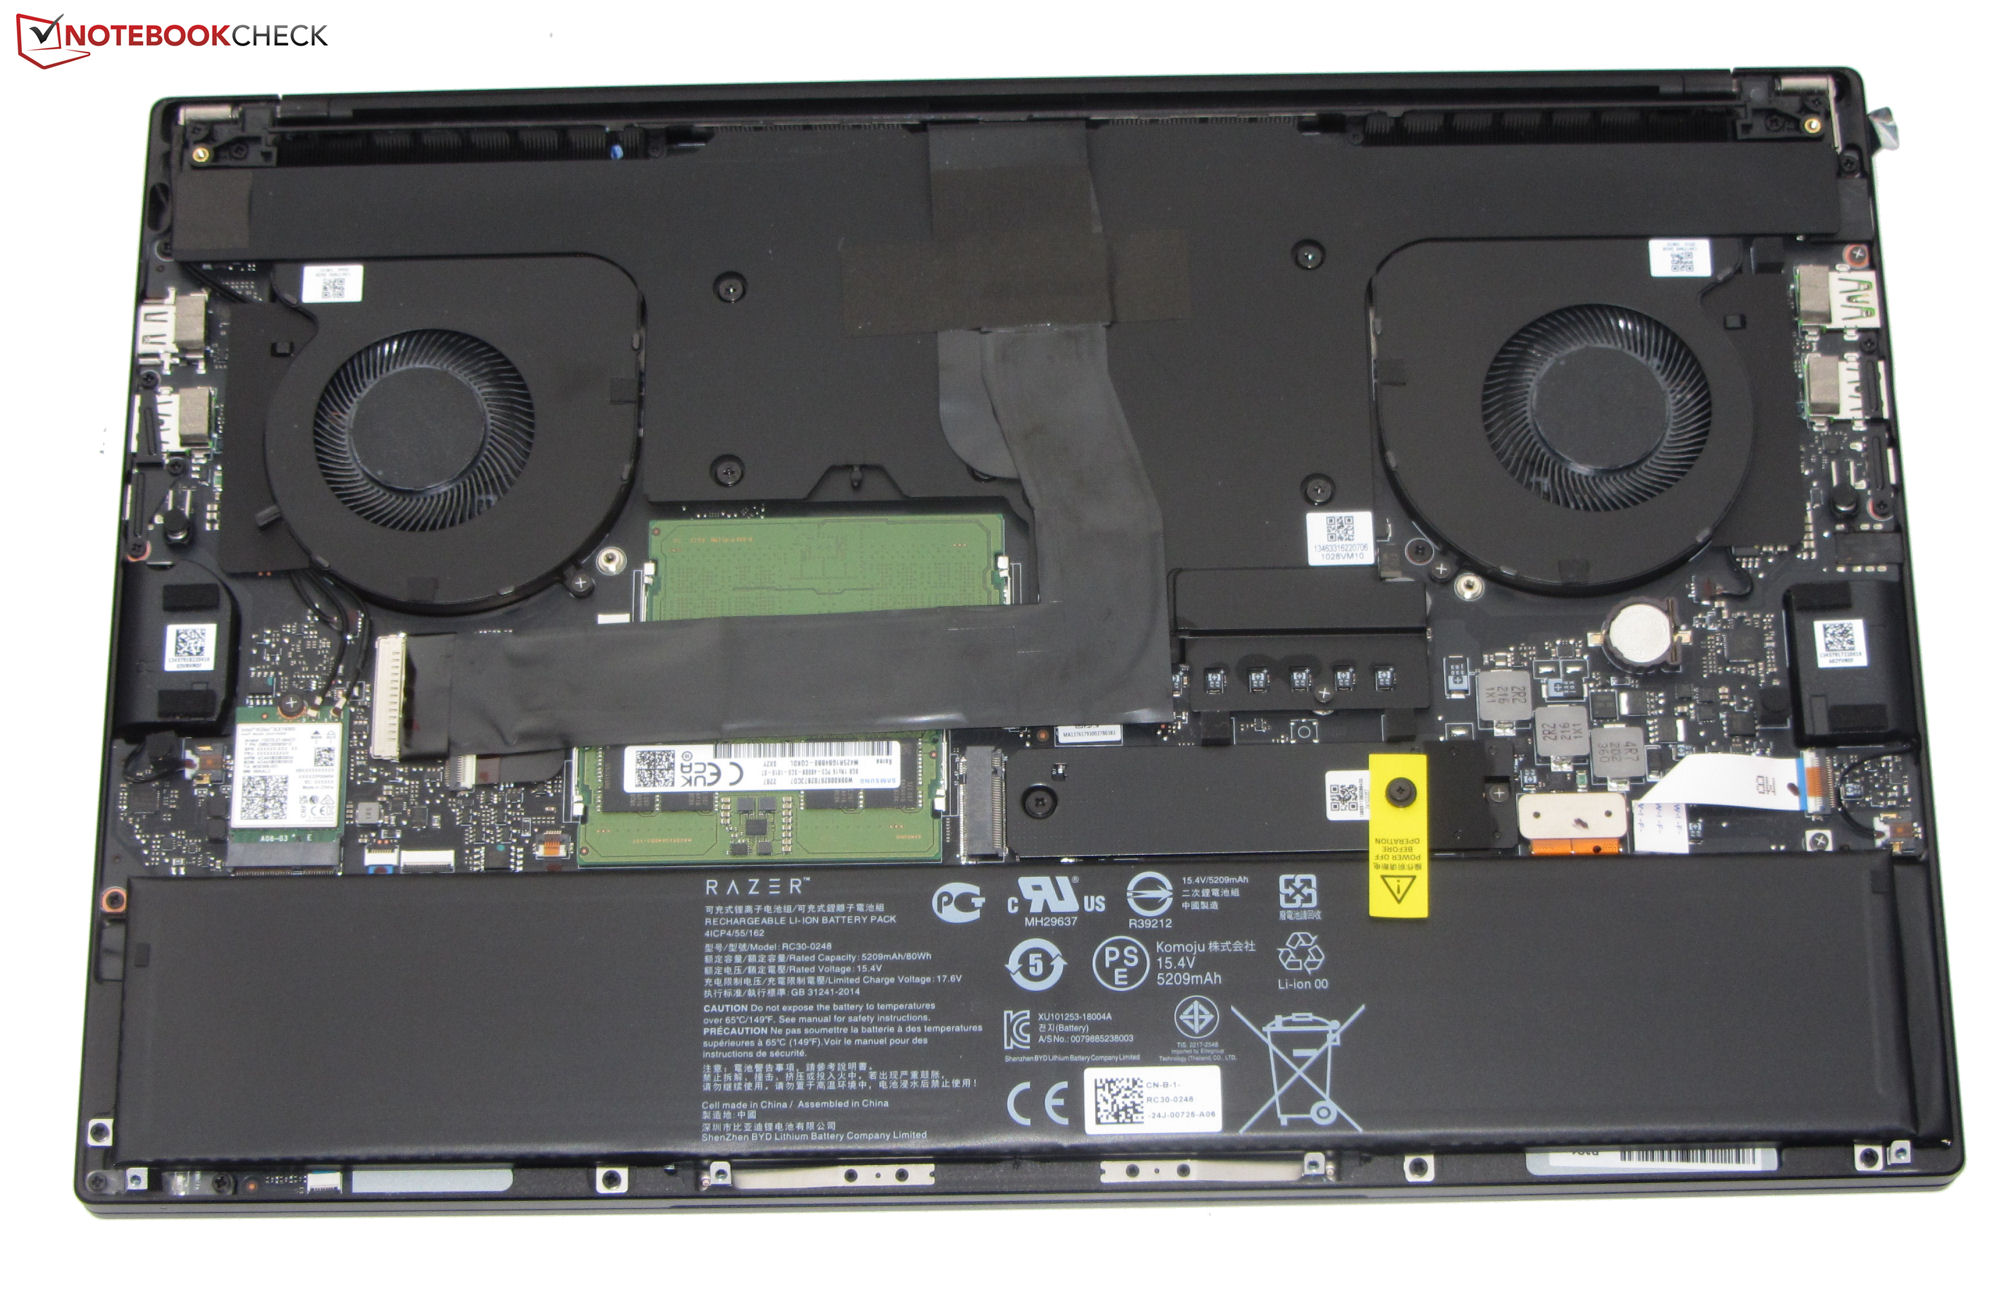
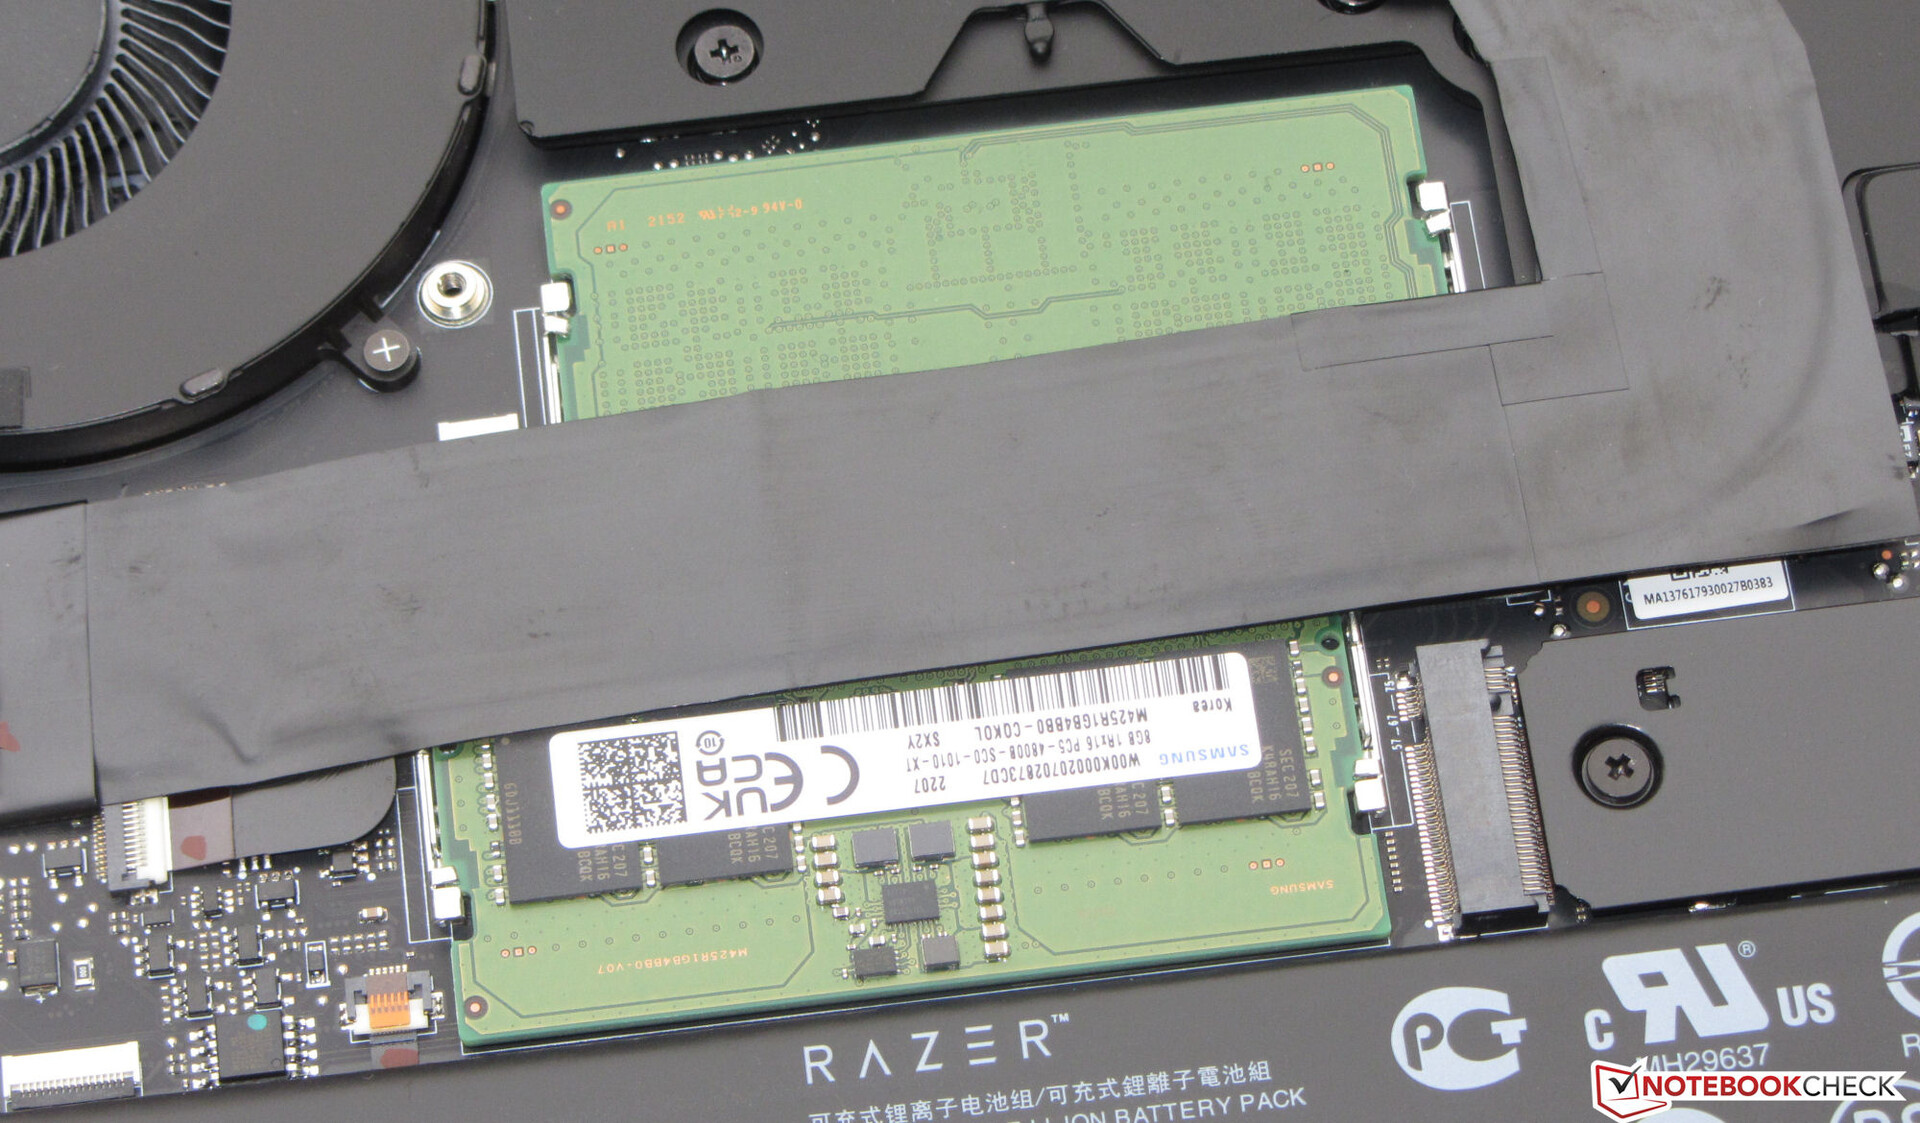
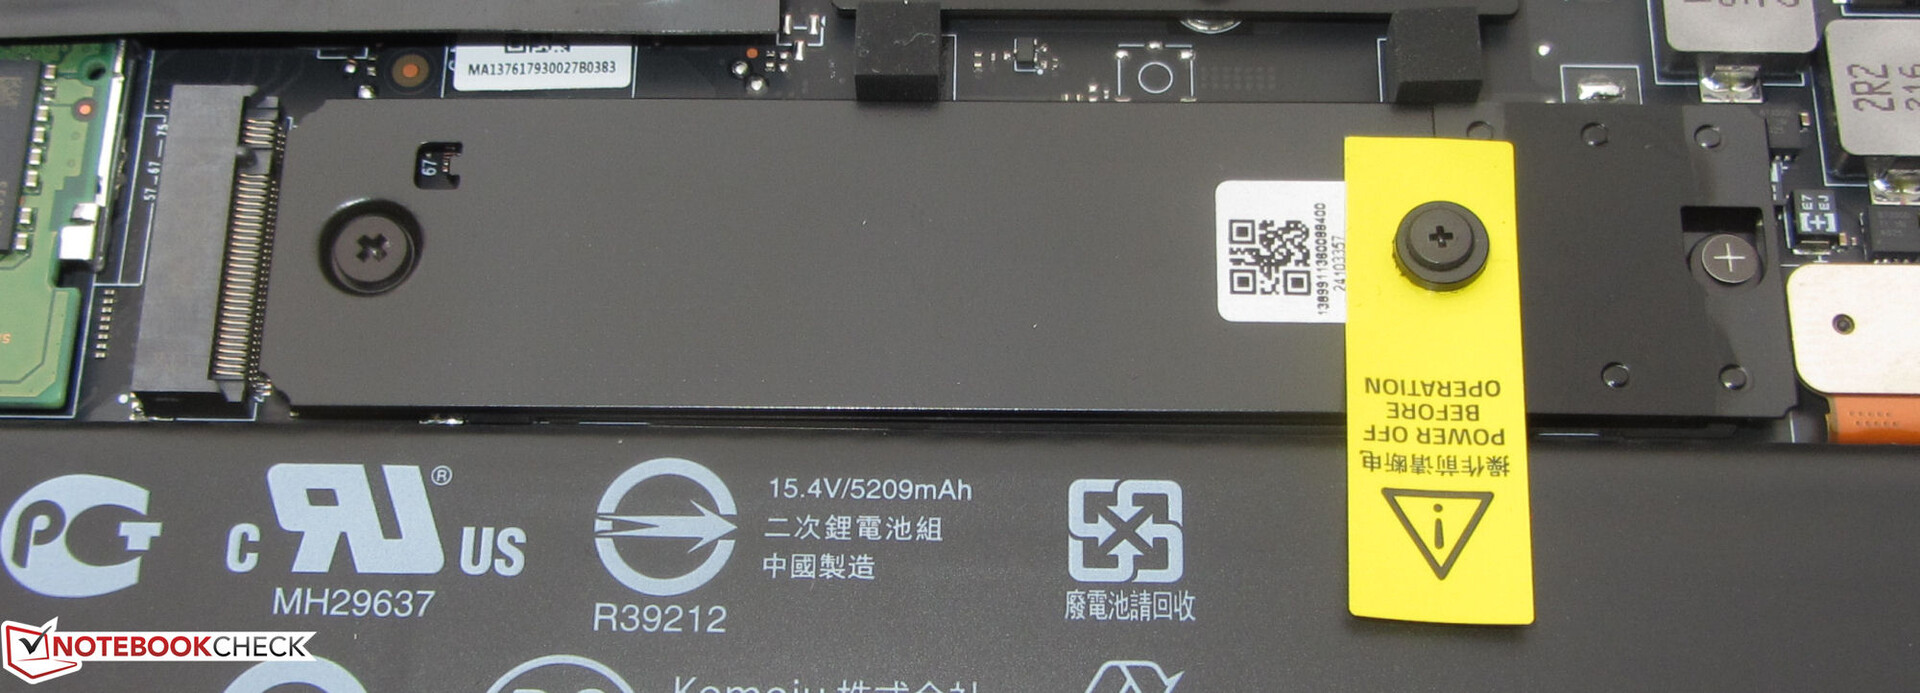
Armazenamento em massa
A lâmina tem espaço para dois SSDs PCIe-4 no formato M.2 2280. O SSD PCIe-4 instalado (1 TB) da Samsung oferece taxas de transferência muito boas. As quedas no desempenho devido ao estrangulamento térmico não estavam presentes.

* ... menor é melhor
Continuous Performance Read: DiskSpd Read Loop, Queue Depth 8
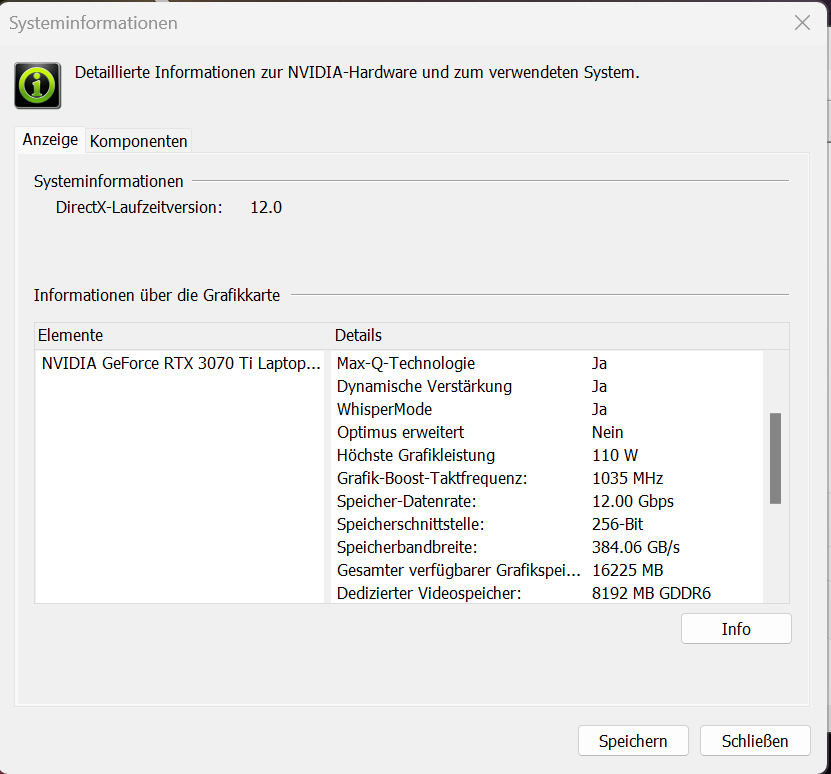
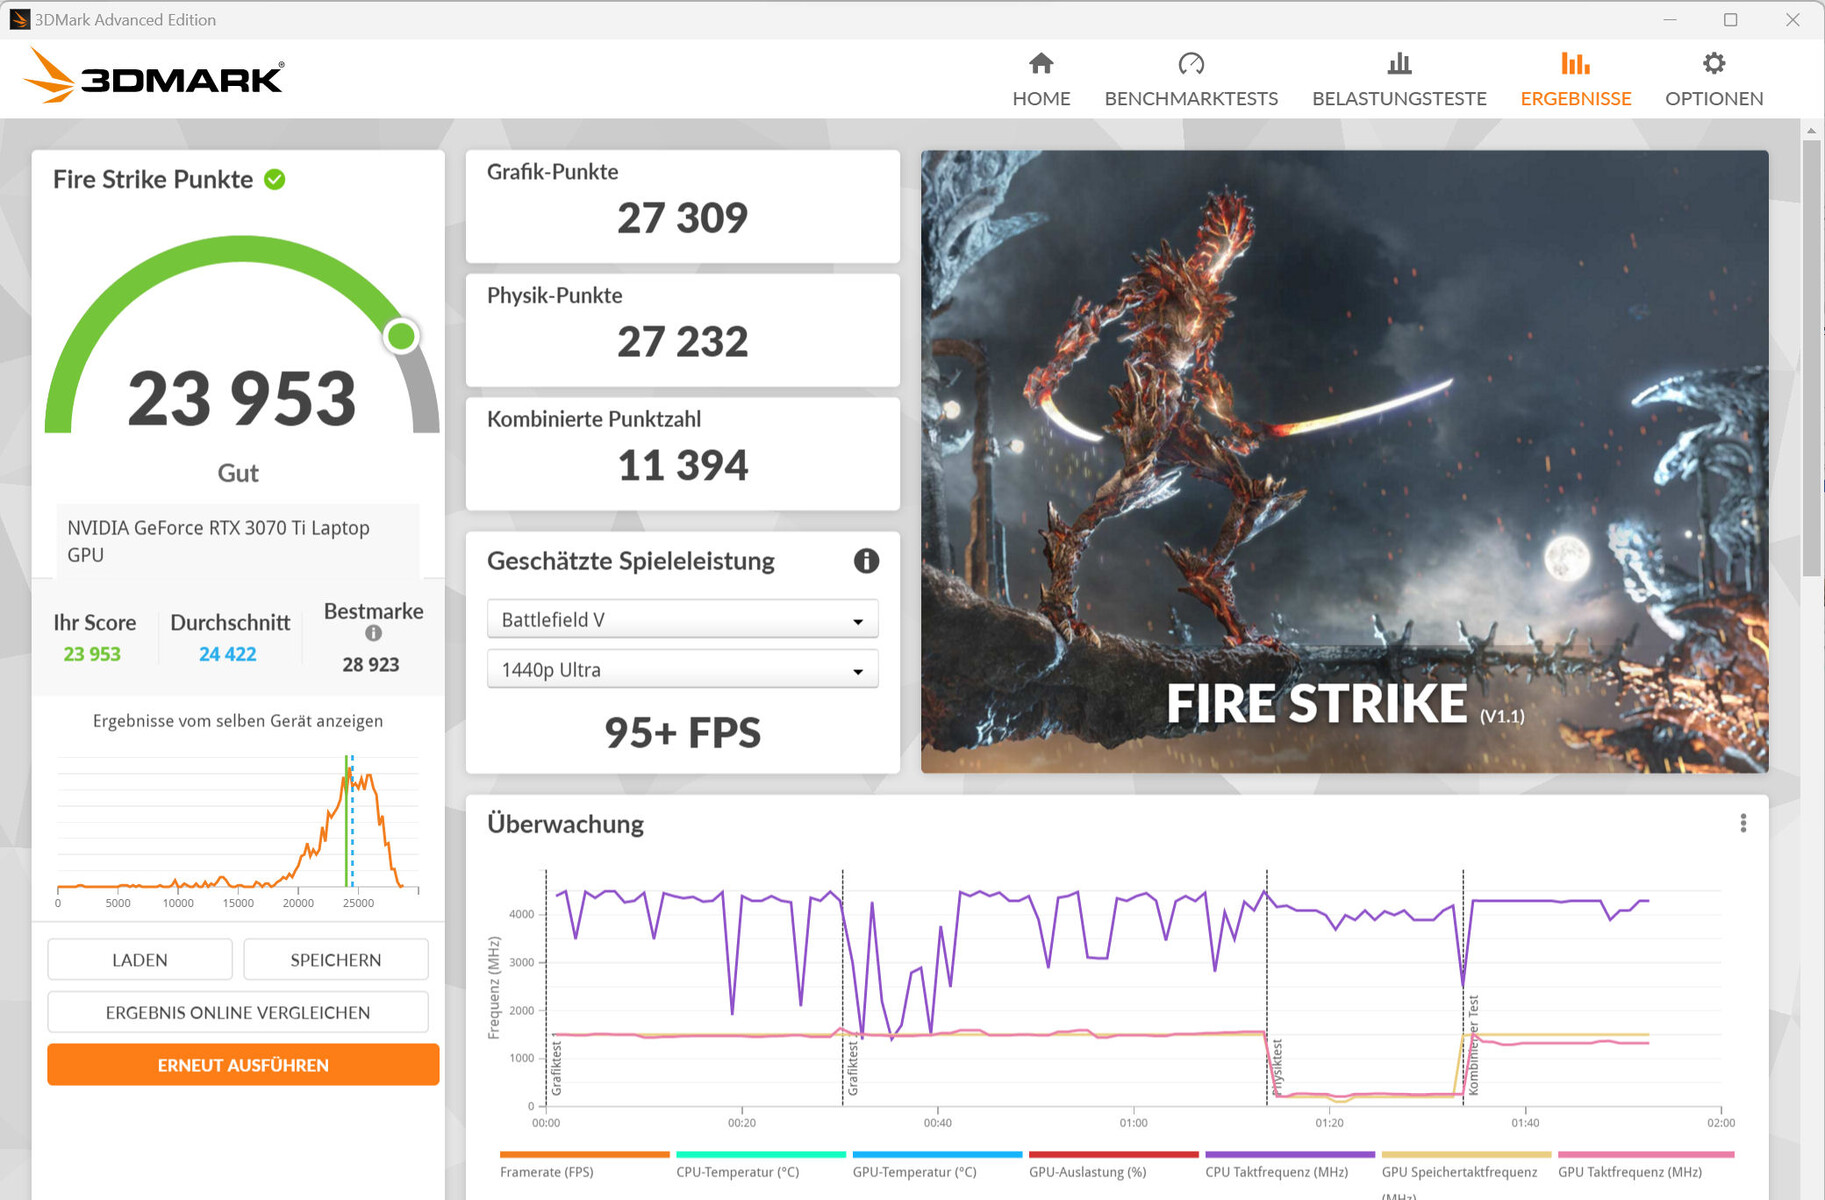
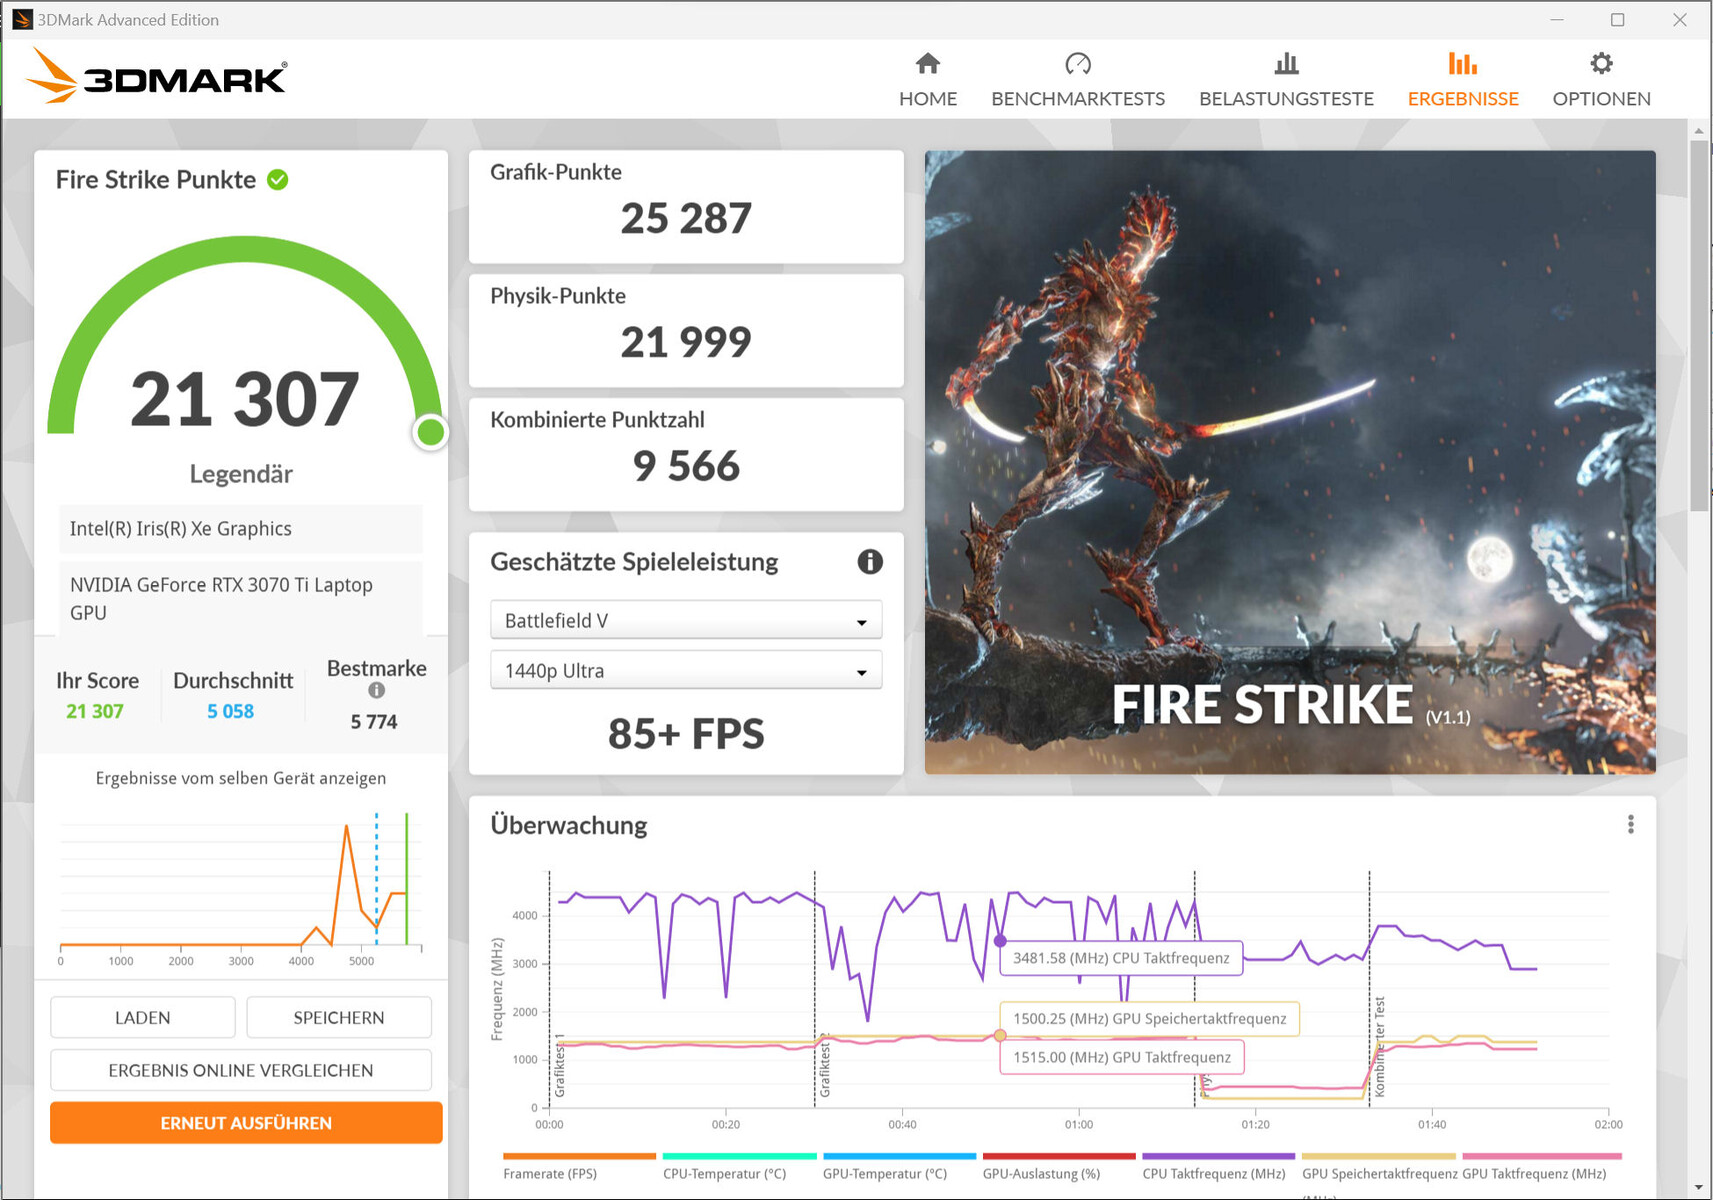
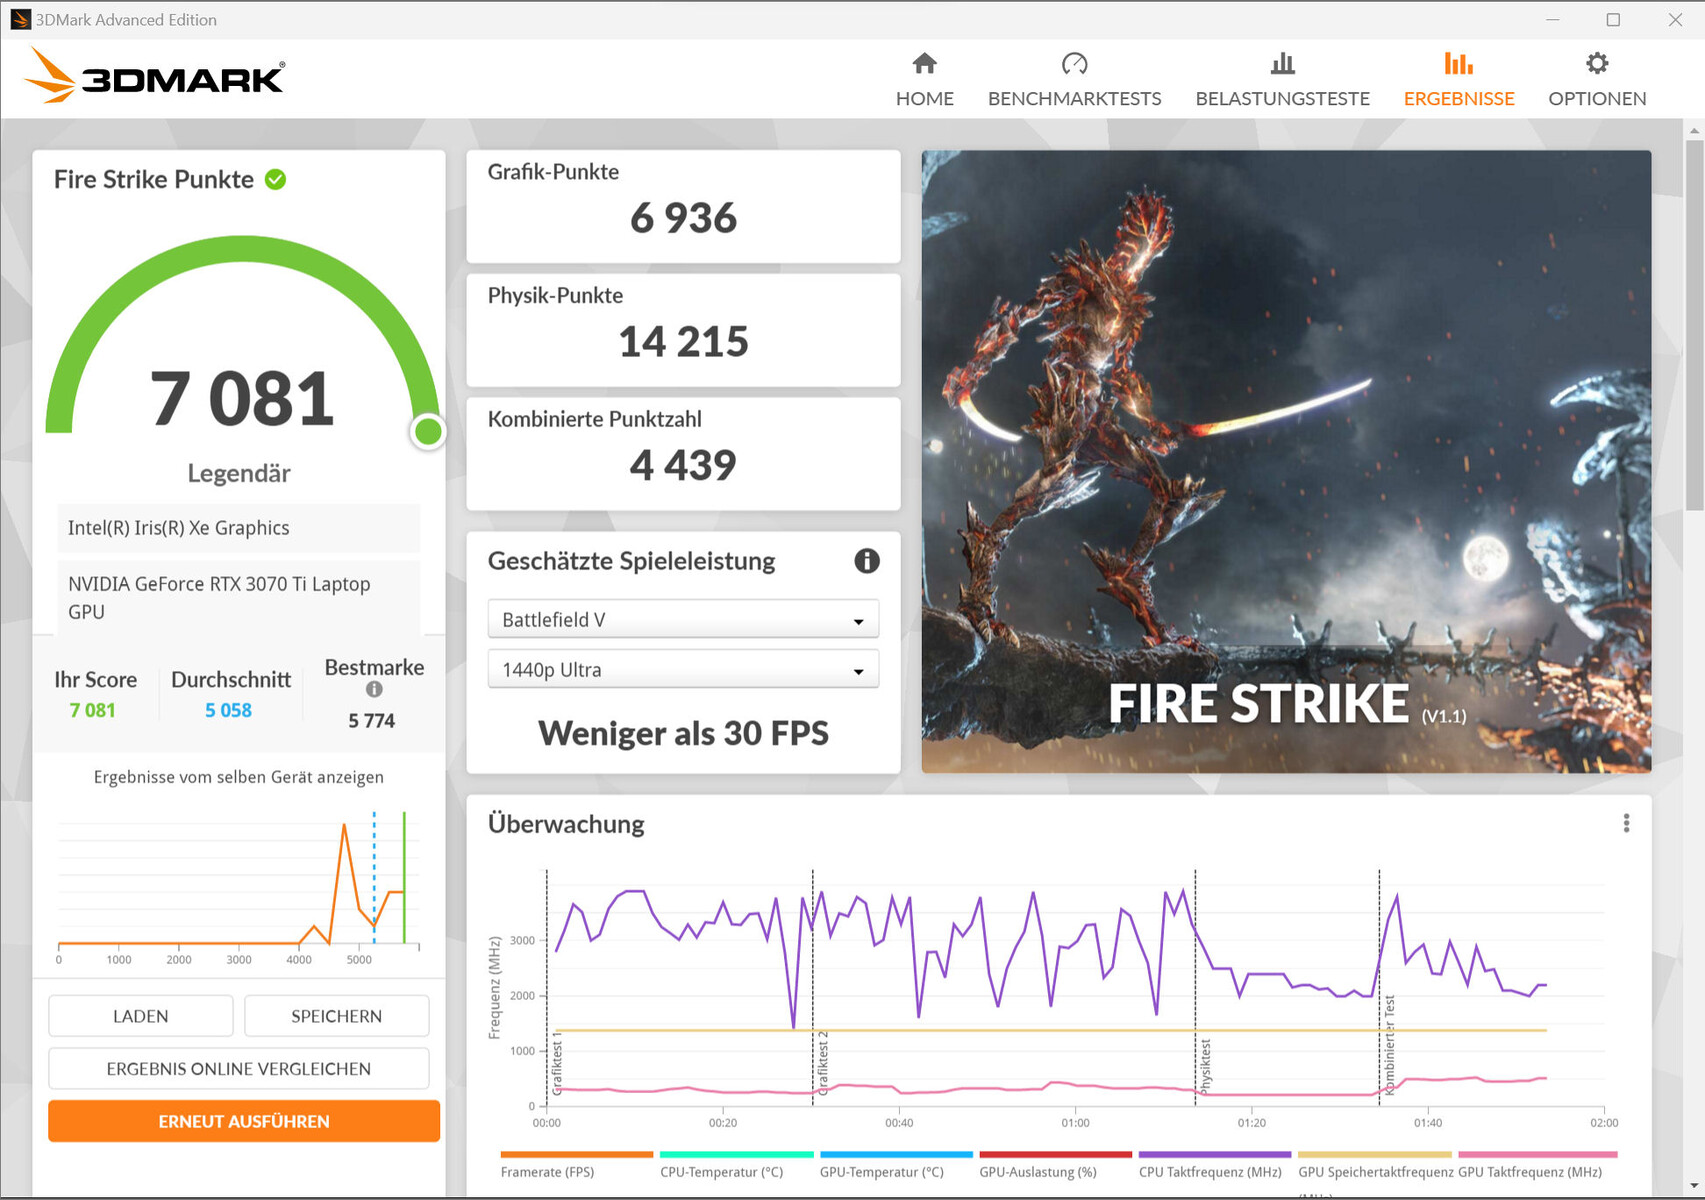
Placa gráfica
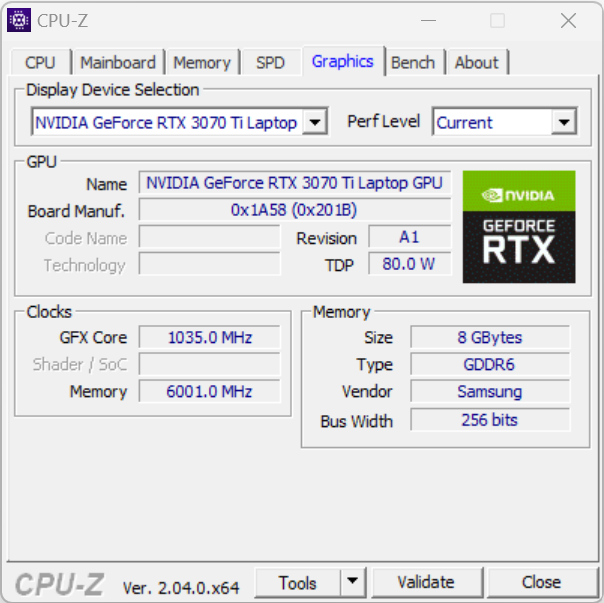
OGeForce RTX 3070 TigPU laptop (VRAM: 8192 MB GDDR6) fornece resultados 3D-Mark no nível médio da GPU determinado até agora e o TGP máximo relativamente baixo de 110 watts é perceptível. A saída direta da imagem através da GPU GeForce leva a um aumento insignificante na performance gráfica. A comutação entre o modo Optimus e dGPU é feita diretamente na BIOS ou através do software Razer Synapse. Otimus avançado não é suportado.


| 3DMark Performance rating - Percent | |
| Média da turma Gaming | |
| Razer Blade 15 2022 | |
| Razer Blade 15 OLED (Early 2022) | |
| Razer Blade 15 OLED (Early 2022) | |
| Média NVIDIA GeForce RTX 3070 Ti Laptop GPU | |
| HP Omen 16-b1090ng | |
| Aorus 15 XE5 -1! | |
| Asus ROG Zephyrus M16 GU603Z | |
| Schenker XMG Fusion 15 (Mid 22) | |
| 3DMark 11 - 1280x720 Performance GPU | |
| Média da turma Gaming (21841 - 80022, n=107, últimos 2 anos) | |
| Razer Blade 15 2022 | |
| Aorus 15 XE5 | |
| Razer Blade 15 OLED (Early 2022) | |
| Média NVIDIA GeForce RTX 3070 Ti Laptop GPU (13799 - 42569, n=36) | |
| Razer Blade 15 OLED (Early 2022) (dGPU) | |
| HP Omen 16-b1090ng | |
| Asus ROG Zephyrus M16 GU603Z | |
| Schenker XMG Fusion 15 (Mid 22) | |
| 3DMark 06 Standard Score | 48871 pontos | |
| 3DMark 11 Performance | 30645 pontos | |
| 3DMark Cloud Gate Standard Score | 59982 pontos | |
| 3DMark Fire Strike Score | 23793 pontos | |
| 3DMark Time Spy Score | 10342 pontos | |
Ajuda | ||
| Blender | |
| v3.3 Classroom OPTIX/RTX | |
| Asus ROG Zephyrus M16 GU603Z (3.3.3) | |
| Razer Blade 15 OLED (Early 2022) (3.3.3) | |
| Razer Blade 15 OLED (Early 2022) (3.3.3, dGPU) | |
| Média NVIDIA GeForce RTX 3070 Ti Laptop GPU (22 - 30, n=15) | |
| Aorus 15 XE5 (3.3.0) | |
| Média da turma Gaming (9 - 32, n=109, últimos 2 anos) | |
| v3.3 Classroom CUDA | |
| Asus ROG Zephyrus M16 GU603Z (3.3.3) | |
| Razer Blade 15 OLED (Early 2022) (3.3.3) | |
| Razer Blade 15 OLED (Early 2022) (3.3.3, dGPU) | |
| Média NVIDIA GeForce RTX 3070 Ti Laptop GPU (36 - 46, n=16) | |
| Aorus 15 XE5 (3.3.0) | |
| Média da turma Gaming (15 - 228, n=109, últimos 2 anos) | |
| v3.3 Classroom CPU | |
| Schenker XMG Fusion 15 (Mid 22) | |
| Aorus 15 XE5 (3.3.0) | |
| Razer Blade 15 OLED (Early 2022) (3.3.3, dGPU) | |
| Razer Blade 15 OLED (Early 2022) (3.3.3) | |
| Média NVIDIA GeForce RTX 3070 Ti Laptop GPU (285 - 459, n=16) | |
| Asus ROG Zephyrus M16 GU603Z (3.3.3) | |
| Média da turma Gaming (122 - 565, n=105, últimos 2 anos) | |
| GPUScore: Sacred Path | |
| 2560x1440 Official VRS | |
| Razer Blade 15 OLED (Early 2022) (0.9.0 Vulkan 1.3) | |
| Razer Blade 15 OLED (Early 2022) (0.9.0 DirectX 12) | |
| Razer Blade 15 OLED (Early 2022) (0.9.0 Vulkan 1.3, dGPU) | |
| Razer Blade 15 OLED (Early 2022) (0.9.0 DirectX 12. dGPU) | |
| Média da turma Gaming (13.8 - 330, n=141, últimos 2 anos) | |
| Média NVIDIA GeForce RTX 3070 Ti Laptop GPU (17.9 - 134.8, n=4) | |
| 2560x1440 Official | |
| Razer Blade 15 OLED (Early 2022) (0.9.0 Vulkan 1.3, dGPU) | |
| Razer Blade 15 OLED (Early 2022) (0.9.0 DirectX 12, dGPU) | |
| Razer Blade 15 OLED (Early 2022) (0.9.0 Vulkan 1.3) | |
| Razer Blade 15 OLED (Early 2022) (0.9.0 DirectX 12) | |
| Média da turma Gaming (11 - 331, n=235, últimos 2 anos) | |
| Asus ROG Zephyrus M16 GU603Z (1.0.0 Vulkan 1.3) | |
| Média NVIDIA GeForce RTX 3070 Ti Laptop GPU (17 - 130.6, n=6) | |
| Geekbench 5.5 | |
| OpenCL Score | |
| Média da turma Gaming (80702 - 277970, n=105, últimos 2 anos) | |
| Razer Blade 15 2022 | |
| Aorus 15 XE5 | |
| Média NVIDIA GeForce RTX 3070 Ti Laptop GPU (100630 - 150471, n=38) | |
| Razer Blade 15 OLED (Early 2022) | |
| Asus ROG Zephyrus M16 GU603Z | |
| Schenker XMG Fusion 15 (Mid 22) | |
| Razer Blade 15 OLED (Early 2022) (dGPU) | |
| HP Omen 16-b1090ng | |
| Vulkan Score 5.5 | |
| Média da turma Gaming (9296 - 246759, n=81, últimos 2 anos) | |
| Razer Blade 15 OLED (Early 2022) (dGPU) | |
| Média NVIDIA GeForce RTX 3070 Ti Laptop GPU (52594 - 92020, n=10) | |
| Razer Blade 15 2022 | |
| Asus ROG Zephyrus M16 GU603Z | |
| Geekbench 6.0 | |
| GPU Vulkan 6.0 | |
| Média da turma Gaming (90515 - 184611, n=3, últimos 2 anos) | |
| Razer Blade 15 OLED (Early 2022) (dGPU) | |
| Média NVIDIA GeForce RTX 3070 Ti Laptop GPU (19109 - 96149, n=2) | |
| Razer Blade 15 OLED (Early 2022) | |
| GPU OpenCL 6.0 | |
| Média da turma Gaming (111827 - 192027, n=3, últimos 2 anos) | |
| Razer Blade 15 OLED (Early 2022) | |
| Média NVIDIA GeForce RTX 3070 Ti Laptop GPU (103225 - 104147, n=2) | |
| Razer Blade 15 OLED (Early 2022) (dGPU) | |
| V-Ray 5 Benchmark | |
| GPU RTX | |
| Média da turma Gaming (1146 - 4363, n=35, últimos 2 anos) | |
| Aorus 15 XE5 (5.0.1) | |
| Média NVIDIA GeForce RTX 3070 Ti Laptop GPU (1334 - 1847, n=15) | |
| Razer Blade 15 OLED (Early 2022) (5.0.1) | |
| Razer Blade 15 OLED (Early 2022) (5.0.1, dGPU) | |
| Schenker XMG Fusion 15 (Mid 22) (5.0.1) | |
| GPU CUDA | |
| Média da turma Gaming (887 - 3288, n=35, últimos 2 anos) | |
| Aorus 15 XE5 (5.0.1) | |
| Média NVIDIA GeForce RTX 3070 Ti Laptop GPU (1062 - 1391, n=14) | |
| Razer Blade 15 OLED (Early 2022) (5.0.1) | |
| Razer Blade 15 OLED (Early 2022) (5.0.1, dGPU) | |
| Schenker XMG Fusion 15 (Mid 22) (5.0.1) | |
| CPU | |
| Média da turma Gaming (5864 - 30302, n=34, últimos 2 anos) | |
| Razer Blade 15 OLED (Early 2022) (5.0.1, dGPU) | |
| Razer Blade 15 OLED (Early 2022) (5.0.1) | |
| Razer Blade 15 2022 (5.0.1) | |
| Média NVIDIA GeForce RTX 3070 Ti Laptop GPU (2880 - 11931, n=20) | |
| Aorus 15 XE5 (5.0.1) | |
| Schenker XMG Fusion 15 (Mid 22) (5.0.1) | |
| V-Ray Benchmark Next 4.10 | |
| GPU | |
| Média da turma Gaming (427 - 1333, n=103, últimos 2 anos) | |
| Aorus 15 XE5 (v4.10.07 ) | |
| Média NVIDIA GeForce RTX 3070 Ti Laptop GPU (277 - 559, n=33) | |
| Schenker XMG Fusion 15 (Mid 22) (v4.10.07 ) | |
| Razer Blade 15 OLED (Early 2022) (v4.10.07 ) | |
| Razer Blade 15 OLED (Early 2022) (v4.10.07, dGPU) | |
| HP Omen 16-b1090ng (v4.10.07 ) | |
| Asus ROG Zephyrus M16 GU603Z (v4.10.07 ) | |
| CPU | |
| Média da turma Gaming (10048 - 45327, n=102, últimos 2 anos) | |
| HP Omen 16-b1090ng (v4.10.07 ) | |
| Razer Blade 15 OLED (Early 2022) (v4.10.07, dGPU) | |
| Asus ROG Zephyrus M16 GU603Z (v4.10.07 ) | |
| Razer Blade 15 OLED (Early 2022) (v4.10.07 ) | |
| Média NVIDIA GeForce RTX 3070 Ti Laptop GPU (4722 - 19786, n=33) | |
| Aorus 15 XE5 (v4.10.07 ) | |
| Schenker XMG Fusion 15 (Mid 22) (v4.10.07 ) | |
* ... menor é melhor
Desempenho nos jogos
O laptop é projetado para jogos de QHD em configurações altas a máximas. Resoluções mais altas seriam possíveis através da conexão a um monitor adequado - embora às vezes em configurações reduzidas. A taxa de quadros dos títulos testados está em um nível típico para a média RTX 3070 Ti determinada. A saída direta de imagem via GeForce GPU pode levar - dependendo do jogo - a um aumento mínimo na taxa de quadros.
| Performance rating - Percent | |
| Média da turma Gaming | |
| Razer Blade 15 2022 | |
| Aorus 15 XE5 | |
| Asus ROG Zephyrus M16 GU603Z | |
| HP Omen 16-b1090ng | |
| Razer Blade 15 OLED (Early 2022) | |
| Média NVIDIA GeForce RTX 3070 Ti Laptop GPU | |
| Razer Blade 15 OLED (Early 2022) | |
| Schenker XMG Fusion 15 (Mid 22) | |
| The Witcher 3 - 1920x1080 Ultra Graphics & Postprocessing (HBAO+) | |
| Média da turma Gaming (95 - 240, n=8, últimos 2 anos) | |
| Razer Blade 15 2022 | |
| Média NVIDIA GeForce RTX 3070 Ti Laptop GPU (76.8 - 124.1, n=39) | |
| Aorus 15 XE5 | |
| Asus ROG Zephyrus M16 GU603Z | |
| HP Omen 16-b1090ng | |
| Razer Blade 15 OLED (Early 2022) (dGPU) | |
| Razer Blade 15 OLED (Early 2022) | |
| Schenker XMG Fusion 15 (Mid 22) | |
| GTA V - 1920x1080 Highest AA:4xMSAA + FX AF:16x | |
| Média da turma Gaming (48.3 - 186.9, n=100, últimos 2 anos) | |
| Razer Blade 15 2022 | |
| Aorus 15 XE5 | |
| Razer Blade 15 OLED (Early 2022) (dGPU) | |
| Razer Blade 15 OLED (Early 2022) | |
| HP Omen 16-b1090ng | |
| Asus ROG Zephyrus M16 GU603Z | |
| Média NVIDIA GeForce RTX 3070 Ti Laptop GPU (44 - 123.9, n=36) | |
| Schenker XMG Fusion 15 (Mid 22) | |
| Final Fantasy XV Benchmark - 1920x1080 High Quality | |
| Média da turma Gaming (41 - 215, n=101, últimos 2 anos) | |
| Razer Blade 15 2022 (1.3) | |
| Aorus 15 XE5 (1.3) | |
| Razer Blade 15 OLED (Early 2022) (1.3, dGPU) | |
| Razer Blade 15 OLED (Early 2022) (1.3) | |
| HP Omen 16-b1090ng | |
| Média NVIDIA GeForce RTX 3070 Ti Laptop GPU (49.5 - 122.4, n=35) | |
| Asus ROG Zephyrus M16 GU603Z (1.3) | |
| Schenker XMG Fusion 15 (Mid 22) (1.3) | |
| Strange Brigade - 1920x1080 ultra AA:ultra AF:16 | |
| Média da turma Gaming (76.3 - 456, n=91, últimos 2 anos) | |
| Aorus 15 XE5 (1.47.22.14 D3D12) | |
| Razer Blade 15 2022 (1.47.22.14 D3D12) | |
| Média NVIDIA GeForce RTX 3070 Ti Laptop GPU (109 - 221, n=37) | |
| Razer Blade 15 OLED (Early 2022) (1.47.22.14 D3D12, dGPU) | |
| Razer Blade 15 OLED (Early 2022) (1.47.22.14 D3D12) | |
| Schenker XMG Fusion 15 (Mid 22) (1.47.22.14 D3D12) | |
| Asus ROG Zephyrus M16 GU603Z (1.47.22.14 D3D12) | |
| HP Omen 16-b1090ng (1.47.22.14 D3D12) | |
| Dota 2 Reborn - 1920x1080 ultra (3/3) best looking | |
| Asus ROG Zephyrus M16 GU603Z | |
| Razer Blade 15 2022 | |
| Média da turma Gaming (84.8 - 248, n=110, últimos 2 anos) | |
| HP Omen 16-b1090ng | |
| Aorus 15 XE5 | |
| Média NVIDIA GeForce RTX 3070 Ti Laptop GPU (68.7 - 160.5, n=38) | |
| Razer Blade 15 OLED (Early 2022) (dGPU) | |
| Razer Blade 15 OLED (Early 2022) | |
| Schenker XMG Fusion 15 (Mid 22) | |
| X-Plane 11.11 - 1920x1080 high (fps_test=3) | |
| Asus ROG Zephyrus M16 GU603Z | |
| HP Omen 16-b1090ng | |
| Razer Blade 15 2022 | |
| Aorus 15 XE5 | |
| Razer Blade 15 OLED (Early 2022) (dGPU) | |
| Média da turma Gaming (52.1 - 143.5, n=113, últimos 2 anos) | |
| Média NVIDIA GeForce RTX 3070 Ti Laptop GPU (51.6 - 116.9, n=37) | |
| Razer Blade 15 OLED (Early 2022) | |
| Schenker XMG Fusion 15 (Mid 22) | |
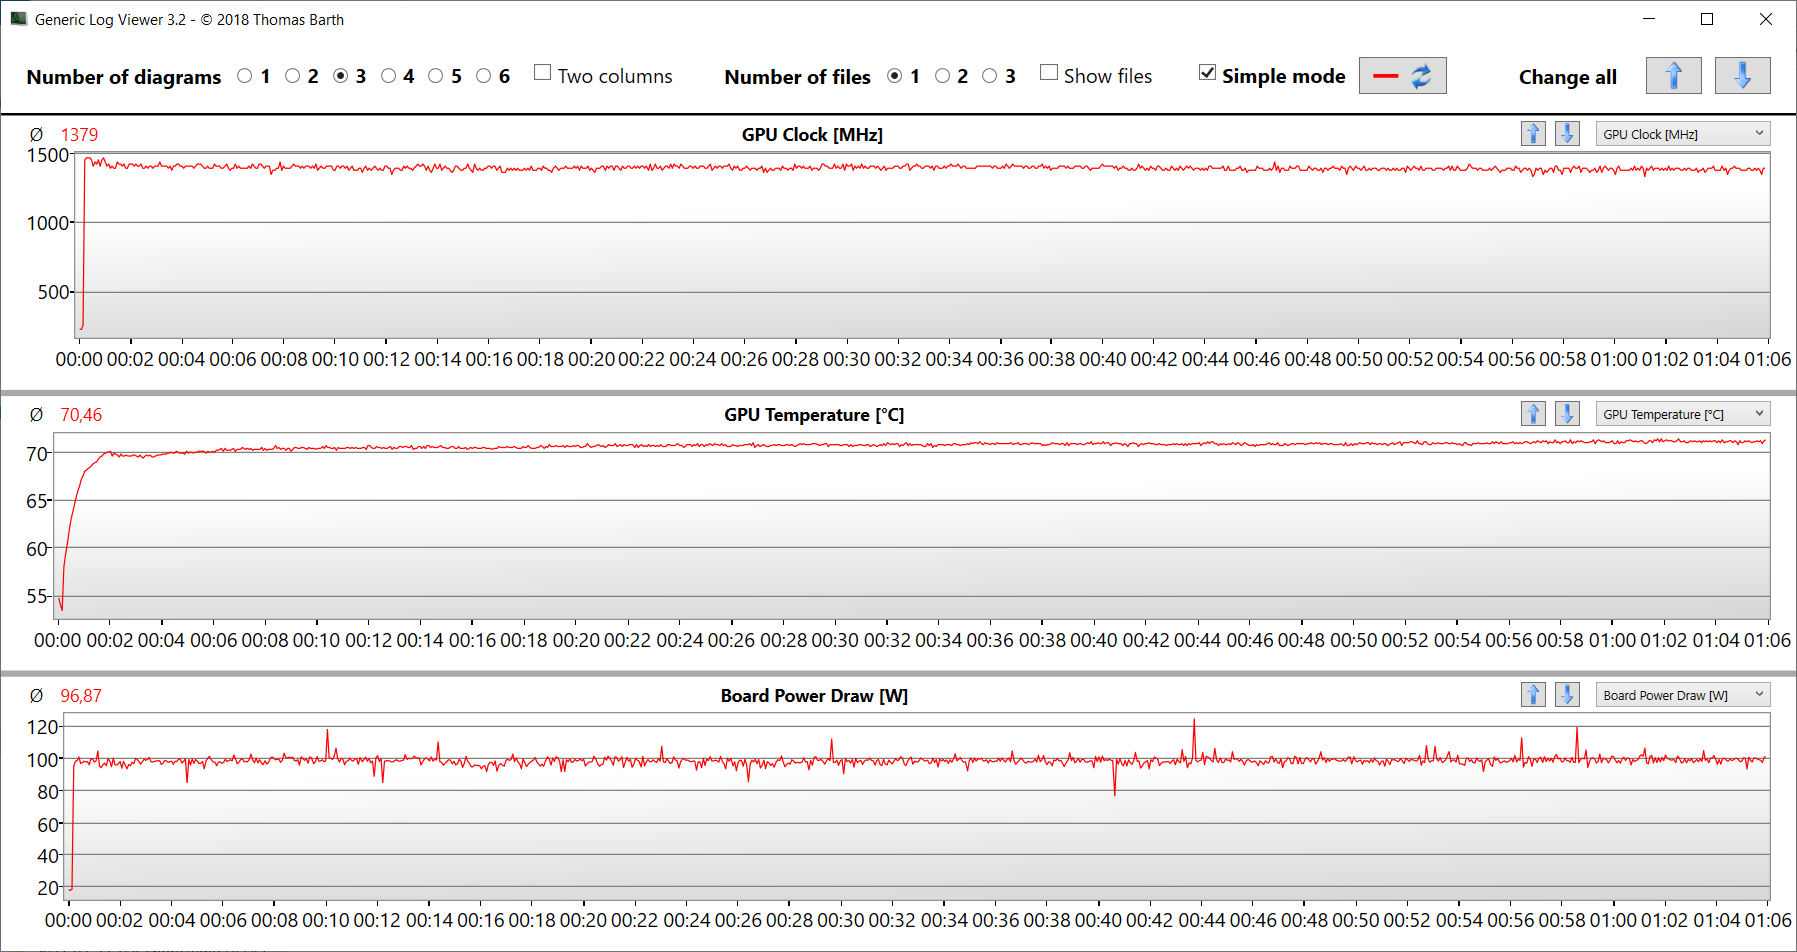
A fim de verificar se as taxas de quadros continuam estáveis por períodos de tempo mais longos, executamos o jogo "The Witcher 3" por cerca de 60 minutos em resolução Full HD e ajustes de qualidade máxima. O personagem do jogo não foi movido e não houve queda perceptível nas taxas de quadros.
Witcher 3 FPS Diagram
| baixo | média | alto | ultra | QHD | |
|---|---|---|---|---|---|
| GTA V (2015) | 182.7 | 177.2 | 172.8 | 113 | 94.3 |
| The Witcher 3 (2015) | 365.8 | 288.5 | 176.6 | 96.4 | |
| Dota 2 Reborn (2015) | 162 | 148.2 | 143.4 | 133 | |
| Final Fantasy XV Benchmark (2018) | 174.2 | 133.3 | 100.3 | 75.1 | |
| X-Plane 11.11 (2018) | 133.3 | 121.6 | 95 | ||
| Far Cry 5 (2018) | 170 | 141 | 135 | 126 | 100 |
| Strange Brigade (2018) | 351 | 240 | 197.2 | 173.4 | 130.9 |
| Flight Simulator 2020 (2020) | 124.8 | 97.8 | 70.2 | 52.2 | 41.3 |
| F1 22 (2022) | 203 | 202 | 173.1 | 65.2 | 42.3 |
| FIFA 23 (2022) | 104.3 | ||||
| A Plague Tale Requiem (2022) | 101.6 | 84 | 73.3 | 62.9 | 50.5 |
| Uncharted Legacy of Thieves Collection (2022) | 78 | 75.2 | 71.8 | 69.3 | 56.2 |
| Call of Duty Modern Warfare 2 2022 (2022) | 126 | 112 | 89 | 85 | 63 |
| Spider-Man Miles Morales (2022) | 107 | 102.6 | 94.9 | 93.2 | 69.6 |
| The Callisto Protocol (2022) | 117 | 99.3 | 71 | 70.7 | 52.8 |
| Need for Speed Unbound (2022) | 112.8 | 106.9 | 93 | 84.6 | 66.7 |
| High On Life (2023) | 175.7 | 139.4 | 117.5 | 97.1 | 60.8 |
| The Witcher 3 v4 (2023) | 174.4 | 149.6 | 81.3 | 71.4 | 47.4 |
| Dead Space Remake (2023) | 82.1 | 74.6 | 68.1 | 66.8 | 47.2 |
| Hogwarts Legacy (2023) | 88.5 | 79 | 69.7 | 59.3 | 42.6 |
Emissões - O laptop Razer não aquece excessivamente
Emissões sonoras
No total, para um laptop para jogos, os níveis de ruído são moderados. No uso ocioso e cotidiano (escritório e internet), os ventiladores funcionam em baixa velocidade e são praticamente inaudíveis. Sob carga total (teste de estresse, Witcher 3 teste) os níveis de pressão sonora podem subir até 43,9 dB (A). O perfil de desempenho "Silencioso" não faz o que o nome sugere, mas consegue diminuir o ruído de fundo - em detrimento da potência computacional.
Barulho
| Ocioso |
| 28 / 28 / 28 dB |
| Carga |
| 38.5 / 43.9 dB |
 | ||
30 dB silencioso 40 dB(A) audível 50 dB(A) ruidosamente alto |
||
min: | ||
| Razer Blade 15 OLED (Early 2022) GeForce RTX 3070 Ti Laptop GPU, i9-12900H, Samsung PM9A1 MZVL21T0HCLR | Asus ROG Zephyrus M16 GU603Z GeForce RTX 3070 Ti Laptop GPU, i9-12900H, Micron 3400 1TB MTFDKBA1T0TFH | Aorus 15 XE5 GeForce RTX 3070 Ti Laptop GPU, i7-12700H, Gigabyte AG470S1TB-SI B10 | Schenker XMG Fusion 15 (Mid 22) GeForce RTX 3070 Laptop GPU, i7-11800H, Samsung SSD 980 Pro 1TB MZ-V8P1T0BW | HP Omen 16-b1090ng GeForce RTX 3070 Ti Laptop GPU, i7-12700H, WDC PC SN810 1TB | Razer Blade 15 2022 GeForce RTX 3080 Ti Laptop GPU, i7-12800H, SSSTC CA6-8D1024 | |
|---|---|---|---|---|---|---|
| Noise | -10% | -6% | -5% | -16% | -4% | |
| desligado / ambiente * (dB) | 26 | 23 12% | 24 8% | 26 -0% | 26 -0% | 25.4 2% |
| Idle Minimum * (dB) | 28 | 23 18% | 26 7% | 26 7% | 30 -7% | 26.2 6% |
| Idle Average * (dB) | 28 | 24 14% | 28 -0% | 28 -0% | 31 -11% | 26.2 6% |
| Idle Maximum * (dB) | 28 | 47 -68% | 30 -7% | 31 -11% | 33 -18% | 28.4 -1% |
| Load Average * (dB) | 38.5 | 47.91 -24% | 48 -25% | 45 -17% | 49 -27% | 44.7 -16% |
| Load Maximum * (dB) | 43.9 | 50.25 -14% | 52 -18% | 48 -9% | 57 -30% | 51.9 -18% |
| Witcher 3 ultra * (dB) | 48.91 | 52 | 46 | 53 | 44.7 |
* ... menor é melhor
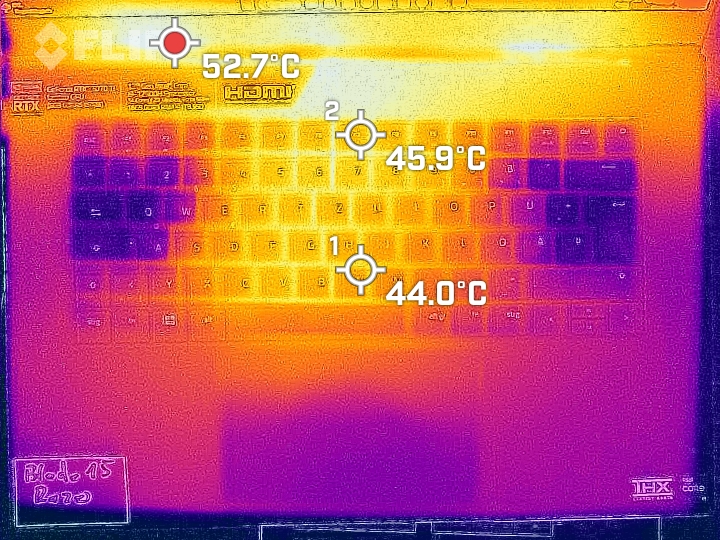
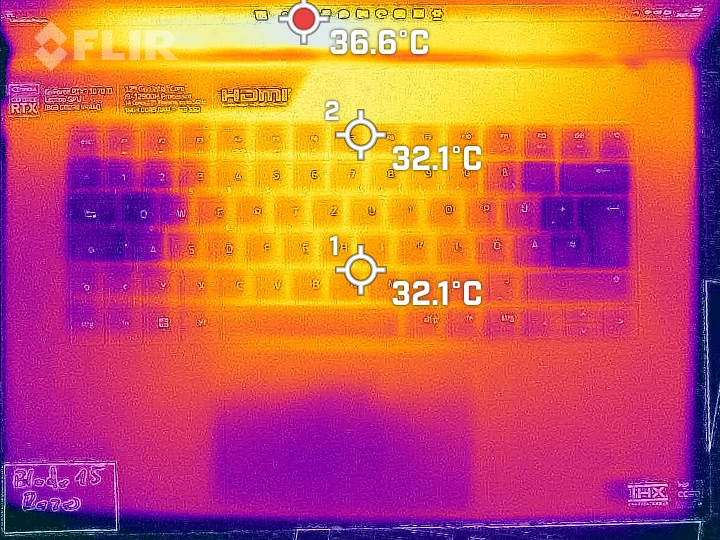
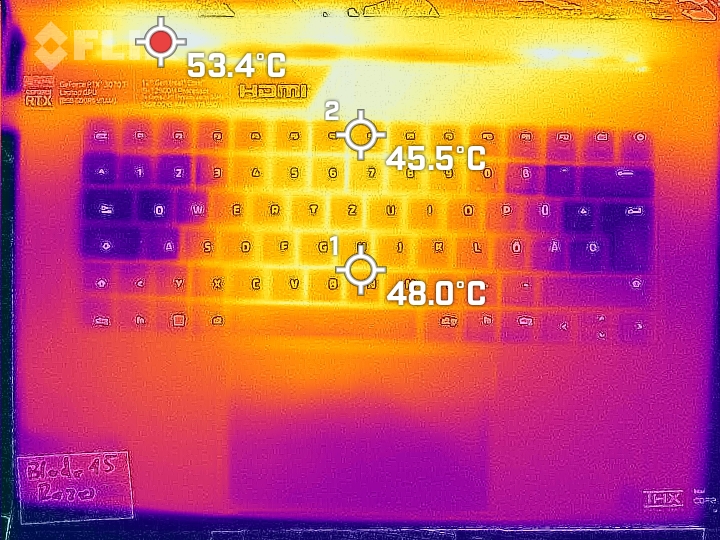
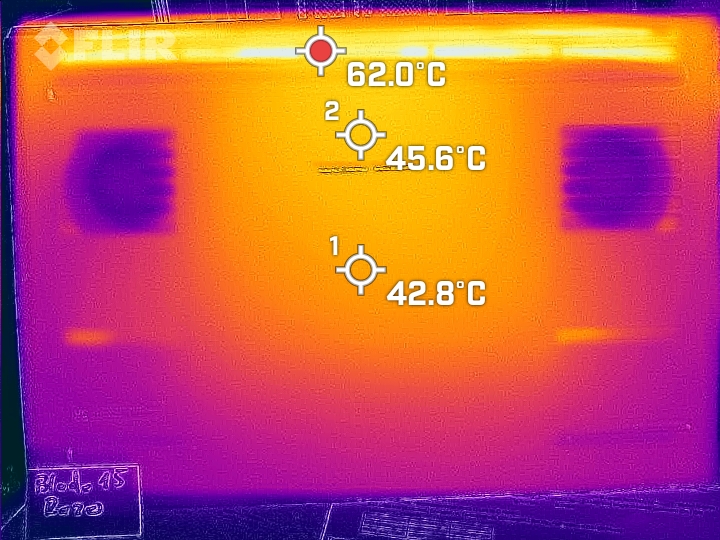
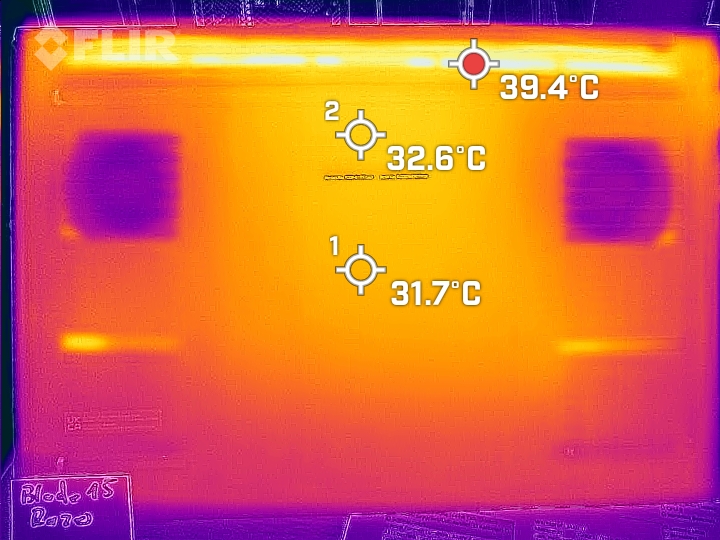
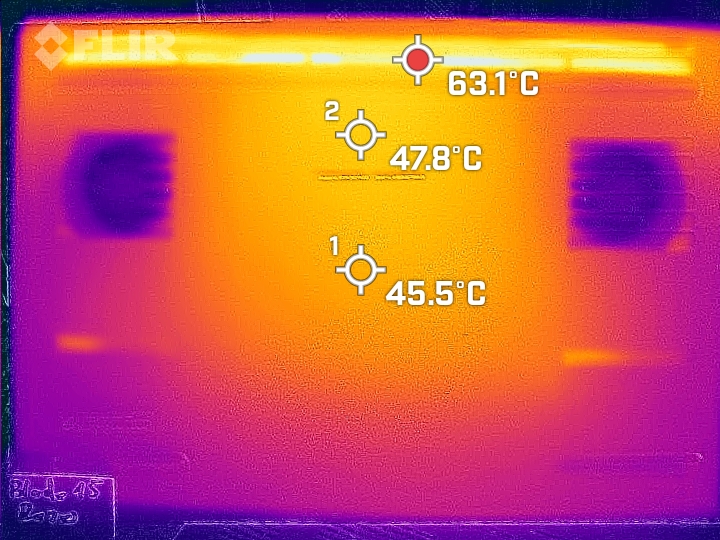
Temperatura
No uso diário (escritório, internet), as temperaturas do estojo permanecem muito na zona verde. Sob carga (teste de estresse, Witcher 3 teste) o laptop aquece visivelmente, mas não excessivamente.
(-) A temperatura máxima no lado superior é 49.5 °C / 121 F, em comparação com a média de 40.4 °C / 105 F , variando de 21.2 a 68.8 °C para a classe Gaming.
(-) A parte inferior aquece até um máximo de 47.5 °C / 118 F, em comparação com a média de 43.2 °C / 110 F
(+) Em uso inativo, a temperatura média para o lado superior é 30 °C / 86 F, em comparação com a média do dispositivo de 33.9 °C / ### class_avg_f### F.
(-) Jogando The Witcher 3, a temperatura média para o lado superior é 40.3 °C / 105 F, em comparação com a média do dispositivo de 33.9 °C / ## #class_avg_f### F.
(±) Os apoios para as mãos e o touchpad podem ficar muito quentes ao toque, com um máximo de 38 °C / 100.4 F.
(-) A temperatura média da área do apoio para as mãos de dispositivos semelhantes foi 28.8 °C / 83.8 F (-9.2 °C / -16.6 F).
| Razer Blade 15 OLED (Early 2022) Intel Core i9-12900H, NVIDIA GeForce RTX 3070 Ti Laptop GPU | Asus ROG Zephyrus M16 GU603Z Intel Core i9-12900H, NVIDIA GeForce RTX 3070 Ti Laptop GPU | Aorus 15 XE5 Intel Core i7-12700H, NVIDIA GeForce RTX 3070 Ti Laptop GPU | Schenker XMG Fusion 15 (Mid 22) Intel Core i7-11800H, NVIDIA GeForce RTX 3070 Laptop GPU | HP Omen 16-b1090ng Intel Core i7-12700H, NVIDIA GeForce RTX 3070 Ti Laptop GPU | Razer Blade 15 2022 Intel Core i7-12800H, NVIDIA GeForce RTX 3080 Ti Laptop GPU | |
|---|---|---|---|---|---|---|
| Heat | 2% | -12% | -15% | 9% | -6% | |
| Maximum Upper Side * (°C) | 49.5 | 52 -5% | 46 7% | 52 -5% | 41 17% | 50 -1% |
| Maximum Bottom * (°C) | 47.5 | 51 -7% | 57 -20% | 63 -33% | 62 -31% | 47 1% |
| Idle Upper Side * (°C) | 33.4 | 29 13% | 38 -14% | 37 -11% | 25 25% | 37.4 -12% |
| Idle Bottom * (°C) | 35 | 33 6% | 42 -20% | 38 -9% | 26 26% | 38.4 -10% |
* ... menor é melhor
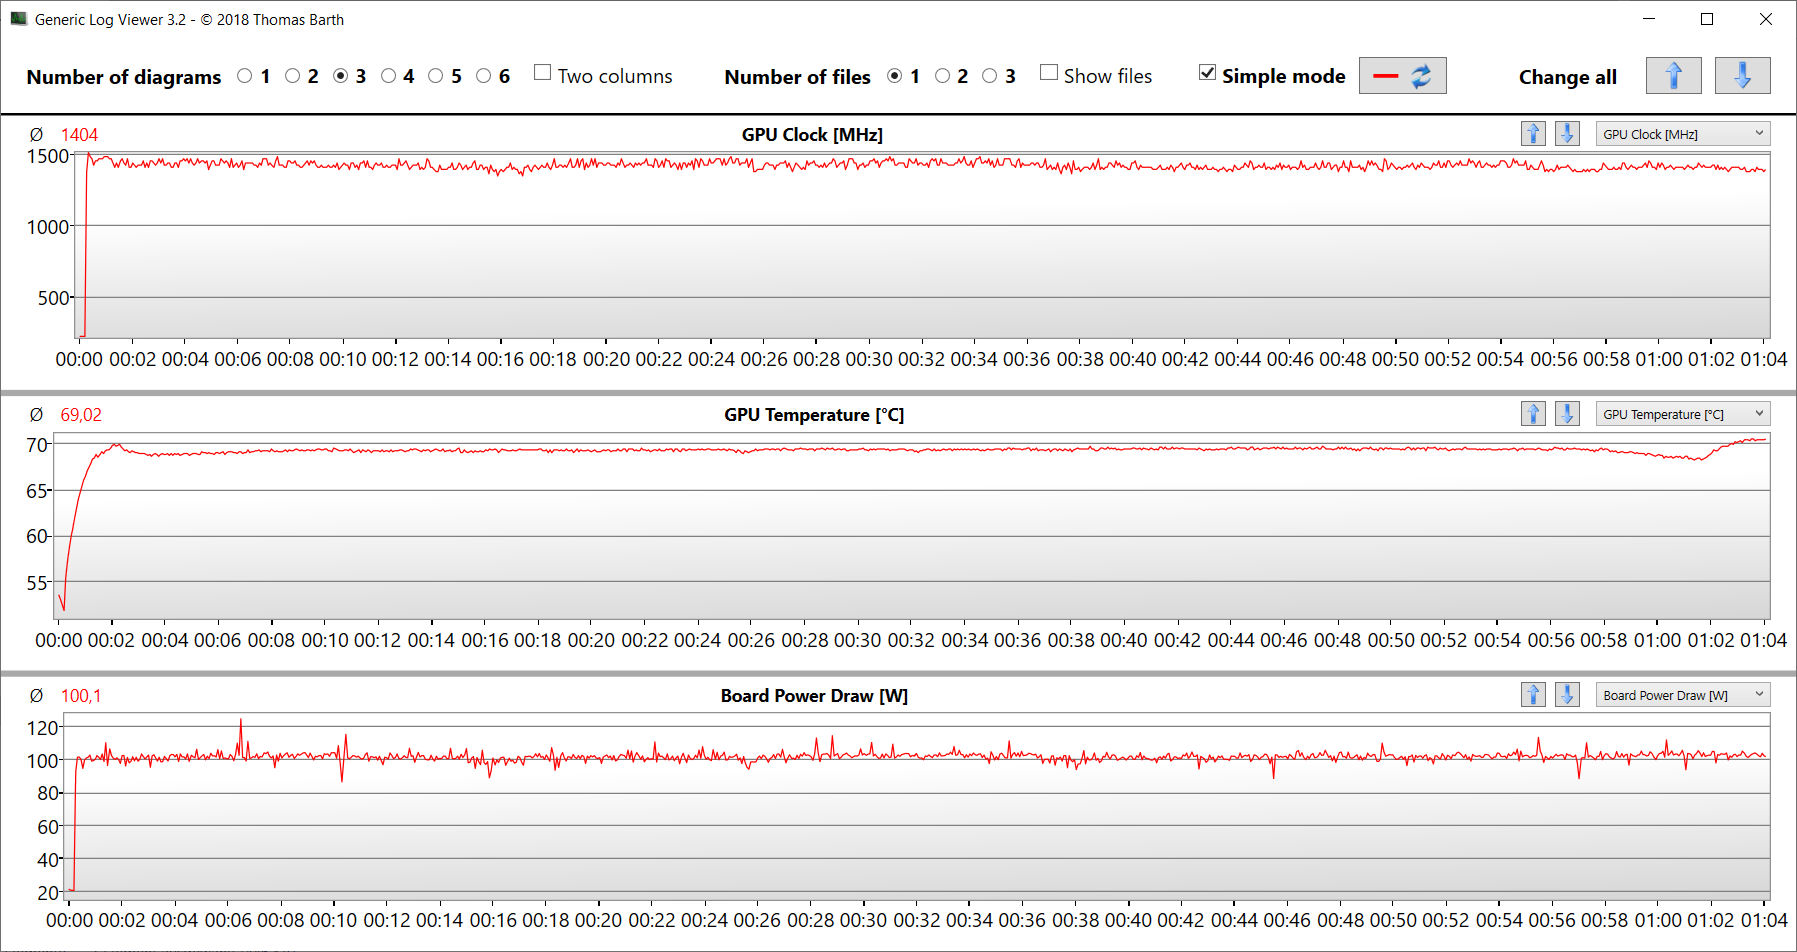
Teste de estresse
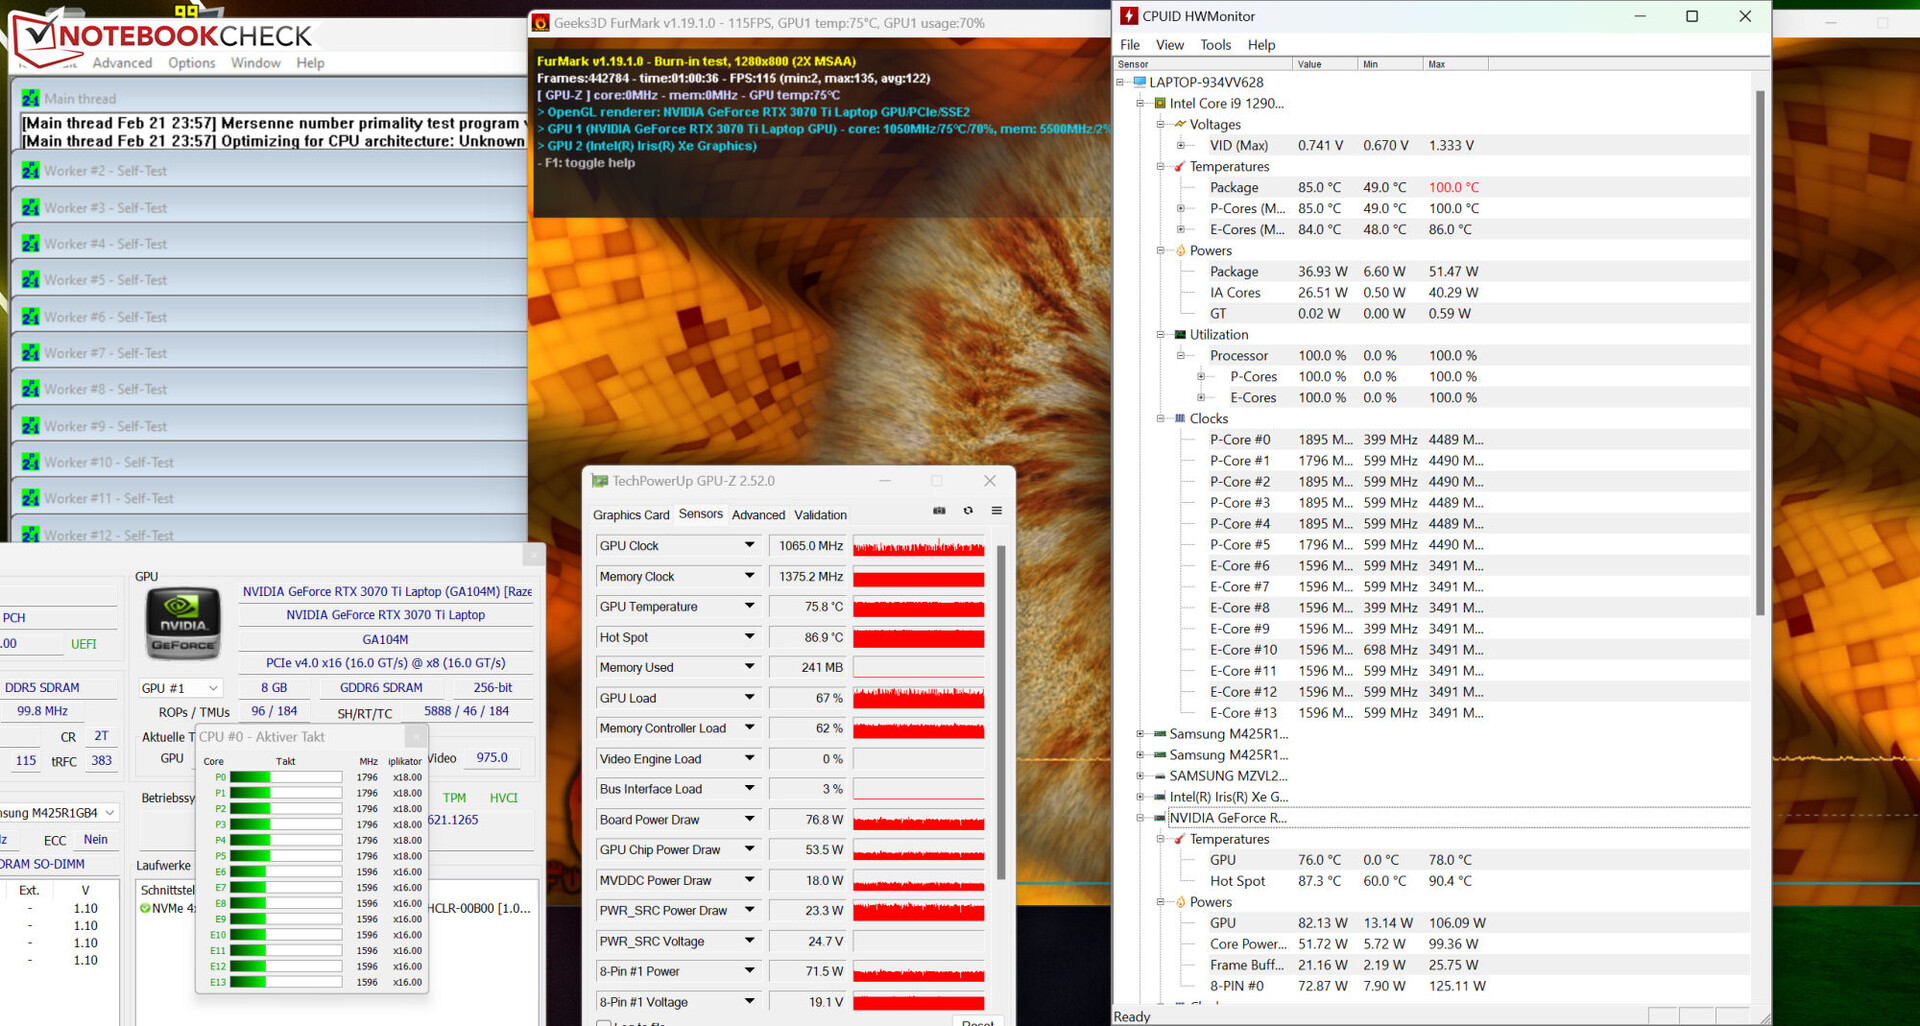
O teste de esforço (Prime95 e Furmark em operação contínua) apresenta o cenário extremo de análise da estabilidade do sistema sob carga total. No decorrer do teste, a velocidade da CPU caiu de um ponto inicial de 2,5 GHz (P-cores) e 2,1 GHz (E-cores), respectivamente, para cerca de 1,7 GHz (P-cores) e 1,5 GHz (E-cores), respectivamente. A velocidade do relógio da GPU flutua entre 700 e 1.300 MHz.
Oradores
Os alto-falantes estéreo produzem um som decente, mas que carece de graves.
Razer Blade 15 OLED (Early 2022) análise de áudio
(+) | os alto-falantes podem tocar relativamente alto (###valor### dB)
Graves 100 - 315Hz
(-) | quase nenhum baixo - em média 24.8% menor que a mediana
(±) | a linearidade dos graves é média (12.7% delta para a frequência anterior)
Médios 400 - 2.000 Hz
(+) | médios equilibrados - apenas 3% longe da mediana
(+) | médios são lineares (4.3% delta para frequência anterior)
Altos 2 - 16 kHz
(+) | agudos equilibrados - apenas 2.2% longe da mediana
(+) | os máximos são lineares (4.1% delta da frequência anterior)
Geral 100 - 16.000 Hz
(+) | o som geral é linear (14.1% diferença em relação à mediana)
Comparado com a mesma classe
» 24% de todos os dispositivos testados nesta classe foram melhores, 8% semelhantes, 68% piores
» O melhor teve um delta de 6%, a média foi 18%, o pior foi 132%
Comparado com todos os dispositivos testados
» 17% de todos os dispositivos testados foram melhores, 4% semelhantes, 80% piores
» O melhor teve um delta de 4%, a média foi 24%, o pior foi 134%
Asus ROG Zephyrus M16 GU603Z análise de áudio
(+) | os alto-falantes podem tocar relativamente alto (###valor### dB)
Graves 100 - 315Hz
(±) | graves reduzidos - em média 11.6% menor que a mediana
(±) | a linearidade dos graves é média (9.2% delta para a frequência anterior)
Médios 400 - 2.000 Hz
(+) | médios equilibrados - apenas 4.3% longe da mediana
(+) | médios são lineares (5.7% delta para frequência anterior)
Altos 2 - 16 kHz
(+) | agudos equilibrados - apenas 1.6% longe da mediana
(+) | os máximos são lineares (3.9% delta da frequência anterior)
Geral 100 - 16.000 Hz
(+) | o som geral é linear (10.1% diferença em relação à mediana)
Comparado com a mesma classe
» 5% de todos os dispositivos testados nesta classe foram melhores, 2% semelhantes, 93% piores
» O melhor teve um delta de 6%, a média foi 18%, o pior foi 132%
Comparado com todos os dispositivos testados
» 5% de todos os dispositivos testados foram melhores, 1% semelhantes, 94% piores
» O melhor teve um delta de 4%, a média foi 24%, o pior foi 134%
Gerenciamento de energia - A Lâmina está muito faminta no uso ocioso
Consumo de energia
No uso ocioso, os requisitos de energia (até 39 watts) são comparativamente altos. Este parece ser um problema geral encontrado nos modelos de lâminas de 2022 que que encontramos em muitas ocasiões. Sob carga, o consumo é normal para este tipo de hardware. Enquanto o teste Witcher 3 funcionava com consumo de energia constante, as exigências caíram abruptamente durante o teste de estresse - a CPU foi asfixiada. A unidade de fornecimento de energia (230 watts) tem o tamanho adequado.
| desligado | |
| Ocioso | |
| Carga |
|
Key:
min: | |
| Razer Blade 15 OLED (Early 2022) i9-12900H, GeForce RTX 3070 Ti Laptop GPU, Samsung PM9A1 MZVL21T0HCLR, OLED, 2560x1440, 15.6" | Asus ROG Zephyrus M16 GU603Z i9-12900H, GeForce RTX 3070 Ti Laptop GPU, Micron 3400 1TB MTFDKBA1T0TFH, IPS, 2560x1600, 16" | Aorus 15 XE5 i7-12700H, GeForce RTX 3070 Ti Laptop GPU, Gigabyte AG470S1TB-SI B10, IPS, 2560x1440, 15.6" | Schenker XMG Fusion 15 (Mid 22) i7-11800H, GeForce RTX 3070 Laptop GPU, Samsung SSD 980 Pro 1TB MZ-V8P1T0BW, IPS, 2560x1440, 15.6" | HP Omen 16-b1090ng i7-12700H, GeForce RTX 3070 Ti Laptop GPU, WDC PC SN810 1TB, IPS, 2560x1440, 16.1" | Razer Blade 15 2022 i7-12800H, GeForce RTX 3080 Ti Laptop GPU, SSSTC CA6-8D1024, IPS, 2560x1440, 15.6" | Média NVIDIA GeForce RTX 3070 Ti Laptop GPU | Média da turma Gaming | |
|---|---|---|---|---|---|---|---|---|
| Power Consumption | 26% | -18% | 24% | 29% | -8% | 18% | 21% | |
| Idle Minimum * (Watt) | 31.6 | 10.8 66% | 31 2% | 12 62% | 4 87% | 33.2 -5% | 14.2 ? 55% | 13.2 ? 58% |
| Idle Average * (Watt) | 33.3 | 17 49% | 35 -5% | 17 49% | 10 70% | 36.4 -9% | 19.9 ? 40% | 18.9 ? 43% |
| Idle Maximum * (Watt) | 38.6 | 17.8 54% | 46 -19% | 24 38% | 19 51% | 37.6 3% | 26.2 ? 32% | 24.3 ? 37% |
| Load Average * (Watt) | 149 | 116 22% | 120 19% | 106 29% | 114 23% | 116.7 22% | 125.8 ? 16% | 108.3 ? 27% |
| Witcher 3 ultra * (Watt) | 149.6 | 144 4% | 202 -35% | 159.9 -7% | 183.2 -22% | 172 -15% | ||
| Load Maximum * (Watt) | 160 | 220 -38% | 268 -68% | 208 -30% | 221 -38% | 228.6 -43% | 248 ? -55% | 254 ? -59% |
* ... menor é melhor
Power consumption Witcher 3 / Stress test
Power consumption with an external monitor
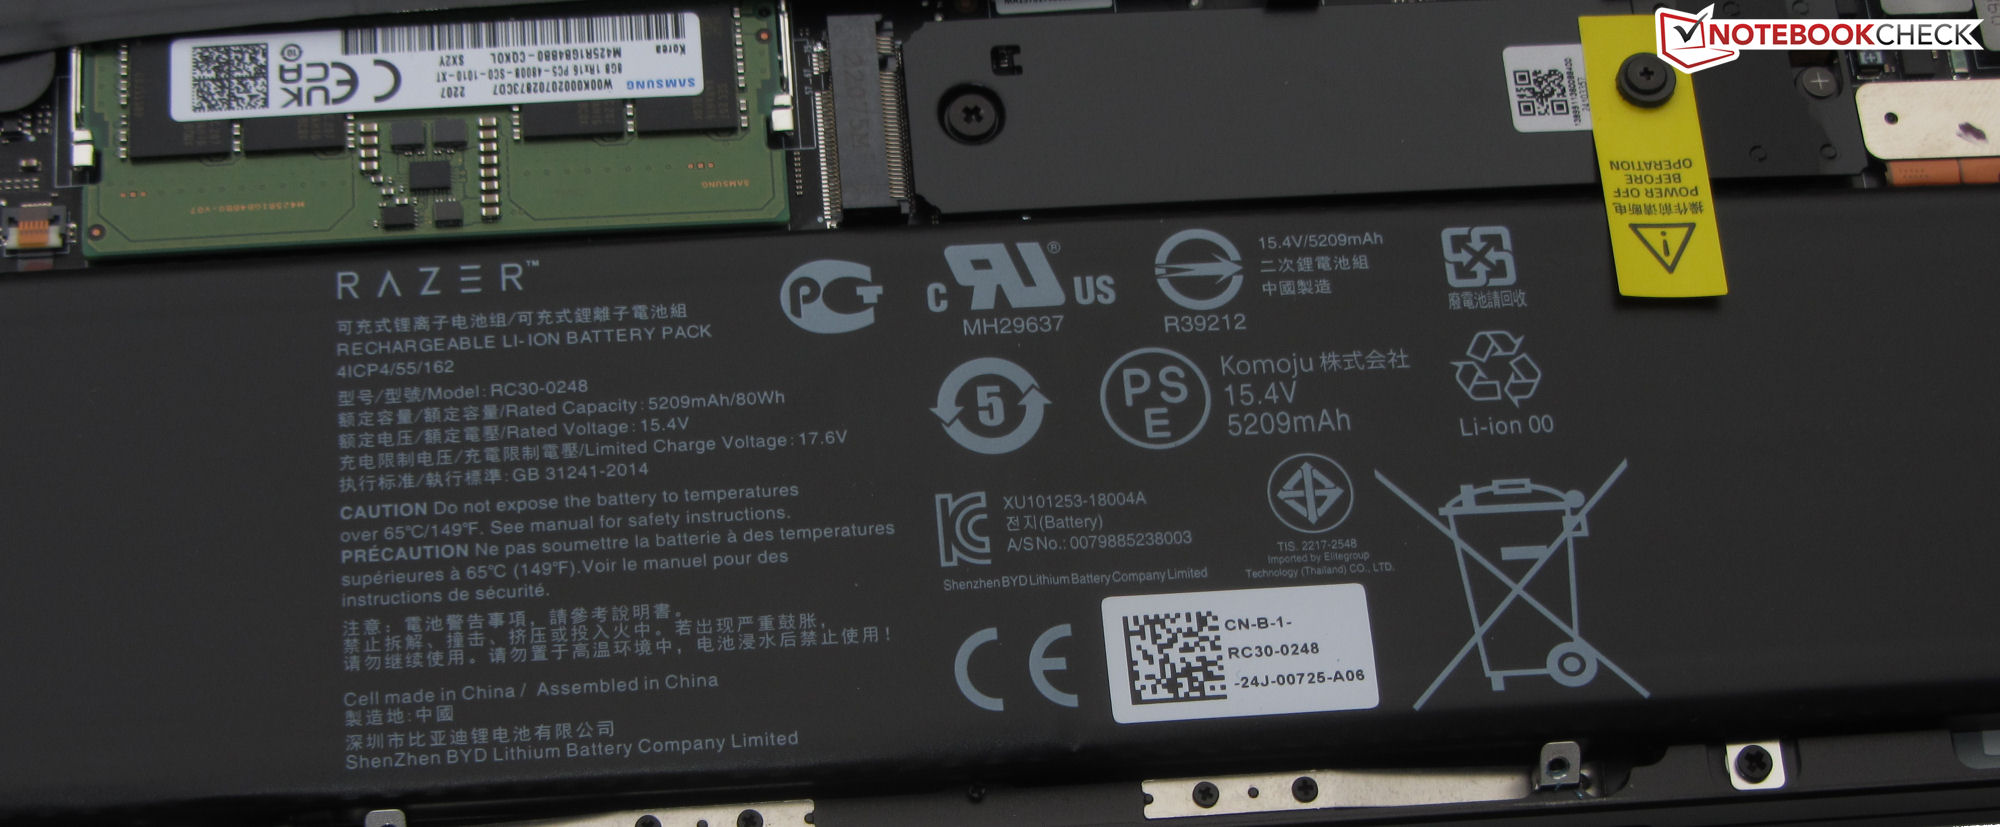
Duração da bateria
No teste WiFi (abertura de websites usando um roteiro) e no teste de vídeo (curta-metragem Big Buck Bunny (codificação H.264, FHD) em loop), o dispositivo de 15 polegadas atingiu tempos de funcionamento da bateria de 4,34 horas e 5,52 horas, respectivamente. As funções de economia de energia do laptop foram desativadas durante ambos os testes e o brilho do visor foi ajustado para 150 cd/m². O teste de vídeo também foi realizado com o módulo de rádio desligado.
Em suma, a Lâmina não foi capaz de proporcionar uma impressionante vida útil da bateria - mesmo para um poderoso portátil QHD. Em todo o quadro, a concorrência oferece melhor resistência - tanto em termos absolutos como também em termos de watt-hora calculada.
| Razer Blade 15 OLED (Early 2022) i9-12900H, GeForce RTX 3070 Ti Laptop GPU, 80 Wh | Asus ROG Zephyrus M16 GU603Z i9-12900H, GeForce RTX 3070 Ti Laptop GPU, 90 Wh | Aorus 15 XE5 i7-12700H, GeForce RTX 3070 Ti Laptop GPU, 99 Wh | Schenker XMG Fusion 15 (Mid 22) i7-11800H, GeForce RTX 3070 Laptop GPU, 93.48 Wh | HP Omen 16-b1090ng i7-12700H, GeForce RTX 3070 Ti Laptop GPU, 83 Wh | Razer Blade 15 2022 i7-12800H, GeForce RTX 3080 Ti Laptop GPU, 80 Wh | Média da turma Gaming | |
|---|---|---|---|---|---|---|---|
| Duração da bateria | 17% | 23% | 51% | 21% | 7% | 23% | |
| Reader / Idle (h) | 6.7 | 10 49% | 15.5 131% | 10.1 51% | 8.71 ? 30% | ||
| H.264 (h) | 5.9 | 7.3 24% | 6.2 5% | 7.5 27% | 8.26 ? 40% | ||
| WiFi v1.3 (h) | 4.6 | 7.4 61% | 6.8 48% | 7.4 61% | 5.6 22% | 4.9 7% | 7.04 ? 53% |
| Load (h) | 2.1 | 1.4 -33% | 1.9 -10% | 1.8 -14% | 1.9 -10% | 1.47 ? -30% |
Pro
Contra
Verdict- Uma casa de força compacta
As principais áreas de aplicação da Lâmina 15 devem ser encontradas na edição de vídeo, renderização e jogos. OCore-i9 12900HcPU e GeForce RTX 3070 Ti laptopa GPU (TGP: 110 watts) fornece a potência necessária. Um rápido PCIe-4 SSD (1 TB) garante curtos tempos de carregamento.
A lâmina 15 OLED (Início de 2022) é uma ferramenta poderosa tanto para os jogadores quanto para os tipos criativos.
O foco não está somente no alto desempenho: Os resultados máximos dos núcleos computacionais são médios quando comparados com os laptops previamente revisados com a 12900H ou 3070 Ti. Embora a produção de calor seja típica para um laptop com esta potência, as emissões de ruído são relativamente moderadas. Este último não pode ser dito sobre o consumo de energia em uso ocioso: O Blade 15 ajuda-se a um gole muito grande da garrafa.
A vida real da bateria de 4 a 6 horas não impressiona. A este respeito, a concorrência tem muito mais a oferecer. Entretanto, a bateria pode ser carregada através de uma fonte de alimentação universal USB-C (mín. 65 watts, 20 V) e ambas as portas USB-C (2x Thunderbolt) suportam o fornecimento de energia (e Displayport).
Em geral, o painel OLED refletivo (QHD) tem pontuação um pouco melhor do que o painel de LED convencional (QHD) encontrado no modelo Blade 2022 previamente revisado. Ambos os displays oferecem boa cobertura de espaço de cor (sRGB: 100%) e boa reprodução de cor. O modelo OLED tem seu nariz na frente quando se trata de níveis de preto, brilho e tempos de resposta, onde o modelo LED pontua graças a sua superfície fosca.
Uma possível alternativa a este dispositivo poderia vir na forma doAsus ROG Zephyrus M16 GU603Z. Em termos de desempenho, o processador está no mesmo nível, mas marca pontos extras devido a uma exibição mais brilhante, no formato 16:10, bem como uma duração de bateria consideravelmente maior. Uma alternativa orçamentária poderia ser oAorus 15 XE5. Apesar desta máquina ser algumas centenas de dólares mais barata em preço, ela fornece um pouco mais de energia e melhor duração da bateria do que a Lâmina.
Preço e disponibilidade
A especificação de revisão Razer Blade 15 OLED (Early 22) pode ser obtida em Amazon por US$1.967.
Razer Blade 15 OLED (Early 2022)
- 03/04/2023 v7 (old)
Sascha Mölck
Transparência
A seleção dos dispositivos a serem analisados é feita pela nossa equipe editorial. A amostra de teste foi fornecida ao autor como empréstimo pelo fabricante ou varejista para fins desta revisão. O credor não teve influência nesta revisão, nem o fabricante recebeu uma cópia desta revisão antes da publicação. Não houve obrigação de publicar esta revisão. Como empresa de mídia independente, a Notebookcheck não está sujeita à autoridade de fabricantes, varejistas ou editores.
É assim que o Notebookcheck está testando
Todos os anos, o Notebookcheck analisa de forma independente centenas de laptops e smartphones usando procedimentos padronizados para garantir que todos os resultados sejam comparáveis. Desenvolvemos continuamente nossos métodos de teste há cerca de 20 anos e definimos padrões da indústria no processo. Em nossos laboratórios de teste, equipamentos de medição de alta qualidade são utilizados por técnicos e editores experientes. Esses testes envolvem um processo de validação em vários estágios. Nosso complexo sistema de classificação é baseado em centenas de medições e benchmarks bem fundamentados, o que mantém a objetividade.Price comparison

