Revisão do MSI Katana 17 B13V laptop: Nvidia GeForce RTX 4060 faz sua estréia
5499 dólares. Isso é o quanto os compradores em potencial têm que desembolsar para a MSI Titan GT77. Por um lado, você obtém o máximo em poder, mas não muitas pessoas estarão dispostas a gastar tanto em um laptop. Com alguns cantos cortados, o MSI Katana 17 B13VFK mostra que o mais barato também pode funcionar: Com uma CPU Raptor Lake e Nvidia GeForce RTX 4060este laptop para jogos (atualmente indisponível na Amazon e Best Buy) pode ser adquirido na Alemanha por cerca de 1999 euros. Ainda é muito dinheiro, mas cerca de dois terços mais barato. Em nossa extensa revisão, revelamos se o desempenho também tem ou não um impacto semelhante.
Possíveis concorrentes em comparação
Avaliação | Data | Modelo | Peso | Altura | Size | Resolução | Preço |
|---|---|---|---|---|---|---|---|
| 82.1 % v7 (old) | 02/2023 | MSI Katana 17 B13VFK i7-13620H, GeForce RTX 4060 Laptop GPU | 2.8 kg | 25.2 mm | 17.30" | 1920x1080 | |
| 89 % v7 (old) | 02/2023 | MSI Titan GT77 HX 13VI i9-13950HX, GeForce RTX 4090 Laptop GPU | 3.5 kg | 23 mm | 17.30" | 3840x2160 | |
| 83.2 % v7 (old) | 01/2023 | MSI Pulse GL76 12UGK i7-12700H, GeForce RTX 3070 Laptop GPU | 2.6 kg | 24.2 mm | 17.30" | 1920x1080 | |
| 83.3 % v7 (old) | 01/2023 | Gigabyte G7 KE i5-12500H, GeForce RTX 3060 Laptop GPU | 2.6 kg | 25 mm | 17.30" | 1920x1080 | |
| 86.9 % v7 (old) | 11/2022 | Asus ROG Strix Scar 17 SE G733CX-LL014W i9-12950HX, GeForce RTX 3080 Ti Laptop GPU | 2.9 kg | 28.3 mm | 17.30" | 2560x1440 | |
| 86.5 % v7 (old) | 11/2022 | Acer Predator Helios 300 (i7-12700H, RTX 3070 Ti) i7-12700H, GeForce RTX 3070 Ti Laptop GPU | 3 kg | 27.65 mm | 17.30" | 2560x1440 |
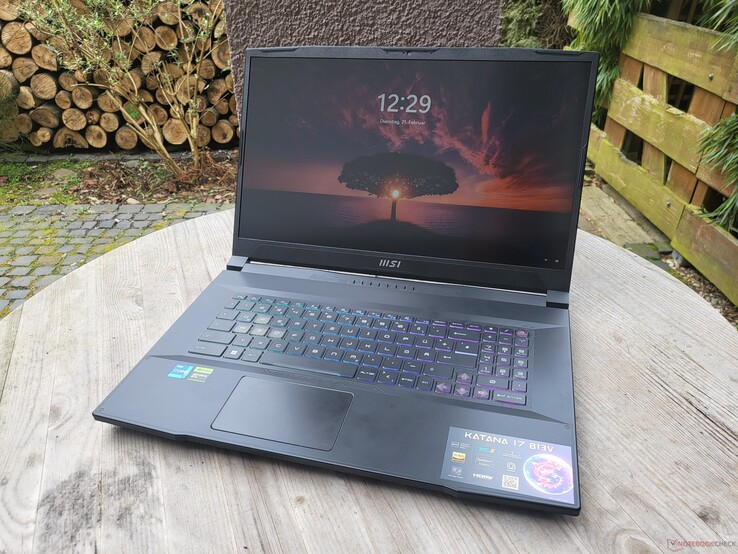
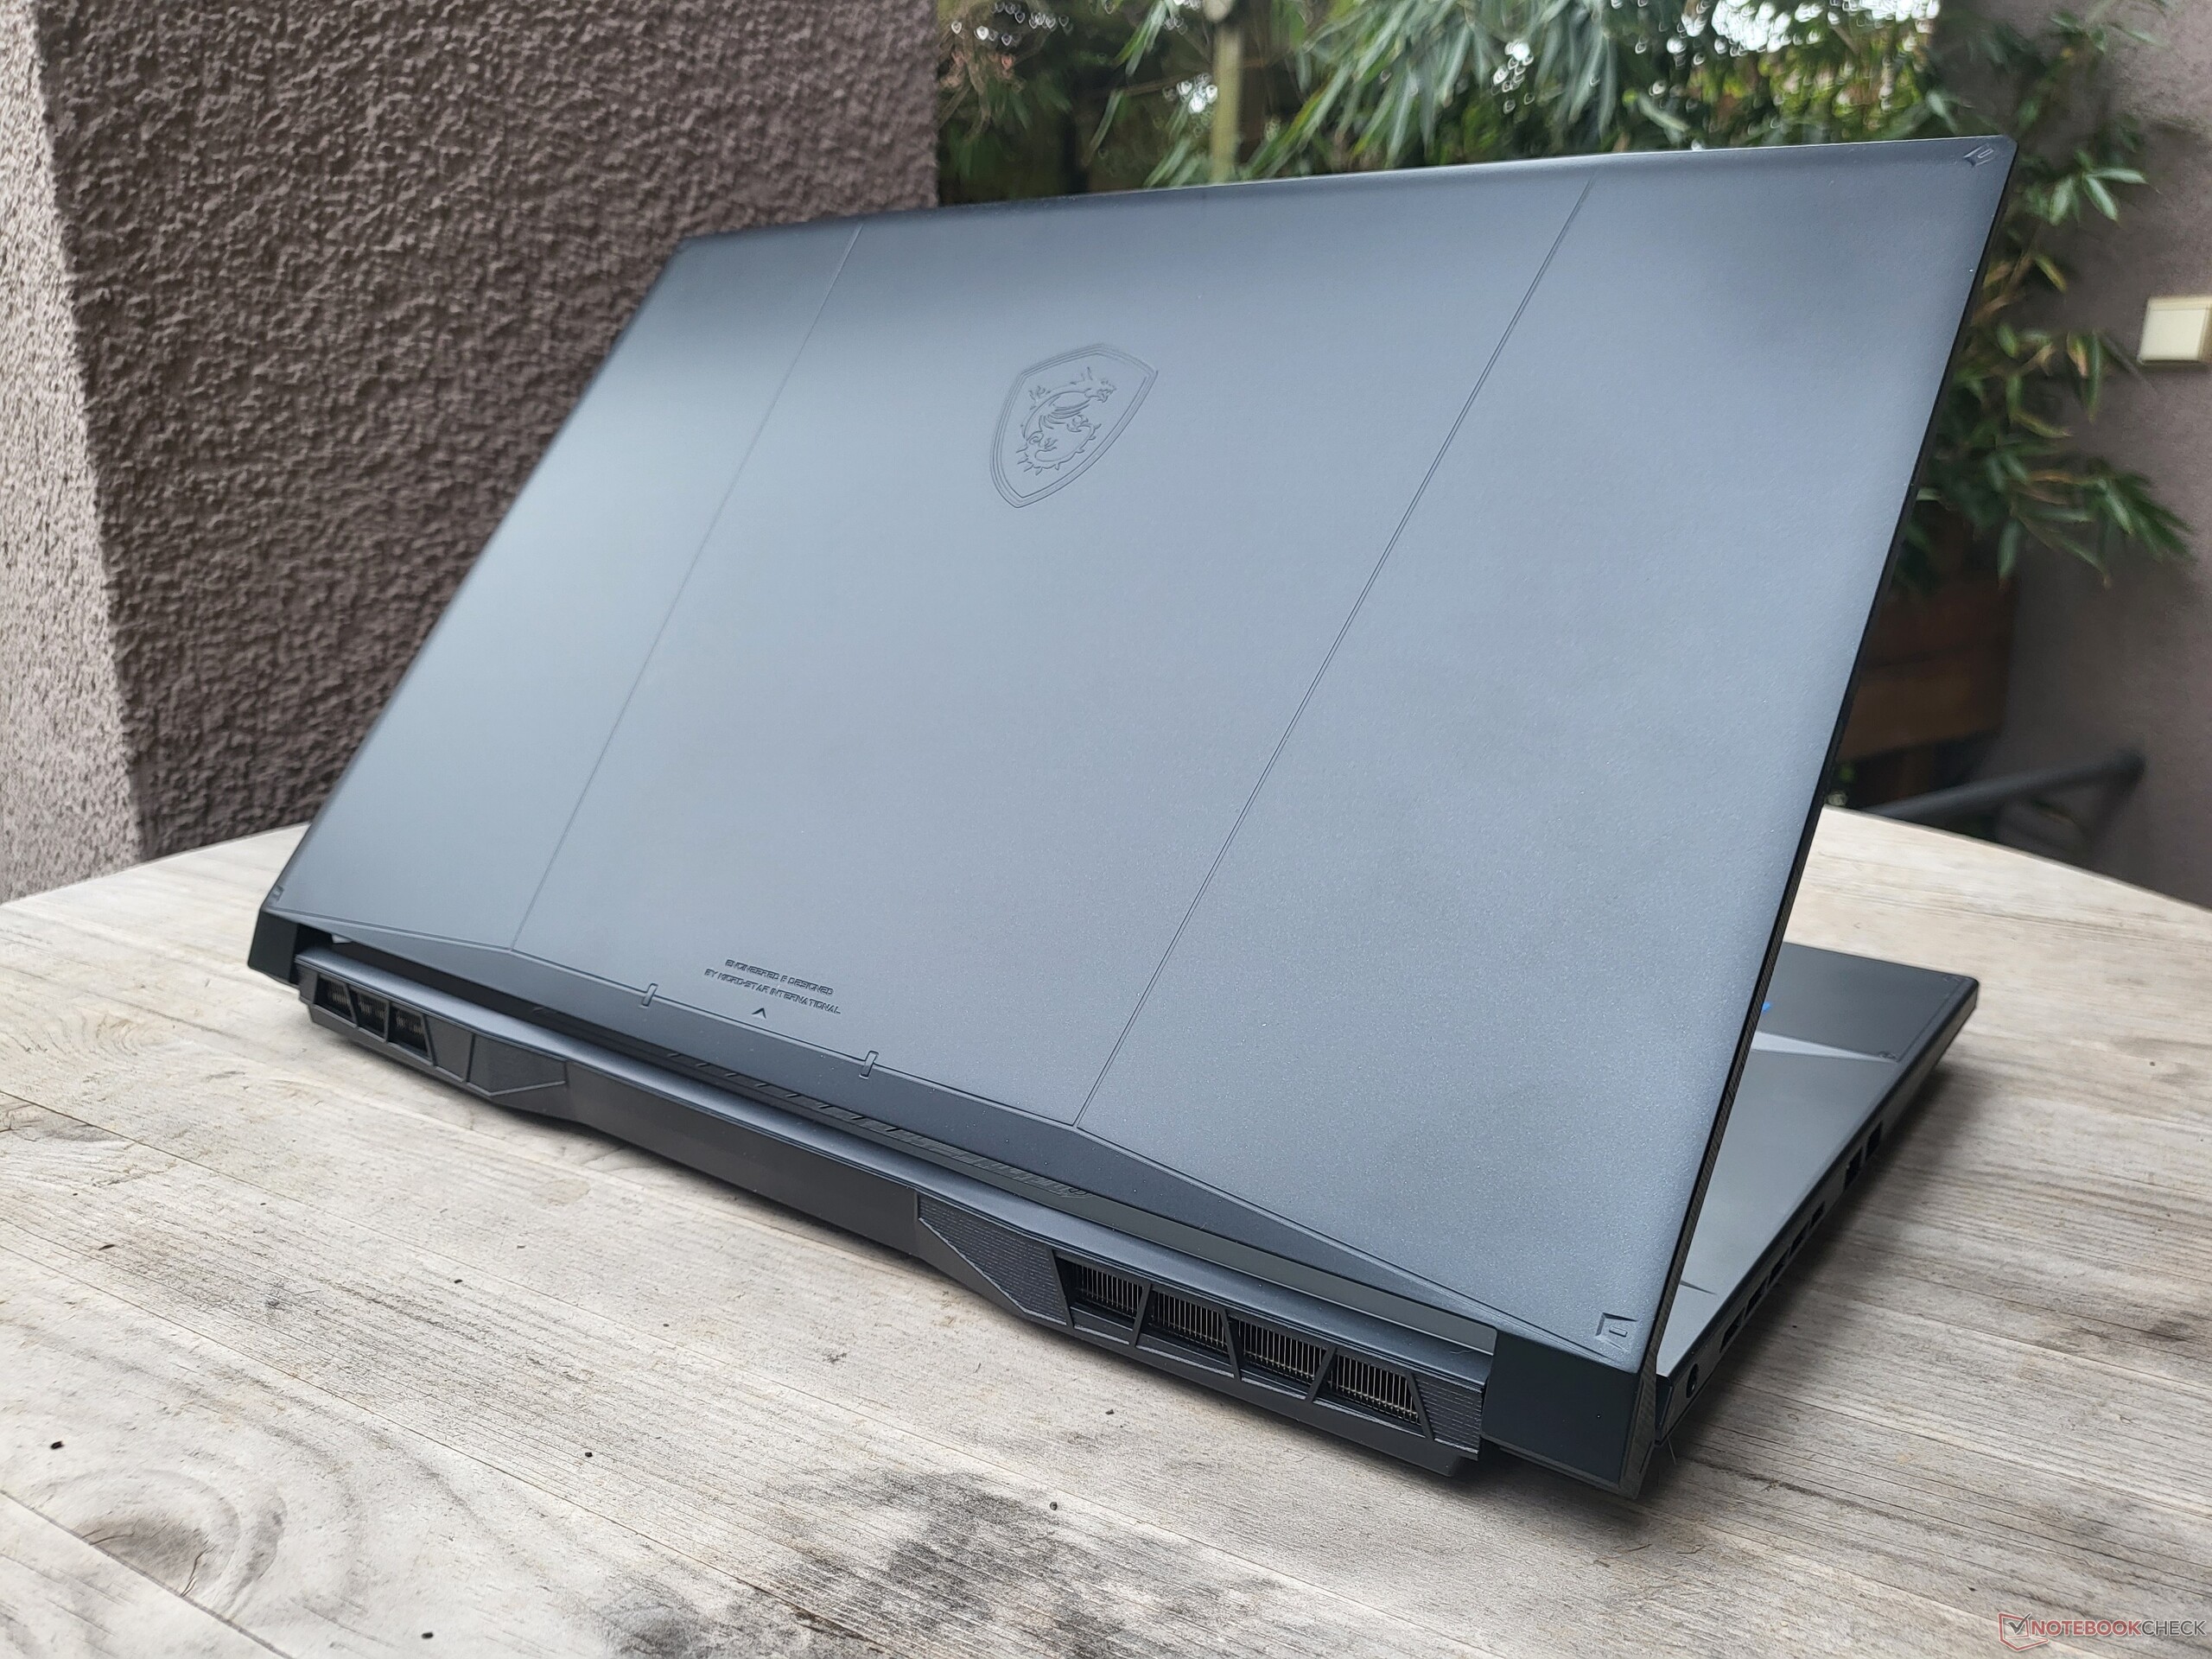
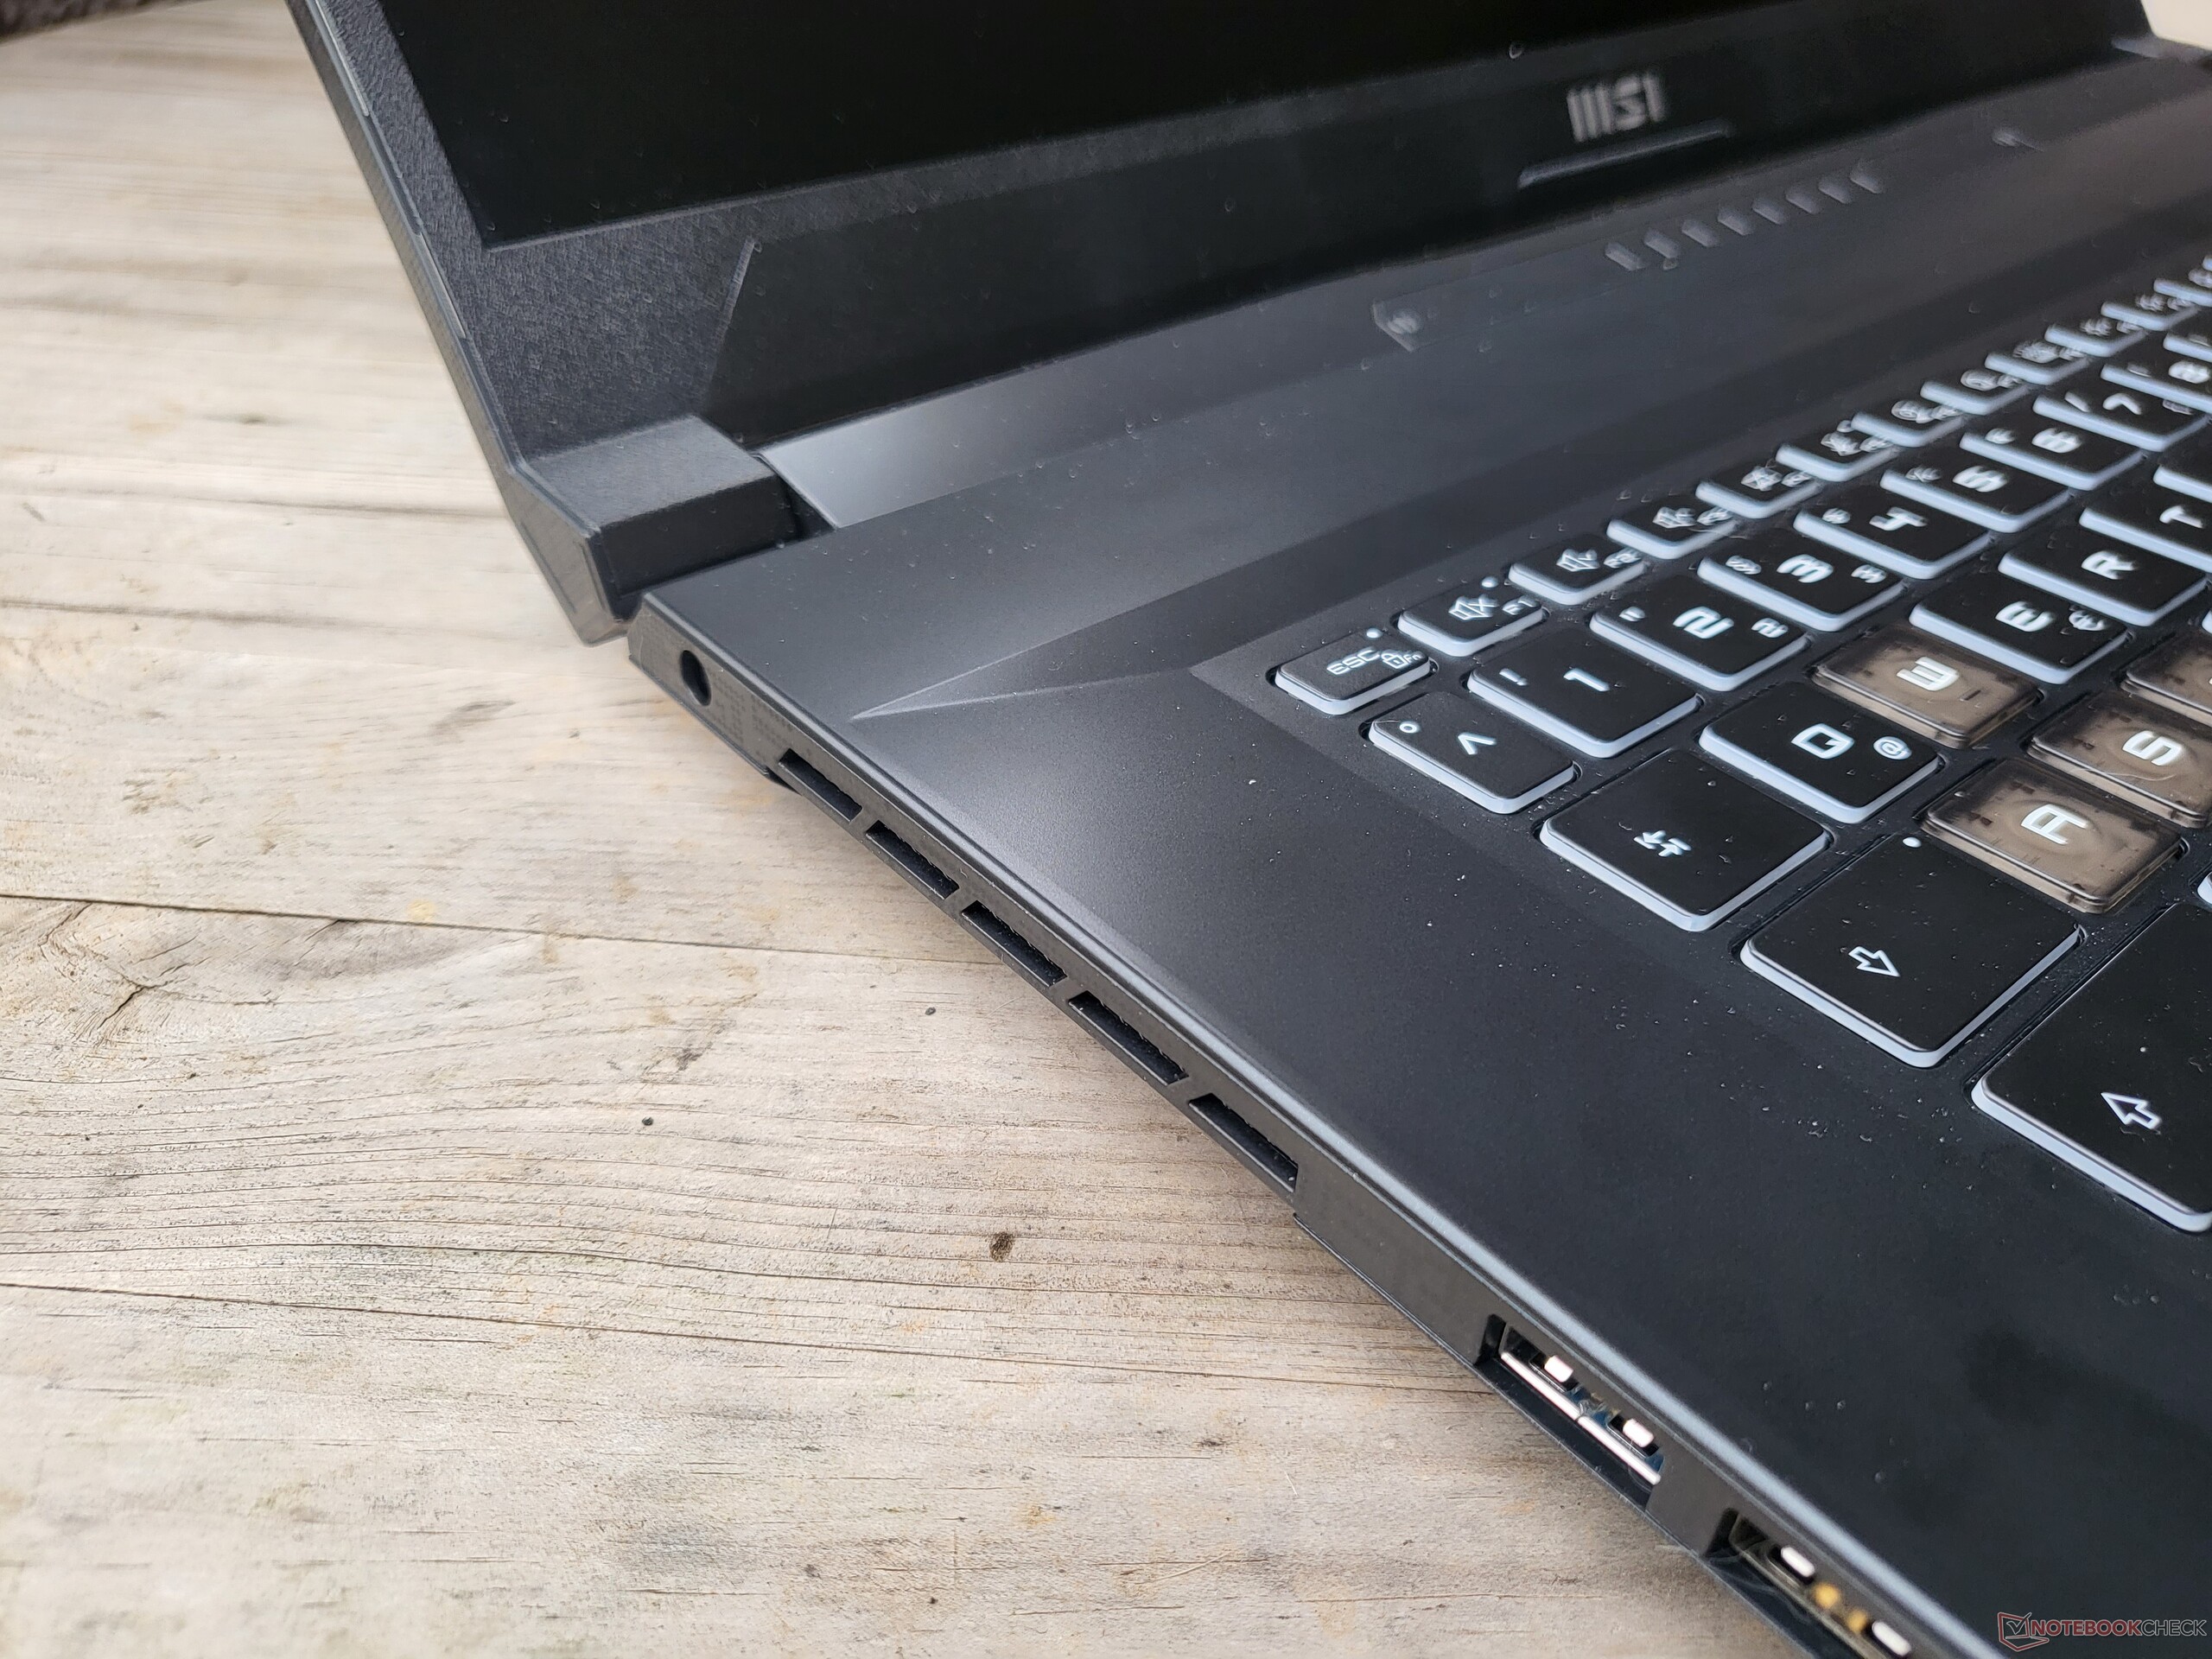
Estojo: Um foguete MSI cinza fosco
A MSI deu ao Katana 17 um visual de jogo típico. A linguagem de design dificilmente pode ser descrita como simples, mas isso é algo que não se aplica à cor do laptop: o MSI é cinza escuro por todo o lado. Embora, este seja apenas o caso quando o dispositivo é desligado. Com o teclado colorido e retroiluminado ativado, em termos de cor, o MSI também se parece com um laptop para jogos.
Externamente, pelo menos, o laptop é feito de plástico. O apoio de palma e a tampa da palma da mão são suaves ao toque, enquanto a base da unidade é um pouco mais áspera. Não é necessariamente da mais alta qualidade, mas serve ao seu propósito. Quando é aplicada uma leve pressão, o apoio de palma é firme, mas com pressão adicional, ele flexiona um pouco no meio. A tampa do visor pode ser ligeiramente torcida, ao contrário da base que não pode ser torcida de forma alguma. Para um laptop que deve passar a maior parte de seu tempo em uma mesa, isto não deve ser um problema.
As grandes dobradiças permitem que o dispositivo seja aberto a um ângulo de 180 graus e a tampa do mostrador pode ser aberta com uma mão.
Em termos de peso, o MSI Katana 17 fica no meio do pacote quando comparado com seus pares. Em troca, ela possui dimensões relativamente compactas.
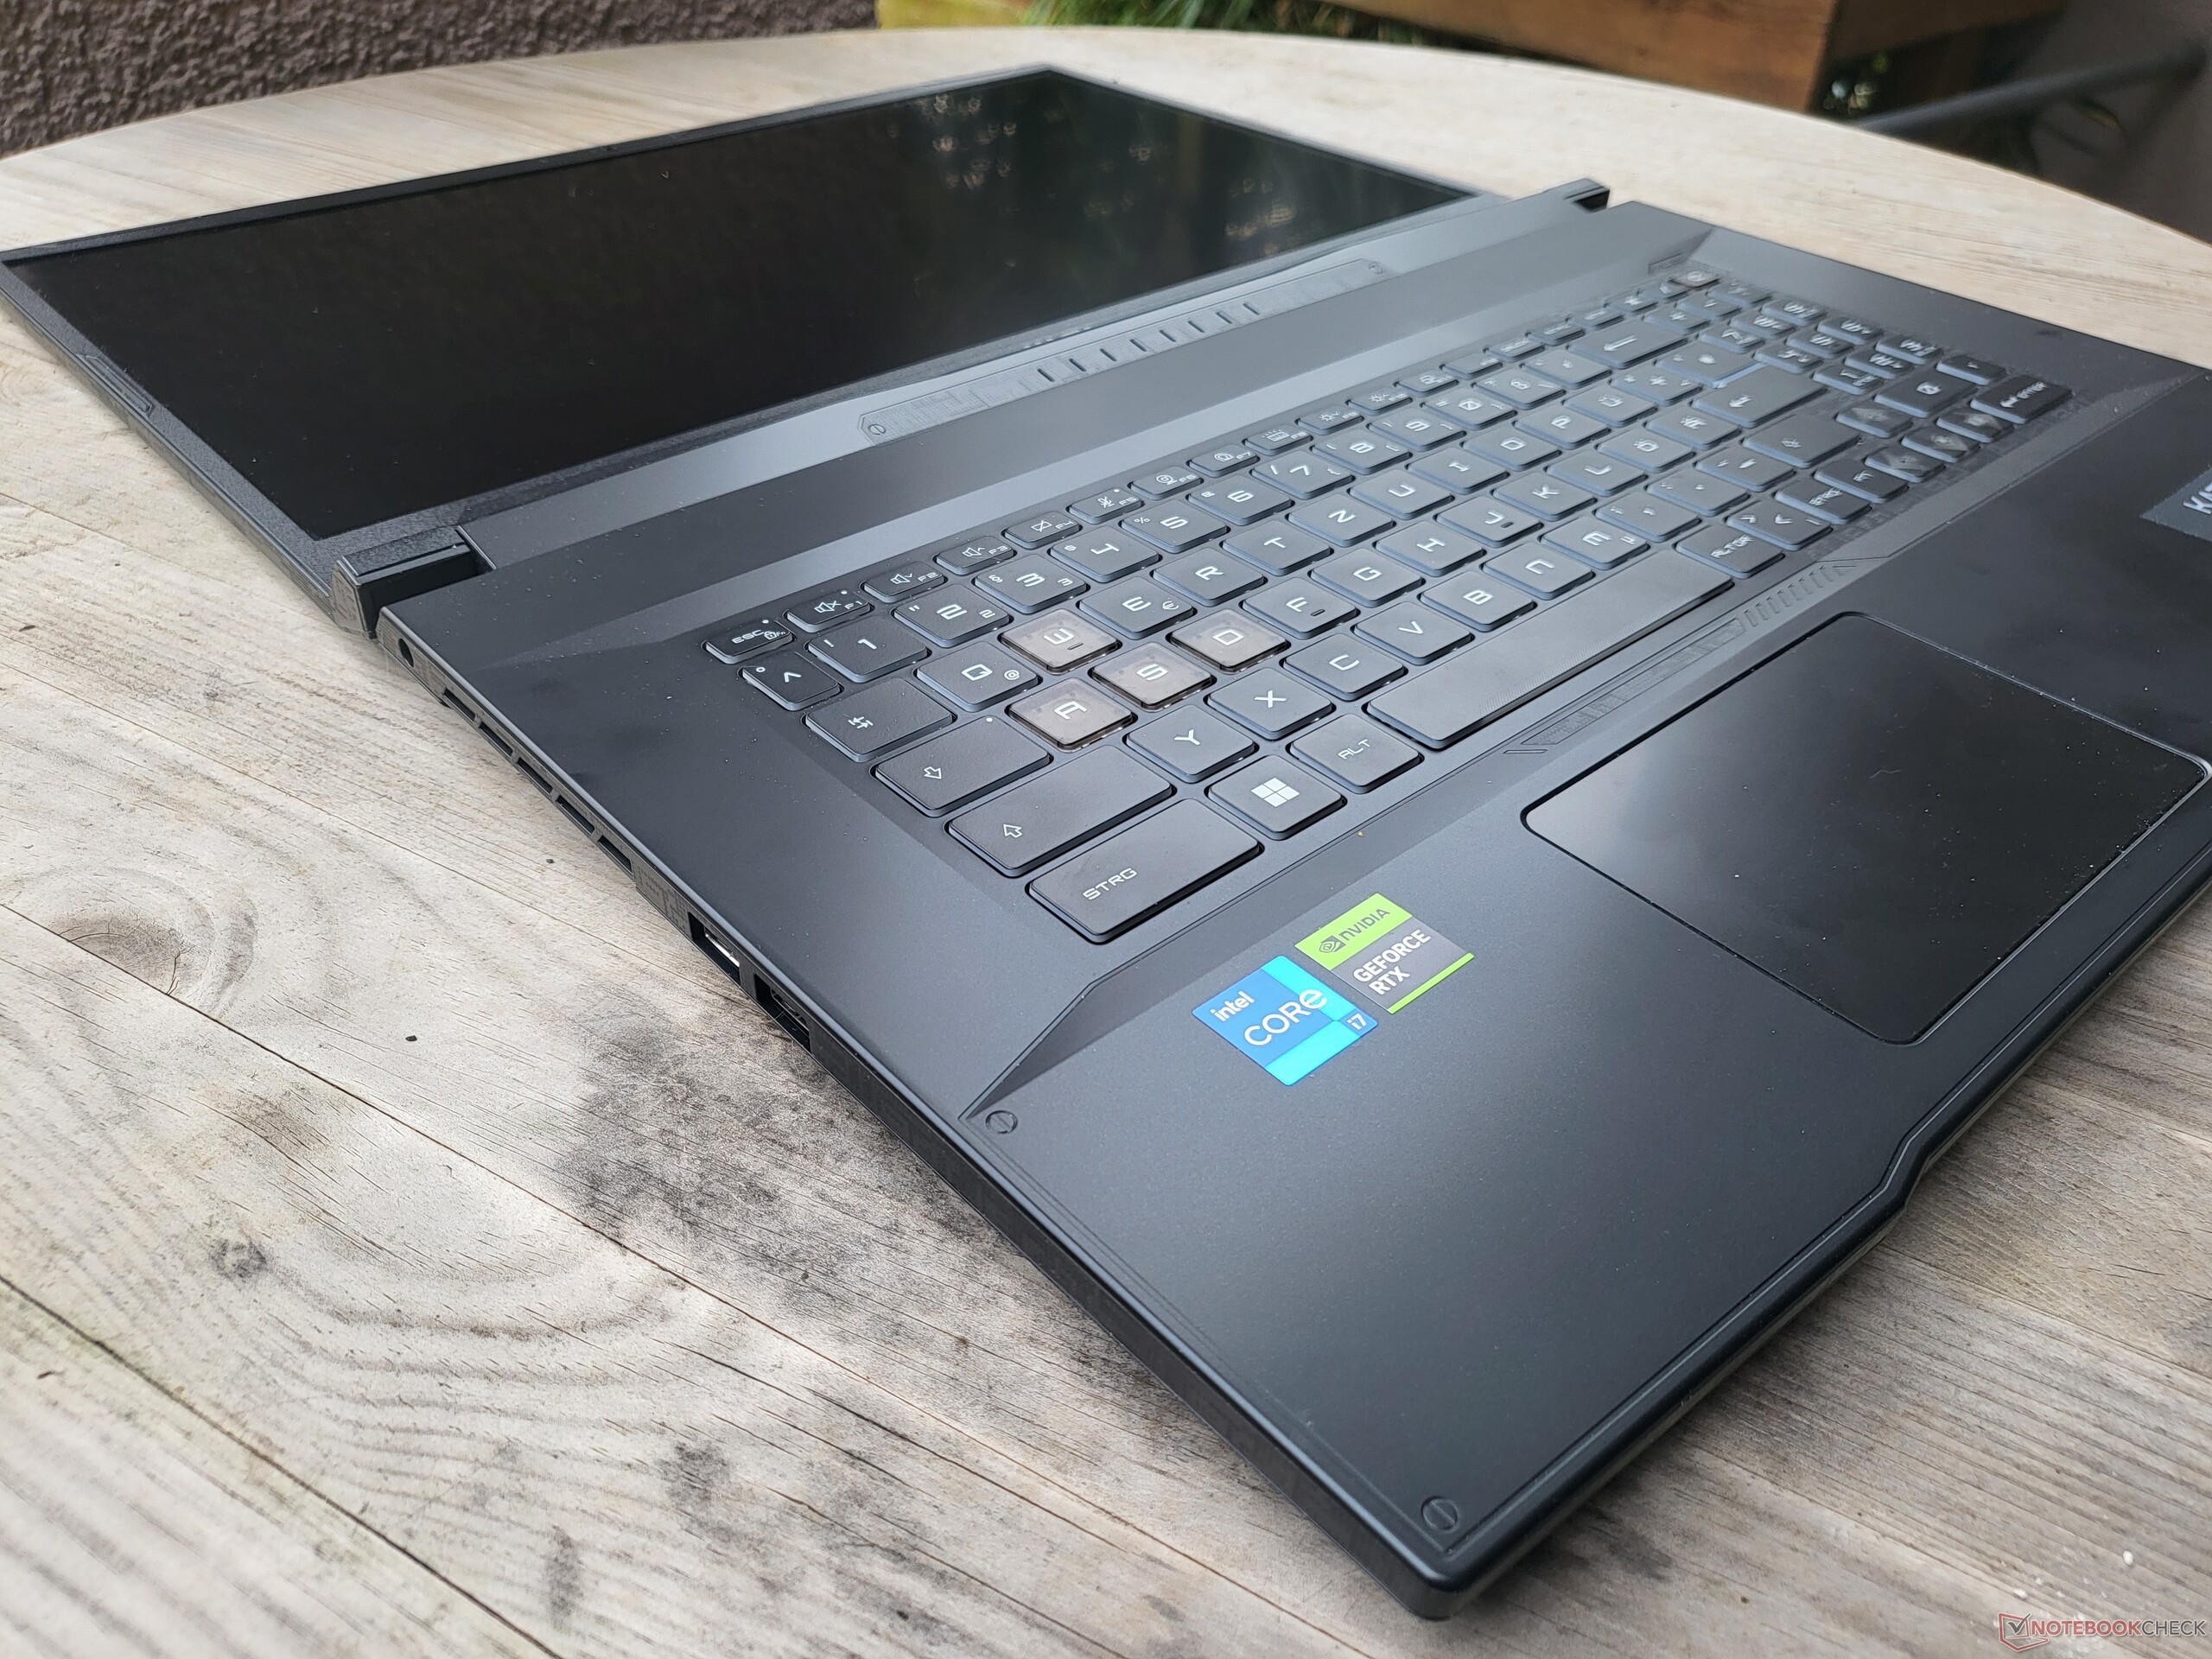
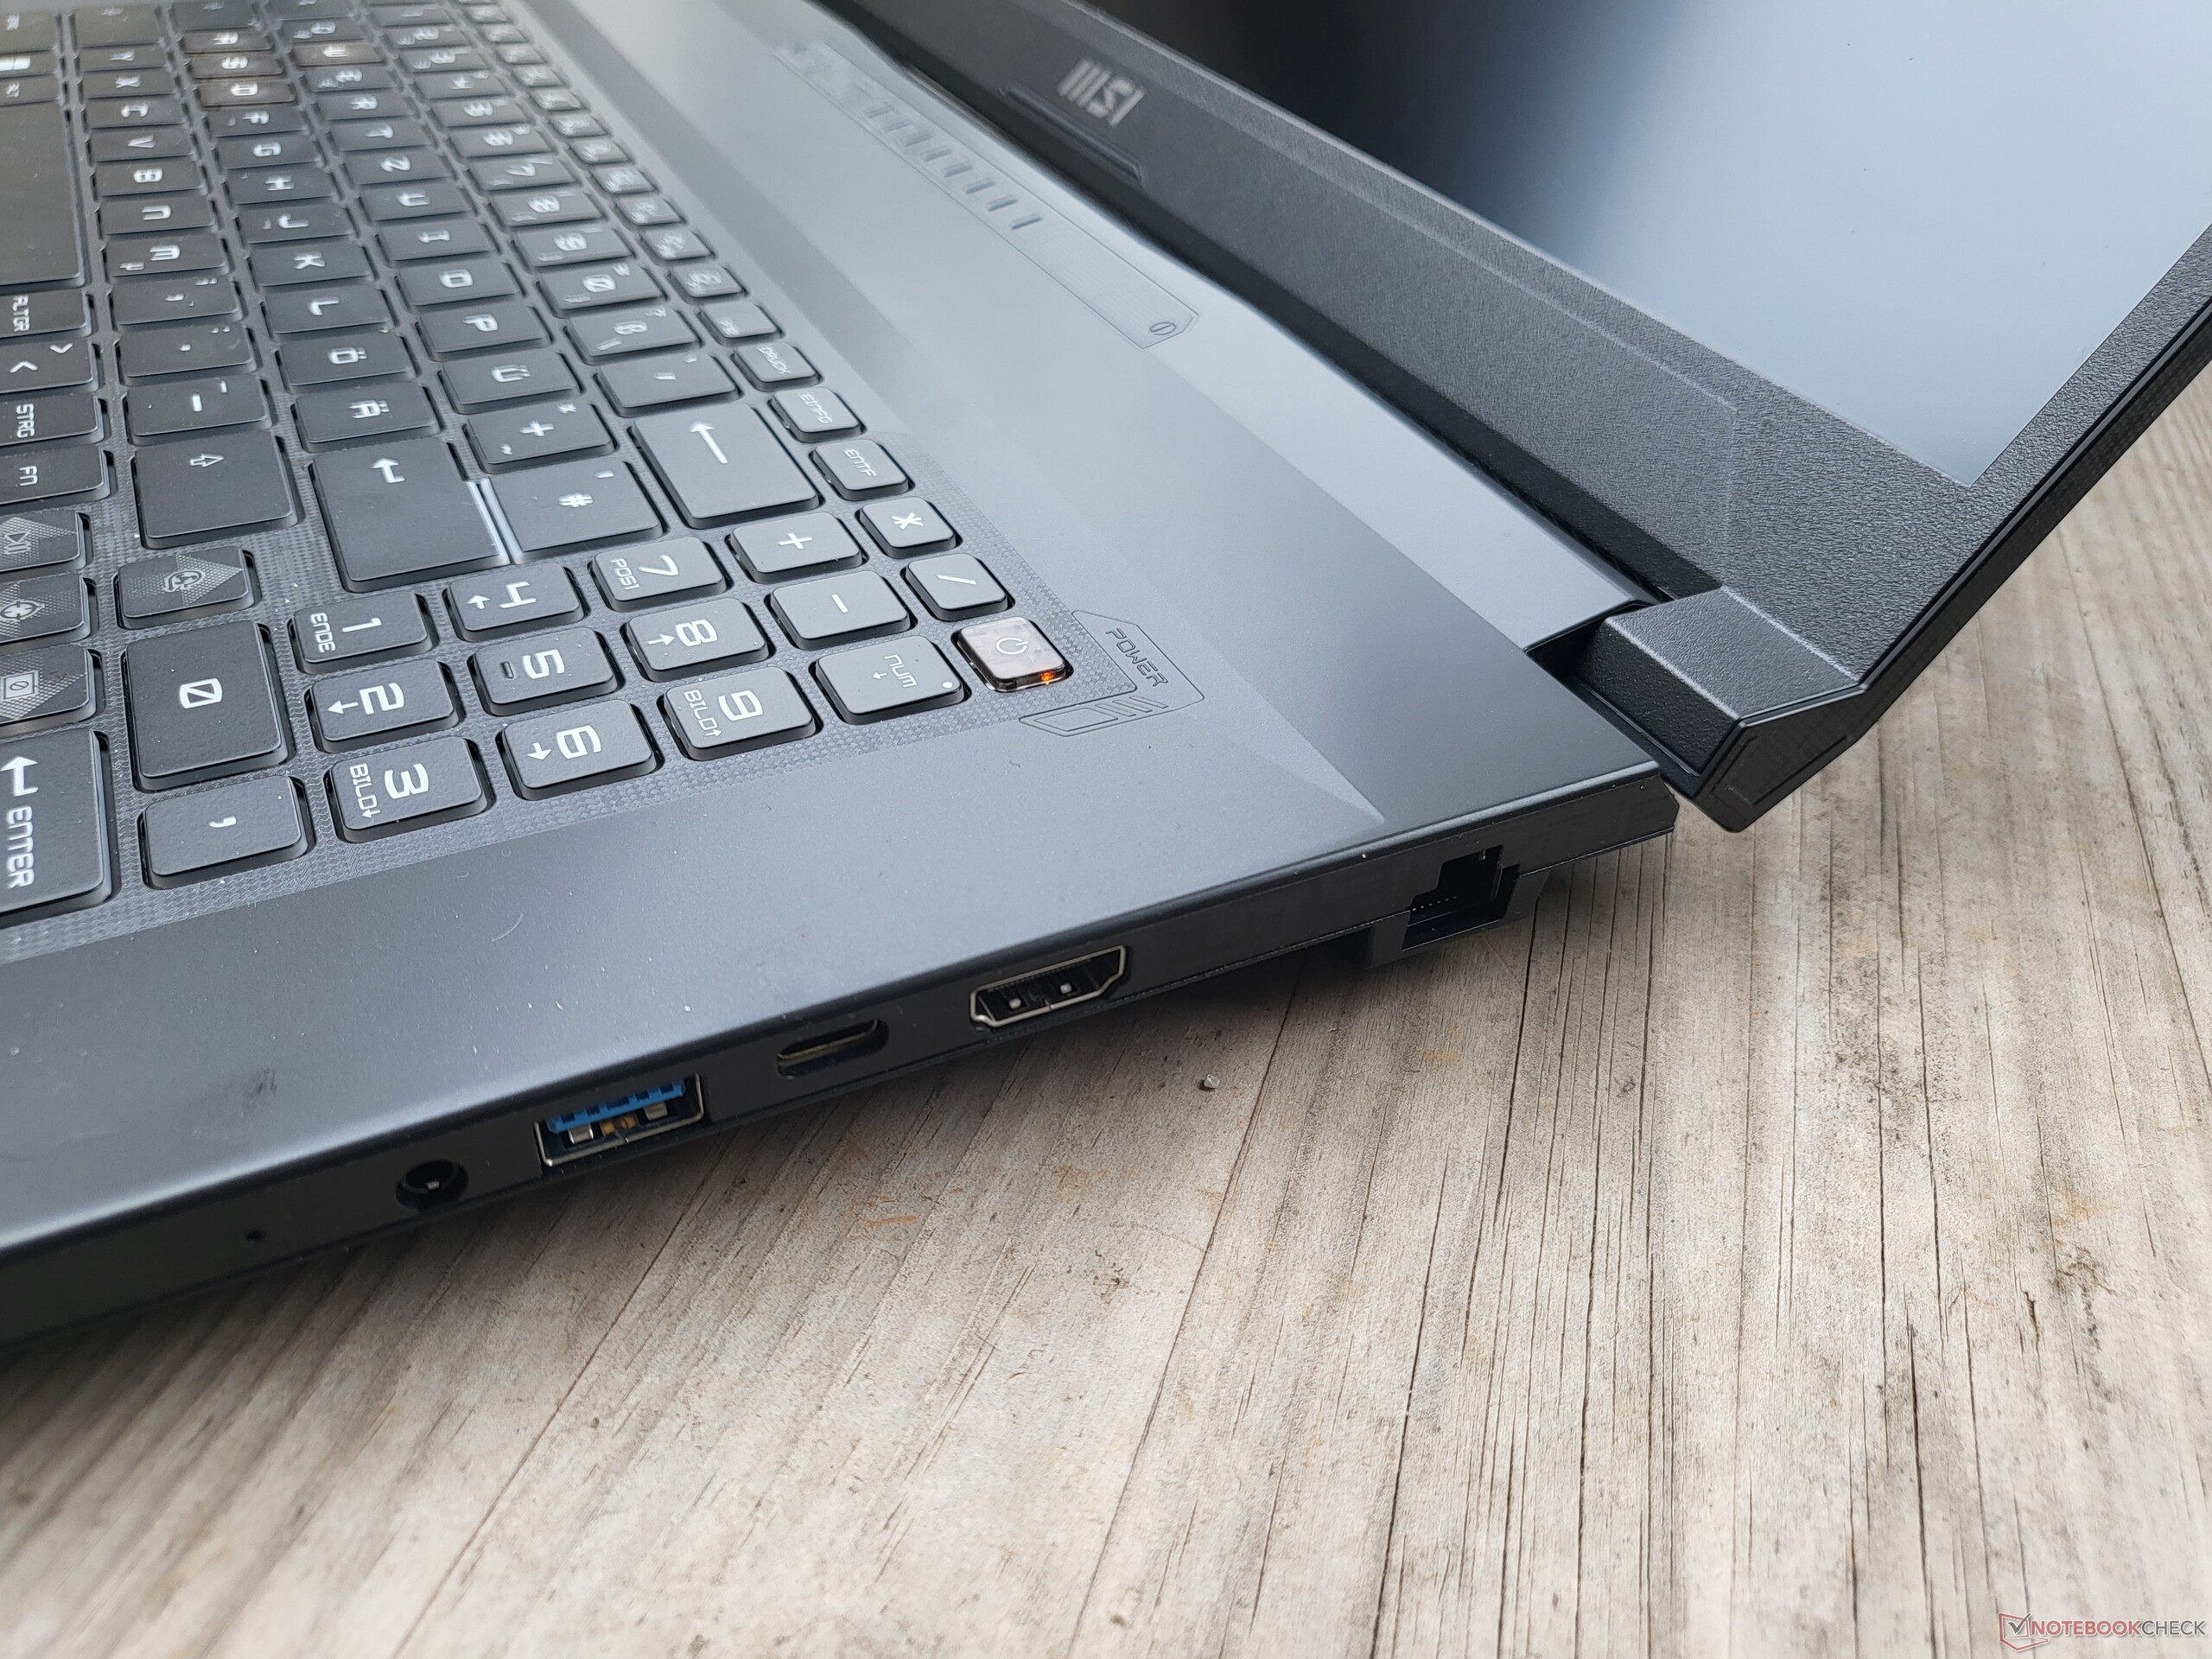
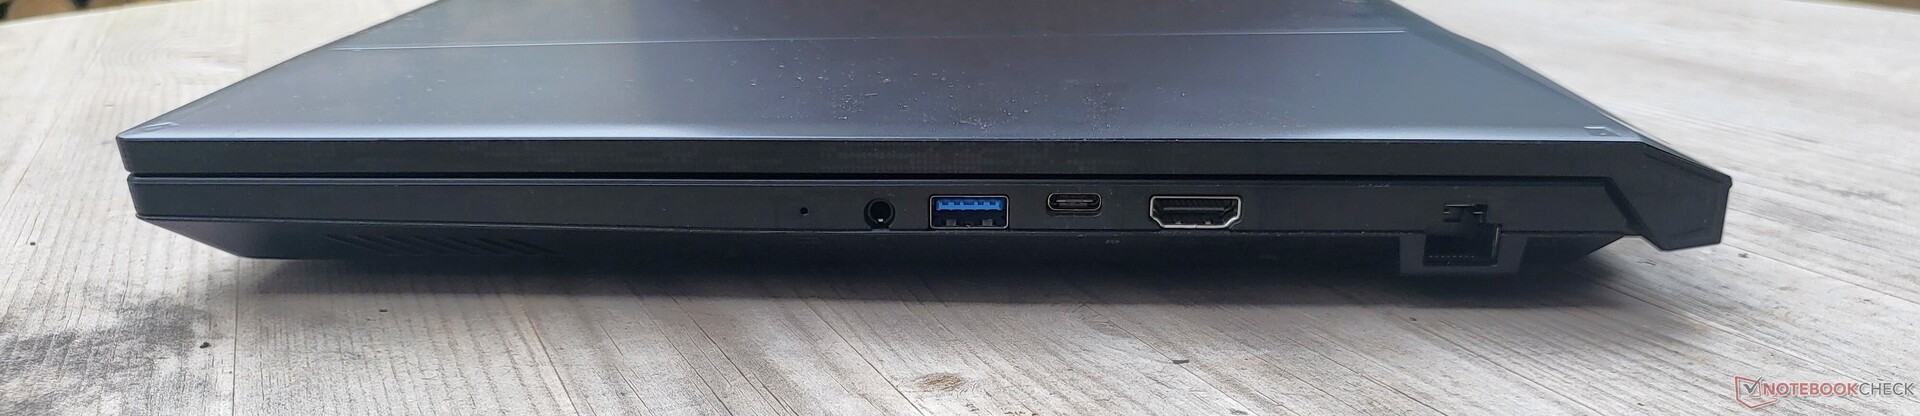
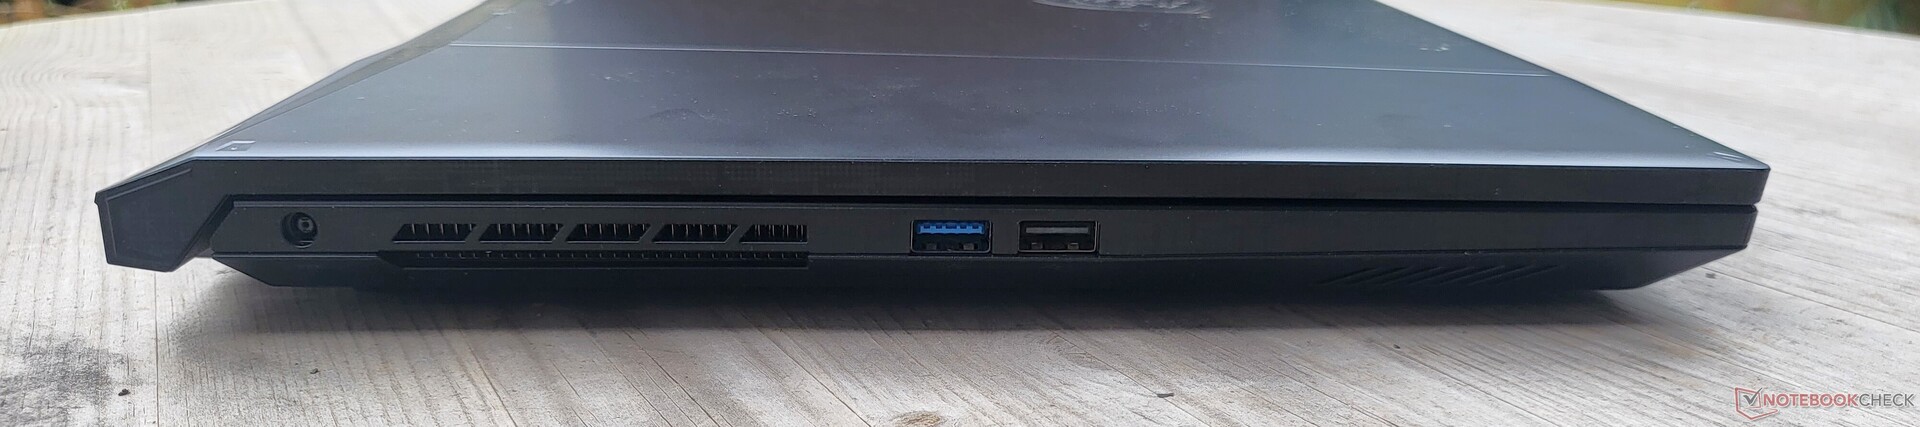
Características: USB 2.0 ao invés de Thunderbolt
A variedade de portos deixa muito a desejar: O USB 2.0 não tem lugar em 2022 e o Thunderbolt também está ausente no MSI Katana 17. Além disso, sentimos falta de ter um leitor de cartões SD, mas pelo menos a MSI não passou na porta den RJ45.
Comunicação
Com o Katana 17 B13V, a MSI optou por uma solução WiFi da Intel, embora não uma com a tecnologia mais atualizada. O Intel AX201 oferece taxas de transferência altas e estáveis, embora tenha que passar sem o mais novo padrão WiFI 6E.
Webcam
A webcam 720p fornece uma imagem típica para laptops: ruidosa, desbotada e sem nitidez.


Acessórios
Out-of-the-box, o MSI Katana 17 B13V vem com uma unidade de alimentação de 240 watts da Chicony que usa um conector proprietário.
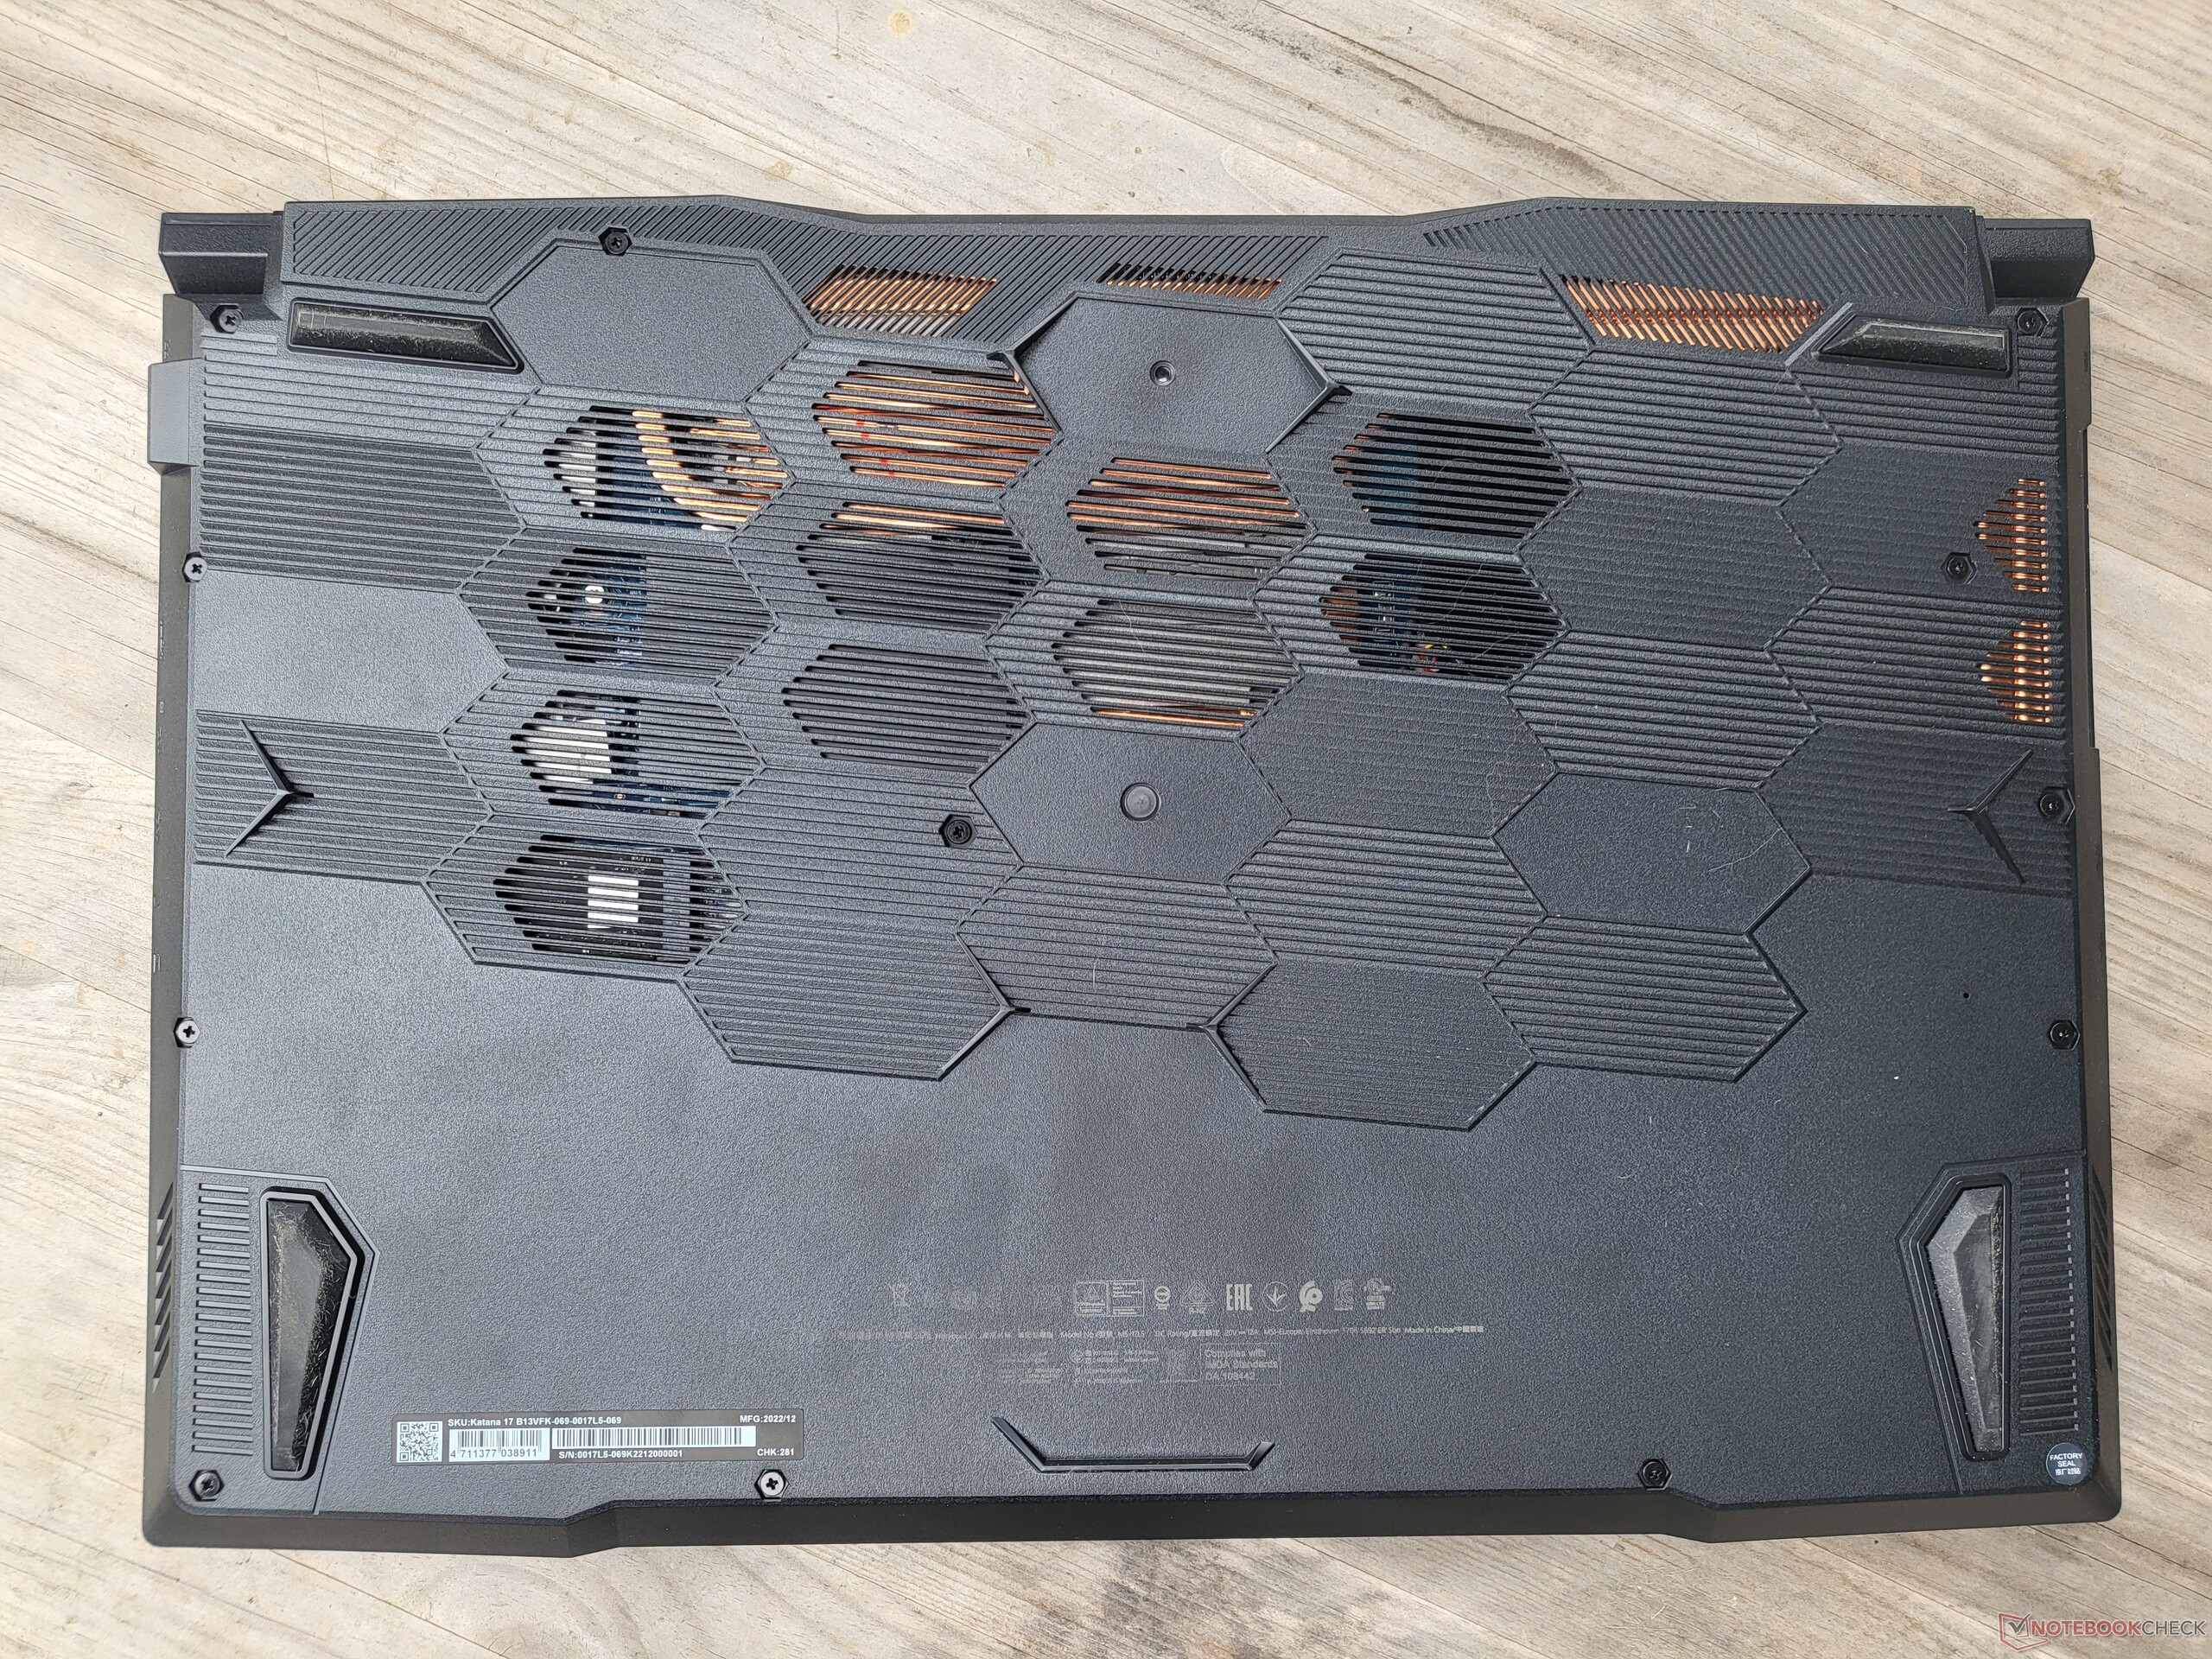
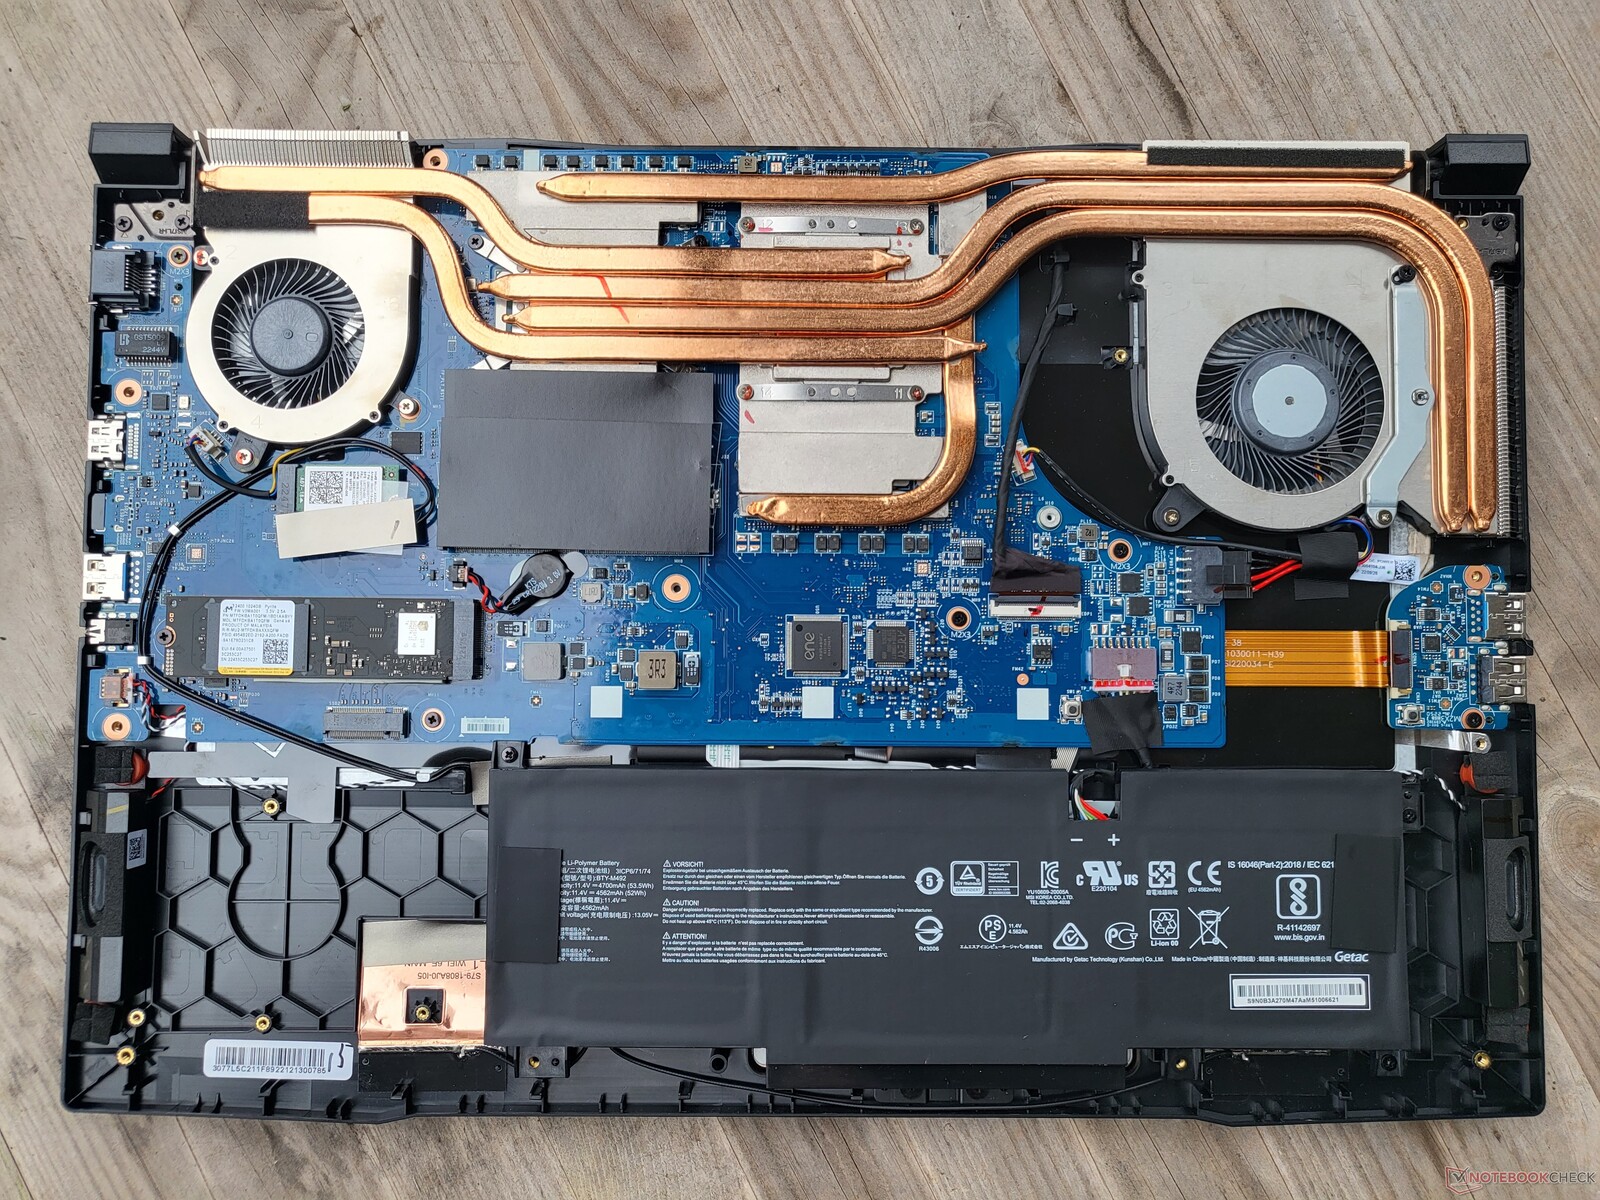
Manutenção
Treze parafusos e alguns clipes impedem o acesso aos internos da Katana. O módulo WiFi, M.2 2280 SSD, bem como ambos os módulos de RAM podem ser atualizados. Além disso, é possível acessar o sistema de resfriamento grande de dois ventiladores e também a bateria, que é bastante pequena para um dispositivo deste tamanho. O espaço livre ao lado da bateria é muito grande, o que mostra que uma bateria maior teria sido possível. Curiosamente, há um peso na placa de base que faz o laptop MSI parecer mais pesado - possivelmente devido ao espaço grande e livre.
Garantia
O laptop MSI vem com uma garantia de 2 anos a partir da data de compra que inclui um serviço de Pick-Up & Return. No entanto, a garantia do fabricante só se aplica à Alemanha.
Dispositivos de entrada: Bom teclado, layout estranho
Teclado
Primeiramente, os positivos: O teclado chiclet vem completo com backlight RGB multinível (quatro zonas, configurável) e oferece, pelos padrões atuais, um curso de teclas muito generoso de 1,7 mm. A MSI escolheu um teclado muito bom para o Katana 17 B13V. A experiência de digitação é maravilhosa e o destaque da tecla WASD se encaixa bem no design do jogo - assim como as teclas de seta relativamente grandes.
Entretanto, é difícil entender porque a MSI não optou por um teclado de largura total. Algumas teclas são mais claras e menores do que o normal e, em particular, o teclado numérico é minúsculo. De modo geral, ficamos lidando com um layout de teclado muito incomum e incômodo. A tecla FN está em uma posição absurda, a tecla de deslocamento direito é consideravelmente menor e, para completar, é um layout ANSI com uma tecla de entrada estreita, o que significa que a tecla # está deslocada. Não é um problema para o mercado mundial, mas é muito incomum aqui na Alemanha.
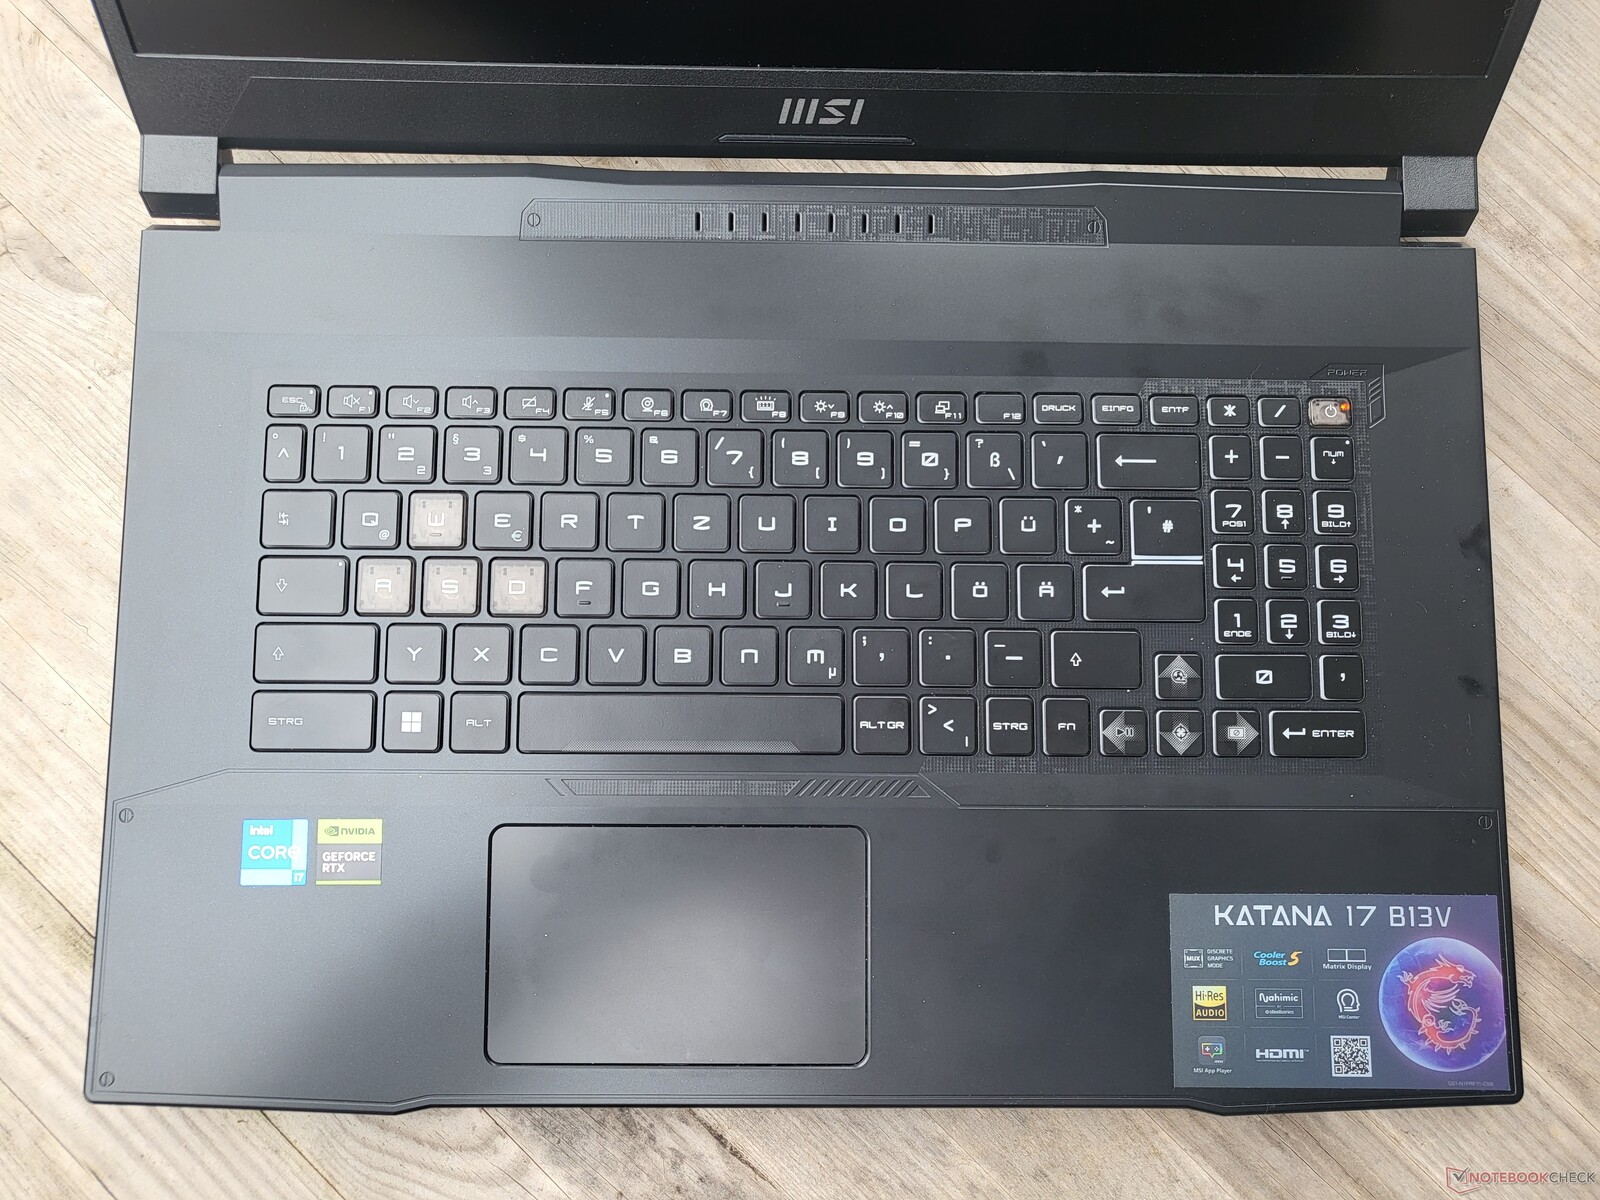
Touchpad
O touchpad do MSI Katana 17 mede 10,5 x 6,5 cm - muito pequeno pelos padrões de hoje e também em relação ao tamanho do dispositivo. Para nossos gostos, a superfície plástica poderia ser um pouco mais lisa e também não se sente muito superior. Ao menos isto não se aplica ao mecanismo de clique: O "click pad" proporciona um clique uniforme e uma sensação de alta qualidade. Há pouco a reclamar em termos de implementação de software e, neste aspecto, é o tipo típico de touchpad encontrado nos modernos laptops Windows.
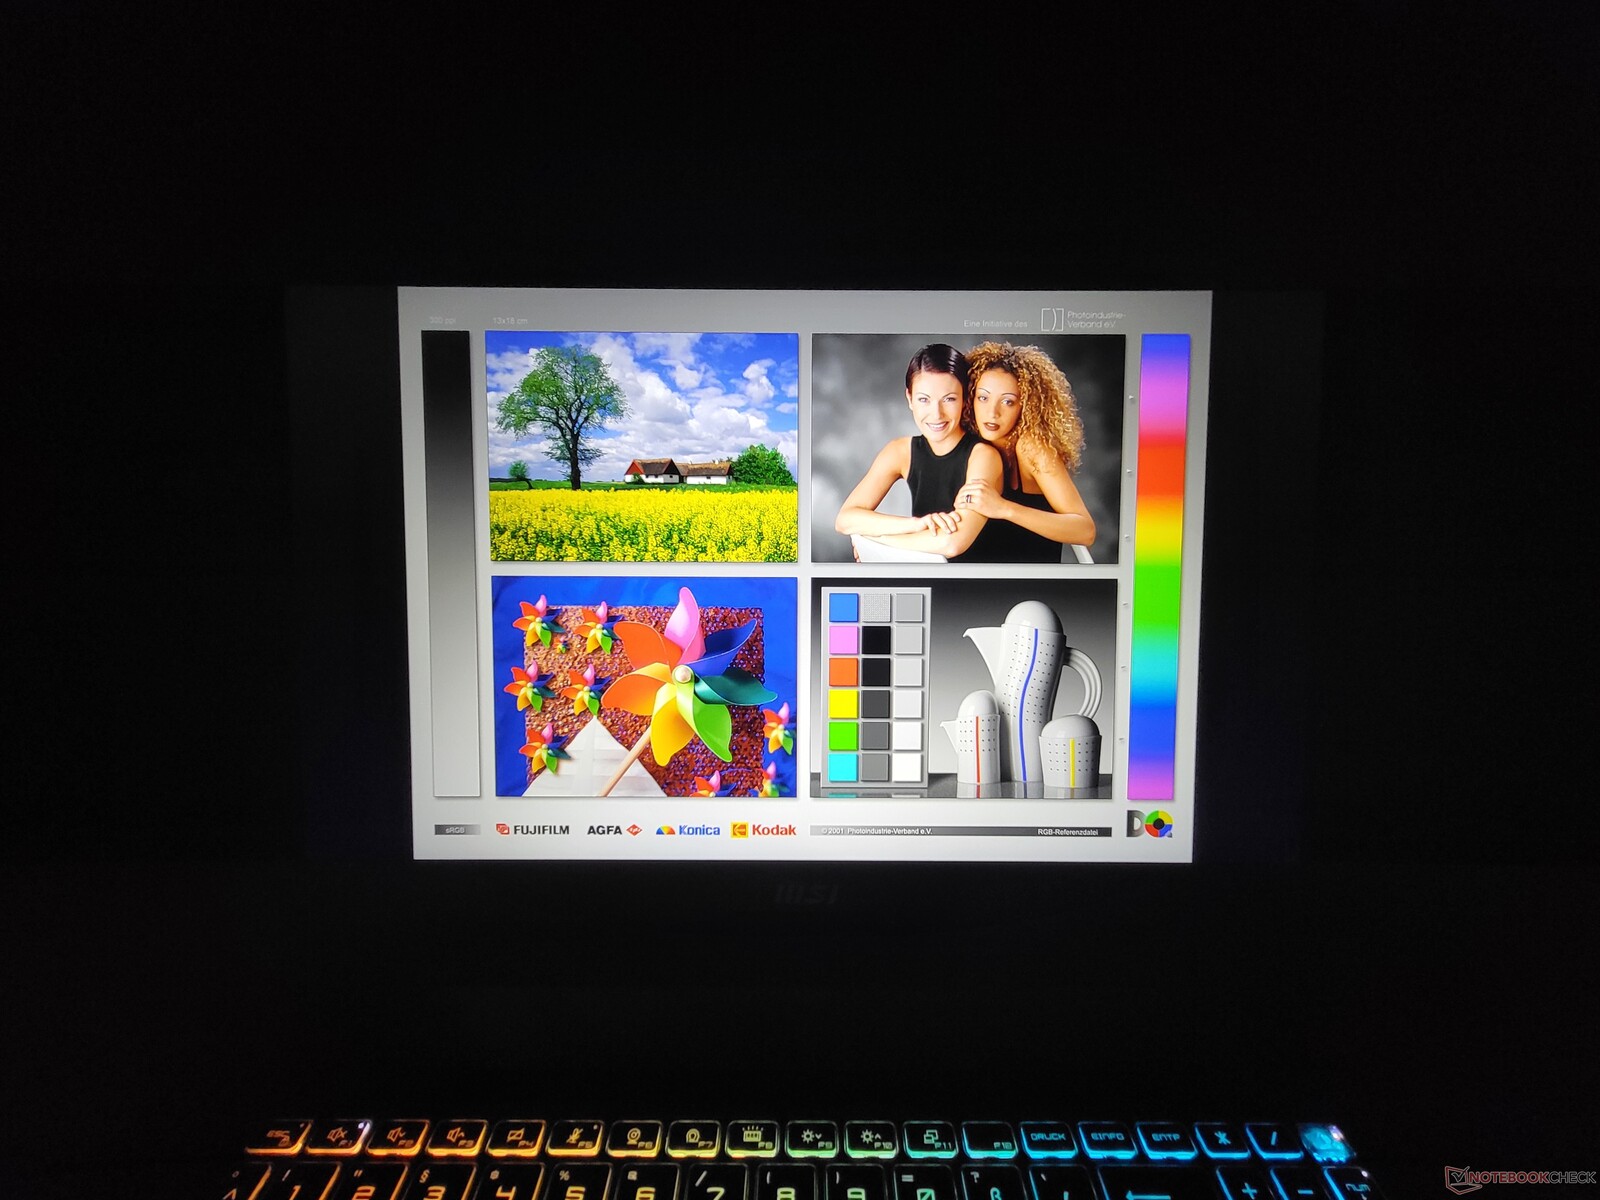
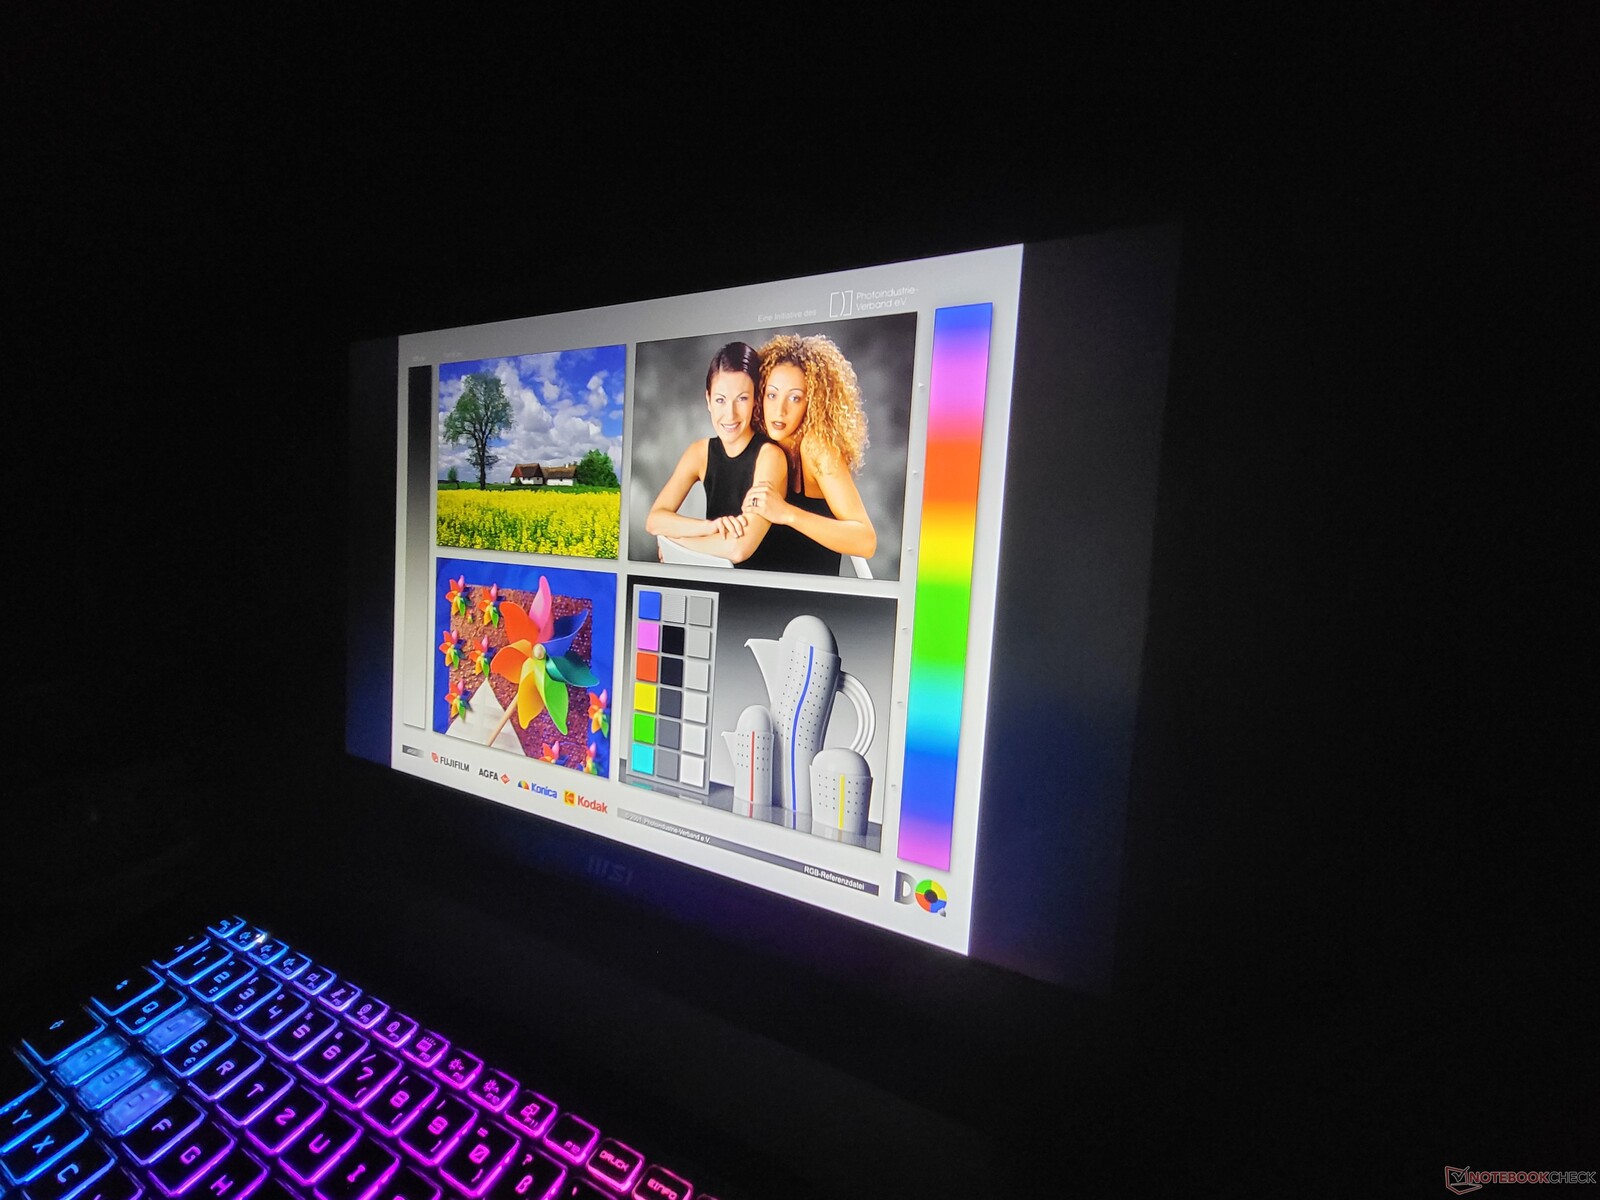
A tela da MSI Katana 17 é seu elo mais fraco
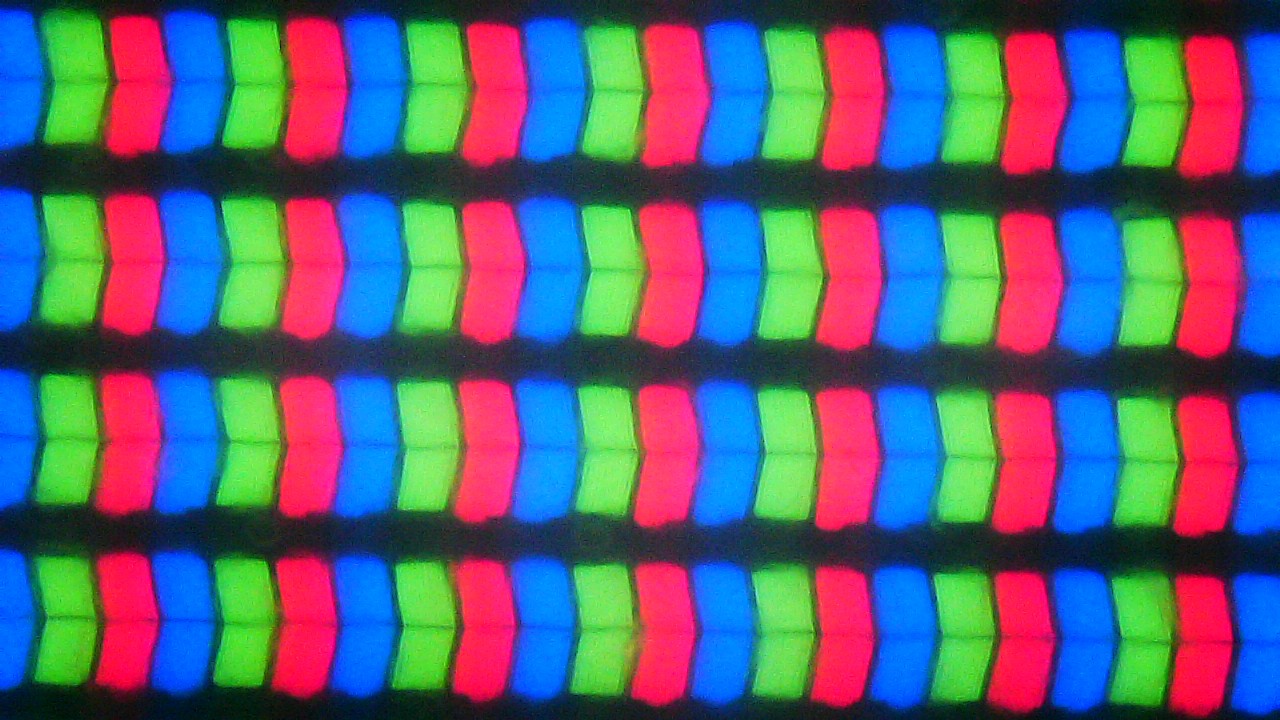
Para o Katana 17 B13V, a MSI oferece apenas uma opção de display e é um LCD IPS de 17,3 polegadas, fosco, formato 16:9. A única resolução disponível é 1920 x 1080, em outras palavras, FullHD. Esta é uma resolução relativamente baixa para um monitor deste tamanho - embora pelo menos seja um monitor de 144 Hz.
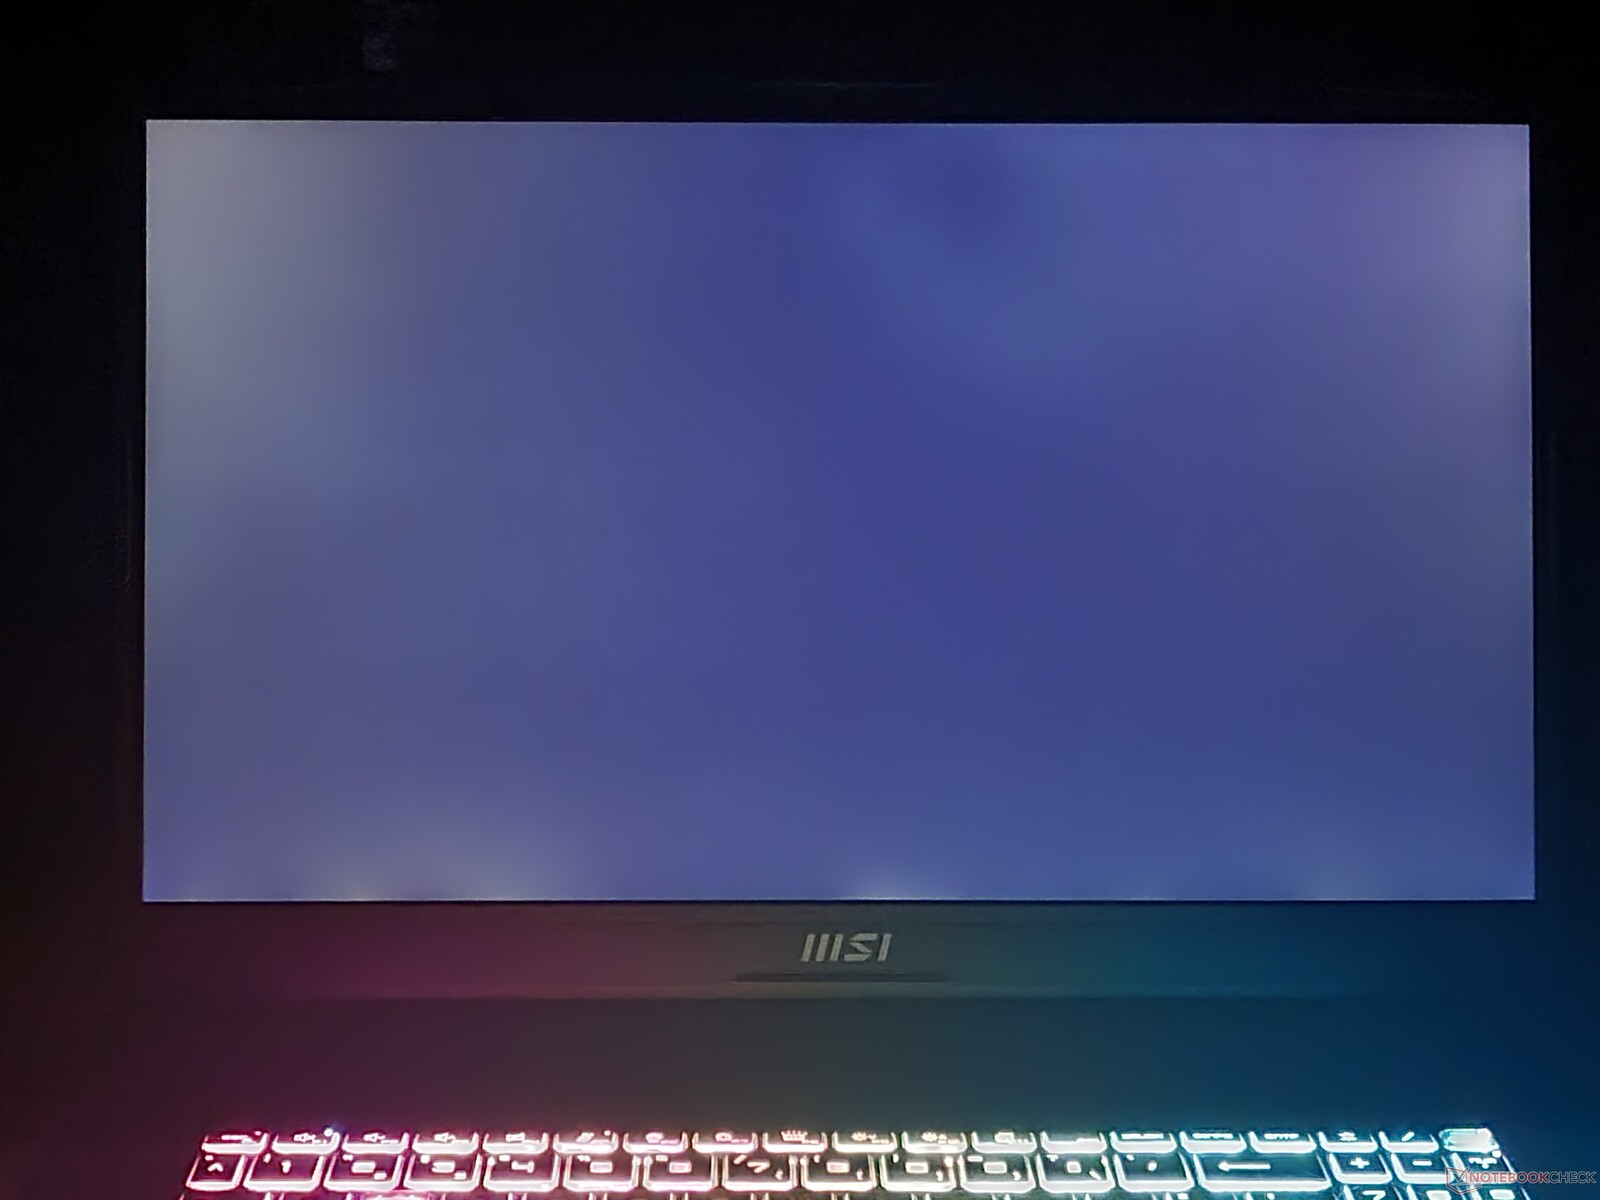
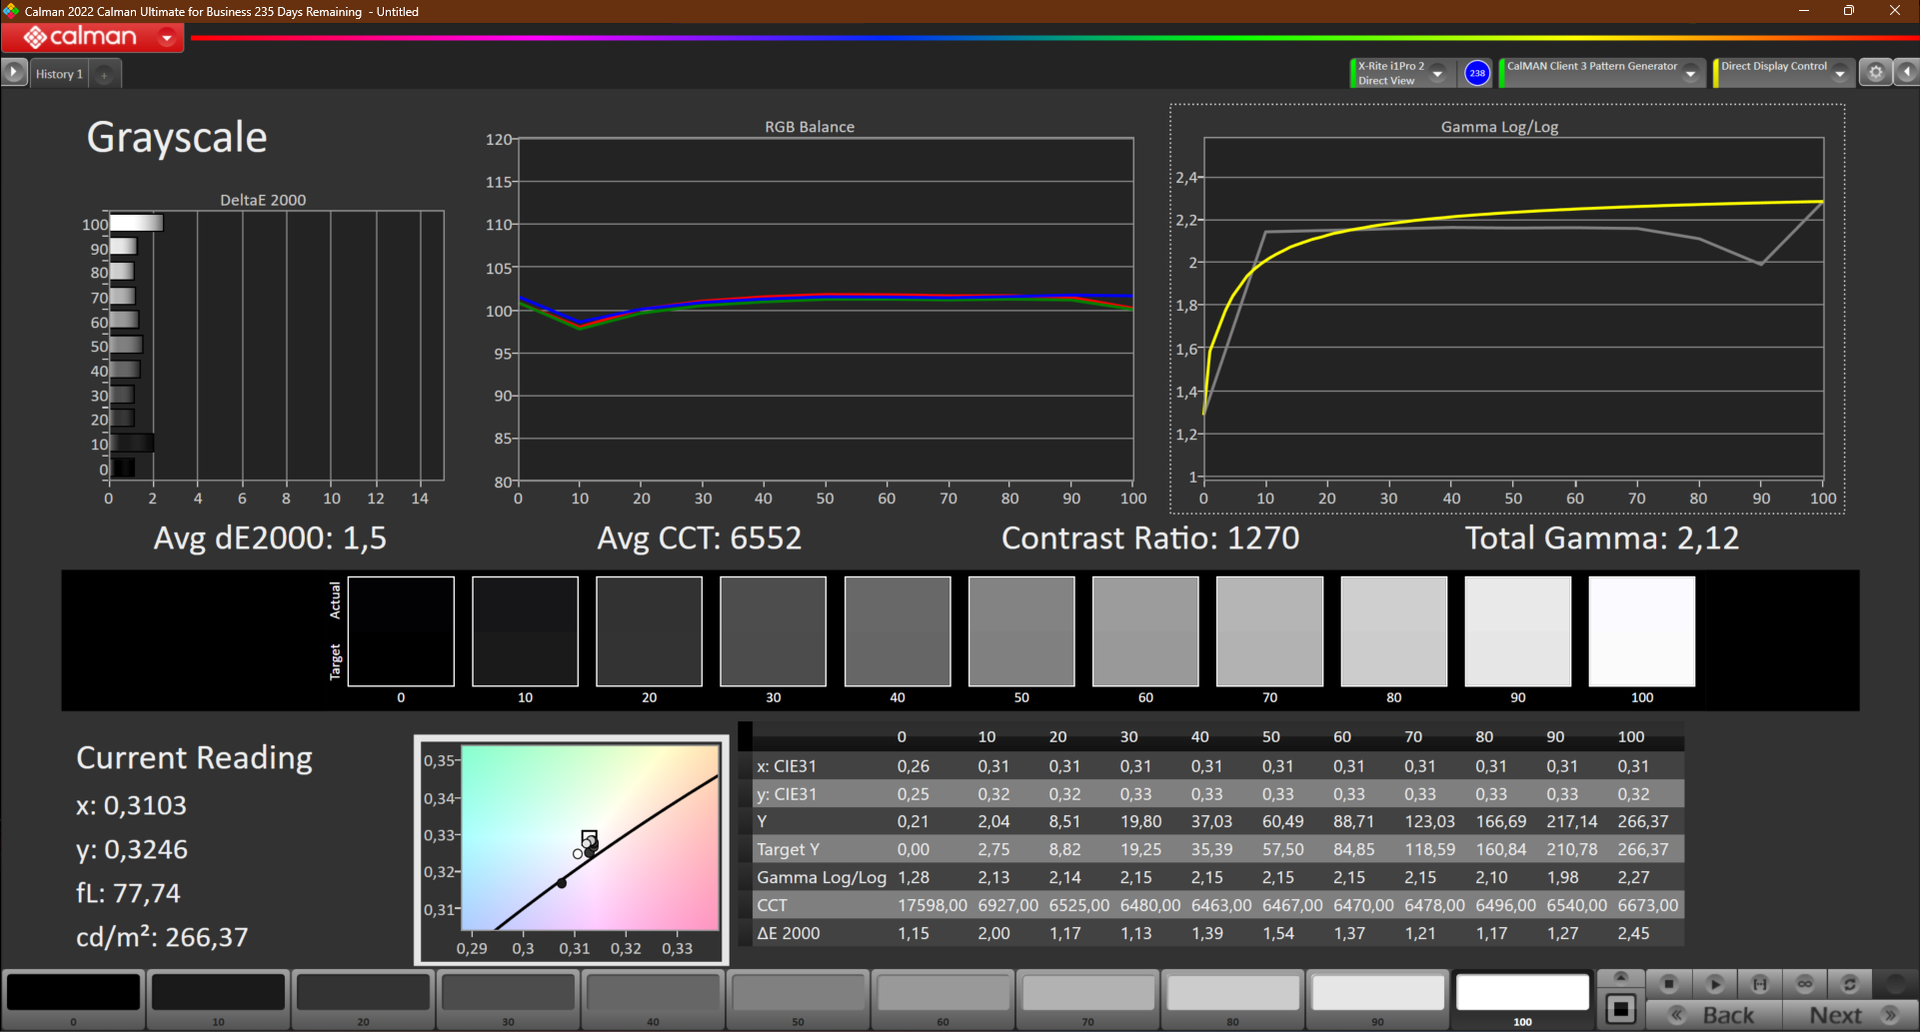
Infelizmente, a qualidade do painel da AUO deixa muito a desejar. Com cerca de 256 cd/m², o brilho da tela fica atrás da concorrência. Os tempos de resposta também são ruins para um laptop para jogos.
| |||||||||||||||||||||||||
iluminação: 93 %
iluminação com acumulador: 267 cd/m²
Contraste: 1271:1 (Preto: 0.21 cd/m²)
ΔE ColorChecker Calman: 4.7 | ∀{0.5-29.43 Ø4.71}
calibrated: 4.5
ΔE Greyscale Calman: 1.5 | ∀{0.09-98 Ø4.96}
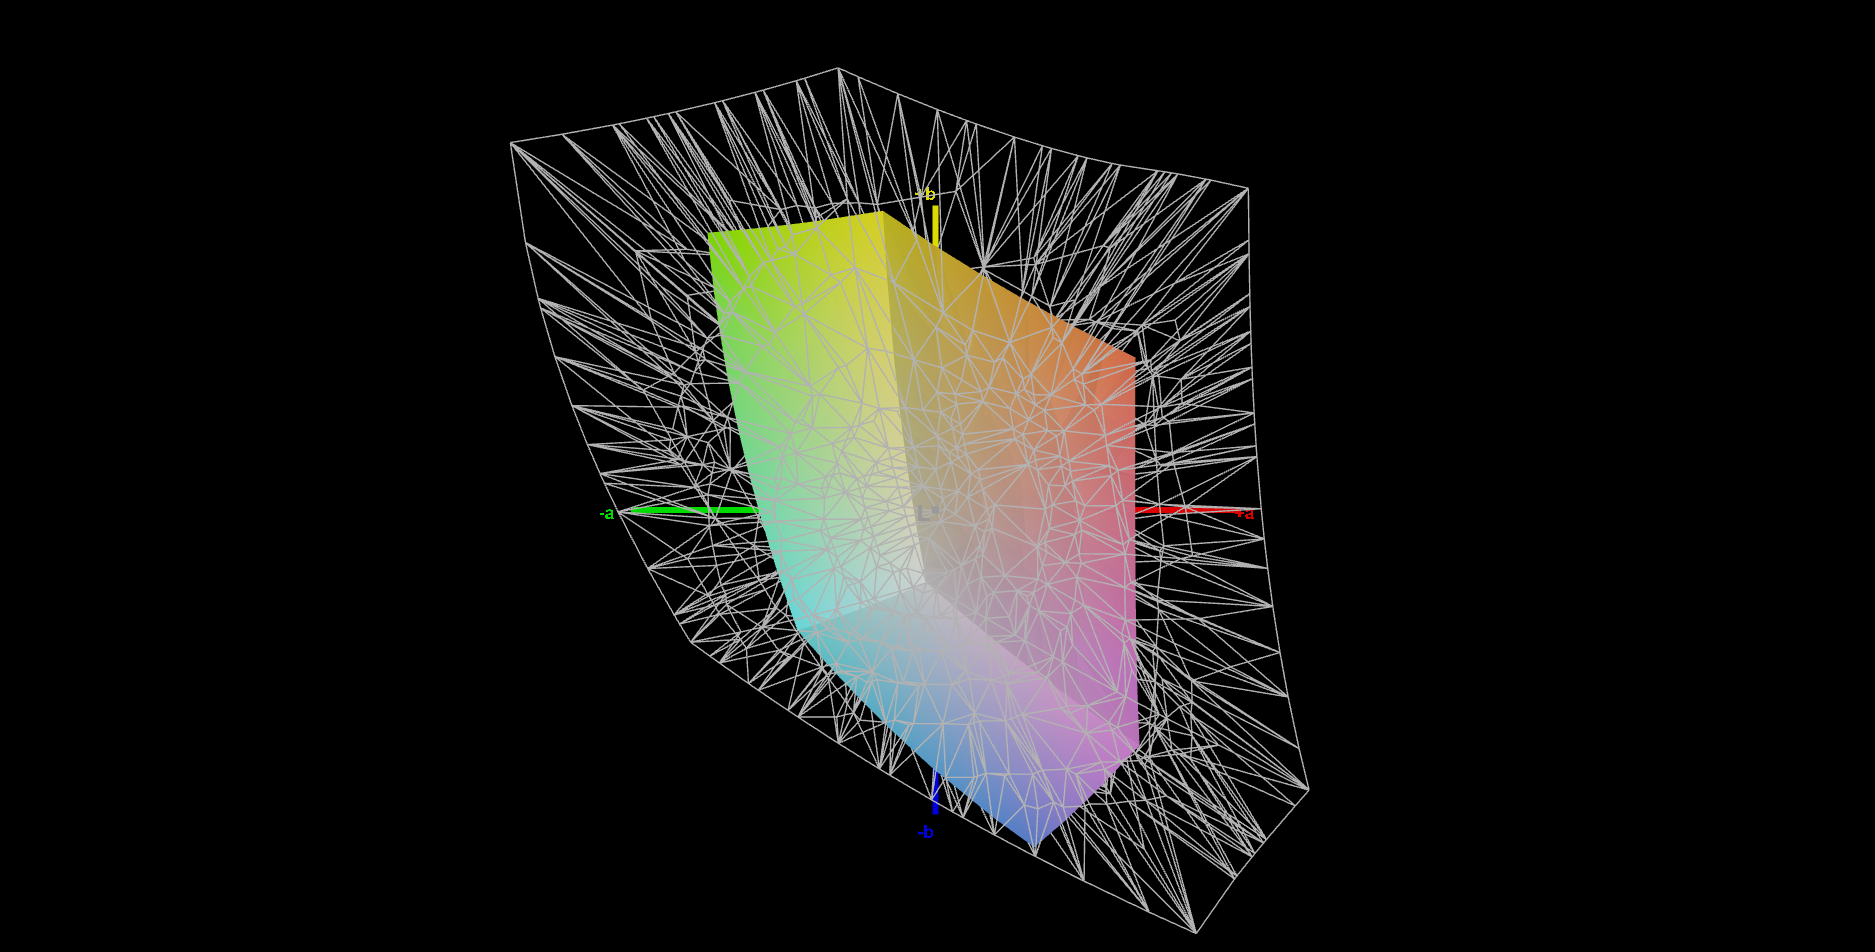
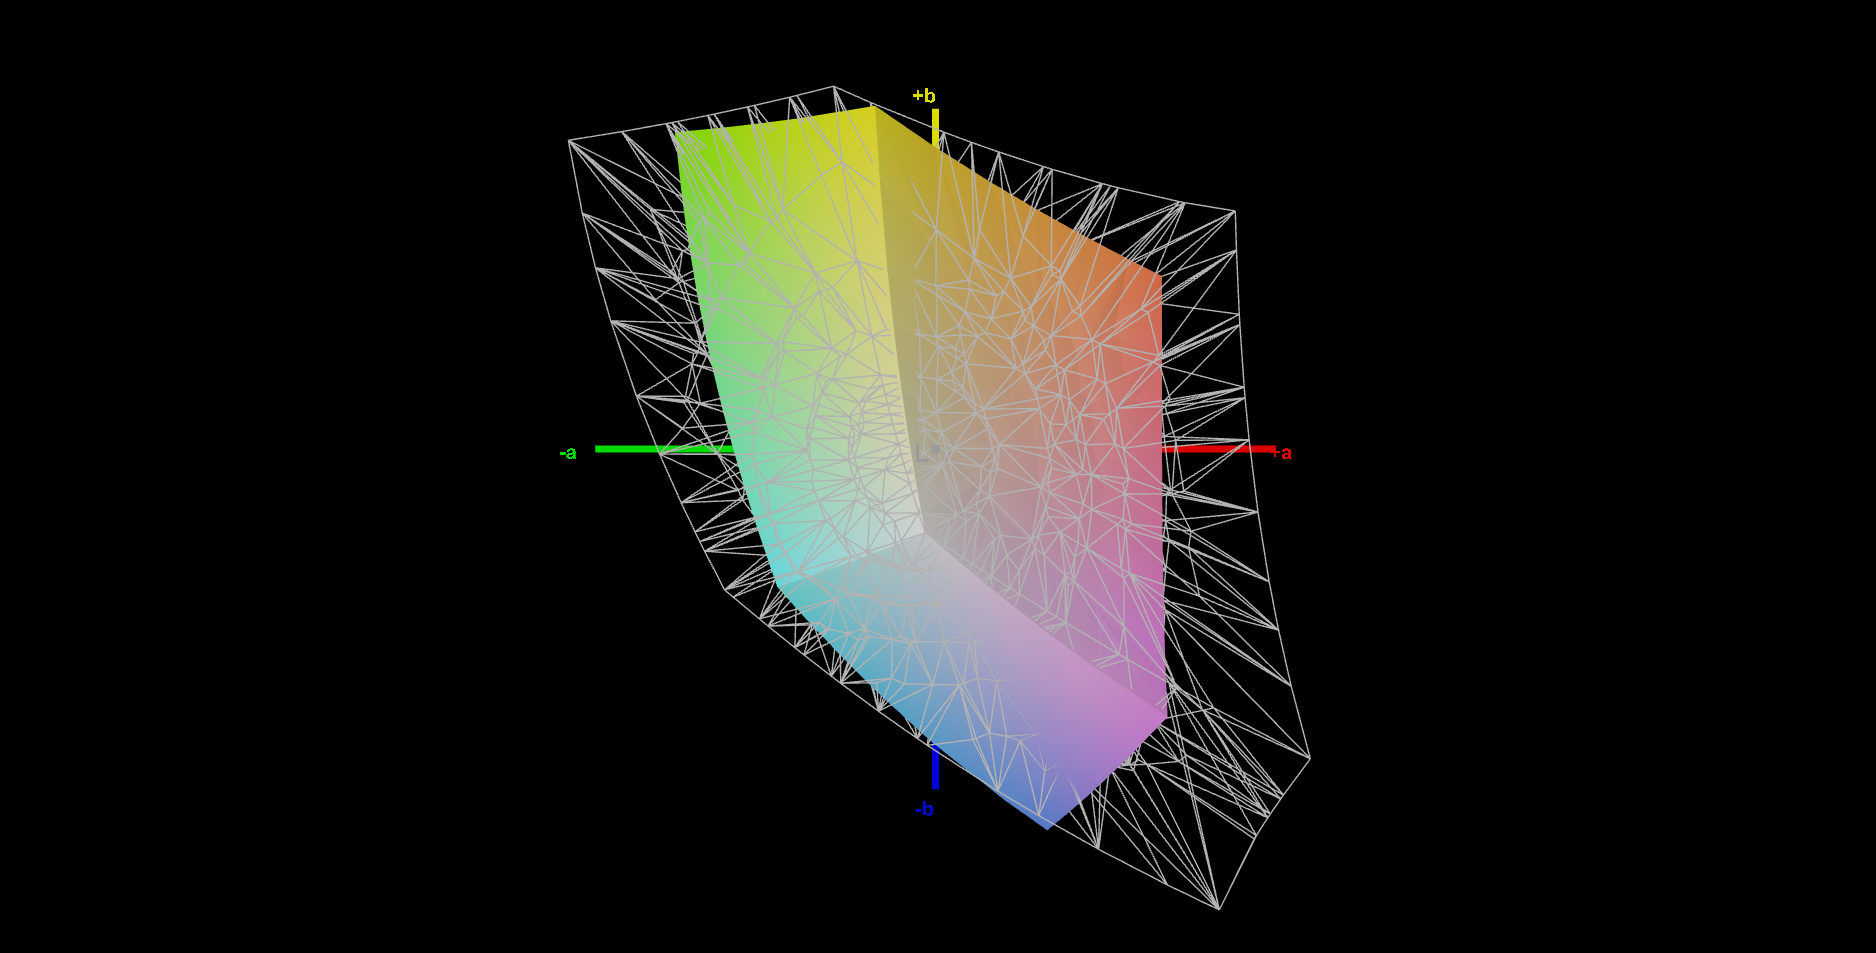
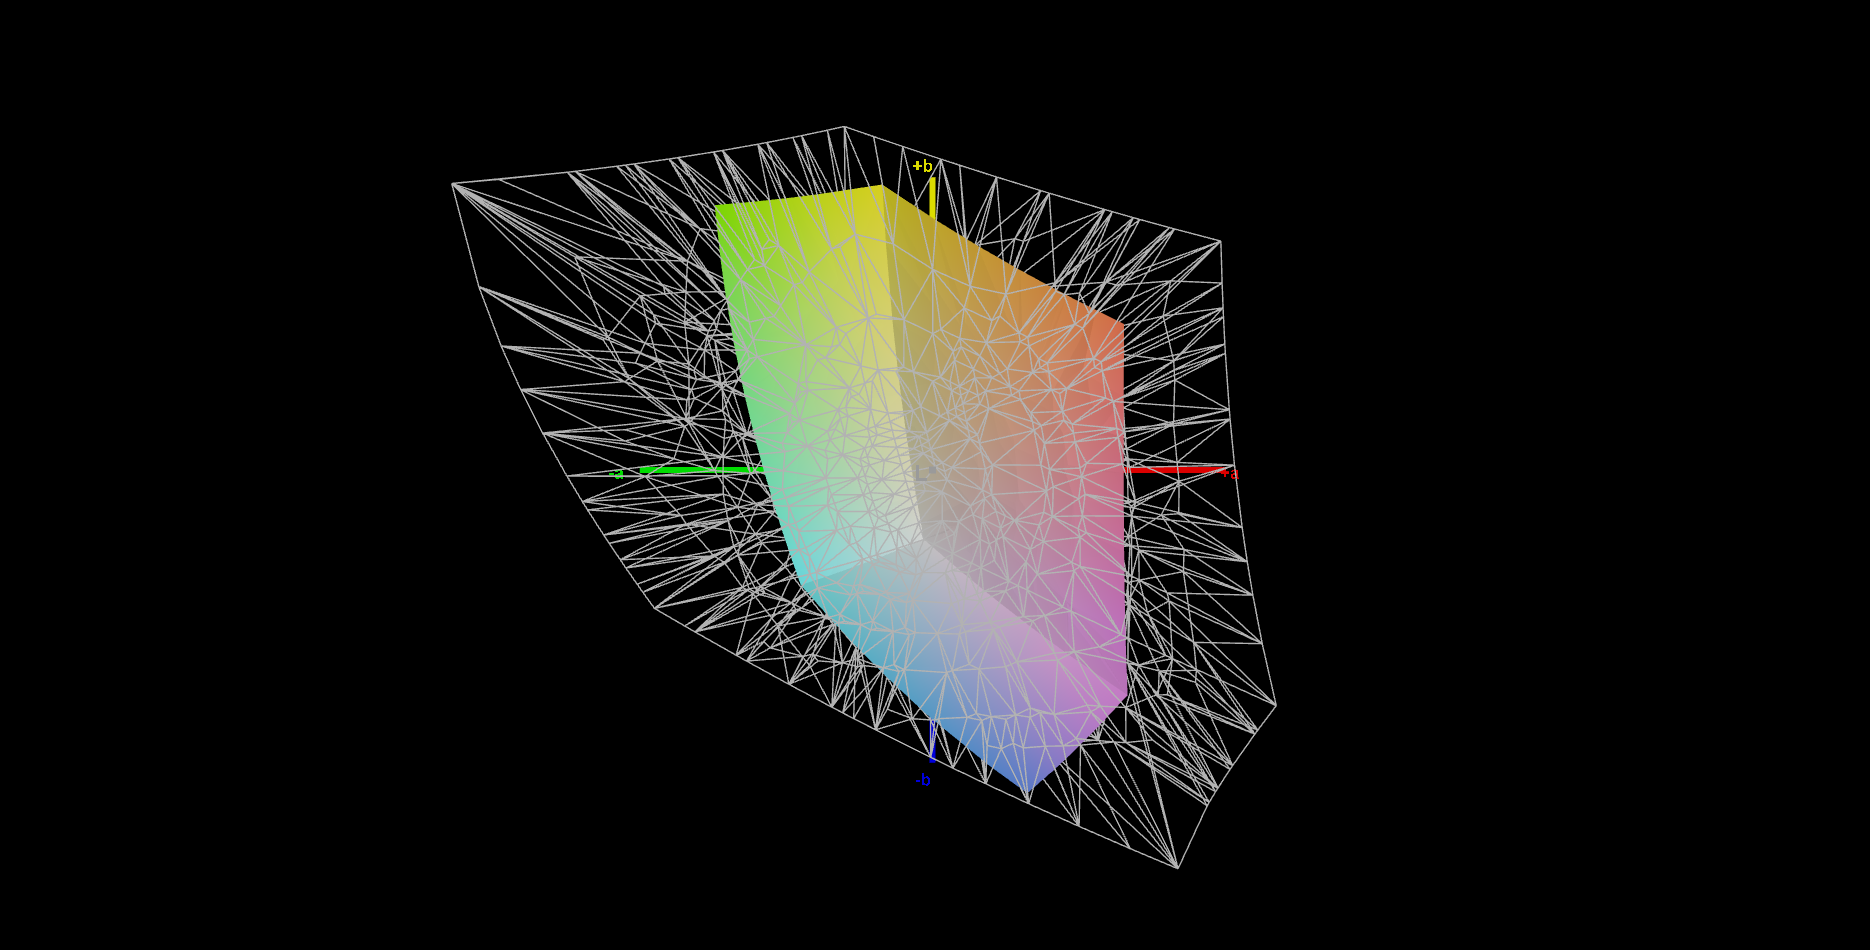
42.2% AdobeRGB 1998 (Argyll 3D)
61% sRGB (Argyll 3D)
40.8% Display P3 (Argyll 3D)
Gamma: 2.12
CCT: 6552 K
| MSI Katana 17 B13VFK B173HAN04.9, IPS LED, 1920x1080, 17.3" | MSI Titan GT77 HX 13VI B173ZAN06.C, Mini-LED, 3840x2160, 17.3" | MSI Pulse GL76 12UGK Sharp LQ173M1JW08, IPS, 1920x1080, 17.3" | Gigabyte G7 KE AU Optronics B173HAN05.1, IPS, 1920x1080, 17.3" | Asus ROG Strix Scar 17 SE G733CX-LL014W NE173QHM-NZ2, IPS, 2560x1440, 17.3" | Acer Predator Helios 300 (i7-12700H, RTX 3070 Ti) BOE0A1A, IPS, 2560x1440, 17.3" | |
|---|---|---|---|---|---|---|
| Display | 105% | 72% | 69% | 101% | 101% | |
| Display P3 Coverage (%) | 40.8 | 94.9 133% | 71.9 76% | 70.4 73% | 97.1 138% | 96.8 137% |
| sRGB Coverage (%) | 61 | 99.9 64% | 99.9 64% | 99.8 64% | 99.9 64% | 99.9 64% |
| AdobeRGB 1998 Coverage (%) | 42.2 | 92.4 119% | 73.7 75% | 71.7 70% | 84.8 101% | 84.8 101% |
| Response Times | -9% | 72% | 77% | 72% | 54% | |
| Response Time Grey 50% / Grey 80% * (ms) | 33 ? | 38.4 ? -16% | 4.6 ? 86% | 5 ? 85% | 5.7 ? 83% | 16.4 ? 50% |
| Response Time Black / White * (ms) | 26 ? | 26.6 ? -2% | 11.2 ? 57% | 8.3 ? 68% | 10.1 ? 61% | 11.2 ? 57% |
| PWM Frequency (Hz) | 2380 ? | |||||
| Screen | 52982% | -21% | 27% | 21% | 4% | |
| Brightness middle (cd/m²) | 267 | 606 127% | 337.7 26% | 307 15% | 320 20% | 366 37% |
| Brightness (cd/m²) | 256 | 602 135% | 331 29% | 301 18% | 303 18% | 340 33% |
| Brightness Distribution (%) | 93 | 93 0% | 82 -12% | 93 0% | 87 -6% | 85 -9% |
| Black Level * (cd/m²) | 0.21 | 0.0001 100% | 0.31 -48% | 0.2 5% | 0.3 -43% | 0.31 -48% |
| Contrast (:1) | 1271 | 6060000 476690% | 1089 -14% | 1535 21% | 1067 -16% | 1181 -7% |
| Colorchecker dE 2000 * | 4.7 | 4.8 -2% | 4.12 12% | 1.32 72% | 1.1 77% | 3.56 24% |
| Colorchecker dE 2000 max. * | 20.4 | 8.2 60% | 8.89 56% | 4.6 77% | 2.7 87% | 5.66 72% |
| Colorchecker dE 2000 calibrated * | 4.5 | 1.8 60% | 0.98 78% | 1.03 77% | 3.31 26% | |
| Greyscale dE 2000 * | 1.5 | 6.5 -333% | 6.3 -320% | 2.1 -40% | 1.1 27% | 2.84 -89% |
| Gamma | 2.12 104% | 2.63 84% | 2.48 89% | 2.247 98% | 2.13 103% | 2.29 96% |
| CCT | 6552 99% | 6596 99% | 6542 99% | 6815 95% | 6599 98% | 6835 95% |
| Média Total (Programa/Configurações) | 17693% /
34081% | 41% /
12% | 58% /
43% | 65% /
47% | 53% /
32% |
* ... menor é melhor
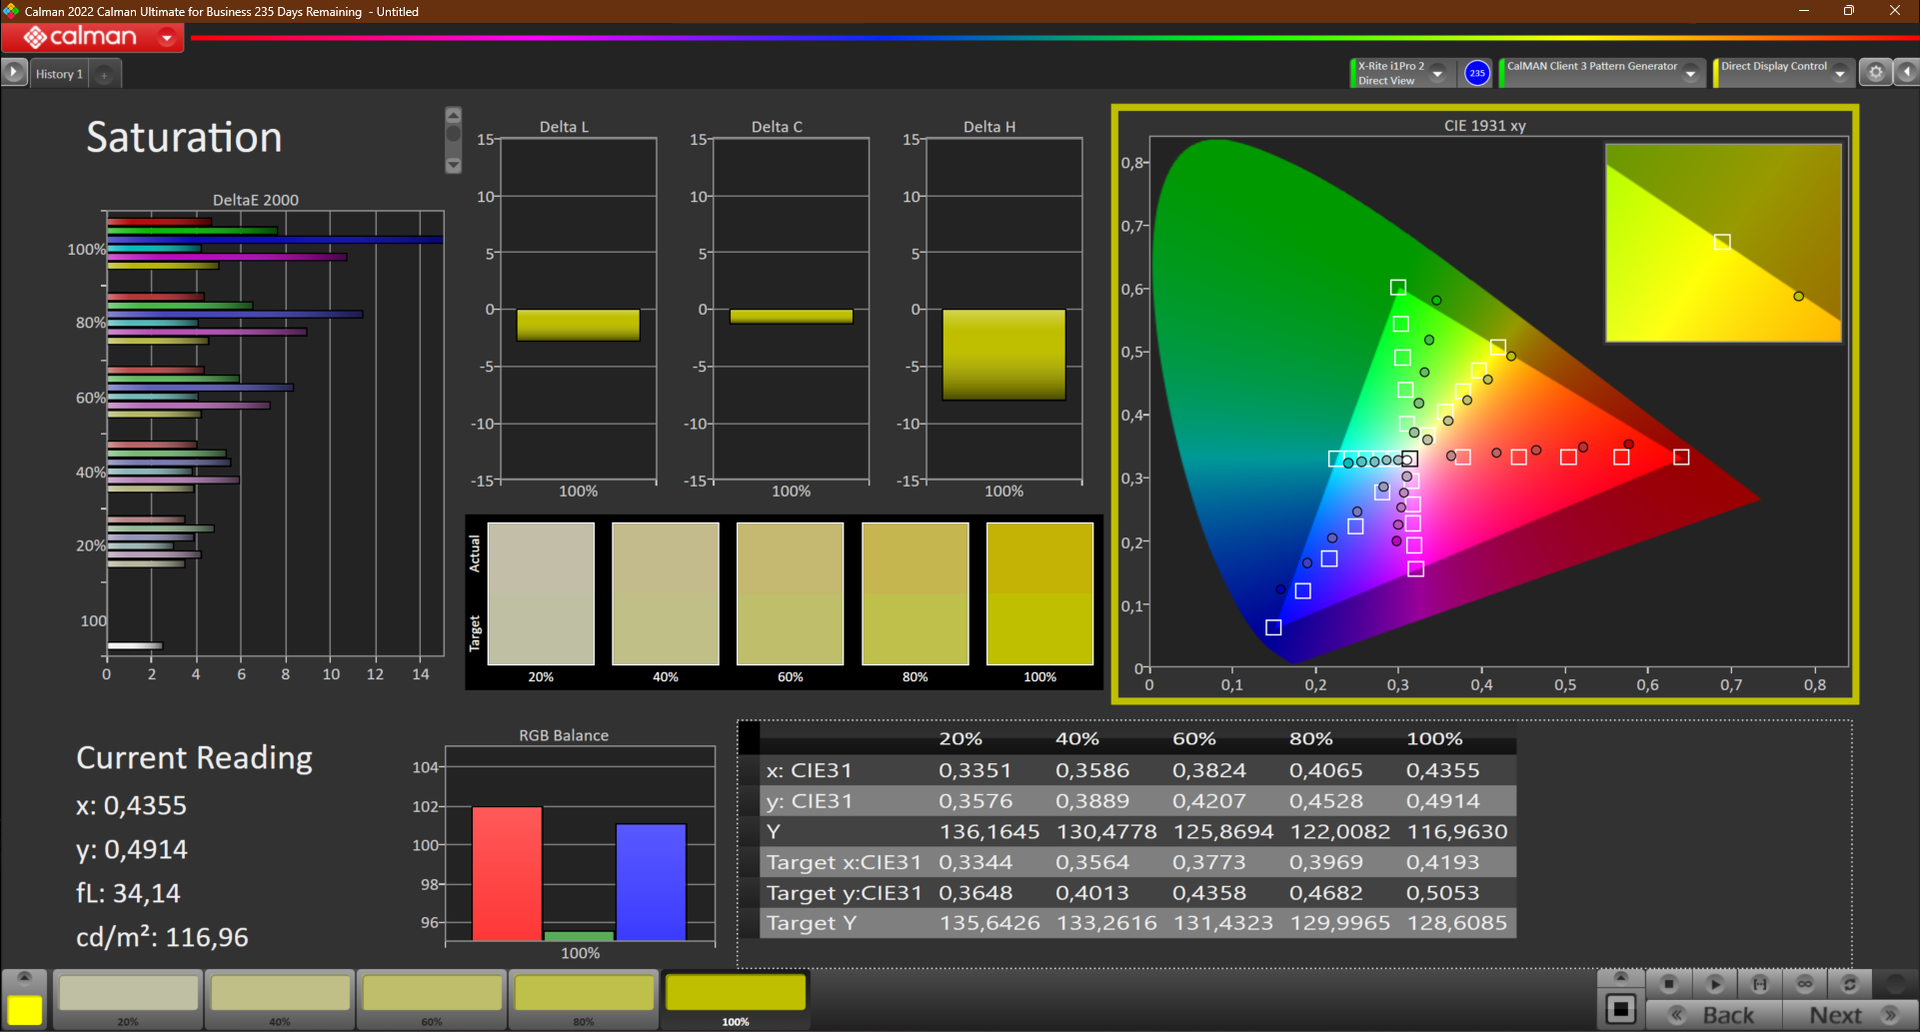
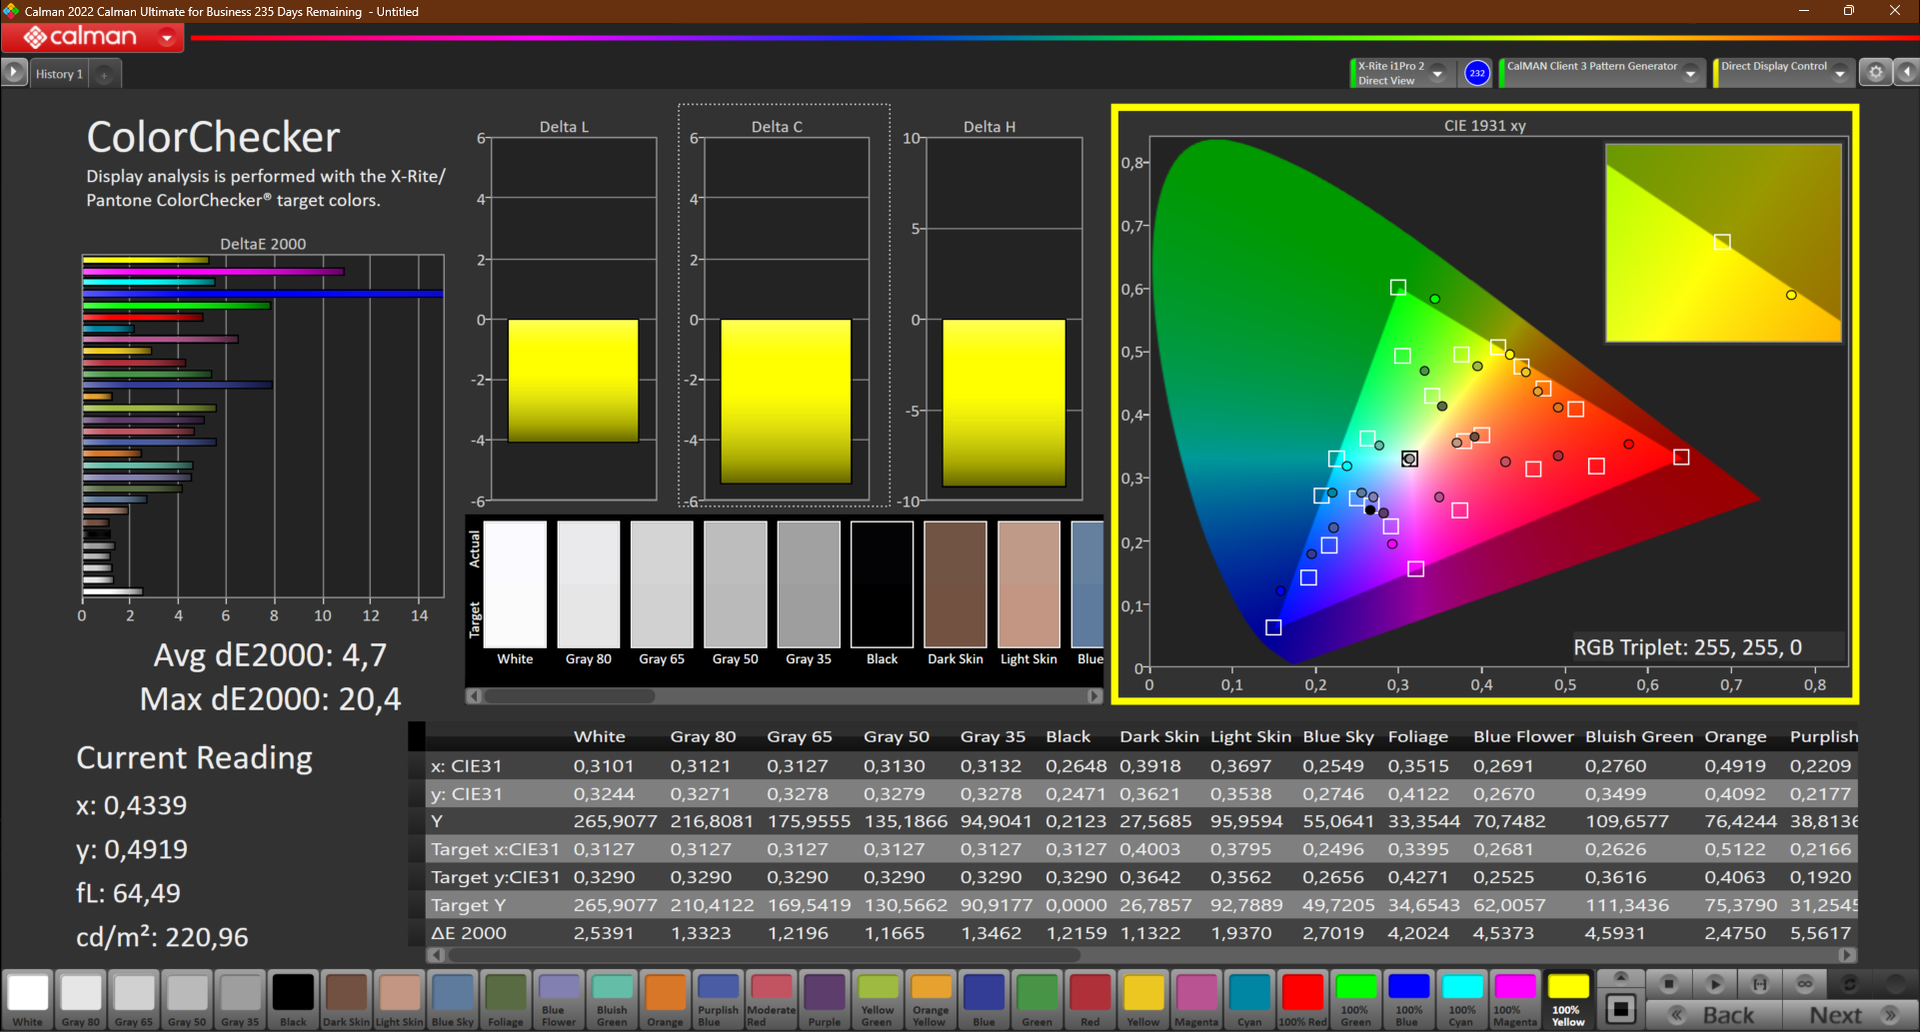
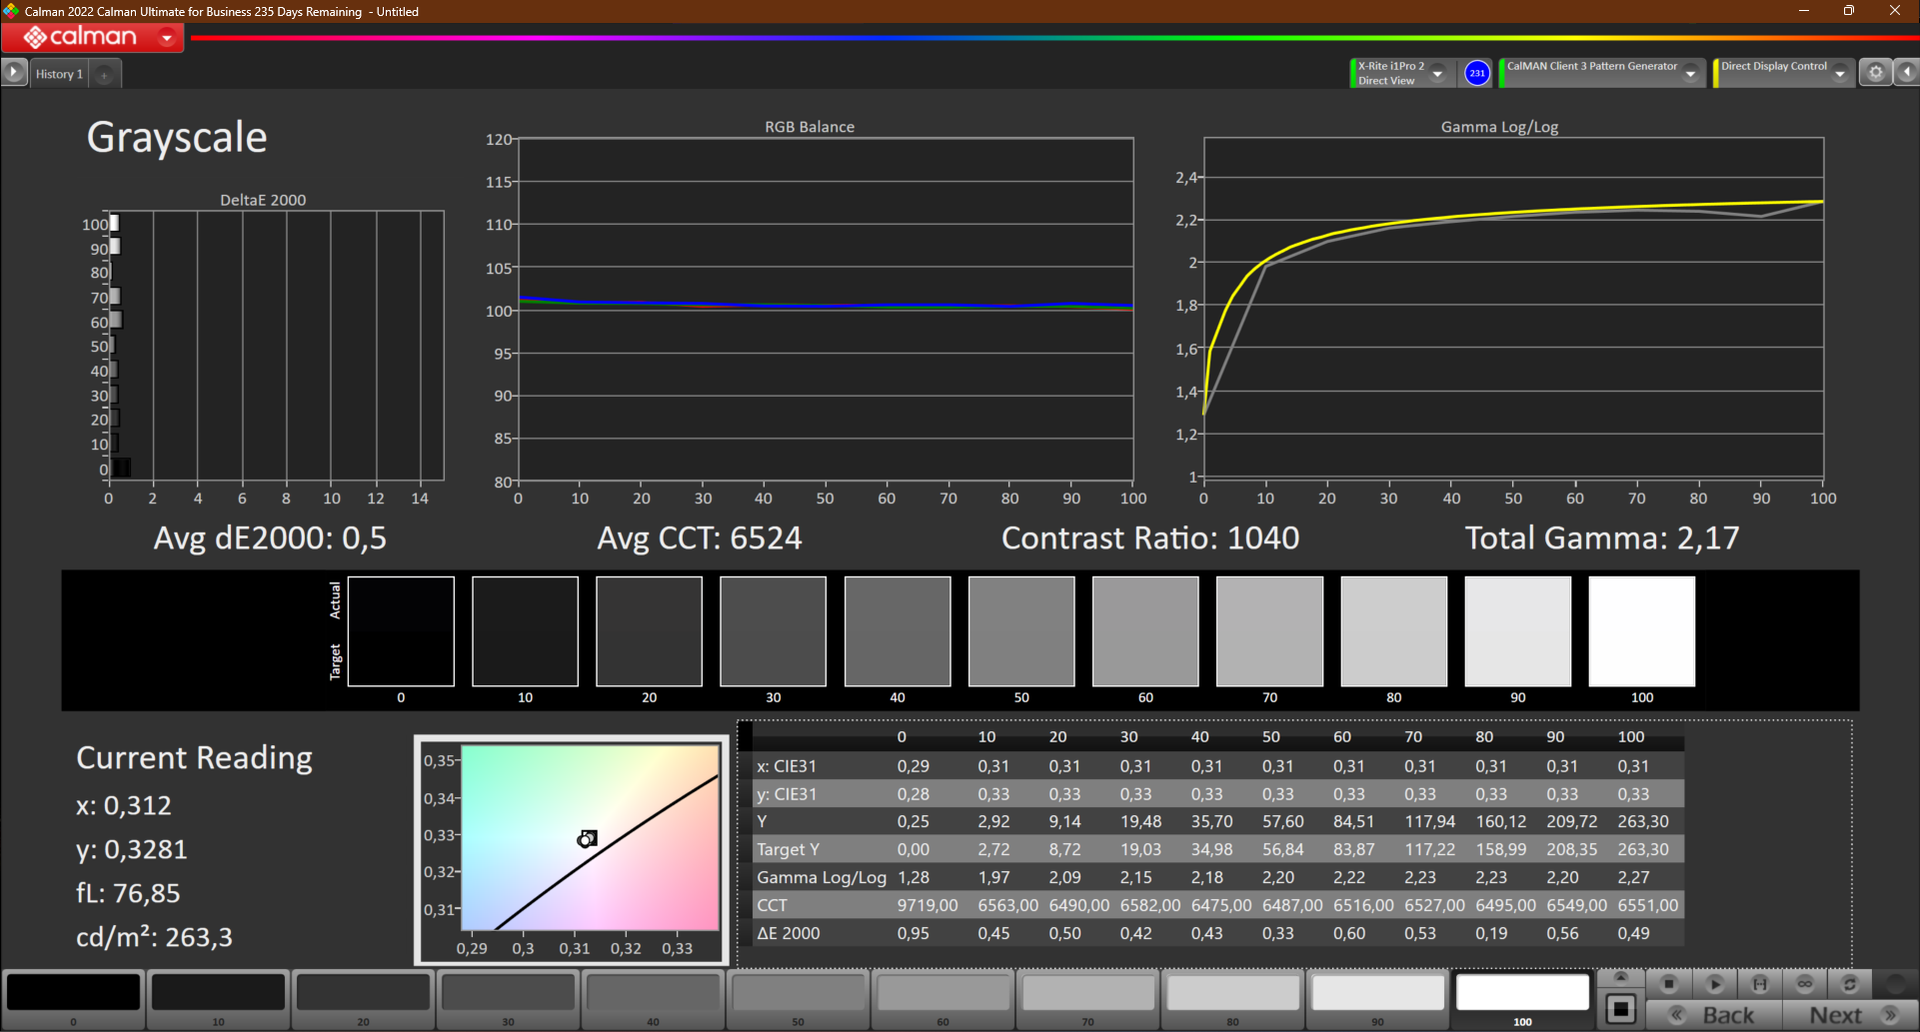
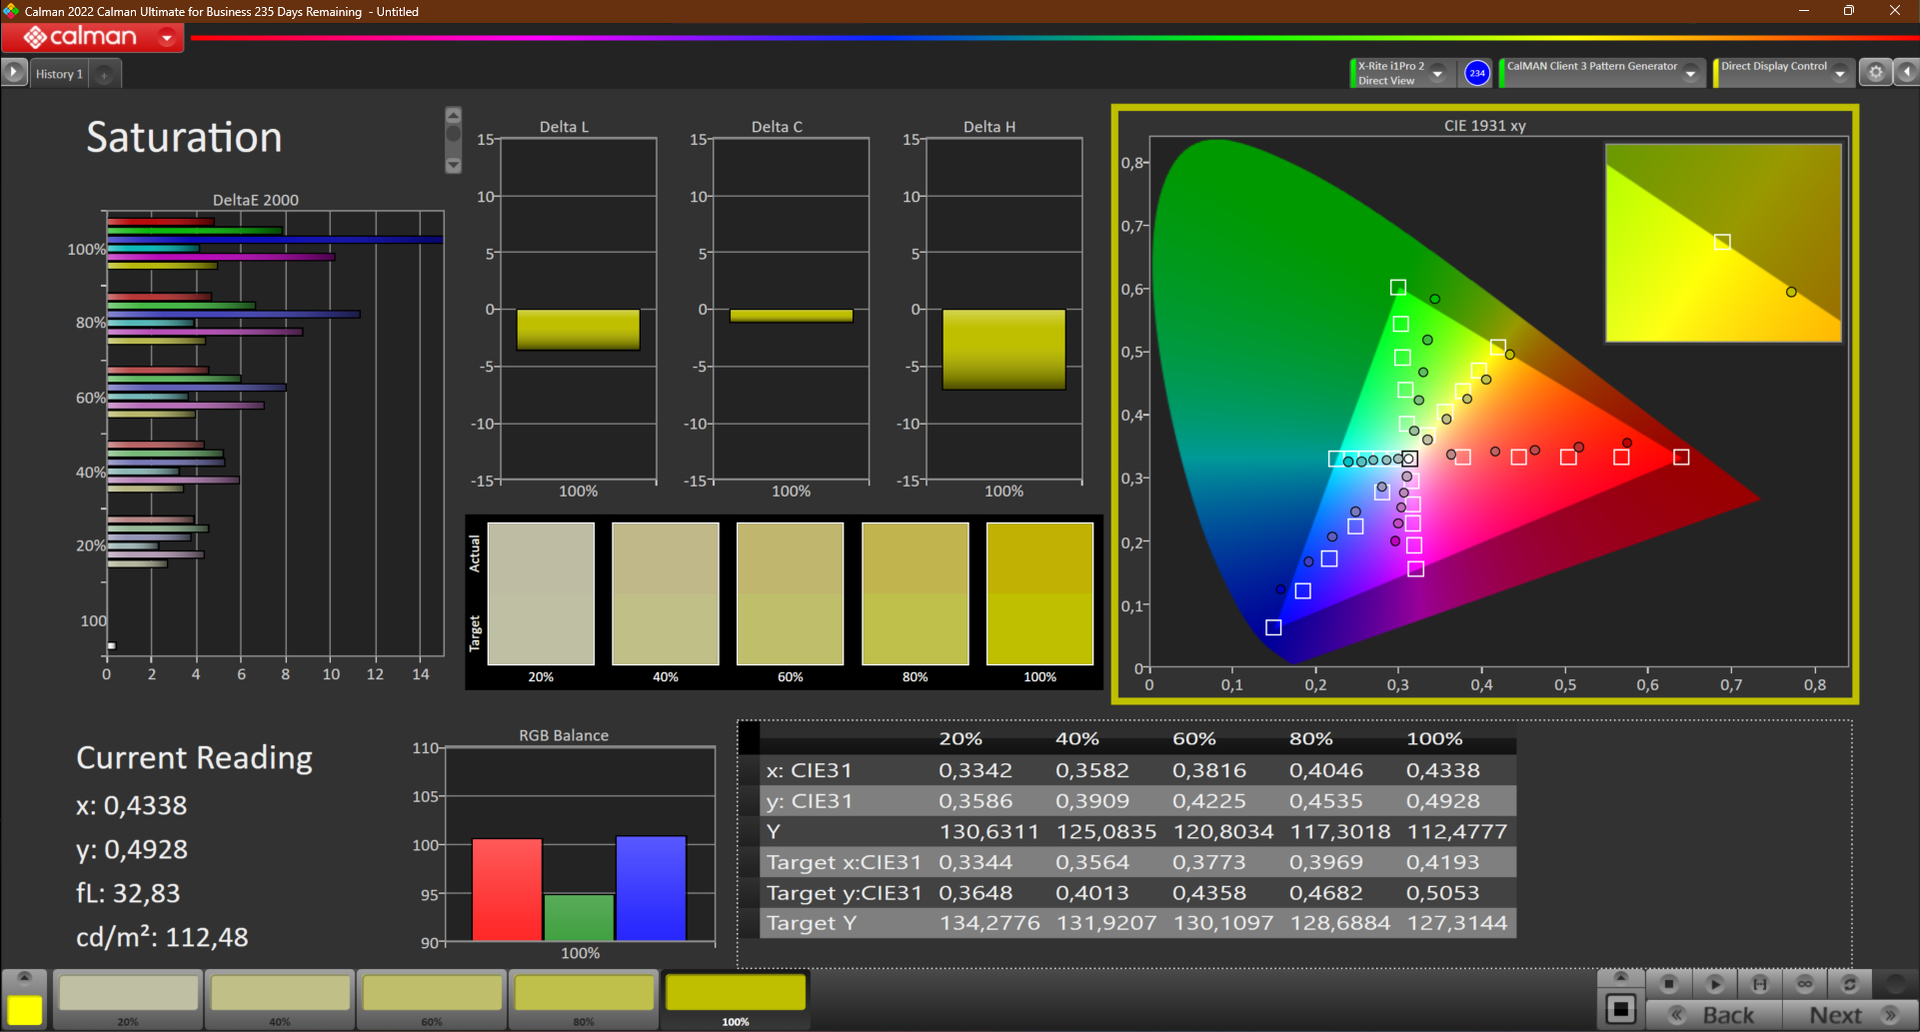
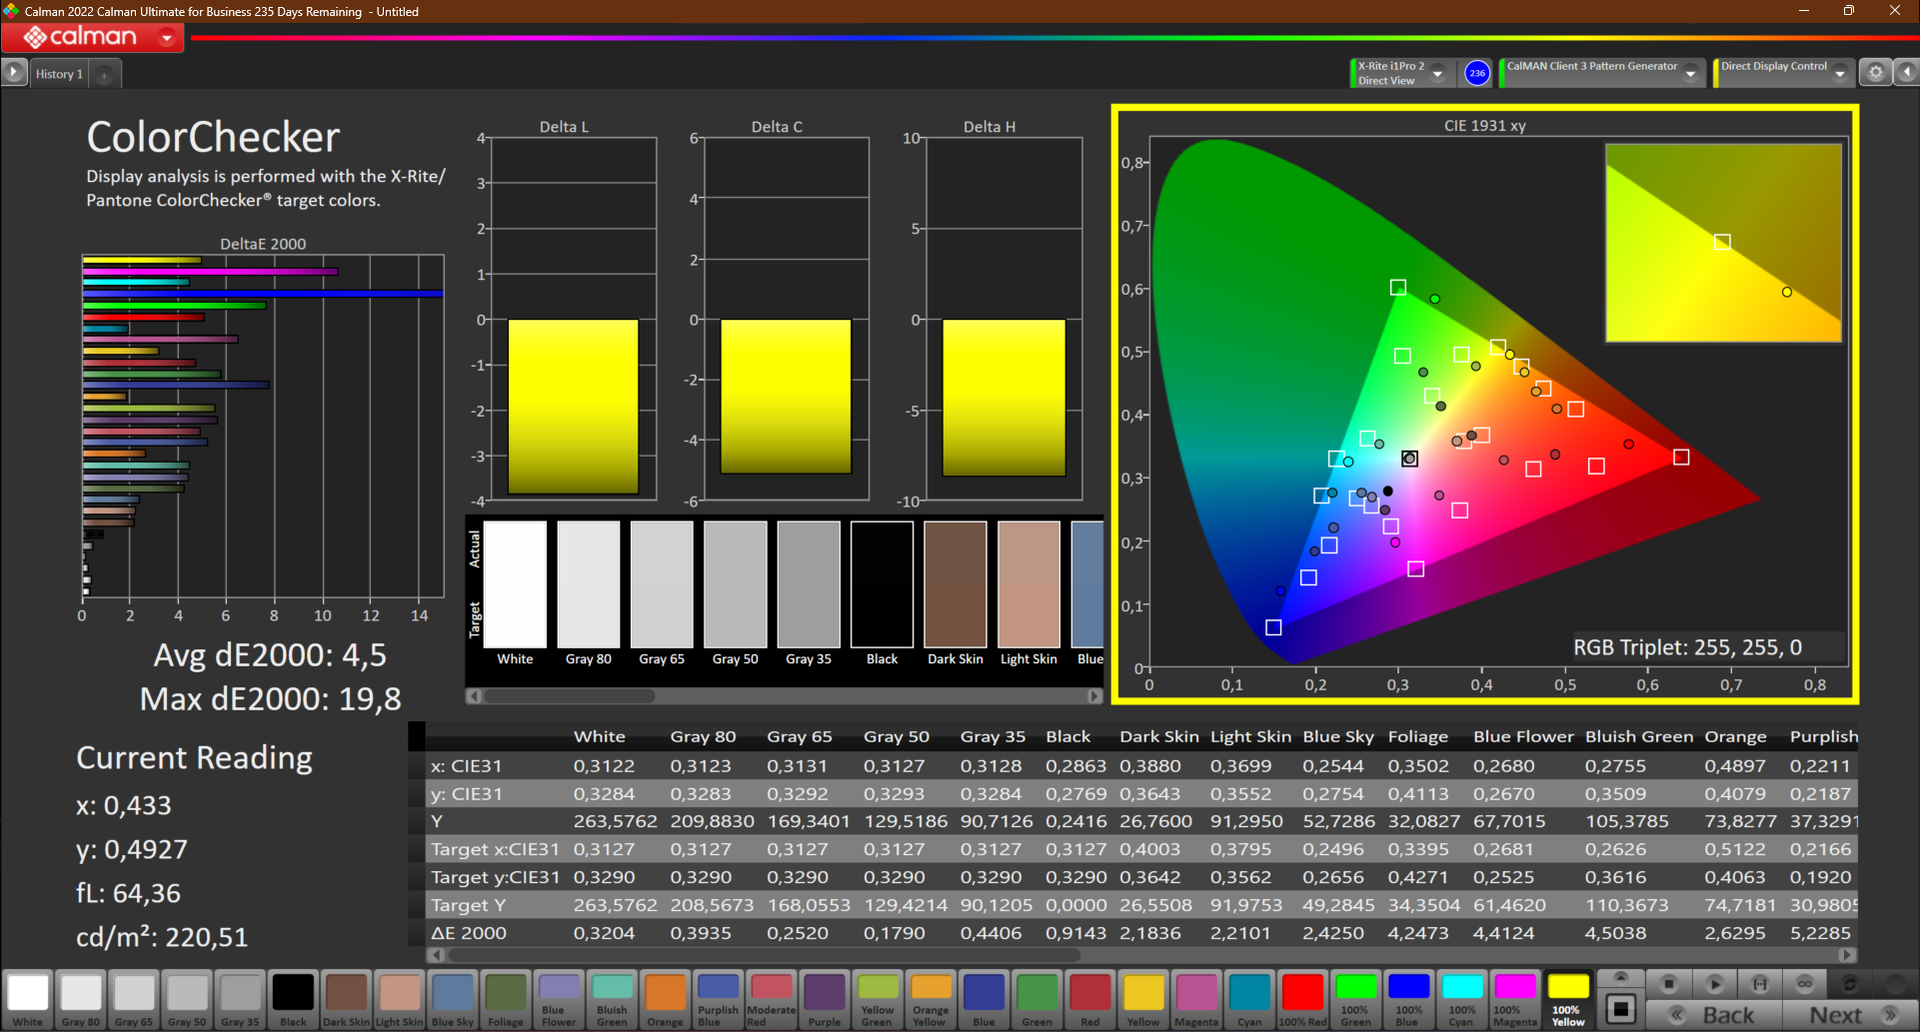
Na área de representação de cores, a impressão menos que positiva da tela continua. Mesmo após a calibração, o painel está muito longe de exibir cores precisas. Após calibrá-lo com i1Profiler e X-Rite i1Pro 2, o DeltaE-Wert caiu apenas minimamente de 4,7 para 4,5.
A causa para isto pode ser a falta de cobertura do espaço de cores. Atualmente, apenas 61% do espaço de cor sRGB é um resultado insatisfatório - especialmente para um laptop voltado para o consumo de mídia.
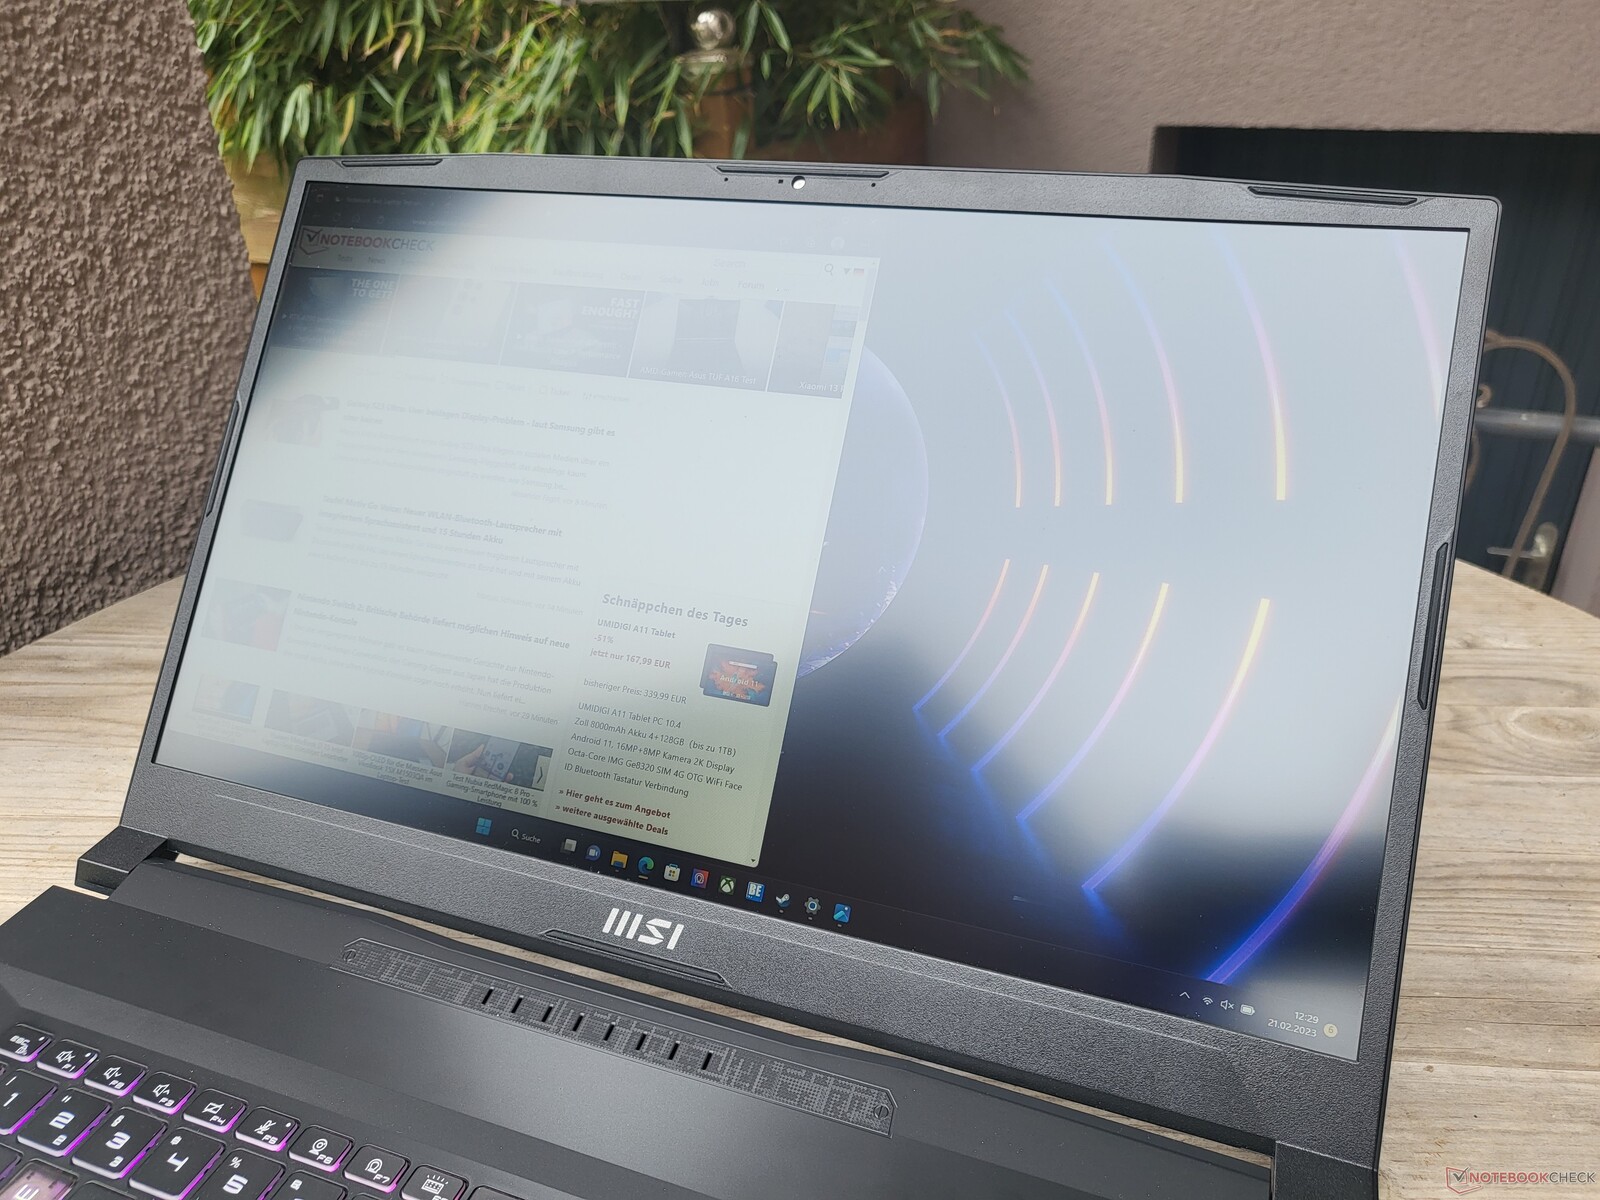
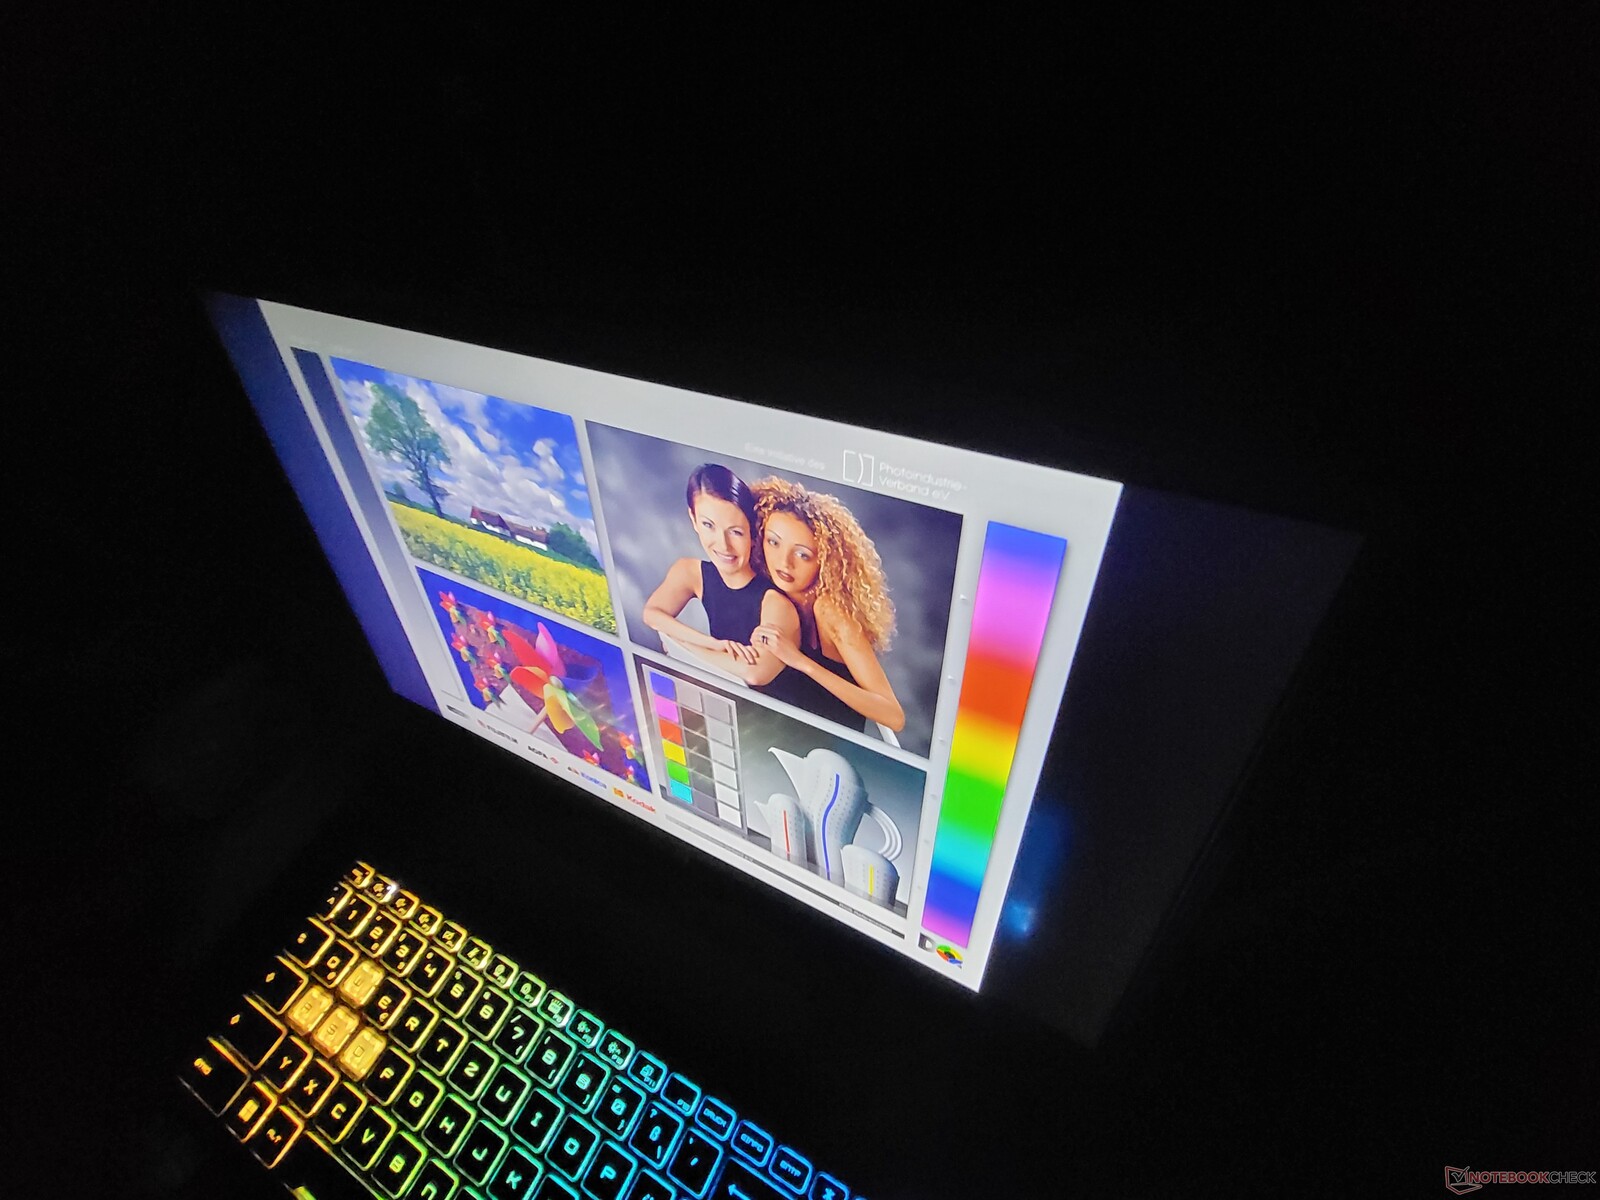
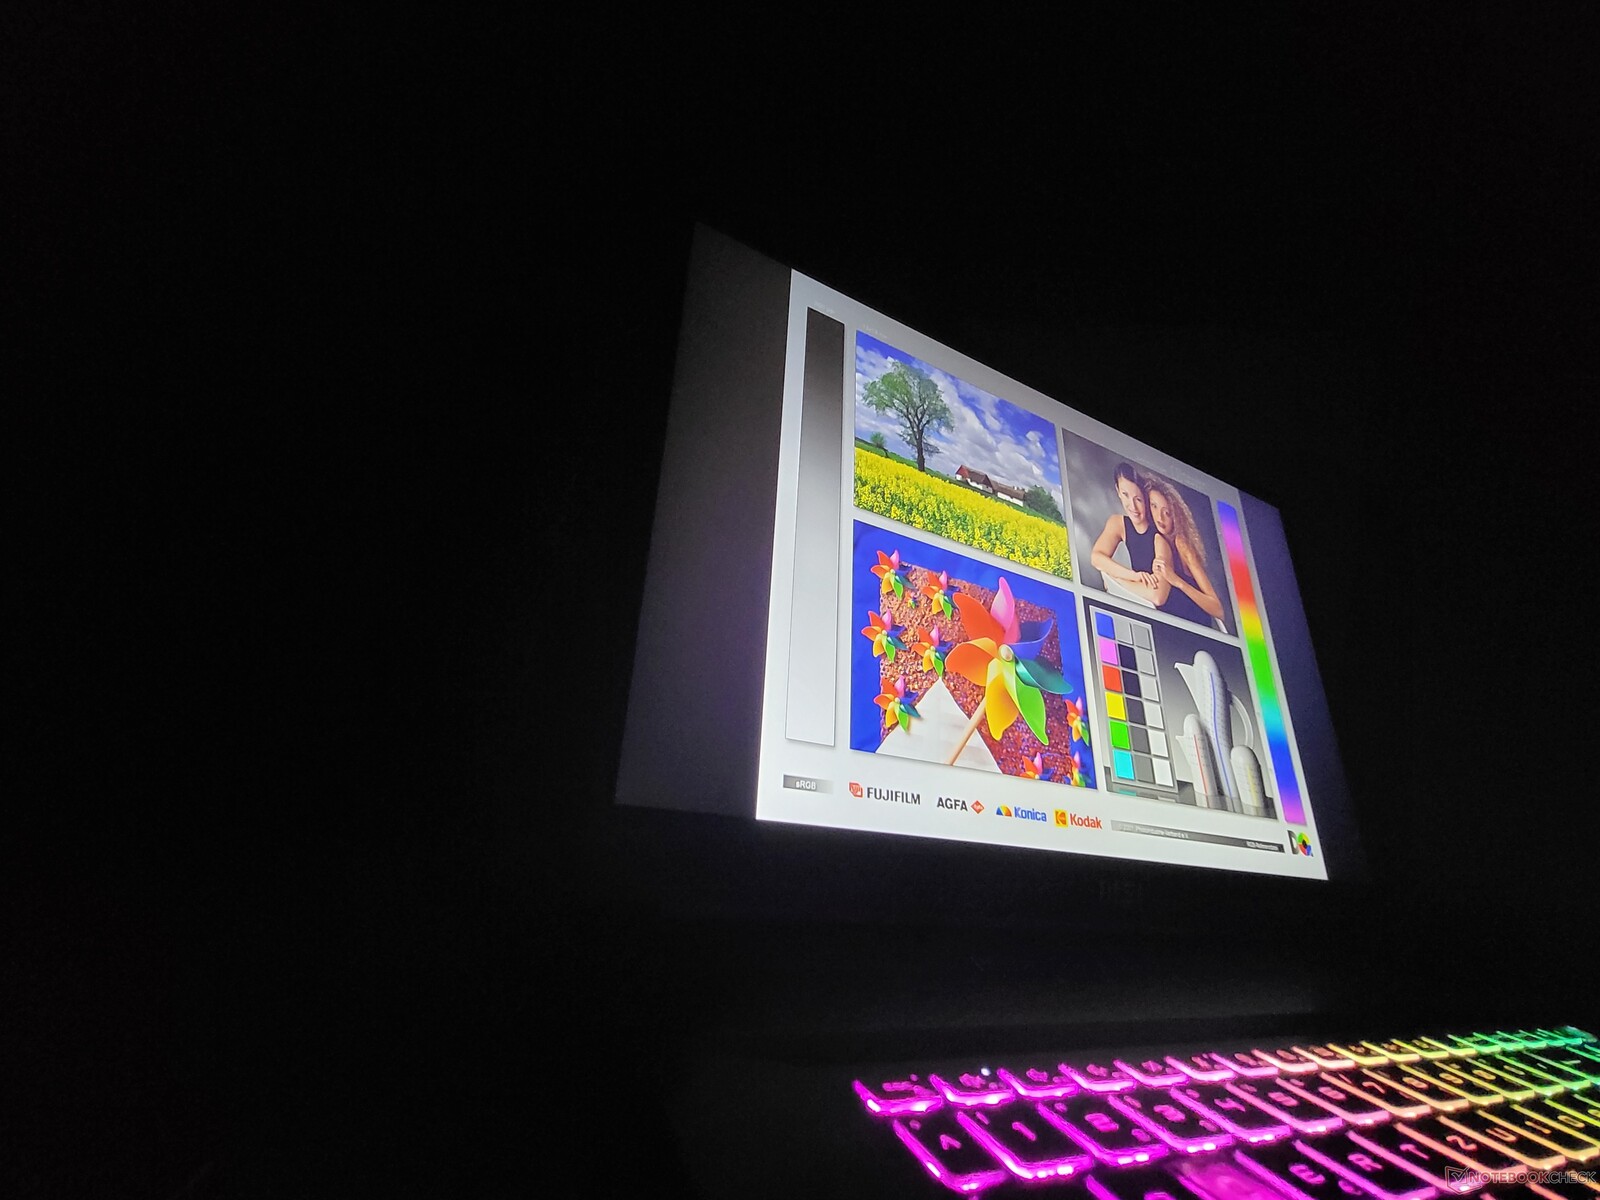
Ao ar livre, a tela MSI Katana 17 é praticamente utilizável desde que o dispositivo seja utilizado à sombra.
Exibir tempos de resposta
| ↔ Tempo de resposta preto para branco | ||
|---|---|---|
| 26 ms ... ascensão ↗ e queda ↘ combinadas | ↗ 13 ms ascensão | 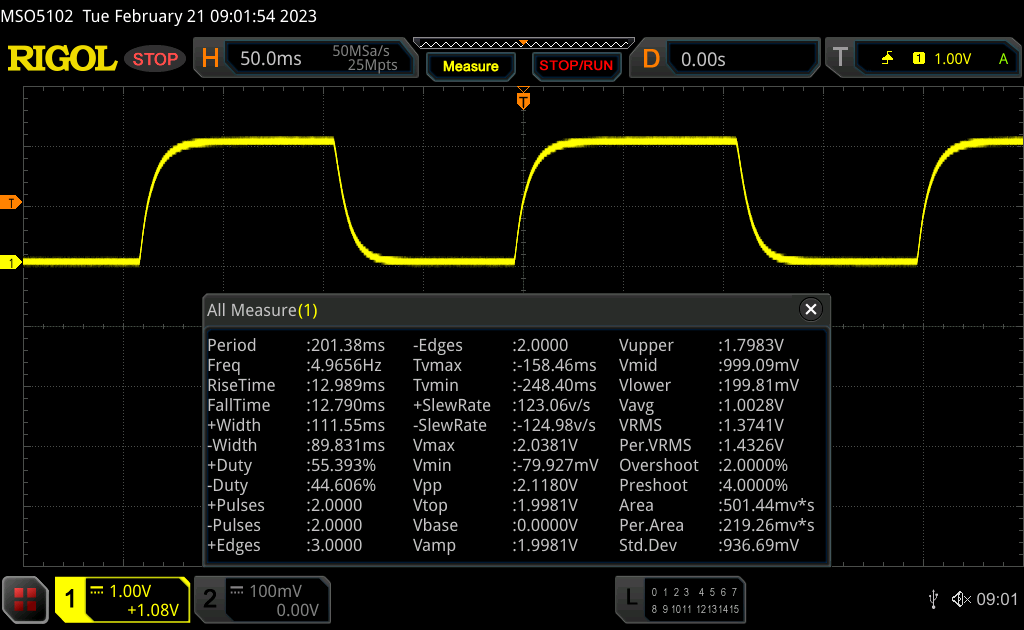 |
| ↘ 13 ms queda | ||
| A tela mostra taxas de resposta relativamente lentas em nossos testes e pode ser muito lenta para os jogadores. Em comparação, todos os dispositivos testados variam de 0.1 (mínimo) a 240 (máximo) ms. » 63 % de todos os dispositivos são melhores. Isso significa que o tempo de resposta medido é pior que a média de todos os dispositivos testados (19.8 ms). | ||
| ↔ Tempo de resposta 50% cinza a 80% cinza | ||
| 33 ms ... ascensão ↗ e queda ↘ combinadas | ↗ 16 ms ascensão | 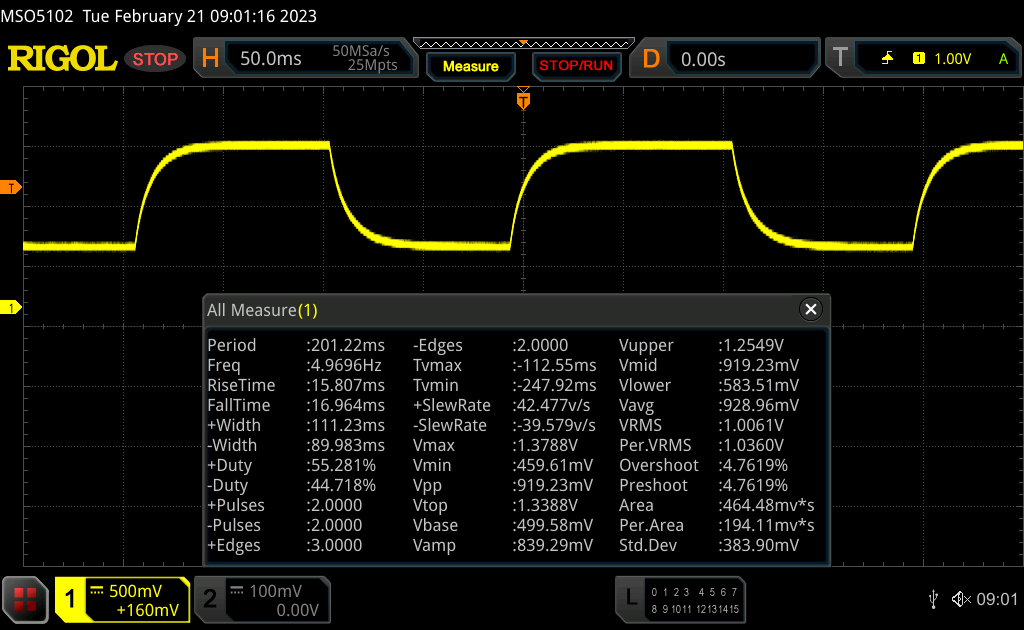 |
| ↘ 17 ms queda | ||
| A tela mostra taxas de resposta lentas em nossos testes e será insatisfatória para os jogadores. Em comparação, todos os dispositivos testados variam de 0.165 (mínimo) a 636 (máximo) ms. » 45 % de todos os dispositivos são melhores. Isso significa que o tempo de resposta medido é semelhante à média de todos os dispositivos testados (31 ms). | ||
Cintilação da tela / PWM (modulação por largura de pulso)
| Tela tremeluzindo / PWM não detectado | 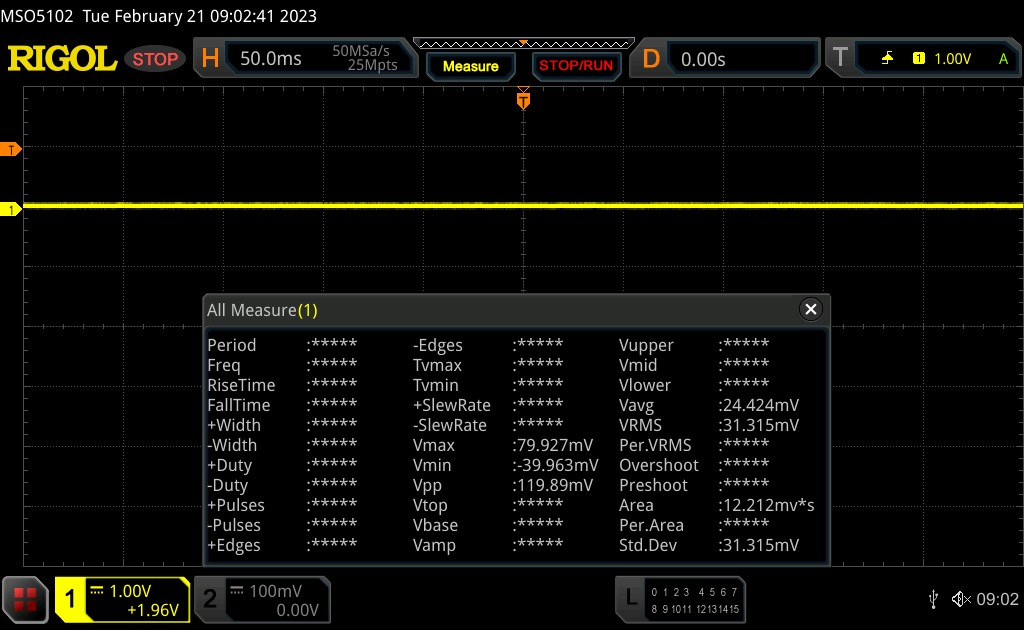 | ||
[pwm_comparison] Em comparação: 52 % de todos os dispositivos testados não usam PWM para escurecer a tela. Se PWM foi detectado, uma média de 7754 (mínimo: 5 - máximo: 343500) Hz foi medida. | |||
Desempenho: A estréia da Nvidia GeForce RTX 4060
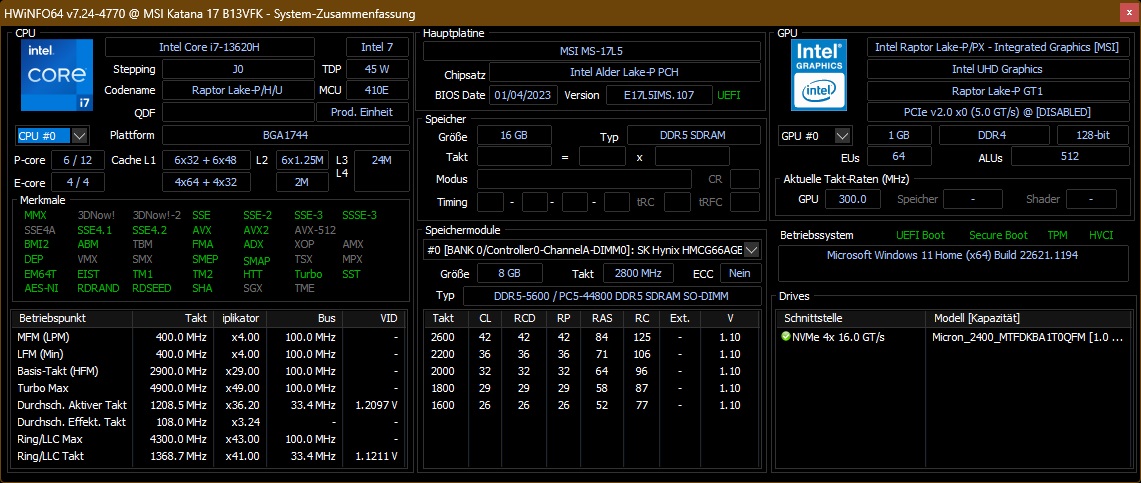
Na Alemanha, a MSI vende o Katana 17 B13V em duas configurações. Ambos os dispositivos têm Intel Core i7-13620H, Nvidia GeForce RTX 4060 assim como 16 GB de DDR5 5200 RAM em comum. A única diferença é: Um modelo tem um SSD de 512 GB, e o outro tem uma capacidade de SSD de 1 TB.
Condições de teste
No software "MSI Center" da MSI, há quatro modos de desempenho: Máximo desempenho, modos balanceado e silencioso, bem como Super Bateria. Além disso, há também um modo Automático. Executamos todos os nossos testes usando o modo Max Performance, no qual o consumo da CPU flutuou entre 70 e 80 watts. As reservas de desempenho são similares no modo Equilibrado, que foi usado para o teste de bateria. Nos modos Silencioso e Super Bateria, a CPU é limitada a 30 e 15 watts, respectivamente.
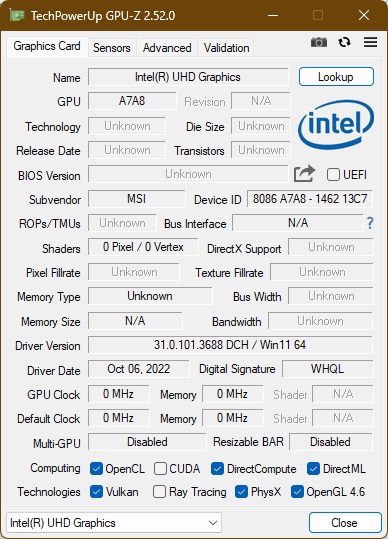
Graças ao Optimus Advanced, é possível mudar o chip gráfico para operação puramente Nvidia e desativar a GPU Intel. Testamos o dispositivo usando o modo Optimus normal.
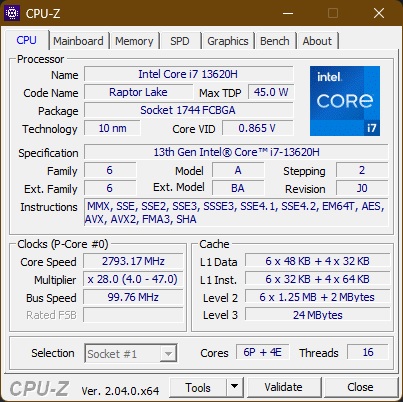
Processador
OIntel Core i7-13620Hé o modelo de nível básico i7 da série Raptor Lake H. Ele tem todos os seis núcleos de desempenho, mas apenas quatro dos núcleos E menores. Como CPU H, ele tem um TDP típico de 45 watts, embora este possa diferir muito, dependendo do laptop. Todos os dez núcleos (16 fios) têm uma taxa de clock que varia de 1,8 a 4,9 GHz. Você pode encontrar comparações adicionais com outros processadores em nosso Lista de CPU.
A MSI concedeu ao processador um máximo de 80 watts. O desempenho resultante situa-se entre o i7-12700HnoMSI Pulso GL76e oi5-12500Hencontrado noGigabyte G7 KE. Dadas as especificações e pequenas diferenças entre Alder Lake e Raptor Lake de qualquer forma, estes resultados eram de se esperar. Com seus oito P-cores e 16 E-cores, o Intel Core i9-13950HXestá claramente à frente.
No modo de bateria, o desempenho da CPU é severamente limitado. Com um total de 1399 pontos, o resultado do Cinebench R15 foi cerca de 40 por cento menor.
Cinebench R15 Multi Continuous Test
Cinebench R23: Multi Core | Single Core
Cinebench R20: CPU (Multi Core) | CPU (Single Core)
Cinebench R15: CPU Multi 64Bit | CPU Single 64Bit
Blender: v2.79 BMW27 CPU
7-Zip 18.03: 7z b 4 | 7z b 4 -mmt1
Geekbench 5.5: Multi-Core | Single-Core
HWBOT x265 Benchmark v2.2: 4k Preset
LibreOffice : 20 Documents To PDF
R Benchmark 2.5: Overall mean
| CPU Performance rating | |
| MSI Titan GT77 HX 13VI | |
| Média da turma Gaming | |
| Asus ROG Strix Scar 17 SE G733CX-LL014W | |
| MSI Pulse GL76 12UGK | |
| MSI Katana 17 B13VFK | |
| Acer Predator Helios 300 (i7-12700H, RTX 3070 Ti) | |
| Média Intel Core i7-13620H | |
| Gigabyte G7 KE | |
| Cinebench R23 / Multi Core | |
| MSI Titan GT77 HX 13VI | |
| Média da turma Gaming (10488 - 42661, n=107, últimos 2 anos) | |
| Asus ROG Strix Scar 17 SE G733CX-LL014W | |
| Acer Predator Helios 300 (i7-12700H, RTX 3070 Ti) | |
| MSI Pulse GL76 12UGK | |
| MSI Katana 17 B13VFK | |
| Gigabyte G7 KE | |
| Média Intel Core i7-13620H (10819 - 15496, n=7) | |
| Cinebench R23 / Single Core | |
| MSI Titan GT77 HX 13VI | |
| Média da turma Gaming (1166 - 2415, n=107, últimos 2 anos) | |
| Asus ROG Strix Scar 17 SE G733CX-LL014W | |
| Média Intel Core i7-13620H (1716 - 1871, n=7) | |
| MSI Katana 17 B13VFK | |
| Acer Predator Helios 300 (i7-12700H, RTX 3070 Ti) | |
| MSI Pulse GL76 12UGK | |
| Gigabyte G7 KE | |
| Cinebench R20 / CPU (Multi Core) | |
| MSI Titan GT77 HX 13VI | |
| Média da turma Gaming (4029 - 16433, n=106, últimos 2 anos) | |
| Asus ROG Strix Scar 17 SE G733CX-LL014W | |
| MSI Pulse GL76 12UGK | |
| MSI Katana 17 B13VFK | |
| Acer Predator Helios 300 (i7-12700H, RTX 3070 Ti) | |
| Média Intel Core i7-13620H (4214 - 5905, n=7) | |
| Gigabyte G7 KE | |
| Cinebench R20 / CPU (Single Core) | |
| MSI Titan GT77 HX 13VI | |
| Média da turma Gaming (442 - 913, n=106, últimos 2 anos) | |
| Asus ROG Strix Scar 17 SE G733CX-LL014W | |
| Acer Predator Helios 300 (i7-12700H, RTX 3070 Ti) | |
| Média Intel Core i7-13620H (657 - 719, n=7) | |
| MSI Katana 17 B13VFK | |
| MSI Pulse GL76 12UGK | |
| Gigabyte G7 KE | |
| Cinebench R15 / CPU Multi 64Bit | |
| MSI Titan GT77 HX 13VI | |
| Média da turma Gaming (1578 - 6330, n=105, últimos 2 anos) | |
| Asus ROG Strix Scar 17 SE G733CX-LL014W | |
| Acer Predator Helios 300 (i7-12700H, RTX 3070 Ti) | |
| MSI Pulse GL76 12UGK | |
| MSI Katana 17 B13VFK | |
| Gigabyte G7 KE | |
| Média Intel Core i7-13620H (1681 - 2492, n=7) | |
| Cinebench R15 / CPU Single 64Bit | |
| MSI Titan GT77 HX 13VI | |
| Média da turma Gaming (188.8 - 350, n=106, últimos 2 anos) | |
| Asus ROG Strix Scar 17 SE G733CX-LL014W | |
| Média Intel Core i7-13620H (250 - 269, n=7) | |
| MSI Katana 17 B13VFK | |
| MSI Pulse GL76 12UGK | |
| Acer Predator Helios 300 (i7-12700H, RTX 3070 Ti) | |
| Gigabyte G7 KE | |
| Blender / v2.79 BMW27 CPU | |
| Média Intel Core i7-13620H (215 - 297, n=7) | |
| Gigabyte G7 KE | |
| MSI Katana 17 B13VFK | |
| Acer Predator Helios 300 (i7-12700H, RTX 3070 Ti) | |
| MSI Pulse GL76 12UGK | |
| Asus ROG Strix Scar 17 SE G733CX-LL014W | |
| Média da turma Gaming (79 - 330, n=104, últimos 2 anos) | |
| MSI Titan GT77 HX 13VI | |
| 7-Zip 18.03 / 7z b 4 | |
| MSI Titan GT77 HX 13VI | |
| Média da turma Gaming (33491 - 148086, n=105, últimos 2 anos) | |
| Asus ROG Strix Scar 17 SE G733CX-LL014W | |
| Acer Predator Helios 300 (i7-12700H, RTX 3070 Ti) | |
| MSI Pulse GL76 12UGK | |
| MSI Katana 17 B13VFK | |
| Média Intel Core i7-13620H (45092 - 62324, n=7) | |
| Gigabyte G7 KE | |
| 7-Zip 18.03 / 7z b 4 -mmt1 | |
| MSI Titan GT77 HX 13VI | |
| Média da turma Gaming (4199 - 7436, n=105, últimos 2 anos) | |
| Asus ROG Strix Scar 17 SE G733CX-LL014W | |
| Média Intel Core i7-13620H (5648 - 6326, n=7) | |
| Acer Predator Helios 300 (i7-12700H, RTX 3070 Ti) | |
| MSI Katana 17 B13VFK | |
| MSI Pulse GL76 12UGK | |
| Gigabyte G7 KE | |
| Geekbench 5.5 / Multi-Core | |
| MSI Titan GT77 HX 13VI | |
| Média da turma Gaming (6460 - 28263, n=105, últimos 2 anos) | |
| Asus ROG Strix Scar 17 SE G733CX-LL014W | |
| Acer Predator Helios 300 (i7-12700H, RTX 3070 Ti) | |
| MSI Pulse GL76 12UGK | |
| MSI Katana 17 B13VFK | |
| Média Intel Core i7-13620H (8112 - 12223, n=7) | |
| Gigabyte G7 KE | |
| Geekbench 5.5 / Single-Core | |
| Média da turma Gaming (986 - 2474, n=105, últimos 2 anos) | |
| MSI Titan GT77 HX 13VI | |
| Asus ROG Strix Scar 17 SE G733CX-LL014W | |
| Média Intel Core i7-13620H (1703 - 1865, n=7) | |
| MSI Katana 17 B13VFK | |
| Acer Predator Helios 300 (i7-12700H, RTX 3070 Ti) | |
| Gigabyte G7 KE | |
| MSI Pulse GL76 12UGK | |
| HWBOT x265 Benchmark v2.2 / 4k Preset | |
| MSI Titan GT77 HX 13VI | |
| Média da turma Gaming (11.5 - 44.4, n=105, últimos 2 anos) | |
| Asus ROG Strix Scar 17 SE G733CX-LL014W | |
| MSI Pulse GL76 12UGK | |
| MSI Katana 17 B13VFK | |
| Gigabyte G7 KE | |
| Acer Predator Helios 300 (i7-12700H, RTX 3070 Ti) | |
| Média Intel Core i7-13620H (12.2 - 17.7, n=7) | |
| LibreOffice / 20 Documents To PDF | |
| Acer Predator Helios 300 (i7-12700H, RTX 3070 Ti) | |
| MSI Katana 17 B13VFK | |
| Média Intel Core i7-13620H (41.5 - 78.9, n=7) | |
| Média da turma Gaming (33.2 - 88.8, n=105, últimos 2 anos) | |
| MSI Titan GT77 HX 13VI | |
| MSI Pulse GL76 12UGK | |
| Gigabyte G7 KE | |
| Asus ROG Strix Scar 17 SE G733CX-LL014W | |
| R Benchmark 2.5 / Overall mean | |
| Gigabyte G7 KE | |
| MSI Pulse GL76 12UGK | |
| Acer Predator Helios 300 (i7-12700H, RTX 3070 Ti) | |
| Média Intel Core i7-13620H (0.4438 - 0.4762, n=7) | |
| MSI Katana 17 B13VFK | |
| Média da turma Gaming (0.3439 - 0.759, n=106, últimos 2 anos) | |
| Asus ROG Strix Scar 17 SE G733CX-LL014W | |
| MSI Titan GT77 HX 13VI | |
* ... menor é melhor
AIDA64: FP32 Ray-Trace | FPU Julia | CPU SHA3 | CPU Queen | FPU SinJulia | FPU Mandel | CPU AES | CPU ZLib | FP64 Ray-Trace | CPU PhotoWorxx
| Performance rating | |
| MSI Titan GT77 HX 13VI | |
| Média da turma Gaming | |
| Asus ROG Strix Scar 17 SE G733CX-LL014W | |
| Acer Predator Helios 300 (i7-12700H, RTX 3070 Ti) | |
| MSI Pulse GL76 12UGK | |
| Gigabyte G7 KE | |
| MSI Katana 17 B13VFK | |
| Média Intel Core i7-13620H | |
| AIDA64 / FP32 Ray-Trace | |
| Média da turma Gaming (10227 - 85542, n=105, últimos 2 anos) | |
| MSI Titan GT77 HX 13VI | |
| Asus ROG Strix Scar 17 SE G733CX-LL014W | |
| Acer Predator Helios 300 (i7-12700H, RTX 3070 Ti) | |
| MSI Pulse GL76 12UGK | |
| MSI Katana 17 B13VFK | |
| Gigabyte G7 KE | |
| Média Intel Core i7-13620H (10779 - 13601, n=7) | |
| AIDA64 / FPU Julia | |
| MSI Titan GT77 HX 13VI | |
| Média da turma Gaming (51376 - 238426, n=105, últimos 2 anos) | |
| Acer Predator Helios 300 (i7-12700H, RTX 3070 Ti) | |
| Asus ROG Strix Scar 17 SE G733CX-LL014W | |
| MSI Pulse GL76 12UGK | |
| MSI Katana 17 B13VFK | |
| Gigabyte G7 KE | |
| Média Intel Core i7-13620H (54287 - 67187, n=7) | |
| AIDA64 / CPU SHA3 | |
| MSI Titan GT77 HX 13VI | |
| Média da turma Gaming (2180 - 10115, n=105, últimos 2 anos) | |
| Asus ROG Strix Scar 17 SE G733CX-LL014W | |
| Acer Predator Helios 300 (i7-12700H, RTX 3070 Ti) | |
| MSI Pulse GL76 12UGK | |
| Gigabyte G7 KE | |
| MSI Katana 17 B13VFK | |
| Média Intel Core i7-13620H (2327 - 2773, n=7) | |
| AIDA64 / CPU Queen | |
| MSI Titan GT77 HX 13VI | |
| Média da turma Gaming (49785 - 173351, n=90, últimos 2 anos) | |
| Asus ROG Strix Scar 17 SE G733CX-LL014W | |
| MSI Pulse GL76 12UGK | |
| Acer Predator Helios 300 (i7-12700H, RTX 3070 Ti) | |
| Gigabyte G7 KE | |
| MSI Katana 17 B13VFK | |
| Média Intel Core i7-13620H (66885 - 78867, n=7) | |
| AIDA64 / FPU SinJulia | |
| MSI Titan GT77 HX 13VI | |
| Média da turma Gaming (4424 - 33636, n=105, últimos 2 anos) | |
| Asus ROG Strix Scar 17 SE G733CX-LL014W | |
| Acer Predator Helios 300 (i7-12700H, RTX 3070 Ti) | |
| MSI Pulse GL76 12UGK | |
| MSI Katana 17 B13VFK | |
| Média Intel Core i7-13620H (6737 - 8421, n=7) | |
| Gigabyte G7 KE | |
| AIDA64 / FPU Mandel | |
| Média da turma Gaming (25115 - 128721, n=105, últimos 2 anos) | |
| MSI Titan GT77 HX 13VI | |
| Acer Predator Helios 300 (i7-12700H, RTX 3070 Ti) | |
| Asus ROG Strix Scar 17 SE G733CX-LL014W | |
| MSI Pulse GL76 12UGK | |
| MSI Katana 17 B13VFK | |
| Gigabyte G7 KE | |
| Média Intel Core i7-13620H (27242 - 32787, n=7) | |
| AIDA64 / CPU AES | |
| Asus ROG Strix Scar 17 SE G733CX-LL014W | |
| MSI Pulse GL76 12UGK | |
| MSI Titan GT77 HX 13VI | |
| Gigabyte G7 KE | |
| Média da turma Gaming (39258 - 247074, n=105, últimos 2 anos) | |
| Acer Predator Helios 300 (i7-12700H, RTX 3070 Ti) | |
| Média Intel Core i7-13620H (48646 - 85895, n=7) | |
| MSI Katana 17 B13VFK | |
| AIDA64 / CPU ZLib | |
| MSI Titan GT77 HX 13VI | |
| Média da turma Gaming (574 - 2531, n=105, últimos 2 anos) | |
| Asus ROG Strix Scar 17 SE G733CX-LL014W | |
| Acer Predator Helios 300 (i7-12700H, RTX 3070 Ti) | |
| MSI Pulse GL76 12UGK | |
| Gigabyte G7 KE | |
| MSI Katana 17 B13VFK | |
| Média Intel Core i7-13620H (688 - 835, n=7) | |
| AIDA64 / FP64 Ray-Trace | |
| Média da turma Gaming (5509 - 45446, n=105, últimos 2 anos) | |
| MSI Titan GT77 HX 13VI | |
| Acer Predator Helios 300 (i7-12700H, RTX 3070 Ti) | |
| Asus ROG Strix Scar 17 SE G733CX-LL014W | |
| MSI Pulse GL76 12UGK | |
| MSI Katana 17 B13VFK | |
| Gigabyte G7 KE | |
| Média Intel Core i7-13620H (5919 - 7364, n=7) | |
| AIDA64 / CPU PhotoWorxx | |
| Média da turma Gaming (12271 - 89891, n=105, últimos 2 anos) | |
| Asus ROG Strix Scar 17 SE G733CX-LL014W | |
| MSI Titan GT77 HX 13VI | |
| Acer Predator Helios 300 (i7-12700H, RTX 3070 Ti) | |
| MSI Katana 17 B13VFK | |
| Gigabyte G7 KE | |
| Média Intel Core i7-13620H (19421 - 34544, n=7) | |
| MSI Pulse GL76 12UGK | |
Desempenho do sistema
Um SSD rápido, emparelhado com o poderoso chip gráfico do Katana 17, resulta em um desempenho muito bom do sistema que está, naturalmente, um pouco atrás da concorrência mais bem configurada em benchmarks sintéticos.
CrossMark: Overall | Productivity | Creativity | Responsiveness
| PCMark 10 / Score | |
| MSI Titan GT77 HX 13VI | |
| Média da turma Gaming (5828 - 12414, n=93, últimos 2 anos) | |
| Acer Predator Helios 300 (i7-12700H, RTX 3070 Ti) | |
| MSI Pulse GL76 12UGK | |
| Asus ROG Strix Scar 17 SE G733CX-LL014W | |
| MSI Katana 17 B13VFK | |
| Média Intel Core i7-13620H, NVIDIA GeForce RTX 4060 Laptop GPU (6678 - 7256, n=3) | |
| Gigabyte G7 KE | |
| PCMark 10 / Essentials | |
| MSI Titan GT77 HX 13VI | |
| MSI Pulse GL76 12UGK | |
| MSI Katana 17 B13VFK | |
| Acer Predator Helios 300 (i7-12700H, RTX 3070 Ti) | |
| Média da turma Gaming (8810 - 11935, n=97, últimos 2 anos) | |
| Média Intel Core i7-13620H, NVIDIA GeForce RTX 4060 Laptop GPU (9909 - 10809, n=3) | |
| Asus ROG Strix Scar 17 SE G733CX-LL014W | |
| Gigabyte G7 KE | |
| PCMark 10 / Productivity | |
| Média da turma Gaming (6845 - 25323, n=95, últimos 2 anos) | |
| Acer Predator Helios 300 (i7-12700H, RTX 3070 Ti) | |
| MSI Pulse GL76 12UGK | |
| Asus ROG Strix Scar 17 SE G733CX-LL014W | |
| MSI Titan GT77 HX 13VI | |
| MSI Katana 17 B13VFK | |
| Média Intel Core i7-13620H, NVIDIA GeForce RTX 4060 Laptop GPU (8642 - 9781, n=3) | |
| Gigabyte G7 KE | |
| PCMark 10 / Digital Content Creation | |
| MSI Titan GT77 HX 13VI | |
| Média da turma Gaming (7602 - 19954, n=95, últimos 2 anos) | |
| Acer Predator Helios 300 (i7-12700H, RTX 3070 Ti) | |
| MSI Pulse GL76 12UGK | |
| Asus ROG Strix Scar 17 SE G733CX-LL014W | |
| MSI Katana 17 B13VFK | |
| Média Intel Core i7-13620H, NVIDIA GeForce RTX 4060 Laptop GPU (9437 - 10204, n=3) | |
| Gigabyte G7 KE | |
| CrossMark / Overall | |
| MSI Titan GT77 HX 13VI | |
| Asus ROG Strix Scar 17 SE G733CX-LL014W | |
| Média da turma Gaming (1366 - 2409, n=94, últimos 2 anos) | |
| Média Intel Core i7-13620H, NVIDIA GeForce RTX 4060 Laptop GPU (1857 - 1986, n=3) | |
| Acer Predator Helios 300 (i7-12700H, RTX 3070 Ti) | |
| MSI Katana 17 B13VFK | |
| MSI Pulse GL76 12UGK | |
| Gigabyte G7 KE | |
| CrossMark / Productivity | |
| MSI Titan GT77 HX 13VI | |
| Asus ROG Strix Scar 17 SE G733CX-LL014W | |
| Média da turma Gaming (1386 - 2254, n=94, últimos 2 anos) | |
| Média Intel Core i7-13620H, NVIDIA GeForce RTX 4060 Laptop GPU (1765 - 1908, n=3) | |
| Gigabyte G7 KE | |
| MSI Pulse GL76 12UGK | |
| Acer Predator Helios 300 (i7-12700H, RTX 3070 Ti) | |
| MSI Katana 17 B13VFK | |
| CrossMark / Creativity | |
| MSI Titan GT77 HX 13VI | |
| Asus ROG Strix Scar 17 SE G733CX-LL014W | |
| Média da turma Gaming (1343 - 2786, n=94, últimos 2 anos) | |
| Acer Predator Helios 300 (i7-12700H, RTX 3070 Ti) | |
| Média Intel Core i7-13620H, NVIDIA GeForce RTX 4060 Laptop GPU (2013 - 2067, n=3) | |
| MSI Katana 17 B13VFK | |
| MSI Pulse GL76 12UGK | |
| Gigabyte G7 KE | |
| CrossMark / Responsiveness | |
| Gigabyte G7 KE | |
| Asus ROG Strix Scar 17 SE G733CX-LL014W | |
| Média Intel Core i7-13620H, NVIDIA GeForce RTX 4060 Laptop GPU (1734 - 1989, n=3) | |
| MSI Titan GT77 HX 13VI | |
| MSI Pulse GL76 12UGK | |
| MSI Katana 17 B13VFK | |
| Acer Predator Helios 300 (i7-12700H, RTX 3070 Ti) | |
| Média da turma Gaming (1226 - 2334, n=94, últimos 2 anos) | |
| PCMark 10 Score | 7160 pontos | |
Ajuda | ||
| AIDA64 / Memory Copy | |
| Média da turma Gaming (21750 - 129946, n=105, últimos 2 anos) | |
| MSI Titan GT77 HX 13VI | |
| Asus ROG Strix Scar 17 SE G733CX-LL014W | |
| Acer Predator Helios 300 (i7-12700H, RTX 3070 Ti) | |
| MSI Katana 17 B13VFK | |
| MSI Pulse GL76 12UGK | |
| Média Intel Core i7-13620H (31629 - 53927, n=7) | |
| Gigabyte G7 KE | |
| AIDA64 / Memory Read | |
| Média da turma Gaming (22956 - 118858, n=105, últimos 2 anos) | |
| Asus ROG Strix Scar 17 SE G733CX-LL014W | |
| MSI Titan GT77 HX 13VI | |
| MSI Katana 17 B13VFK | |
| Acer Predator Helios 300 (i7-12700H, RTX 3070 Ti) | |
| Média Intel Core i7-13620H (35115 - 61853, n=7) | |
| MSI Pulse GL76 12UGK | |
| Gigabyte G7 KE | |
| AIDA64 / Memory Write | |
| Média da turma Gaming (22297 - 135096, n=105, últimos 2 anos) | |
| Asus ROG Strix Scar 17 SE G733CX-LL014W | |
| MSI Titan GT77 HX 13VI | |
| Acer Predator Helios 300 (i7-12700H, RTX 3070 Ti) | |
| MSI Katana 17 B13VFK | |
| Gigabyte G7 KE | |
| MSI Pulse GL76 12UGK | |
| Média Intel Core i7-13620H (30611 - 54111, n=7) | |
| AIDA64 / Memory Latency | |
| Média da turma Gaming (75.3 - 259, n=105, últimos 2 anos) | |
| MSI Katana 17 B13VFK | |
| Média Intel Core i7-13620H (75.9 - 108.2, n=7) | |
| MSI Pulse GL76 12UGK | |
| MSI Titan GT77 HX 13VI | |
| Acer Predator Helios 300 (i7-12700H, RTX 3070 Ti) | |
| Gigabyte G7 KE | |
| Asus ROG Strix Scar 17 SE G733CX-LL014W | |
* ... menor é melhor
Latências DPC
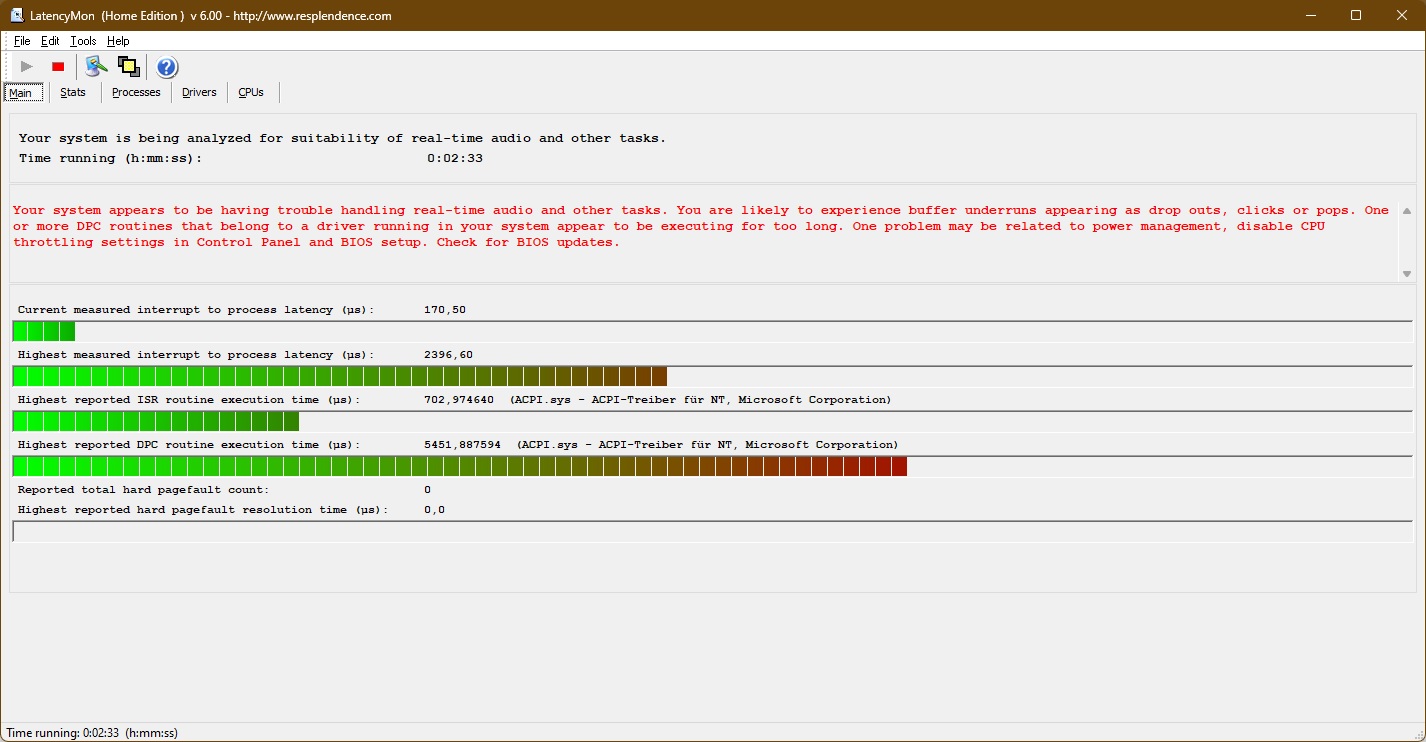
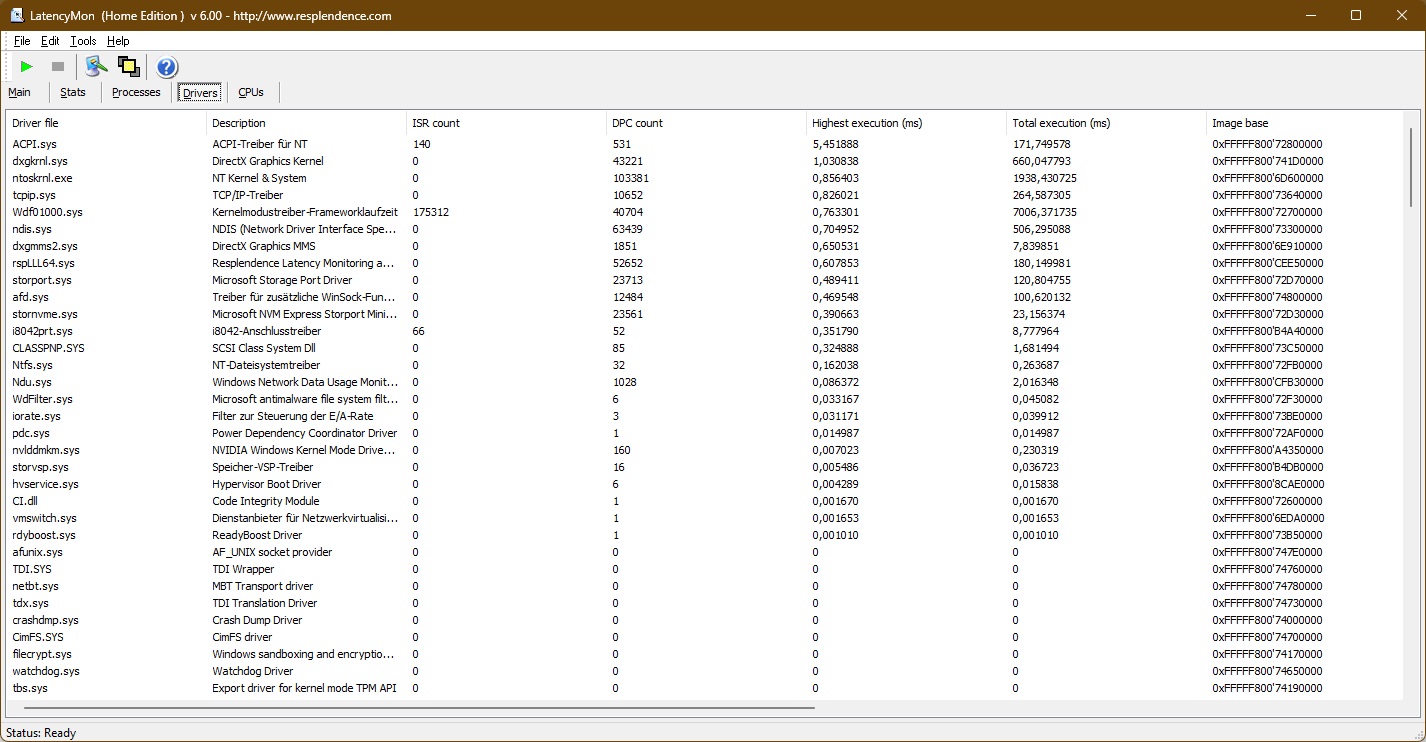
| DPC Latencies / LatencyMon - interrupt to process latency (max), Web, Youtube, Prime95 | |
| MSI Titan GT77 HX 13VI | |
| Asus ROG Strix Scar 17 SE G733CX-LL014W | |
| MSI Katana 17 B13VFK | |
| Gigabyte G7 KE | |
| Acer Predator Helios 300 (i7-12700H, RTX 3070 Ti) | |
| MSI Pulse GL76 12UGK | |
* ... menor é melhor
Armazenamento em massa
Com capacidade de um terabyte, o Micron 2400 é, por si só, um rápido NVMe PCIe 4.0 SSD, com desempenho, ele não consegue acompanhar a concorrência. No entanto, isto não deve ser realmente perceptível no uso diário.

* ... menor é melhor
Continuous Performance Read: DiskSpd Read Loop, Queue Depth 8
Placa gráfica
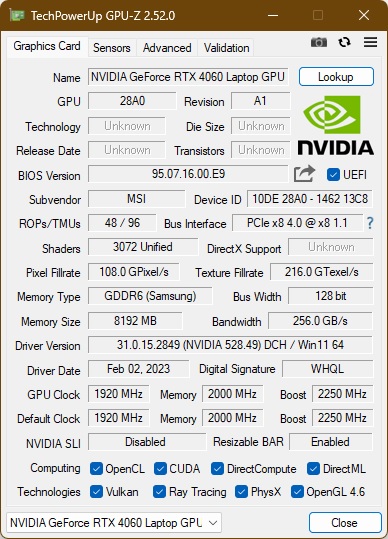
ONvidia GeForce RTX 4060 é uma GPU de médio porte da geração "Ada Lovelace" de Nvidia. As unidades de sombreamento 3072 são clockadas a um máximo de 2,25 GHz e a GPU instalada aqui tem oito gigabytes de RAM GDDR6 à sua disposição. Você pode encontrar comparações adicionais com outros chips gráficos em nosso Lista de referência da GPU.
Nos testes 3DMark, a nova GPU tem seu nariz na frente da última geração Nvidia GeForce RTX 3070- mas apenas. Em contraste, oRTX 3070 Tié marginalmente mais rápido. Em comparação com oNvidia GeForce RTX 3060o RTX 4060 - que pode consumir seu máximo de 105 watts aqui - é cerca de 23% mais rápido. Com 115 watts, o Gigabyte G7 KE encontrado no 3060 consumiu um pouco mais do que o 4060. O RTX 4060 é claramente superado pelaGeForce RTX 4090e era de se esperar. No 3DMark benchmarks, o chip de alta qualidade funciona duas vezes mais rápido. Os resultados do Blender benchmark confirmam os resultados do teste 3DMark.
Assim como no processador, a placa gráfica tem um limite de desempenho em modo de bateria. Sem uma unidade de alimentação, apenas 50% do desempenho da GPU está disponível.
| 3DMark 06 Standard Score | 50607 pontos | |
| 3DMark Vantage P Result | 90275 pontos | |
| 3DMark 11 Performance | 30831 pontos | |
| 3DMark Ice Storm Standard Score | 185655 pontos | |
| 3DMark Cloud Gate Standard Score | 59494 pontos | |
| 3DMark Fire Strike Score | 22497 pontos | |
| 3DMark Time Spy Score | 10345 pontos | |
Ajuda | ||
* ... menor é melhor
Desempenho nos jogos
Em testes de jogos, o Nvidia GeForce RTX 4060 faz melhor do que em benchmarks sintéticos. Neste aspecto, ele bate marginalmente o GeForce RTX 3070 Ti. Entretanto, assim como o RTX 4090, o RTX 3080 Ti continua imbatível. Entretanto, quando se trata de jogos, a diferença para o carro-chefe não é tão grande, com o 4090 ainda sendo cerca de 33 % mais rápido.
O RTX 4060 pode facilmente jogar títulos mais antigos em 4K UHD. Com novos jogos, porém, isto é mais difícil, pelo menos sem a implementação do DLSS. De qualquer forma, é possível jogar em 2,5K.
| The Witcher 3 - 1920x1080 Ultra Graphics & Postprocessing (HBAO+) | |
| MSI Titan GT77 HX 13VI | |
| Média da turma Gaming (104.7 - 240, n=7, últimos 2 anos) | |
| Acer Predator Helios 300 (i7-12700H, RTX 3070 Ti) | |
| Asus ROG Strix Scar 17 SE G733CX-LL014W | |
| MSI Katana 17 B13VFK | |
| MSI Pulse GL76 12UGK | |
| Gigabyte G7 KE | |
| Final Fantasy XV Benchmark - 1920x1080 High Quality | |
| MSI Titan GT77 HX 13VI | |
| Média da turma Gaming (41 - 215, n=95, últimos 2 anos) | |
| Asus ROG Strix Scar 17 SE G733CX-LL014W | |
| Acer Predator Helios 300 (i7-12700H, RTX 3070 Ti) | |
| MSI Katana 17 B13VFK | |
| MSI Pulse GL76 12UGK | |
| Gigabyte G7 KE | |
Witcher 3 frame rate diagram
| baixo | média | alto | ultra | QHD | 4K DLSS | 4K | |
|---|---|---|---|---|---|---|---|
| GTA V (2015) | 186.1 | 184.7 | 180.2 | 112.1 | 83 | 82.1 | |
| The Witcher 3 (2015) | 435 | 322 | 206 | 104.7 | 62.6 | ||
| Dota 2 Reborn (2015) | 184.6 | 171 | 164.1 | 156.3 | 126 | ||
| Final Fantasy XV Benchmark (2018) | 204 | 135.1 | 96.1 | 70.1 | 40.2 | ||
| X-Plane 11.11 (2018) | 178.6 | 154.9 | 118.9 | 98.9 | |||
| Far Cry 5 (2018) | 134 | 99 | 51 | ||||
| Strange Brigade (2018) | 508 | 270 | 216 | 185.1 | 126.4 | 67.2 | |
| Shadow of the Tomb Raider (2018) | 155.6 | 120.7 | 67.2 | ||||
| Metro Exodus (2019) | 74.3 | 59 | 36.8 | ||||
| Control (2019) | 238 | 119 | 89 | ||||
| Borderlands 3 (2019) | 171.3 | 144.6 | 106.5 | 83.9 | |||
| Death Stranding (2020) | 200 | 158.9 | 150.3 | 146.7 | |||
| Horizon Zero Dawn (2020) | 108.3 | 85.9 | 46.5 | ||||
| Flight Simulator 2020 (2020) | 96.9 | 69.4 | 52.5 | ||||
| Crysis Remastered (2020) | 312 | 224 | 85.9 | 72.5 | |||
| Watch Dogs Legion (2020) | 65 | 44 | 25 | ||||
| Dirt 5 (2020) | 218 | 147.2 | 116.1 | 89.5 | |||
| Assassin´s Creed Valhalla (2020) | 135 | 111 | 96 | ||||
| Yakuza Like a Dragon (2020) | 131.7 | 123.2 | 117.4 | 109.6 | |||
| Hitman 3 (2021) | 267.5 | 197.7 | 172.7 | 163.5 | |||
| Days Gone (2021) | 148 | 131.4 | 100.2 | ||||
| F1 2021 (2021) | 389 | 312 | 244 | 128.9 | 93 | 50.2 | |
| Alan Wake Remastered (2021) | 149.8 | 144.9 | |||||
| Far Cry 6 (2021) | 97.2 | 32.6 | 3.38 | ||||
| Back 4 Blood (2021) | 245 | 197.5 | 188.2 | ||||
| Guardians of the Galaxy (2021) | 134 | 135 | 133 | ||||
| Riders Republic (2021) | 177 | 145 | 122 | 112 | |||
| Forza Horizon 5 (2021) | 137 | 125 | 84 | ||||
| Battlefield 2042 (2021) | 145.6 | 123 | 106.1 | ||||
| Halo Infinite (2021) | 144.9 | 123.6 | 114.2 | ||||
| God of War (2022) | 67.5 | 55.6 | 34.7 | ||||
| Rainbow Six Extraction (2022) | 149.1 | 106 | 52.4 | ||||
| Dying Light 2 (2022) | 64.7 | 43.8 | 23 | ||||
| GRID Legends (2022) | 126.4 | 102.2 | 63.9 | ||||
| Elden Ring (2022) | 59.5 | ||||||
| Cyberpunk 2077 1.6 (2022) | 73.81 | 45.9 | 21.1 | ||||
| Elex 2 (2022) | 115.4 | 115.4 | 113.5 | 96 | |||
| Ghostwire Tokyo (2022) | 68.6 | 65.9 | 36.8 | 29.6 | |||
| Tiny Tina's Wonderlands (2022) | 198.6 | 164.9 | 110 | 85.2 | |||
| Vampire Bloodhunt (2022) | 220 | 201 | 185.7 | ||||
| F1 22 (2022) | 247 | 240 | 179.2 | 65.4 | 41 | 19.7 | |
| The Quarry (2022) | 154.8 | 121.3 | 100.5 | 77.9 | |||
| A Plague Tale Requiem (2022) | 100.7 | 84.9 | 73 | 63.3 | |||
| Uncharted Legacy of Thieves Collection (2022) | 87.9 | 85.1 | 79.1 | 76.9 | |||
| Call of Duty Modern Warfare 2 2022 (2022) | 87 | 59 | 55 | 34 | |||
| Spider-Man Miles Morales (2022) | 77.3 | 59.7 | 35.3 | ||||
| The Callisto Protocol (2022) | 68.9 | 48.6 | 27 | ||||
| Need for Speed Unbound (2022) | 127.4 | 117.2 | 98.9 | 98.6 | |||
| High On Life (2023) | 220 | 165.8 | 125.6 | 99.9 | |||
| The Witcher 3 v4 (2023) | 66.3 | 40.5 | 21.4 | ||||
| Dead Space Remake (2023) | 67 | 43.4 | 20.6 | ||||
| Hogwarts Legacy (2023) | 150 | 126.7 | 107.7 | 91.6 | |||
| Returnal (2023) | |||||||
| Atomic Heart (2023) | 167.3 | 129.2 | 81.6 | 66.8 | |||
| Company of Heroes 3 (2023) | 202.7 | 182.1 | 133.3 | 131.3 | |||
| Sons of the Forest (2023) | 82 | 79.1 | 73.3 | 71.8 |
Emissões: Ventiladores barulhentos, estojo legal
Emissões sonoras
Ao realizar tarefas pouco exigentes, o MSI Laptop Katana 17 funciona em sua maioria silencioso - mas nem sempre. Quando o resfriamento está em andamento, em torno de 40 dB(A), o dispositivo funciona comparativamente alto. Sob carga, isto sobe a um máximo de 59 dB(A), o que é muito alto para orelhas sensíveis, mas normal para jogos.
Não detectamos nenhuma lamentação da bobina.
Barulho
| Ocioso |
| 24.5 / 24.5 / 40 dB |
| Carga |
| 48.3 / 59.1 dB |
 | ||
30 dB silencioso 40 dB(A) audível 50 dB(A) ruidosamente alto |
||
min: | ||
| MSI Katana 17 B13VFK GeForce RTX 4060 Laptop GPU, i7-13620H, Micron 2400 MTFDKBA1T0QFM | MSI Titan GT77 HX 13VI GeForce RTX 4090 Laptop GPU, i9-13950HX, Samsung PM9A1 MZVL22T0HBLB | MSI Pulse GL76 12UGK GeForce RTX 3070 Laptop GPU, i7-12700H, Micron 3400 1TB MTFDKBA1T0TFH | Gigabyte G7 KE GeForce RTX 3060 Laptop GPU, i5-12500H, Gigabyte AG470S1TB-SI B10 | Asus ROG Strix Scar 17 SE G733CX-LL014W GeForce RTX 3080 Ti Laptop GPU, i9-12950HX, Samsung PM9A1 MZVL22T0HBLB | Acer Predator Helios 300 (i7-12700H, RTX 3070 Ti) GeForce RTX 3070 Ti Laptop GPU, i7-12700H, Samsung PM9A1 MZVL21T0HCLR | |
|---|---|---|---|---|---|---|
| Noise | -2% | 6% | -9% | 16% | -0% | |
| desligado / ambiente * (dB) | 24.5 | 24.6 -0% | 24.1 2% | 27 -10% | 23.9 2% | 23 6% |
| Idle Minimum * (dB) | 24.5 | 29.2 -19% | 26.9 -10% | 27 -10% | 23.9 2% | 23 6% |
| Idle Average * (dB) | 24.5 | 29.2 -19% | 26.9 -10% | 35 -43% | 23.9 2% | 25.92 -6% |
| Idle Maximum * (dB) | 40 | 29.2 27% | 27 32% | 38 5% | 23.9 40% | 40.67 -2% |
| Load Average * (dB) | 48.3 | 50.7 -5% | 43.8 9% | 52 -8% | 34.3 29% | 42.7 12% |
| Witcher 3 ultra * (dB) | 56 | 53.3 5% | 44.7 20% | 56 -0% | 62.48 -12% | |
| Load Maximum * (dB) | 59.1 | 61 -3% | 58.3 1% | 59 -0% | 45.9 22% | 62.67 -6% |
* ... menor é melhor
Temperatura
Boas notícias: Você não deve se preocupar em ficar com as mãos suadas ao usar o Katana 17, pois a área de descanso da palma permanece fria, mesmo em testes de estresse. Uma temperatura máxima de 45,5 graus Celsius no testeWitcher 3 também não é motivo de preocupação.
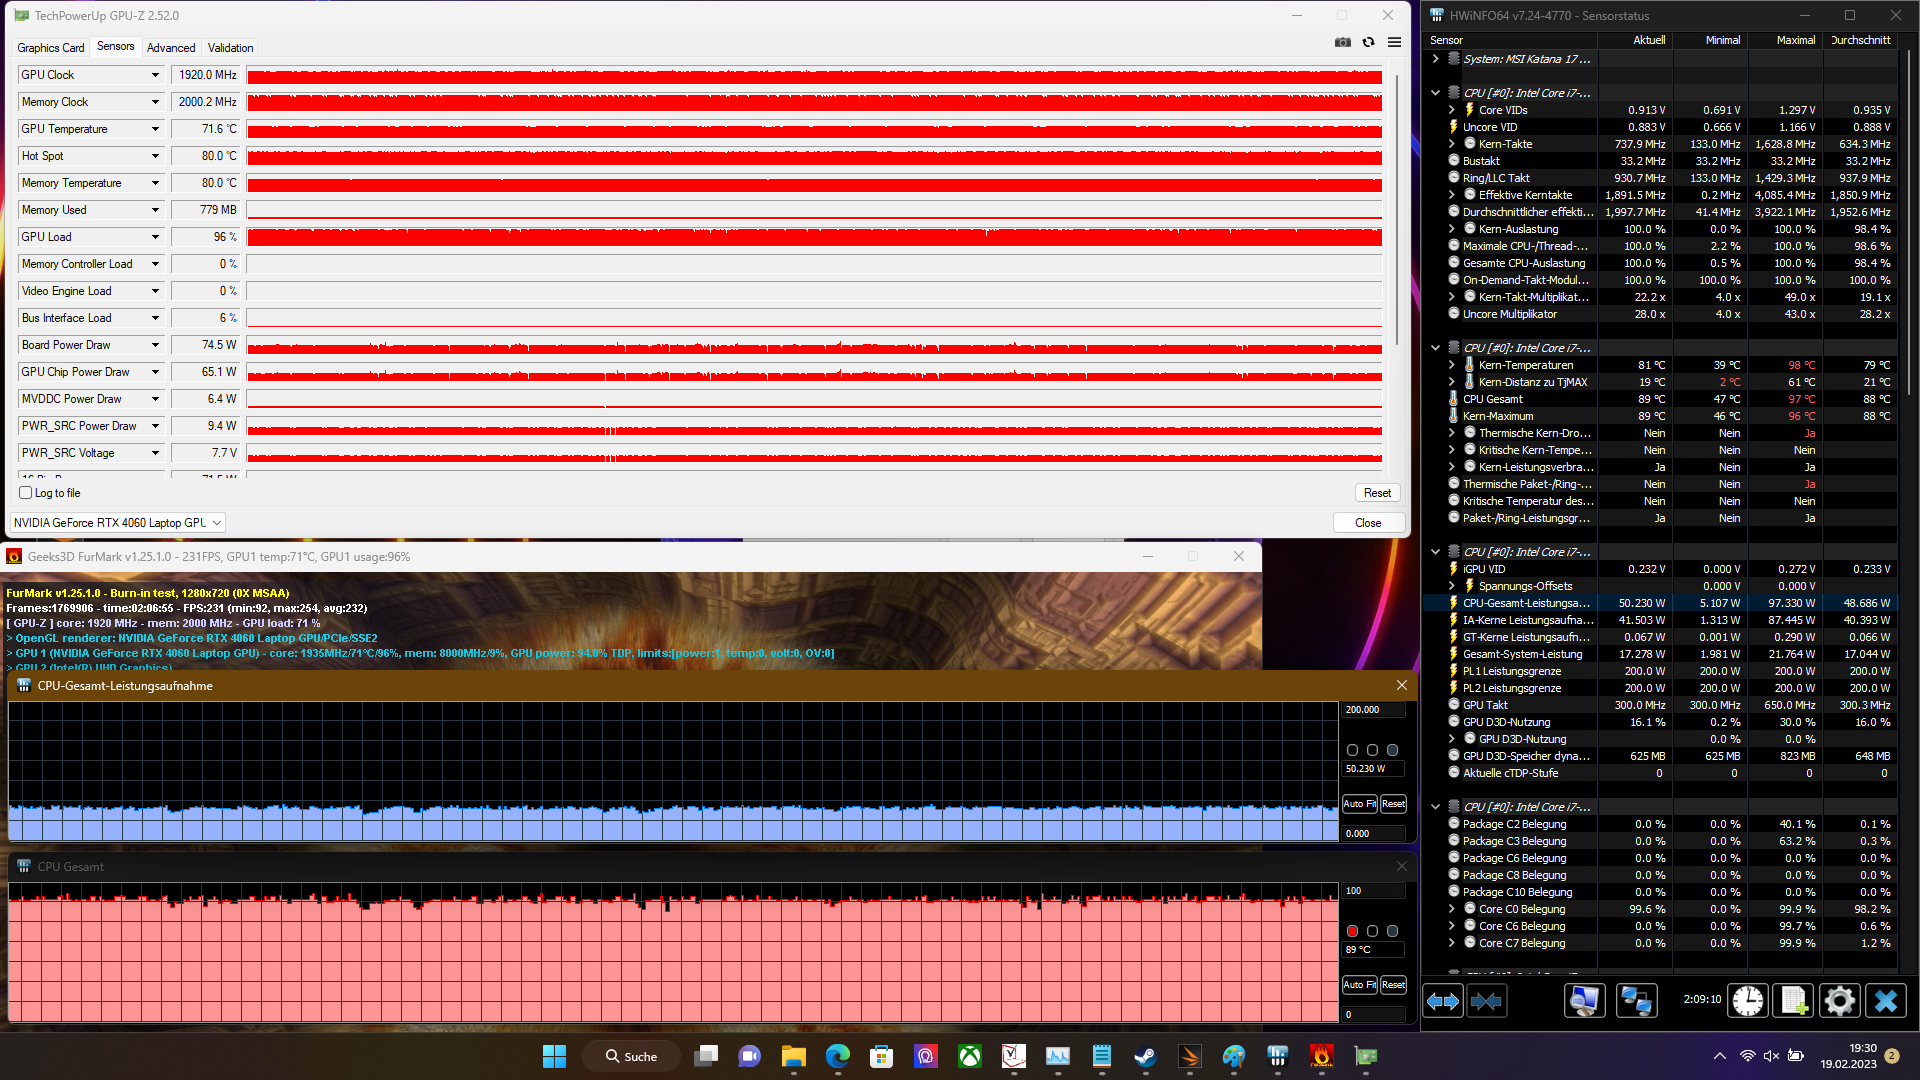
Nos testes de estresse do MSI Katana 17 B13V, não detectamos nenhum estrangulamento.
(±) A temperatura máxima no lado superior é 41.6 °C / 107 F, em comparação com a média de 40.4 °C / 105 F , variando de 21.2 a 68.8 °C para a classe Gaming.
(±) A parte inferior aquece até um máximo de 43.1 °C / 110 F, em comparação com a média de 43.2 °C / 110 F
(+) Em uso inativo, a temperatura média para o lado superior é 27.8 °C / 82 F, em comparação com a média do dispositivo de 33.9 °C / ### class_avg_f### F.
(+) Jogando The Witcher 3, a temperatura média para o lado superior é 31.8 °C / 89 F, em comparação com a média do dispositivo de 33.9 °C / ## #class_avg_f### F.
(+) Os apoios para as mãos e o touchpad são mais frios que a temperatura da pele, com um máximo de 24.2 °C / 75.6 F e, portanto, são frios ao toque.
(+) A temperatura média da área do apoio para as mãos de dispositivos semelhantes foi 28.8 °C / 83.8 F (+4.6 °C / 8.2 F).
| MSI Katana 17 B13VFK Intel Core i7-13620H, NVIDIA GeForce RTX 4060 Laptop GPU | MSI Titan GT77 HX 13VI Intel Core i9-13950HX, NVIDIA GeForce RTX 4090 Laptop GPU | MSI Pulse GL76 12UGK Intel Core i7-12700H, NVIDIA GeForce RTX 3070 Laptop GPU | Gigabyte G7 KE Intel Core i5-12500H, NVIDIA GeForce RTX 3060 Laptop GPU | Asus ROG Strix Scar 17 SE G733CX-LL014W Intel Core i9-12950HX, NVIDIA GeForce RTX 3080 Ti Laptop GPU | Acer Predator Helios 300 (i7-12700H, RTX 3070 Ti) Intel Core i7-12700H, NVIDIA GeForce RTX 3070 Ti Laptop GPU | |
|---|---|---|---|---|---|---|
| Heat | 10% | -5% | -7% | -7% | 2% | |
| Maximum Upper Side * (°C) | 41.6 | 40.6 2% | 44.2 -6% | 52 -25% | 48.8 -17% | 35 16% |
| Maximum Bottom * (°C) | 43.1 | 41.1 5% | 45.2 -5% | 54 -25% | 52.4 -22% | 53 -23% |
| Idle Upper Side * (°C) | 32 | 26.2 18% | 35.4 -11% | 28 12% | 30.4 5% | 29 9% |
| Idle Bottom * (°C) | 35.8 | 30.3 15% | 35 2% | 32 11% | 34.1 5% | 34 5% |
* ... menor é melhor
Oradores
Os alto-falantes do MSI Katana 17 são comparativamente altos, mas carecem de graves. Ao invés disso, os jogadores devem alcançar um bom fone de ouvido, tornando inaudíveis os ruídos dos ventiladores.
MSI Katana 17 B13VFK análise de áudio
(±) | o volume do alto-falante é médio, mas bom (###valor### dB)
Graves 100 - 315Hz
(-) | quase nenhum baixo - em média 17.7% menor que a mediana
(±) | a linearidade dos graves é média (11.7% delta para a frequência anterior)
Médios 400 - 2.000 Hz
(±) | médios mais altos - em média 6.8% maior que a mediana
(+) | médios são lineares (6.7% delta para frequência anterior)
Altos 2 - 16 kHz
(+) | agudos equilibrados - apenas 3.2% longe da mediana
(±) | a linearidade dos máximos é média (7.2% delta para frequência anterior)
Geral 100 - 16.000 Hz
(±) | a linearidade do som geral é média (19.4% diferença em relação à mediana)
Comparado com a mesma classe
» 67% de todos os dispositivos testados nesta classe foram melhores, 7% semelhantes, 26% piores
» O melhor teve um delta de 6%, a média foi 18%, o pior foi 132%
Comparado com todos os dispositivos testados
» 48% de todos os dispositivos testados foram melhores, 7% semelhantes, 45% piores
» O melhor teve um delta de 4%, a média foi 23%, o pior foi 134%
Acer Predator Helios 300 (i7-12700H, RTX 3070 Ti) análise de áudio
(±) | o volume do alto-falante é médio, mas bom (###valor### dB)
Graves 100 - 315Hz
(±) | graves reduzidos - em média 12.7% menor que a mediana
(±) | a linearidade dos graves é média (11.2% delta para a frequência anterior)
Médios 400 - 2.000 Hz
(±) | médios mais altos - em média 5.5% maior que a mediana
(±) | a linearidade dos médios é média (7.9% delta para frequência anterior)
Altos 2 - 16 kHz
(+) | agudos equilibrados - apenas 2.1% longe da mediana
(+) | os máximos são lineares (3.5% delta da frequência anterior)
Geral 100 - 16.000 Hz
(±) | a linearidade do som geral é média (15.8% diferença em relação à mediana)
Comparado com a mesma classe
» 37% de todos os dispositivos testados nesta classe foram melhores, 7% semelhantes, 56% piores
» O melhor teve um delta de 6%, a média foi 18%, o pior foi 132%
Comparado com todos os dispositivos testados
» 24% de todos os dispositivos testados foram melhores, 5% semelhantes, 70% piores
» O melhor teve um delta de 4%, a média foi 23%, o pior foi 134%
Gerenciamento de energia: A máquina de jogos da MSI que consome muita energia
Consumo de energia
O consumo mínimo de cerca de 12,2 watts é relativamente alto, mas típico de um sistema de jogo. Entretanto, em comparação com a concorrência, o consumo ainda é relativamente baixo.
A unidade de alimentação de 240 watts é suficientemente dimensionada para lidar com um consumo máximo de 212 watts.
| desligado | |
| Ocioso | |
| Carga |
|
Key:
min: | |
| MSI Katana 17 B13VFK i7-13620H, GeForce RTX 4060 Laptop GPU, Micron 2400 MTFDKBA1T0QFM, IPS LED, 1920x1080, 17.3" | MSI Titan GT77 HX 13VI i9-13950HX, GeForce RTX 4090 Laptop GPU, Samsung PM9A1 MZVL22T0HBLB, Mini-LED, 3840x2160, 17.3" | MSI Pulse GL76 12UGK i7-12700H, GeForce RTX 3070 Laptop GPU, Micron 3400 1TB MTFDKBA1T0TFH, IPS, 1920x1080, 17.3" | Gigabyte G7 KE i5-12500H, GeForce RTX 3060 Laptop GPU, Gigabyte AG470S1TB-SI B10, IPS, 1920x1080, 17.3" | Asus ROG Strix Scar 17 SE G733CX-LL014W i9-12950HX, GeForce RTX 3080 Ti Laptop GPU, Samsung PM9A1 MZVL22T0HBLB, IPS, 2560x1440, 17.3" | Acer Predator Helios 300 (i7-12700H, RTX 3070 Ti) i7-12700H, GeForce RTX 3070 Ti Laptop GPU, Samsung PM9A1 MZVL21T0HCLR, IPS, 2560x1440, 17.3" | Média NVIDIA GeForce RTX 4060 Laptop GPU | Média da turma Gaming | |
|---|---|---|---|---|---|---|---|---|
| Power Consumption | -55% | -14% | -22% | -61% | -41% | -7% | -29% | |
| Idle Minimum * (Watt) | 12.2 | 14 -15% | 12.4 -2% | 15 -23% | 19.3 -58% | 15 -23% | 11.5 ? 6% | 13 ? -7% |
| Idle Average * (Watt) | 14.9 | 21.6 -45% | 13.1 12% | 17 -14% | 26.5 -78% | 20 -34% | 16 ? -7% | 19 ? -28% |
| Idle Maximum * (Watt) | 15.8 | 24.8 -57% | 25.3 -60% | 24 -52% | 27.1 -72% | 22.3 -41% | 20.3 ? -28% | 24.6 ? -56% |
| Load Average * (Watt) | 85.22 | 122.5 -44% | 105.4 -24% | 111 -30% | 141 -65% | 133 -56% | 92.9 ? -9% | 110.7 ? -30% |
| Witcher 3 ultra * (Watt) | 151.1 | 265 -75% | 150 1% | 174.1 -15% | 225 -49% | 231 -53% | ||
| Load Maximum * (Watt) | 212.8 | 418 -96% | 240.5 -13% | 208 2% | 307.9 -45% | 290 -36% | 210 ? 1% | 259 ? -22% |
* ... menor é melhor
Power consumption Witcher 3 / stress test
Power consumption with an external monitor
Duração da bateria
A pequena bateria do MSI Katana 17 tem uma capacidade de apenas 53,5 watt-hora. Portanto, não se deve esperar uma boa vida útil da bateria quando se trata de um sistema tão potente. A bateria durou uma magra três horas em testes WiFi, o que significa que o laptop MSI não é adequado para o uso móvel.
| MSI Katana 17 B13VFK i7-13620H, GeForce RTX 4060 Laptop GPU, 53.5 Wh | MSI Titan GT77 HX 13VI i9-13950HX, GeForce RTX 4090 Laptop GPU, 99.9 Wh | MSI Pulse GL76 12UGK i7-12700H, GeForce RTX 3070 Laptop GPU, 90 Wh | Gigabyte G7 KE i5-12500H, GeForce RTX 3060 Laptop GPU, 54 Wh | Asus ROG Strix Scar 17 SE G733CX-LL014W i9-12950HX, GeForce RTX 3080 Ti Laptop GPU, 90 Wh | Acer Predator Helios 300 (i7-12700H, RTX 3070 Ti) i7-12700H, GeForce RTX 3070 Ti Laptop GPU, 90 Wh | Média da turma Gaming | |
|---|---|---|---|---|---|---|---|
| Duração da bateria | 62% | 107% | 57% | 45% | 94% | 98% | |
| WiFi v1.3 (h) | 2.9 | 5.3 83% | 5.9 103% | 5.3 83% | 4.2 45% | 6 107% | 7.11 ? 145% |
| Load (h) | 1 | 1.4 40% | 2.1 110% | 1.3 30% | 1.8 80% | 1.502 ? 50% | |
| H.264 (h) | 6 | 2.2 | 5.9 | 8.32 ? | |||
| Reader / Idle (h) | 7.3 | 7.1 | 8.27 ? |
Pro
Contra
Veredicto: O MSI Katana 17 B13V é um bom sistema de jogo

O laptop MSI Katana 17 B13V nos impressionou em sua principal área de competência - jogos. ONvidia GeForce RTX 4060garante níveis de alto desempenho que podem competir com a geração anterior do RTX 3070 Ti. Além da rápida GPU, a MSI vem com um display de 144 Hz bem como um teclado RGB e proporciona uma experiência de digitação muito boa. Apesar da potência em mãos, o laptop permanece comparativamente frio.
Acima de tudo, o principal ponto de crítica é a tela: Ele não é muito brilhante e tem pouca cobertura de espaço de cores, bem como tempos de resposta altos. Além disso, uma porta USB-2.0 é algo que 2023 pode realmente dispensar. Além disso, descobrimos também que o layout do teclado foi mal executado, pois teclas como a FN foram movidas para locais bastante incomuns. É de se esperar uma bateria fraca de um laptop para jogos, mas ainda assim é digno de crítica.
O GeForce RTX 4060: A atração do MSI 17 Katana B13V fica de pé ou cai com a GPU.
No geral, o MSI Katana 17 ganhou uma boa classificação e, com o RTX 4060, é definitivamente uma escolha interessante para os jogadores. Entretanto, em tempos de inflação, isto também se aplica aos dispositivos da geração anterior, tais como oGigabyte G7 KEcom um RTX 3060. Clientes conscientes dos preços podem economizar muito dinheiro em um dos modelos de última geração.
Preço e disponibilidade
No momento da publicação desta revisão, o MSI Katana 17 B14V não está atualmente disponível na Amazon e Best Buy. Entretanto, o modelo da geração anterior (3070Ti) pode ser obtido atualmente na Amazon para por volta de 1499 dólares.
MSI Katana 17 B13VFK
- 02/21/2023 v7 (old)
Benjamin Herzig
Transparência
A seleção dos dispositivos a serem analisados é feita pela nossa equipe editorial. A amostra de teste foi fornecida ao autor como empréstimo pelo fabricante ou varejista para fins desta revisão. O credor não teve influência nesta revisão, nem o fabricante recebeu uma cópia desta revisão antes da publicação. Não houve obrigação de publicar esta revisão. Como empresa de mídia independente, a Notebookcheck não está sujeita à autoridade de fabricantes, varejistas ou editores.
É assim que o Notebookcheck está testando
Todos os anos, o Notebookcheck analisa de forma independente centenas de laptops e smartphones usando procedimentos padronizados para garantir que todos os resultados sejam comparáveis. Desenvolvemos continuamente nossos métodos de teste há cerca de 20 anos e definimos padrões da indústria no processo. Em nossos laboratórios de teste, equipamentos de medição de alta qualidade são utilizados por técnicos e editores experientes. Esses testes envolvem um processo de validação em vários estágios. Nosso complexo sistema de classificação é baseado em centenas de medições e benchmarks bem fundamentados, o que mantém a objetividade.Price comparison

