Asus ROG Strix G17 G713PI: O laptop para jogos impressiona no teste com o novo Ryzen 9
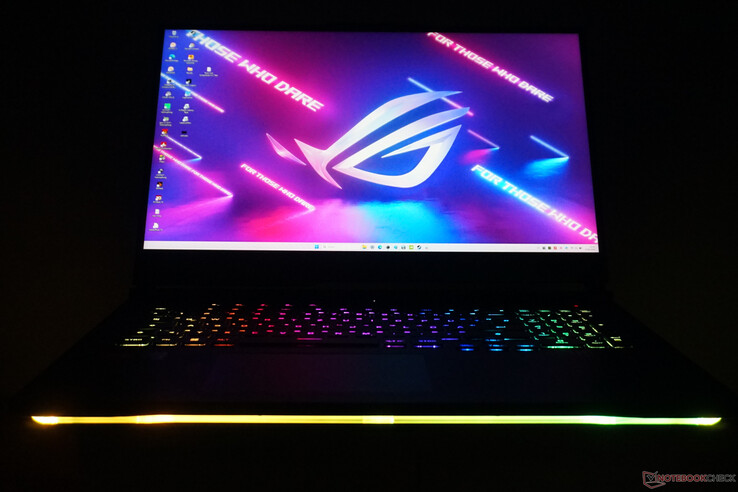
Com o ROG Strix G17, a Asus apresenta um laptop para jogos que deve causar uma impressão, particularmente com seu processador. E de fato, 16 núcleos, 32 fios, um enorme cache L3 de 64-MB, e a arquitetura Zen4 doAMD Ryzen 9 7945HX pelo menos soa impressionante. Acontece que isto não só se aplica à folha de especificações técnicas, mas a CPU também faz um bom trabalho em nossos benchmarks.
Você também pode selecionar entre os três chips gráficos móveis menores da série RTX 4000, que todos garantem que os 240 Hertz da tela de 17 polegadas, de outra forma simples, sejam fornecidos com um número suficiente de quadros. Eles também mantêm o preço dentro de limites aceitáveis, começando na faixa de 2.000 euros (~$2.123) para o ROG Strix. Além do desempenho de jogo convincente e visuais dignos, há também algumas economias menores que não prejudicam a impressão geral e impedem o desempenho do jogo no máximo minimamente.
Nossa configuração de teste G713PI-LL005W com 32 GB de RAM, a Nvidia GeForce RTX 4070, e 1-TB M.2 SSD está em concorrência direta com os Asus ROG Strix G18 eLâmina Razer 18que também estão equipados com o mesmo Nvidia GeForce RTX 4070e processadores Intel. A comparação com a geração anterior de placas gráficas também deve ser interessante. Nossos benchmarks devem mostrar o quanto ela é capaz de superar um Asus ROG Strix Scar 17 SEcom oRTX 3080 Ti ou umAlienware m17 R5com o AMD Radeon RX 6850M XT.
Possíveis concorrentes em comparação
Avaliação | Data | Modelo | Peso | Altura | Size | Resolução | Preço |
|---|---|---|---|---|---|---|---|
| 88.4 % v7 (old) | 04/2023 | Asus ROG Strix G17 G713PI R9 7945HX, GeForce RTX 4070 Laptop GPU | 2.8 kg | 30.7 mm | 17.30" | 2560x1440 | |
| 87.4 % v7 (old) | 03/2023 | Asus ROG Strix G18 G814JI i7-13650HX, GeForce RTX 4070 Laptop GPU | 3 kg | 31 mm | 18.00" | 2560x1600 | |
| 91.4 % v7 (old) | 02/2023 | Razer Blade 18 RTX 4070 i9-13950HX, GeForce RTX 4070 Laptop GPU | 3 kg | 21.9 mm | 18.00" | 2560x1600 | |
| 86.9 % v7 (old) | 11/2022 | Asus ROG Strix Scar 17 SE G733CX-LL014W i9-12950HX, GeForce RTX 3080 Ti Laptop GPU | 2.9 kg | 28.3 mm | 17.30" | 2560x1440 | |
| 88 % v7 (old) | 04/2023 | Asus Zephyrus Duo 16 GX650PY-NM006W R9 7945HX, GeForce RTX 4090 Laptop GPU | 2.7 kg | 29.7 mm | 16.00" | 2560x1600 | |
| 86.1 % v7 (old) | 01/2023 | Alienware m17 R5 (R9 6900HX, RX 6850M XT) R9 6900HX, Radeon RX 6850M XT | 3.4 kg | 26.7 mm | 17.00" | 3840x2160 | |
| 88.4 % v7 (old) | 03/2023 | Asus ROG Strix G16 G614JZ i9-13980HX, GeForce RTX 4080 Laptop GPU | 2.4 kg | 30.4 mm | 16.00" | 2560x1600 |
Os Top 10
» Os Top 10 Portáteis Multimídia
» Os Top 10 Portáteis de Jogos
» Os Top 10 Portáteis Leves para Jogos
» Os Top 10 Portáteis Acessíveis de Escritório/Empresariais
» Os Top 10 Portáteis Premium de Escritório/Empresariais
» Os Top 10 dos Portáteis Workstation
» Os Top 10 Subportáteis
» Os Top 10 Ultrabooks
» Os Top 10 Conversíveis
» Os Top 10 Tablets
» Os Top 10 Smartphones
» A melhores Telas de Portáteis Analisadas Pela Notebookcheck
» Top 10 dos portáteis abaixo dos 500 Euros da Notebookcheck
» Top 10 dos Portáteis abaixo dos 300 Euros
Case - Robusto e lúdico ROG Strix
A caixa maciça do laptop para jogos mostra uma excelente estabilidade. Apesar de seu pesado peso de quase 3 kg, não conseguimos detectar nenhuma deformação, mesmo que toda a unidade base seja feita exclusivamente de plástico. Em contraste, o grande visor de 17,3 polegadas está emoldurado em uma tampa de metal. A construção geral parece ser correspondentemente robusta, sem dar qualquer motivo de reclamação.
Destacam-se os muitos elementos de acentuação grandes e pequenos. A tampa contém um logotipo brilhante que permanece sempre iluminado em branco. A parte inferior também abriga uma barra RGB livremente configurável que pode ser iluminada junto com ou independente do teclado RGB. Além disso, há letras e slogans ao redor da caixa.
A grande distância entre o display e a parte de trás da caixa com os ventiladores parece bem pensada. Quando o case é fechado, todos os LEDs de status permanecem visíveis e os ventiladores continuam a funcionar sem nenhum impedimento, enquanto você pode continuar jogando seu jogo usando um monitor externo e um teclado de mesa.
Considerando a tela de 17 polegadas, a Asus ROG Strix é um dos maiores laptops. Em comparação com a geração predecessora do ROG Strix Scar 17 SEa espessura da caixa aumentou em quase 2 mm (~0,08 pol.). Apesar dos luneis de 5 mm (~0,2 pol.) de mostrador atrativamente finos, as grandes áreas para o resfriamento fazem dele um laptop grande. Entretanto, os concorrentes estão dentro de uma faixa de tamanho semelhante, e o mesmo vale para o peso de quase 3 kg (~6,6 lb).
Equipamento de conexão - Nada de especial no laptop para jogos
Somente o que é absolutamente necessário e também com apenas uma velocidade insuficiente - o equipamento de conexão é muito limitado. Apenas duas conexões USB-A no lado esquerdo permitem conectar um mouse de jogo, impressora, e assim por diante. Além disso, há uma porta de áudio simples, mas suficiente para um fone de ouvido.
Como as demais conexões são colocadas na parte de trás, sua mesa pode ser mantida confortavelmente livre de desordem, mesmo que o ROG Strix raramente possa se dar completamente sem nenhuma conexão com fio, como mostraremos abaixo. As duas conexões USB-C mal chegam a 10 Gbit/s, o que mal é suficiente para também iniciar jogos a partir de um SSD externo. Teríamos gostado de ter pelo menos uma porta USB oferecendo duas ou até quatro vezes a velocidade. Vemos uma imagem semelhante com a porta LAN: Enquanto atualmente encontramos frequentemente portas de 2,5 Gbit, a Asus oferece apenas 1 Gbit. Isto é suficiente, mas nada mais.
Há pelo menos três portas de saída de vídeo, mas apenas a primeira porta USB-C suporta G-Sync. Enquanto um laptop para jogos não precisa de uma grande variedade de conexões, as taxas de transferência das poucas conexões disponíveis poderiam ter sido pelo menos mais altas.
Comunicação
Olhar para as taxas de transferência alcançadas pelo módulo WLAN nos ajuda a esquecer rapidamente a fraca porta LAN. O Asus ROG Strix G17 é capaz de superar todos os concorrentes aqui, colocando-se no topo e impressionante em nossas medidas da faixa de 5-GHz. Pelo menos a uma curta distância do roteador, é possível obter taxas de transferência sem fio muito superiores a 1 Gbit/s. Além disso, o Wi-Fi 6E é suportado, cuja grande faixa de comunicação garante menos interferência em áreas com muitas redes WLAN diferentes.
Com isso, ele se enquadra no alcance da maioria dos laptops Intel, enquanto supera significativamente os concorrentes da AMD com CPUs da geração anterior. Por exemplo, o desempenho do envio e recebimento deAlienware m17 R5é 40% mais lento.
Webcam
A pequena câmera parece ter uma colocação infeliz, já que os dedos tendem a tocar diretamente na lente da câmera ao tentar abrir o laptop. Com uma resolução HD, as imagens mostram uma resolução fraca, mas ainda assim são facilmente reconhecíveis mesmo em condições de pouca luz, mesmo que pareçam ligeiramente granulosas. Embora isto deva ser suficiente para chamadas de vídeo simples, se seu interlocutor usa Full-HD ou superior, as diferenças de qualidade são imediatamente aparentes.
O microfone se torna significativamente melhor. Não notamos nenhum som de lata ou distorções audíveis. As vozes gravadas soam naturalmente e são registradas uniformemente a partir de várias direções e distâncias variáveis. Estes são os melhores requisitos para uma conversa dentro do jogo.
Manutenção
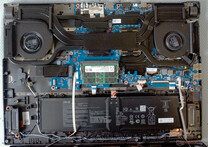
O Asus facilita a abertura do laptop para jogos. Depois de remover onze parafusos Philips, você não precisa de muita força, mas apenas de um toque delicado para remover a placa inferior.
Mas tenha cuidado: devido à iluminação RGB, a placa inferior é conectada à caixa com dois cabos. Entretanto, os cabos ainda são colocados de modo que você possa abrir o fundo sem desconectá-los.
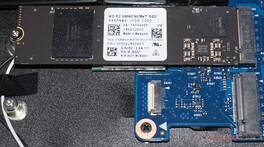
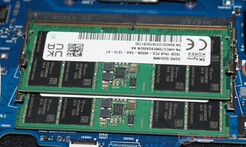
As partes internas da ROG Strix são bem arranjadas e especialmente espaçosas. Os ventiladores podem ser acessados facilmente e a bateria substituída rapidamente. Há um slot livre para expandir o armazenamento, permitindo a inserção de um novo SSD de forma muito simples. Também é fácil substituir o módulo RAM e WLAN (escondido sob o SSD).
Dispositivos de entrada - Um teclado focado em jogos
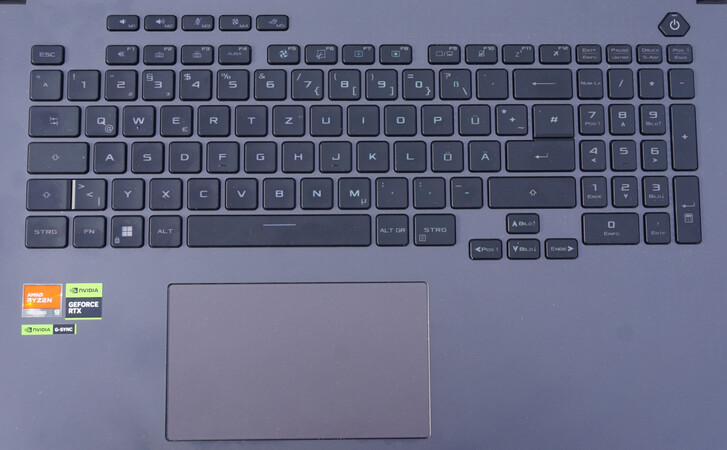
O teclado se apresenta como muito adequado para jogos. Além do bloco de números de tamanho completo e das teclas F que estão de fato predefinidas para suas funções básicas, o ROG Strix oferece cinco teclas adicionais, que controlam os modos de desempenho, o volume e o microfone. No entanto, você também pode configurá-las com suas próprias macros.
O curso da tecla de quase 1,5 mm (~0,06 pol.) torna a digitação muito confortável. Também gostamos do ponto de pressão bem ajustado.
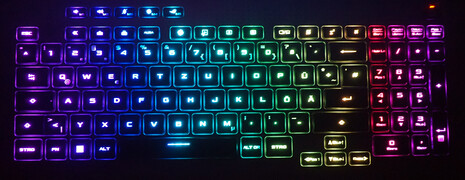
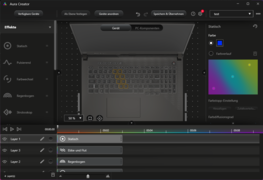
A iluminação do teclado não deixa nada a desejar. Desde o clássico efeito arco-íris até a conexão de teclas individuais aos valores dos sensores, à música tocada ou às cores no visor, o Aura Creator permite programar qualquer comportamento que você possa pensar, mesmo individualmente para cada tecla e os seis elementos na parte inferior. Com os acessórios correspondentes, você também pode estender isto a toda a sua área de trabalho.
O touchpad é grande, e suas teclas ocultas respondem com precisão e com pontos de pressão bem ajustados. Mas normalmente isto não importa muito assim que você conecta um mouse.
Mostrador - Laptop de jogos com uma alta taxa de quadros
Além da alta taxa de atualização e da cobertura do espaço de cores muito grande que cobre pelo menos o Display-P3 quase completamente, a exibição da ROG Strix G17 oferece valores médios. O brilho limitado e, no máximo, o contraste médio não são particularmente atraentes. No entanto, os concorrentes quase não são melhores aqui. Mas se o laptop para jogos estiver em sua mesa em casa e seu ambiente não estiver inundado pela luz do sol, isto não deve importar muito de qualquer forma.
Por outro lado, a grande diagonal de 17 polegadas, amplo espaço de cores, resolução QHD e, é claro, a taxa de atualização de 240-Hz mostram plenamente suas vantagens quando se joga.
Com algumas imagens muito escuras, o sangramento da tela pode se tornar um empecilho. Nossa unidade de teste é afetada por isto no canto superior esquerdo, e é visível mesmo sem exposições longas. No entanto, assim que as imagens ou cenas são ligeiramente mais brilhantes, não é mais perceptível.
| |||||||||||||||||||||||||
iluminação: 89 %
iluminação com acumulador: 327 cd/m²
Contraste: 861:1 (Preto: 0.38 cd/m²)
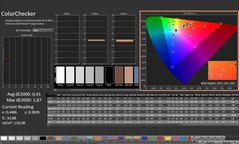
ΔE ColorChecker Calman: 1.01 | ∀{0.5-29.43 Ø4.76}
calibrated: 0.41
ΔE Greyscale Calman: 1.6 | ∀{0.09-98 Ø5}
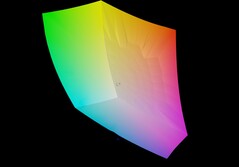
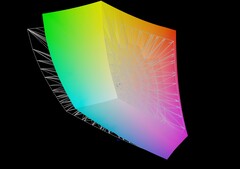
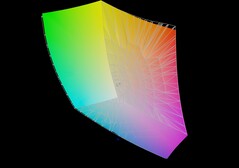
85.9% AdobeRGB 1998 (Argyll 3D)
100% sRGB (Argyll 3D)
98.3% Display P3 (Argyll 3D)
Gamma: 2.168
CCT: 6659 K
| Asus ROG Strix G17 G713PI BOE0B69, IPS, 2560x1440, 17.3" | Asus ROG Strix G18 G814JI NE180QDM-NZ2 (BOE0B35), IPS, 2560x1600, 18" | Razer Blade 18 RTX 4070 AU Optronics B180QAN01.0, IPS, 2560x1600, 18" | Asus ROG Strix Scar 17 SE G733CX-LL014W NE173QHM-NZ2, IPS, 2560x1440, 17.3" | Asus Zephyrus Duo 16 GX650PY-NM006W NE160QDM-NM4, MiniLED, 2560x1600, 16" | Alienware m17 R5 (R9 6900HX, RX 6850M XT) AU Optronics AUODBA3, IPS, 3840x2160, 17" | Asus ROG Strix G16 G614JZ TL160ADMP03-0, IPS, 2560x1600, 16" | |
|---|---|---|---|---|---|---|---|
| Display | 0% | -1% | -1% | 2% | 1% | -1% | |
| Display P3 Coverage (%) | 98.3 | 98.1 0% | 96.9 -1% | 97.1 -1% | 99.4 1% | 97.2 -1% | 97 -1% |
| sRGB Coverage (%) | 100 | 99.9 0% | 99.8 0% | 99.9 0% | 100 0% | 99.6 0% | 99.9 0% |
| AdobeRGB 1998 Coverage (%) | 85.9 | 85.6 0% | 85.3 -1% | 84.8 -1% | 90.8 6% | 88.4 3% | 84.9 -1% |
| Response Times | -6% | 14% | -13% | -154% | -122% | 14% | |
| Response Time Grey 50% / Grey 80% * (ms) | 5.3 ? | 5.6 ? -6% | 4.2 ? 21% | 5.7 ? -8% | 15.2 ? -187% | 16.4 ? -209% | 5.1 ? 4% |
| Response Time Black / White * (ms) | 8.6 ? | 9 ? -5% | 8 ? 7% | 10.1 ? -17% | 19 ? -121% | 11.6 ? -35% | 6.6 ? 23% |
| PWM Frequency (Hz) | 12000 ? | ||||||
| Screen | -24% | -85% | 11% | 119% | -191% | -19% | |
| Brightness middle (cd/m²) | 327 | 471 44% | 549.6 68% | 320 -2% | 712 118% | 484 48% | 470 44% |
| Brightness (cd/m²) | 320 | 422 32% | 524 64% | 303 -5% | 703 120% | 449 40% | 459 43% |
| Brightness Distribution (%) | 89 | 83 -7% | 89 0% | 87 -2% | 95 7% | 87 -2% | 93 4% |
| Black Level * (cd/m²) | 0.38 | 0.47 -24% | 0.53 -39% | 0.3 21% | 0.07 82% | 0.55 -45% | 0.42 -11% |
| Contrast (:1) | 861 | 1002 16% | 1037 20% | 1067 24% | 10171 1081% | 880 2% | 1119 30% |
| Colorchecker dE 2000 * | 1.01 | 2.05 -103% | 3.32 -229% | 1.1 -9% | 1.7 -68% | 4.8 -375% | 1.86 -84% |
| Colorchecker dE 2000 max. * | 4.01 | 4.15 -3% | 6.63 -65% | 2.7 33% | 4 -0% | 7.48 -87% | 3.87 3% |
| Colorchecker dE 2000 calibrated * | 0.41 | 0.8 -95% | 2.7 -559% | 1.2 -193% | 4.74 -1056% | 0.93 -127% | |
| Greyscale dE 2000 * | 1.6 | 2.8 -75% | 2 -25% | 1.1 31% | 2.8 -75% | 5.5 -244% | 2.7 -69% |
| Gamma | 2.168 101% | 2.204 100% | 2.29 96% | 2.13 103% | 2.21 100% | 2.42 91% | 2.246 98% |
| CCT | 6659 98% | 7122 91% | 6319 103% | 6599 98% | 6978 93% | 6148 106% | 6711 97% |
| Média Total (Programa/Configurações) | -10% /
-16% | -24% /
-53% | -1% /
5% | -11% /
55% | -104% /
-140% | -2% /
-10% |
* ... menor é melhor
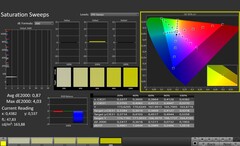
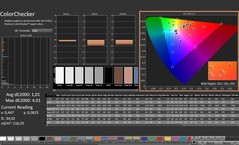
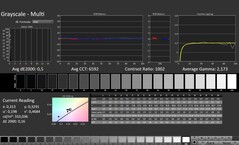
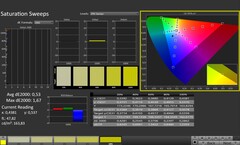
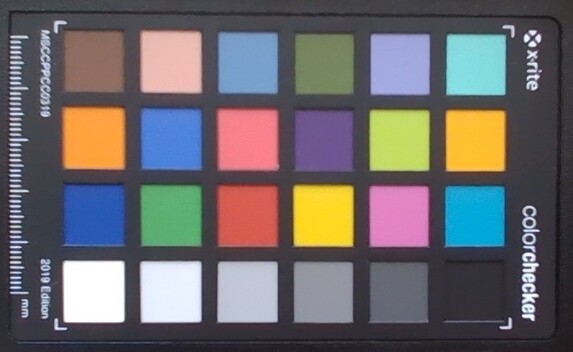
O display colorido é muito preciso, mesmo sem uma calibração adicional. Os desvios são dificilmente perceptíveis com o olho nu. Após uma calibração, todos os desvios caem abaixo dos limites perceptíveis. Com isto, o display também é adequado para o processamento de imagens. Você pode baixar o perfil de cor correspondente do link acima na área com os valores do display.
Os curtos tempos de resposta que são significativamente inferiores a 10 ms, a falta de PWM cintilando, e o grande espaço de cores tornam esta tela muito adequada para um laptop para jogos.
A reprodução colorida também não dá motivo para reclamação. Nossas medidas de reprodução de cores resultam em um 100% sRGB, 98% DCI-P3, e pelo menos 86% AdobeRGB. Além das correspondentes seqüências de jogos maravilhosas, os criadores também terão o que precisam. Somente para exigências profissionais no processamento de imagens você precisaria usar uma tela com cobertura completa do espaço de cores AdobeRGB.
Exibir tempos de resposta
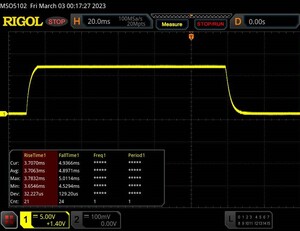
| ↔ Tempo de resposta preto para branco | ||
|---|---|---|
| 8.6 ms ... ascensão ↗ e queda ↘ combinadas | ↗ 3.7 ms ascensão | |
| ↘ 4.9 ms queda | ||
| A tela mostra taxas de resposta rápidas em nossos testes e deve ser adequada para jogos. Em comparação, todos os dispositivos testados variam de 0.1 (mínimo) a 240 (máximo) ms. » 23 % de todos os dispositivos são melhores. Isso significa que o tempo de resposta medido é melhor que a média de todos os dispositivos testados (20.1 ms). | ||
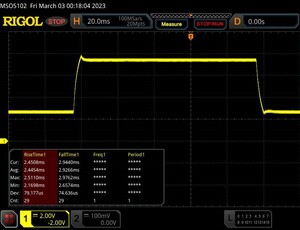
| ↔ Tempo de resposta 50% cinza a 80% cinza | ||
| 5.3 ms ... ascensão ↗ e queda ↘ combinadas | ↗ 2.4 ms ascensão | |
| ↘ 2.9 ms queda | ||
| A tela mostra taxas de resposta muito rápidas em nossos testes e deve ser muito adequada para jogos em ritmo acelerado. Em comparação, todos os dispositivos testados variam de 0.165 (mínimo) a 636 (máximo) ms. » 17 % de todos os dispositivos são melhores. Isso significa que o tempo de resposta medido é melhor que a média de todos os dispositivos testados (31.4 ms). | ||
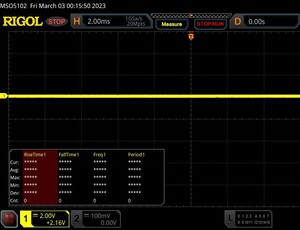
Cintilação da tela / PWM (modulação por largura de pulso)
| Tela tremeluzindo / PWM não detectado | |||
[pwm_comparison] Em comparação: 53 % de todos os dispositivos testados não usam PWM para escurecer a tela. Se PWM foi detectado, uma média de 8013 (mínimo: 5 - máximo: 343500) Hz foi medida. | |||
Há apenas tanta estabilidade de ângulo de visão quanto a necessária para um laptop de jogos como o ROG Strix G17. Uma vez que quase sempre se olha diretamente para a tela pela frente, não deve importar que de ângulos significativamente mais inclinados do que 45°, quaisquer áreas pretas são cobertas por um véu cinza e as cores também aparecem ligeiramente pálidas.
Desempenho - ROG Strix na faixa média superior
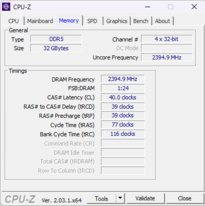
A Asus ROG Strix G17 mal falha uma colocação no segmento high-end, mas isso certamente não é culpa da CPU, que é atualmente um dos modelos mais poderosos. Juntamente com os 32 GB de DDR5-RAM em nossa unidade de teste G713PI-LL005W, isto não deixa dúvidas quanto ao alto desempenho computacional. A placa gráfica, por outro lado, ainda deixa alguma margem para melhorias.
Entretanto, a RTX 4070 ainda deve permitir que você jogue confortavelmente a maioria dos jogos, ainda mais complexos, com os mais altos níveis de detalhes e em resolução total. Se você quiser taxas de quadros tão altas quanto possível, é mais provável que você consiga isso em resolução Full HD. Com os modelos com o RTX 4060 e RTX 4050, você tem que esperar mais alguns compromissos correspondentes.
Condições de teste
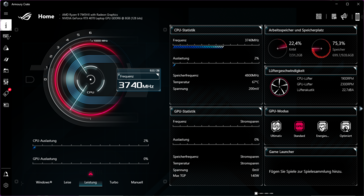
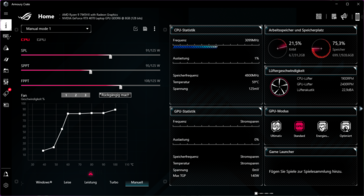
O Asus inclui uma série de perfis de potência no ROG Strix G17 que oferecem ajustes do desempenho do sistema, bem como emissões para várias situações. Usando as opções de ajuste manual, você pode ajustá-los ainda mais ou até mesmo alterá-los completamente.
Realizamos todos os nossos benchmarks usando o modo "Desempenho". Segundo a Asus, este modo oferece um alto desempenho computacional, limitando ao menos o desenvolvimento do ruído. Para comparação, também incluímos uma medição adicional com o modo "Turbo" no teste de carga constante Cinebench-R15, para mostrar o máximo desempenho possível. Entretanto, sem o uso de fones de ouvido ou em altas temperaturas ambientais, este modo não é recomendável por si só.
O processador é executado com diferentes limites de potência em quase todas as situações, mas o consumo de energia é sempre considerável, embora ainda continue sendo apropriado para o alto desempenho computacional.
| PL2 | PL1 | |
| Modo de desempenho | 120 W | 90 W |
| Modo Turbo | 125 W | 125 W |
| Modo silencioso | 100 W | 65 W |
| Desempenho (bateria) | 120 W | 60 W |
| Silencioso (bateria) | 100 W | 40 W |
Processador
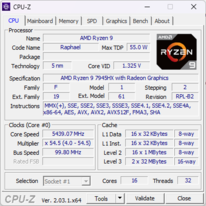
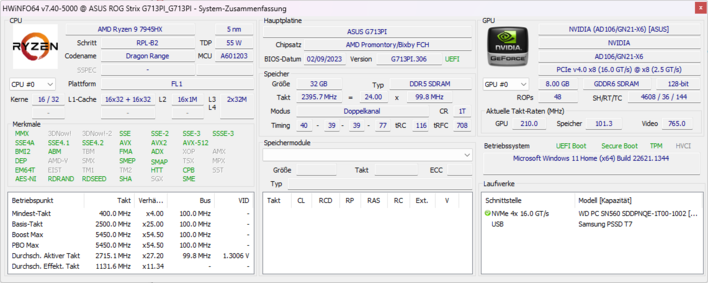
OAMD Ryzen 9 7945HXcom a arquitetura Zen4 atual é capaz de fornecer valores de desempenho consideráveis. Somente seus 16 núcleos e 32 fios garantem uma grande quantidade de reservas de desempenho, permitindo velocidades máximas de relógio de até 5,4 GHz. Também não há falta em termos de cache, e 16 MB de cache L2 e particularmente 64 MB de cache L3 garantem tempos mínimos de carga.
Nossa classificação de desempenho em vários benchmarks de CPU mostra o que isto significa na prática. O processador Zen4 da AMD é colocado em cima quase por todo o lado. Somente nas tarefas que são executadas por um único núcleo de computação, as CPUs da Intel permanecem à frente. No teste de carga constante com o Cinebench R15, o 7945HX em modo Turbo é capaz de superar os valores de um Intel Core i9-13980HX (também no modo Turbo) em cerca de 20%. No Cinebench R23, isto ainda é pelo menos 5%. A diferença de desempenho em relação à geração anterior do processador AMD com a arquitetura Zen3 é ainda mais notável. O AMD Ryzen 9 6900HXatinge apenas a metade dos pontos, com o Intel Core i9-12950HXtambém não está indo muito melhor.
O consumo de energia se mantém praticamente no mesmo nível. Com isto, a AMD foi capaz de alcançar um enorme aumento na eficiência de seus núcleos de computação. Atualmente, dificilmente se pode alcançar um desempenho muito maior com qualquer processador móvel.
Você pode encontrar dados adicionais de desempenho e comparações em nosso Lista de referência de CPU.
Cinebench R15 Multi Constant Load Test
Cinebench R23: Multi Core | Single Core
Cinebench R20: CPU (Multi Core) | CPU (Single Core)
Cinebench R15: CPU Multi 64Bit | CPU Single 64Bit
Blender: v2.79 BMW27 CPU
7-Zip 18.03: 7z b 4 | 7z b 4 -mmt1
Geekbench 5.5: Multi-Core | Single-Core
HWBOT x265 Benchmark v2.2: 4k Preset
LibreOffice : 20 Documents To PDF
R Benchmark 2.5: Overall mean
| CPU Performance rating | |
| Média AMD Ryzen 9 7945HX | |
| Asus Zephyrus Duo 16 GX650PY-NM006W | |
| Asus ROG Strix G16 G614JZ | |
| Asus ROG Strix G17 G713PI | |
| Razer Blade 18 RTX 4070 | |
| Média da turma Gaming | |
| Asus ROG Strix Scar 17 SE G733CX-LL014W | |
| Asus ROG Strix G18 G814JI | |
| Alienware m17 R5 (R9 6900HX, RX 6850M XT) | |
| Cinebench R23 / Multi Core | |
| Asus Zephyrus Duo 16 GX650PY-NM006W | |
| Média AMD Ryzen 9 7945HX (30783 - 34613, n=9) | |
| Asus ROG Strix G17 G713PI | |
| Asus ROG Strix G16 G614JZ | |
| Razer Blade 18 RTX 4070 | |
| Média da turma Gaming (5668 - 40970, n=136, últimos 2 anos) | |
| Asus ROG Strix G18 G814JI | |
| Asus ROG Strix Scar 17 SE G733CX-LL014W | |
| Alienware m17 R5 (R9 6900HX, RX 6850M XT) | |
| Cinebench R23 / Single Core | |
| Asus ROG Strix G16 G614JZ | |
| Razer Blade 18 RTX 4070 | |
| Média da turma Gaming (1136 - 2267, n=136, últimos 2 anos) | |
| Asus Zephyrus Duo 16 GX650PY-NM006W | |
| Média AMD Ryzen 9 7945HX (1861 - 1957, n=9) | |
| Asus ROG Strix Scar 17 SE G733CX-LL014W | |
| Asus ROG Strix G18 G814JI | |
| Asus ROG Strix G17 G713PI | |
| Alienware m17 R5 (R9 6900HX, RX 6850M XT) | |
| Cinebench R20 / CPU (Multi Core) | |
| Asus Zephyrus Duo 16 GX650PY-NM006W | |
| Média AMD Ryzen 9 7945HX (10025 - 13769, n=9) | |
| Asus ROG Strix G16 G614JZ | |
| Razer Blade 18 RTX 4070 | |
| Asus ROG Strix G17 G713PI | |
| Média da turma Gaming (2179 - 16108, n=135, últimos 2 anos) | |
| Asus ROG Strix G18 G814JI | |
| Asus ROG Strix Scar 17 SE G733CX-LL014W | |
| Alienware m17 R5 (R9 6900HX, RX 6850M XT) | |
| Cinebench R20 / CPU (Single Core) | |
| Asus ROG Strix G16 G614JZ | |
| Razer Blade 18 RTX 4070 | |
| Média da turma Gaming (439 - 870, n=135, últimos 2 anos) | |
| Asus Zephyrus Duo 16 GX650PY-NM006W | |
| Média AMD Ryzen 9 7945HX (712 - 760, n=9) | |
| Asus ROG Strix Scar 17 SE G733CX-LL014W | |
| Asus ROG Strix G18 G814JI | |
| Asus ROG Strix G17 G713PI | |
| Alienware m17 R5 (R9 6900HX, RX 6850M XT) | |
| Cinebench R15 / CPU Multi 64Bit | |
| Asus Zephyrus Duo 16 GX650PY-NM006W | |
| Média AMD Ryzen 9 7945HX (4998 - 5663, n=10) | |
| Asus ROG Strix G17 G713PI | |
| Asus ROG Strix G16 G614JZ | |
| Asus ROG Strix G16 G614JZ | |
| Razer Blade 18 RTX 4070 | |
| Média da turma Gaming (1537 - 6271, n=135, últimos 2 anos) | |
| Asus ROG Strix G18 G814JI | |
| Asus ROG Strix Scar 17 SE G733CX-LL014W | |
| Alienware m17 R5 (R9 6900HX, RX 6850M XT) | |
| Cinebench R15 / CPU Single 64Bit | |
| Asus Zephyrus Duo 16 GX650PY-NM006W | |
| Asus ROG Strix G16 G614JZ | |
| Asus ROG Strix G16 G614JZ | |
| Média AMD Ryzen 9 7945HX (290 - 311, n=10) | |
| Razer Blade 18 RTX 4070 | |
| Asus ROG Strix G17 G713PI | |
| Média da turma Gaming (188.8 - 343, n=134, últimos 2 anos) | |
| Asus ROG Strix G18 G814JI | |
| Asus ROG Strix Scar 17 SE G733CX-LL014W | |
| Alienware m17 R5 (R9 6900HX, RX 6850M XT) | |
| Blender / v2.79 BMW27 CPU | |
| Alienware m17 R5 (R9 6900HX, RX 6850M XT) | |
| Asus ROG Strix Scar 17 SE G733CX-LL014W | |
| Asus ROG Strix G18 G814JI | |
| Média da turma Gaming (80 - 517, n=132, últimos 2 anos) | |
| Razer Blade 18 RTX 4070 | |
| Asus ROG Strix G16 G614JZ | |
| Asus ROG Strix G17 G713PI | |
| Média AMD Ryzen 9 7945HX (87 - 100, n=9) | |
| Asus Zephyrus Duo 16 GX650PY-NM006W | |
| 7-Zip 18.03 / 7z b 4 | |
| Asus Zephyrus Duo 16 GX650PY-NM006W | |
| Média AMD Ryzen 9 7945HX (123364 - 140932, n=9) | |
| Asus ROG Strix G17 G713PI | |
| Razer Blade 18 RTX 4070 | |
| Asus ROG Strix G16 G614JZ | |
| Média da turma Gaming (23795 - 148086, n=133, últimos 2 anos) | |
| Asus ROG Strix G18 G814JI | |
| Asus ROG Strix Scar 17 SE G733CX-LL014W | |
| Alienware m17 R5 (R9 6900HX, RX 6850M XT) | |
| 7-Zip 18.03 / 7z b 4 -mmt1 | |
| Média AMD Ryzen 9 7945HX (7319 - 7711, n=9) | |
| Asus ROG Strix G17 G713PI | |
| Asus Zephyrus Duo 16 GX650PY-NM006W | |
| Asus ROG Strix G16 G614JZ | |
| Razer Blade 18 RTX 4070 | |
| Média da turma Gaming (4199 - 7508, n=133, últimos 2 anos) | |
| Asus ROG Strix Scar 17 SE G733CX-LL014W | |
| Asus ROG Strix G18 G814JI | |
| Alienware m17 R5 (R9 6900HX, RX 6850M XT) | |
| Geekbench 5.5 / Multi-Core | |
| Razer Blade 18 RTX 4070 | |
| Média AMD Ryzen 9 7945HX (18372 - 20394, n=9) | |
| Asus Zephyrus Duo 16 GX650PY-NM006W | |
| Asus ROG Strix G16 G614JZ | |
| Asus ROG Strix G17 G713PI | |
| Média da turma Gaming (4557 - 27010, n=133, últimos 2 anos) | |
| Asus ROG Strix Scar 17 SE G733CX-LL014W | |
| Asus ROG Strix G18 G814JI | |
| Alienware m17 R5 (R9 6900HX, RX 6850M XT) | |
| Geekbench 5.5 / Single-Core | |
| Asus Zephyrus Duo 16 GX650PY-NM006W | |
| Média AMD Ryzen 9 7945HX (1960 - 2158, n=9) | |
| Asus ROG Strix G17 G713PI | |
| Asus ROG Strix G16 G614JZ | |
| Razer Blade 18 RTX 4070 | |
| Média da turma Gaming (986 - 2474, n=133, últimos 2 anos) | |
| Asus ROG Strix Scar 17 SE G733CX-LL014W | |
| Asus ROG Strix G18 G814JI | |
| Alienware m17 R5 (R9 6900HX, RX 6850M XT) | |
| HWBOT x265 Benchmark v2.2 / 4k Preset | |
| Média AMD Ryzen 9 7945HX (33.8 - 37.6, n=8) | |
| Asus Zephyrus Duo 16 GX650PY-NM006W | |
| Asus ROG Strix G17 G713PI | |
| Razer Blade 18 RTX 4070 | |
| Asus ROG Strix G16 G614JZ | |
| Média da turma Gaming (7.7 - 44.3, n=133, últimos 2 anos) | |
| Asus ROG Strix G18 G814JI | |
| Asus ROG Strix Scar 17 SE G733CX-LL014W | |
| Alienware m17 R5 (R9 6900HX, RX 6850M XT) | |
| LibreOffice / 20 Documents To PDF | |
| Asus Zephyrus Duo 16 GX650PY-NM006W | |
| Asus ROG Strix G18 G814JI | |
| Alienware m17 R5 (R9 6900HX, RX 6850M XT) | |
| Média da turma Gaming (19 - 88.8, n=133, últimos 2 anos) | |
| Asus ROG Strix G16 G614JZ | |
| Asus ROG Strix G17 G713PI | |
| Média AMD Ryzen 9 7945HX (35.5 - 60.4, n=8) | |
| Razer Blade 18 RTX 4070 | |
| Asus ROG Strix Scar 17 SE G733CX-LL014W | |
| R Benchmark 2.5 / Overall mean | |
| Alienware m17 R5 (R9 6900HX, RX 6850M XT) | |
| Asus ROG Strix G18 G814JI | |
| Média da turma Gaming (0.3439 - 0.759, n=134, últimos 2 anos) | |
| Asus ROG Strix Scar 17 SE G733CX-LL014W | |
| Asus ROG Strix G17 G713PI | |
| Média AMD Ryzen 9 7945HX (0.3884 - 0.4159, n=8) | |
| Asus Zephyrus Duo 16 GX650PY-NM006W | |
| Razer Blade 18 RTX 4070 | |
| Asus ROG Strix G16 G614JZ | |
* ... menor é melhor
AIDA64: FP32 Ray-Trace | FPU Julia | CPU SHA3 | CPU Queen | FPU SinJulia | FPU Mandel | CPU AES | CPU ZLib | FP64 Ray-Trace | CPU PhotoWorxx
| Performance rating | |
| Média AMD Ryzen 9 7945HX | |
| Asus ROG Strix G17 G713PI | |
| Razer Blade 18 RTX 4070 | |
| Asus ROG Strix G16 G614JZ | |
| Média da turma Gaming | |
| Asus ROG Strix Scar 17 SE G733CX-LL014W | |
| Asus ROG Strix G18 G814JI | |
| AIDA64 / FP32 Ray-Trace | |
| Média AMD Ryzen 9 7945HX (50388 - 60169, n=7) | |
| Asus ROG Strix G17 G713PI | |
| Média da turma Gaming (7192 - 85542, n=133, últimos 2 anos) | |
| Asus ROG Strix G16 G614JZ | |
| Razer Blade 18 RTX 4070 | |
| Asus ROG Strix G18 G814JI | |
| Asus ROG Strix Scar 17 SE G733CX-LL014W | |
| AIDA64 / FPU Julia | |
| Asus ROG Strix G17 G713PI | |
| Média AMD Ryzen 9 7945HX (201874 - 252486, n=7) | |
| Asus ROG Strix G16 G614JZ | |
| Razer Blade 18 RTX 4070 | |
| Média da turma Gaming (35040 - 238426, n=133, últimos 2 anos) | |
| Asus ROG Strix G18 G814JI | |
| Asus ROG Strix Scar 17 SE G733CX-LL014W | |
| AIDA64 / CPU SHA3 | |
| Média AMD Ryzen 9 7945HX (8525 - 10389, n=7) | |
| Asus ROG Strix G17 G713PI | |
| Asus ROG Strix G16 G614JZ | |
| Razer Blade 18 RTX 4070 | |
| Média da turma Gaming (1728 - 9817, n=133, últimos 2 anos) | |
| Asus ROG Strix G18 G814JI | |
| Asus ROG Strix Scar 17 SE G733CX-LL014W | |
| AIDA64 / CPU Queen | |
| Média AMD Ryzen 9 7945HX (175041 - 200651, n=7) | |
| Asus ROG Strix G17 G713PI | |
| Asus ROG Strix G16 G614JZ | |
| Razer Blade 18 RTX 4070 | |
| Média da turma Gaming (49785 - 173351, n=133, últimos 2 anos) | |
| Asus ROG Strix G18 G814JI | |
| Asus ROG Strix Scar 17 SE G733CX-LL014W | |
| AIDA64 / FPU SinJulia | |
| Média AMD Ryzen 9 7945HX (28794 - 32988, n=7) | |
| Asus ROG Strix G17 G713PI | |
| Asus ROG Strix G16 G614JZ | |
| Razer Blade 18 RTX 4070 | |
| Média da turma Gaming (4424 - 33636, n=133, últimos 2 anos) | |
| Asus ROG Strix Scar 17 SE G733CX-LL014W | |
| Asus ROG Strix G18 G814JI | |
| AIDA64 / FPU Mandel | |
| Média AMD Ryzen 9 7945HX (105740 - 134044, n=7) | |
| Asus ROG Strix G17 G713PI | |
| Média da turma Gaming (17585 - 128721, n=133, últimos 2 anos) | |
| Asus ROG Strix G16 G614JZ | |
| Razer Blade 18 RTX 4070 | |
| Asus ROG Strix G18 G814JI | |
| Asus ROG Strix Scar 17 SE G733CX-LL014W | |
| AIDA64 / CPU AES | |
| Média AMD Ryzen 9 7945HX (126790 - 325960, n=7) | |
| Asus ROG Strix G17 G713PI | |
| Asus ROG Strix Scar 17 SE G733CX-LL014W | |
| Asus ROG Strix G16 G614JZ | |
| Razer Blade 18 RTX 4070 | |
| Média da turma Gaming (19065 - 247074, n=133, últimos 2 anos) | |
| Asus ROG Strix G18 G814JI | |
| AIDA64 / CPU ZLib | |
| Média AMD Ryzen 9 7945HX (2022 - 2409, n=7) | |
| Asus ROG Strix G17 G713PI | |
| Asus ROG Strix G16 G614JZ | |
| Razer Blade 18 RTX 4070 | |
| Média da turma Gaming (373 - 2531, n=133, últimos 2 anos) | |
| Asus ROG Strix G18 G814JI | |
| Asus ROG Strix Scar 17 SE G733CX-LL014W | |
| AIDA64 / FP64 Ray-Trace | |
| Média AMD Ryzen 9 7945HX (26875 - 31796, n=7) | |
| Asus ROG Strix G17 G713PI | |
| Média da turma Gaming (3856 - 45446, n=133, últimos 2 anos) | |
| Asus ROG Strix G16 G614JZ | |
| Razer Blade 18 RTX 4070 | |
| Asus ROG Strix G18 G814JI | |
| Asus ROG Strix Scar 17 SE G733CX-LL014W | |
| AIDA64 / CPU PhotoWorxx | |
| Razer Blade 18 RTX 4070 | |
| Média da turma Gaming (10805 - 62916, n=133, últimos 2 anos) | |
| Asus ROG Strix Scar 17 SE G733CX-LL014W | |
| Asus ROG Strix G18 G814JI | |
| Asus ROG Strix G16 G614JZ | |
| Média AMD Ryzen 9 7945HX (31421 - 40095, n=7) | |
| Asus ROG Strix G17 G713PI | |
Desempenho do sistema
Basicamente, tudo funciona rapidamente com a Asus ROG Strix. Instalar programas, apagar e executar facilmente várias aplicações em paralelo não representa nenhum problema para o laptop do jogo. Não há quase nenhum tempo de espera, particularmente porque o processador opera em um nível elevado durante todo o processo.
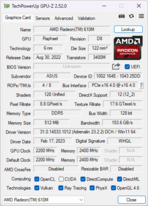
Por outro lado, a troca entre o processador interno AMD Radeon 610Me oNvidia GeForce RTX 4070não funciona sem nenhum problema. Ocasionalmente, você verá uma tela preta ao iniciar algum programa, e isso não apenas enquanto estiver jogando. Este também é o caso quando se ativa a Nvidia Optimus. Também temos que observar que o dGPU recebe repetidamente algumas tarefas, por exemplo, enquanto navega. Isto aumenta desnecessariamente o consumo de energia ou diminui o tempo de funcionamento durante a operação da bateria.
No entanto, devemos esperar que algumas atualizações adicionais do driver remedeiem estes comportamentos. Mas até lá, é provavelmente aconselhável desligar os gráficos integrados na operação de rede via Armoury Crate. Isto melhorará a experiência do usuário, particularmente quando se alterna frequentemente entre programas. Uma cooperação sem fricções entre os dois chips gráficos teria sido melhor.
CrossMark: Overall | Productivity | Creativity | Responsiveness
| PCMark 10 / Score | |
| Asus Zephyrus Duo 16 GX650PY-NM006W | |
| Média da turma Gaming (5776 - 10060, n=113, últimos 2 anos) | |
| Média AMD Ryzen 9 7945HX, NVIDIA GeForce RTX 4070 Laptop GPU (7449 - 8334, n=2) | |
| Razer Blade 18 RTX 4070 | |
| Asus ROG Strix G17 G713PI | |
| Alienware m17 R5 (R9 6900HX, RX 6850M XT) | |
| Asus ROG Strix G16 G614JZ | |
| Asus ROG Strix Scar 17 SE G733CX-LL014W | |
| Asus ROG Strix G18 G814JI | |
| PCMark 10 / Essentials | |
| Asus Zephyrus Duo 16 GX650PY-NM006W | |
| Asus ROG Strix G16 G614JZ | |
| Razer Blade 18 RTX 4070 | |
| Média AMD Ryzen 9 7945HX, NVIDIA GeForce RTX 4070 Laptop GPU (11166 - 11364, n=2) | |
| Asus ROG Strix G17 G713PI | |
| Média da turma Gaming (8810 - 12600, n=117, últimos 2 anos) | |
| Asus ROG Strix Scar 17 SE G733CX-LL014W | |
| Alienware m17 R5 (R9 6900HX, RX 6850M XT) | |
| Asus ROG Strix G18 G814JI | |
| PCMark 10 / Productivity | |
| Asus Zephyrus Duo 16 GX650PY-NM006W | |
| Asus ROG Strix G17 G713PI | |
| Média AMD Ryzen 9 7945HX, NVIDIA GeForce RTX 4070 Laptop GPU (10441 - 11087, n=2) | |
| Média da turma Gaming (6662 - 16716, n=115, últimos 2 anos) | |
| Asus ROG Strix Scar 17 SE G733CX-LL014W | |
| Razer Blade 18 RTX 4070 | |
| Alienware m17 R5 (R9 6900HX, RX 6850M XT) | |
| Asus ROG Strix G18 G814JI | |
| Asus ROG Strix G16 G614JZ | |
| PCMark 10 / Digital Content Creation | |
| Asus Zephyrus Duo 16 GX650PY-NM006W | |
| Média da turma Gaming (7440 - 19351, n=115, últimos 2 anos) | |
| Alienware m17 R5 (R9 6900HX, RX 6850M XT) | |
| Média AMD Ryzen 9 7945HX, NVIDIA GeForce RTX 4070 Laptop GPU (9062 - 13239, n=2) | |
| Asus ROG Strix G16 G614JZ | |
| Razer Blade 18 RTX 4070 | |
| Asus ROG Strix Scar 17 SE G733CX-LL014W | |
| Asus ROG Strix G17 G713PI | |
| Asus ROG Strix G18 G814JI | |
| CrossMark / Overall | |
| Asus ROG Strix G16 G614JZ | |
| Razer Blade 18 RTX 4070 | |
| Asus ROG Strix Scar 17 SE G733CX-LL014W | |
| Asus Zephyrus Duo 16 GX650PY-NM006W | |
| Média AMD Ryzen 9 7945HX, NVIDIA GeForce RTX 4070 Laptop GPU (2037 - 2044, n=2) | |
| Asus ROG Strix G17 G713PI | |
| Média da turma Gaming (1247 - 2344, n=113, últimos 2 anos) | |
| Alienware m17 R5 (R9 6900HX, RX 6850M XT) | |
| CrossMark / Productivity | |
| Asus ROG Strix G16 G614JZ | |
| Razer Blade 18 RTX 4070 | |
| Asus ROG Strix Scar 17 SE G733CX-LL014W | |
| Asus Zephyrus Duo 16 GX650PY-NM006W | |
| Asus ROG Strix G17 G713PI | |
| Média AMD Ryzen 9 7945HX, NVIDIA GeForce RTX 4070 Laptop GPU (1909 - 1917, n=2) | |
| Média da turma Gaming (1299 - 2211, n=113, últimos 2 anos) | |
| Alienware m17 R5 (R9 6900HX, RX 6850M XT) | |
| CrossMark / Creativity | |
| Asus ROG Strix G16 G614JZ | |
| Razer Blade 18 RTX 4070 | |
| Asus Zephyrus Duo 16 GX650PY-NM006W | |
| Asus ROG Strix Scar 17 SE G733CX-LL014W | |
| Média AMD Ryzen 9 7945HX, NVIDIA GeForce RTX 4070 Laptop GPU (2313 - 2335, n=2) | |
| Asus ROG Strix G17 G713PI | |
| Média da turma Gaming (1275 - 2729, n=113, últimos 2 anos) | |
| Alienware m17 R5 (R9 6900HX, RX 6850M XT) | |
| CrossMark / Responsiveness | |
| Asus ROG Strix G16 G614JZ | |
| Asus ROG Strix Scar 17 SE G733CX-LL014W | |
| Razer Blade 18 RTX 4070 | |
| Média da turma Gaming (1030 - 2330, n=113, últimos 2 anos) | |
| Asus Zephyrus Duo 16 GX650PY-NM006W | |
| Média AMD Ryzen 9 7945HX, NVIDIA GeForce RTX 4070 Laptop GPU (1671 - 1682, n=2) | |
| Asus ROG Strix G17 G713PI | |
| Alienware m17 R5 (R9 6900HX, RX 6850M XT) | |
| PCMark 10 Score | 7449 pontos | |
Ajuda | ||
| AIDA64 / Memory Copy | |
| Razer Blade 18 RTX 4070 | |
| Média da turma Gaming (21750 - 108104, n=133, últimos 2 anos) | |
| Asus ROG Strix G18 G814JI | |
| Asus ROG Strix Scar 17 SE G733CX-LL014W | |
| Asus ROG Strix G16 G614JZ | |
| Média AMD Ryzen 9 7945HX (48948 - 57953, n=7) | |
| Alienware m17 R5 (R9 6900HX, RX 6850M XT) | |
| Asus ROG Strix G17 G713PI | |
| AIDA64 / Memory Read | |
| Razer Blade 18 RTX 4070 | |
| Média da turma Gaming (22956 - 104349, n=133, últimos 2 anos) | |
| Asus ROG Strix G16 G614JZ | |
| Asus ROG Strix Scar 17 SE G733CX-LL014W | |
| Asus ROG Strix G18 G814JI | |
| Média AMD Ryzen 9 7945HX (56910 - 67753, n=7) | |
| Asus ROG Strix G17 G713PI | |
| Alienware m17 R5 (R9 6900HX, RX 6850M XT) | |
| AIDA64 / Memory Write | |
| Razer Blade 18 RTX 4070 | |
| Média da turma Gaming (22297 - 133486, n=133, últimos 2 anos) | |
| Asus ROG Strix Scar 17 SE G733CX-LL014W | |
| Média AMD Ryzen 9 7945HX (58602 - 70063, n=7) | |
| Asus ROG Strix G18 G814JI | |
| Asus ROG Strix G16 G614JZ | |
| Asus ROG Strix G17 G713PI | |
| Alienware m17 R5 (R9 6900HX, RX 6850M XT) | |
| AIDA64 / Memory Latency | |
| Média da turma Gaming (59.5 - 259, n=133, últimos 2 anos) | |
| Alienware m17 R5 (R9 6900HX, RX 6850M XT) | |
| Asus ROG Strix G16 G614JZ | |
| Asus ROG Strix G17 G713PI | |
| Asus ROG Strix Scar 17 SE G733CX-LL014W | |
| Razer Blade 18 RTX 4070 | |
| Média AMD Ryzen 9 7945HX (77.1 - 91.3, n=7) | |
| Asus ROG Strix G18 G814JI | |
* ... menor é melhor
Latências DPC
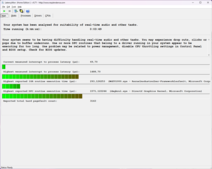
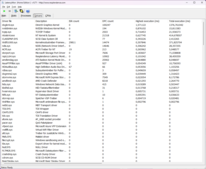
A avaliação das latências não se revela nem particularmente boa nem realmente ruim. Entretanto, o programa LatencyMon adverte que pode haver alguns problemas com o processamento de áudio em tempo real. Mas apenas muito poucos laptops podem evitar isso de qualquer forma.
Atualmente, Nvidia adverte sobre problemas com o aumento das latências com seus drivers. Na verdade, a lista de drivers da LatencyMon mostra apenas esse driver particular do DirectX como o principal culpado pela avaliação menos que ótima. A atualização de alguns outros drivers também pode mudar o resultado positiva ou negativamente.
O ROG Strix G17 se mostra muito bom, mas não muito perfeito no teste de transmissão de vídeo 4K. A CPU é carregada apenas a 4%, e há apenas uma única queda de quadro na reprodução do vídeo.
| DPC Latencies / LatencyMon - interrupt to process latency (max), Web, Youtube, Prime95 | |
| Asus Zephyrus Duo 16 GX650PY-NM006W | |
| Asus ROG Strix Scar 17 SE G733CX-LL014W | |
| Asus ROG Strix G16 G614JZ | |
| Asus ROG Strix G17 G713PI | |
| Alienware m17 R5 (R9 6900HX, RX 6850M XT) | |
| Razer Blade 18 RTX 4070 | |
| Asus ROG Strix G18 G814JI | |
* ... menor é melhor
Solução de armazenamento
O SSD se revela um pouco fraco. Em comparação com os concorrentes, o desempenho de leitura e escrita é incapaz de acompanhar o ritmo. Mas pelo menos no teste para as taxas de transferência estáveis constantes, o resultado se revela positivo, já que a velocidade não precisa ser estrangulada devido às altas temperaturas. Um exemplo negativo aqui é o Asus ROG Strix Scar 17com M.2 SSD RAID, cujas taxas de transferência extremas caem para o valor de um SSD SATA a longo prazo.
No entanto, na prática, enquanto joga, renderiza ou navega, o desempenho ligeiramente inferior do SSD não tem nenhum efeito perceptível.
* ... menor é melhor
Disk Throttling: DiskSpd Read Loop, Queue Depth 8
Placa Gráfica
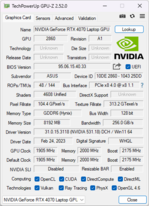
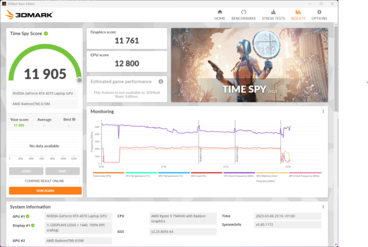
ONvidia GeForce RTX 4070funciona no ROG Strix G17 com o consumo máximo de energia de 115 W permitido pelo fabricante. Além disso, outros 25 W podem ser deslocados do processador, fornecendo um total de 140 W para a GPU. O Asus aumentou ligeiramente a velocidade do relógio. O sistema especifica 2.225 MHz, enquanto que 2.175 MHz são possíveis de acordo com a Nvidia. Este é um aumento de um pouco mais de 2%, o que não faz nenhuma diferença.
A GPU se comporta como esperado em nossos benchmarks. É capaz de atingir aproximadamente o nível do RTX 3080 Ti, embora isso seja capaz de consumir 35 W a mais de potência no caso concreto. Portanto, resta notar que a série RTX-4000 alcançou um salto notável, não apenas em termos de desempenho, mas também de eficiência. Você pode encontrar resultados adicionais que coletamos em nossa lista de referência GPU.
| 3DMark 11 Performance | 34661 pontos | |
| 3DMark Cloud Gate Standard Score | 68557 pontos | |
| 3DMark Fire Strike Score | 28377 pontos | |
| 3DMark Time Spy Score | 11905 pontos | |
Ajuda | ||
* ... menor é melhor
Desempenho nos jogos
Mesmo os jogos atuais podem ser jogados sem problemas na resolução nativa QHD com o máximo de detalhes. Se a quantidade de pixels que tem que ser computada for cortada pela metade como é o caso em resolução Full HD, as taxas de quadros podem ser dobradas quase sempre.
O resultado é considerável. O display de 240-Hz faz brilhar as altas taxas de quadros, enquanto a perda de detalhes de QHD para Full-HD é fácil de suportar. Mas a alta taxa de atualização também tem vantagens a 60 quadros por segundo, uma vez que o atraso de entrada ainda é reduzido significativamente. Isto significa que a exibição sempre faz justiça a suas tarefas, mesmo a menos de 240 fps significativamente.
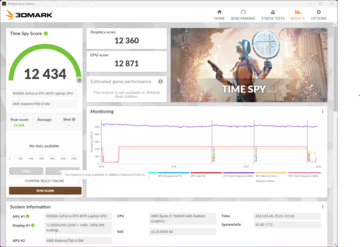
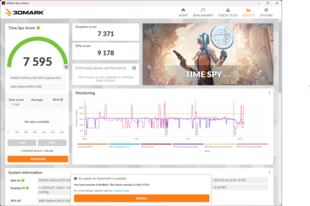
O modo Turbo dificilmente traz melhorias (5% no benchmark Time-Spy), enquanto o nível de ruído aumenta enormemente. O sistema não é muito ruim na operação com bateria. Embora o consumo de energia seja reduzido significativamente, ele ainda atinge 65% do desempenho na operação da rede elétrica.
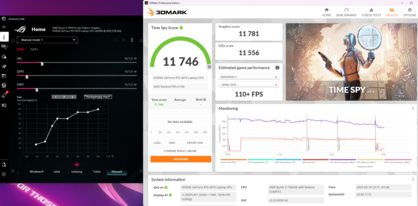
O processador potente é incapaz de contribuir muito para os resultados aqui. Os ajustes manuais de potência permitem reduzir seu consumo de energia a um máximo de 75 W e constante de 50 W, sem causar um pior resultado de referência com isto. Mas este procedimento não é realmente necessário, já que a CPU só permite um consumo de energia significativamente menor sob carga constante de qualquer forma. Se um modelo similar com um processador mais fraco se tornar disponível em algum momento no futuro, ele provavelmente só teria um desempenho minimamente pior nos jogos, de modo que correspondentemente poderia ser a melhor escolha.
| The Witcher 3 - 1920x1080 Ultra Graphics & Postprocessing (HBAO+) | |
| Asus Zephyrus Duo 16 GX650PY-NM006W | |
| Asus ROG Strix G16 G614JZ | |
| Média da turma Gaming (80.2 - 240, n=35, últimos 2 anos) | |
| Alienware m17 R5 (R9 6900HX, RX 6850M XT) | |
| Asus ROG Strix G17 G713PI | |
| Asus ROG Strix G18 G814JI | |
| Asus ROG Strix Scar 17 SE G733CX-LL014W | |
| Razer Blade 18 RTX 4070 | |
| Hogwarts Legacy | |
| 1920x1080 Ultra Preset AA:High T | |
| Asus ROG Strix G16 G614JZ | |
| Asus ROG Strix G17 G713PI | |
| Asus ROG Strix G18 G814JI | |
| Média NVIDIA GeForce RTX 4070 Laptop GPU (41 - 107, n=7) | |
| Média da turma Gaming (35.4 - 108.3, n=4, últimos 2 anos) | |
| 2560x1440 Ultra Preset AA:High T | |
| Asus ROG Strix G16 G614JZ | |
| Asus ROG Strix G18 G814JI | |
| Média da turma Gaming (29.8 - 96.8, n=3, últimos 2 anos) | |
| Média NVIDIA GeForce RTX 4070 Laptop GPU (35 - 71, n=7) | |
| Asus ROG Strix G17 G713PI | |
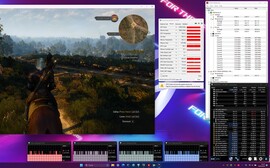
O Witcher 3 funciona de forma estável a um nível elevado no teste de carga constante. Os valores do Asus ROG Strix Scar 17 SE com o RTX 3080 Ti são quase idênticos. Ao mesmo tempo, a distância por trás do RTX 4090é muito grande, mas isso também se aplica aos custos financeiros.
The Witcher 3 FPS Chart
| baixo | média | alto | ultra | QHD DLSS | QHD FSR | QHD | 4K DLSS | 4K FSR | 4K | |
|---|---|---|---|---|---|---|---|---|---|---|
| GTA V (2015) | 178.1 | 114 | ||||||||
| The Witcher 3 (2015) | 216 | 121 | ||||||||
| Dota 2 Reborn (2015) | 169.8 | 163.4 | ||||||||
| Final Fantasy XV Benchmark (2018) | 114.3 | 83.3 | ||||||||
| X-Plane 11.11 (2018) | 128.5 | |||||||||
| Far Cry 5 (2018) | 141 | 132 | 114 | |||||||
| Strange Brigade (2018) | 249 | 210 | 138.1 | |||||||
| Cyberpunk 2077 1.6 (2022) | 86 | 83.3 | 53.1 | |||||||
| F1 22 (2022) | 195.2 | 76.6 | 48.4 | |||||||
| Hogwarts Legacy (2023) | 123 | 107 | 50 | |||||||
| Baldur's Gate 3 (2023) | 164.2 | 129.3 | 114.4 | 109.4 | 110.5 | 60 | 104.7 | 71.5 | 37.2 | |
| Cyberpunk 2077 (2023) | 154.7 | 123.7 | 100.4 | 87.5 | 58.6 | 49.1 | 21.2 | 20.3 | ||
| F1 24 (2024) | 284 | 269 | 220 | 77.4 | 76.1 | 77.3 | 47.7 | 27.3 | 36.3 | 21.3 |
| Star Wars Outlaws (2024) | 40.5 | 40.2 | 29.4 | 25.5 | 15.6 | |||||
| Space Marine 2 (2024) | 84 | 79.9 | 60.7 | 45.5 | 28.9 | |||||
| Call of Duty Black Ops 6 (2024) | 91 | 73 | 96 | 67 | 41 | 38 | 38 | |||
| Stalker 2 (2024) | 49.8 | 47.2 | 35.5 | 1.358 | 1.845 | |||||
| Indiana Jones and the Great Circle (2024) | 71.5 | 28.9 | 24.7 | 15.6 | ||||||
| Kingdom Come Deliverance 2 (2025) | 58.9 | 44.6 | 35.5 | 23.4 | ||||||
| Monster Hunter Wilds (2025) | 82.4 | 63.1 | 35.6 | 35.3 | 22.9 | 16.4 | 12.5 | |||
| Civilization 7 (2025) | 121.2 | 131.8 | 72.8 | 56.4 | 30.3 | |||||
| Assassin's Creed Shadows (2025) | 63 | 55 | 48 | 31 | 37 | 35 | 26 | 22 | 22 | 16 |
Emissões - O laptop para jogos continua a ser mais moderado
Níveis de ruídos
O ruído do ventilador acaba sendo moderado. O Asus Zephyrus Duo 16por exemplo, pode se tornar visivelmente mais alto. Entretanto, se você ligar o modo Turbo, a ROG Strix G17 também mostra seu lado ruidoso. Mas não notamos nenhum uivar espontâneo ao reviver ou mudanças bruscas de velocidade durante nossos testes.
Por outro lado, o que notamos foi algum uivo de bobina em nossa unidade de teste, embora isto permaneça relativamente silencioso e desapareça quando os ventiladores ligam. Quando o som é ligado, a maioria das pessoas não deve notá-lo, mas ele é facilmente audível em ambientes muito silenciosos.
Barulho
| Ocioso |
| 26 / 29 / 30 dB |
| Carga |
| 46 / 47 dB |
 | ||
30 dB silencioso 40 dB(A) audível 50 dB(A) ruidosamente alto |
||
min: | ||
| Asus ROG Strix G17 G713PI R9 7945HX, GeForce RTX 4070 Laptop GPU | Asus ROG Strix G18 G814JI i7-13650HX, GeForce RTX 4070 Laptop GPU | Razer Blade 18 RTX 4070 i9-13950HX, GeForce RTX 4070 Laptop GPU | Asus ROG Strix Scar 17 SE G733CX-LL014W i9-12950HX, GeForce RTX 3080 Ti Laptop GPU | Asus Zephyrus Duo 16 GX650PY-NM006W R9 7945HX, GeForce RTX 4090 Laptop GPU | Alienware m17 R5 (R9 6900HX, RX 6850M XT) R9 6900HX, Radeon RX 6850M XT | Asus ROG Strix G16 G614JZ i9-13980HX, GeForce RTX 4080 Laptop GPU | |
|---|---|---|---|---|---|---|---|
| Noise | 3% | 6% | 13% | -7% | 7% | -3% | |
| desligado / ambiente * (dB) | 25 | 25 -0% | 23.5 6% | 23.9 4% | 23.9 4% | 23 8% | 25 -0% |
| Idle Minimum * (dB) | 26 | 26 -0% | 23.8 8% | 23.9 8% | 23.9 8% | 23 12% | 26 -0% |
| Idle Average * (dB) | 29 | 28 3% | 23.8 18% | 23.9 18% | 32.9 -13% | 28.11 3% | 28 3% |
| Idle Maximum * (dB) | 30 | 29 3% | 26.8 11% | 23.9 20% | 36.5 -22% | 28.11 6% | 30 -0% |
| Load Average * (dB) | 46 | 41 11% | 37.3 19% | 34.3 25% | 42.9 7% | 30.62 33% | 48 -4% |
| Witcher 3 ultra * (dB) | 46 | 44 4% | 48 -4% | 51.2 -11% | 49.75 -8% | 49 -7% | |
| Load Maximum * (dB) | 47 | 46 2% | 53.5 -14% | 45.9 2% | 56 -19% | 50.17 -7% | 52 -11% |
* ... menor é melhor
Temperaturas
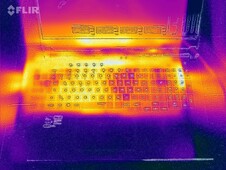
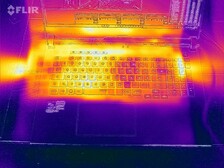
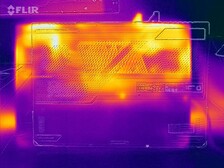
O laptop para jogos é quase sempre quente. Basta surfar para que haja um aumento perceptível da temperatura na área do teclado.
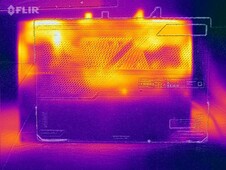
No entanto, não há nenhuma surpresa desconfortável nos valores máximos. Mesmo sob carga, as temperaturas de superfície atingem apenas um pouco mais de 40 °C (104 °F), com os descansos da palma da mão permanecendo mesmo abaixo de 30 °C (86 °F). A transferência de calor para a parte de trás da caixa é muito bem sucedida.
(±) A temperatura máxima no lado superior é 42 °C / 108 F, em comparação com a média de 40.4 °C / 105 F , variando de 21.2 a 68.8 °C para a classe Gaming.
(±) A parte inferior aquece até um máximo de 41 °C / 106 F, em comparação com a média de 43.3 °C / 110 F
(+) Em uso inativo, a temperatura média para o lado superior é 28.8 °C / 84 F, em comparação com a média do dispositivo de 33.9 °C / ### class_avg_f### F.
(±) Jogando The Witcher 3, a temperatura média para o lado superior é 36.6 °C / 98 F, em comparação com a média do dispositivo de 33.9 °C / ## #class_avg_f### F.
(+) Os apoios para as mãos e o touchpad são mais frios que a temperatura da pele, com um máximo de 28 °C / 82.4 F e, portanto, são frios ao toque.
(±) A temperatura média da área do apoio para as mãos de dispositivos semelhantes foi 28.8 °C / 83.8 F (+0.8 °C / 1.4 F).
| Asus ROG Strix G17 G713PI AMD Ryzen 9 7945HX, NVIDIA GeForce RTX 4070 Laptop GPU | Asus ROG Strix G18 G814JI Intel Core i7-13650HX, NVIDIA GeForce RTX 4070 Laptop GPU | Razer Blade 18 RTX 4070 Intel Core i9-13950HX, NVIDIA GeForce RTX 4070 Laptop GPU | Asus ROG Strix Scar 17 SE G733CX-LL014W Intel Core i9-12950HX, NVIDIA GeForce RTX 3080 Ti Laptop GPU | Asus Zephyrus Duo 16 GX650PY-NM006W AMD Ryzen 9 7945HX, NVIDIA GeForce RTX 4090 Laptop GPU | Alienware m17 R5 (R9 6900HX, RX 6850M XT) AMD Ryzen 9 6900HX, AMD Radeon RX 6850M XT | Asus ROG Strix G16 G614JZ Intel Core i9-13980HX, NVIDIA GeForce RTX 4080 Laptop GPU | |
|---|---|---|---|---|---|---|---|
| Heat | 1% | 7% | -9% | 1% | -10% | -12% | |
| Maximum Upper Side * (°C) | 42 | 45 -7% | 39.2 7% | 48.8 -16% | 44.2 -5% | 53 -26% | 54 -29% |
| Maximum Bottom * (°C) | 41 | 47 -15% | 35.6 13% | 52.4 -28% | 46.8 -14% | 56 -37% | 55 -34% |
| Idle Upper Side * (°C) | 33 | 28 15% | 31.8 4% | 30.4 8% | 29.2 12% | 30 9% | 29 12% |
| Idle Bottom * (°C) | 34 | 31 9% | 33.2 2% | 34.1 -0% | 30.2 11% | 29 15% | 33 3% |
* ... menor é melhor
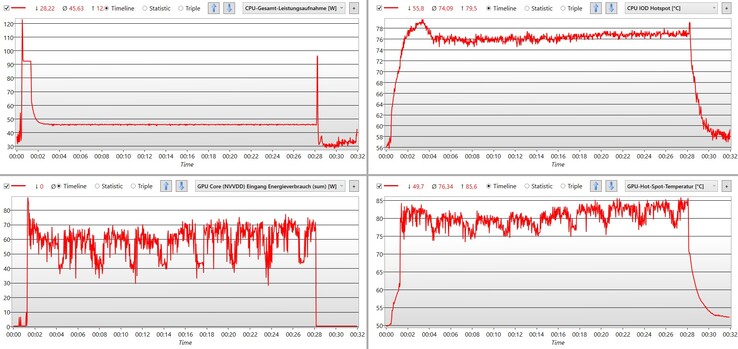
Teste de estresse
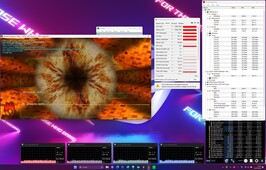
Após apenas 1 min, o consumo de energia da CPU é reduzido drasticamente. Depois disso, as temperaturas da CPU e da GPU permanecem em torno de 70 a 80 °C (158 - 176 °F) e podem ser mantidas de forma confiável neste nível. O consumo de energia inicial do processador e do chip gráfico juntos é reduzido de cerca de 220 W para quase 100 W sob carga constante.
Oradores
Os alto-falantes embutidos soam muito bem, sem mostrar nenhum ponto fraco em todo o espectro de freqüência. Eles até produzem graves particularmente impressionantes. Você também pode ouvir alguns detalhes finos. Se quisermos reclamar a um nível muito alto, podemos dizer que os médios inferiores carecem de algum soco.
Você pode usar os alto-falantes para ouvir música do rock ao clássico, para assistir a filmes e, claro, também para jogos. Entretanto, durante este último, os fãs audíveis podem se tornar irritantes. O resultado é notável para um laptop, cuja qualidade sonora geralmente não é predestinada para tocar música na maioria dos casos. Asus mostra com o ROG Strix G17 que isto pode ser feito significativamente melhor.
Asus ROG Strix G17 G713PI análise de áudio
(±) | o volume do alto-falante é médio, mas bom (###valor### dB)
Graves 100 - 315Hz
(+) | bons graves - apenas 4.6% longe da mediana
(+) | o baixo é linear (6.5% delta para a frequência anterior)
Médios 400 - 2.000 Hz
(+) | médios equilibrados - apenas 3.1% longe da mediana
(+) | médios são lineares (5.9% delta para frequência anterior)
Altos 2 - 16 kHz
(+) | agudos equilibrados - apenas 3.5% longe da mediana
(+) | os máximos são lineares (6.8% delta da frequência anterior)
Geral 100 - 16.000 Hz
(+) | o som geral é linear (9.5% diferença em relação à mediana)
Comparado com a mesma classe
» 3% de todos os dispositivos testados nesta classe foram melhores, 1% semelhantes, 95% piores
» O melhor teve um delta de 6%, a média foi 18%, o pior foi 132%
Comparado com todos os dispositivos testados
» 3% de todos os dispositivos testados foram melhores, 1% semelhantes, 96% piores
» O melhor teve um delta de 4%, a média foi 24%, o pior foi 134%
Apple MacBook Pro 16 2021 M1 Pro análise de áudio
(+) | os alto-falantes podem tocar relativamente alto (###valor### dB)
Graves 100 - 315Hz
(+) | bons graves - apenas 3.8% longe da mediana
(+) | o baixo é linear (5.2% delta para a frequência anterior)
Médios 400 - 2.000 Hz
(+) | médios equilibrados - apenas 1.3% longe da mediana
(+) | médios são lineares (2.1% delta para frequência anterior)
Altos 2 - 16 kHz
(+) | agudos equilibrados - apenas 1.9% longe da mediana
(+) | os máximos são lineares (2.7% delta da frequência anterior)
Geral 100 - 16.000 Hz
(+) | o som geral é linear (4.6% diferença em relação à mediana)
Comparado com a mesma classe
» 0% de todos os dispositivos testados nesta classe foram melhores, 0% semelhantes, 100% piores
» O melhor teve um delta de 5%, a média foi 17%, o pior foi 45%
Comparado com todos os dispositivos testados
» 0% de todos os dispositivos testados foram melhores, 0% semelhantes, 100% piores
» O melhor teve um delta de 4%, a média foi 24%, o pior foi 134%
Gerenciamento de energia - ROG Strix sempre com um alto consumo
Consumo de energia
Em nenhum momento o laptop para jogos é realmente eficiente. Mesmo sem realizar nenhuma tarefa explícita, ele consome quase 20 W. O pico do consumo de energia aumenta para cerca de 250 W. Com isto, a fonte de alimentação bastante grande de 280 W oferece reservas suficientes em todos os casos.
Dando uma olhada noAsus ROG Strix Scar 17 SEo sistema de testes de desempenho, que funciona a nível dos olhos, apesar de sua CPU e GPU não serem mais muito atuais, também é interessante: Ao rodar o Witcher 3, onde também atinge fps quase idênticos, seu consumo de energia é 25% maior. Portanto, pelo menos sob carga maior, nossa unidade de teste ROG Strix G17 é eficiente.
| desligado | |
| Ocioso | |
| Carga |
|
Key:
min: | |
| Asus ROG Strix G17 G713PI R9 7945HX, GeForce RTX 4070 Laptop GPU | Asus ROG Strix G18 G814JI i7-13650HX, GeForce RTX 4070 Laptop GPU | Razer Blade 18 RTX 4070 i9-13950HX, GeForce RTX 4070 Laptop GPU | Asus ROG Strix Scar 17 SE G733CX-LL014W i9-12950HX, GeForce RTX 3080 Ti Laptop GPU | Alienware m17 R5 (R9 6900HX, RX 6850M XT) R9 6900HX, Radeon RX 6850M XT | Asus ROG Strix G16 G614JZ i9-13980HX, GeForce RTX 4080 Laptop GPU | Média da turma Gaming | |
|---|---|---|---|---|---|---|---|
| Power Consumption | 15% | -39% | -20% | 10% | -4% | 5% | |
| Idle Minimum * (Watt) | 15 | 8 47% | 24.5 -63% | 19.3 -29% | 13 13% | 10 33% | 13.8 ? 8% |
| Idle Average * (Watt) | 20 | 15 25% | 34.1 -71% | 26.5 -33% | 16.5 17% | 16 20% | 19.5 ? 2% |
| Idle Maximum * (Watt) | 29 | 26 10% | 47.7 -64% | 27.1 7% | 17 41% | 27 7% | 25.5 ? 12% |
| Load Average * (Watt) | 121 | 102 16% | 140 -16% | 141 -17% | 93 23% | 129 -7% | 110.6 ? 9% |
| Witcher 3 ultra * (Watt) | 179.8 | 178.6 1% | 202 -12% | 225 -25% | 239 -33% | 247 -37% | |
| Load Maximum * (Watt) | 246 | 267 -9% | 261 -6% | 307.9 -25% | 251 -2% | 342 -39% | 257 ? -4% |
* ... menor é melhor
Power Consumption The Witcher 3 / Stress Test
Power Consumption with External Monitor
Vida útil da bateria
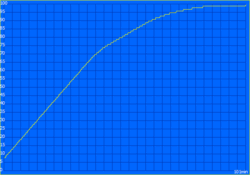
Longos períodos de operação com bateria não fazem definitivamente parte do plano, apesar da grande bateria de 90-Wh. A ROG Strix G17 permanece mesmo abaixo dos valores médios da classe de laptops para jogos, que já são muito baixos, durando apenas 4 horas em nosso teste WLAN com um brilho de tela limitado.
Talvez seja possível chegar a um tempo de execução meio utilizável com alguns ajustes manuais de ajuste. Pelo menos, o Asus mostra que é possível atingir tempos de execução muito mais longos com o ROG Strix G16que é igualmente potente e oferece a mesma capacidade de bateria.
A propósito, a virada da dGPU não levou a uma melhoria notável dos resultados. Com as configurações usadas aqui, o uso móvel do laptop quase não faz sentido, especialmente porque ele só foi capaz de reproduzir um vídeo Full HD no modo avião por menos de 3 horas.
| Asus ROG Strix G17 G713PI R9 7945HX, GeForce RTX 4070 Laptop GPU, 90 Wh | Asus ROG Strix G18 G814JI i7-13650HX, GeForce RTX 4070 Laptop GPU, 90 Wh | Razer Blade 18 RTX 4070 i9-13950HX, GeForce RTX 4070 Laptop GPU, 91.7 Wh | Asus ROG Strix Scar 17 SE G733CX-LL014W i9-12950HX, GeForce RTX 3080 Ti Laptop GPU, 90 Wh | Alienware m17 R5 (R9 6900HX, RX 6850M XT) R9 6900HX, Radeon RX 6850M XT, 97 Wh | Asus ROG Strix G16 G614JZ i9-13980HX, GeForce RTX 4080 Laptop GPU, 90 Wh | Média da turma Gaming | |
|---|---|---|---|---|---|---|---|
| Duração da bateria | 54% | 12% | -2% | 56% | 68% | 68% | |
| H.264 (h) | 2.8 | 4.9 75% | 7.93 ? 183% | ||||
| WiFi v1.3 (h) | 4.3 | 8.1 88% | 4 -7% | 4.2 -2% | 4.8 12% | 9.7 126% | 6.67 ? 55% |
| Witcher 3 ultra (h) | 1.1 | 0.958 ? -13% | |||||
| Load (h) | 1 | 1.2 20% | 1.3 30% | 1.8 80% | 1.1 10% | 1.483 ? 48% |
Pro
Contra
Veredicto - Um pacote bem completo para jogos
Desde o excelente desempenho da CPU até os sólidos pontos de referência de jogo a nível de um RTX 3080 Tia ROG Strix G17 não mostra nenhuma fraqueza. Com isto, as expectativas sobre o novo Nvidia GeForce RTX 4070são cumpridas. O poderoso chip de médio alcance calcula ao nível de uma placa gráfica premium da geração anterior (mas por causa de apenas 8 GB VRAM não é muito prova de futuro). Graças ao R9 7945HXo laptop para jogos é capaz de jogar no topo com seu alto desempenho em computação.
A tela também se ajusta a este desempenho. Com sua reprodução de cores precisas, a resolução QHD, e a taxa de atualização de 240-Hz que se ajusta ao desempenho do sistema, ele parece quase personalizado. O brilho fraco quase não faz diferença ao usá-lo sobre a mesa. A iluminação também é visualmente atrativa. Não vai levar muito tempo para encontrar uma opção de iluminação individual que até dá algumas informações sobre o status do sistema.
Seus principais pontos fracos não fazem nenhuma diferença quando se joga. Isto faz do Asus ROG Strix G17 um laptop para jogos que é bem sucedido em todo o processo, mas também só deve ser usado dessa forma.
A construção do laptop também parece bem pensada. O ruído do ventilador e o desenvolvimento de calor são moderados para o segmento de jogos. Com um slot gratuito para um SSD e acessibilidade descomplicada das partes internas, não há nada na forma de realizar tarefas de manutenção ou substituir componentes importantes.
Felizmente, encontramos os pontos fracos apenas em áreas que não têm impacto no desempenho dos jogos. As conexões USB são decepcionantes, já que um máximo de 10 Gbit/s permanece muito abaixo das possibilidades atuais do USB4 (que também não é suportado). A webcam HD não aparece mais atualizada. Além disso, apesar da capacidade suficiente da bateria, a vida útil da bateria permanece abaixo da média, mesmo para um laptop para jogos.
Mesmo que isto reduza as qualidades do ROG Strix G17 como um allrounder, não muda nada sobre a adequação para jogar os jogos atuais. Em comparação, o Lâmina Razer 18parece mais adequado em geral, oferecendo Thunderbolt 4, uma tela mais brilhante, e um desempenho comparável e um chip gráfico idêntico. Ao mesmo tempo, isso também é muito mais caro sem oferecer nenhum ganho no desempenho do sistema, por isso realmente só representa uma alternativa se você precisar de um laptop mais versátil.
Por outro lado, se o Asus ROG Strix G17 estivesse disponível com um processador um pouco menor no futuro, esse seria, com toda a probabilidade, o concorrente mais próximo, desde que o sistema seja usado quase exclusivamente para jogos.
Preço e Disponibilidade
Nos EUA, a Asus ROG Strix G17 (2023) G713 está disponível no site Asus web shop a partir de $1799.99.
Asus ROG Strix G17 G713PI
- 03/16/2023 v7 (old)
Mario Petzold
Transparência
A seleção dos dispositivos a serem analisados é feita pela nossa equipe editorial. A amostra de teste foi fornecida ao autor como empréstimo pelo fabricante ou varejista para fins desta revisão. O credor não teve influência nesta revisão, nem o fabricante recebeu uma cópia desta revisão antes da publicação. Não houve obrigação de publicar esta revisão. Como empresa de mídia independente, a Notebookcheck não está sujeita à autoridade de fabricantes, varejistas ou editores.
É assim que o Notebookcheck está testando
Todos os anos, o Notebookcheck analisa de forma independente centenas de laptops e smartphones usando procedimentos padronizados para garantir que todos os resultados sejam comparáveis. Desenvolvemos continuamente nossos métodos de teste há cerca de 20 anos e definimos padrões da indústria no processo. Em nossos laboratórios de teste, equipamentos de medição de alta qualidade são utilizados por técnicos e editores experientes. Esses testes envolvem um processo de validação em vários estágios. Nosso complexo sistema de classificação é baseado em centenas de medições e benchmarks bem fundamentados, o que mantém a objetividade.


