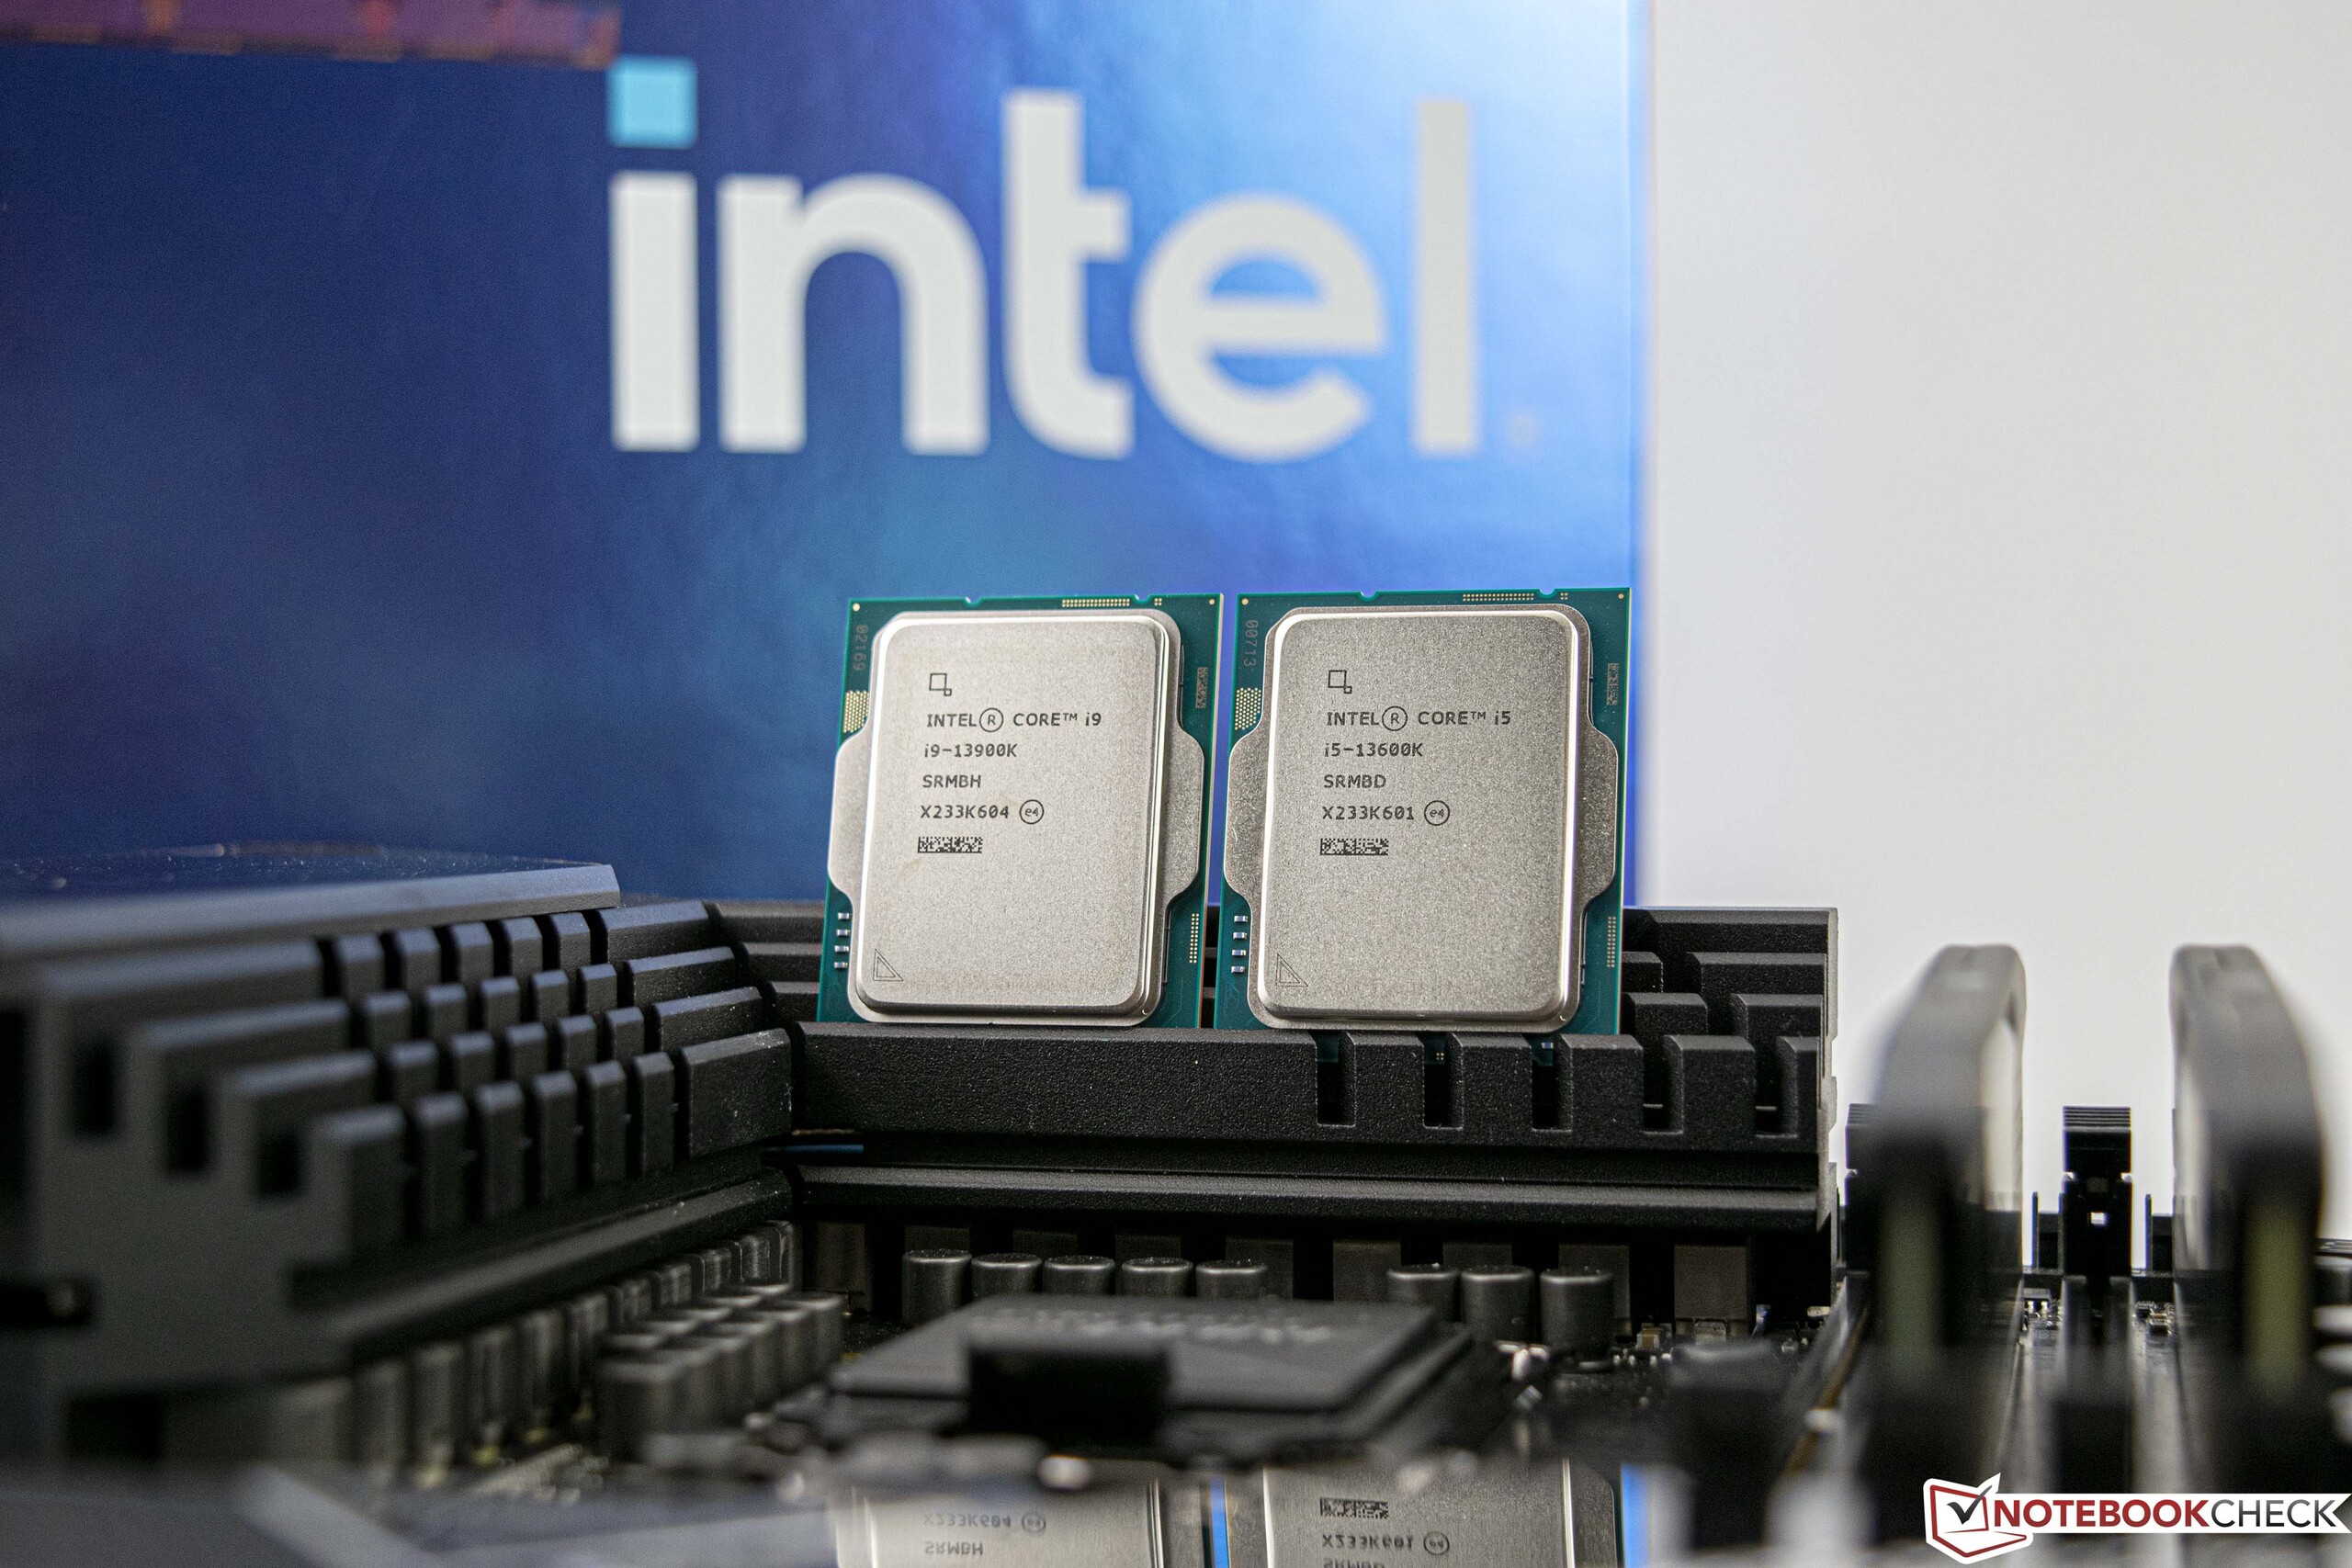
Revisão do Intel Core i9-13900K e Intel Core i5-13600K: Mais núcleos e uma maior velocidade do relógio com Raptor Lake
Com a introdução de CPUs híbridas na área de desktops, a Intel conseguiu pontuar com um salto significativo de desempenho no ano passado. Pela primeira vez, aPlataforma do Lago Alderusou os núcleos P e E para melhorar a distribuição do desempenho. A AMD segue uma abordagem diferente com sua arquitetura de chiplets e também é capaz de atingir um desempenho muito bom neste ponto. Com os processadores Zen 4 recentemente introduzidos, a AMD foi novamente capaz de alcançar um aumento significativo de desempenho. O Raptor Lake deve agora compensar isso e permitir que a Intel recupere a coroa de desempenho.
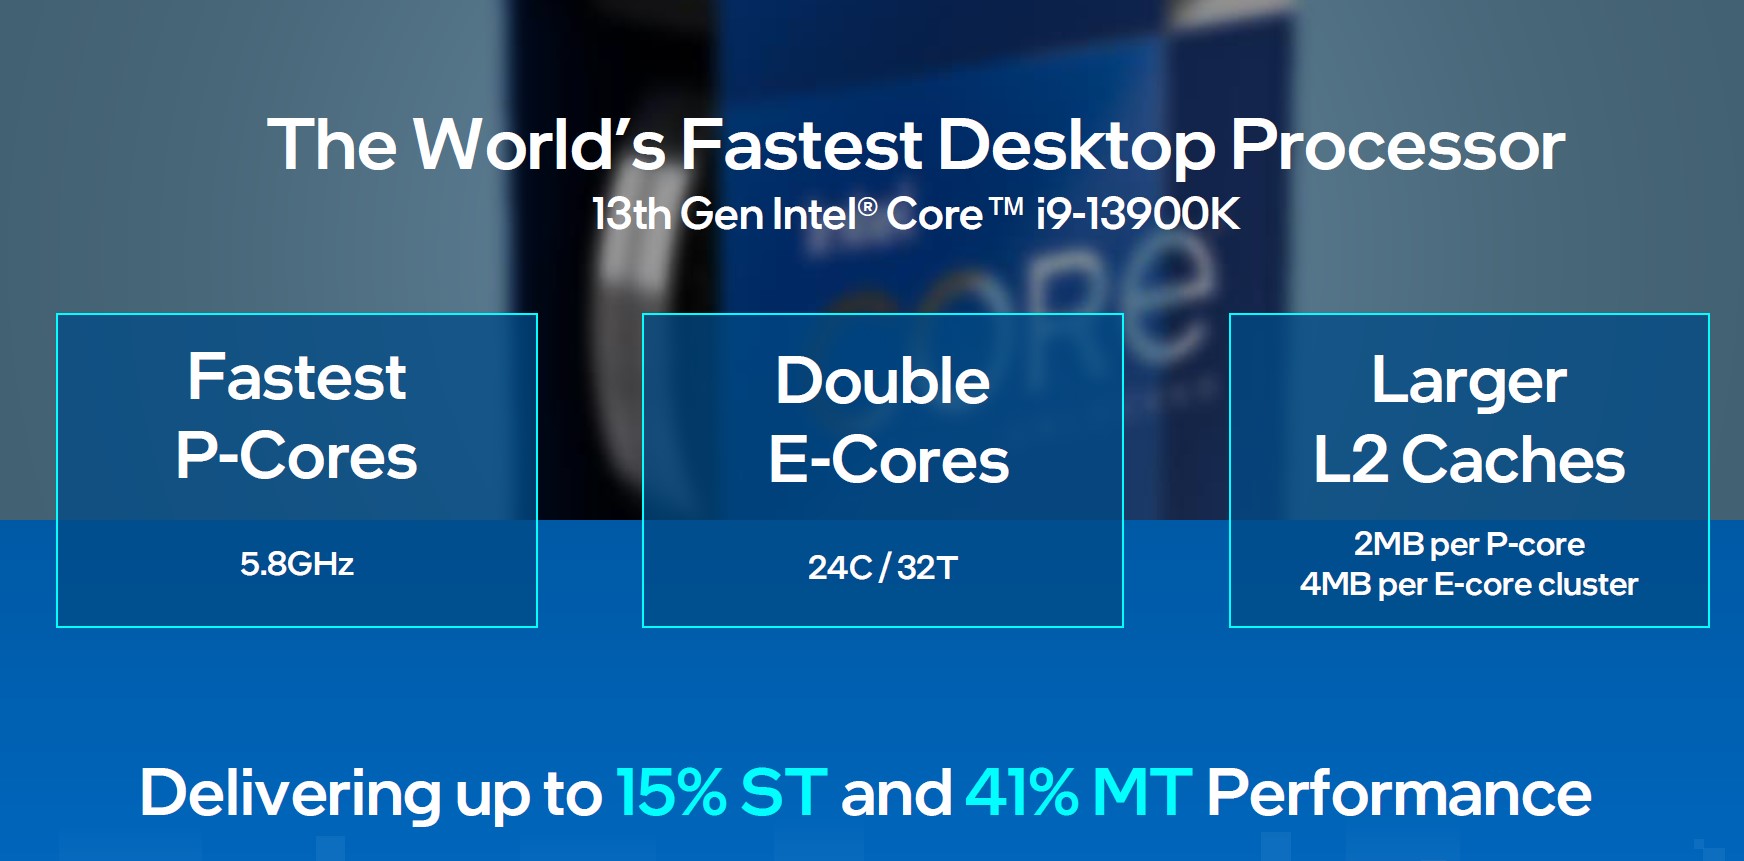
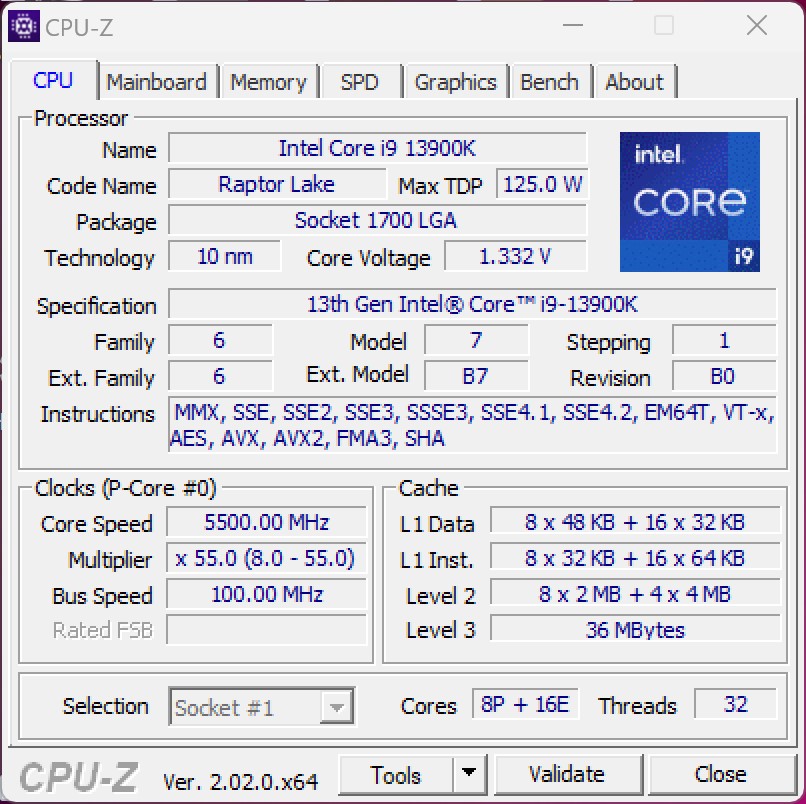
A Intel permanece basicamente fiel ao soquete de 1700 nesta geração. Entretanto, ainda há numerosas mudanças que, em suma, resultam em uma corrida frente a frente com o Ryzen 9 7950X da AMD. Por exemplo, há um cache significativamente maior e há mais roscas no total e núcleos P redesenhados com um IPC mais alto. Além disso, a Intel aumentou o Turbo em até 600 MHz para um máximo de 5,8 GHz. Essas mudanças se aplicam a toda a linha da nova série Raptor Lake.
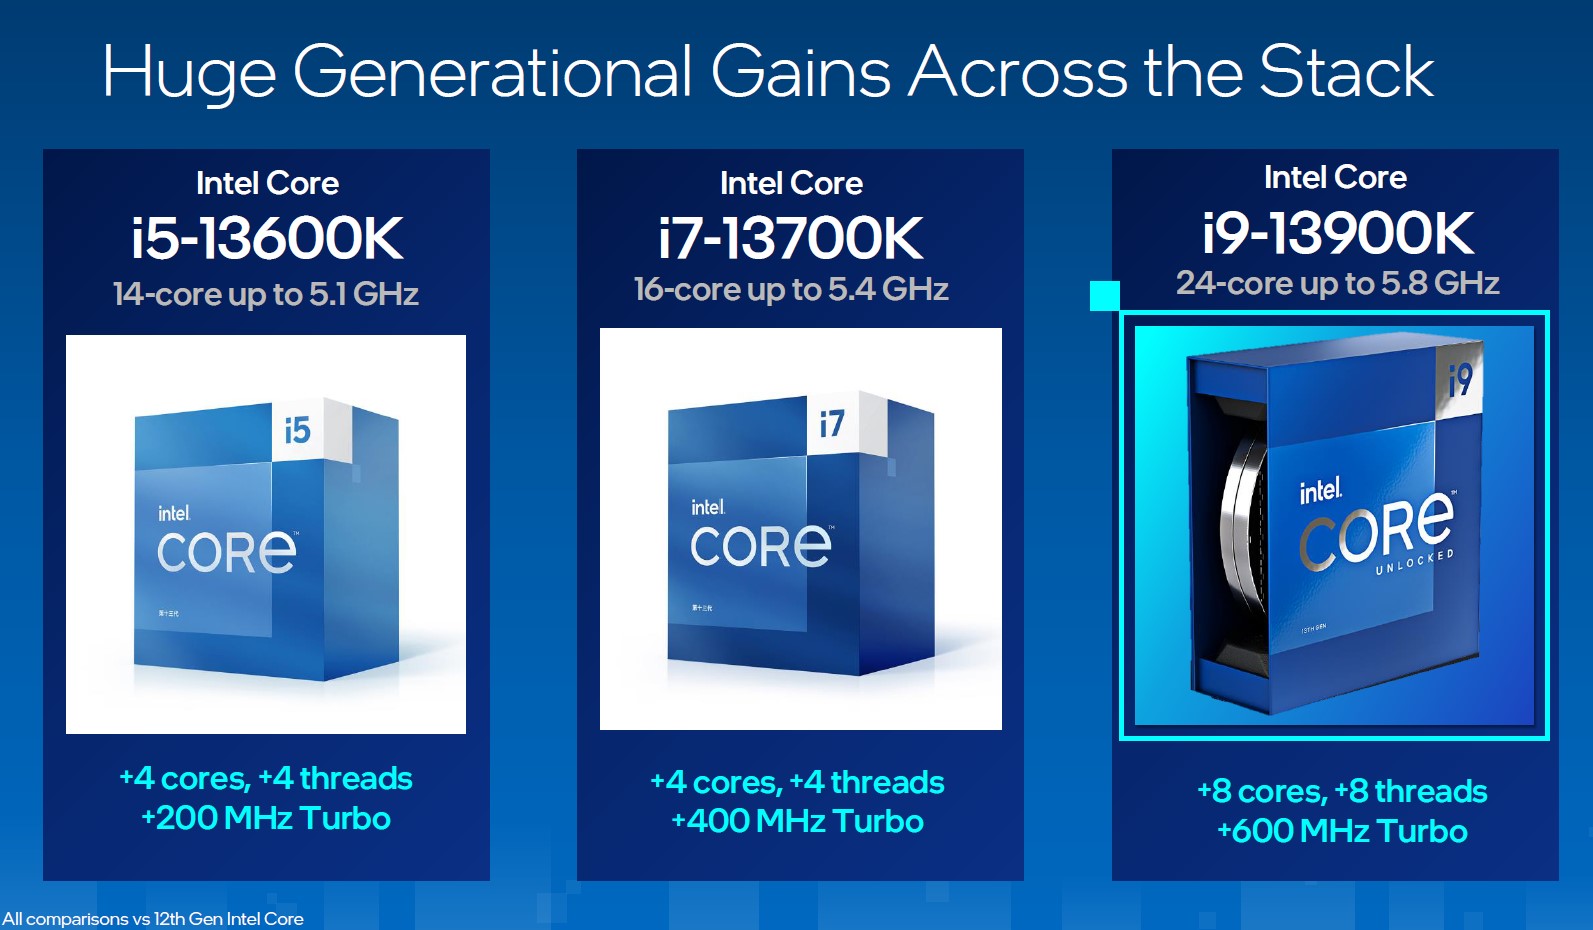
Listamos os representantes mais importantes da nova família Raptor Lake S para você no quadro abaixo.
Embora a Intel siga a série Alder Lake em termos de preço, a fraca taxa de câmbio atual entre o euro e o dólar americano fará os preços dos novos processadores parecerem subjetivamente mais caros.
13ª geração de processadores Intel Core em um relance
| Modelo | Núcleos / Roscas |
Clock Speed P Core / Turbo | Clock Speed E Core / Turbo | Cache L2 + L3 | Gráficos | PBP | MTB | Preço (MSRP) |
| Core i9-13900K | 16 (8P + 16E) /32 | 3,0 GHz / 5,8 GHz | 2,2 GHz / 4,3 GHz | 32 + 36 MB | UHD 770 | 125 Watt | 253 Watt | $589 |
| Core i9-13900KF | 16 (8P + 16E) /32 | 3,0 GHz / 5,8 GHz | 2,2 GHz / 4,3 GHz | 32 + 36 MB | - | 125 Watt | 253 Watt | $564 |
| Core i9-12900K | 16 (8P + 8E) /24 | 3,2 GHz / 5,1 GHz | 2,4 GHz / 3,9 GHz | 14 + 30 MB | UHD 770 | 125 Watt | 241 Watt | $589 |
| Core i9-12900KF | 16 (8P + 8E) /24 | 3,2 GHz / 5,1 GHz | 2,4 GHz / 3,9 GHz | 14 + 30 MB | - | 125 Watt | 241 Watt | $564 |
| Core i7-13700K | 16 (8P + 8E) /24 | 3,4 GHz / 5,4 GHz | 2,5 GHz / 4,2 GHz | 24 + 30 MB | UHD 770 | 125 Watt | 253 Watt | $409 |
| Core i7-13700KF | 16 (8P + 8E) /24 | 3,4 GHz / 5,4 GHz | 2,5 GHz / 4,2 GHz | 24 + 30 MB | - | 125 Watt | 253 Watt | $384 |
| Core i7-12700K | 12 (8P + 4E) /20 | 3,6 GHz / 4,9 GHz | 2,7 GHz / 3,8 GHz | 12 + 25 MB | UHD 770 | 125 Watt | 190 Watt | $409 |
| Core i7-12700KF | 12 (8P + 4E) /20 | 3,6 GHz / 4,9 GHz | 2,7 GHz / 3,8 GHz | 12 + 25 MB | - | 125 Watt | 190 Watt | $384 |
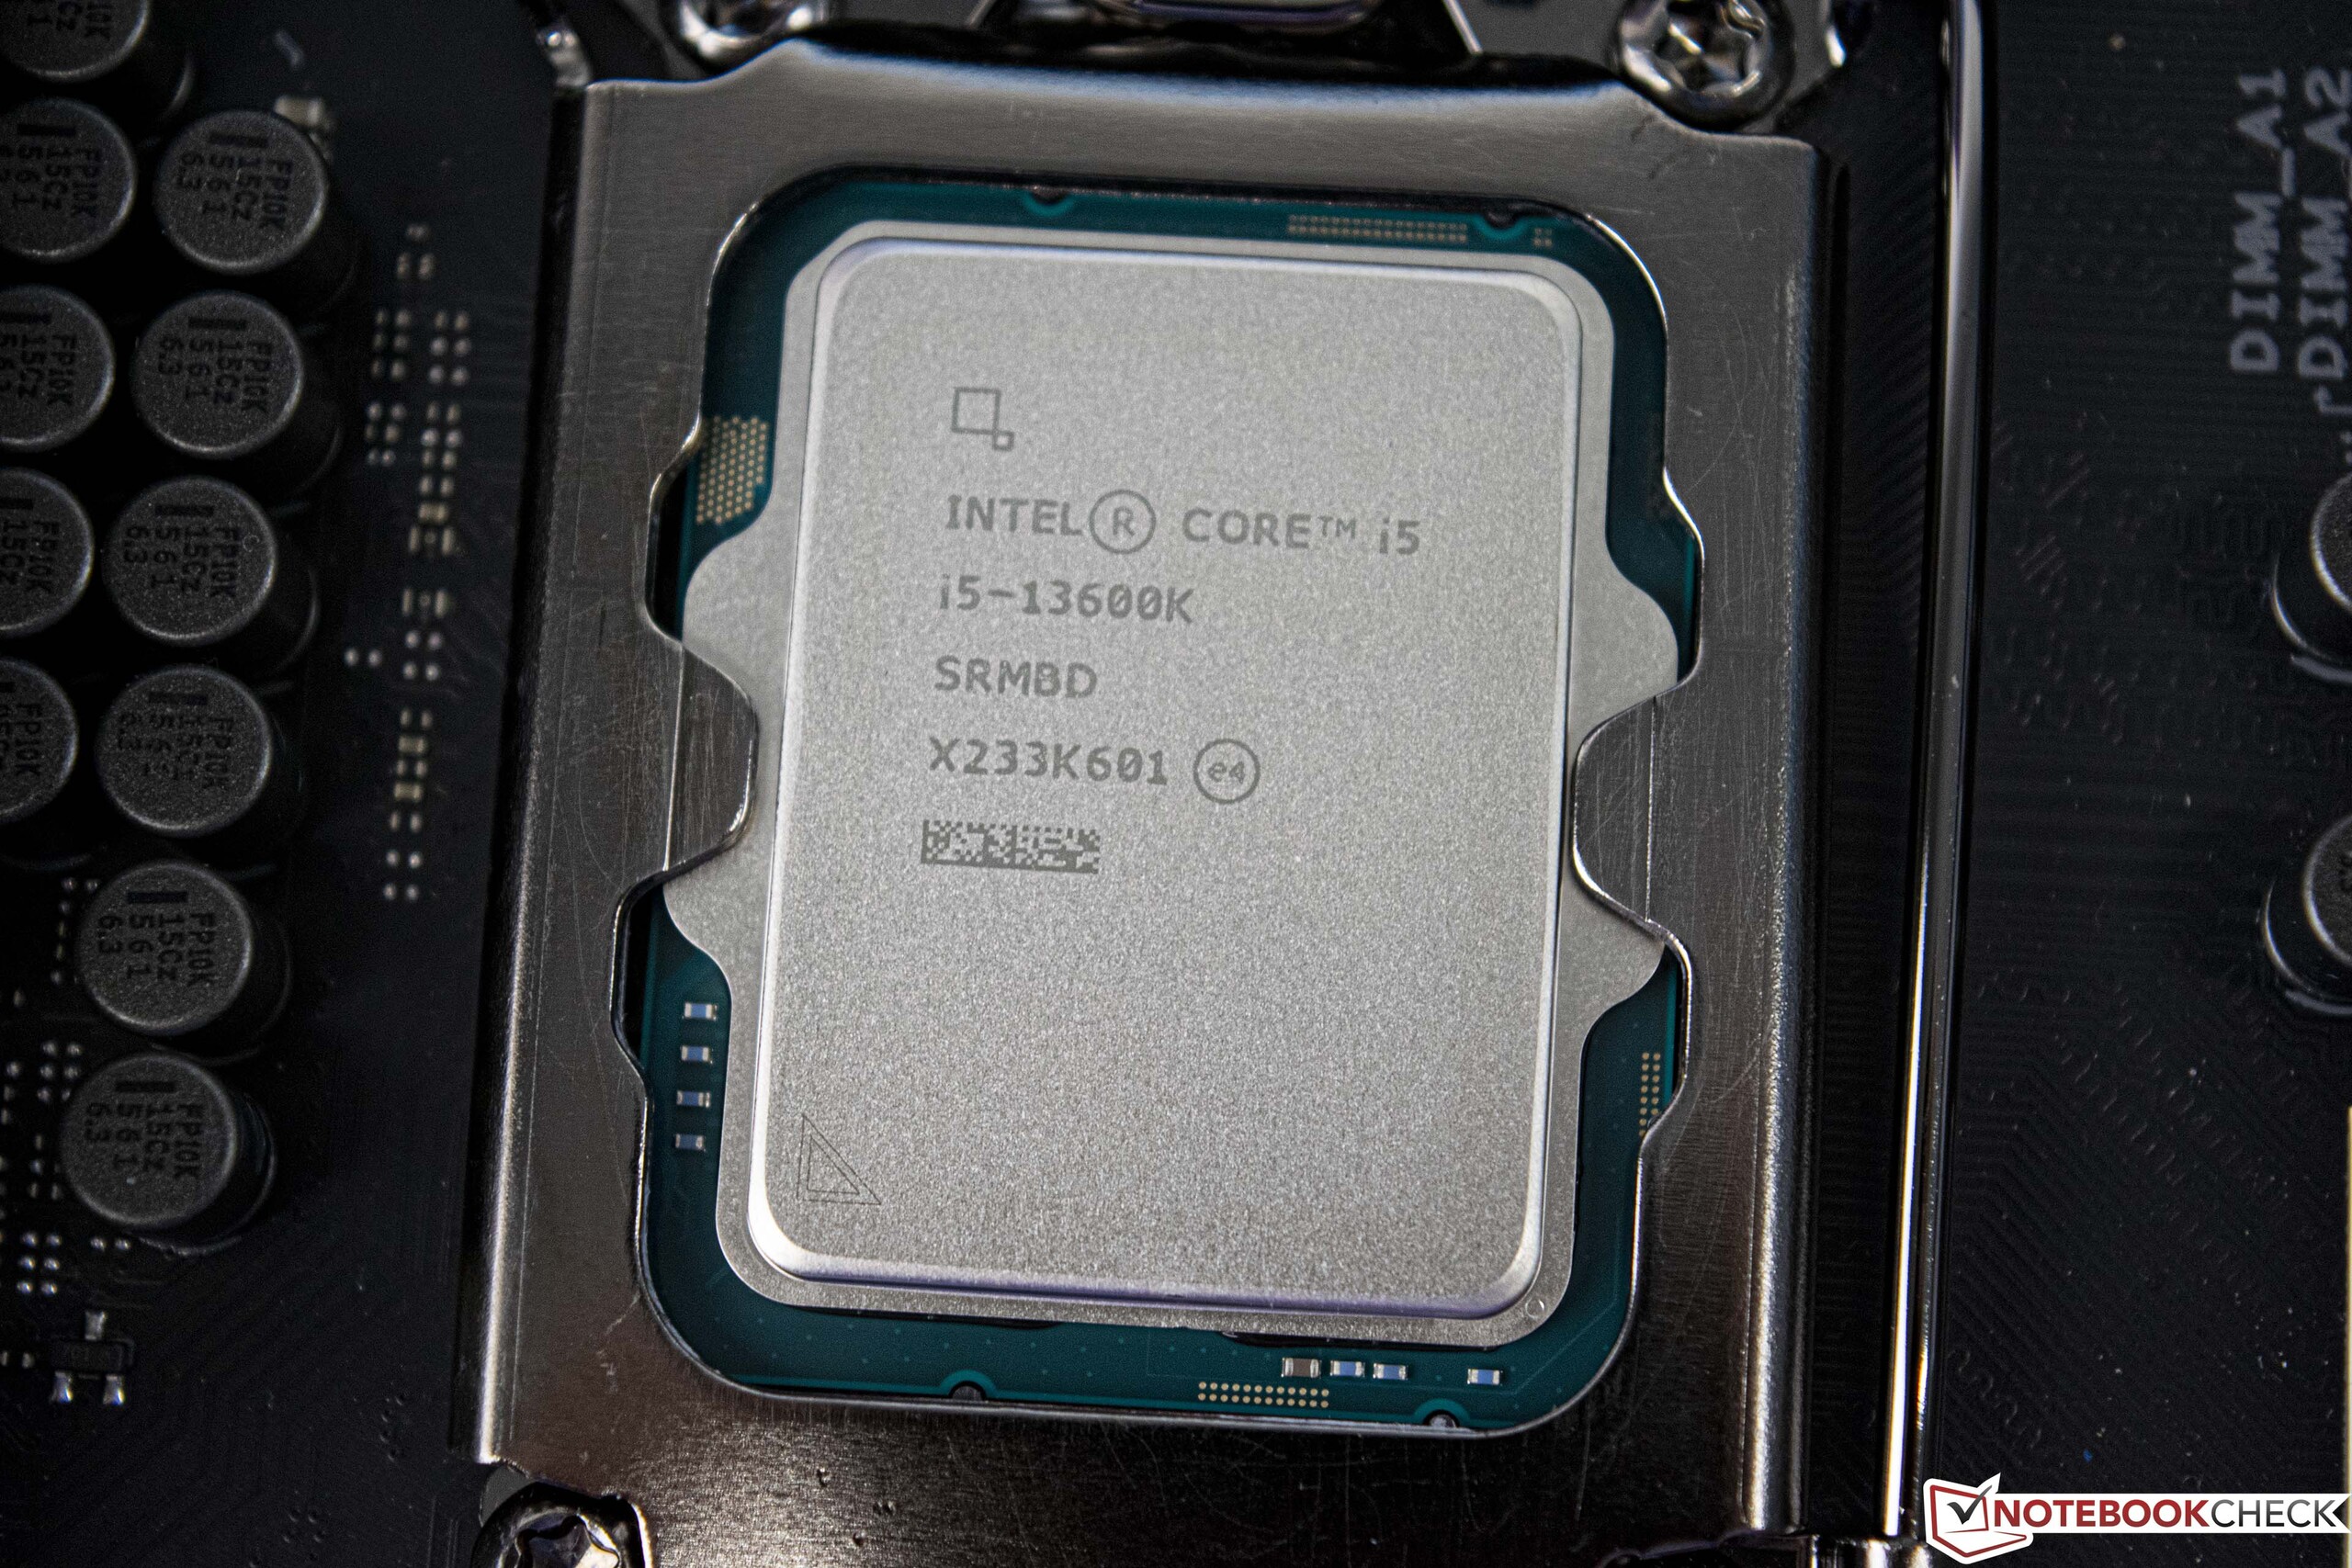
| Core i5-13600K | 14 (6P + 8E) /20 | 3,5 GHz / 5,1 GHz | 2,6 GHz / 3,9 GHz | 20 + 24 MB | UHD 770 | 125 Watt | 181 Watt | $319 |
| Core i5-13600KF | 14 (6P + 8E) /20 | 3,5 GHz / 5,1 GHz | 2,6 GHz / 3,9 GHz | 20 + 24 MB | - | 125 Watt | 181 Watt | $294 |
| Core i5-12600K | 10 (6P + 4E) /16 | 3,7 GHz / 4,9 GHz | 2,8 GHz / 3,6 GHz | 9,5 + 20 MB | UHD 770 | 125 Watt | 150 Watt | $289 |
| Core i5-12600KF | 10 (6P + 4E) /16 | 3,7 GHz / 4,9 GHz | 2,8 GHz / 3,6 GHz | 9,5 + 20 MB | - | 125 Watt | 150 Watt | $264 |
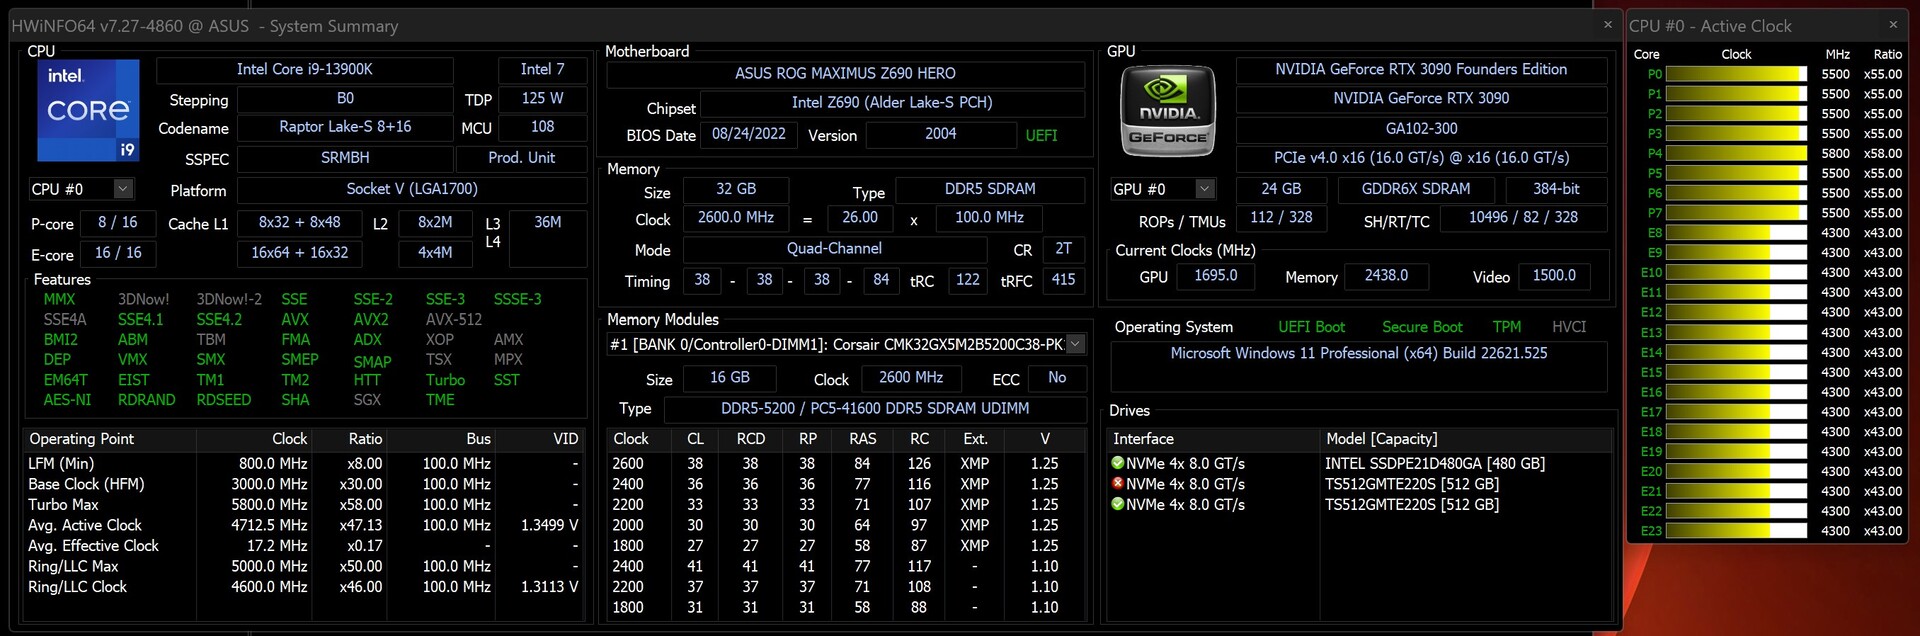
Detalhes de nosso sistema de teste
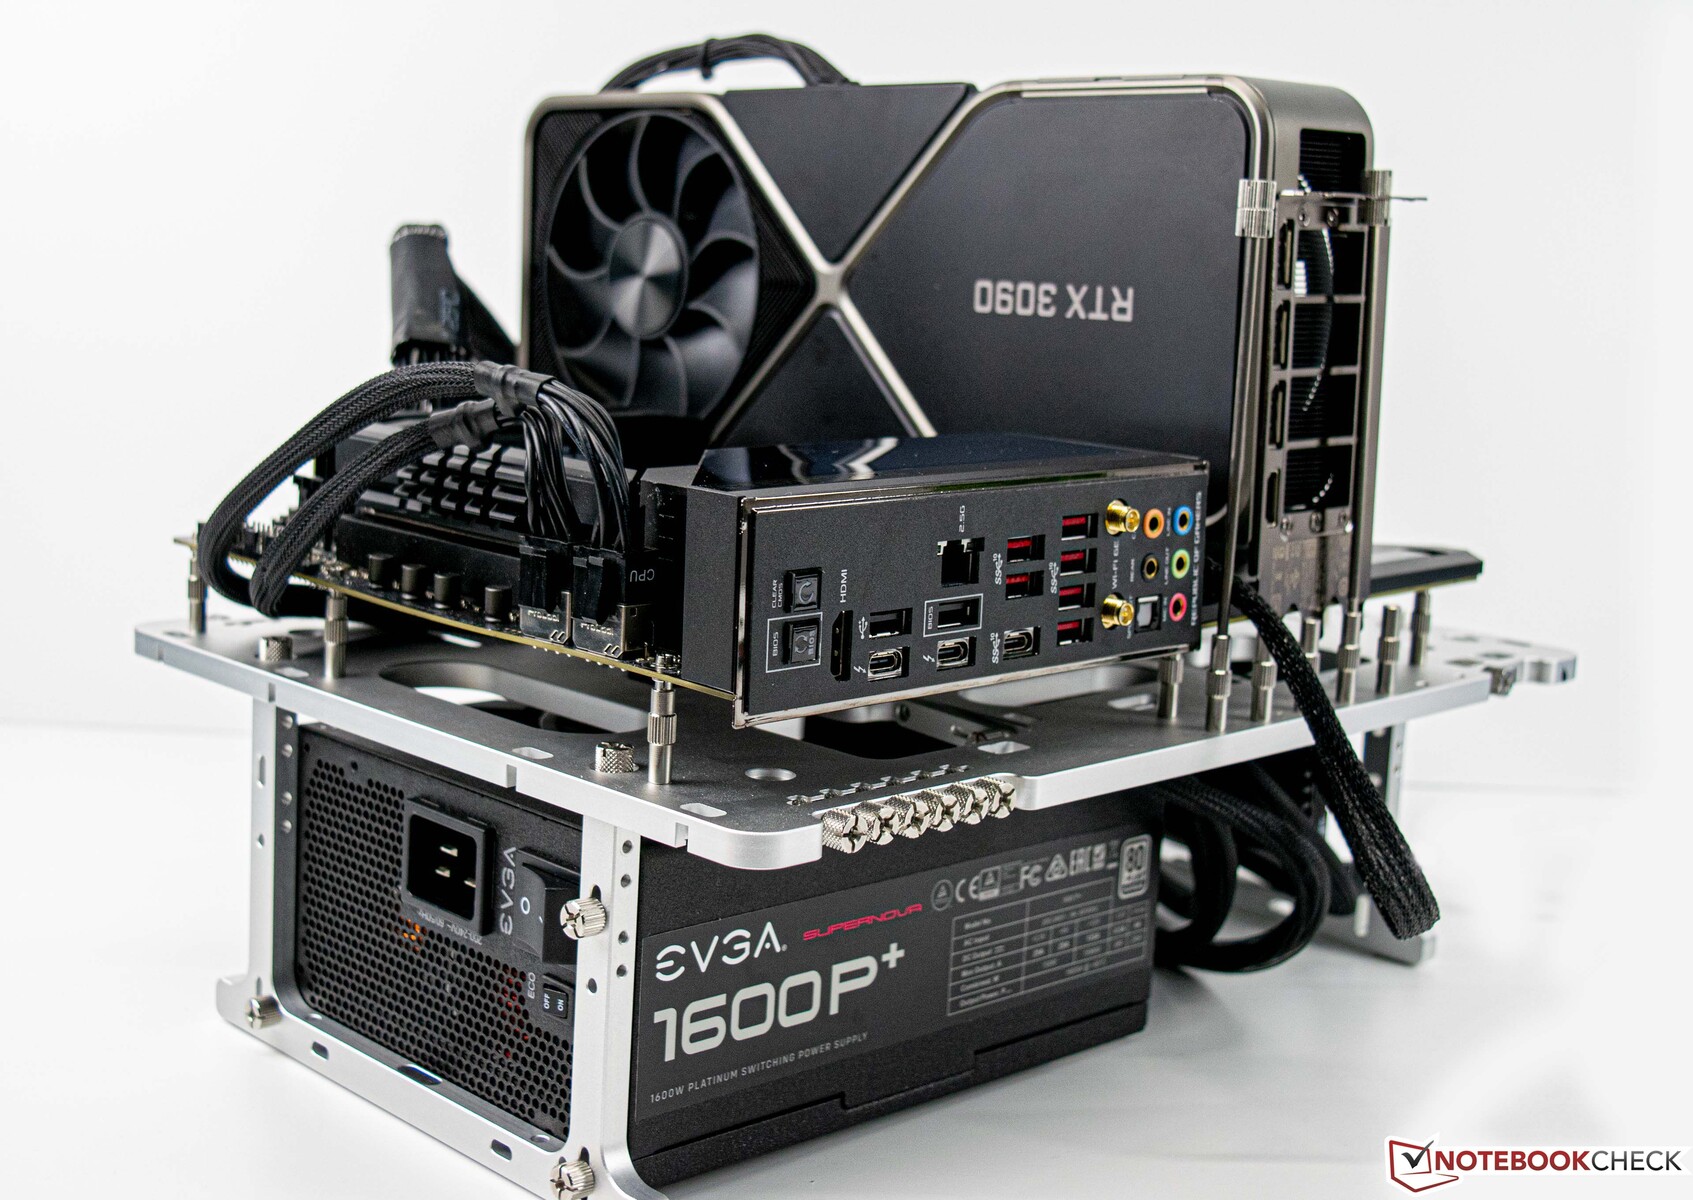
Utilizamos o seguinte sistema para os testes e benchmarks abaixo:
- Streacom BC1 V2 Bancada aberta
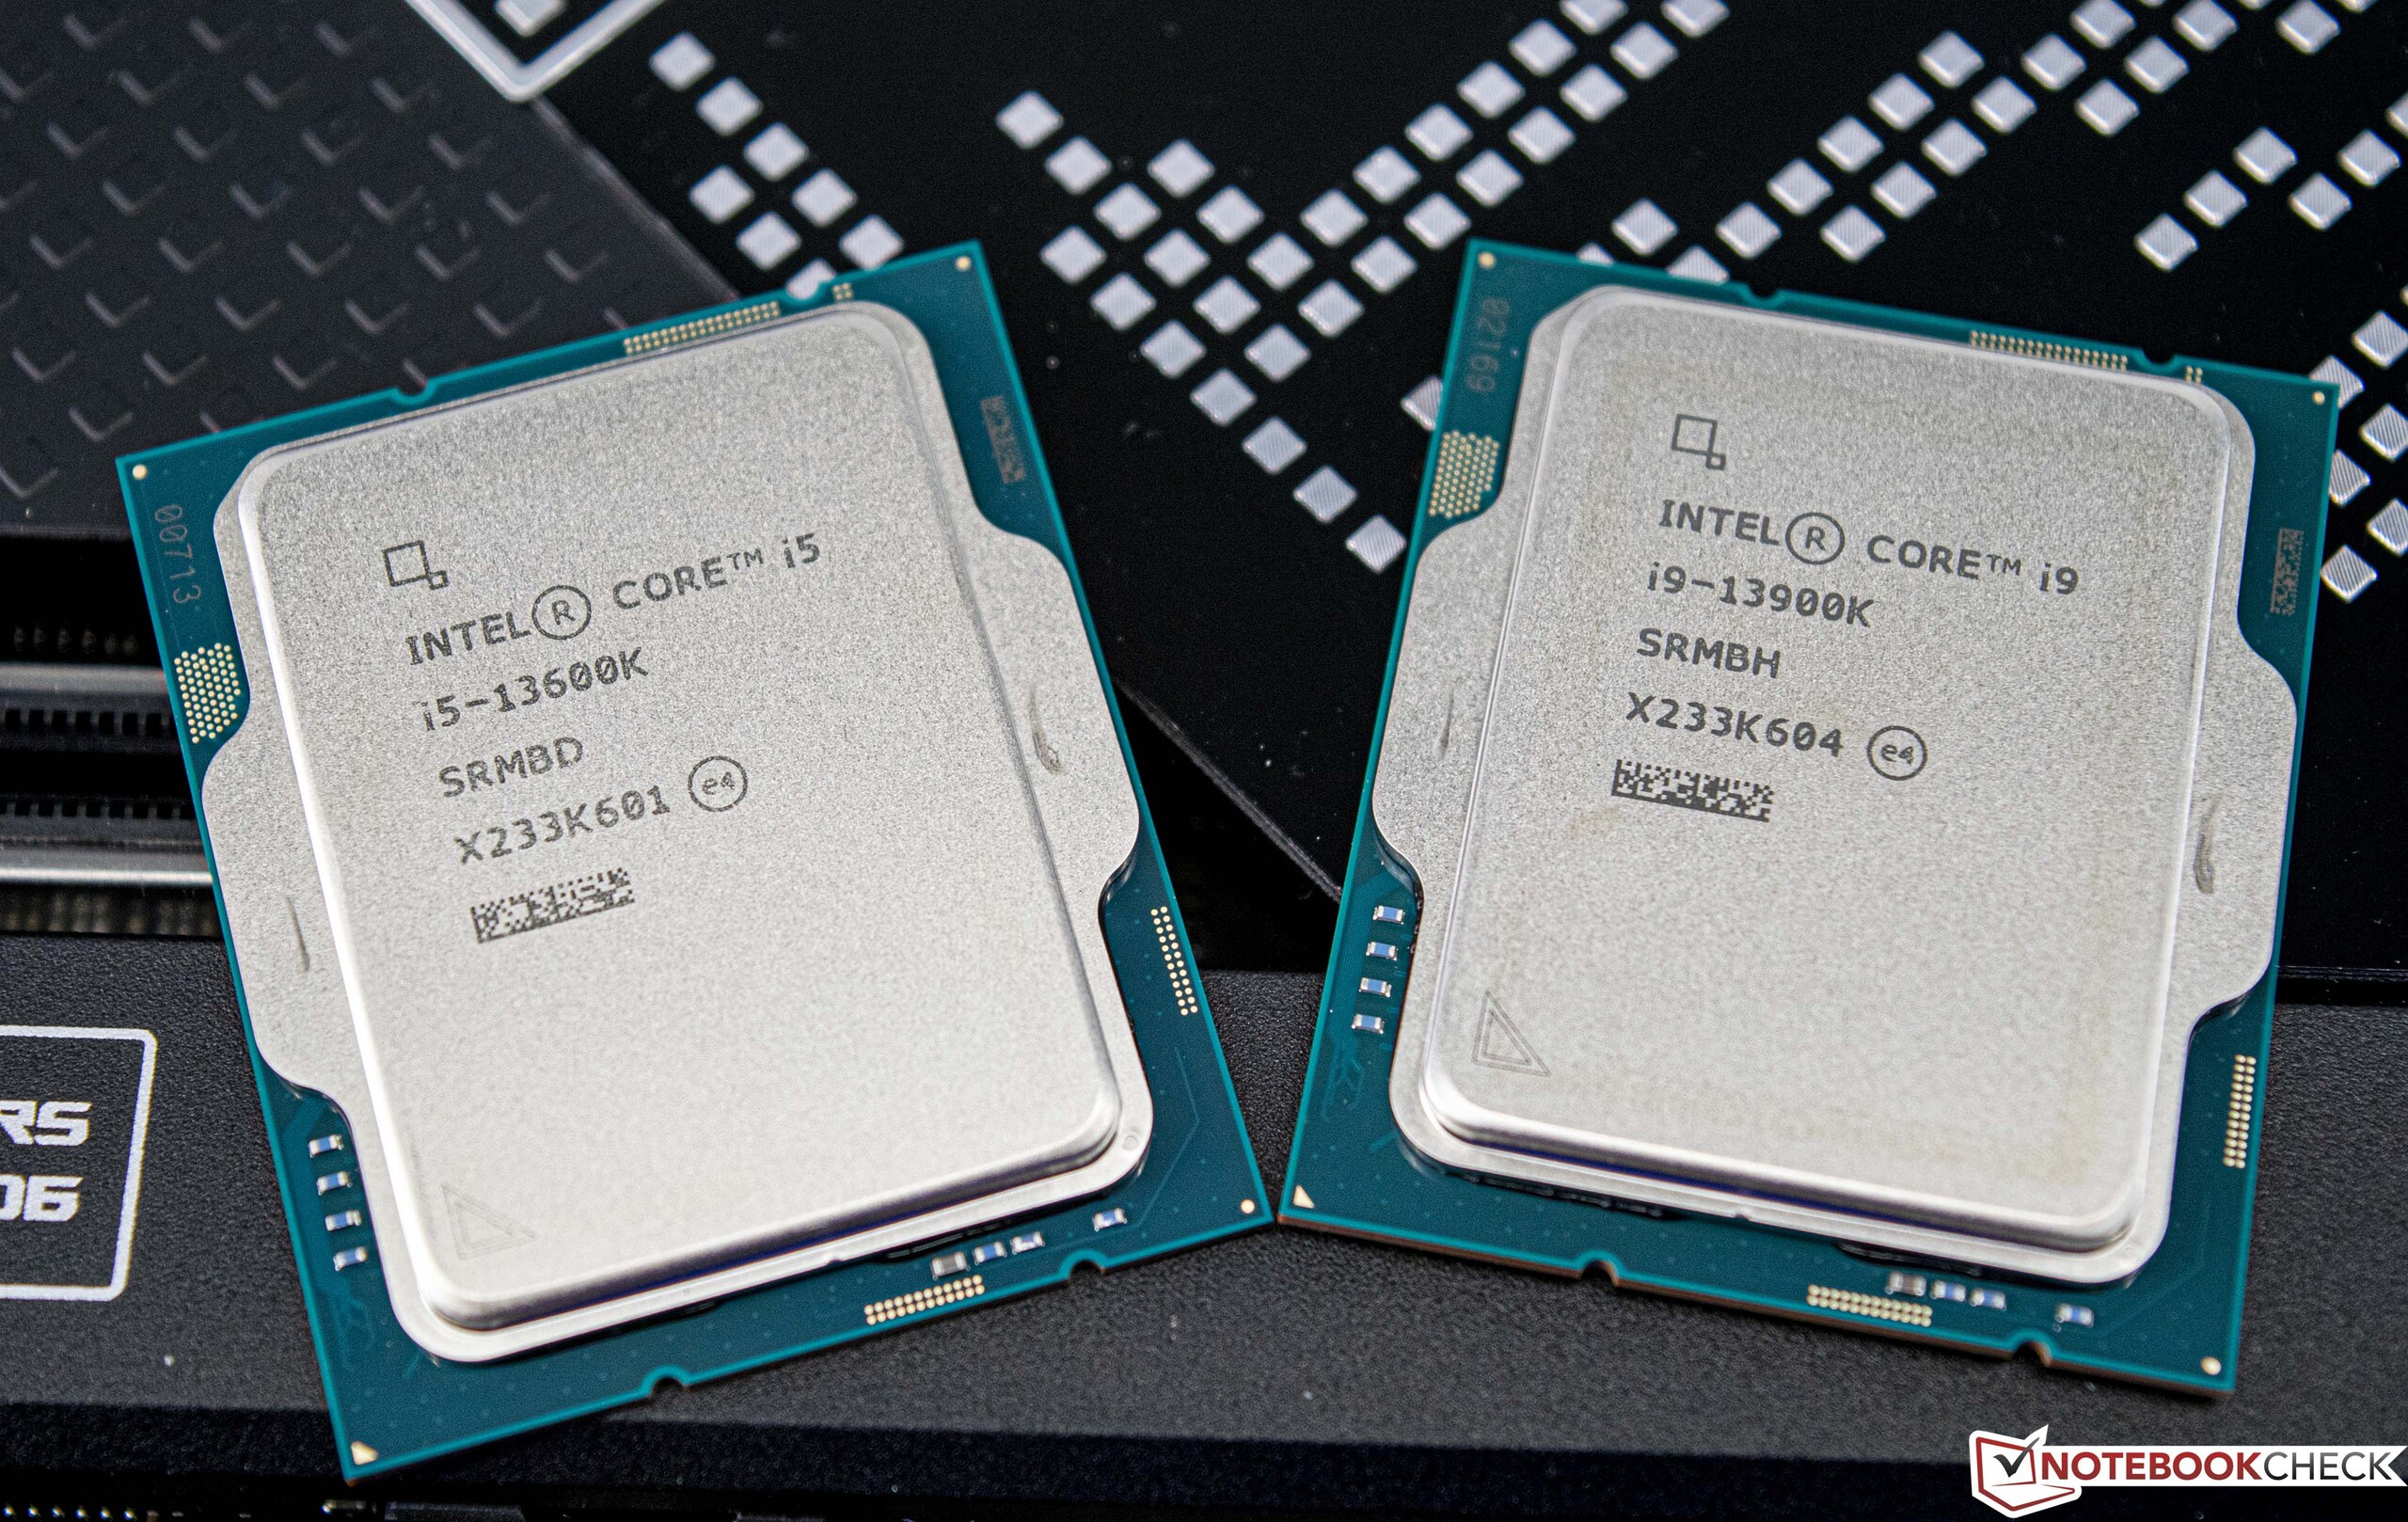
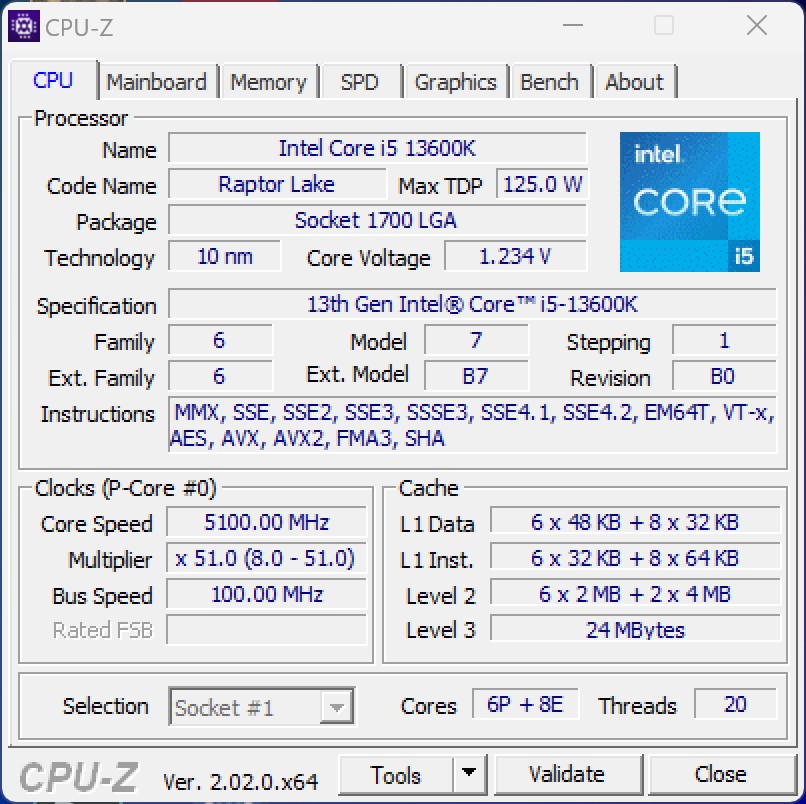
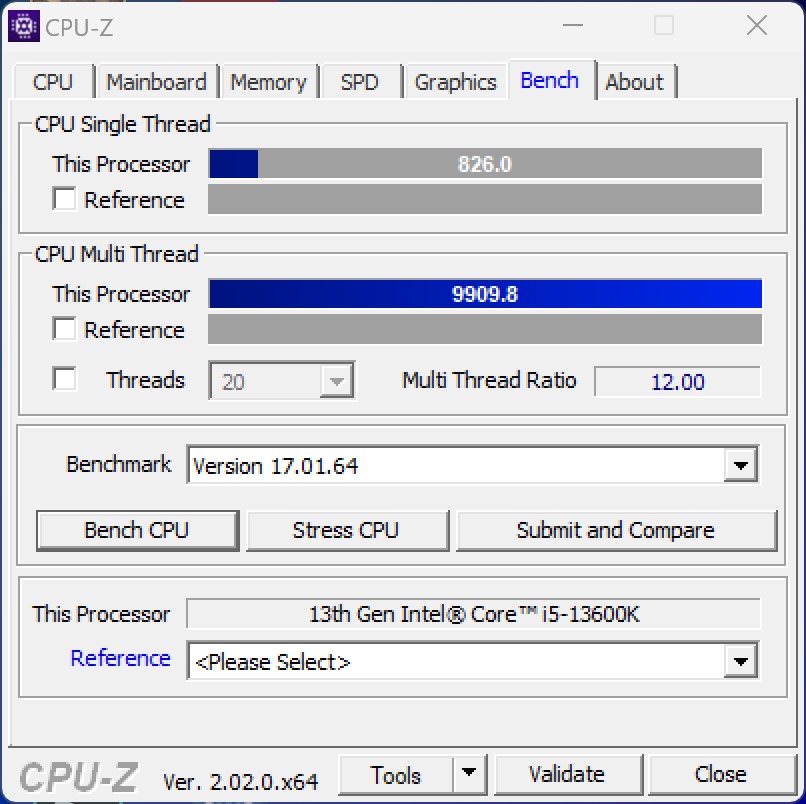
- Intel Core i9-13900K, Intel Core i5-13600K
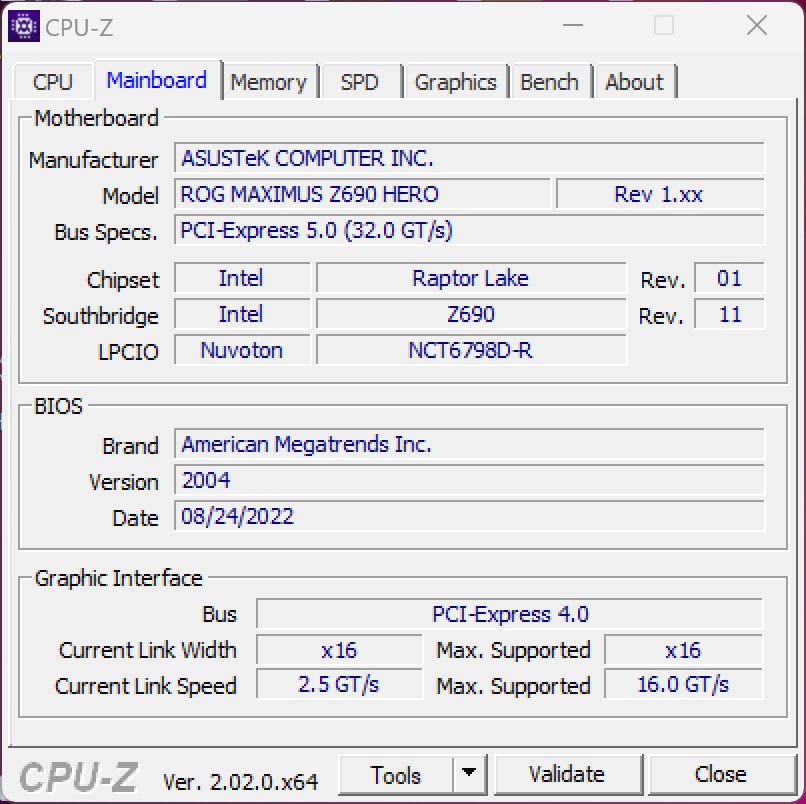
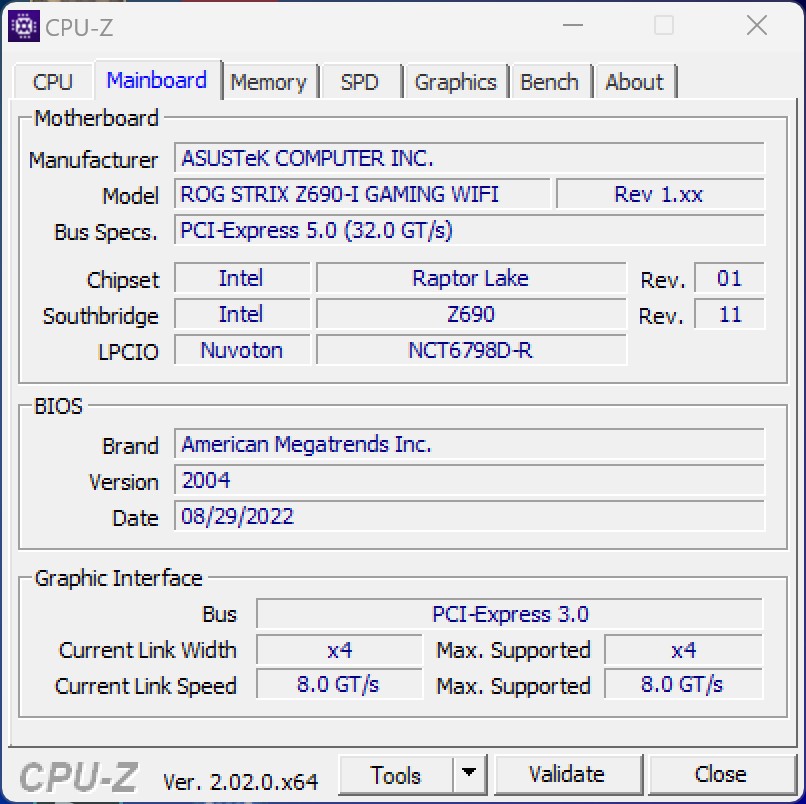
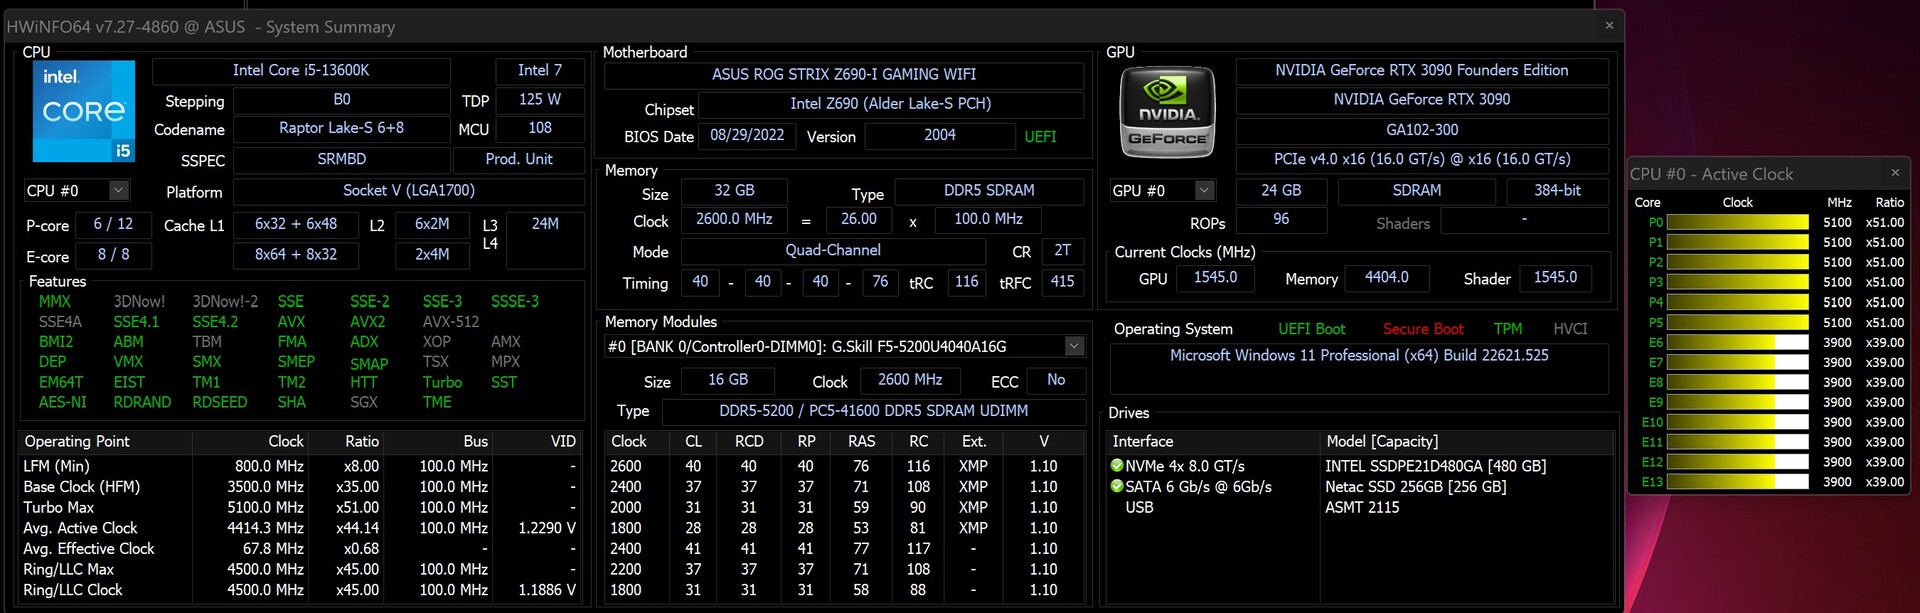
- Asus ROG Maximus Z690 Hero (BIOS v2004) / Asus ROG Strix Z690-I Gaming WiFi (BIOS v2004)
- Resfriamento de água de loop personalizado (Bomba: Alphacool Aquastream XT Ultra, Radiador: EK MO-RA3 420 LT PRETO)
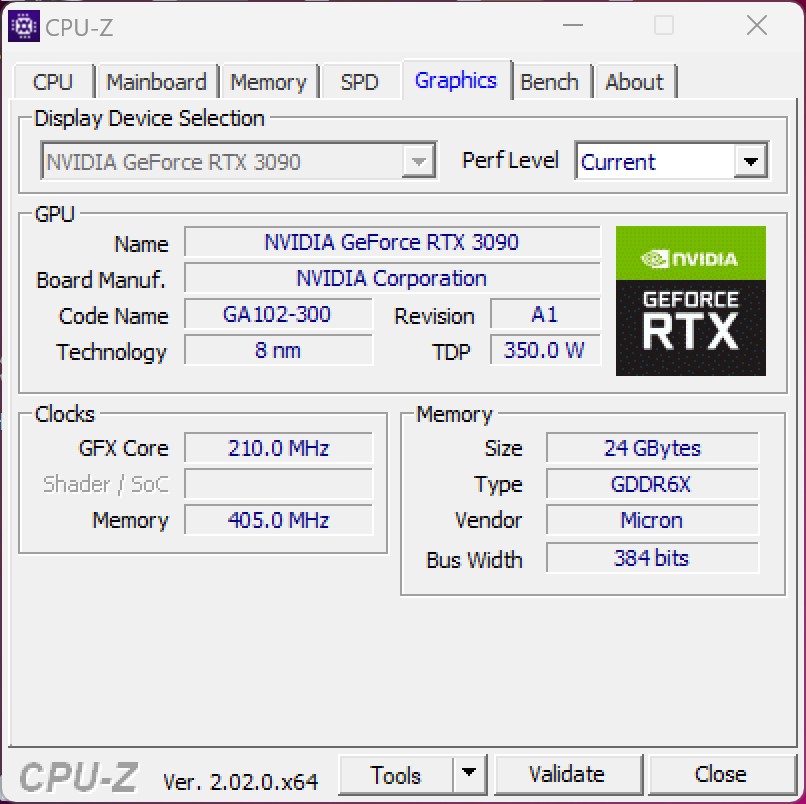
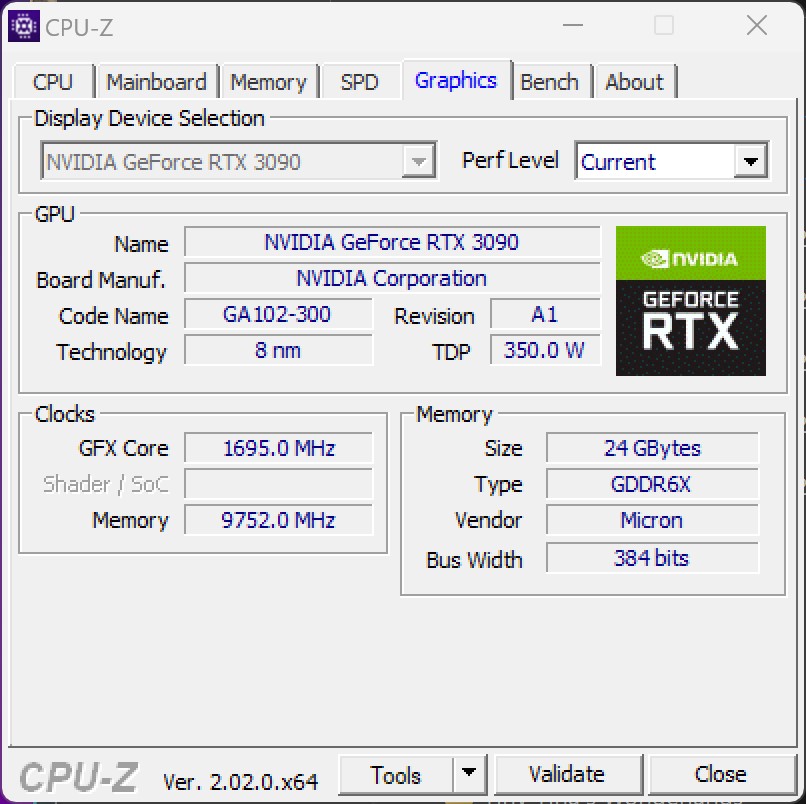
- Nvidia GeForce RTX 3090 Edição Fundadores (motorista: 517.48)
- EVGA SuperNOVA P+ 1600W
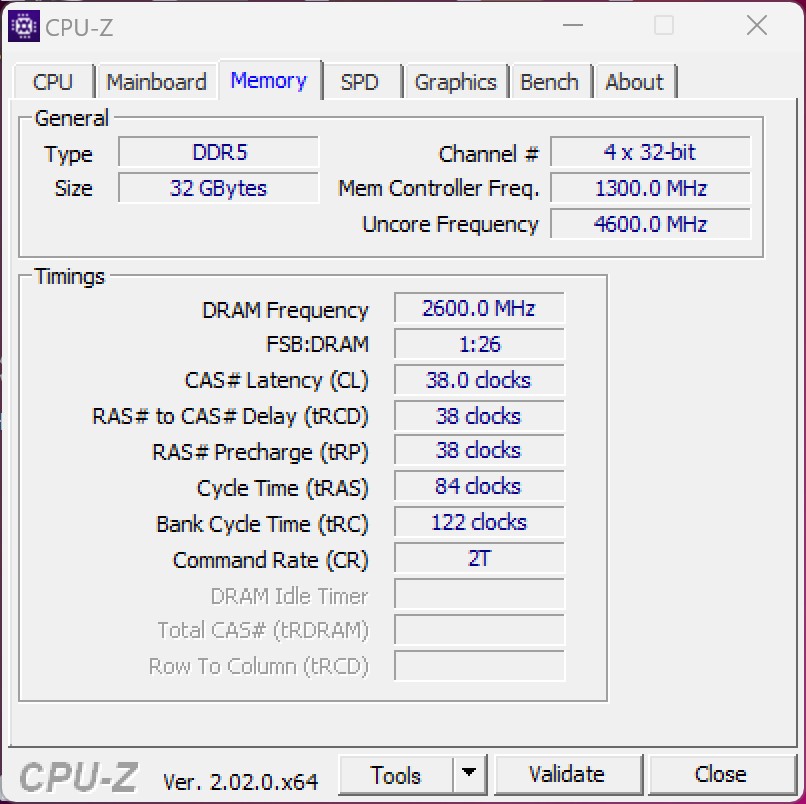
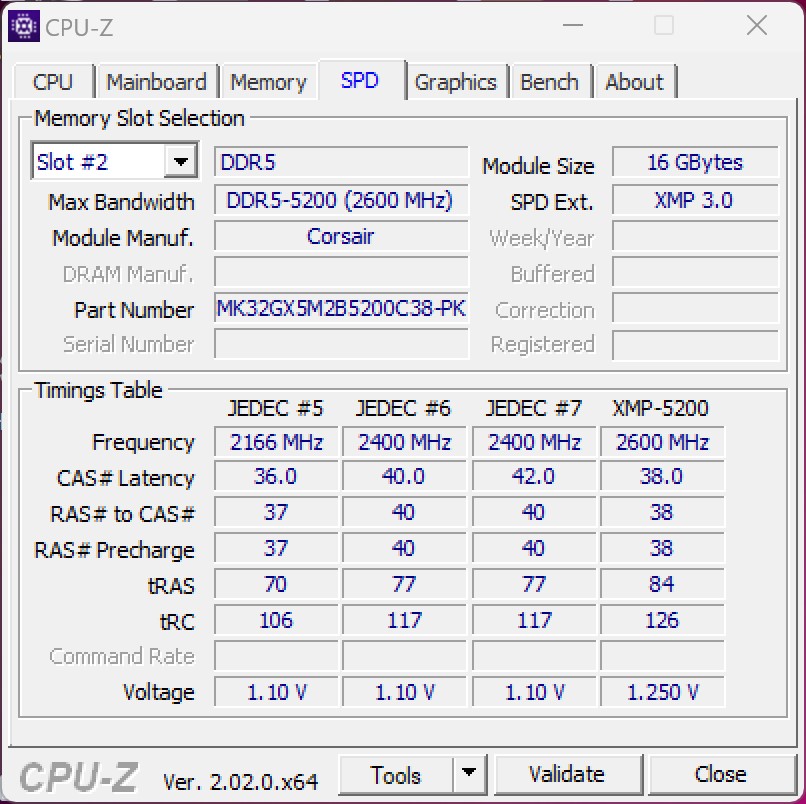
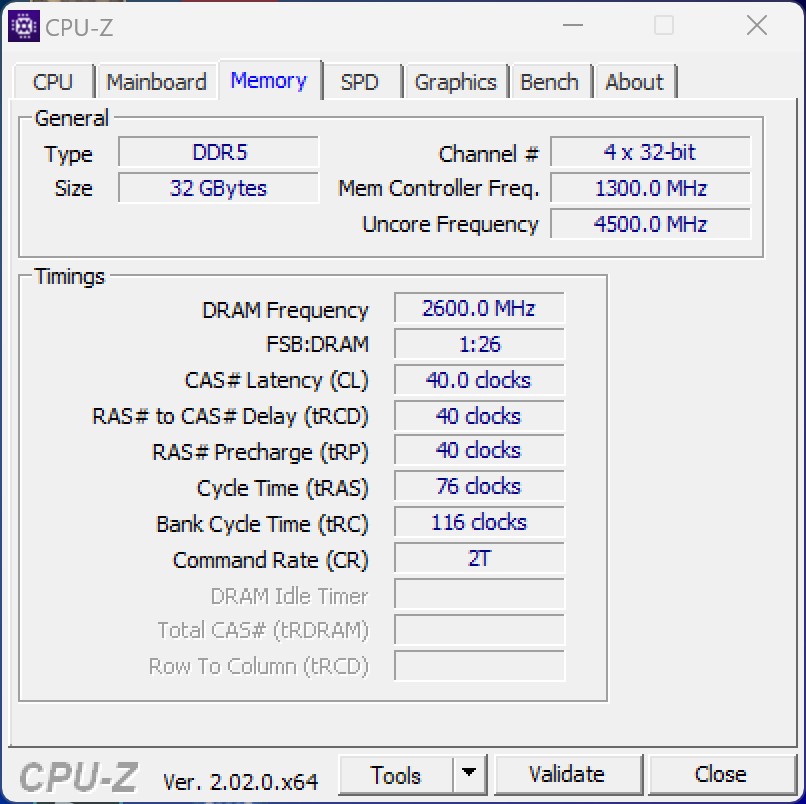
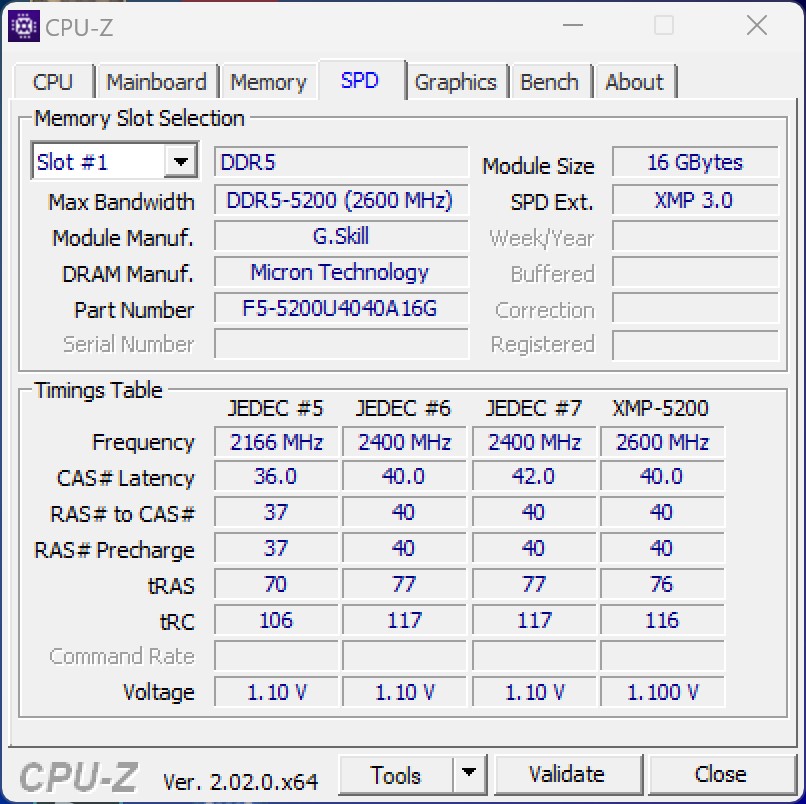
- G.Skill Ripjaws S5 (2x 16 GB - DDR5-5200)
- Intel Optane 905p (sistema de 480 GB + benchmarks)
- Microsoft Windows 11 Professional 64 Bit (Versão 22H2)
Condições de teste - Z690 utilizável após atualização da BIOS
Para este teste, usamos o Asus ROG Maximus Z690 Hero, que já foi usado durante o lançamento do Alder Lake S. No entanto, com o novo chipset Z790, haverá placas principais atualizadas que suportam a 12ª e a 13ª geração dos processadores Intel. No entanto, você ainda deve ter em mente que a série Intel Rocket Lake será provavelmente a última geração que usa o soquete 1700.
Todos os testes são executados com o perfil mais atual da BIOS e XMP ativado. Além disso, todas as limitações de energia são desativadas a fim de obter o desempenho total dos processadores.
Observação:
Devido a alguns problemas com o Asus ROG Maximus Z690 Hero durante nossos testes, tivemos que usar o Asus ROG Strix Z690-I Gaming WiFi em vez de todos os benchmarks com o Intel Core i5-13600K. Uma breve comparação de desempenho com o Asus ROG Maximus Z690 Hero não mostrou nenhuma diferença significativa de desempenho. Após conversarmos com o Asus, pudemos determinar que havia um problema com a BIOS da versão utilizada até então. O Asus respondeu imediatamente e resolveu os problemas com a versão 2103.
Benchmarks de Processador
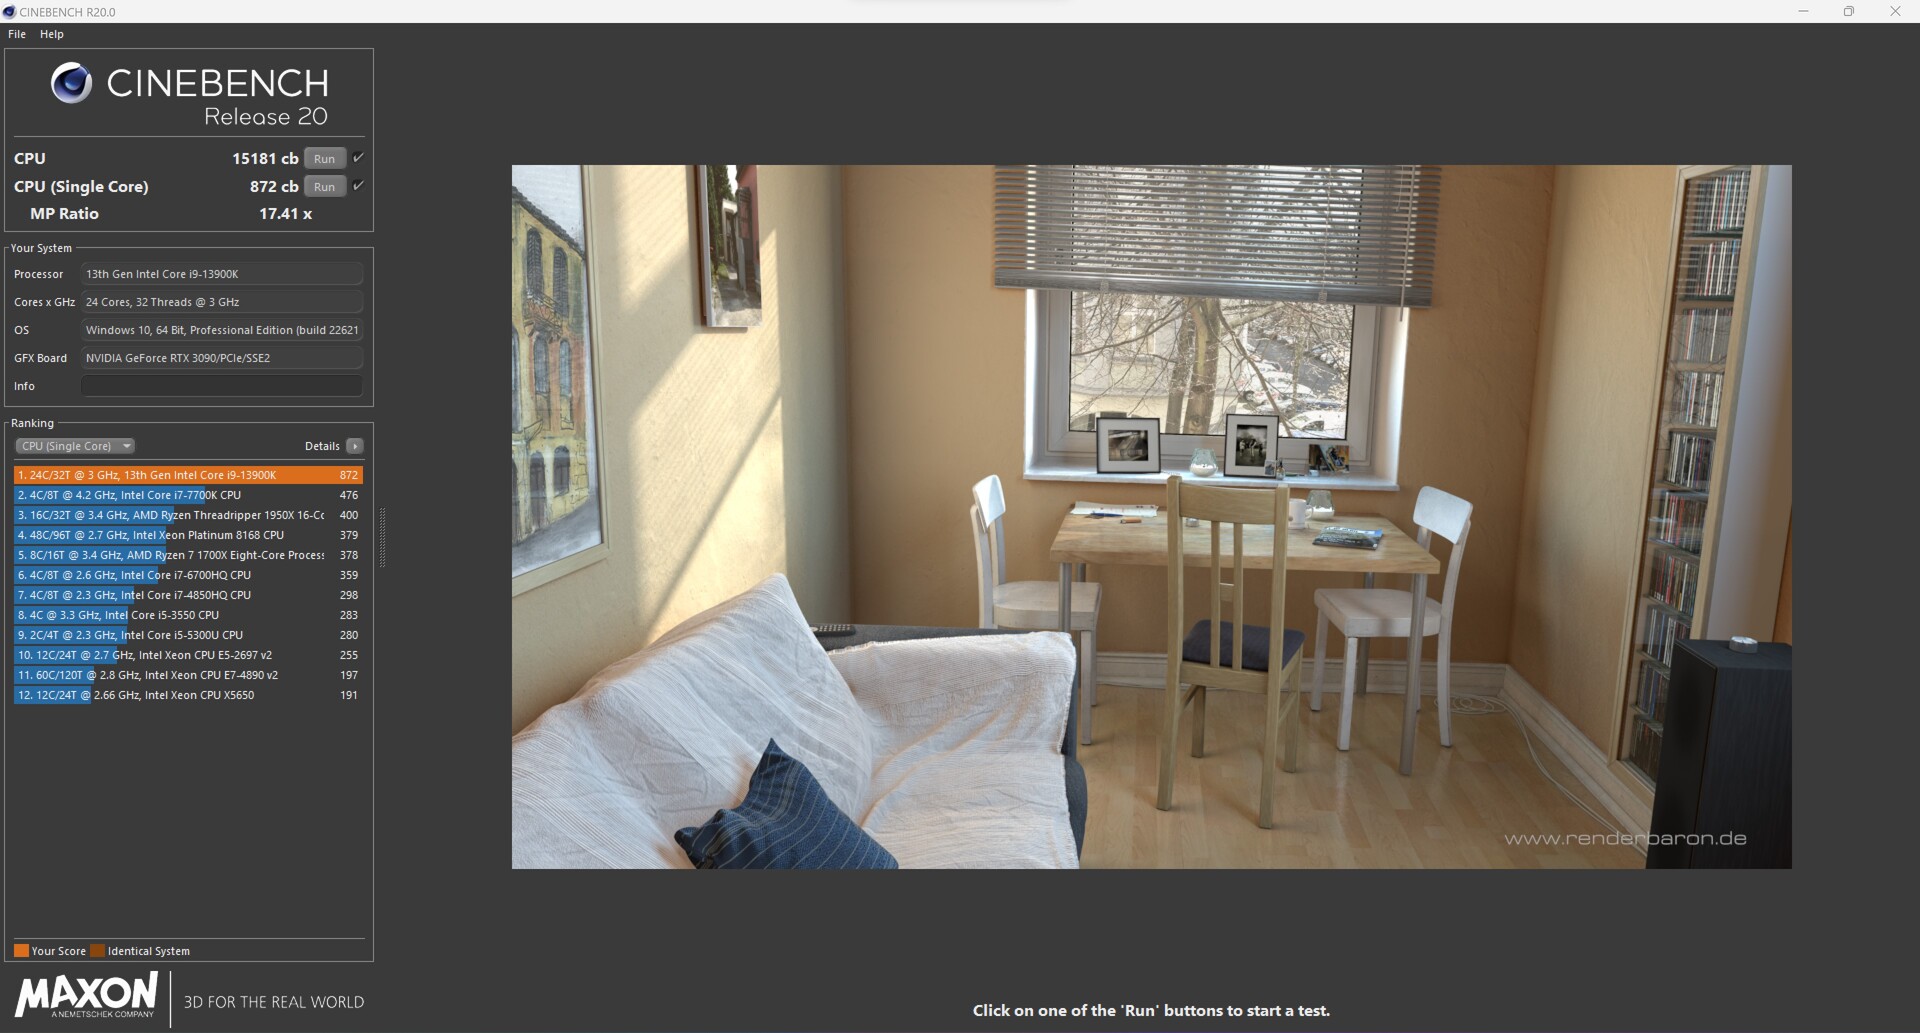
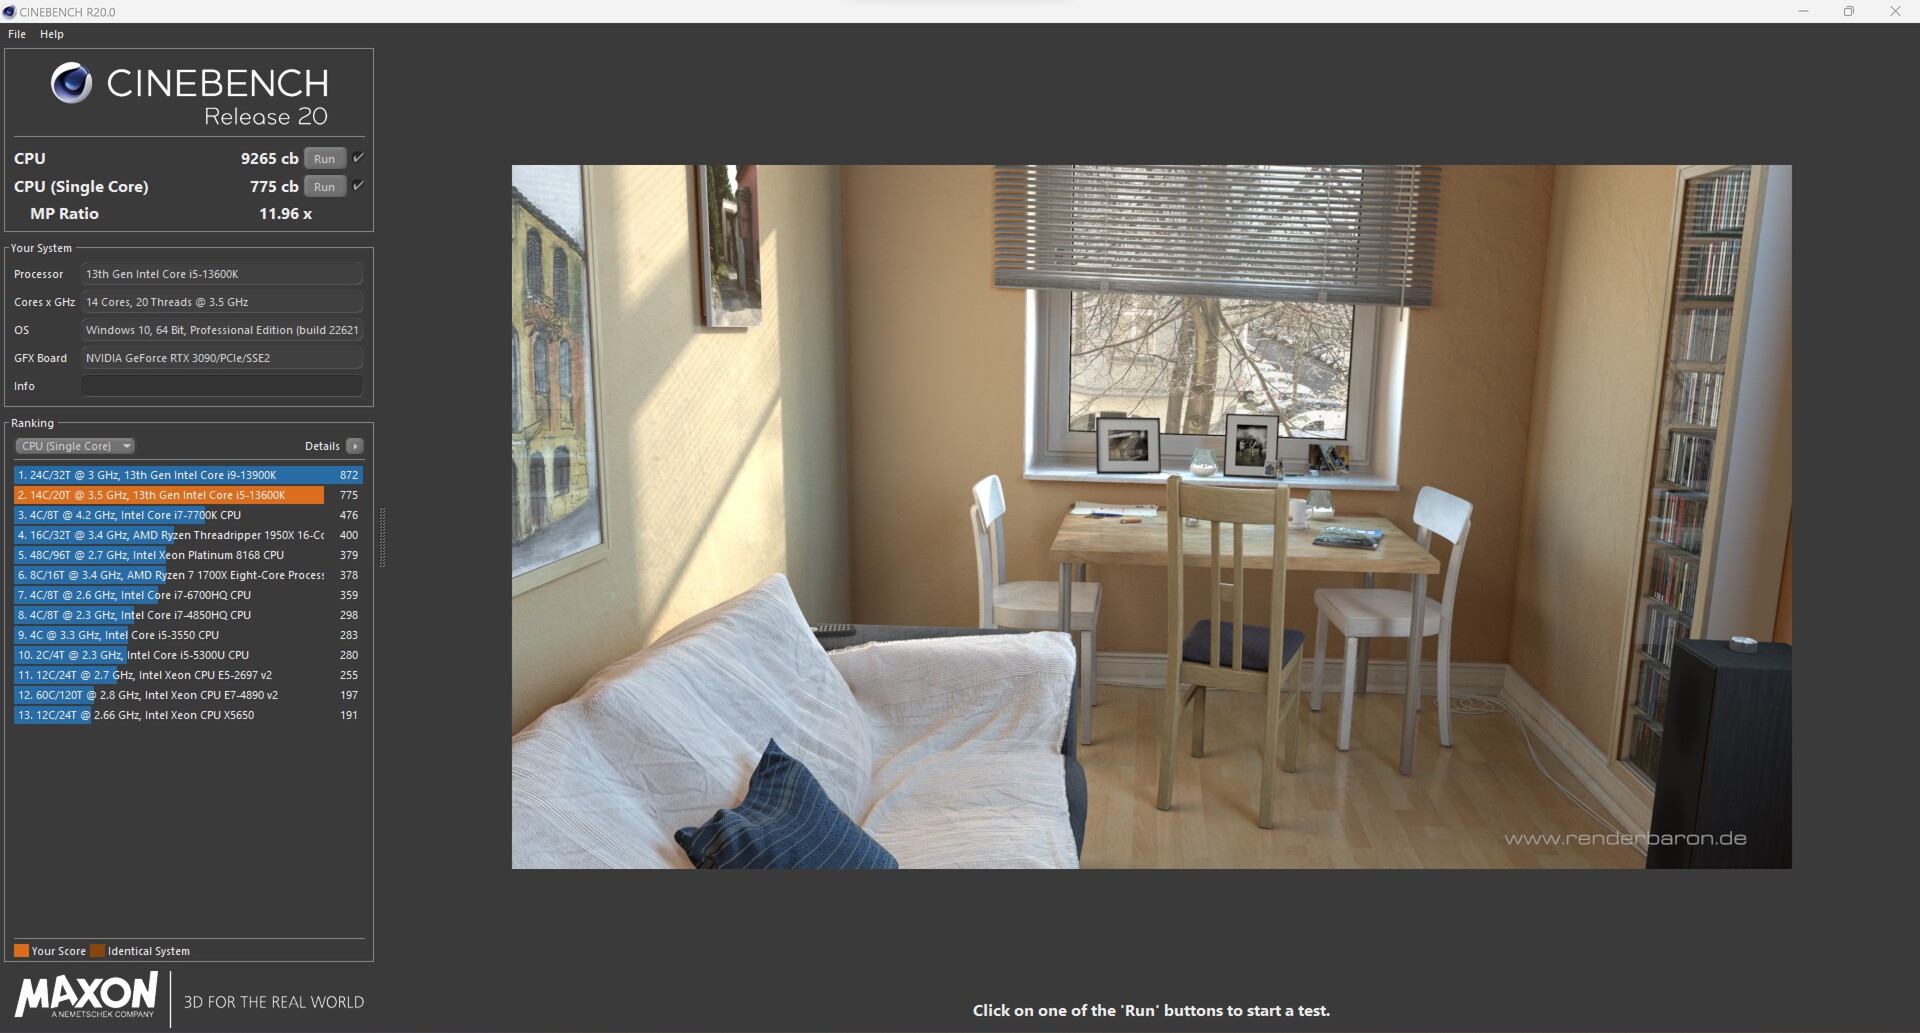
Em comparação com os processadores mais antigos do Alder Lake S, o aumento de desempenho é enorme em todas as áreas. O aumento do IPC é acompanhado por uma velocidade de Boost significativamente maior, o que por implicação também é suficiente para um aumento de desempenho de 19% no Intel Core i9-13900K em comparação com o Intel Core i9-12900K. Nas comparações simples, são possíveis até mesmo saltos de desempenho de até 49%. Com o modelo menor Core-i5, medimos um aumento de desempenho de 14% em comparação com a amostra mais antiga do Lago Alder
No duelo dos modelos superiores, o Intel Core i9-13900K é capaz de colocar logo à frente do AMD Ryzen 9 7950X. Subjetivamente, ambos os modelos top operam ao nível dos olhos. No entanto, ainda vemos que em alguns testes a Intel está à frente, e em outros, a AMD. Como exemplo, podemos tomar o 3DMark, onde o processador Intel está significativamente à frente dos modelos AMD em termos de benchmark de CPU. Por outro lado, a AMD é capaz de pontuar no teste wPrime, onde a Intel é claramente deixada para trás.
O menor Intel Core i5-13600K compete com o AMD Ryzen 5 7600X. Aqui, o número significativamente maior de roscas (20 vs. 12) é a chave para seu sucesso. No entanto, uma vantagem de 7% na classificação de desempenho não é muito significativa. Mas os dois processadores ainda são comparáveis, uma vez que ambos pertencem à mesma classe de preço.
Para completar, também executamos todos os testes de CPU com o PL2 ativado. Como você pode ver pelos resultados, não há desvantagem se você definir o limite de potência. Valores melhores são mesmo possíveis em partes, já que as CPUs não atingem temperaturas críticas aqui.
Você pode encontrar referências adicionais sobre os processadores aqui
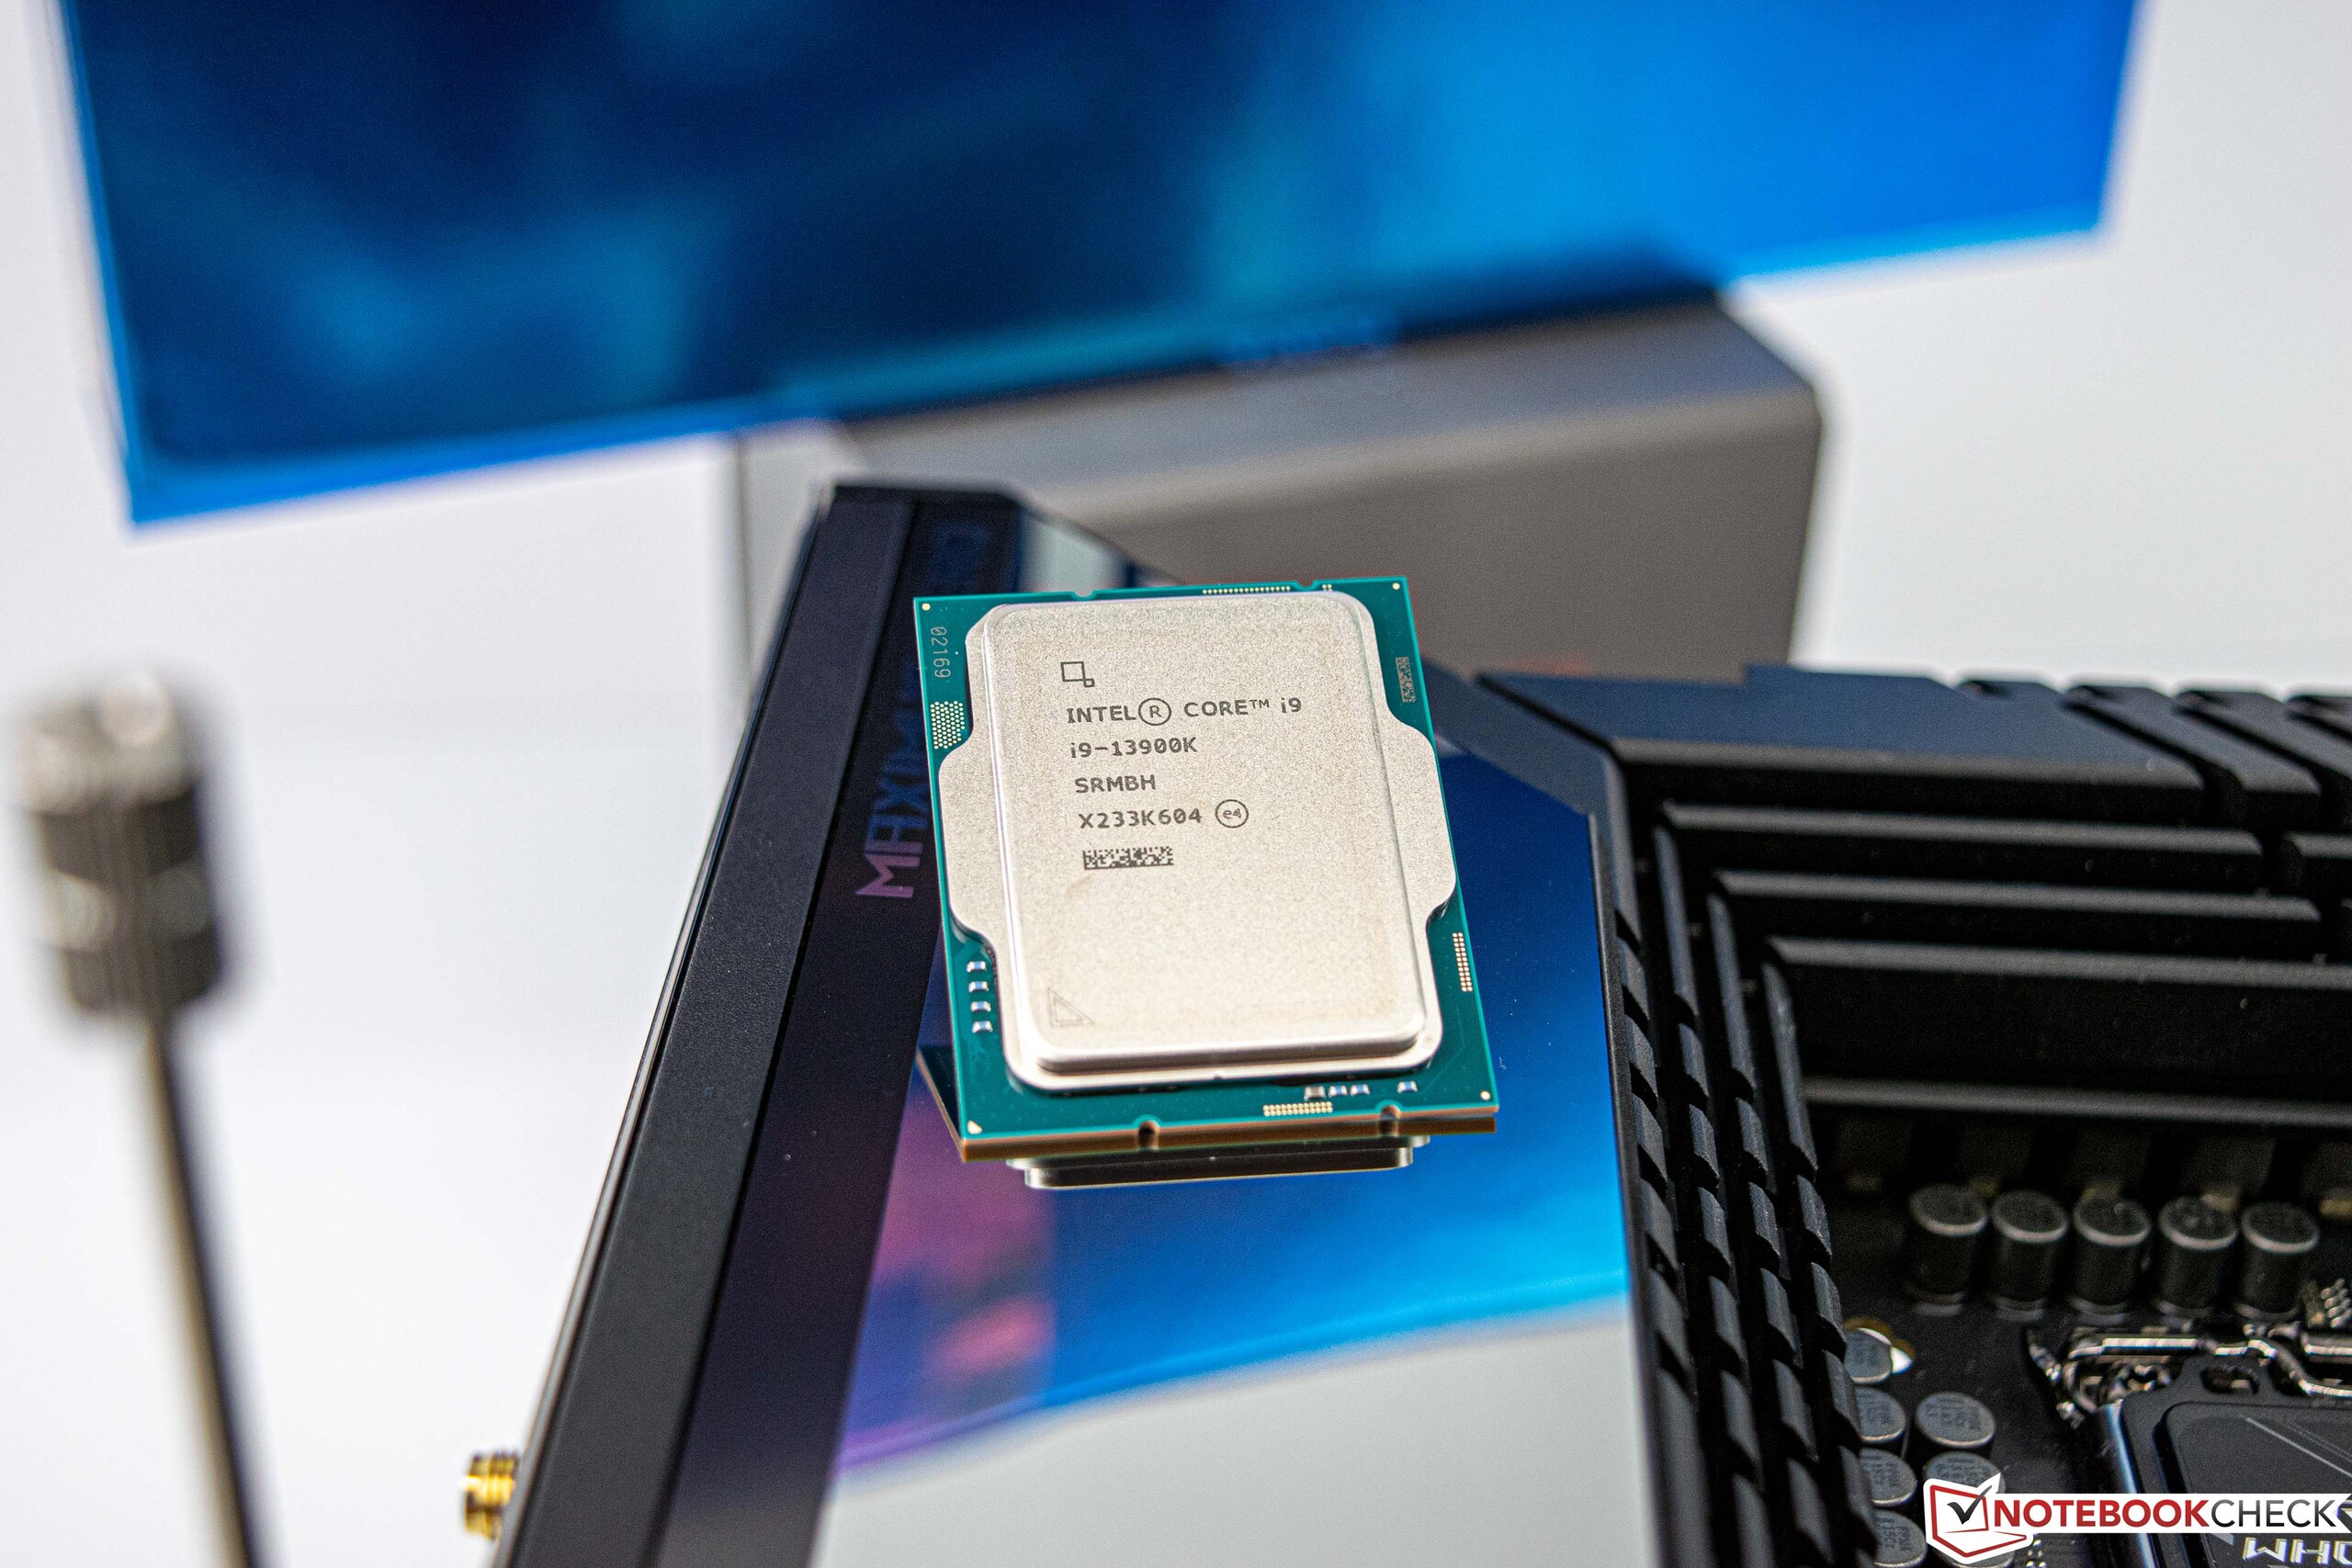
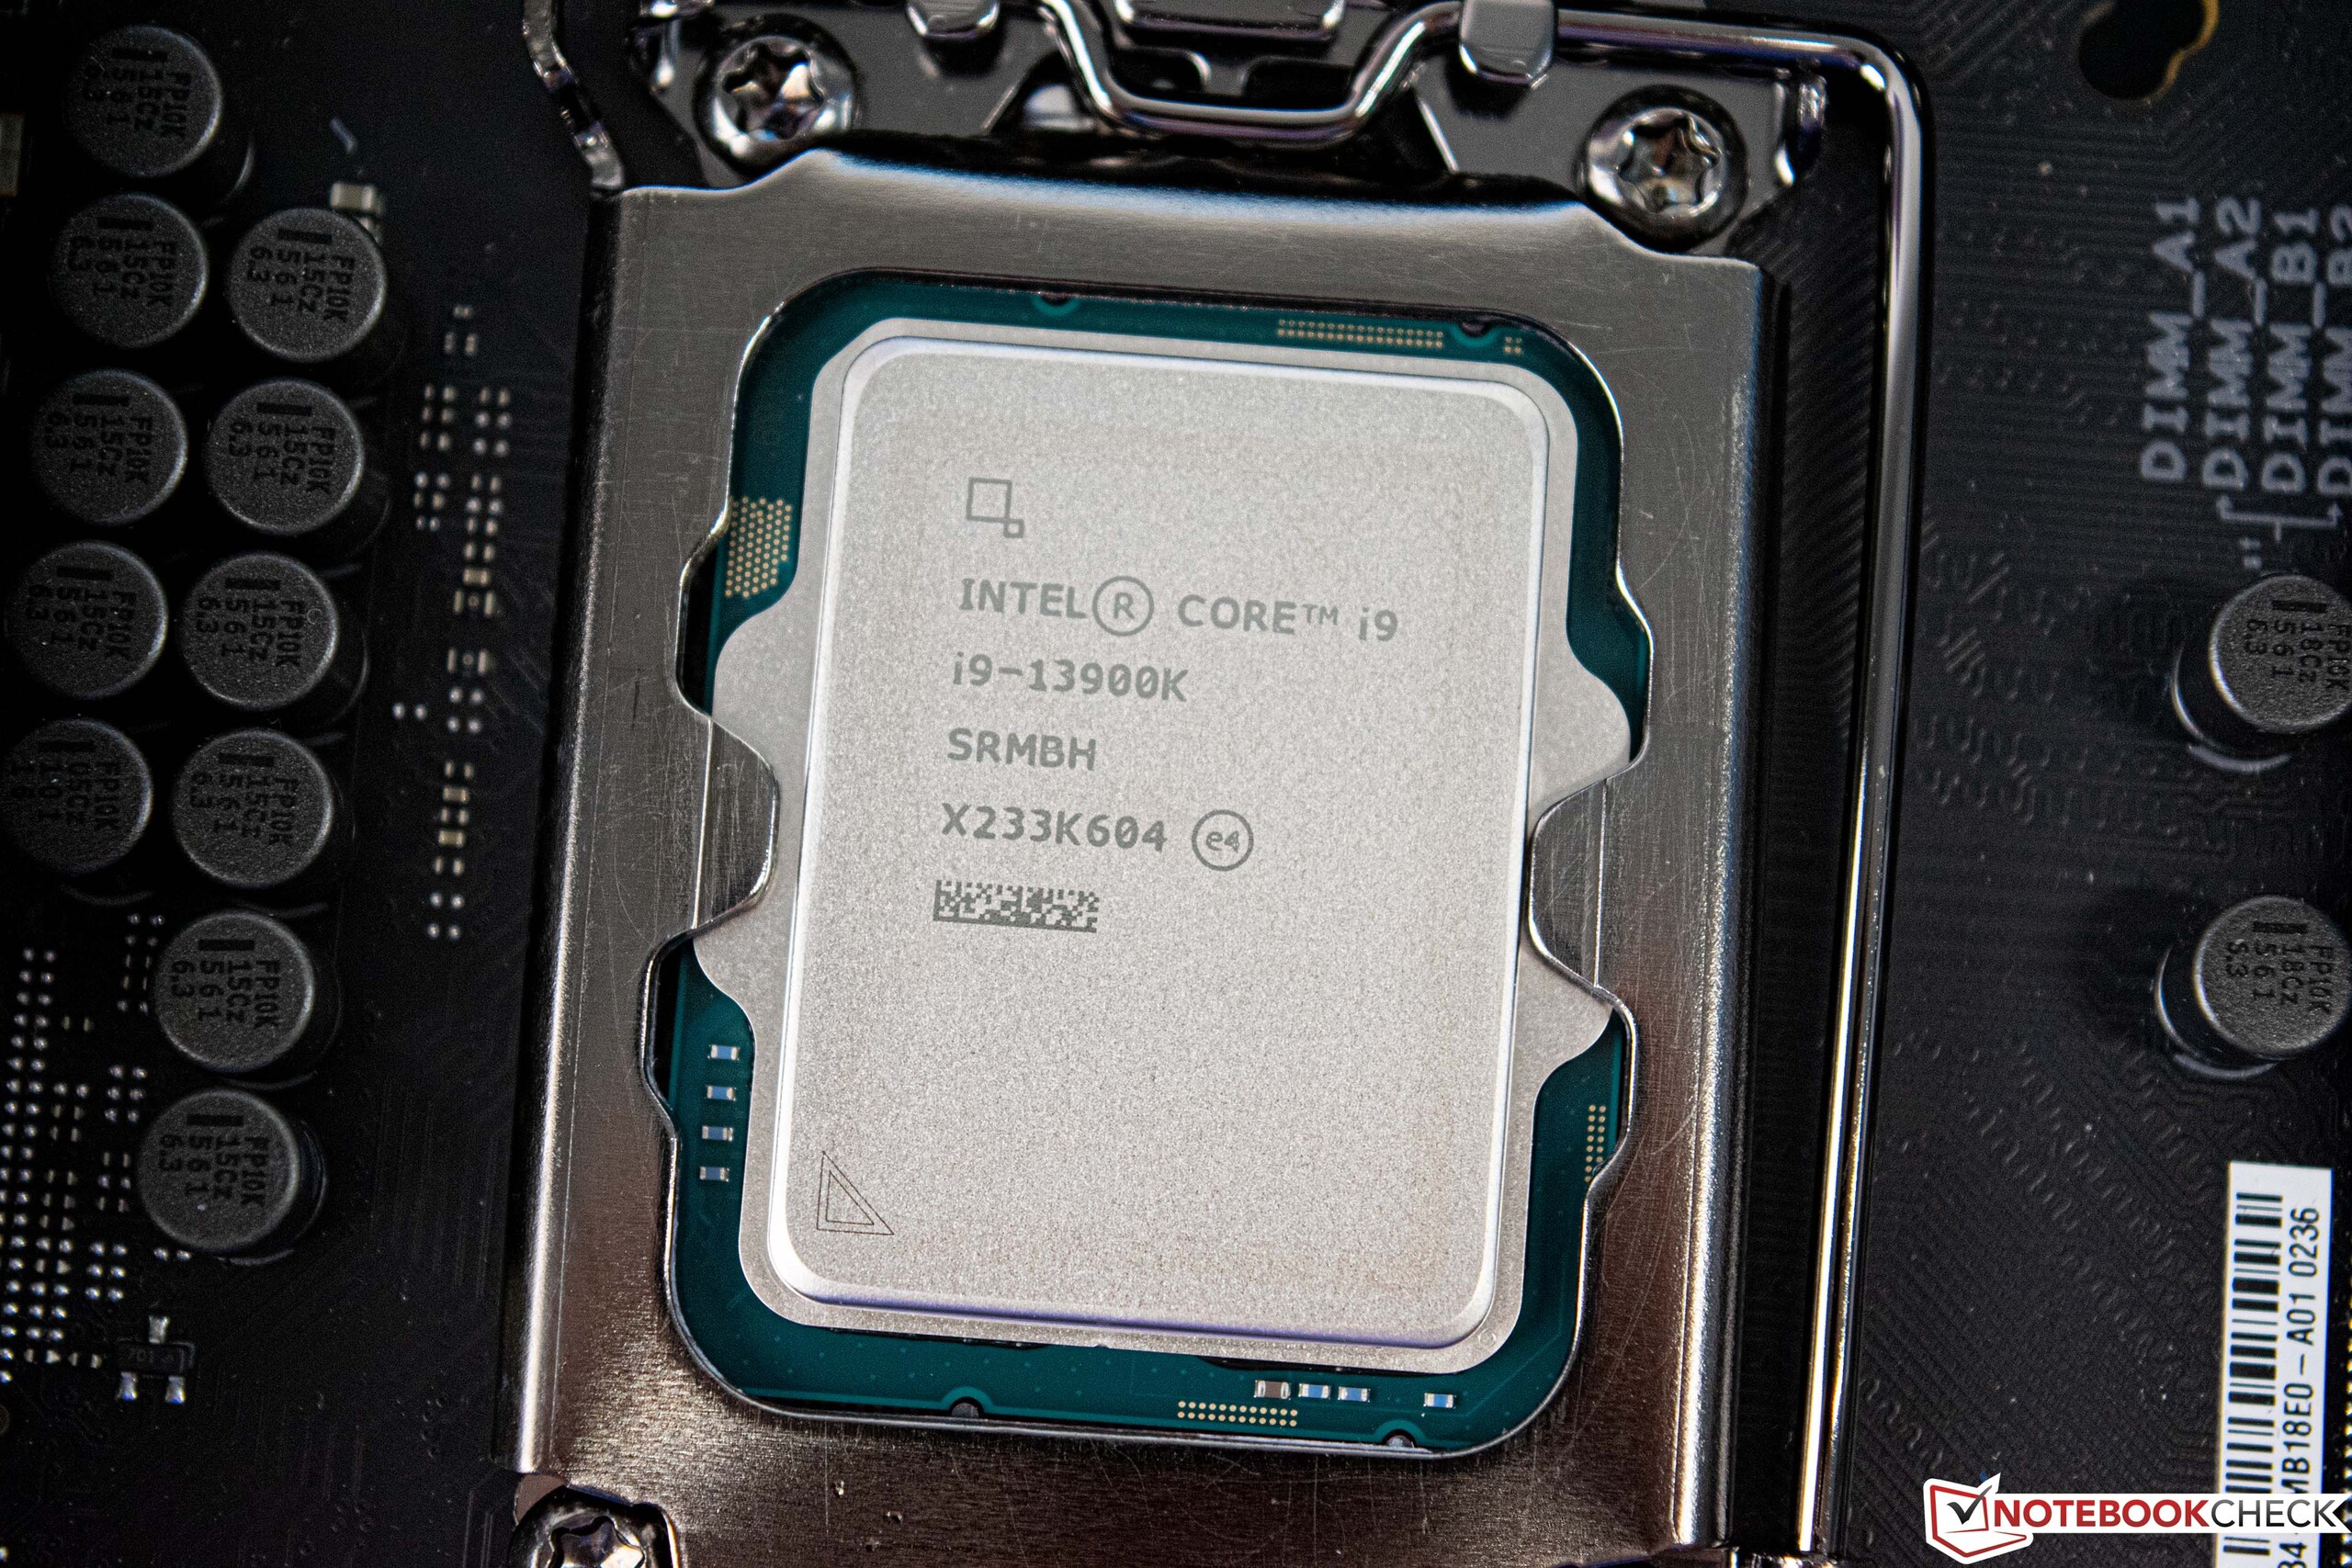
Intel Core i9-13900K

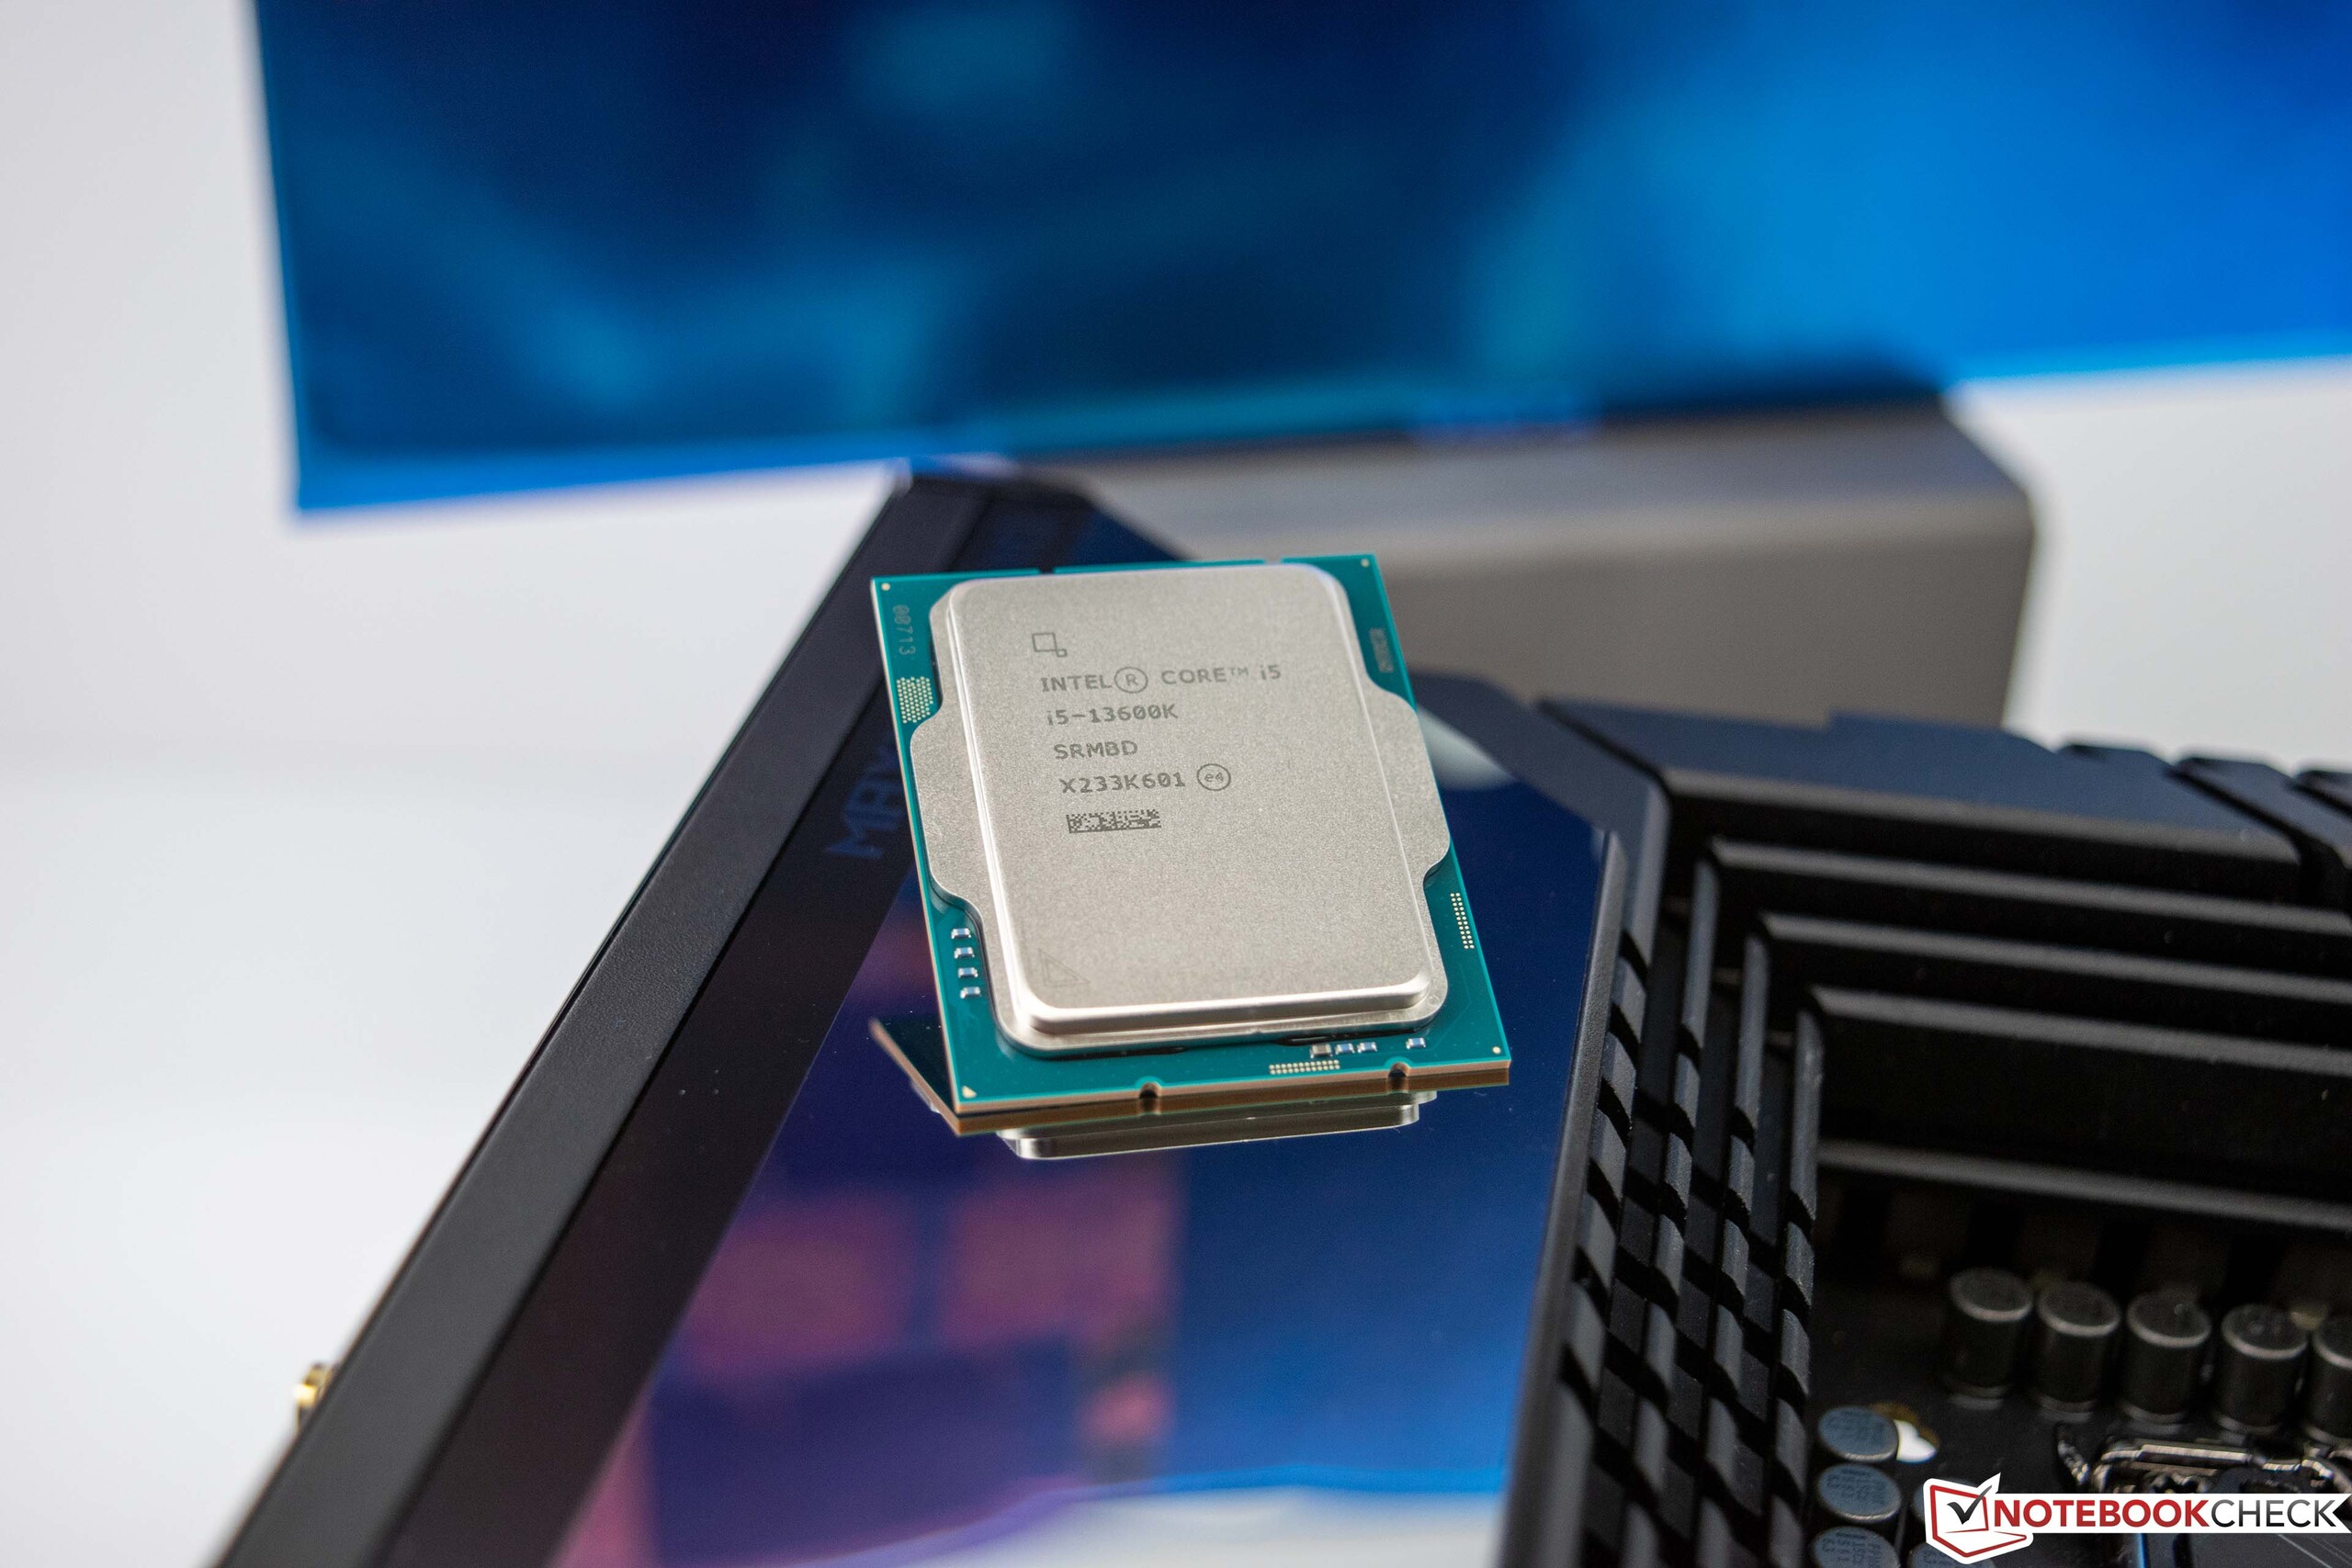
Intel Core i5-13600K
| Performance rating - Percent | |
| Intel Core i9-13900K | |
| Intel Core i9-13900K @253W | |
| NVIDIA GeForce RTX 3090 Founders Edition | |
| AMD Ryzen 9 7900X | |
| Intel Core i9-12900K | |
| Intel Core i5-13600K | |
| Intel Core i5-13600K @181W | |
| AMD Ryzen 5 7600X | |
| Intel Core i5-12600K | |
| Cinebench R15 | |
| CPU Single 64Bit | |
| NVIDIA GeForce RTX 3090 Founders Edition | |
| Intel Core i9-13900K @253W | |
| Intel Core i9-13900K | |
| AMD Ryzen 9 7900X | |
| AMD Ryzen 5 7600X | |
| Intel Core i5-13600K | |
| Intel Core i9-12900K | |
| Intel Core i5-13600K @181W | |
| Intel Core i5-12600K | |
| CPU Multi 64Bit | |
| NVIDIA GeForce RTX 3090 Founders Edition | |
| Intel Core i9-13900K | |
| Intel Core i9-13900K @253W | |
| AMD Ryzen 9 7900X | |
| Intel Core i9-12900K | |
| Intel Core i5-13600K | |
| Intel Core i5-13600K @181W | |
| Intel Core i5-12600K | |
| AMD Ryzen 5 7600X | |
| Cinebench R20 | |
| CPU (Single Core) | |
| Intel Core i9-13900K @253W | |
| Intel Core i9-13900K | |
| NVIDIA GeForce RTX 3090 Founders Edition | |
| AMD Ryzen 9 7900X | |
| Intel Core i5-13600K | |
| Intel Core i9-12900K | |
| Intel Core i5-13600K @181W | |
| AMD Ryzen 5 7600X | |
| Intel Core i5-12600K | |
| CPU (Multi Core) | |
| Intel Core i9-13900K | |
| NVIDIA GeForce RTX 3090 Founders Edition | |
| Intel Core i9-13900K @253W | |
| AMD Ryzen 9 7900X | |
| Intel Core i9-12900K | |
| Intel Core i5-13600K | |
| Intel Core i5-13600K @181W | |
| Intel Core i5-12600K | |
| AMD Ryzen 5 7600X | |
| Cinebench R23 | |
| Single Core | |
| Intel Core i9-13900K @253W | |
| Intel Core i9-13900K | |
| NVIDIA GeForce RTX 3090 Founders Edition | |
| AMD Ryzen 9 7900X | |
| Intel Core i5-13600K | |
| Intel Core i9-12900K | |
| Intel Core i5-13600K @181W | |
| AMD Ryzen 5 7600X | |
| Intel Core i5-12600K | |
| Multi Core | |
| Intel Core i9-13900K | |
| Intel Core i9-13900K @253W | |
| NVIDIA GeForce RTX 3090 Founders Edition | |
| AMD Ryzen 9 7900X | |
| Intel Core i9-12900K | |
| Intel Core i5-13600K | |
| Intel Core i5-13600K @181W | |
| Intel Core i5-12600K | |
| AMD Ryzen 5 7600X | |
| Cinebench R11.5 | |
| CPU Single 64Bit | |
| Intel Core i9-13900K @253W | |
| Intel Core i9-13900K | |
| NVIDIA GeForce RTX 3090 Founders Edition | |
| AMD Ryzen 9 7900X | |
| AMD Ryzen 5 7600X | |
| Intel Core i9-12900K | |
| Intel Core i5-13600K | |
| Intel Core i5-13600K @181W | |
| Intel Core i5-12600K | |
| CPU Multi 64Bit | |
| Intel Core i9-13900K | |
| NVIDIA GeForce RTX 3090 Founders Edition | |
| Intel Core i9-13900K @253W | |
| AMD Ryzen 9 7900X | |
| Intel Core i9-12900K | |
| Intel Core i5-13600K | |
| Intel Core i5-13600K @181W | |
| Intel Core i5-12600K | |
| AMD Ryzen 5 7600X | |
| Cinebench R10 | |
| Rendering Single CPUs 64Bit | |
| Intel Core i9-13900K @253W | |
| Intel Core i9-13900K | |
| AMD Ryzen 9 7900X | |
| NVIDIA GeForce RTX 3090 Founders Edition | |
| Intel Core i5-13600K | |
| Intel Core i9-12900K | |
| Intel Core i5-13600K @181W | |
| AMD Ryzen 5 7600X | |
| Intel Core i5-12600K | |
| Rendering Multiple CPUs 64Bit | |
| Intel Core i9-13900K @253W | |
| Intel Core i9-13900K | |
| NVIDIA GeForce RTX 3090 Founders Edition | |
| AMD Ryzen 9 7900X | |
| Intel Core i9-12900K | |
| Intel Core i5-13600K @181W | |
| Intel Core i5-13600K | |
| AMD Ryzen 5 7600X | |
| Intel Core i5-12600K | |
| Blender - v2.79 BMW27 CPU | |
| AMD Ryzen 5 7600X | |
| Intel Core i5-12600K | |
| Intel Core i5-13600K | |
| Intel Core i5-13600K @181W | |
| Intel Core i9-12900K | |
| AMD Ryzen 9 7900X | |
| NVIDIA GeForce RTX 3090 Founders Edition | |
| Intel Core i9-13900K @253W | |
| Intel Core i9-13900K | |
| wPrime 2.10 | |
| 32m | |
| Intel Core i9-12900K | |
| Intel Core i5-12600K | |
| AMD Ryzen 5 7600X | |
| Intel Core i5-13600K | |
| Intel Core i5-13600K @181W | |
| Intel Core i9-13900K @253W | |
| Intel Core i9-13900K | |
| AMD Ryzen 9 7900X | |
| NVIDIA GeForce RTX 3090 Founders Edition | |
| 1024m | |
| Intel Core i5-12600K | |
| Intel Core i9-12900K | |
| Intel Core i5-13600K | |
| Intel Core i5-13600K @181W | |
| Intel Core i9-13900K @253W | |
| Intel Core i9-13900K | |
| AMD Ryzen 5 7600X | |
| AMD Ryzen 9 7900X | |
| NVIDIA GeForce RTX 3090 Founders Edition | |
| X264 HD Benchmark 4.0 | |
| Pass 1 | |
| Intel Core i9-13900K @253W | |
| Intel Core i9-13900K | |
| Intel Core i5-13600K | |
| Intel Core i5-13600K @181W | |
| NVIDIA GeForce RTX 3090 Founders Edition | |
| AMD Ryzen 9 7900X | |
| Intel Core i9-12900K | |
| AMD Ryzen 5 7600X | |
| Intel Core i5-12600K | |
| Pass 2 | |
| Intel Core i9-13900K | |
| NVIDIA GeForce RTX 3090 Founders Edition | |
| Intel Core i9-13900K @253W | |
| AMD Ryzen 9 7900X | |
| Intel Core i9-12900K | |
| Intel Core i5-13600K | |
| Intel Core i5-13600K @181W | |
| Intel Core i5-12600K | |
| AMD Ryzen 5 7600X | |
| WinRAR - Result | |
| AMD Ryzen 9 7900X | |
| NVIDIA GeForce RTX 3090 Founders Edition | |
| AMD Ryzen 5 7600X | |
| Intel Core i9-13900K @253W | |
| Intel Core i9-13900K | |
| Intel Core i5-13600K @181W | |
| Intel Core i5-13600K | |
| Intel Core i9-12900K | |
| Intel Core i5-12600K | |
| TrueCrypt | |
| AES Mean 100MB | |
| NVIDIA GeForce RTX 3090 Founders Edition | |
| Intel Core i9-13900K | |
| Intel Core i9-13900K @253W | |
| Intel Core i5-13600K @181W | |
| Intel Core i5-13600K | |
| Intel Core i9-12900K | |
| AMD Ryzen 9 7900X | |
| AMD Ryzen 5 7600X | |
| Intel Core i5-12600K | |
| Twofish Mean 100MB | |
| Intel Core i9-13900K | |
| Intel Core i9-13900K @253W | |
| NVIDIA GeForce RTX 3090 Founders Edition | |
| Intel Core i9-12900K | |
| Intel Core i5-13600K @181W | |
| Intel Core i5-13600K | |
| AMD Ryzen 9 7900X | |
| Intel Core i5-12600K | |
| AMD Ryzen 5 7600X | |
| Serpent Mean 100MB | |
| Intel Core i9-13900K | |
| Intel Core i9-13900K @253W | |
| NVIDIA GeForce RTX 3090 Founders Edition | |
| Intel Core i9-12900K | |
| Intel Core i5-13600K | |
| Intel Core i5-13600K @181W | |
| AMD Ryzen 9 7900X | |
| Intel Core i5-12600K | |
| AMD Ryzen 5 7600X | |
| Geekbench 5.5 | |
| Multi-Core | |
| NVIDIA GeForce RTX 3090 Founders Edition | |
| Intel Core i9-13900K | |
| Intel Core i9-13900K @253W | |
| AMD Ryzen 9 7900X | |
| Intel Core i9-12900K | |
| Intel Core i5-13600K @181W | |
| Intel Core i5-13600K | |
| Intel Core i5-12600K | |
| AMD Ryzen 5 7600X | |
| Single-Core | |
| NVIDIA GeForce RTX 3090 Founders Edition | |
| Intel Core i9-13900K | |
| Intel Core i9-13900K @253W | |
| AMD Ryzen 9 7900X | |
| AMD Ryzen 5 7600X | |
| Intel Core i9-12900K | |
| Intel Core i5-13600K @181W | |
| Intel Core i5-13600K | |
| Intel Core i5-12600K | |
| Geekbench 5.0 | |
| 5.0 Multi-Core | |
| NVIDIA GeForce RTX 3090 Founders Edition | |
| Intel Core i9-13900K | |
| Intel Core i9-13900K @253W | |
| AMD Ryzen 9 7900X | |
| Intel Core i9-12900K | |
| Intel Core i5-13600K | |
| Intel Core i5-13600K @181W | |
| Intel Core i5-12600K | |
| AMD Ryzen 5 7600X | |
| 5.0 Single-Core | |
| Intel Core i9-13900K @253W | |
| NVIDIA GeForce RTX 3090 Founders Edition | |
| Intel Core i9-13900K | |
| AMD Ryzen 9 7900X | |
| AMD Ryzen 5 7600X | |
| Intel Core i9-12900K | |
| Intel Core i5-13600K @181W | |
| Intel Core i5-13600K | |
| Intel Core i5-12600K | |
| Geekbench 4.4 | |
| 64 Bit Single-Core Score | |
| Intel Core i9-13900K @253W | |
| Intel Core i9-13900K | |
| NVIDIA GeForce RTX 3090 Founders Edition | |
| AMD Ryzen 9 7900X | |
| AMD Ryzen 5 7600X | |
| Intel Core i9-12900K | |
| Intel Core i5-13600K @181W | |
| Intel Core i5-13600K | |
| Intel Core i5-12600K | |
| 64 Bit Multi-Core Score | |
| NVIDIA GeForce RTX 3090 Founders Edition | |
| Intel Core i9-13900K | |
| Intel Core i9-13900K @253W | |
| AMD Ryzen 9 7900X | |
| Intel Core i9-12900K | |
| Intel Core i5-13600K @181W | |
| Intel Core i5-13600K | |
| AMD Ryzen 5 7600X | |
| Intel Core i5-12600K | |
| 3DMark 11 - 1280x720 Performance Physics | |
| Intel Core i9-13900K | |
| Intel Core i9-13900K @253W | |
| Intel Core i5-13600K | |
| Intel Core i5-13600K @181W | |
| AMD Ryzen 9 7900X | |
| NVIDIA GeForce RTX 3090 Founders Edition | |
| Intel Core i9-12900K | |
| AMD Ryzen 5 7600X | |
| Intel Core i5-12600K | |
| 7-Zip 18.03 | |
| 7z b 4 | |
| NVIDIA GeForce RTX 3090 Founders Edition | |
| Intel Core i9-13900K | |
| Intel Core i9-13900K @253W | |
| AMD Ryzen 9 7900X | |
| Intel Core i9-12900K | |
| Intel Core i5-13600K | |
| Intel Core i5-13600K @181W | |
| AMD Ryzen 5 7600X | |
| Intel Core i5-12600K | |
| 7z b 4 -mmt1 | |
| NVIDIA GeForce RTX 3090 Founders Edition | |
| AMD Ryzen 9 7900X | |
| AMD Ryzen 5 7600X | |
| Intel Core i9-13900K @253W | |
| Intel Core i9-13900K | |
| Intel Core i9-12900K | |
| Intel Core i5-13600K | |
| Intel Core i5-13600K @181W | |
| Intel Core i5-12600K | |
| HWBOT x265 Benchmark v2.2 - 4k Preset | |
| NVIDIA GeForce RTX 3090 Founders Edition | |
| Intel Core i9-13900K | |
| Intel Core i9-13900K @253W | |
| AMD Ryzen 9 7900X | |
| Intel Core i5-12600K | |
| Intel Core i9-12900K | |
| Intel Core i5-13600K | |
| Intel Core i5-13600K @181W | |
| AMD Ryzen 5 7600X | |
| R Benchmark 2.5 - Overall mean | |
| Intel Core i5-12600K | |
| Intel Core i9-12900K | |
| Intel Core i5-13600K | |
| Intel Core i5-13600K @181W | |
| AMD Ryzen 5 7600X | |
| AMD Ryzen 9 7900X | |
| NVIDIA GeForce RTX 3090 Founders Edition | |
| Intel Core i9-13900K | |
| Intel Core i9-13900K @253W | |
| LibreOffice - 20 Documents To PDF | |
| Intel Core i5-12600K | |
| Intel Core i9-12900K | |
| AMD Ryzen 5 7600X | |
| Intel Core i9-13900K | |
| Intel Core i5-13600K @181W | |
| NVIDIA GeForce RTX 3090 Founders Edition | |
| Intel Core i5-13600K | |
| AMD Ryzen 9 7900X | |
| Intel Core i9-13900K @253W | |
| WebXPRT 3 - Overall | |
| AMD Ryzen 9 7900X | |
| Intel Core i9-13900K @253W | |
| NVIDIA GeForce RTX 3090 Founders Edition | |
| AMD Ryzen 5 7600X | |
| Intel Core i9-13900K | |
| Intel Core i5-13600K | |
| Intel Core i5-13600K @181W | |
| Intel Core i9-12900K | |
| Intel Core i5-12600K | |
| Mozilla Kraken 1.1 - Total | |
| Intel Core i5-12600K | |
| Intel Core i9-12900K | |
| Intel Core i5-13600K | |
| Intel Core i5-13600K @181W | |
| AMD Ryzen 5 7600X | |
| NVIDIA GeForce RTX 3090 Founders Edition | |
| Intel Core i9-13900K | |
| AMD Ryzen 9 7900X | |
| Intel Core i9-13900K @253W | |
| 3DMark | |
| 3840x2160 Fire Strike Ultra Physics | |
| Intel Core i9-13900K @253W | |
| Intel Core i9-13900K | |
| AMD Ryzen 9 7900X | |
| NVIDIA GeForce RTX 3090 Founders Edition | |
| Intel Core i9-12900K | |
| Intel Core i5-13600K @181W | |
| Intel Core i5-13600K | |
| AMD Ryzen 5 7600X | |
| Intel Core i5-12600K | |
| 1920x1080 Fire Strike Physics | |
| Intel Core i9-13900K @253W | |
| Intel Core i9-13900K | |
| AMD Ryzen 9 7900X | |
| NVIDIA GeForce RTX 3090 Founders Edition | |
| Intel Core i9-12900K | |
| Intel Core i5-13600K @181W | |
| Intel Core i5-13600K | |
| AMD Ryzen 5 7600X | |
| Intel Core i5-12600K | |
| 2560x1440 Time Spy CPU | |
| Intel Core i9-13900K @253W | |
| Intel Core i9-13900K | |
| Intel Core i9-12900K | |
| Intel Core i5-13600K | |
| Intel Core i5-13600K @181W | |
| AMD Ryzen 9 7900X | |
| NVIDIA GeForce RTX 3090 Founders Edition | |
| Intel Core i5-12600K | |
| AMD Ryzen 5 7600X | |
* ... menor é melhor
Intel Core i9-13900K + Intel Core i5-13600K vs. Cinebench R15 multi loop
No teste de carga, em que executamos o loop constante Cinebench R15, ambas as unidades de teste mostram um desempenho muito estável. Entretanto, devemos ainda mencionar que o Intel Core i9-13900K funciona constantemente no limite de temperatura. Mas, em mais de 2.000 pontos, o desempenho aumenta em comparação com o Intel Core i9-12900Kainda é enorme. Com uma média de 3.620 pontos em todas as 50 corridas, o Intel Core i5-13600K também é digno de menção.
Benchmarks Sintéticos e Desempenho de Aplicação
Embora as referências sintéticas ainda fossem claramente o domínio da Intel no lançamento do Alder Lake do ano passado, as coisas não parecem tão claras este ano. A AMD é capaz de acompanhar seus processadores Ryzen 9, e a Intel só consegue o terceiro lugar no benchmark PCMark 10. No entanto, em comparação com o Alder Lake, o Raptor Lake é capaz de se colocar à frente durante todo o tempo, implementando um bom desempenho.
| PCMark 10 - Score | |
| AMD Ryzen 9 7900X, NVIDIA GeForce RTX 3090 | |
| NVIDIA GeForce RTX 3090 Founders Edition, NVIDIA GeForce RTX 3090 | |
| Intel Core i9-13900K, NVIDIA GeForce RTX 3090 | |
| AMD Ryzen 5 7600X, NVIDIA GeForce RTX 3090 | |
| Intel Core i5-13600K, NVIDIA GeForce RTX 3090 | |
| Intel Core i9-12900K, NVIDIA Titan RTX | |
| Intel Core i5-12600K, NVIDIA Titan RTX | |
| 3DMark | |
| 1920x1080 Fire Strike Physics | |
| Intel Core i9-13900K @253W, NVIDIA GeForce RTX 3090 | |
| Intel Core i9-13900K, NVIDIA GeForce RTX 3090 | |
| AMD Ryzen 9 7900X, NVIDIA GeForce RTX 3090 | |
| NVIDIA GeForce RTX 3090 Founders Edition, NVIDIA GeForce RTX 3090 | |
| Intel Core i9-12900K, NVIDIA Titan RTX | |
| Intel Core i5-13600K @181W, NVIDIA GeForce RTX 3090 | |
| Intel Core i5-13600K, NVIDIA GeForce RTX 3090 | |
| AMD Ryzen 5 7600X, NVIDIA GeForce RTX 3090 | |
| Intel Core i5-12600K, NVIDIA Titan RTX | |
| 2560x1440 Time Spy CPU | |
| Intel Core i9-13900K @253W, NVIDIA GeForce RTX 3090 | |
| Intel Core i9-13900K, NVIDIA GeForce RTX 3090 | |
| Intel Core i9-12900K, NVIDIA Titan RTX | |
| Intel Core i5-13600K, NVIDIA GeForce RTX 3090 | |
| Intel Core i5-13600K @181W, NVIDIA GeForce RTX 3090 | |
| AMD Ryzen 9 7900X, NVIDIA GeForce RTX 3090 | |
| NVIDIA GeForce RTX 3090 Founders Edition, NVIDIA GeForce RTX 3090 | |
| Intel Core i5-12600K, NVIDIA Titan RTX | |
| AMD Ryzen 5 7600X, NVIDIA GeForce RTX 3090 | |
| 3DMark 11 - 1280x720 Performance Physics | |
| Intel Core i9-13900K, NVIDIA GeForce RTX 3090 | |
| Intel Core i9-13900K @253W, NVIDIA GeForce RTX 3090 | |
| Intel Core i5-13600K, NVIDIA GeForce RTX 3090 | |
| Intel Core i5-13600K @181W, NVIDIA GeForce RTX 3090 | |
| AMD Ryzen 9 7900X, NVIDIA GeForce RTX 3090 | |
| NVIDIA GeForce RTX 3090 Founders Edition, NVIDIA GeForce RTX 3090 | |
| Intel Core i9-12900K, NVIDIA Titan RTX | |
| AMD Ryzen 5 7600X, NVIDIA GeForce RTX 3090 | |
| Intel Core i5-12600K, NVIDIA Titan RTX | |
| Desktop-PC, NVIDIA GeForce RTX 3090 | |
| CrossMark - Overall | |
| Intel Core i9-13900K, NVIDIA GeForce RTX 3090 | |
| Intel Core i9-13900K @253W, NVIDIA GeForce RTX 3090 | |
| NVIDIA GeForce RTX 3090 Founders Edition, NVIDIA GeForce RTX 3090 | |
| AMD Ryzen 9 7900X, NVIDIA GeForce RTX 3090 | |
| Intel Core i5-13600K, NVIDIA GeForce RTX 3090 | |
| Intel Core i5-13600K @181W, NVIDIA GeForce RTX 3090 | |
| AMD Ryzen 5 7600X, NVIDIA GeForce RTX 3090 | |
| Intel Core i5-12600K, NVIDIA GeForce RTX 3090 | |
| AIDA64 / Memory Copy | |
| Intel Core i9-13900K @253W | |
| Intel Core i9-13900K | |
| Intel Core i5-13600K @181W | |
| Intel Core i9-12900K | |
| NVIDIA GeForce RTX 3090 Founders Edition | |
| Intel Core i5-13600K | |
| Intel Core i5-12600K | |
| AMD Ryzen 9 7900X | |
| AMD Ryzen 5 7600X | |
| Média da turma (4514 - 234662, n=2222) | |
| AIDA64 / Memory Read | |
| Intel Core i9-13900K | |
| Intel Core i9-13900K @253W | |
| Intel Core i9-12900K | |
| NVIDIA GeForce RTX 3090 Founders Edition | |
| Intel Core i5-13600K @181W | |
| Intel Core i5-12600K | |
| Intel Core i5-13600K | |
| AMD Ryzen 9 7900X | |
| AMD Ryzen 5 7600X | |
| Média da turma (4031 - 271066, n=2184) | |
| AIDA64 / Memory Write | |
| AMD Ryzen 5 7600X | |
| NVIDIA GeForce RTX 3090 Founders Edition | |
| AMD Ryzen 9 7900X | |
| Intel Core i9-13900K | |
| Intel Core i5-13600K @181W | |
| Intel Core i9-13900K @253W | |
| Intel Core i5-12600K | |
| Intel Core i9-12900K | |
| Intel Core i5-13600K | |
| Média da turma (3506 - 242868, n=2189) | |
| AIDA64 / Memory Latency | |
| Média da turma (6.1 - 536, n=2250) | |
| Intel Core i5-13600K | |
| Intel Core i9-13900K @253W | |
| Intel Core i9-13900K | |
| Intel Core i5-13600K @181W | |
| AMD Ryzen 5 7600X | |
| AMD Ryzen 9 7900X | |
| NVIDIA GeForce RTX 3090 Founders Edition | |
* ... menor é melhor
Desempenho nos jogos
Se fosse uma questão de CPU de jogos mais rápida nos anos anteriores, você poderia sempre contar com a Intel. Entretanto, a AMD foi então capaz de misturar as coisas com seus processadores Zen 4, de modo que não há um vencedor claro aqui. Na comparação acumulada dos onze jogos, o Intel Core i9-13900K fica pouco atrás do AMD Ryzen 9 7950X. Entretanto, se considerarmos também a classe de preço dos processadores, o Intel Core i9-13900K é capaz de colocar logo à frente do AMD Ryzen 9 7900X. Mas não devemos esquecer que existem alguns jogos que funcionam melhor com processadores Intel, e outros, onde os processadores AMD oferecem o melhor desempenho. Na comparação interna entre os dois processadores Raptor Lake S, os Intel Core i5-13600Kperde apenas 7% em relação ao navio-estandarte. Aqueles que ainda usam uma placa principal AM4 também podem dar uma olhada no AMD Ryzen 7 5800X3Duma vez que essa CPU também oferece um desempenho de jogo muito bom.
Tanto o processador Intel Core i9-13900K quanto o Intel Core i5-13600K oferecem um desempenho muito bom em jogos. No limite da CPU, medimos algumas diferenças significativas de desempenho entre os dois concorrentes, mas com o aumento da resolução e dos detalhes, isto se torna cada vez menos significativo. Não podemos dar à Intel a coroa da CPU para jogos mais rápida este ano, uma vez que a AMD é um pouco mais rápida com o Ryzen 9 7950X. Todos os competidores voltam a se aproximar. Aqueles que, além dos jogos, também transmitem e querem incluir o público se beneficiarão do maior número de fios, o que também torna os atuais processadores do Raptor Lake muito interessantes para os criadores de conteúdo.
Gaming Performance - Raptor Lake vs. Alder Lake
| Performance rating - Percent | |
| Intel Core i9-13900K | |
| Intel Core i9-12900K | |
| Intel Core i5-13600K | |
| Intel Core i5-12600K -2! | |
| F1 22 | |
| 1920x1080 Low Preset AA:T AF:16x | |
| Intel Core i5-13600K | |
| Intel Core i9-13900K | |
| Intel Core i9-12900K | |
| Intel Core i5-12600K | |
| 1920x1080 Ultra High Preset AA:T AF:16x | |
| Intel Core i9-12900K | |
| Intel Core i5-12600K | |
| Intel Core i5-13600K | |
| Intel Core i9-13900K | |
| Far Cry 5 | |
| 1920x1080 Ultra Preset AA:T | |
| Intel Core i9-13900K | |
| Intel Core i5-13600K | |
| Intel Core i9-12900K | |
| Intel Core i5-12600K | |
| 1280x720 Low Preset AA:T | |
| Intel Core i9-13900K | |
| Intel Core i5-13600K | |
| Intel Core i9-12900K | |
| Intel Core i5-12600K | |
| X-Plane 11.11 | |
| 1920x1080 high (fps_test=3) | |
| Intel Core i9-13900K | |
| Intel Core i9-12900K | |
| Intel Core i5-13600K | |
| Intel Core i5-12600K | |
| 1280x720 low (fps_test=1) | |
| Intel Core i9-13900K | |
| Intel Core i9-12900K | |
| Intel Core i5-13600K | |
| Intel Core i5-12600K | |
| Final Fantasy XV Benchmark | |
| 1920x1080 High Quality | |
| Intel Core i5-13600K | |
| Intel Core i9-13900K | |
| Intel Core i9-12900K | |
| Intel Core i5-12600K | |
| 1280x720 Lite Quality | |
| Intel Core i5-13600K | |
| Intel Core i9-13900K | |
| Intel Core i9-12900K | |
| Intel Core i5-12600K | |
| Dota 2 Reborn | |
| 1920x1080 ultra (3/3) best looking | |
| Intel Core i9-13900K | |
| Intel Core i5-13600K | |
| Intel Core i9-12900K | |
| Intel Core i5-12600K | |
| 1280x720 min (0/3) fastest | |
| Intel Core i9-13900K | |
| Intel Core i5-13600K | |
| Intel Core i9-12900K | |
| Intel Core i5-12600K | |
| The Witcher 3 | |
| 1920x1080 Ultra Graphics & Postprocessing (HBAO+) | |
| Intel Core i5-13600K | |
| Intel Core i9-12900K | |
| Intel Core i9-13900K | |
| 1024x768 Low Graphics & Postprocessing | |
| Intel Core i9-13900K | |
| Intel Core i9-12900K | |
| Intel Core i5-13600K | |
| GTA V | |
| 1920x1080 Highest AA:4xMSAA + FX AF:16x | |
| Intel Core i9-13900K | |
| Intel Core i5-13600K | |
| Intel Core i9-12900K | |
| Intel Core i5-12600K | |
| 1024x768 Lowest Settings possible | |
| Intel Core i9-13900K | |
| Intel Core i5-13600K | |
| Intel Core i9-12900K | |
| Intel Core i5-12600K | |
Gaming Performance in Direct Comparison with AMD
| Performance rating - Percent | |
| AMD Ryzen 9 7950X | |
| Intel Core i9-13900K | |
| AMD Ryzen 9 7900X | |
| AMD Ryzen 5 7600X | |
| Intel Core i5-13600K | |
| F1 22 | |
| 1920x1080 Low Preset AA:T AF:16x | |
| AMD Ryzen 9 7950X | |
| AMD Ryzen 9 7900X | |
| AMD Ryzen 5 7600X | |
| Intel Core i5-13600K | |
| Intel Core i9-13900K | |
| 1920x1080 Ultra High Preset AA:T AF:16x | |
| AMD Ryzen 9 7950X | |
| Intel Core i5-13600K | |
| AMD Ryzen 5 7600X | |
| AMD Ryzen 9 7900X | |
| Intel Core i9-13900K | |
| Far Cry 5 | |
| 1920x1080 Ultra Preset AA:T | |
| Intel Core i9-13900K | |
| AMD Ryzen 9 7950X | |
| Intel Core i5-13600K | |
| AMD Ryzen 9 7900X | |
| AMD Ryzen 5 7600X | |
| 1280x720 Low Preset AA:T | |
| Intel Core i9-13900K | |
| AMD Ryzen 9 7900X | |
| Intel Core i5-13600K | |
| AMD Ryzen 9 7950X | |
| AMD Ryzen 5 7600X | |
| X-Plane 11.11 | |
| 1920x1080 high (fps_test=3) | |
| AMD Ryzen 9 7900X | |
| AMD Ryzen 9 7950X | |
| AMD Ryzen 5 7600X | |
| Intel Core i9-13900K | |
| Intel Core i5-13600K | |
| 1280x720 low (fps_test=1) | |
| Intel Core i9-13900K | |
| AMD Ryzen 5 7600X | |
| AMD Ryzen 9 7900X | |
| AMD Ryzen 9 7950X | |
| Intel Core i5-13600K | |
| Final Fantasy XV Benchmark | |
| 1920x1080 High Quality | |
| AMD Ryzen 9 7900X | |
| Intel Core i5-13600K | |
| Intel Core i9-13900K | |
| AMD Ryzen 9 7950X | |
| AMD Ryzen 5 7600X | |
| 1280x720 Lite Quality | |
| AMD Ryzen 9 7900X | |
| Intel Core i5-13600K | |
| AMD Ryzen 9 7950X | |
| Intel Core i9-13900K | |
| AMD Ryzen 5 7600X | |
| Dota 2 Reborn | |
| 1920x1080 ultra (3/3) best looking | |
| AMD Ryzen 9 7950X | |
| AMD Ryzen 9 7900X | |
| Intel Core i9-13900K | |
| AMD Ryzen 5 7600X | |
| Intel Core i5-13600K | |
| 1280x720 min (0/3) fastest | |
| AMD Ryzen 5 7600X | |
| AMD Ryzen 9 7900X | |
| AMD Ryzen 9 7950X | |
| Intel Core i9-13900K | |
| Intel Core i5-13600K | |
| The Witcher 3 | |
| 1920x1080 Ultra Graphics & Postprocessing (HBAO+) | |
| AMD Ryzen 9 7950X | |
| AMD Ryzen 9 7900X | |
| AMD Ryzen 5 7600X | |
| Intel Core i5-13600K | |
| Intel Core i9-13900K | |
| 1024x768 Low Graphics & Postprocessing | |
| AMD Ryzen 9 7950X | |
| AMD Ryzen 9 7900X | |
| Intel Core i9-13900K | |
| AMD Ryzen 5 7600X | |
| Intel Core i5-13600K | |
| GTA V | |
| 1920x1080 Highest AA:4xMSAA + FX AF:16x | |
| Intel Core i9-13900K | |
| AMD Ryzen 9 7950X | |
| AMD Ryzen 9 7900X | |
| AMD Ryzen 5 7600X | |
| Intel Core i5-13600K | |
| 1024x768 Lowest Settings possible | |
| Intel Core i9-13900K | |
| AMD Ryzen 9 7900X | |
| AMD Ryzen 5 7600X | |
| Intel Core i5-13600K | |
| AMD Ryzen 9 7950X | |
| Borderlands 3 | |
| 1280x720 Very Low Overall Quality (DX11) | |
| AMD Ryzen 9 7900X | |
| Intel Core i9-13900K | |
| AMD Ryzen 9 7950X | |
| AMD Ryzen 5 7600X | |
| Intel Core i5-13600K | |
| 1920x1080 Badass Overall Quality (DX11) | |
| AMD Ryzen 9 7950X | |
| AMD Ryzen 9 7900X | |
| Intel Core i9-13900K | |
| AMD Ryzen 5 7600X | |
| Intel Core i5-13600K | |
| Far Cry New Dawn | |
| 1280x720 Low Preset | |
| Intel Core i9-13900K | |
| AMD Ryzen 9 7950X | |
| Intel Core i5-13600K | |
| AMD Ryzen 9 7900X | |
| AMD Ryzen 5 7600X | |
| 1920x1080 Ultra Preset | |
| Intel Core i9-13900K | |
| AMD Ryzen 9 7950X | |
| Intel Core i5-13600K | |
| AMD Ryzen 9 7900X | |
| AMD Ryzen 5 7600X | |
| Shadow of the Tomb Raider | |
| 1280x720 Lowest Preset | |
| AMD Ryzen 9 7950X | |
| AMD Ryzen 9 7900X | |
| Intel Core i9-13900K | |
| AMD Ryzen 5 7600X | |
| Intel Core i5-13600K | |
| 1920x1080 Highest Preset AA:T | |
| AMD Ryzen 9 7900X | |
| AMD Ryzen 9 7950X | |
| Intel Core i9-13900K | |
| AMD Ryzen 5 7600X | |
| Intel Core i5-13600K | |
| Tiny Tina's Wonderlands | |
| 1920x1080 Low Preset (DX12) | |
| AMD Ryzen 9 7950X | |
| Intel Core i9-13900K | |
| AMD Ryzen 5 7600X | |
| AMD Ryzen 9 7900X | |
| Intel Core i5-13600K | |
| 1920x1080 Badass Preset (DX12) | |
| AMD Ryzen 9 7900X | |
| AMD Ryzen 5 7600X | |
| AMD Ryzen 9 7950X | |
| Intel Core i9-13900K | |
| Intel Core i5-13600K | |
Intel Core i9-13900K with Nvidia GeForce RTX 3090
| baixo | média | alto | ultra | QHD | 4K | |
|---|---|---|---|---|---|---|
| GTA V (2015) | 187.7 | 187.7 | 187.4 | 165.6 | 156.7 | 182.5 |
| The Witcher 3 (2015) | 752 | 584 | 368 | 179.8 | 151.6 | |
| Dota 2 Reborn (2015) | 285.3 | 256.1 | 243.7 | 229.2 | 215.9 | |
| Final Fantasy XV Benchmark (2018) | 234 | 233 | 188.9 | 148.2 | 88.5 | |
| X-Plane 11.11 (2018) | 234 | 202 | 148.4 | 128.4 | ||
| Far Cry 5 (2018) | 263 | 232 | 220 | 205 | 186 | 110 |
| Strange Brigade (2018) | 749 | 506 | 402 | 350 | 266 | 159 |
| Shadow of the Tomb Raider (2018) | 314 | 265 | 250 | 230 | 167.4 | 97.1 |
| Far Cry New Dawn (2019) | 221 | 191 | 183 | 166 | 156 | 111 |
| Metro Exodus (2019) | 285 | 217 | 173.9 | 141.3 | 116.4 | 76.2 |
| Borderlands 3 (2019) | 243 | 215 | 190.3 | 163 | 128.3 | 73.1 |
| F1 2020 (2020) | 515 | 438 | 407 | 297 | 233 | 142.4 |
| F1 2021 (2021) | 590 | 520 | 435 | 224 | 171.8 | 103.4 |
| Far Cry 6 (2021) | 226 | 192.3 | 169.2 | 159.1 | 133.5 | 84.5 |
| Forza Horizon 5 (2021) | 334 | 214 | 196 | 127 | 113 | 85 |
| God of War (2022) | 240 | 204 | 170.8 | 121.9 | 108.4 | 77.1 |
| Tiny Tina's Wonderlands (2022) | 368 | 297 | 209 | 165.8 | 121.7 | 69.2 |
| F1 22 (2022) | 320 | 338 | 308 | 122.6 | 82.5 | 41.8 |
| The Quarry (2022) | 279 | 217 | 177.3 | 146.1 | 104.6 | 59 |
Intel Core i5-13600K with Nvidia GeForce RTX 3090
| baixo | média | alto | ultra | QHD | 4K | |
|---|---|---|---|---|---|---|
| GTA V (2015) | 187.5 | 187.5 | 186.7 | 154.9 | 148.5 | 180.7 |
| The Witcher 3 (2015) | 611 | 551 | 369 | 183.2 | 152.8 | |
| Dota 2 Reborn (2015) | 246.2 | 224.6 | 216.8 | 205.4 | 200.4 | |
| Final Fantasy XV Benchmark (2018) | 235 | 230 | 189.7 | 145.6 | 86.8 | |
| X-Plane 11.11 (2018) | 200 | 175.3 | 131.4 | 112.7 | ||
| Far Cry 5 (2018) | 240 | 212 | 201 | 188 | 177 | 108 |
| Strange Brigade (2018) | 679 | 487 | 398 | 348 | 265 | 158.4 |
| Shadow of the Tomb Raider (2018) | 269 | 240 | 234 | 220 | 167.1 | 96.4 |
| Far Cry New Dawn (2019) | 201 | 176 | 170 | 153 | 146 | 108 |
| Metro Exodus (2019) | 272 | 218 | 173 | 140.8 | 115.5 | 75.7 |
| Borderlands 3 (2019) | 223 | 195.3 | 176.3 | 156.3 | 128.3 | 73.2 |
| F1 2020 (2020) | 456 | 383 | 376 | 295 | 233 | 142.1 |
| F1 2021 (2021) | 512 | 474 | 399 | 223 | 171.8 | 101.8 |
| Far Cry 6 (2021) | 195.3 | 183.1 | 170.8 | 151.2 | 132.4 | 84.1 |
| God of War (2022) | 228 | 205 | 168.9 | 122 | 106.5 | 76.5 |
| GRID Legends (2022) | 287 | 261 | 232 | 156 | 177.8 | 115.1 |
| Tiny Tina's Wonderlands (2022) | 358 | 290 | 208 | 165.1 | 120.8 | 68.8 |
| F1 22 (2022) | 322 | 373 | 432 | 128.1 | 84.1 | 42.4 |
| The Quarry (2022) | 270 | 213 | 177.9 | 145.9 | 105 | 59.4 |
Consumo de energia
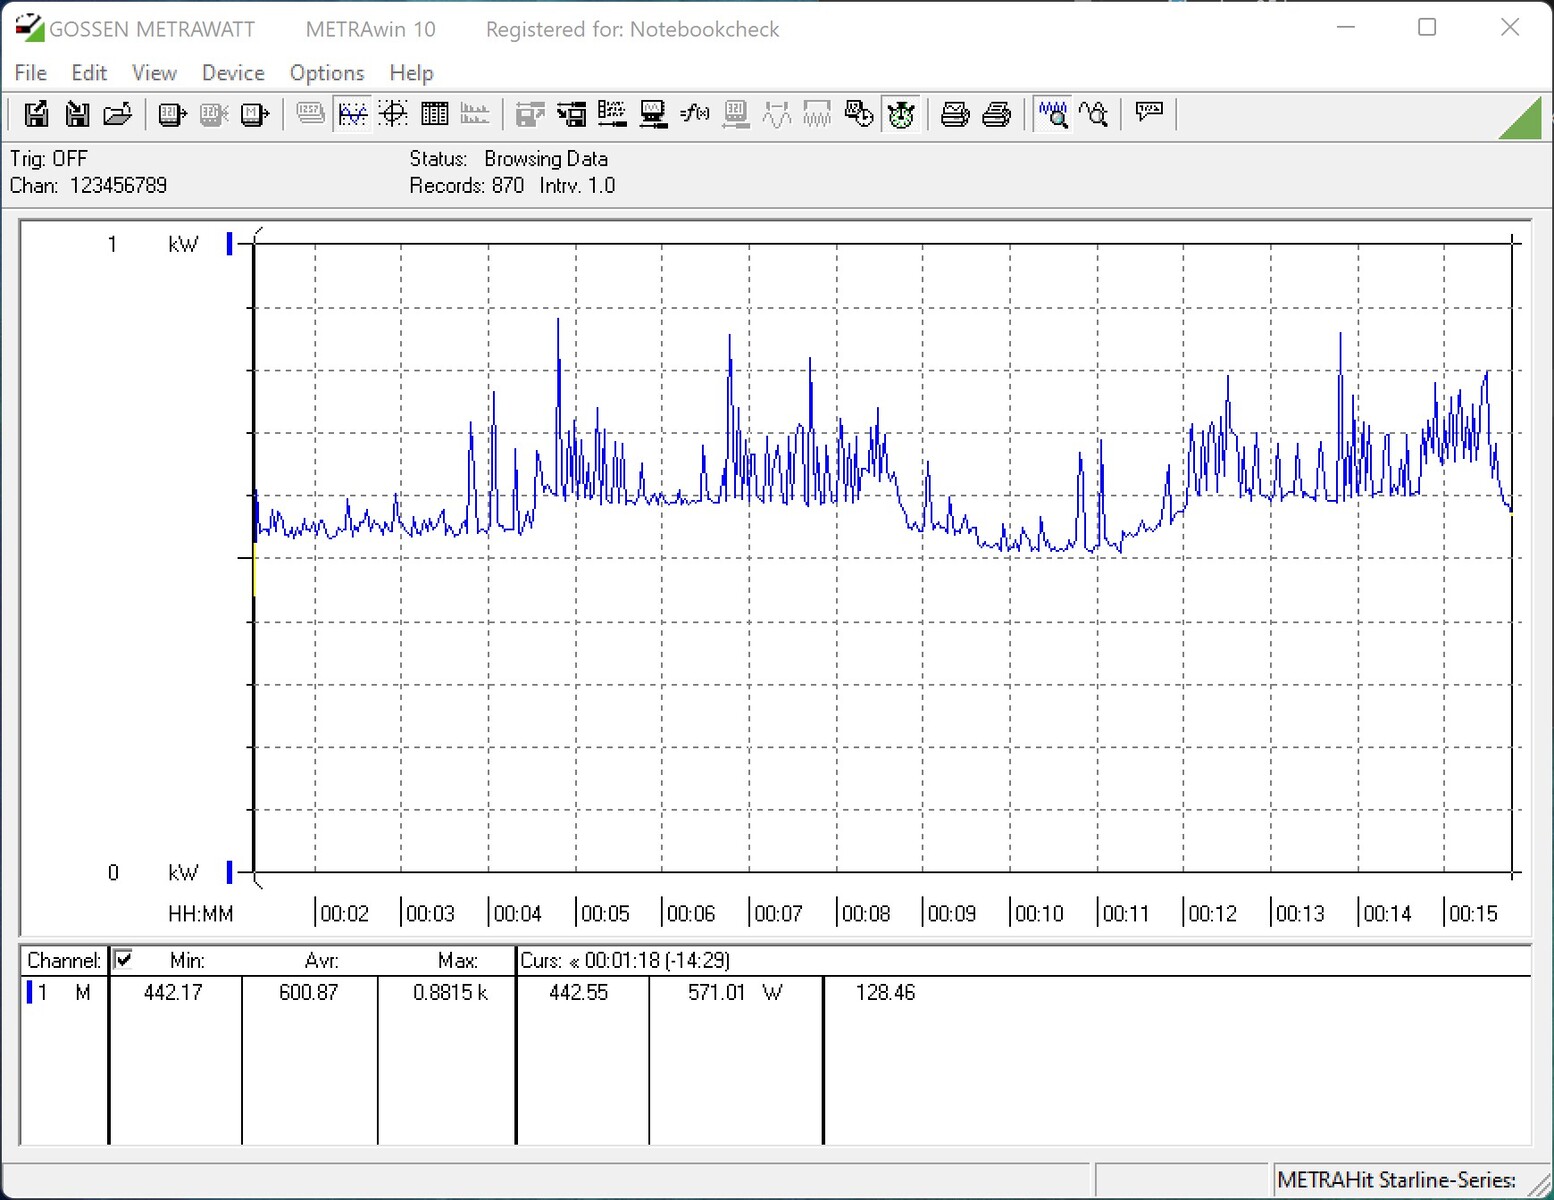
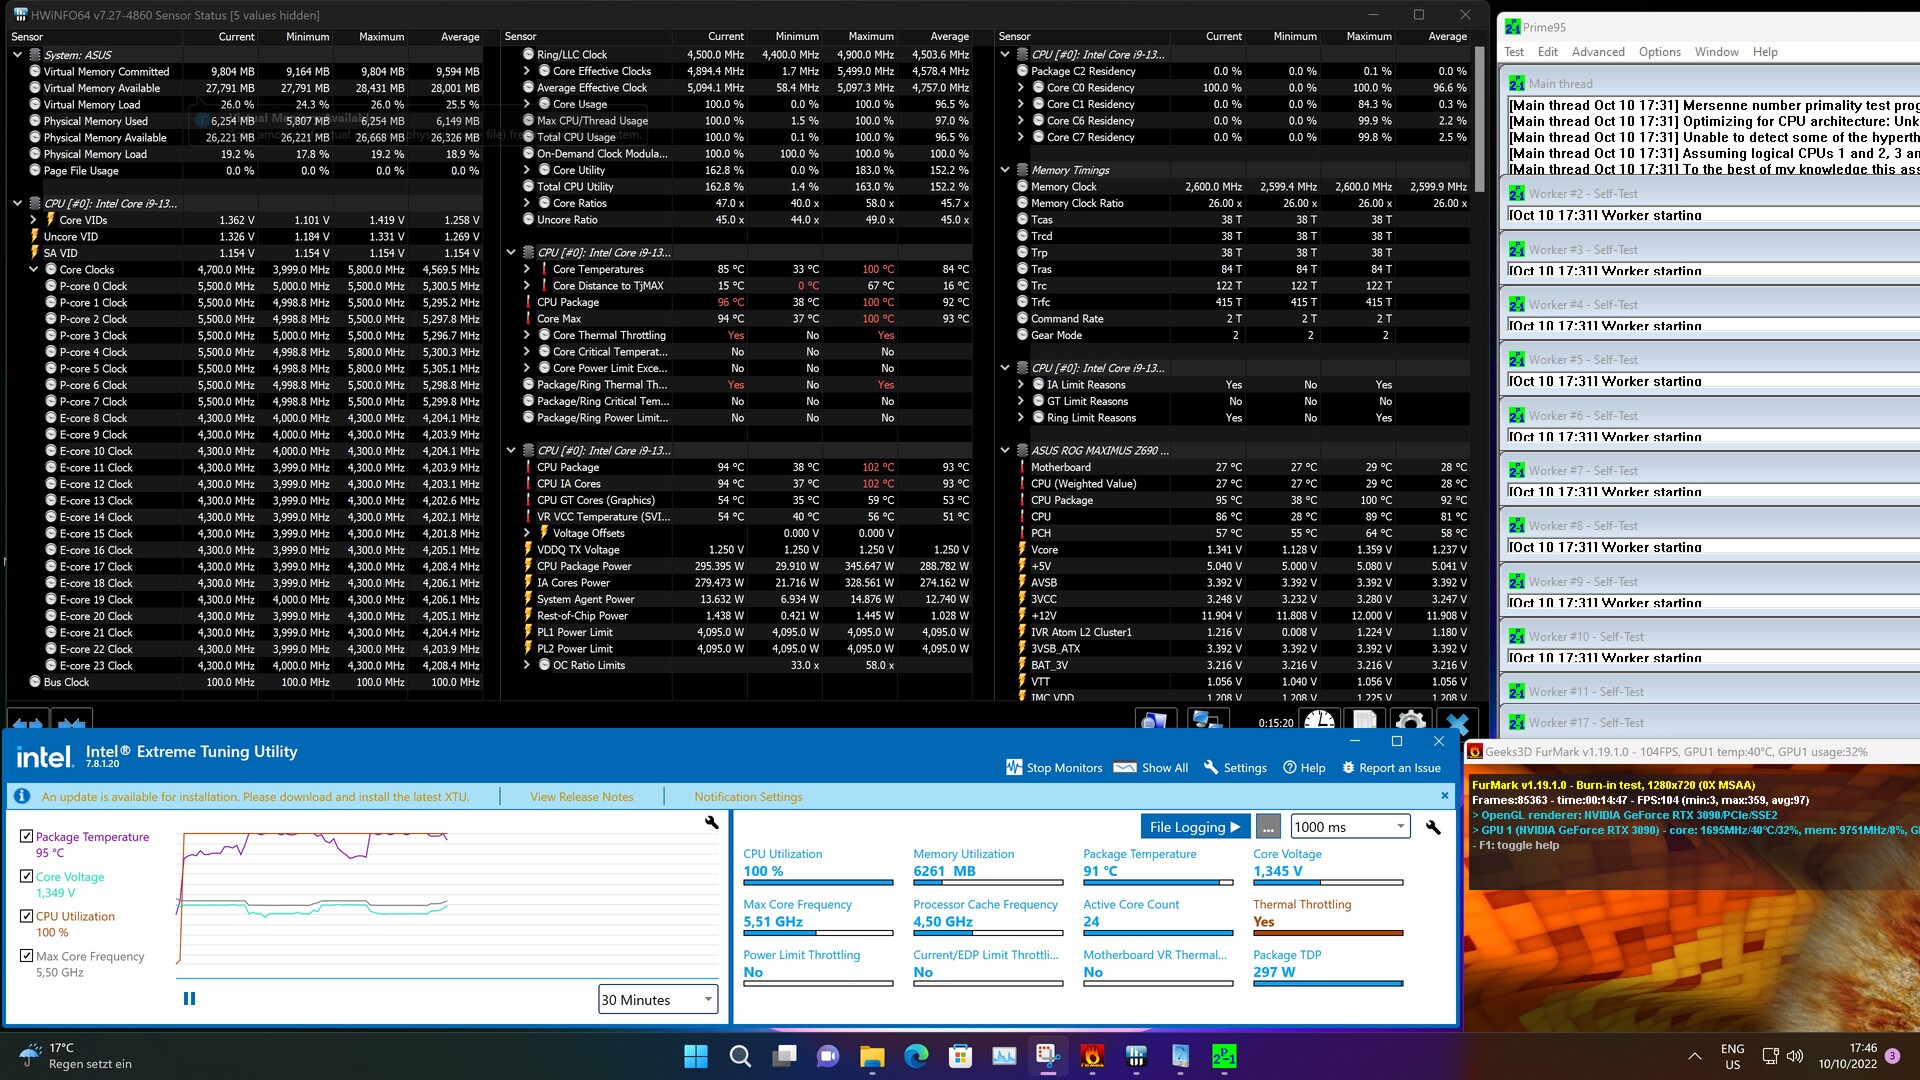
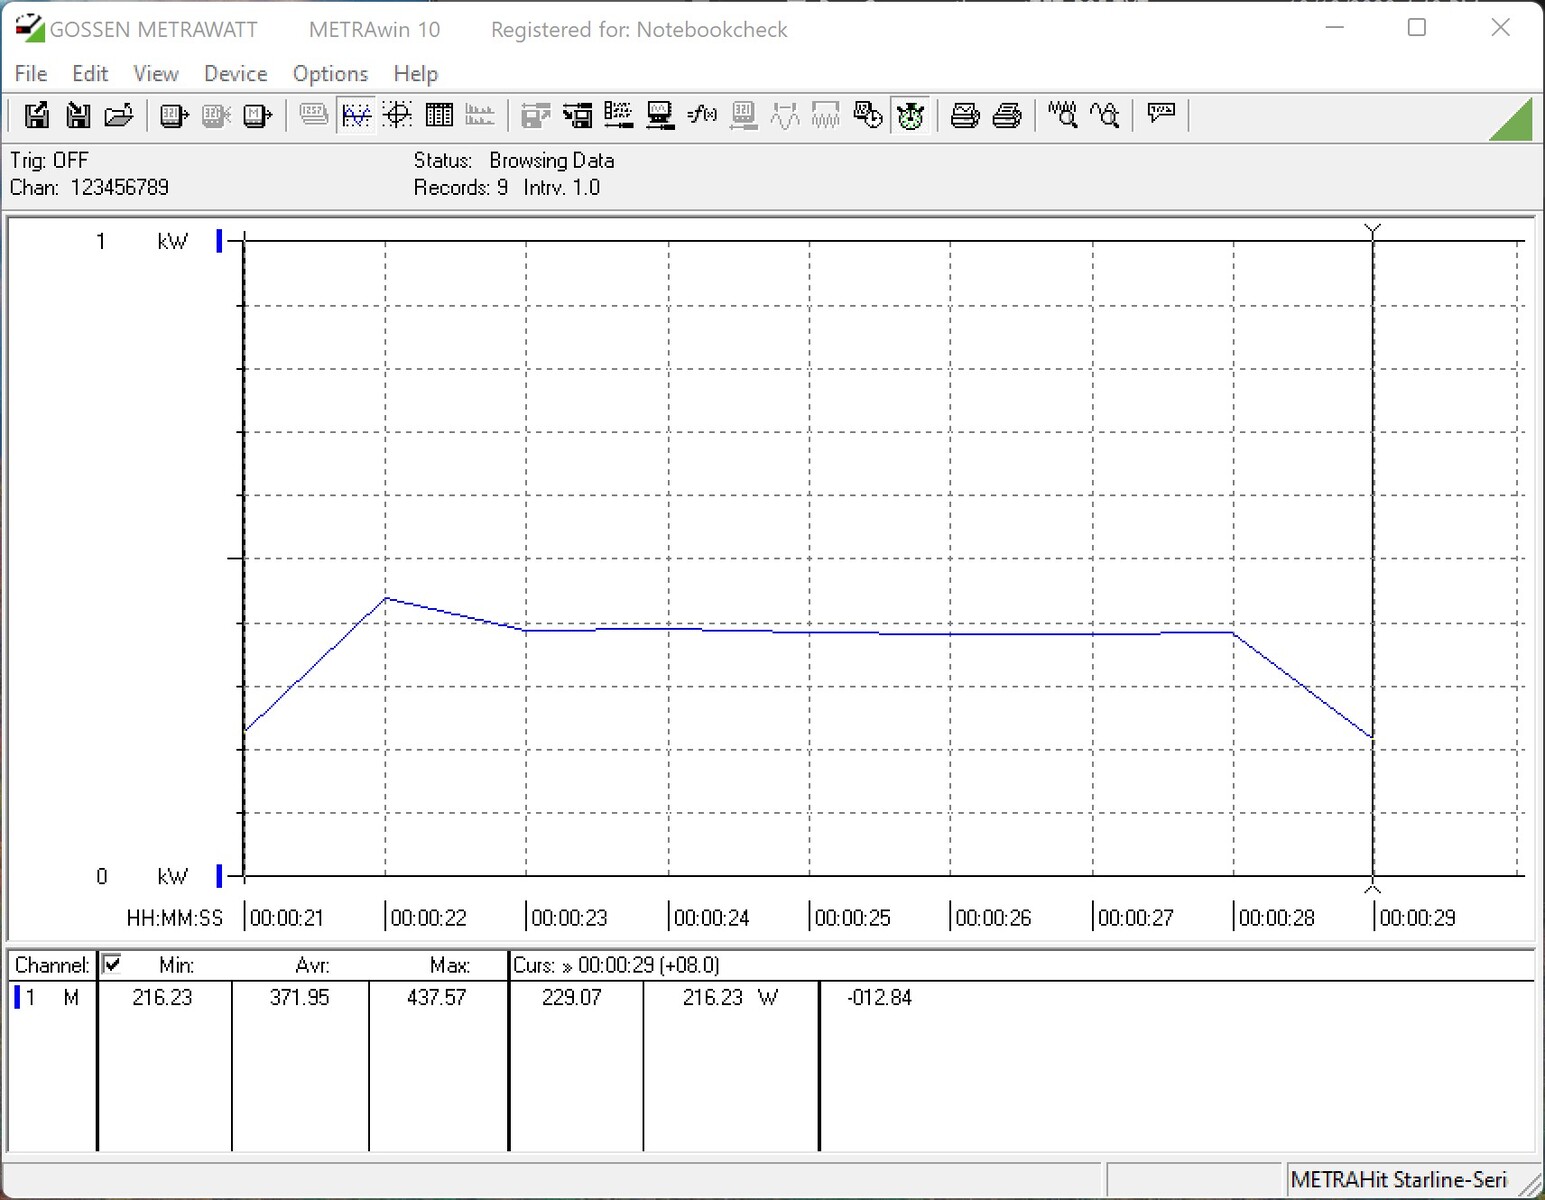
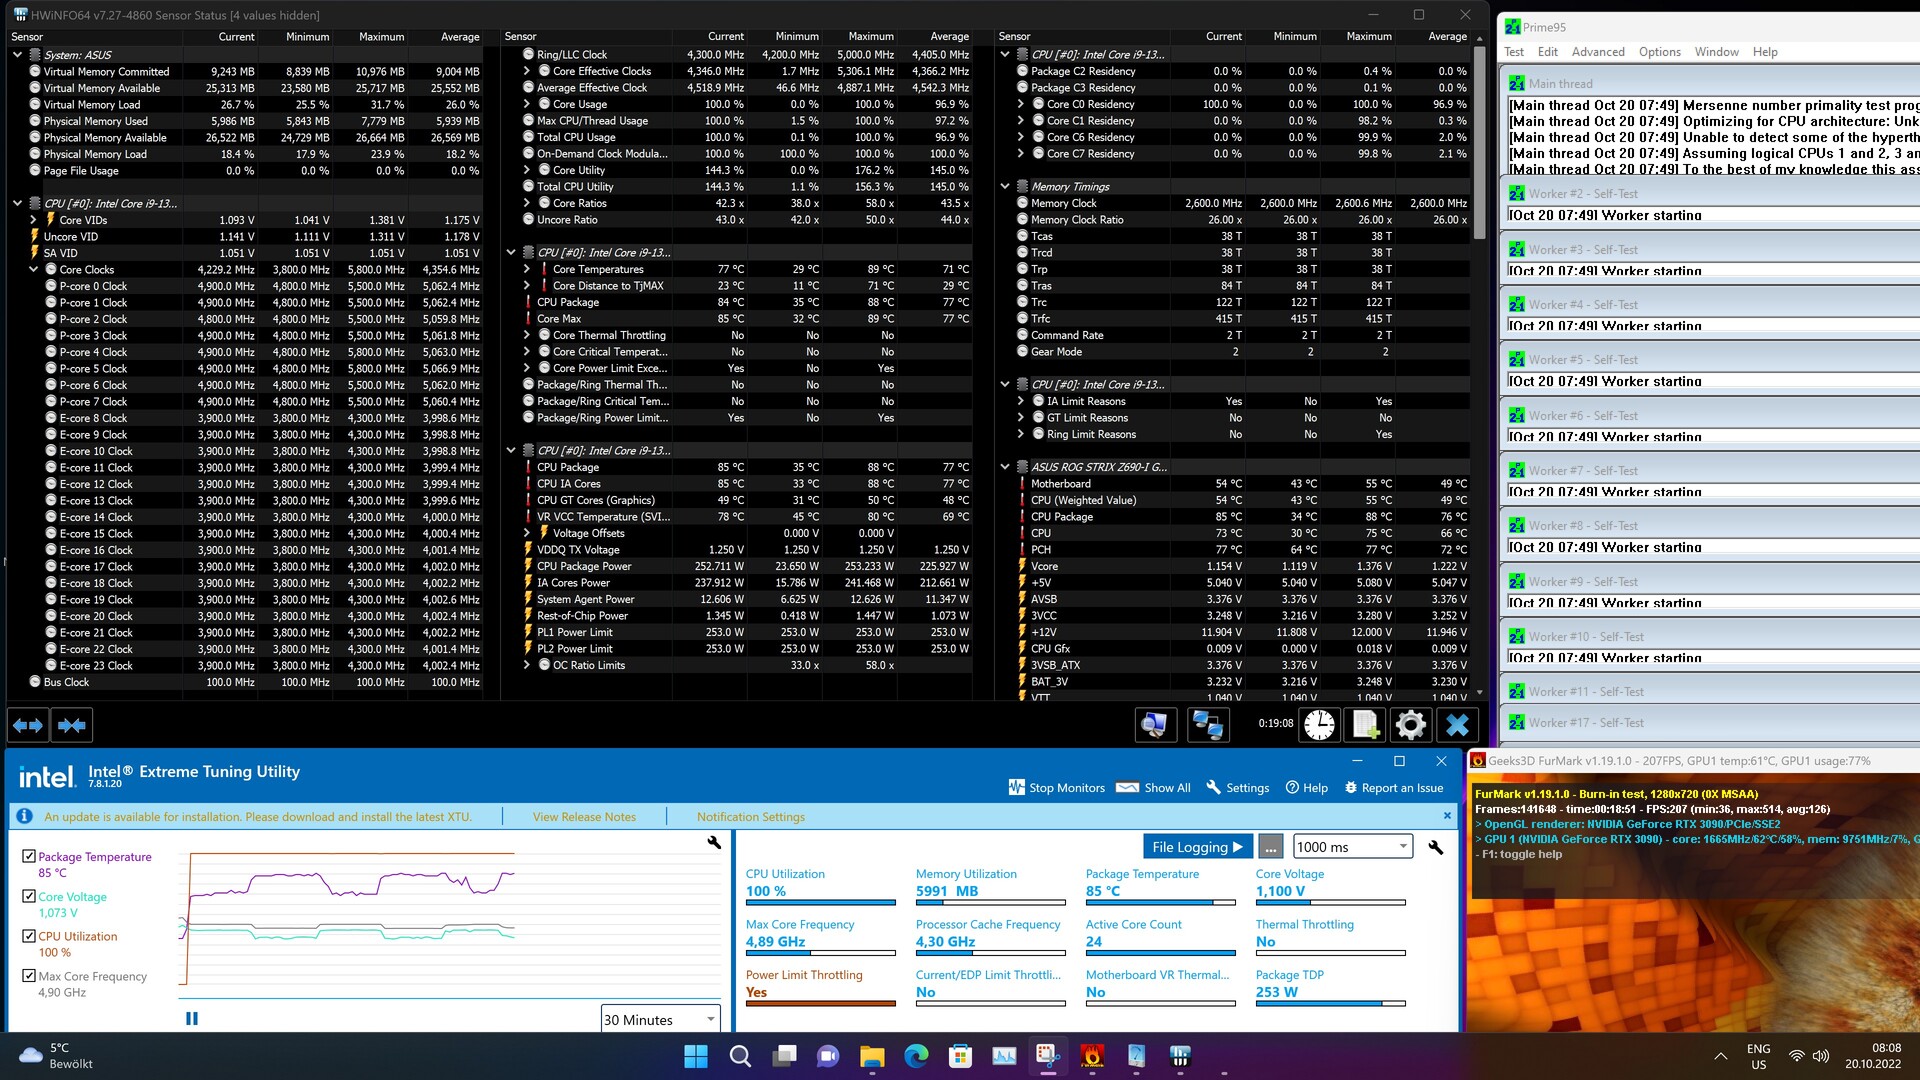
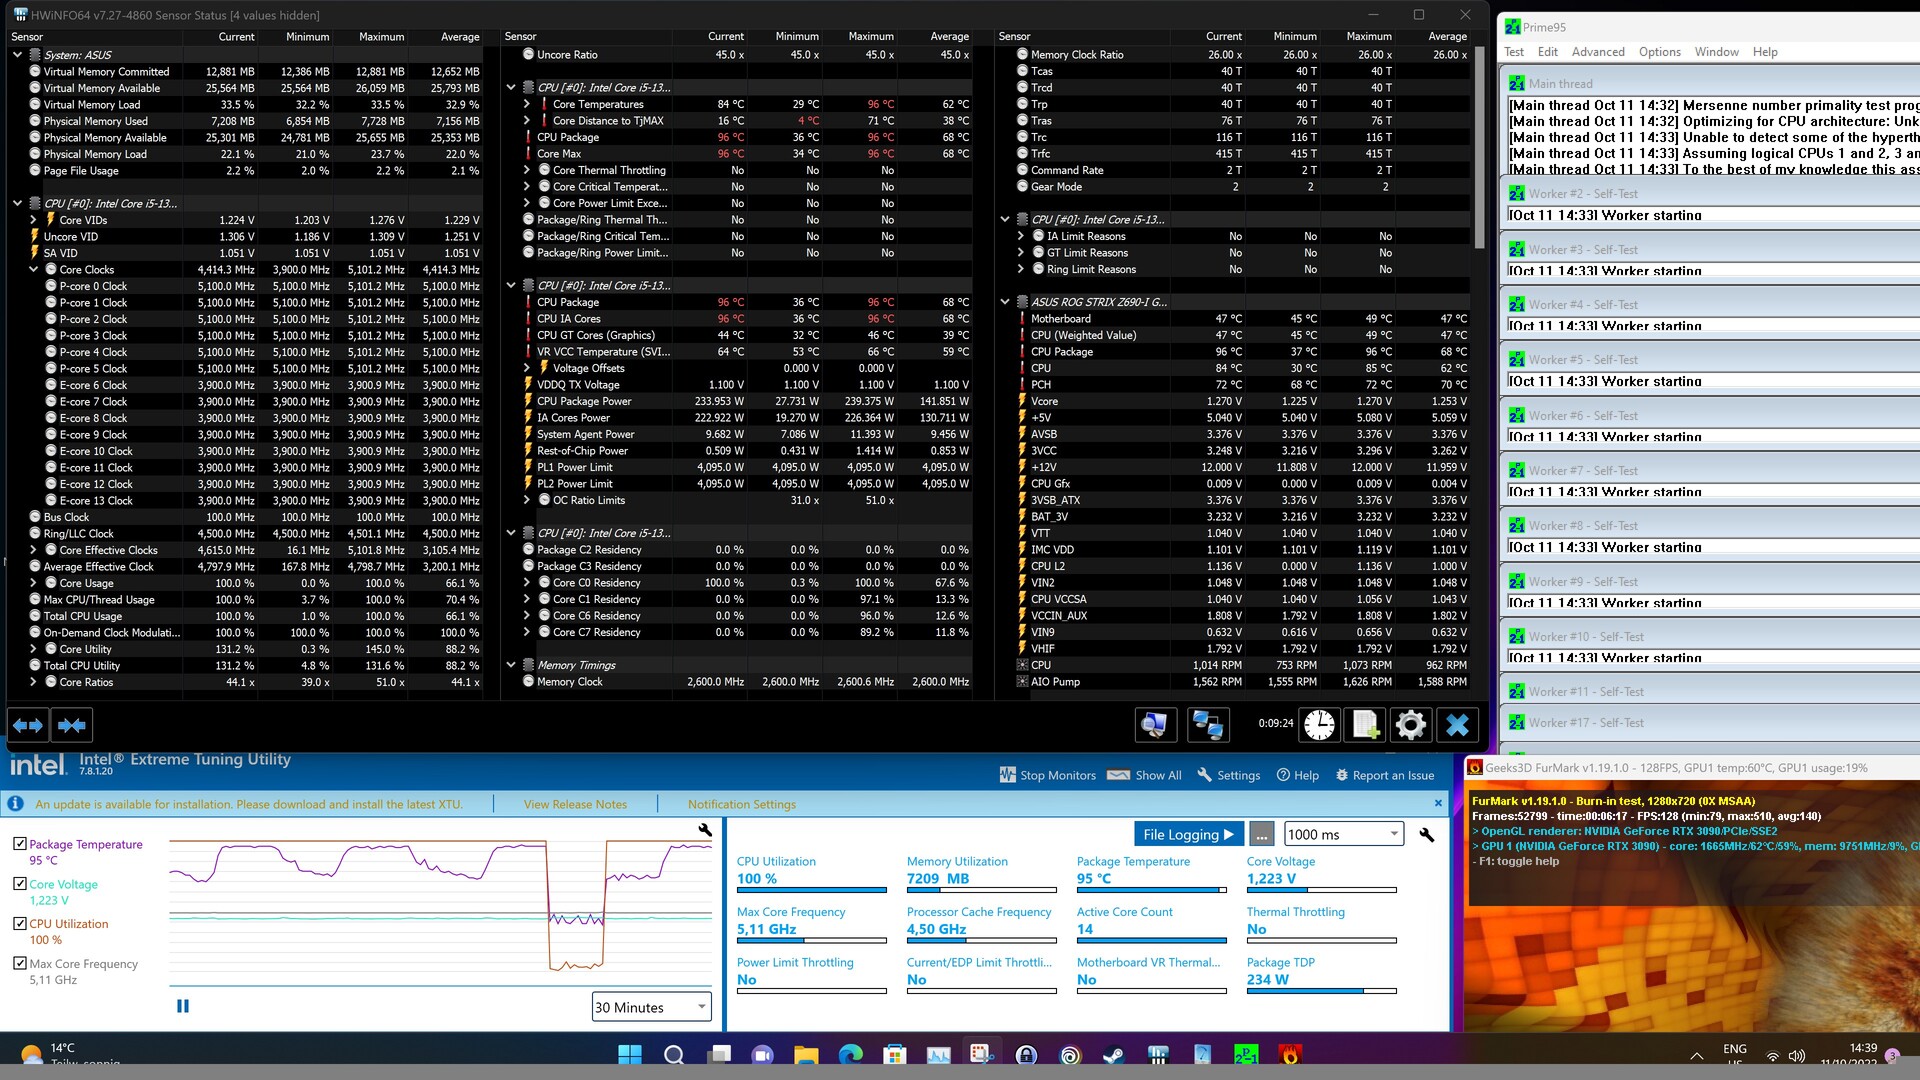
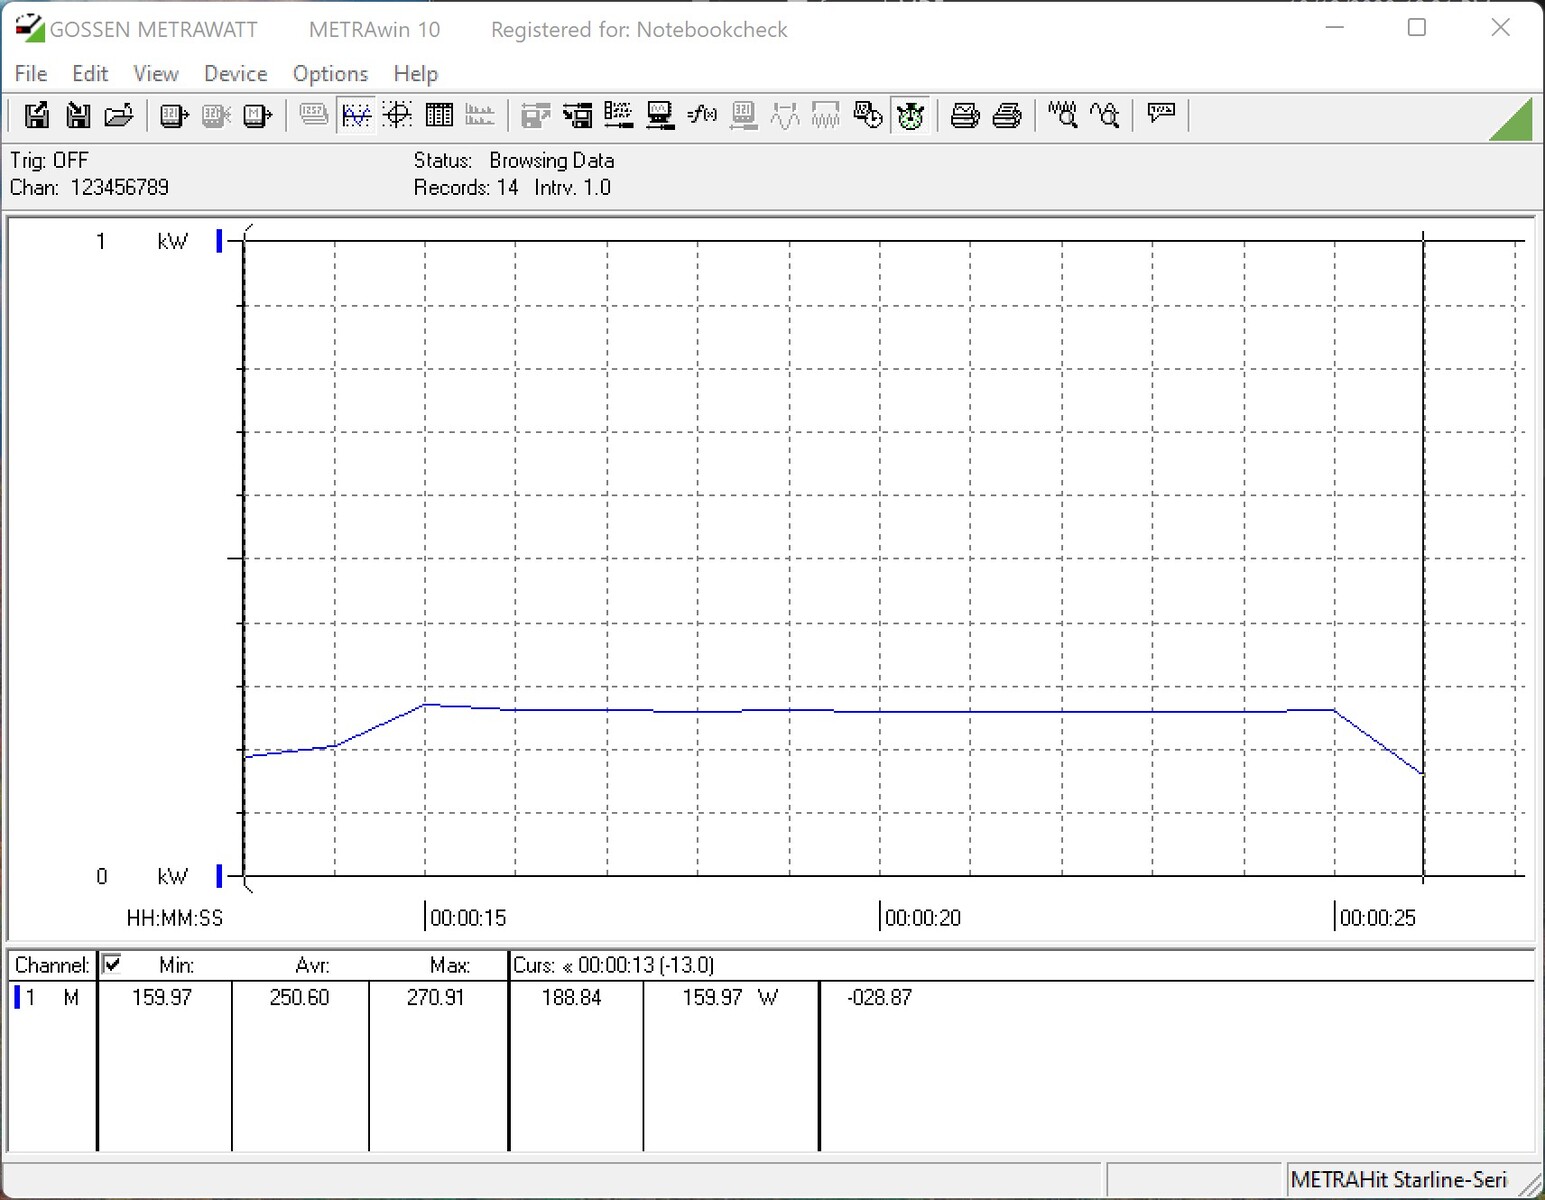
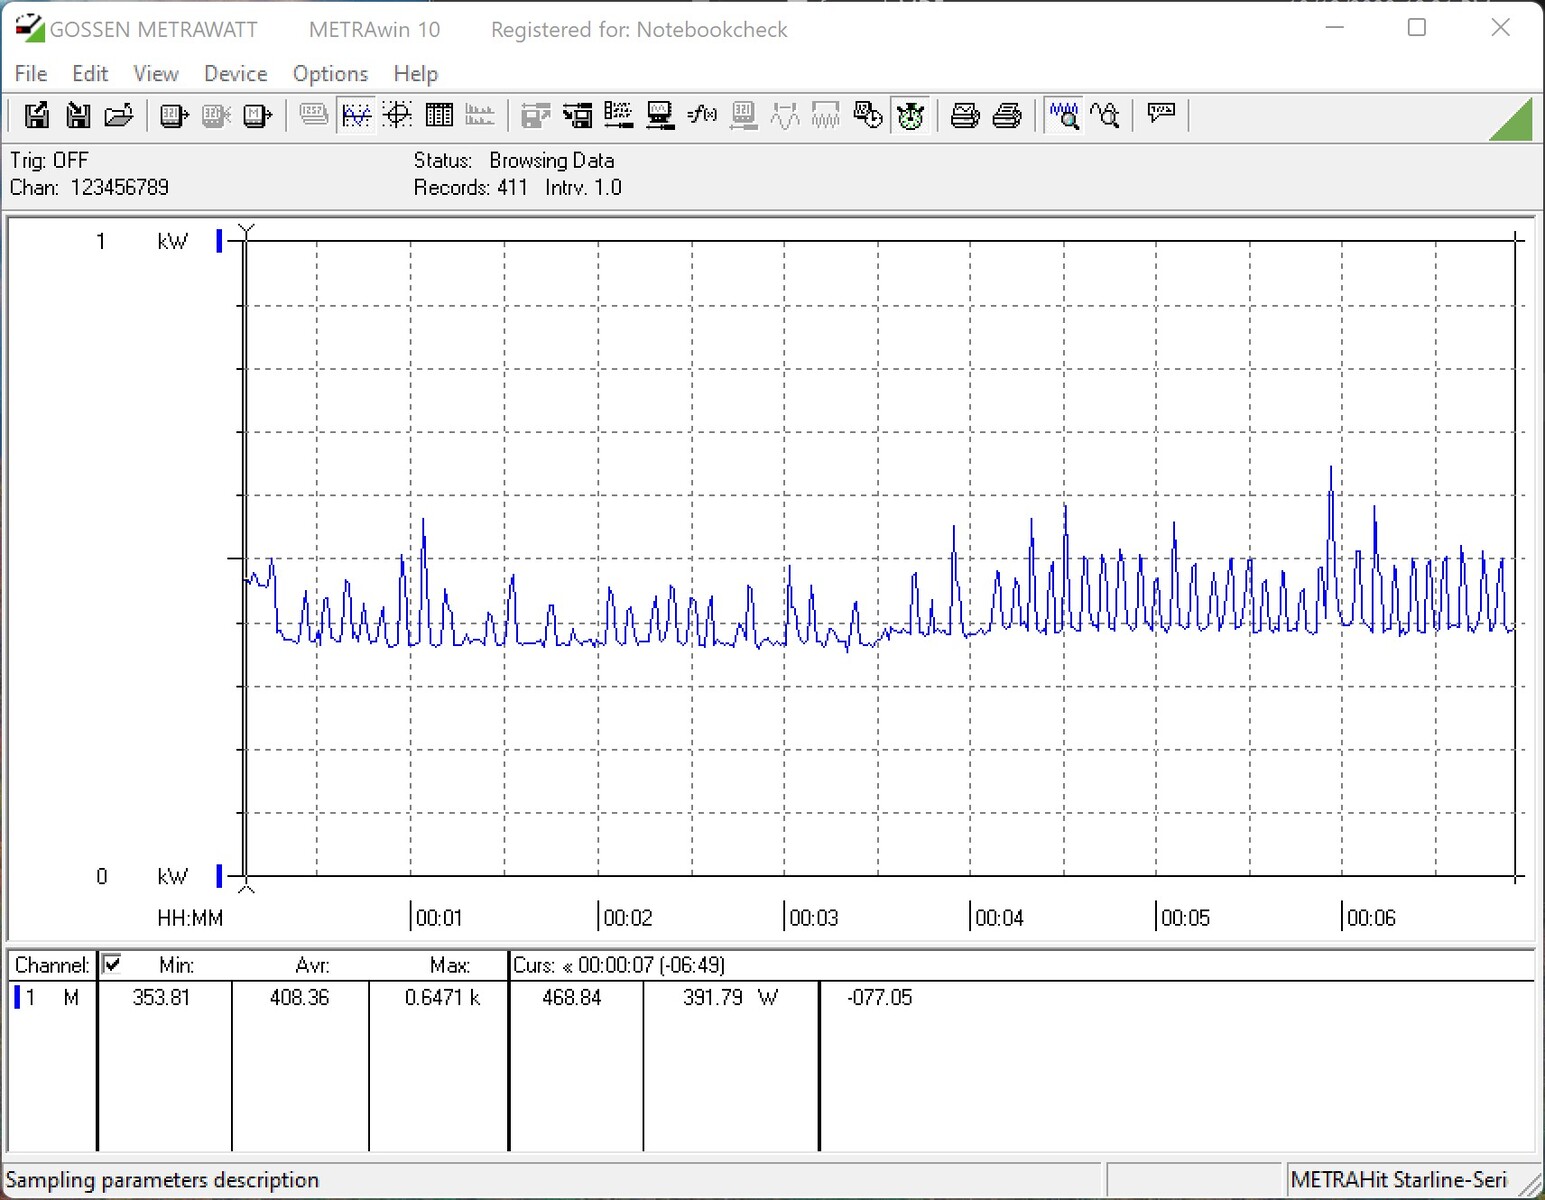
De acordo com as especificações técnicas, os processadores continuam a oferecer um TDP de 125 watts. Isto se refere ao valor PL1. O valor PL2 especifica quantos watts o processador pode consumir sob carga total, se todos os requisitos forem cumpridos. Se todas as restrições forem ativadas no BIOS, o Intel Core i9-13900K tem permissão para consumir no máximo 253 watts. Para o Intel Core i5-13600K, ele ainda é de 181 watts. Se todas as restrições forem desativadas, não há limitação direta do consumo de energia, o que implicitamente significa que somente o limite de temperatura é capaz de diminuir a velocidade da CPU. Portanto, não é surpreendente que continuemos a atingir a marca de 100 °C (212 °F) durante nossos testes de estresse. Nesse ponto, medimos 345 watts para o Core i9-13900K e 240 watts para o Core i5-13600K. Com isto, o uso de um bom sistema de resfriamento aumentará o consumo de energia em muito
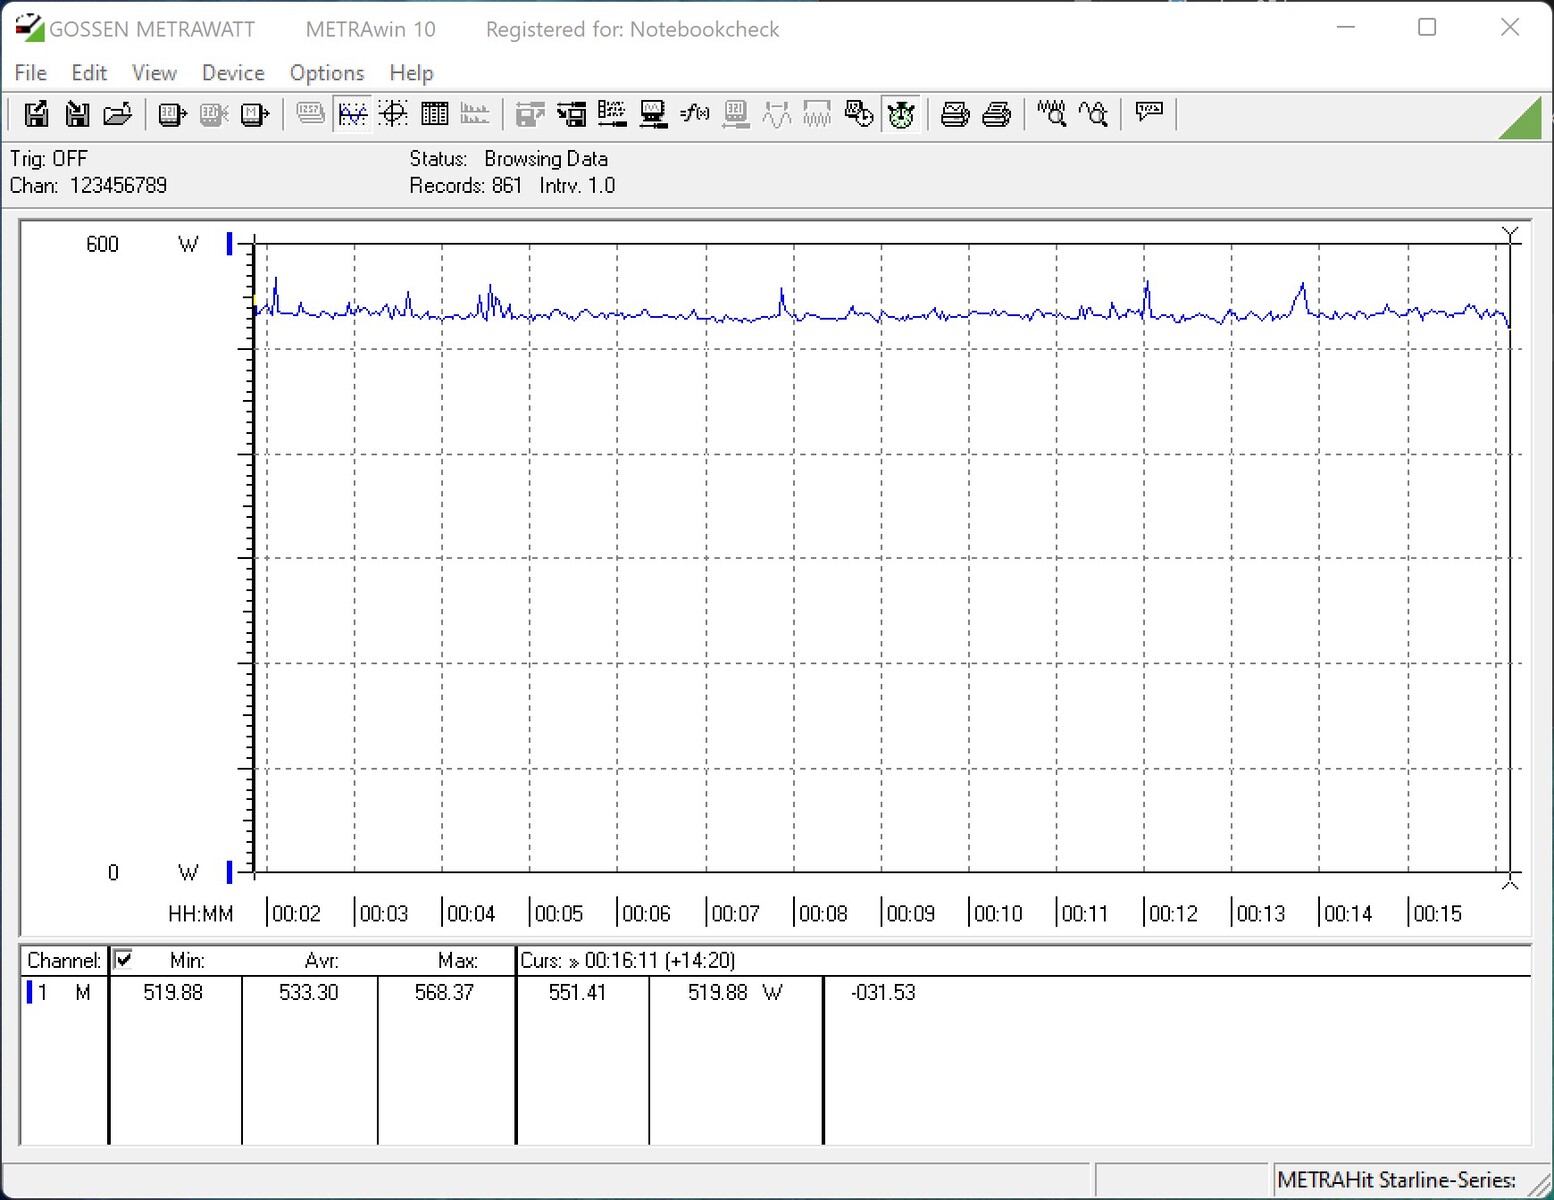
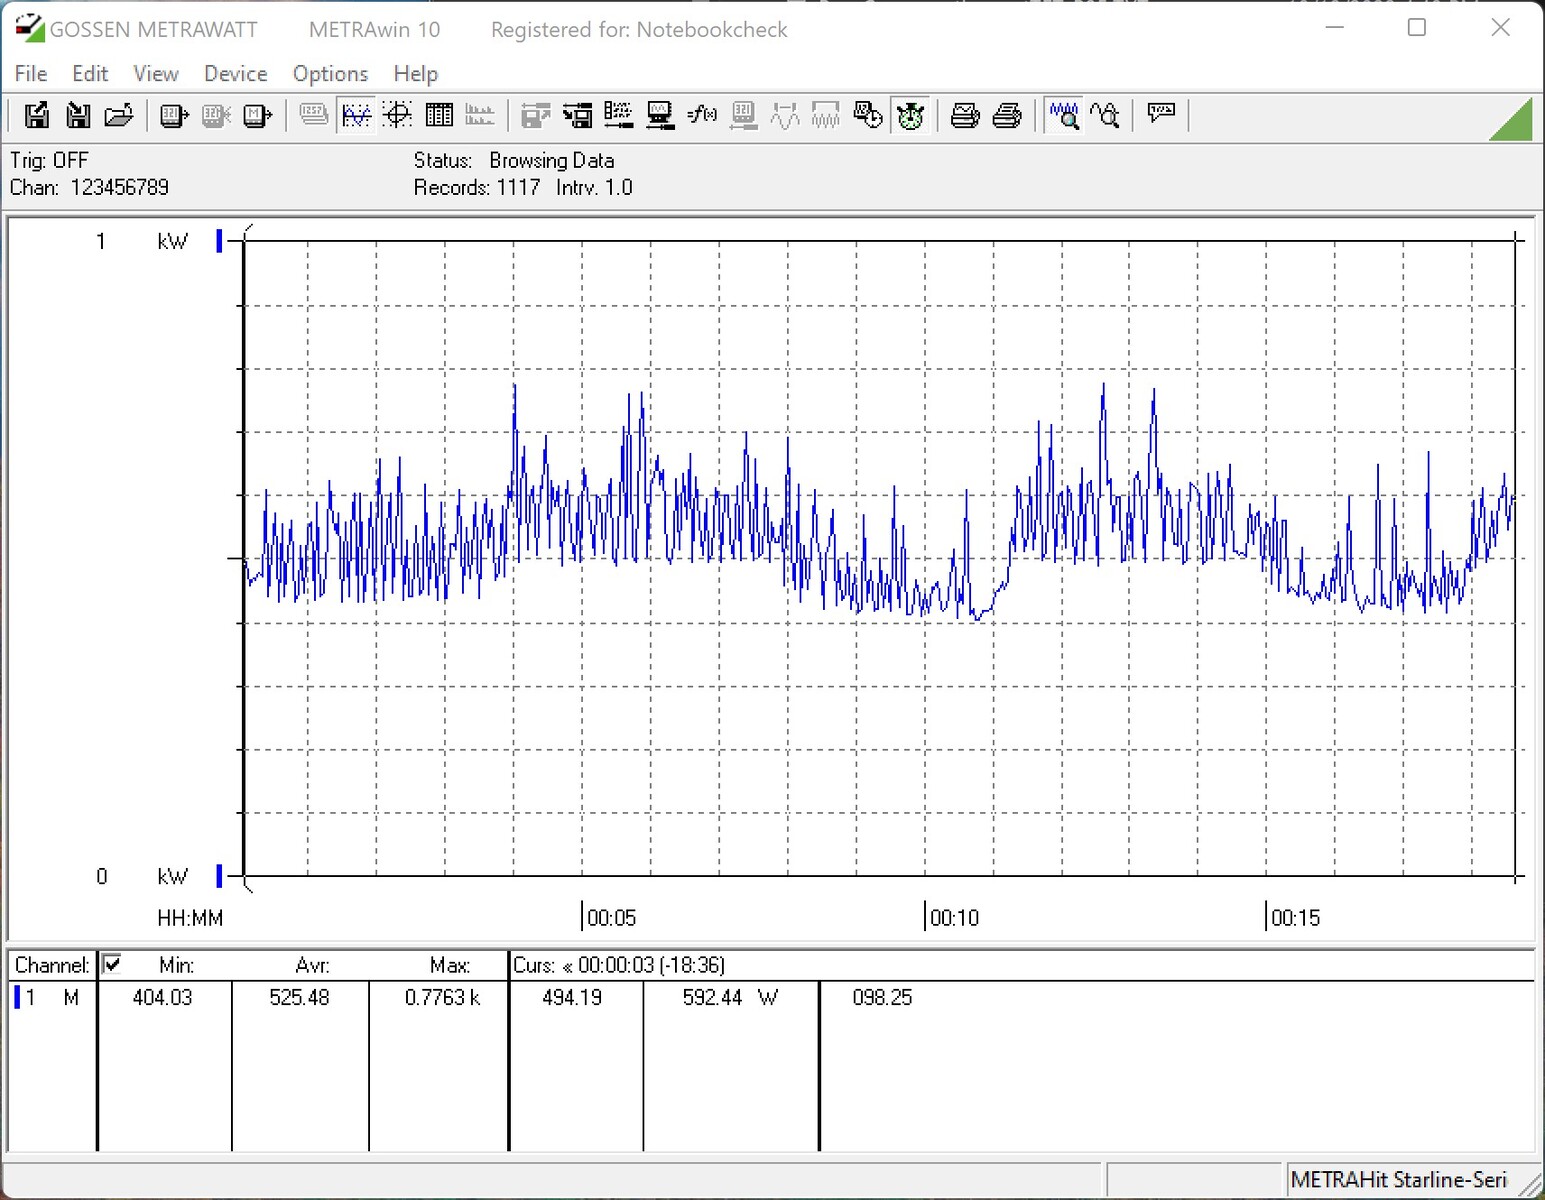
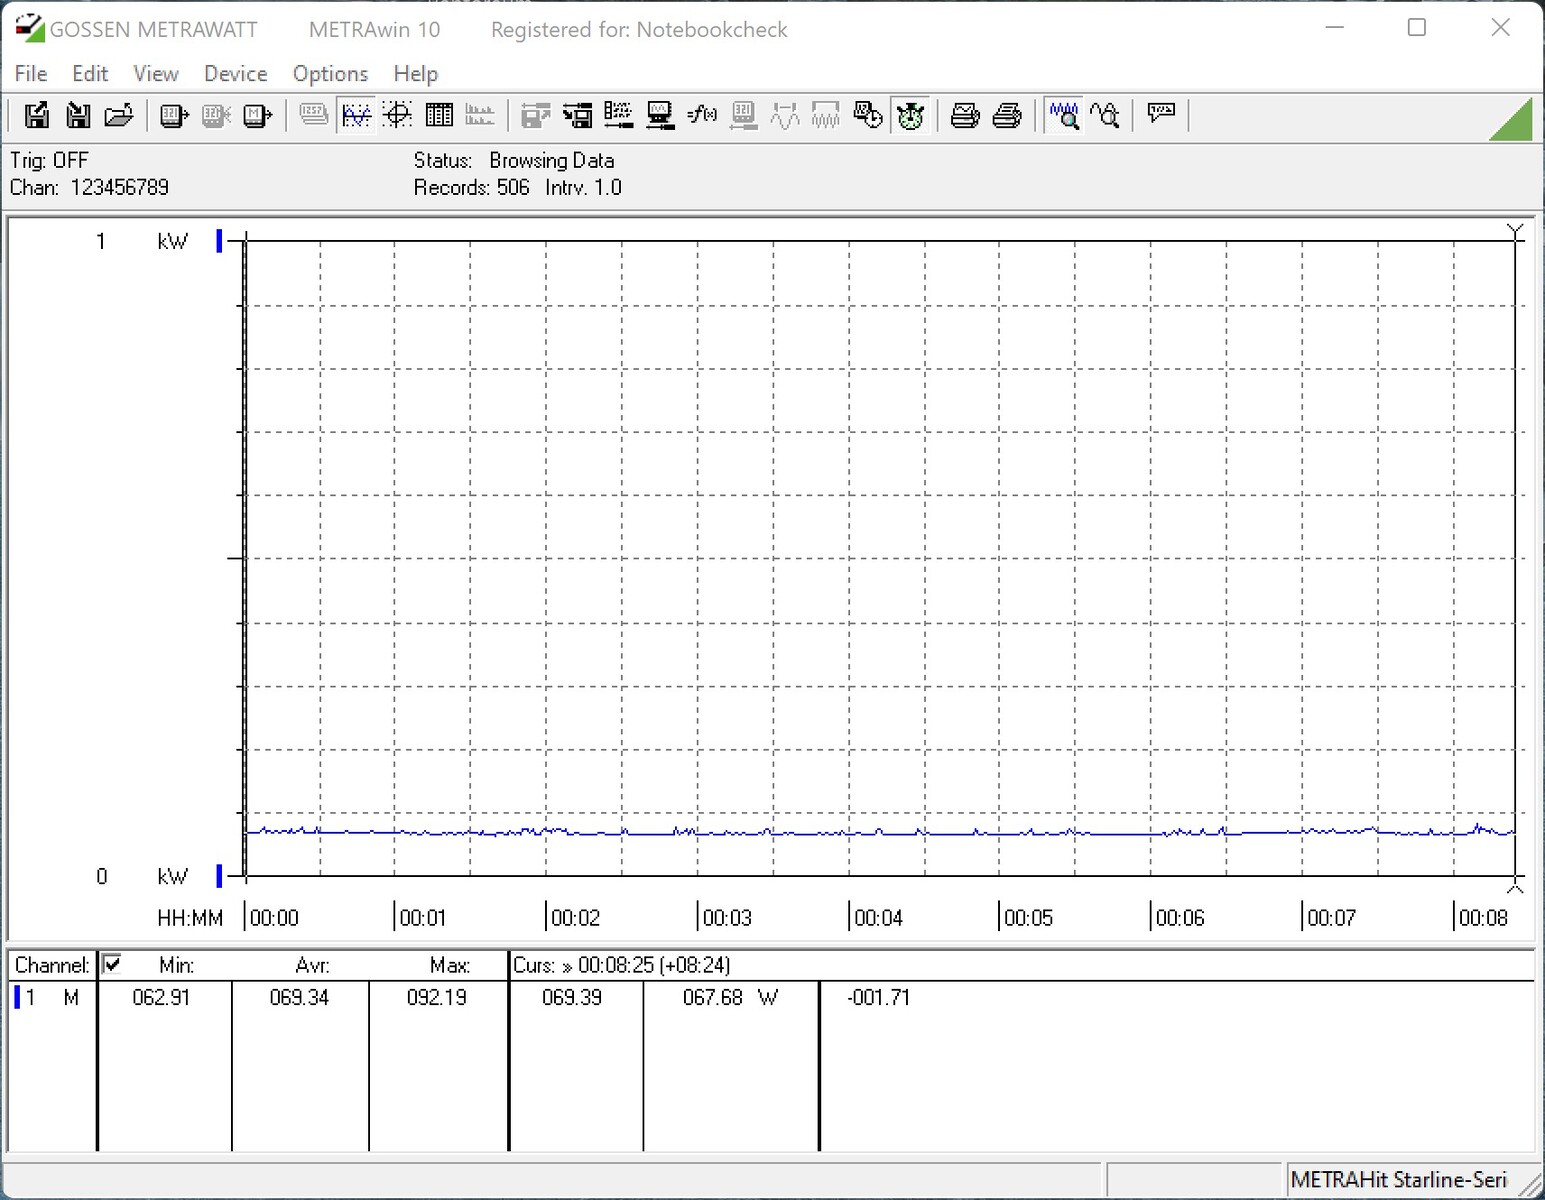
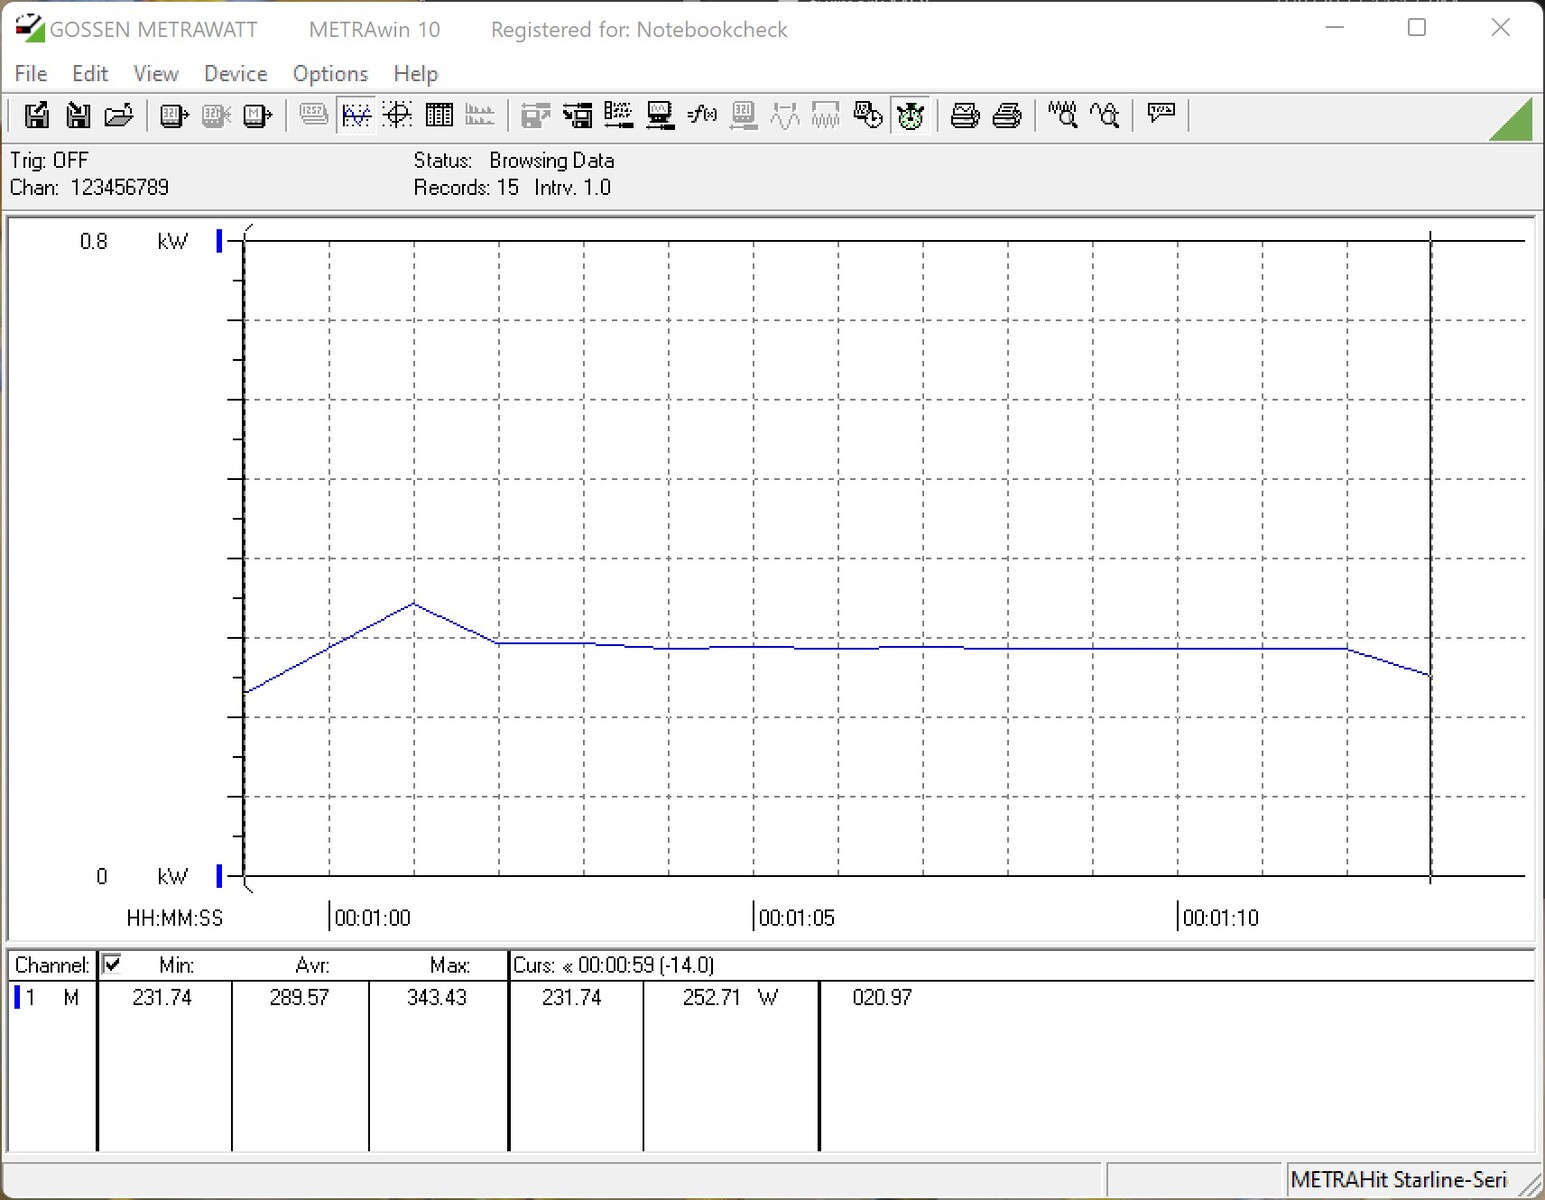
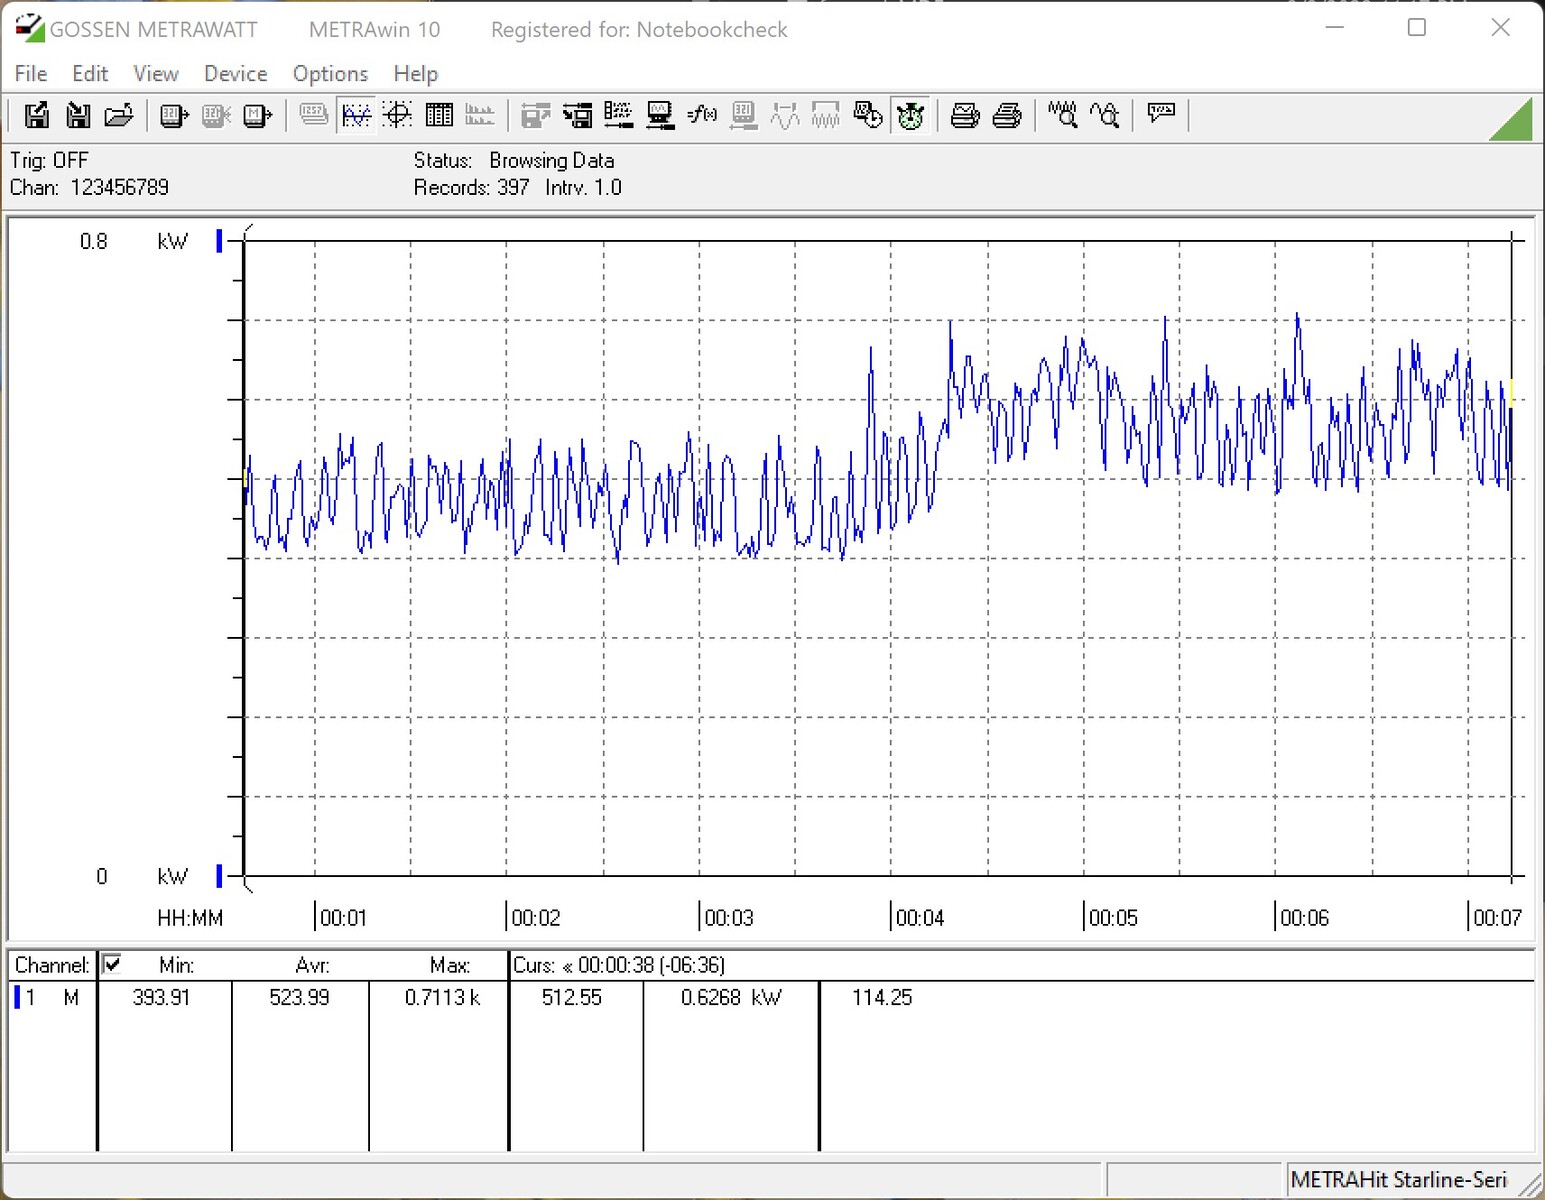
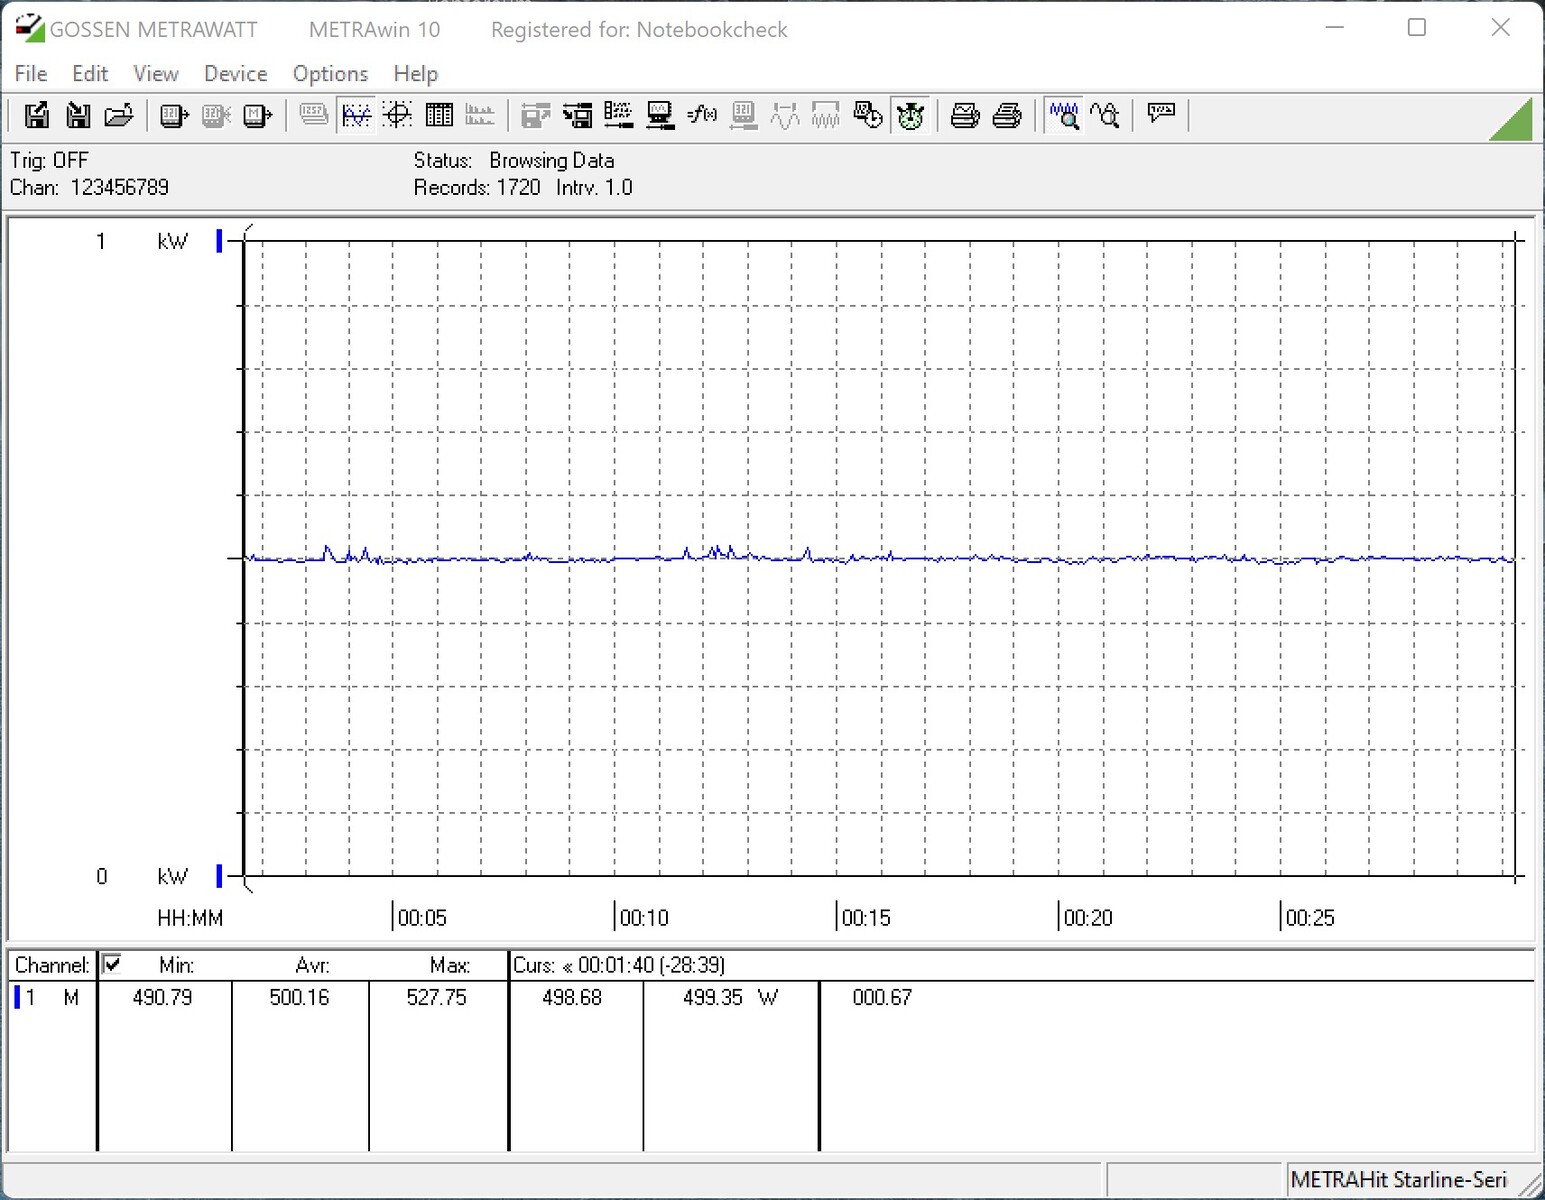
Medimos um consumo de energia de 480 watts para nosso sistema de teste durante o teste múltiplo Cinebench R15. Isto é 48% ou quase 160 watts a mais para o fornecimento de energia em comparação com o Intel Core i9-12900K. Para o Intel Core i5-13600K, o aumento também não é insignificante, 39% ou 80 watts adicionais. Enquanto joga, o consumo de energia é ligeiramente menor. No entanto, ainda medimos pelo menos 500 watts em média.
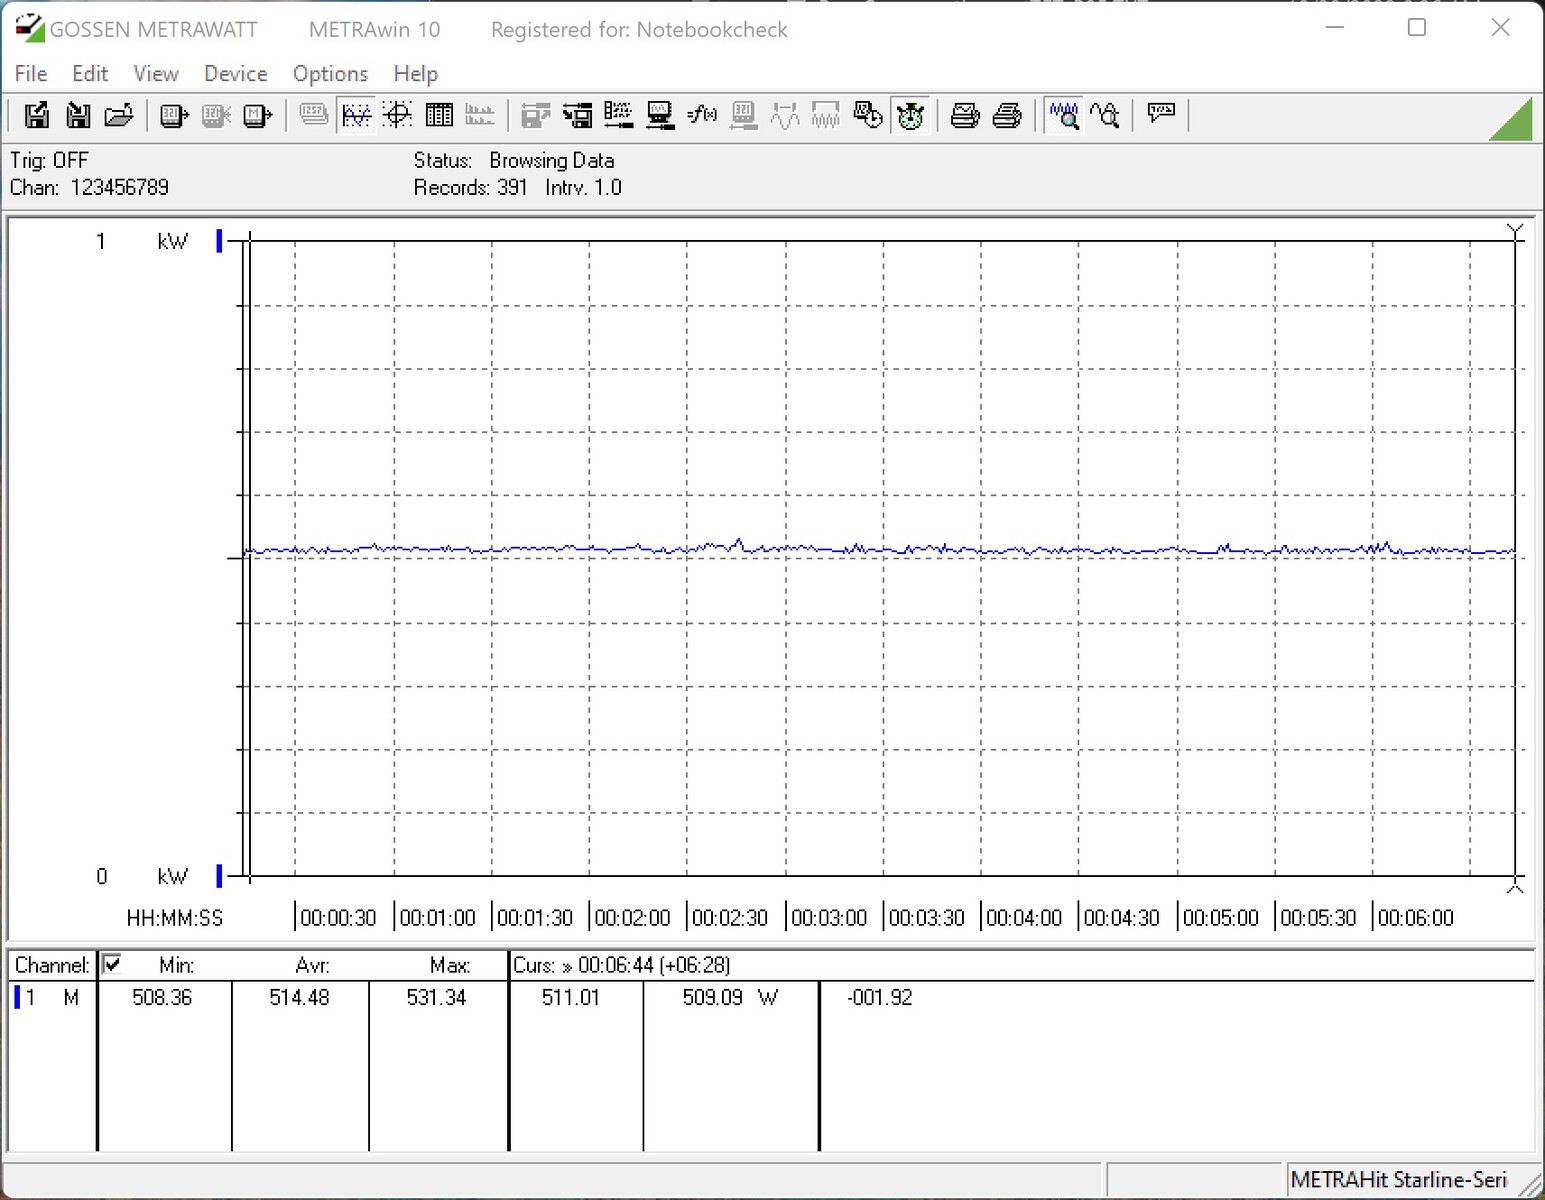
Você precisa de um sistema de resfriamento muito bom para lidar com os processadores do Lago Raptor. Com um sistema de resfriamento de água personalizado, você também pode deixar os novos Raptors funcionar sem nenhuma limitação, desde que você não tenha problemas com altas temperaturas. Aqueles que querem estar no lado seguro devem ativar a limitação PL2. Então um máximo de 253 ou 181 watts, respectivamente, é o limite. Definitivamente, recomendamos ficar dentro dos limites de potência dos processadores do Raptor Lake. Um consumo de energia significativamente menor e baixas temperaturas são boas razões para fazer isso. Também não há desvantagem em termos de desempenho puro, como já mencionamos acima.
Intel Core i9-13900K - Limite de potência aberto

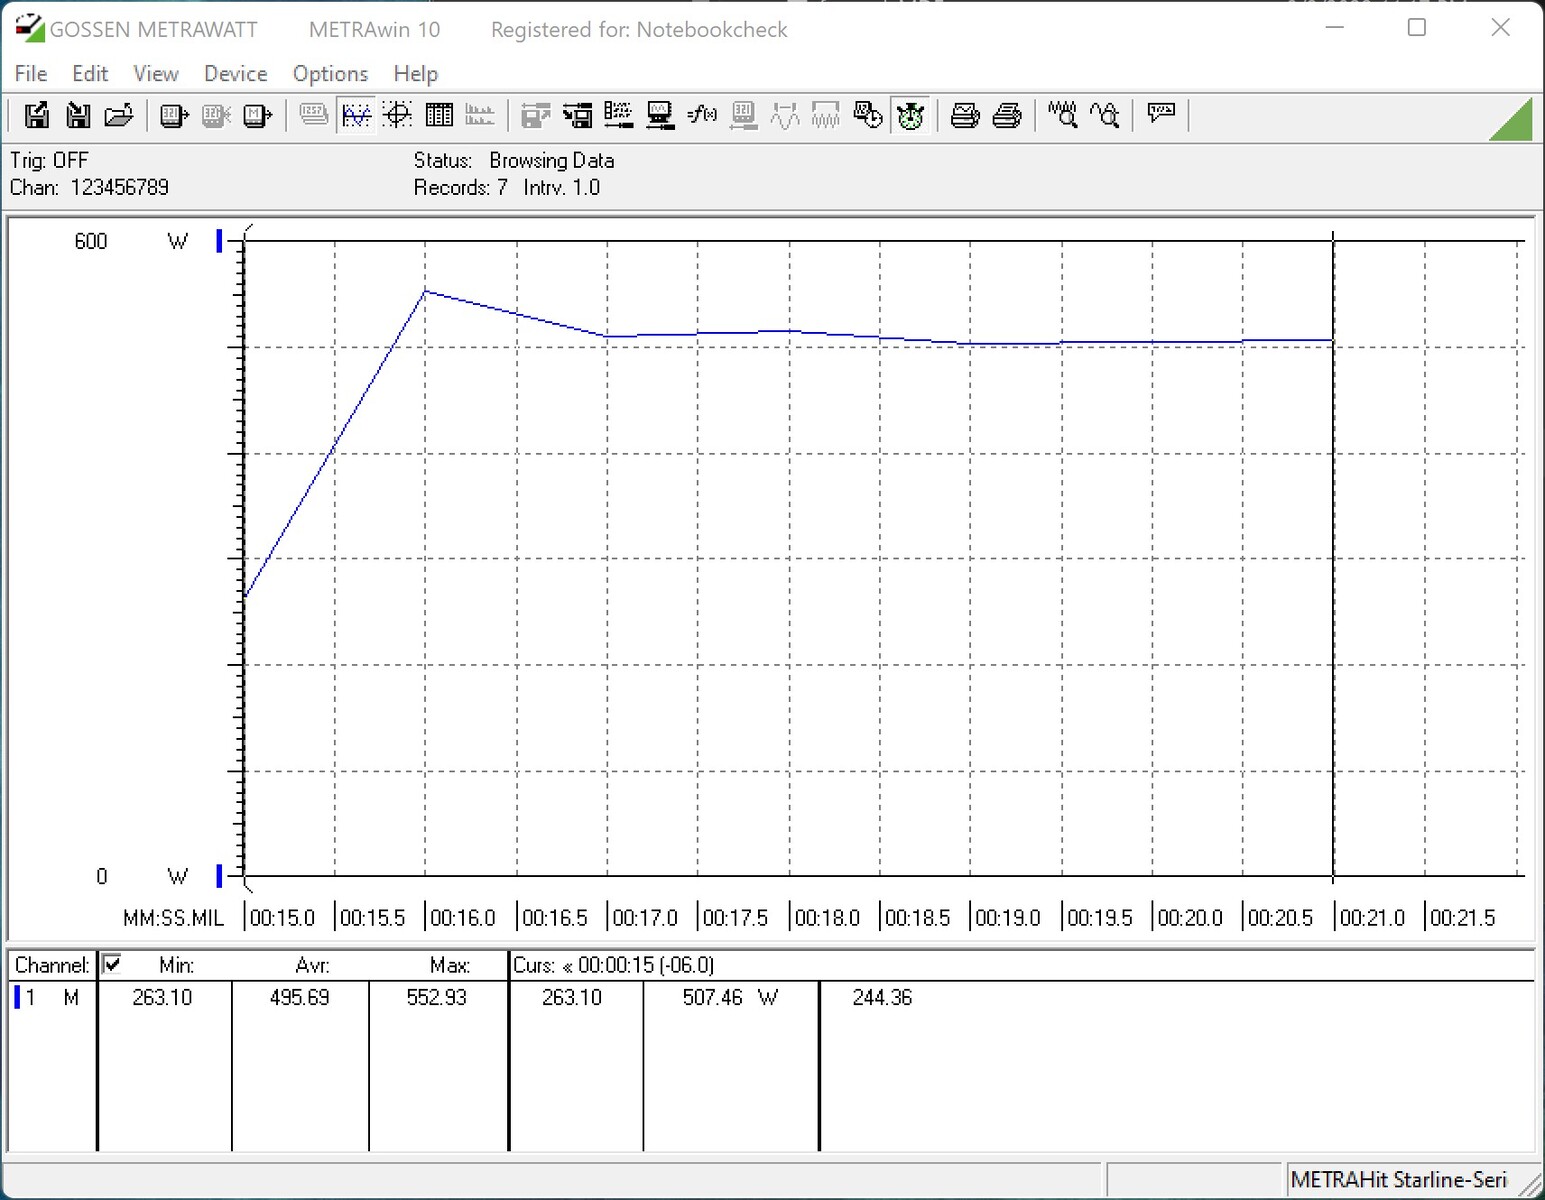
Intel Core i9-13900K - Limite de potência de 253 watts
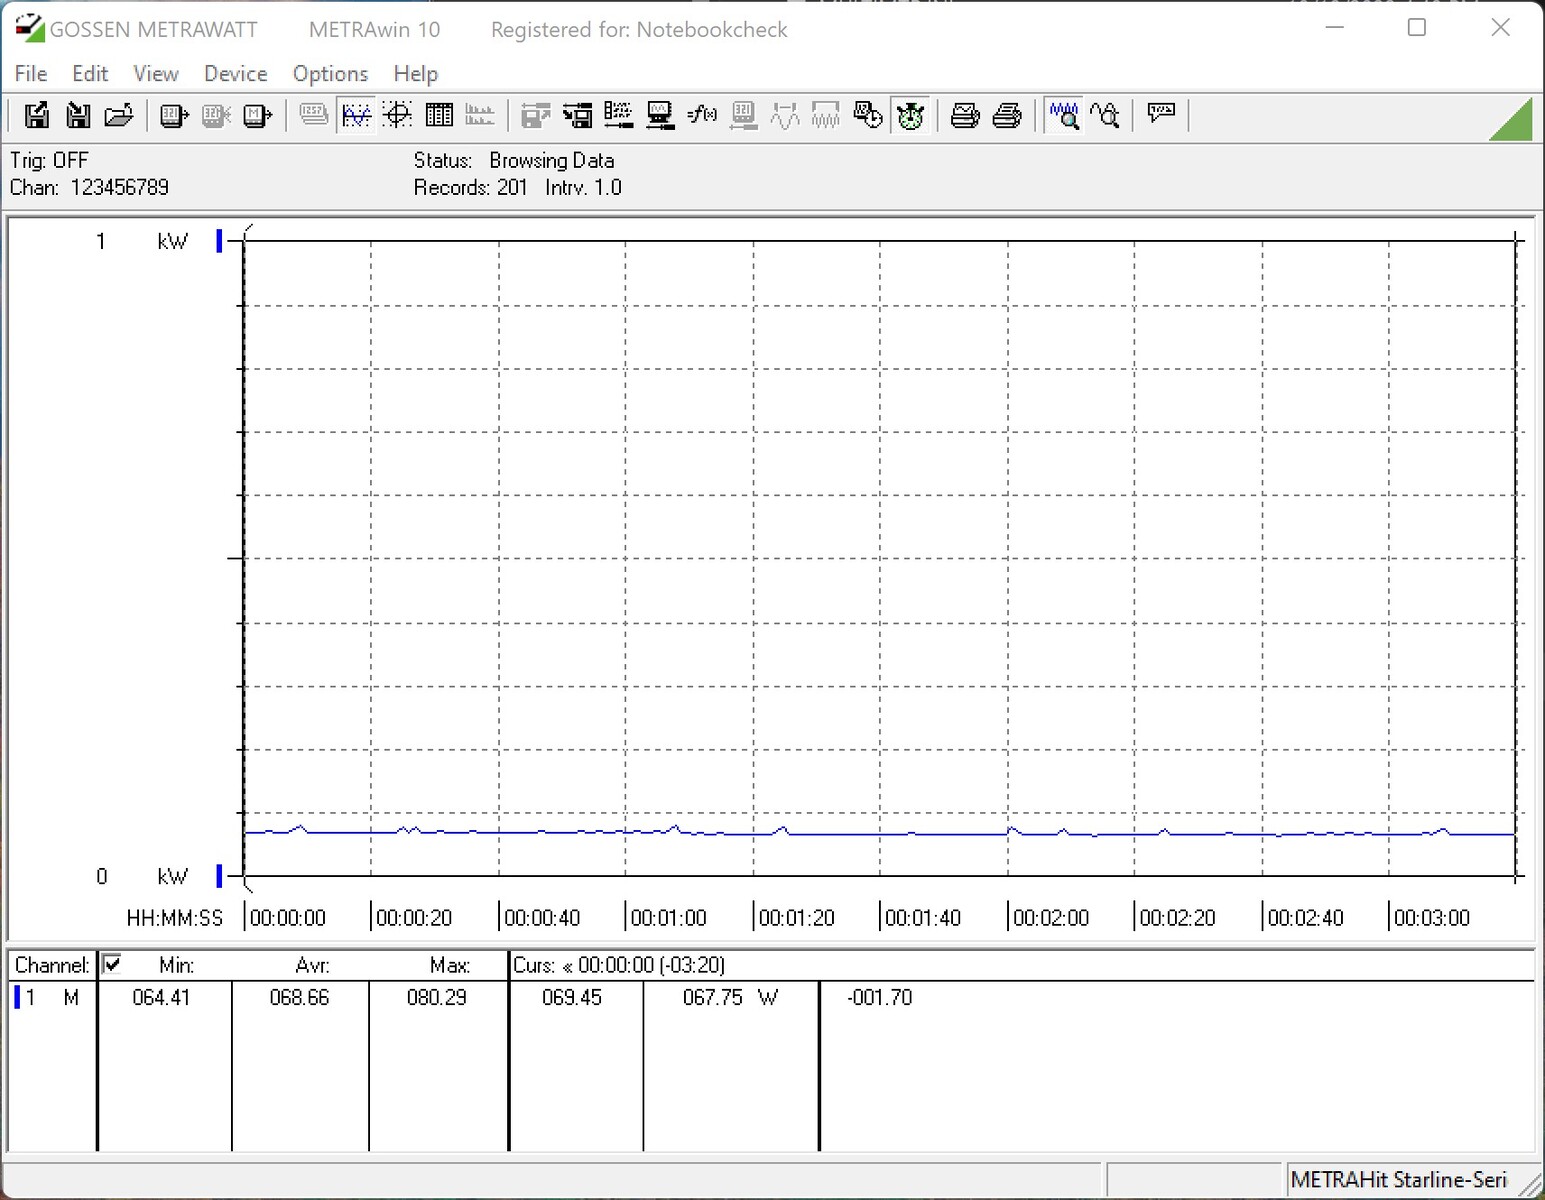
Intel Core i5-13600K - Limite de potência aberto
Intel Core i5-13600K - Limite de potência de 181 watts

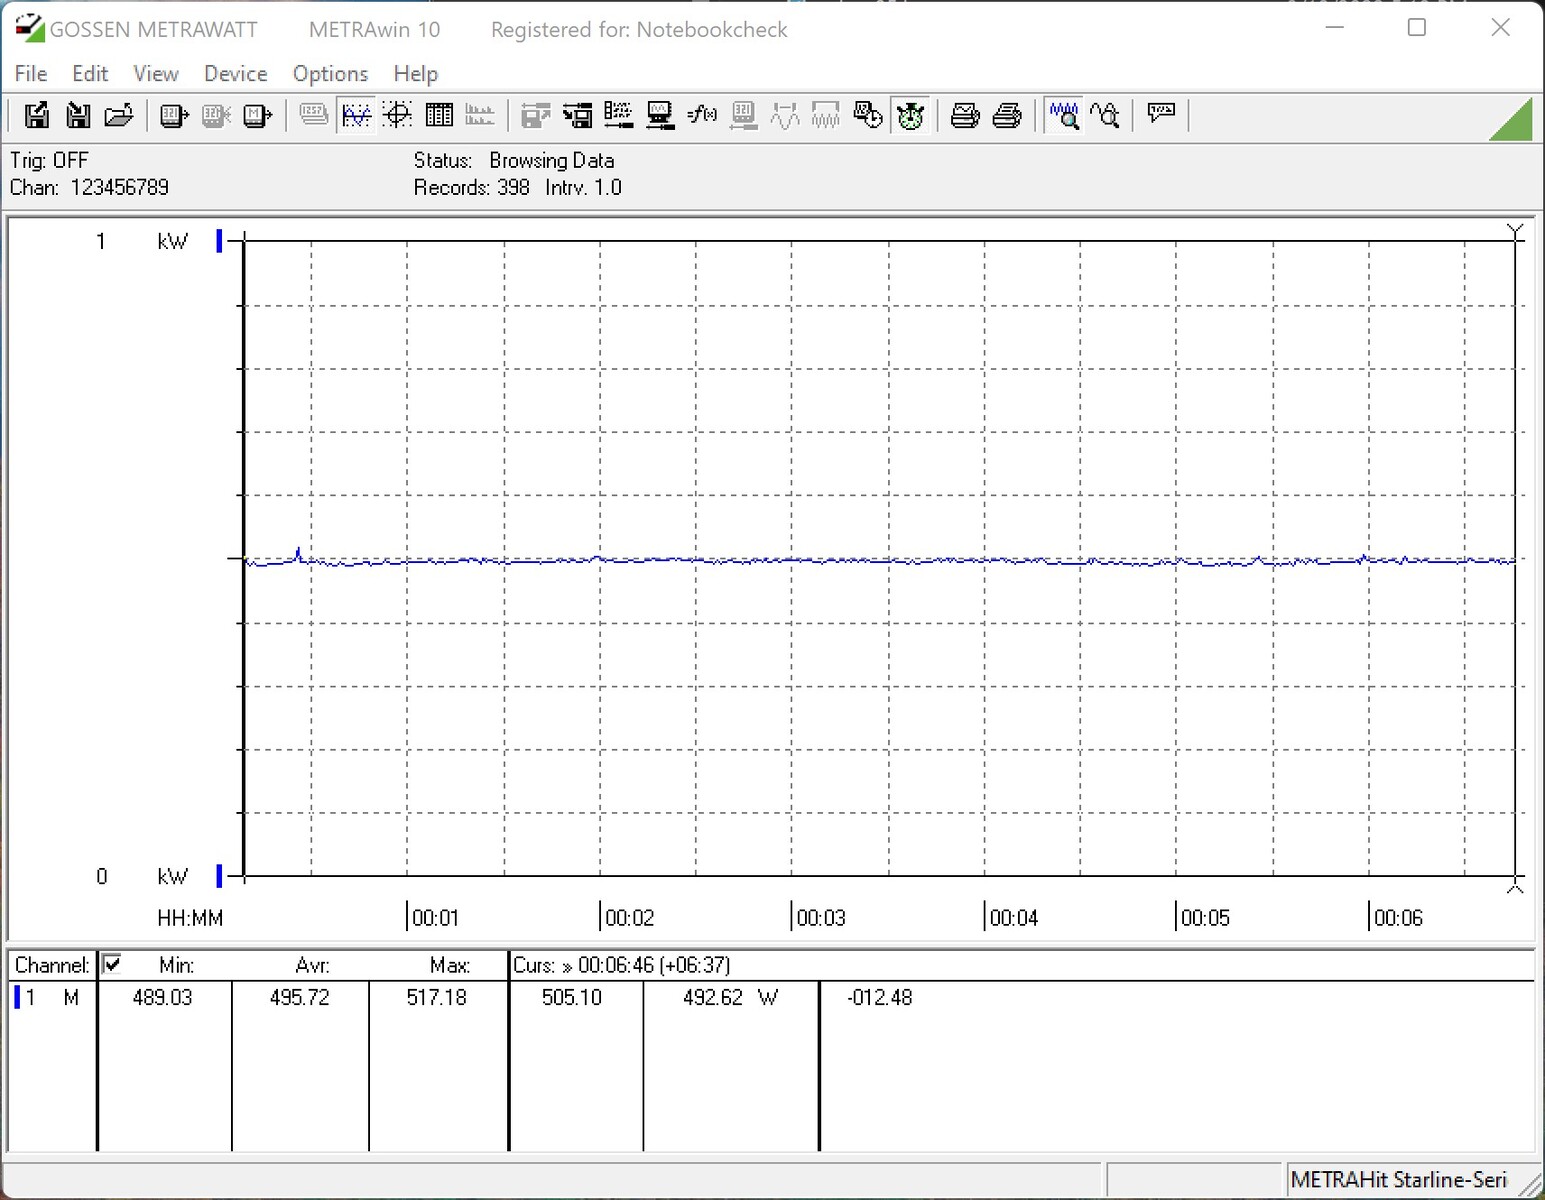

| Power Consumption / Cinebench R15 Multi (external Monitor) | |
| Intel Core i9-13900K | |
| Intel Core i9-13900K @253W | |
| Intel Core i9-12900K (Idle: 70.5 W) | |
| NVIDIA GeForce RTX 3090 Founders Edition | |
| AMD Ryzen 9 7900X | |
| Intel Core i5-13600K | |
| Intel Core i5-13600K @181W | |
| AMD Ryzen 5 7600X | |
| Intel Core i5-12600K (Idle: 70.45 W) | |
| Power Consumption / Prime95 V2810 Stress (external Monitor) | |
| Intel Core i9-13900K | |
| Intel Core i9-13900K @253W | |
| Intel Core i5-13600K | |
| NVIDIA GeForce RTX 3090 Founders Edition | |
| AMD Ryzen 9 7900X | |
| Intel Core i9-12900K (Idle: 70.5 W) | |
| Intel Core i5-13600K @181W | |
| Intel Core i5-12600K (Idle: 70.45 W) | |
| AMD Ryzen 5 7600X | |
| Power Consumption / The Witcher 3 ultra (external Monitor) | |
| AMD Ryzen 9 7900X | |
| NVIDIA GeForce RTX 3090 Founders Edition | |
| Intel Core i9-13900K | |
| AMD Ryzen 5 7600X | |
| Intel Core i9-13900K @253W | |
| Intel Core i5-13600K | |
| Intel Core i5-13600K @181W | |
| Intel Core i9-12900K (Idle: 70.5 W) | |
| Intel Core i5-12600K (Idle: 70.45 W) | |
* ... menor é melhor
Pro
Contra
Veredicto - Extremo consumo de energia

Com Raptor Lake, a Intel envia um sucessor digno para a geração de Alder Lake para o ringue. Também era tempo para isso, pois com sua atual formação, a AMD correu à frente dos processadores do Alder Lake. Entretanto, a Intel é incapaz de se antecipar completamente aos concorrentes com seus atuais processadores. No entanto, é capaz de alcançar, e às vezes até mesmo superar ligeiramente os competidores. As diferenças entre os dois principais modelos são muito pequenas e não são realmente perceptíveis. Entretanto, se basearmos nossa comparação de desempenho nos atuais MSRPs, o Intel Core i9-13900K está à frente do AMD Ryzen 9 7900X em muitos pontos de referência.
A Intel luta por esta posição com uma maior velocidade do relógio, mais núcleos e um maior consumo de energia. Esta última é também uma abordagem que a AMD está buscando, embora o TDP do Intel Core i9-13900K atinja um novo valor superior a 253 watts (PL2). No menor Intel Core i5-13600K, ele ainda é de 181 watts sob carga total. Isto significa que um resfriamento muito bom é um requisito, se o modelo superior estiver em sua lista de desejos.
Os atuais processadores Intel Raptor Lake oferecem um desempenho muito bom em jogos e aplicativos. Seu desempenho muito alto faz do Intel Core i9-13900K a CPU ideal para os criadores de conteúdo
Para a base, você está seguro para usar um conjunto de 600 chipset, já que o Raptor Lake é compatível após uma atualização da BIOS. Isto não colocará muita pressão em seu orçamento para uma atualização. Entretanto, haverá também novas placas principais com o novo chipset 700. Mas você também deve estar ciente de que não haverá uma nova geração de CPU para o atual soquete 1700. Os rumores atuais dizem que o soquete 1851 será introduzido com o Meteor Lake, que não é mais compatível com os soquetes atuais.
Preço e Disponibilidade
Algumas lojas já listam os novos processadores de Raptor Lake. Por exemplo, o núcleo Intel i5-13600K está disponível na Amazon por US$340e o modelo top de linha, o Intel Core i9-13900K , está listado lá por $750.

